


Abstract
This study presents the experimental optimization of an interferometric optical fiber sensor for acoustic emission (AE) detection. The system employs a simple and low-cost structure composed of sensing and reference fibers, enabling interference-based detection without specialized components such as fiber Bragg gratings or Fabry–Perot cavities. A narrowband laser source was selected through comparative experiments for its superior stability and interference performance. The influence of fiber-loop parameters, including the number of turns and the optical-path intensity ratio, was systematically evaluated to clarify their effects on AE sensitivity and frequency response. The experimental results demonstrate that detection performance and bandwidth can be flexibly tuned by optimizing the loop configuration. Finally, the sensor was validated using a tensile test, successfully detecting AE signals in the range of 20 kHz to 1 MHz. The proposed system provides a robust, EMI-resistant, and cost-effective interferometric solution for AE monitoring.
1. Introduction
Acoustic Emission (AE) testing is a vibration-based measurement technique that captures transient elastic waves generated when a material undergoes deformation, develops micro-cracks [1], or experiences internal displacement under loading [2,3,4]. In the field of non-destructive testing (NDT), AE is employed to monitor structural dynamics and detect the initiation and progression of defects such as cracks [5,6], metal fatigue [7,8], and partial discharges [9,10]. As damage advances, energy is released in the form of high-frequency vibration pulses, which are detected by AE sensors placed on the surface. These pulses are then converted into electrical signals and analyzed in terms of their frequency spectrum and amplitude to determine the location, severity, and underlying mechanism of the defect. A key advantage of AE lies in its ability to provide the continuous monitoring and early detection of micro-damage phenomena [11,12]. Moreover, it offers directional information about the dynamic behavior of damage, thereby supporting structural integrity assessments and enhancing the reliability of equipment operation.
Various types of AE sensors have been developed to address different measurement objectives and environmental conditions. Among them, the two most widely used are piezoelectric sensors [13,14,15] and Fiber Bragg Grating (FBG) sensors [16,17,18]. Piezoelectric sensors are a traditional and popular choice due to their effectiveness in detecting high-frequency acoustic waves generated by phenomena such as fracture, plastic deformation, or internal impacts within materials. These sensors operate based on the piezoelectric effect, in which mechanical vibrations induced by AE waves are converted into electrical signals by piezoelectric crystals. Their advantages include high sensitivity, a wide frequency range (typically from tens of kHz to several MHz), ease of implementation, and cost-effectiveness. However, they also have limitations, such as susceptibility to electromagnetic interference [19,20], the requirement for firm physical contact with the material surface, and reduced durability in high-temperature or high-humidity environments. In contrast, FBG sensors represent a modern solution leveraging optical fiber technology [21,22]. FBG sensors operate based on the shift in the reflected Bragg wavelength caused by mechanical strain from AE waves deforming the grating structure within the optical fiber [23]. Their key advantages include immunity to electromagnetic interference, compact size, remote sensing capability, and high environmental stability [24]. Furthermore, multiple FBG sensors can be multiplexed along a single optical fiber, enabling efficient multi-point monitoring [25,26]. Although FBG has been widely used for strain-based monitoring, the detection of AE signals with FBG requires high-speed wavelength demodulation to resolve the rapid kHz-range strain fluctuations produced by AE. Temperature-induced wavelength drift occurs at very low frequencies and can be separated from AE components through filtering; however, the data-acquisition system must still accommodate the full dynamic range of both slow thermal variations and fast AE signals. This requirement increases the complexity of the interrogation unit and places stringent demands on sampling speed and resolution, which can limit the practicality of FBG-based AE sensing in simple or low-cost systems.
Several previous studies have developed vibration detection sensors using optical fibers other than Fiber Bragg Gratings (FBG). B. Liu et al. proposed a method in which a silver diaphragm, functioning as a Fabry–Perot interferometer (FPI), is mounted at the tip of an optical fiber, successfully detecting acoustic signals with intensities below 300 mPa [27]. The detection principle is based on the shift in interference wavelength caused by the deflection of the diaphragm’s two mirrors. However, for long-term applications such as structural health monitoring, thermal expansion of the spacer within the diaphragm alters the mirror spacing, making stable measurements difficult. Y. Zhao et al. introduced a different approach by forming a Fabry–Perot interferometer through the creation of an air cavity inside the optical fiber [28]. In their study, the cavity was formed by splicing two optical fibers with different tip geometries. They demonstrated that shorter cavity lengths enhance sensitivity to stress. Nonetheless, when applied to long-term monitoring, this method may encounter challenges such as connector wear and degradation, which could impair reliability.
In recent years, several optical fiber-based acoustic and AE sensing systems have been proposed for structural and industrial monitoring. For example, Miao et al. developed a high-precision fiber-optic AE system for weak damage localization in concrete structures, demonstrating the potential of fiber sensors for practical AE monitoring in civil engineering applications [29]. In parallel, several interferometric and Fabry–Perot fiber sensors have been reported for high-sensitivity acoustic detection, typically relying on well-defined cavity structures or specially processed end faces of fibers. Sun et al. reported a highly sensitive Fabry–Perot acoustic sensor based on an optic-fiber spherical end surface, in which the sensing characteristics are determined by the microcavity geometry [30]. More recently, Ni et al. investigated interferometric optical fiber sensors for high-pressure gas-pipeline monitoring, highlighting the capability of interferometric schemes for distributed and long-distance sensing in harsh environments [31]. Although these studies clearly demonstrate the advantages of interferometric and cavity-based fiber sensors, their sensing performance is often fixed by the specific cavity design, membrane structure, or packaging process, which can complicate fabrication and limit post-fabrication tuning.
In this study, we study an interferometric optical fiber sensor system that enables flexible tuning of sensitivity and frequency response through simple adjustments to the fiber loop configuration. By utilizing a low-cost structure composed of a sensing fiber and a reference fiber, the system detects AE signals based on interference intensity variations induced by mechanical vibrations. This configuration avoids the need for specialized components such as FBGs or Fabry–Perot cavities, offering a more robust solution against electromagnetic noise and temperature fluctuations. We systematically examine the influence of loop parameters, including the number of fiber turns on the system’s response characteristics, and demonstrate the capability of the sensor to detect both pseudo and real AE signals across a wide frequency range. The results support the potential of this approach for practical implementation in structural health monitoring and other vibration-based diagnostics.
2. Materials and Methods
2.1. Acoustic Emission (AE) Method
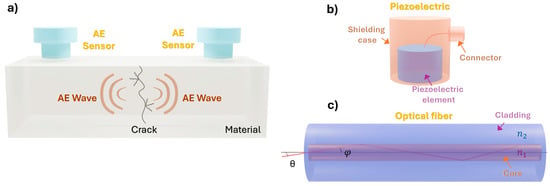
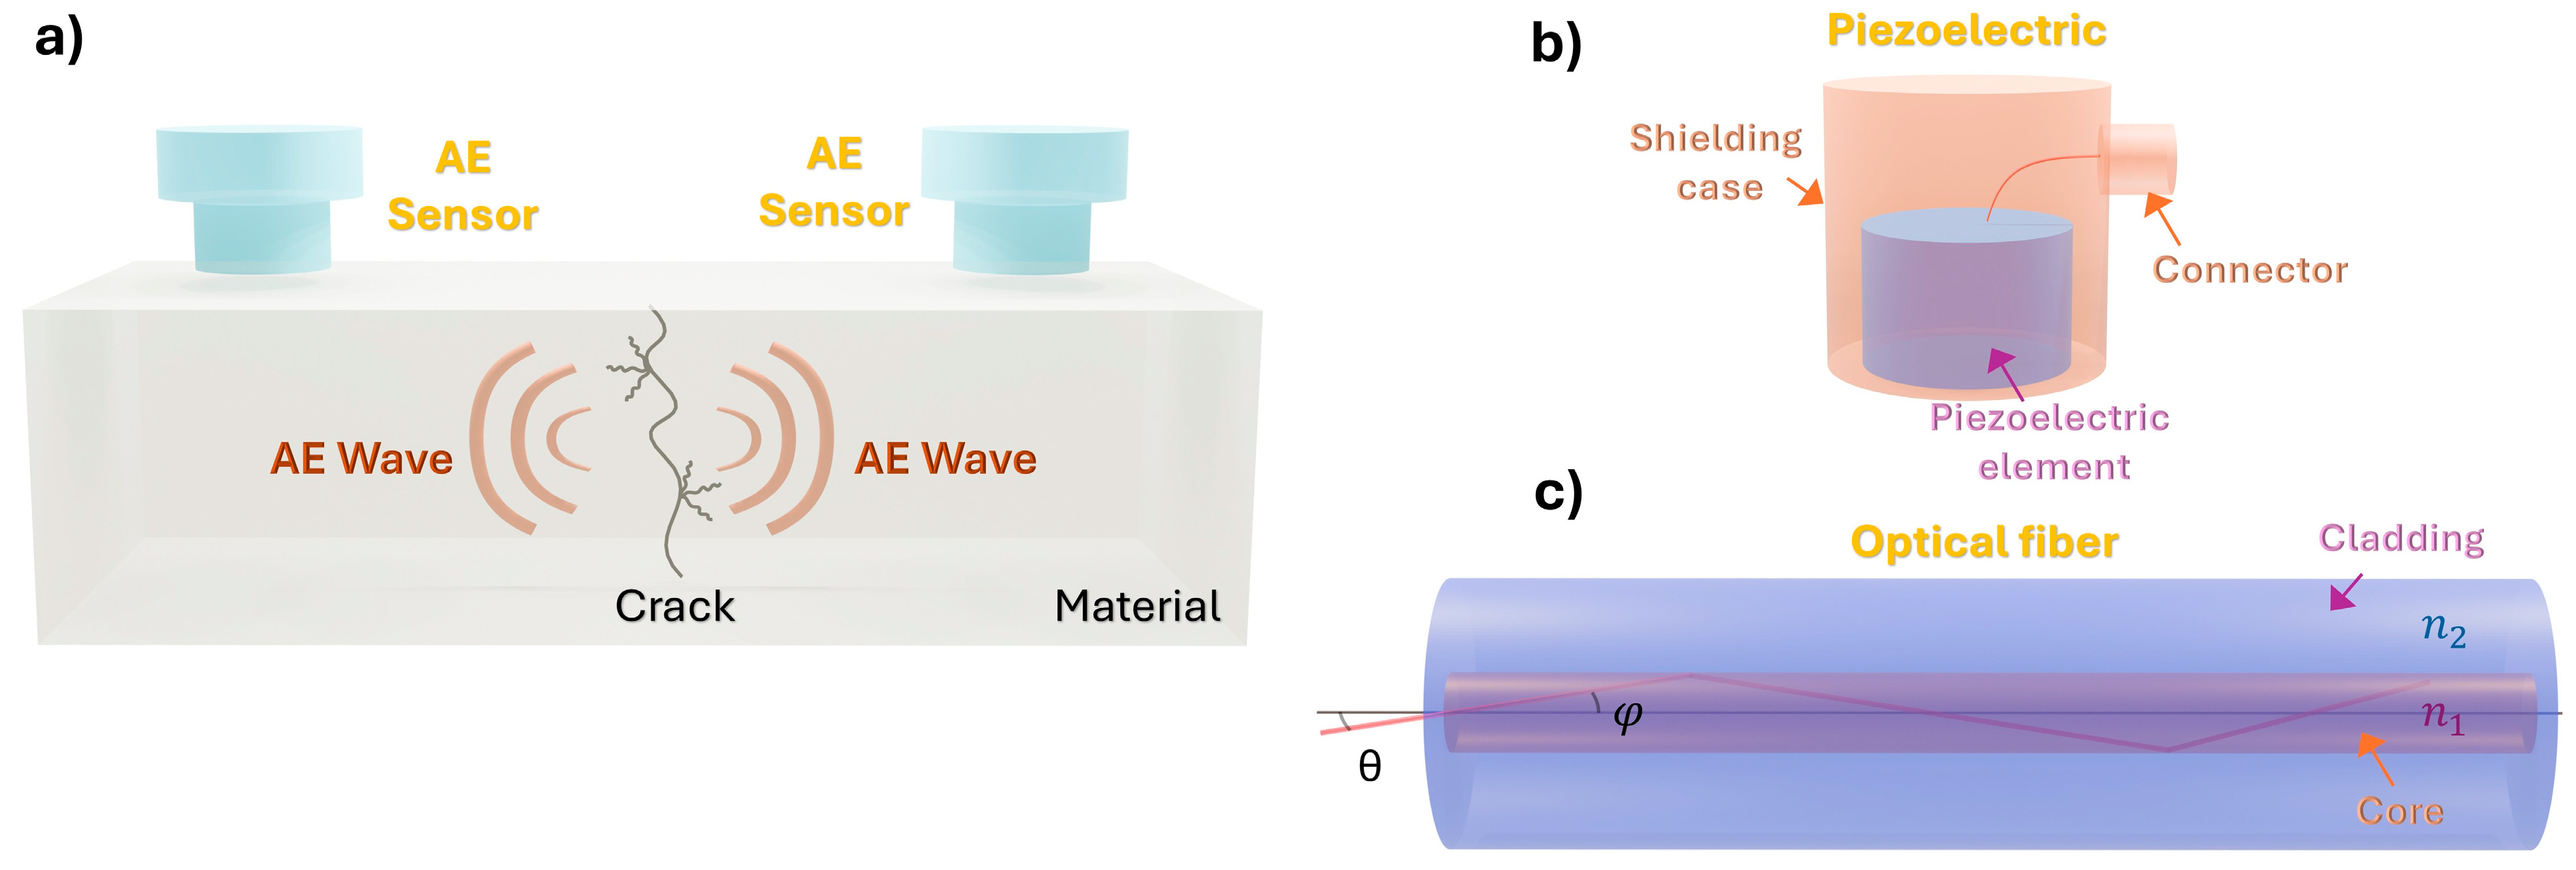
The acoustic emission (AE) method is a passive detection technique that collects information from elastic waves generated by the material itself, as shown in Figure 1. When an external force is applied to a material, macroscopic cracks may form, grow, and ultimately lead to failure. However, at the microscopic level, fine-scale damage phenomena occur, such as the initiation and propagation of microcracks. The formation and expansion of these microcracks consume the deformation energy stored within the material, part of which is released in the form of sound, heat, and other energy forms. Among these, the sound generated inside the material propagates as elastic waves. When the material deforms or fractures, the stored deformation energy is released, producing these waves. By installing multiple sensors on the target structure, the location of the AE source can be accurately determined. This enables the application of AE methods to the maintenance and inspection of large structures, such as aircraft and pressure vessels.
Figure 1.
Acoustic Emission (AE) method: (a) schematic diagram of the AE method, (b) structure of piezoelectric, and (c) structure of optical fiber.
Elastic waves generated by microcracks typically fall within high frequency [32], well above the range of human hearing. As a result, specialized sensors are required to detect these signals, with piezoelectric (PZT) and optical fibers being the most used types. The structure of an AE sensor using PZT is illustrated in Figure 1b. These sensors work on the principle of the piezoelectric effect, where certain materials generate an electric charge in response to mechanical stress, such as pressure or vibration. In an asymmetric design, the piezoelectric components are arranged in such a way that mechanical force is unevenly distributed across them. This asymmetry leads to charge differences across the sensor, increasing its sensitivity to minute pressure changes or vibrations, which is particularly valuable in systems that monitor structural integrity, acoustic emissions, or mechanical failures. The generated charge is then converted into an electrical signal, amplified, and processed for further analysis. Piezoelectric sensors are not suitable for extended use in hotter environments. Moreover, they are prone to electromagnetic interference and therefore require shielding, typically using magnetic caps or similar materials. Their performance may also degrade over time, especially under high loads or in harsh environments. In contrast, optical fiber sensors offer inherent advantages in environments where electromagnetic interference or temperature fluctuations are concerns. These sensors utilize optical fibers, which serve as waveguides to transmit light and are widely used in optical communication systems. As shown in Figure 1c, an optical fiber has a core with a high refractive index, surrounded by a cladding with a lower refractive index. This design enables total internal reflection at the core-cladding boundary, allowing light to travel through the fiber with minimal loss. When an AE occurs, the optical fiber detects subtle changes in the material. These small variations are translated into changes in light wavelength or intensity through physical effects like interference and reflection. The resulting AE signals can then be captured and visualized using a suitable optical detector.
2.2. Existing Vibration Detection Using Optical Fibers
An optical fiber essentially consists of a core in which light is confined, and a cladding that surrounds the core along the center. Protective coating is applied around the cladding to protect the fiber surface, enhance its mechanical strength, and facilitate handling. The refractive index of the core (), is slightly higher than that of the cladding (). Incident light entering the fiber from its end face is totally internally reflected at the boundary between the core and the cladding, remaining confined within the core and propagating along its length. For the incident light at an angle () to satisfy the condition for total internal reflection, the following condition must be met:
The inclination of light rays within an optical fiber is restricted to specific angles, as arbitrary angles do not satisfy the conditions for total internal reflection. In a single-mode fiber optic, light propagates in only one guided mode along the fiber axis, rather than in multiple discrete modes as in multimode fibers. The optical field is confined to the core, and its propagation is determined by the waveguiding properties of the single-mode structure.
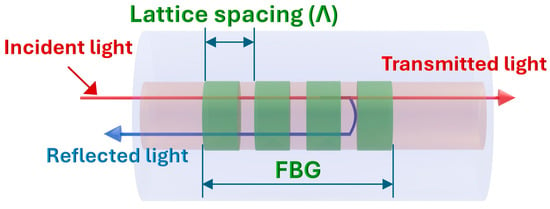
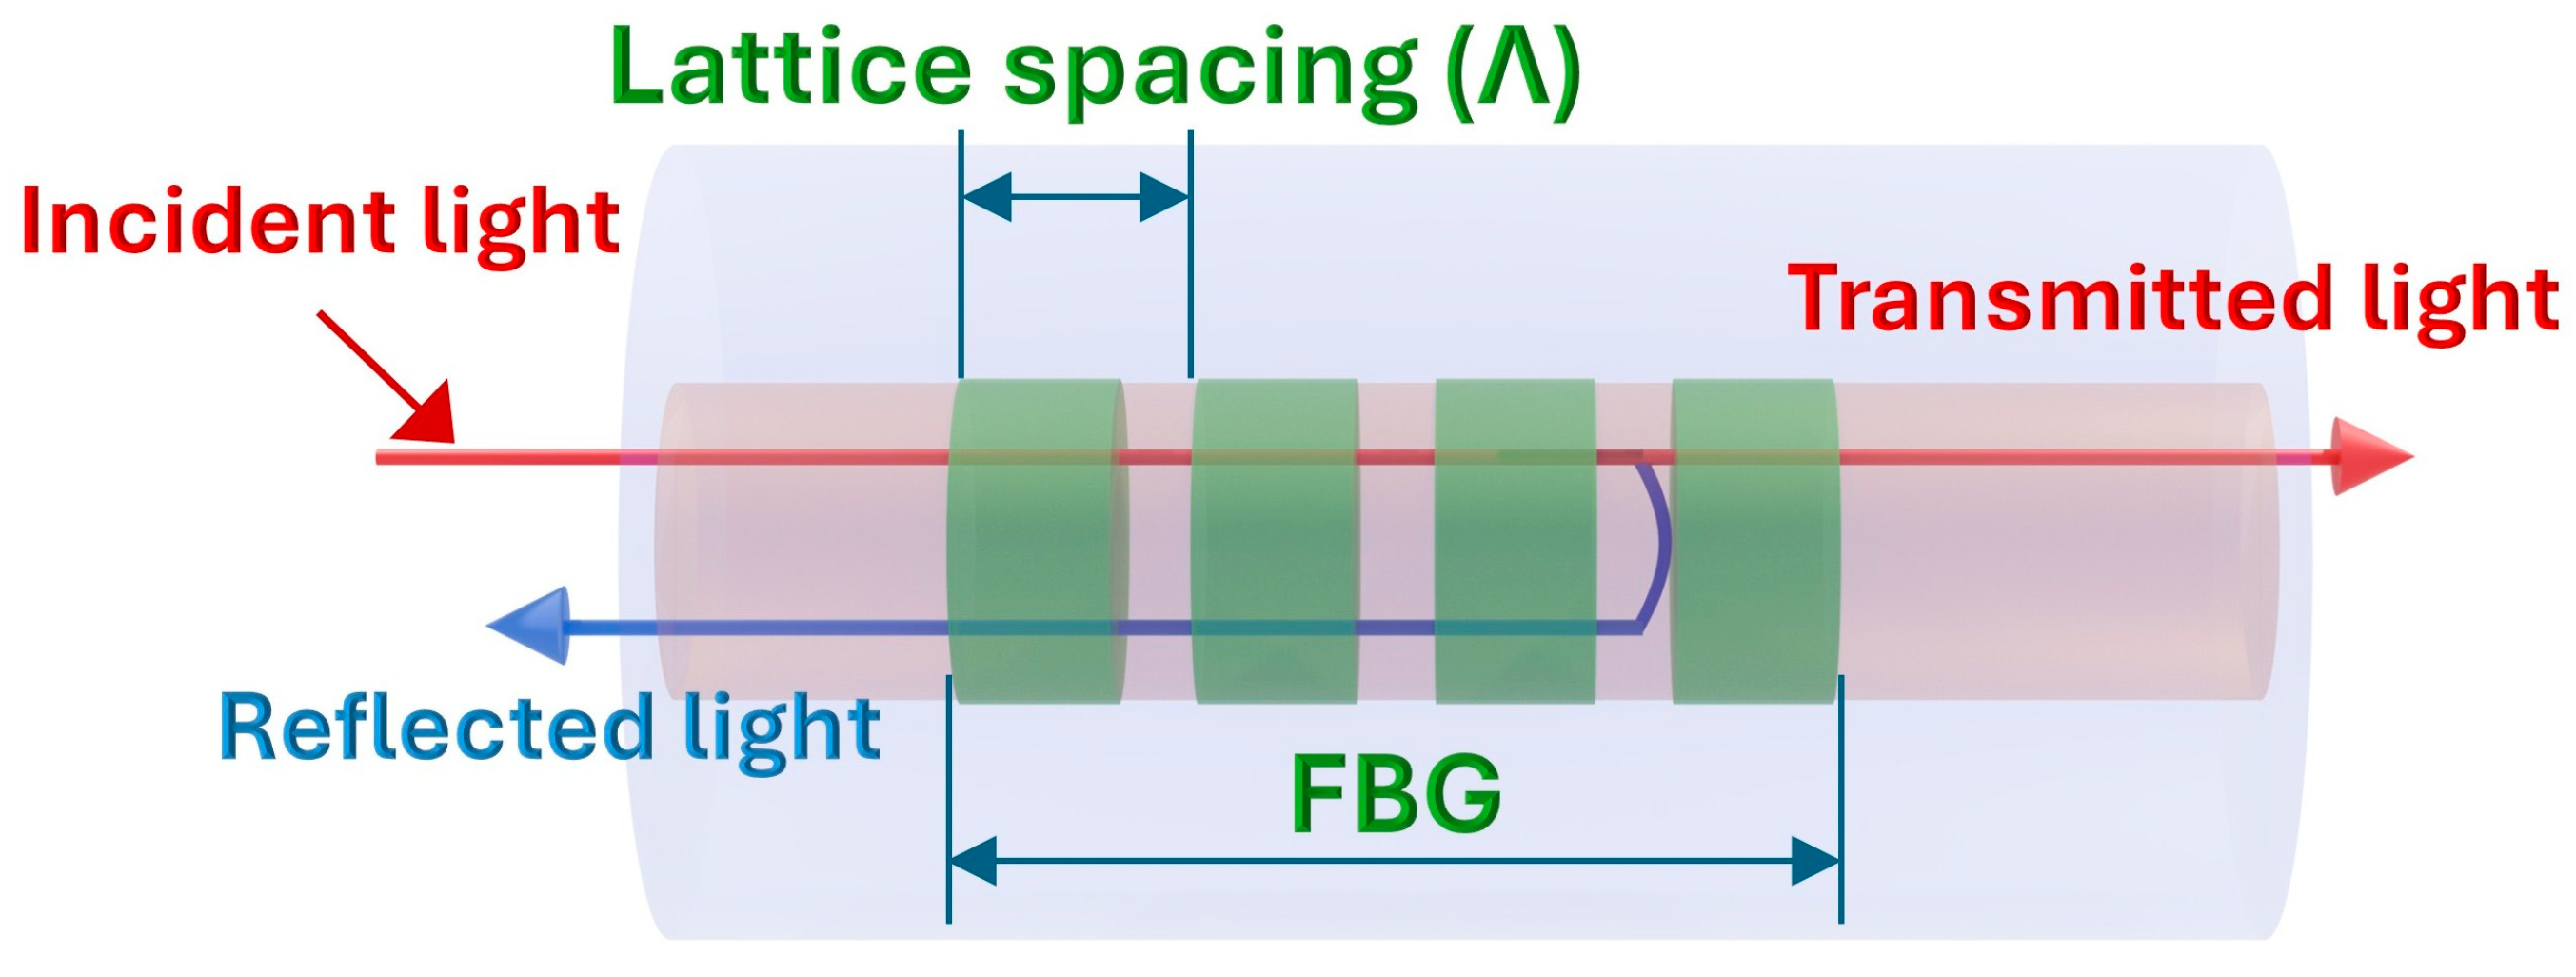
Because Fiber Bragg Grating (FBG) sensors are among the most widely used optical fiber AE sensors, a brief explanation of their operating principle is included here to contextualize the motivation and comparative discussion of this study. An FBG is an optical fiber in which a periodic modulation of the refractive index is formed. This periodic structure functions as a diffraction grating, reflecting only the light of a specific wavelength from the broad-spectrum incident on the fiber core. A schematic diagram of the FBG structure is shown in Figure 2. When broadband light enters the FBG, only the wavelengths that satisfy the Bragg condition experience constructive interference and are reflected, while all other wavelengths are transmitted through FBG regions of the fiber. The specific reflected wavelength, known as the Bragg wavelength (), is determined by the following Equation:
Figure 2.
Schematic diagram of FBG.
Here, denotes the refractive index of the fiber core, and represents the grating period of the diffraction lattice. As indicated by Equation (2), the Bragg wavelength () is directly proportional to the grating period . In other words, any change in the grating period leads to a corresponding shift in the Bragg wavelength, allowing the detection of elastic waves that alter the grating structure. However, FBGs are known to be sensitive to environmental temperature variations. When the fiber undergoes thermal expansion due to rising temperatures, the grating period Λ increases accordingly. Under such conditions, even if elastic waves induce local deformations, the resulting shift in the Bragg wavelength may be negligible or undetectable, leading to a failure in capturing the AE signal. Consequently, AE measurements using FBGs are most effective in environments with minimal temperature fluctuations.
2.3. Vibration Detection Using Interferometric Optical Fibers
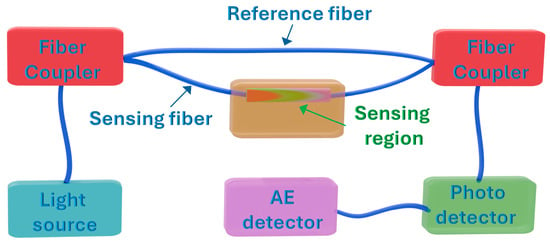
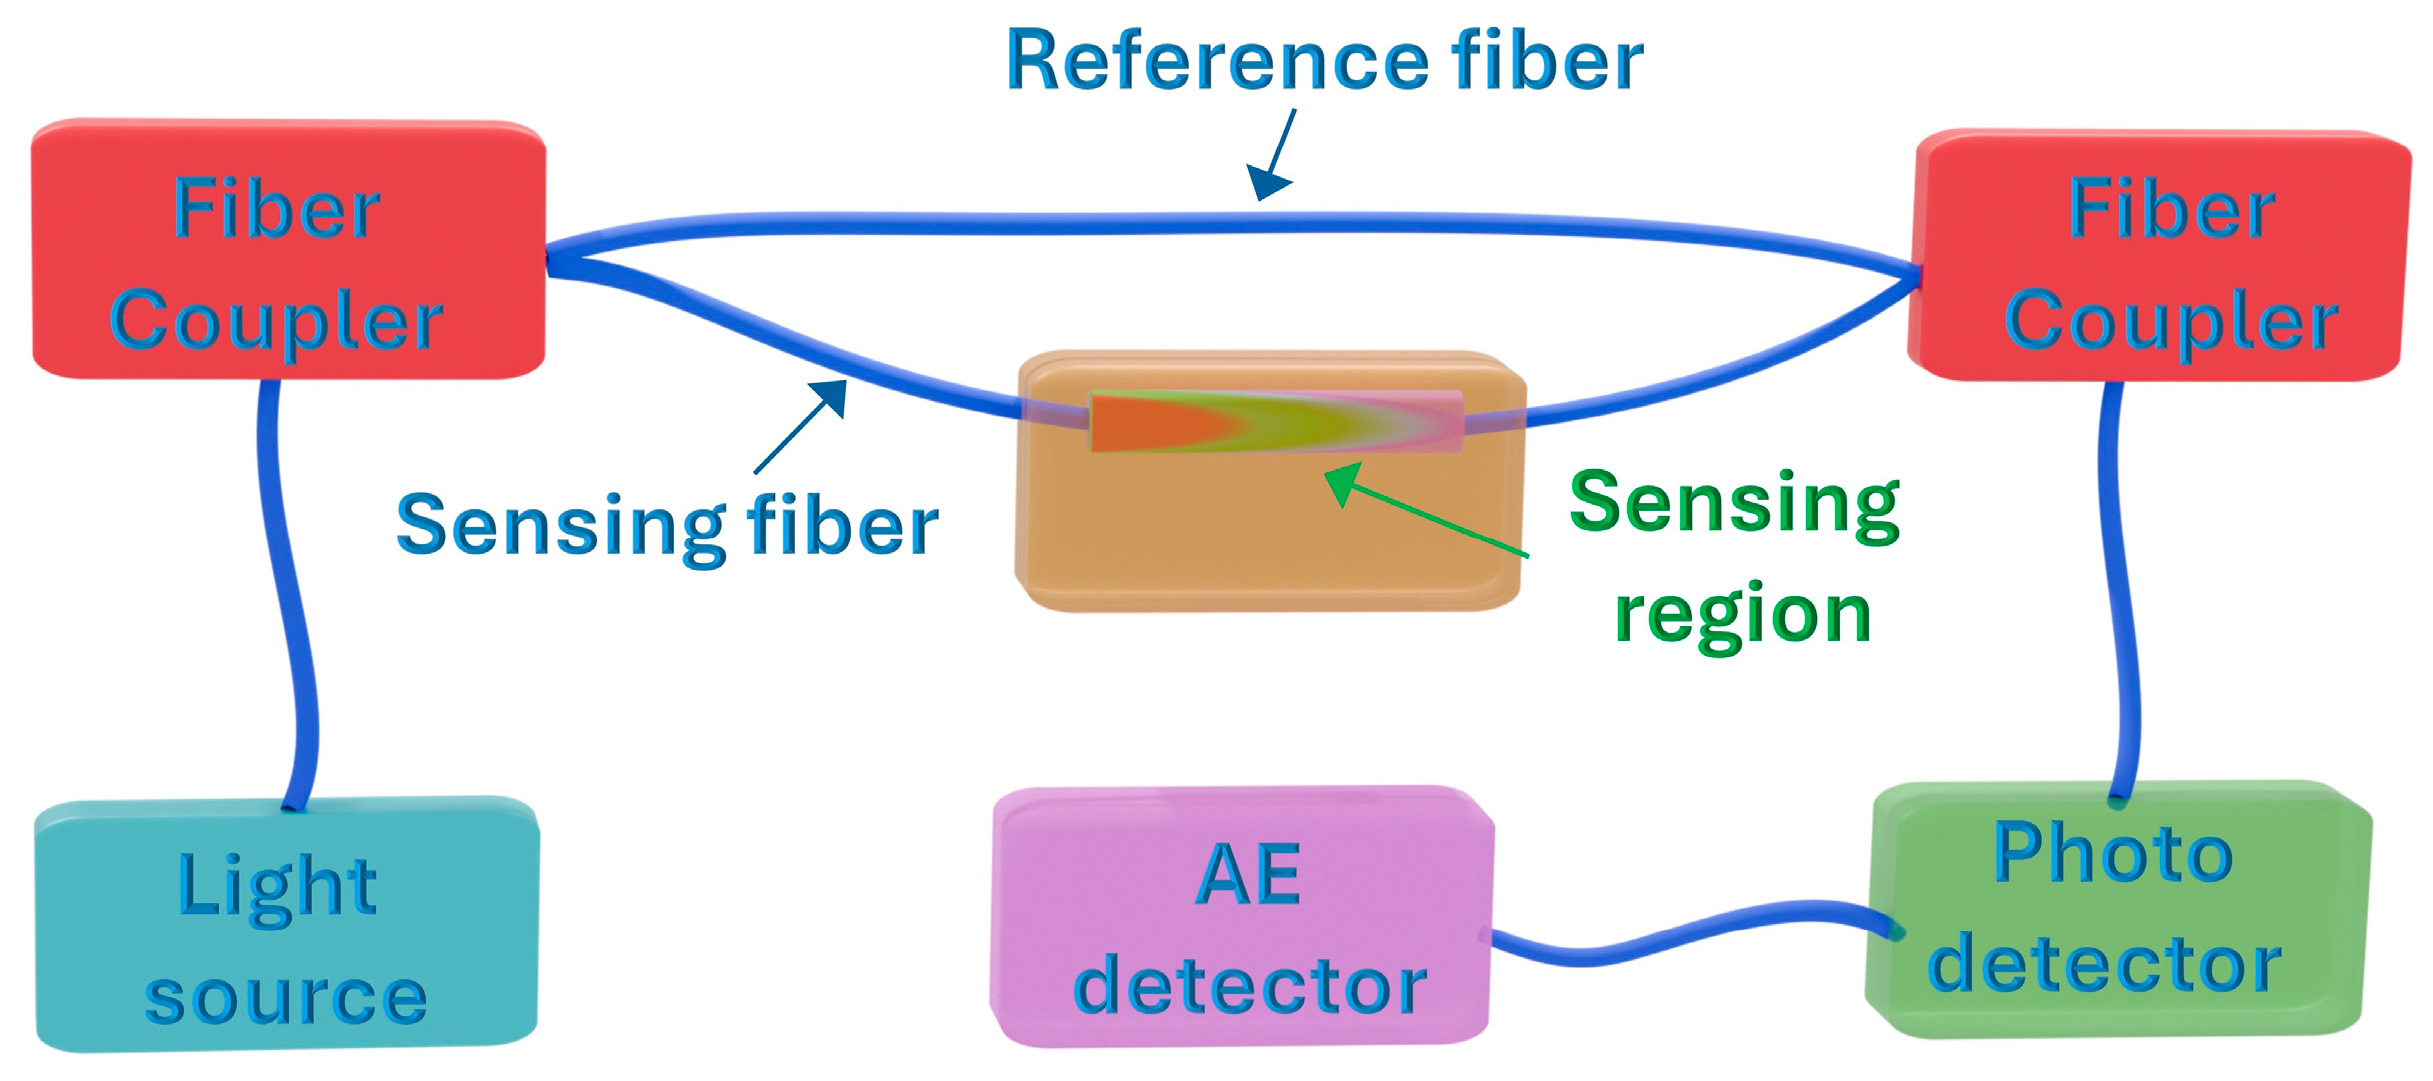
In this study, we study a vibration detection system based on optical interference as an alternative to conventional FBG approaches. Unlike systems that require specialized optical components such as FBG or acousto-optic modulator (AOM) for frequency modulation, the proposed interferometric optical fiber sensing system is simple, versatile, and suitable for a wide range of measurement environments. The schematic of the vibration sensor employed in this study is shown in Figure 3. This sensor comprises a sensing fiber that captures AE signals and a reference fiber to facilitate interference. Light emitted from the source is split into the sensing and reference fibers by a fiber coupler. After traversing their respective paths, the two light beams are recombined by the same coupler, producing an interference signal. Variations in the optical path length between the sensing and reference fibers result in changes in the interference intensity, enabling detection of AE signals. The relationship governing the intensity variation is expressed by the following Equation:
Figure 3.
Schematic diagram of an optical fiber vibration sensing system that uses interferometric optical fiber.
Here, denotes the intensity of the interference light, is the intensity of the light in the sensing fiber, is the intensity of the light in the reference fiber, represents the wavelength of the light, and is the optical path length difference between the sensing and reference fibers. For optimal sensitivity, both fiber couplers used in the interferometric setup should be of the 50:50 (or 3 dB) type to ensure equal power splitting between the sensing and reference arms.
3. Experimental Setup
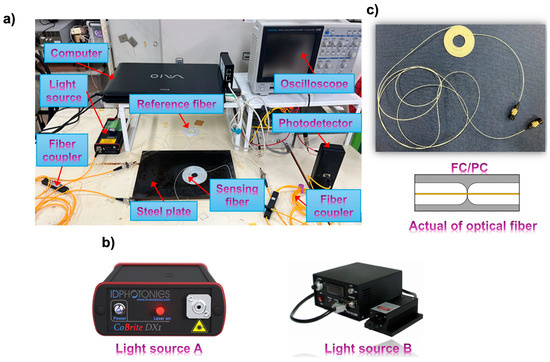
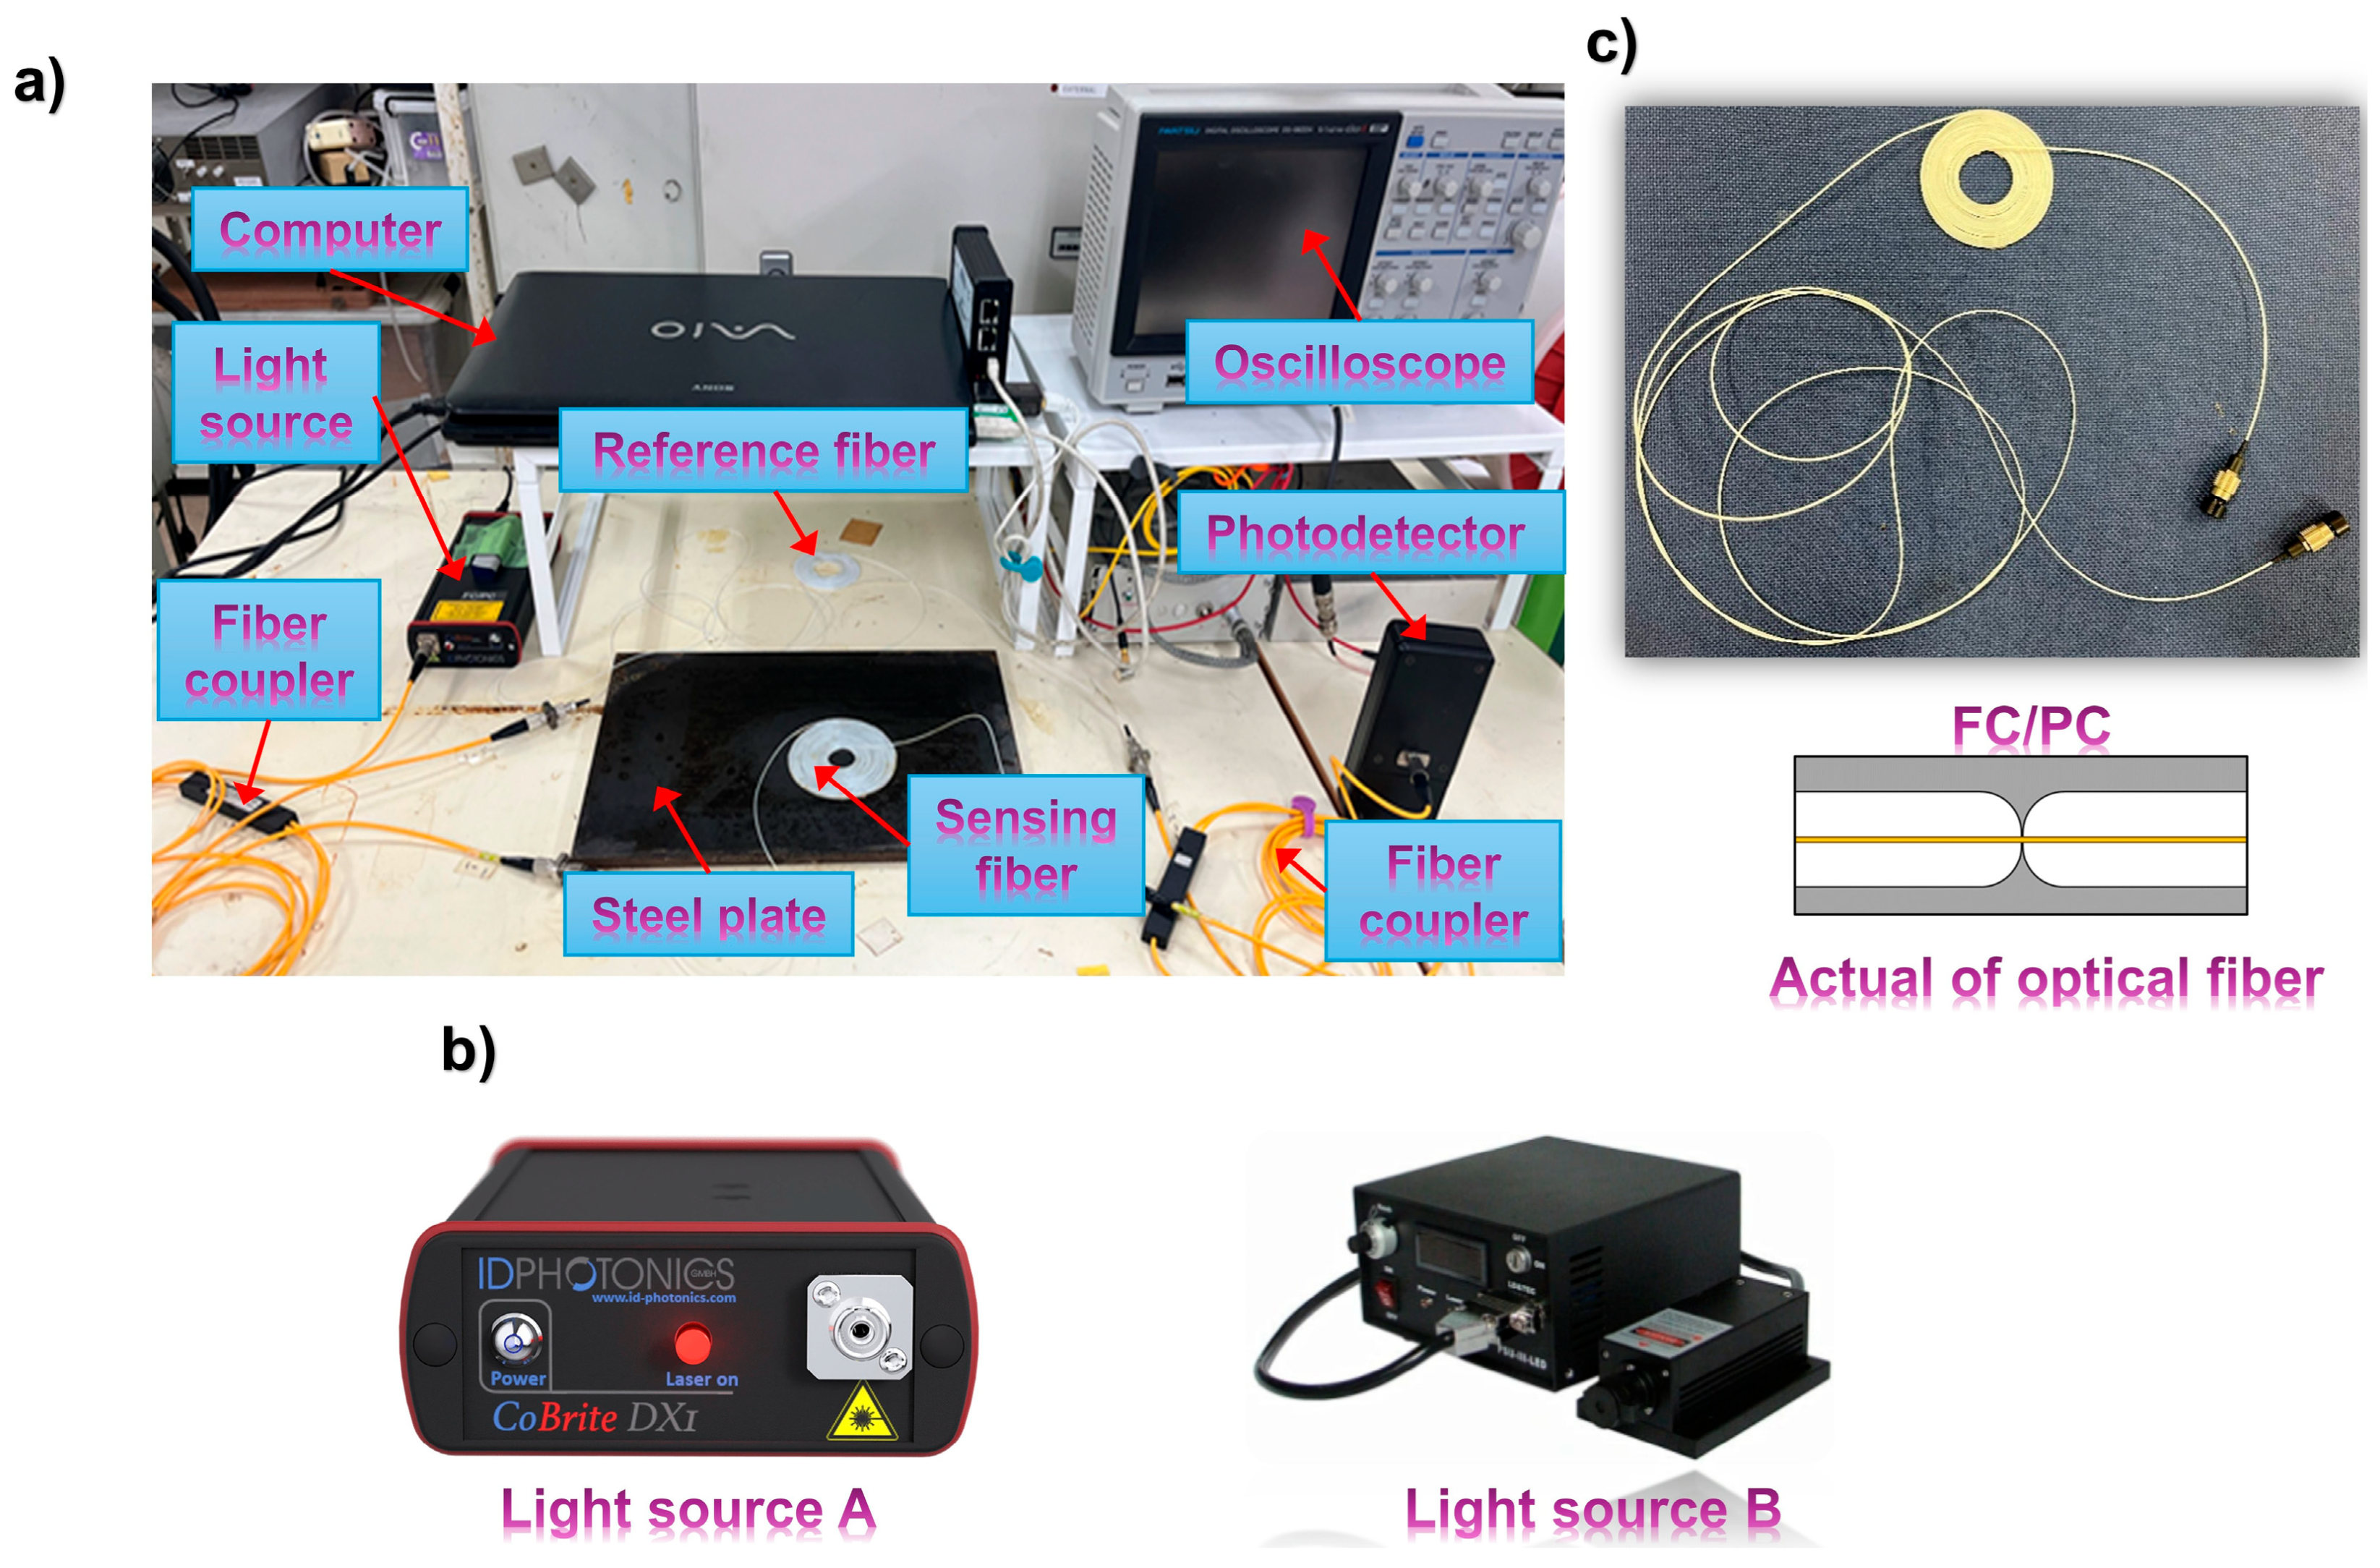
The actual vibration detection system based on optical interference is illustrated in Figure 4a. We compared the noise and vibration detection capabilities of laser light sources with different characteristics when connected to the interference system and selected the most suitable light source for interference. The light sources used in the comparison experiment are shown in Figure 4b. Light source A (CBDX1-1-C-H01-FP, manufactured by ID PHOTONICS, Neubiberg, Germany) is a narrowband laser characterized by emitting light within a very narrow wavelength range. We assumed that the wavelength stability of this source would enable high-precision measurements and therefore included it in our evaluation. In contrast, broadband lasers typically emit over a wider wavelength range, increasing the likelihood that light of varying wavelengths will enter the interference system and distort the interference pattern. To confirm the advantages of a narrowband laser, we conducted a comparative experiment using light source B (MG9001A STABILIZED LIGHT SOURCE, manufactured by Anritsu, Kanagawa, Japan) and light source C (MDL-III-1550, manufactured by CNI, Changchun, China), both of which are conventional broadband lasers.
Figure 4.
Experimental setup: (a) actual vibration detection system based on optical interference, and (b) light source used in the experiment, and (c) actual of optical fiber.
In the experiment, a low-carbon steel test specimen was used, and low-frequency vibrations were applied. To evaluate the response of each light source, the test specimen was tapped with a pen tip at a frequency of three times per second to generate vibration, and the resulting patterns were compared. To enhance the transmission of AE signals to the sensing fiber, couplant (commonly used in flaw detection and thickness measurements) was applied between the test specimen and the sensor. The sensor was then fixed using a neodymium magnet plate to eliminate any air gap, thereby improving acoustic and vibration signal detection.
Table 1 summarizes the test conditions for the light sources. All light sources were operated at the same intensity of 6 dBm. The wavelengths were 1527.605~1567.133 nm, and a linewidth typically less than 100 kHz for light source A, and 1550 ± 10 nm for light source B. Compared to narrowband light source A, broadband source B have wavelength tolerances spanning several tens of nanometers. The oscilloscope was set with a sampling rate of 100 kHz, and a measurement time of 1 s. Initial measurements were taken with DC coupling to verify light transmission, followed by AC coupling to filter out oscillations in the interference signal and facilitate vibration detection.
Table 1.
Light source experimental conditions.
4. Experimental Results
4.1. Experimental Results Regarding the Selection of Light Sources and the Establishment of Interference
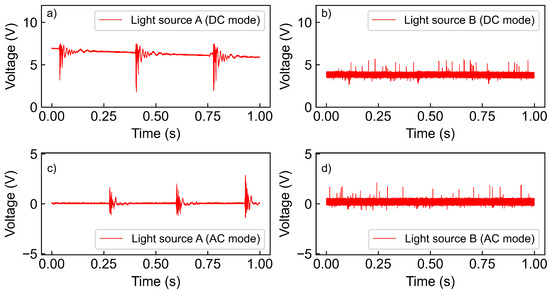
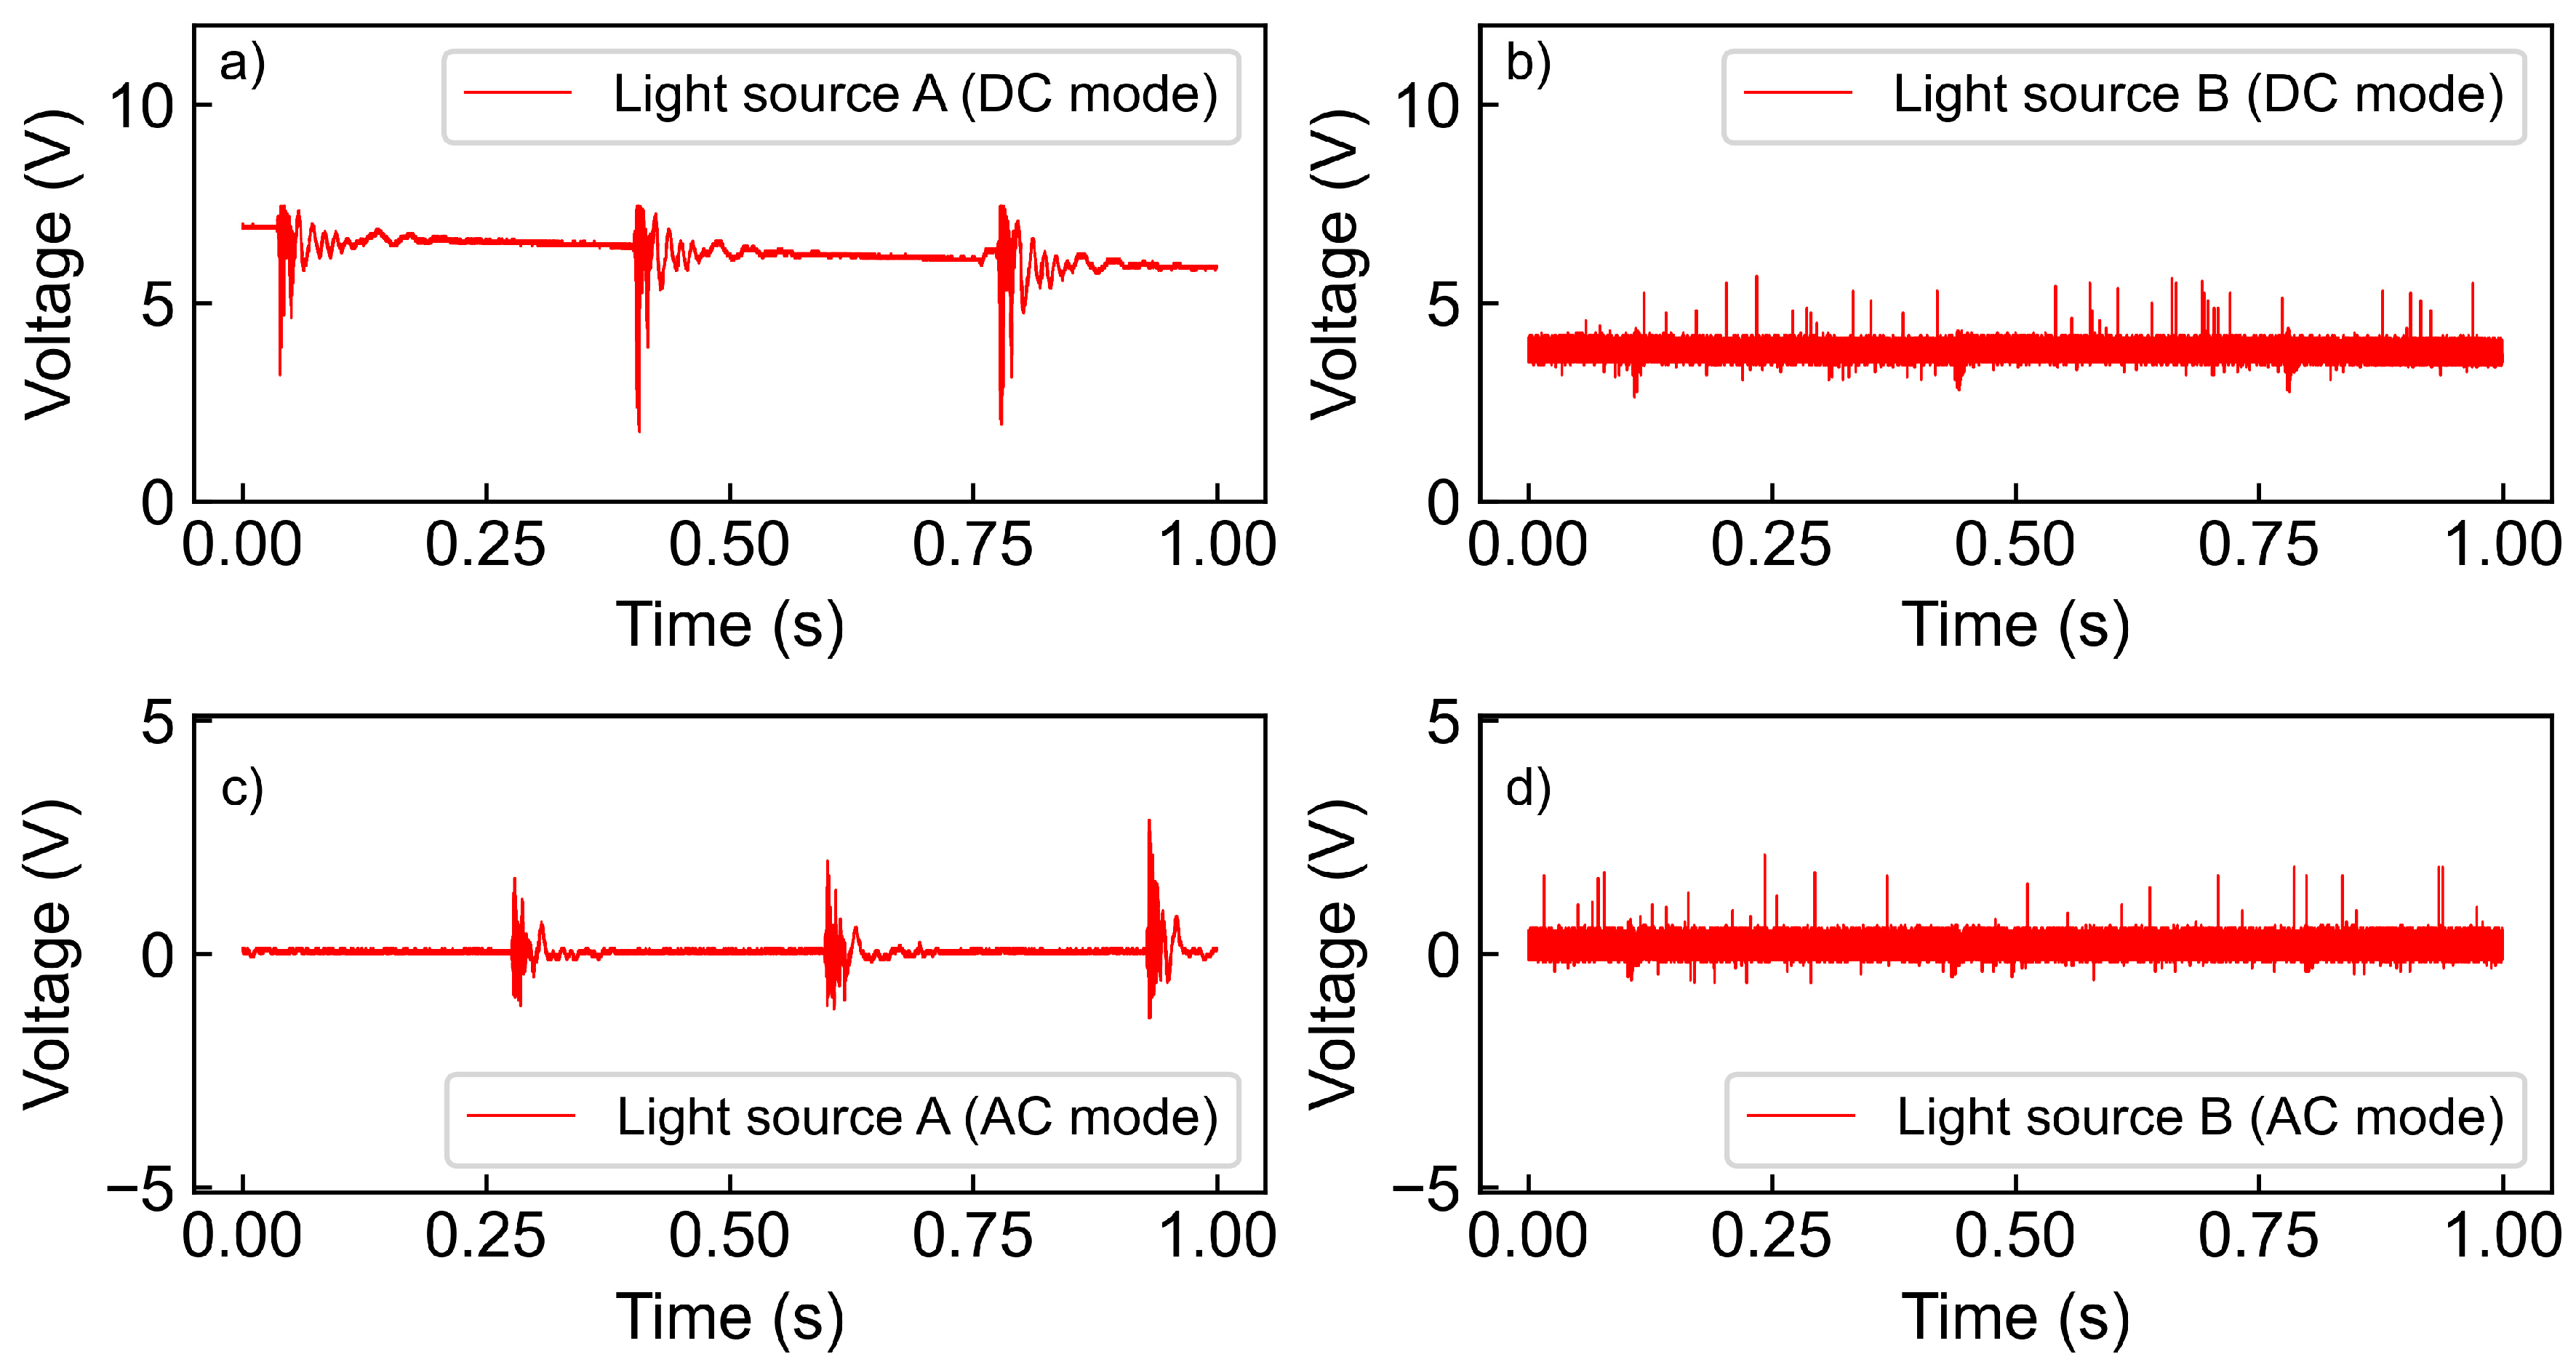
Although the use of a narrow-linewidth laser is generally known to improve the stability of interference signals, this point is particularly relevant in our setup because the sensing and reference fibers form a simple two-arm structure without any additional phase-stabilizing components. In such a configuration, the interference output is strongly influenced by the coherence characteristics of the light source. For this reason, we experimentally compared lasers with different linewidths. This comparison is included here to justify the choice of the laser used in the following measurements and to show its effect on the overall signal quality. The experimental results of light source in DC mode and AC mode are shown in Figure 5a, Figure 5b and Figure 5c, Figure 5d, respectively. These graphs illustrate the variation in interference light intensity over the measurement time. The vertical axis represents the interference light intensity, which is converted into an electrical signal by the receiver and recorded as voltage. Among the DC mode results, only Figure 5a exhibits a non-constant voltage, fluctuating continuously between 2.5 V and 7.5 V. This phenomenon is believed to result from the interference light intensity described by Equation (3). When the sensing fiber and the reference fiber are directly connected to the photodetector, their outputs are 4.12 V and 3.80 V, respectively. Since these lights are combined by an optical coupler with a 50:50 branching ratio, the resulting outputs are halved. Therefore, in Equation (3), and are given as 2.06 V and 1.90 V, respectively. The value of continues to oscillate due to the bending and flexing of the fiber, satisfying the condition:
Figure 5.
Experimental results of light source: (a) light source A (DC mode), (b) light source B (DC mode), (c) light source A (AC mode), and (d) light source B (AC mode).
The fluctuation observed in Figure 5a falls within this predicted range, confirming that the measured signal is consistent with the interference behavior described by Equation (3). Therefore, if (V) and (V), the intensity of the interference light is expected to vary between and . The observed intensity variation of the interference light when using the narrowband laser light source in this experiment satisfies this expectation. On the other hand, the experimental results for light source B (Figure 5b), which are broadband lasers, show constant intensity, contrary to the predicted behavior above. When examining the measurement results in AC mode, where the DC component is removed to better visualize vibration-related fluctuations, it can be observed that signal variations appear for both light sources A and B. However, the response obtained using light source B exhibits a very low signal-to-noise ratio and does not allow reliable or stable acoustic emission detection. A significant difference in detection sensitivity is evident between the two sources. Specifically, light source A shows a reference signal amplitude of 0.125 V and a vibration amplitude of 4.24 V (Figure 5c), whereas light source B shows a reference amplitude of 0.812 V and a vibration amplitude of only 1.06 V (Figure 5d). The corresponding signal-to-noise ratios are calculated to be 30.6 dB and 2.33 dB, respectively. A higher signal-to-noise ratio indicates better device performance and clearer detection of vibration signals. In summary, only the narrowband laser CBDX1-1-C-H01-FP manufactured by ID PHOTONICS succeeded in establishing interference, and its signal-to-noise ratio indicates the highest vibration detection efficiency among the tested sources. This result shows the superiority of narrowband lasers in interference-based optical fiber sensors. Consequently, this narrowband laser light source was selected for use in subsequent experiments.
4.2. Experimental Results of Comparison Between Sensing Fiber and Reference Fiber
In optical fiber sensors, the material of the optical fiber significantly influences the internal optical signal, particularly due to optical loss caused by differences in frequency response characteristics and refractive index. In this experiment, the optical fiber was wound into a loop with a flat contact surface to enhance detection sensitivity. This configuration allows the entire sensor to respond to vibrations more effectively and facilitates easier installation on the measurement target. The optical fiber used is shown in Figure 4c. However, increasing the number of turns leads to greater bending loss, which is expected to reduce the signal voltage and significantly affect noise performance. Therefore, a comparison experiment was conducted to observe waveform changes resulting from varying the number of turns in both the sensing fiber and the reference fiber.
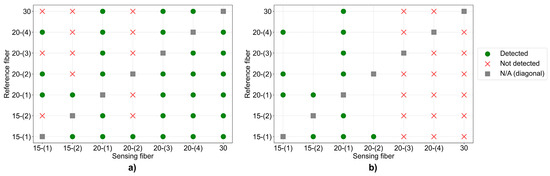
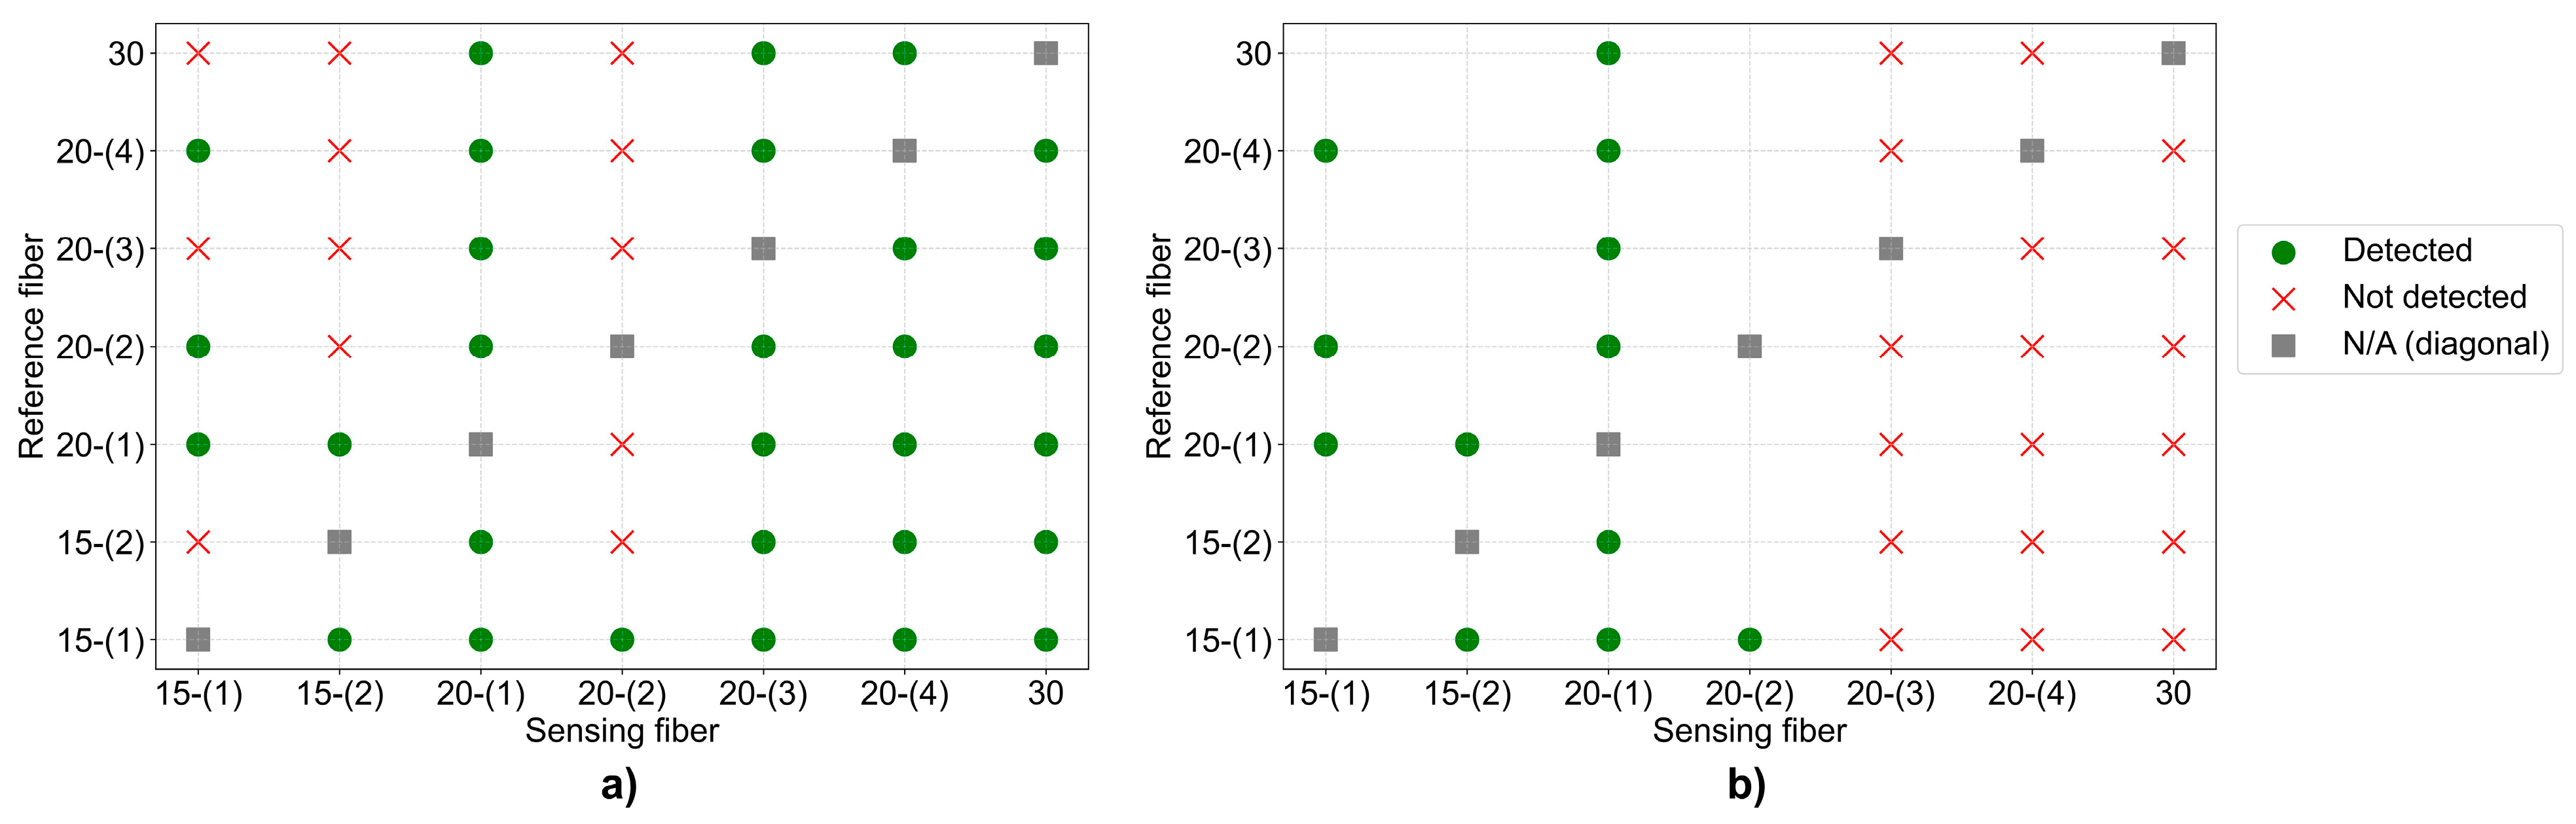
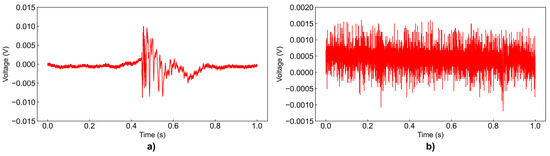
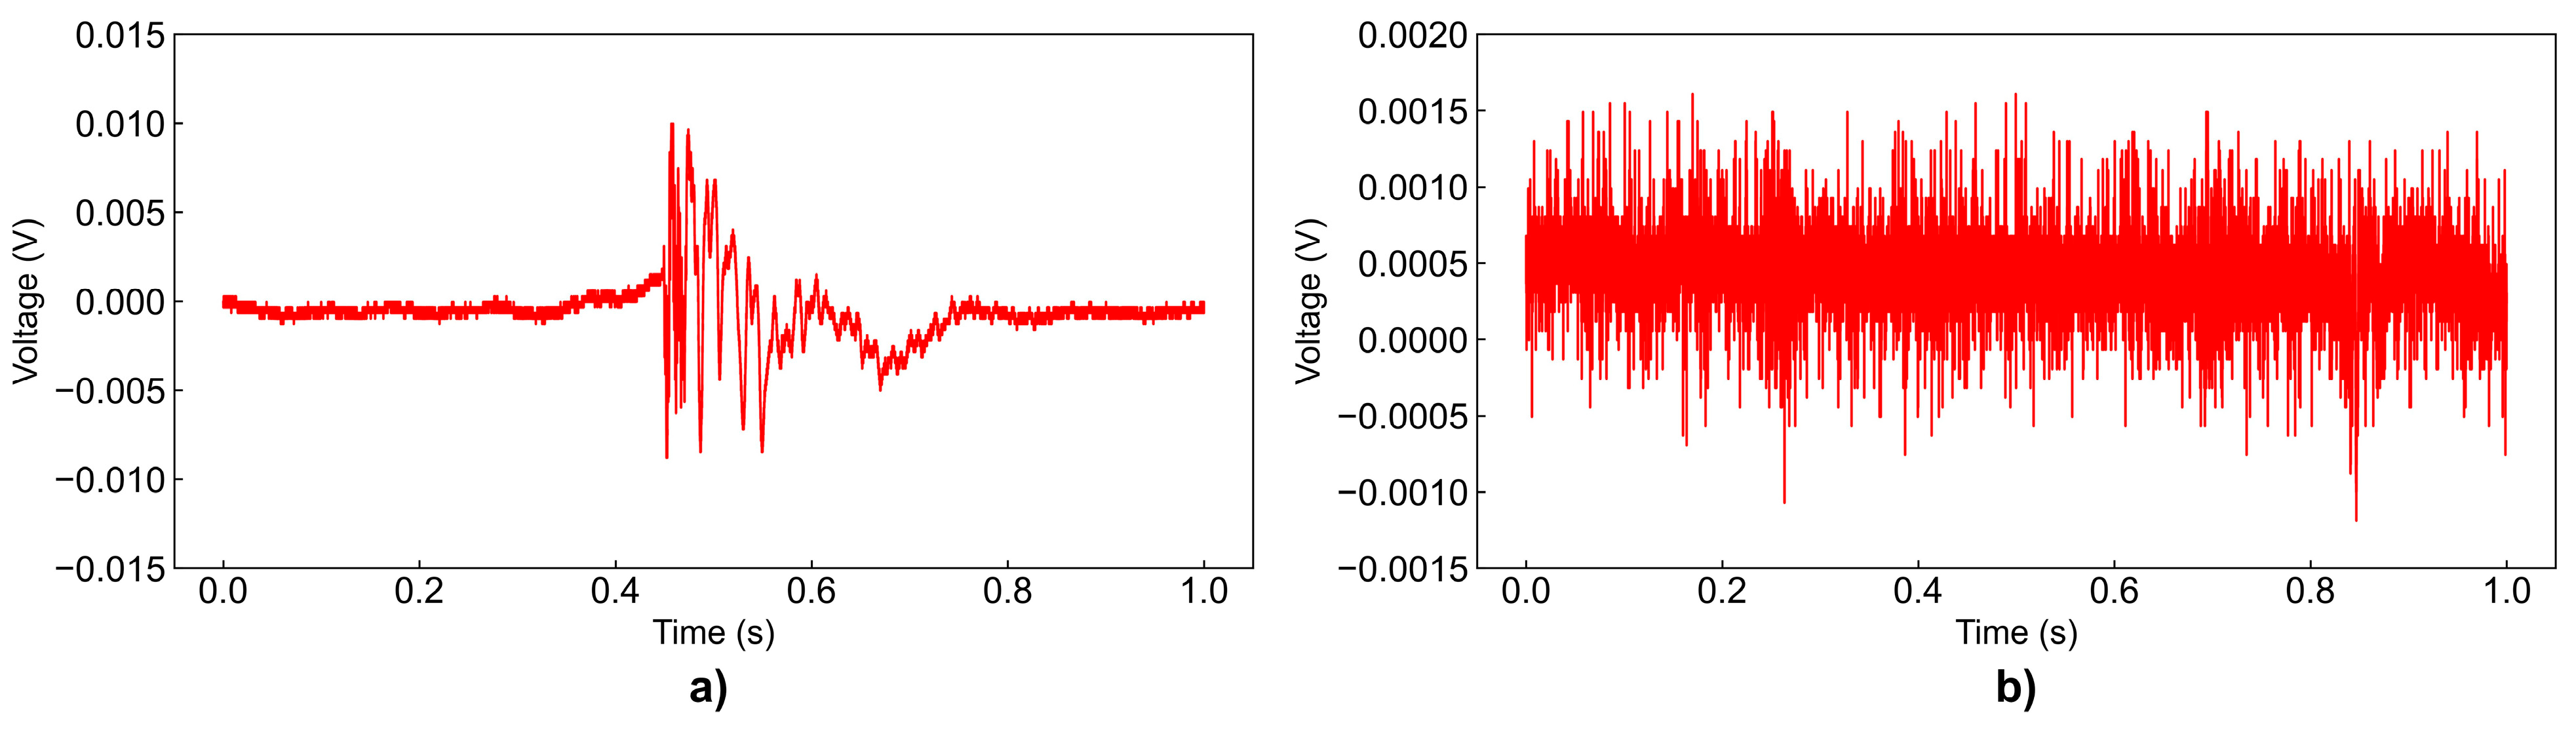
The details of the optical fibers used in the experiment are summarized in Table 2. All fibers were single-mode optical fibers, each 5 m in length, with a center wavelength of 1550 nm, equipped with FC/PC connectors. The test included fibers with 15, 20, and 30 turns. Each fiber had a diameter of 0.9 mm and was made of quartz glass coated with polymer (resin), and a numerical aperture of approximately 0.13–0.14, which is typical for conventional single-mode fibers at 1550 nm. Fibers with the same number of turns were distinguished by labels such as 15-(1) and 15-(2). The “Pencil Lead Break” method was employed in this experiment to evaluate sensor performance. The oscilloscope and photodetector conditions are provided in Table 3, with the photodetector gain set to 30 dB. To suppress DC interference and make the oscillation signal easier to observe, the measurements were taken in AC coupling mode. The experimental conditions for light source A included a wavelength of 1567.133 nm. The results of the combined experiments between the sensing fiber and the reference fiber are shown in Figure 6a. Combinations that were able to detect vibrations are marked with ◯, while those that could not are marked with ×. Examples of results evaluated as ◯ and × are shown in Figure 7.
Table 2.
Specifications of the optical fiber used in the experiment.
Table 3.
Measurement settings of the oscilloscope and photodetector.
Figure 6.
The results of the combined experiments between the sensing fiber and the reference fiber: (a) experimental results, (b) FFT results.
Figure 7.
Examples of experimental results evaluated: (a) detected (◯), (b) not detected (×).
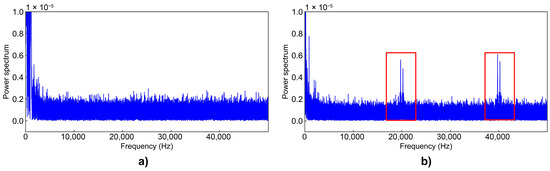
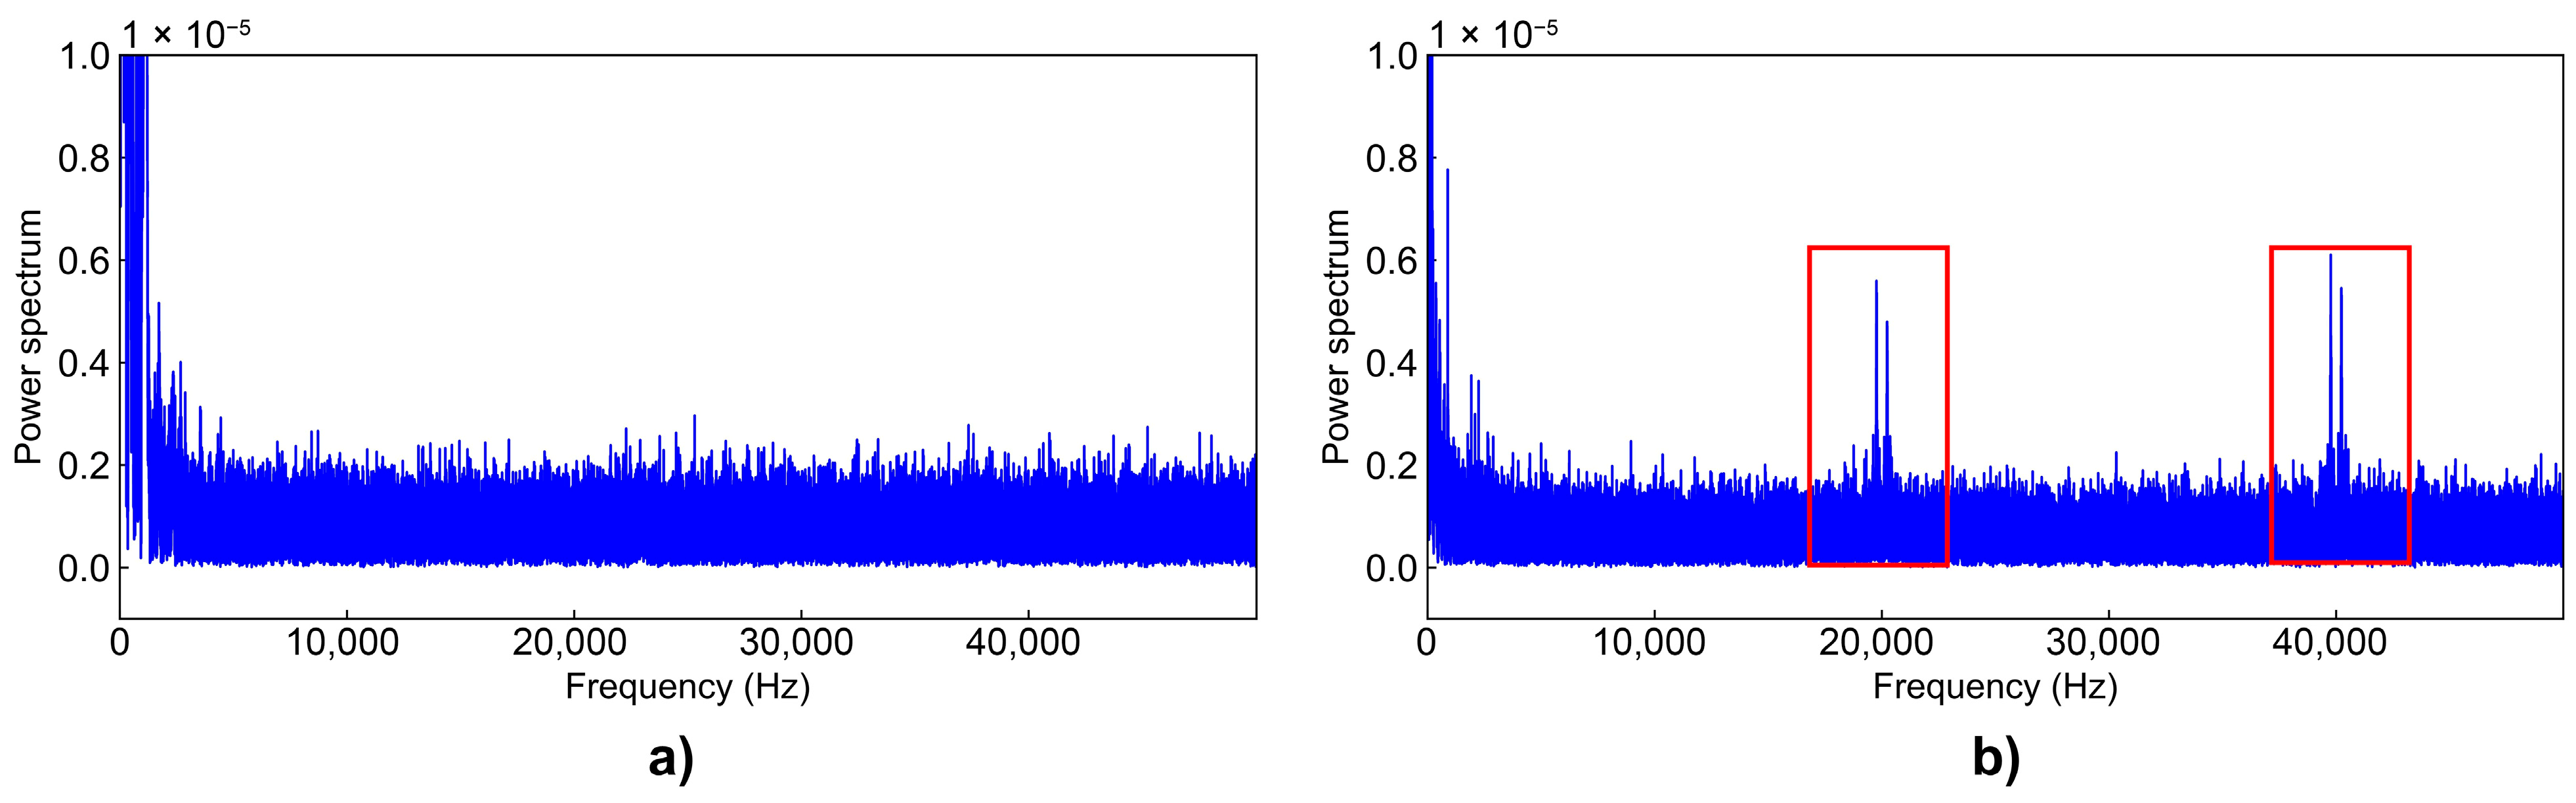
Based on Figure 6a, FFT analysis was performed on the vibration-detectable combinations. This analysis allows visualization of the frequency components within the obtained waveforms. Two types of FFT results were observed: one in which peaks appear only in the low-frequency range, as shown in Figure 8a, and another in which peaks are observed at 20 kHz and 40 kHz, outside the low-frequency range, as shown in Figure 8b. Results showing detection of high-frequency bands (Figure 8b) are marked with ◯, while those showing only low-frequency peaks (Figure 8a) are marked with × and shown in Figure 6b. The columns corresponding to combinations that failed to detect vibrations in Figure 6a are left blank. Configurations marked with ◯ in both cases indicate that high-frequency AE signals can be effectively captured.
Figure 8.
Examples of FFT analysis results: (a) not detected (×), and (b) detected (◯).
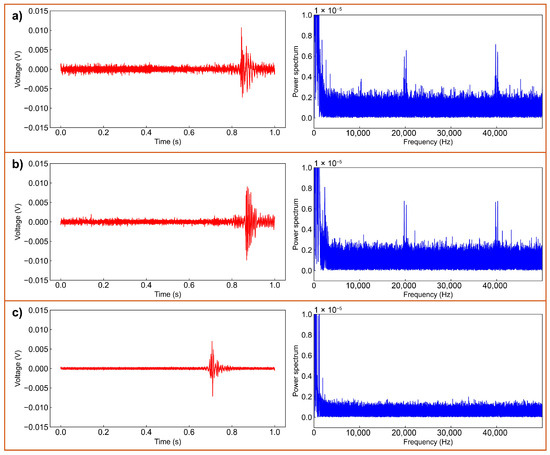
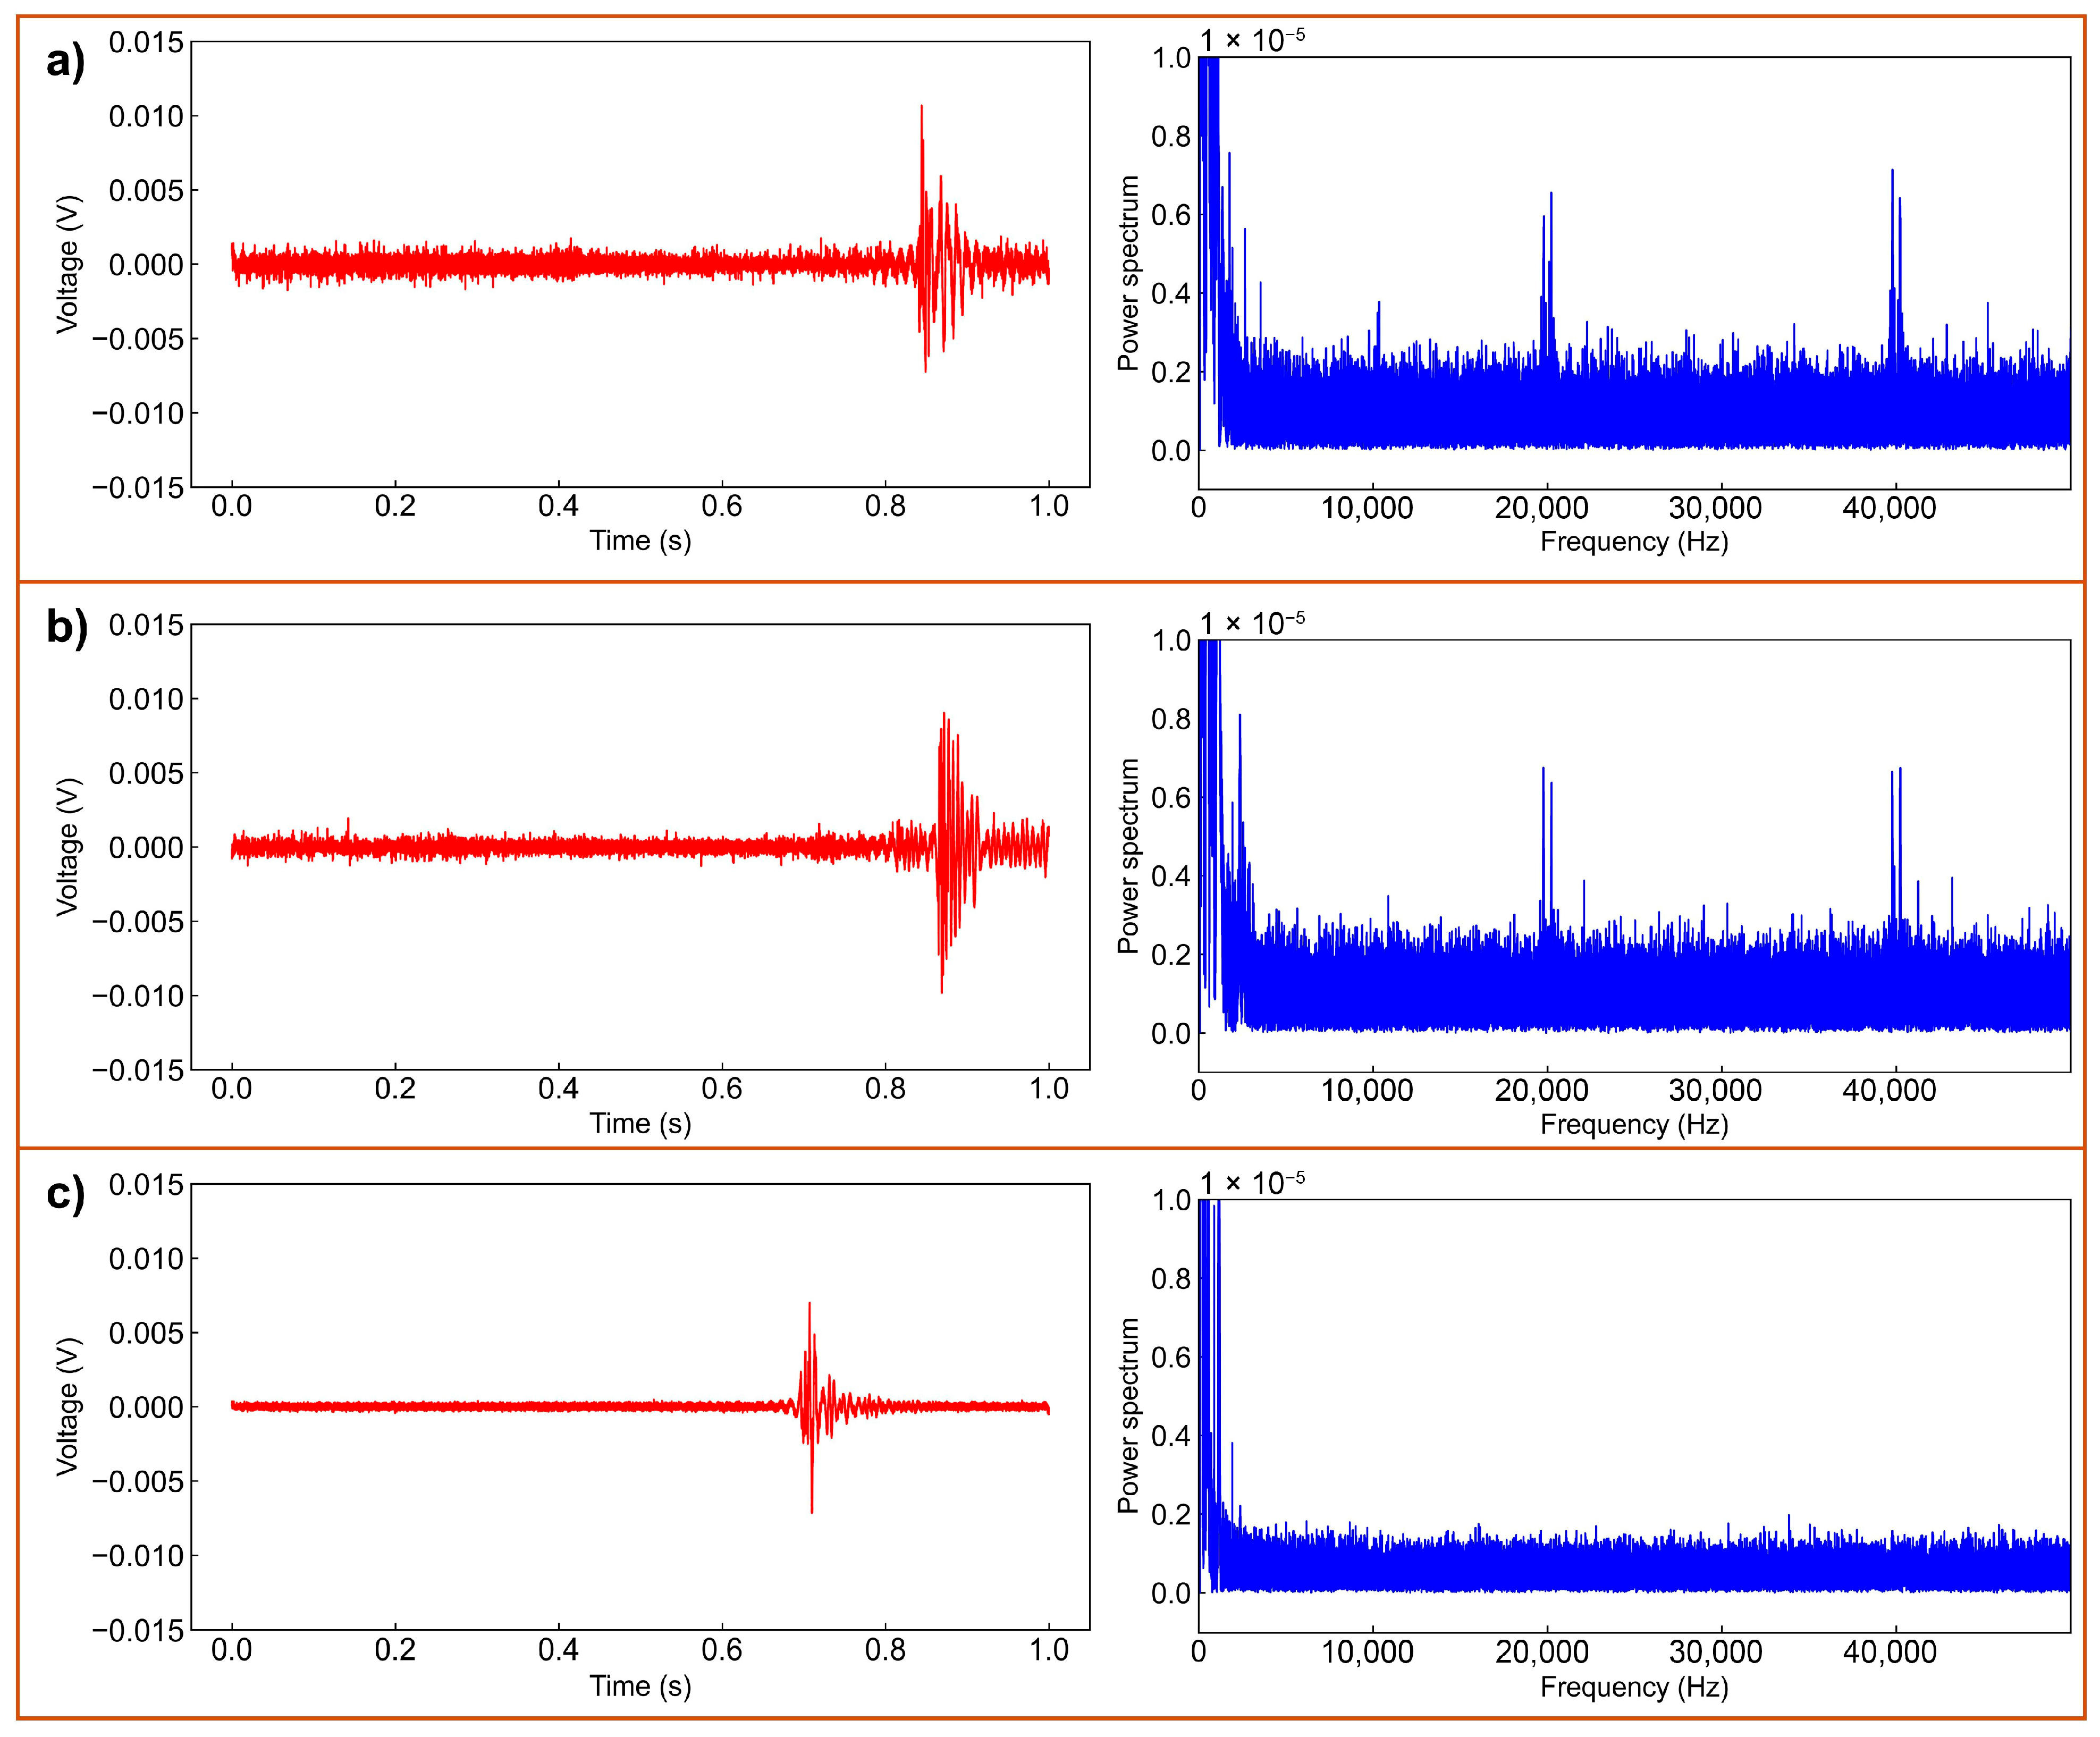
From these results, it is evident that increasing the number of fiber turns reduces the ability to detect high-frequency bands. Figure 9 (left side) shows the experimental waveforms for each number of turns after applying an 80 Hz high-pass filter. Although there are variations across datasets, the amplitude generally decreases as the number of turns increases. This is likely due to increased bending losses associated with more fiber turns. Figure 9 (right side) presents the FFT results for this data. As shown in Figure 9a,b, frequency peaks at 20 kHz and 40 kHz are visible for the 15 turns and 20 turns of fiber, indicating successful detection of high-frequency components. In contrast, the 30 turns of fiber do not exhibit such peaks, indicating the inability to detect high-frequency signals (Figure 9c). A clearer understanding of loss behavior is obtained by considering the bending radius of the fiber coil. For the 15-turn coil, the radius ranged from approximately 14 mm to 20.5 mm. The 20-turn coil exhibited slightly more relaxed curvature, with radius of about 15–30 mm. In contrast, the 30-turn coil included several tightly bent regions with radius near 10 mm, while its outer turns extended up to 40 mm. Because bending loss in single-mode fibers increases markedly when the radius falls below approximately 15 mm, the 30-turn coil experiences significantly greater attenuation due to its smaller-radius segments and longer total bent length. In addition to bending loss, the disappearance of the 20 kHz and 40 kHz components in the 30-turn coil can be explained by phase-cancelation effects arising from acoustic-wave propagation across the coil diameter of approximately 40 mm. Considering typical acoustic velocities, approximately 5900 m/s in steel and 2000 m/s in fiber coatings, an acoustic wave requires on the order of 20 μs to traverse this distance at 2000 m/s. At frequencies near 20–25 kHz, this travel time corresponds to a phase difference close to 180°, resulting in opposite elongation phases on opposite sides of the loop and partial cancelation of high-frequency strain components. This effect does not occur uniformly across the coil, as phase differences are strongest near 45° relative to the propagation direction and may be further influenced by uneven acoustic-wave coupling to different parts of the fiber. Together, these factors provide a consistent explanation for the marked reduction in high-frequency sensitivity observed in the 30-turn configuration.
Figure 9.
Experimental waveforms and FFT for each number of turns after applying an 80 Hz high-pass filter: (a) 15 turns of fiber, (b) 20 turns of fiber, and (c) 30 turns of fiber.
These observations also clarify the role of the spiral winding and the use of multiple loops. Winding the sensing fiber into a spiral increases the contact area between the fiber and the specimen surface, allowing small surface displacements associated with AE to be transferred more effectively to the fiber. In this configuration, an intermediate number of turns (15–20 loops) provides a practical balance between mechanical responsiveness and bending-related optical attenuation. When the number of turns is increased to 30, several portions of the coil exhibit smaller bending radii, which introduce greater loss and reduce interference visibility. In addition to this optical effect, the larger coil diameter also causes acoustic-wave propagation delays across the loop, which can lead to partial phase cancelation of high-frequency strain components. Together, these factors explain the disappearance of the 20 kHz and 40 kHz peaks in the 30-turn configuration, whereas the 15- and 20-turn coils maintain detectable high-frequency components. Because the fiber used in this study is a standard single-mode communication fiber with fixed properties, the influence of bending was characterized empirically by comparing different loop configurations and their corresponding bending radii. The attenuation trend observed for 15, 20, and 30 turns therefore reflects the combined effect of the intrinsic fiber structure and the imposed loop geometry, without relying on an analytical model of waveguide parameters.
4.3. Evaluation of AE Signals During Tensile Tester
In previous experiments, artificial AEs were generated by breaking a pencil lead to collect experimental data. In this section, a tensile testing machine was employed to generate real AE signals, and an experiment was conducted to verify whether these signals could be detected by the sensing device. The test material was fixed in a clamp, and one end was pulled to evaluate the tensile properties. A model RTC-1350A tensile tester, manufactured by Orientec, was used in this study. AE measurement devices are designed to detect weak signals generated by deformation or damage in materials and to analyze their characteristics. As AE signals are typically weak, the goal is to improve signal-to-noise ratio using internal amplifiers and filters, thereby enhancing detection accuracy. Additionally, the device incorporates software to analyze the acquired data and extract patterns related to material deformation or damage. In this experiment, the USB AE Button by Physical Acoustics was used. For the optical detection system, sensing fiber 20-(1) and reference fiber 20-(2) were employed. Both fibers were wound with 20 turns to achieve a balance between sensitivity and bending loss, and their combination was selected based on prior evaluation results confirming stable interference and high-frequency AE signal detectability.
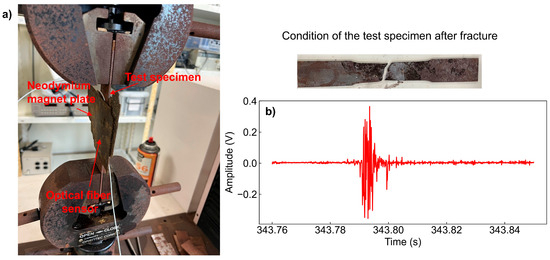
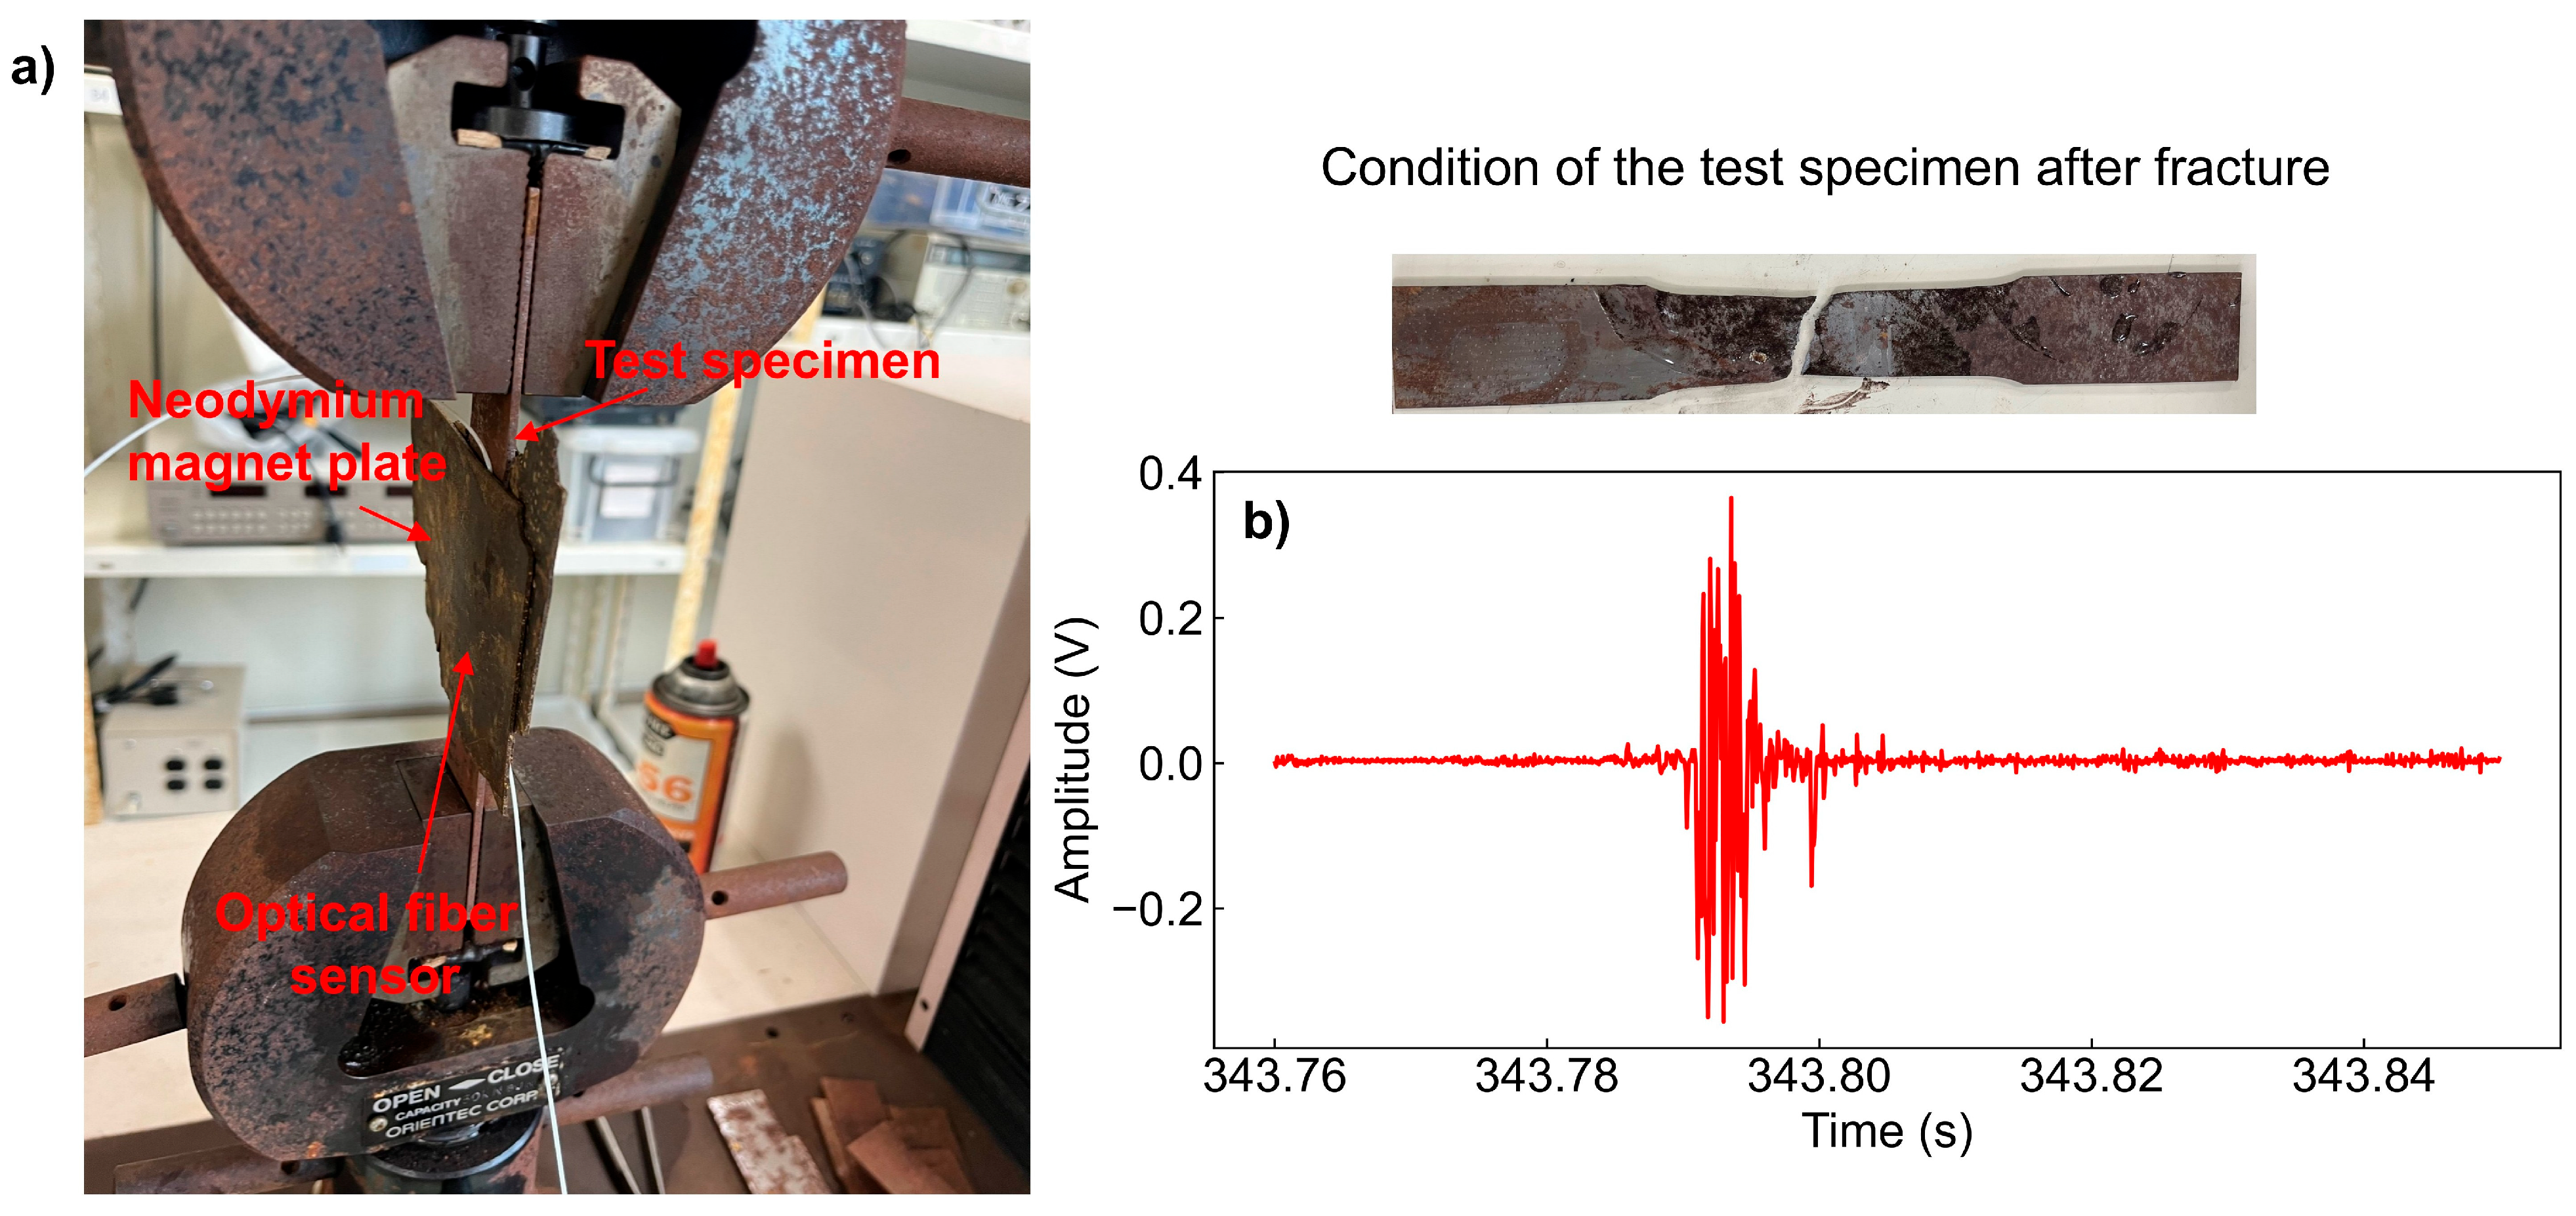
Real AE measurement was performed by pulling an steel test specimen using the tensile tester, as shown in Figure 10a. The AE device was configured with a threshold of 54 dB was set to avoid false detections due to noise. A band-pass filter ranging from 20 kHz to 1 MHz was applied to target the typical frequency range of AE waves. The experiment continued until the specimen fractured, which occurred at 347 s. Figure 10b presents the waveform detected before the point of fracture. Due to the applied band-pass filter, the waveform was confirmed to consist of components within the 20 kHz to 1 MHz range, demonstrating that the sensor developed in this study is capable of detecting actual AE signals.
Figure 10.
Experimental results of AE signals during tensile tester: (a) experimental setup with RTC-1350A tensile tester, and (b) waveform detected at the point of fracture.
5. Discussion
5.1. Stability of the Measurements
To evaluate the repeatability of the proposed interferometric AE sensor, repeated measurements were conducted under identical conditions. For pencil-lead-break tests, the peak amplitude and waveform shape were highly consistent across multiple trials, with variations of less than 5% in peak value. Similarly, during repeated tensile tests, the dominant frequency components and transient AE signatures showed negligible deviation between experiments. This consistency indicates that the interference state of the sensing–reference fiber pair remains stable and that the loop configuration does not introduce significant randomness in the AE response. These results confirm that the proposed system provides reliable and repeatable AE detection suitable for practical monitoring applications.
In this study, the PLB tests and tensile-tester measurements were conducted under stable laboratory conditions (approximately 22–25 °C), and no intentional temperature variation was applied. Because the sensing fiber and reference fiber employed different loop configurations and different numbers of turns (Section 4.2), their thermo-optic and thermo-mechanical responses are not identical, meaning that temperature effects are not completely canceled in the interference signal. Nevertheless, within the limited ambient fluctuations during the experiments, no noticeable drift in the baseline of the interference waveform or distortion of the AE frequency components was observed. Since AE signals are short-duration transient events, their spectral characteristics are minimally affected by slow temperature changes on the time scale of each measurement. A quantitative evaluation of the temperature response will be addressed in future work.
5.2. Qualitative Comparison
The experimental results demonstrate that the proposed interferometric optical fiber sensor provides a robust and adaptable solution for acoustic emission (AE) detection. Unlike conventional cavity-based interferometric sensors, such as Fabry–Perot (FP) and diaphragm-assisted microcavity designs, whose sensitivity is inherently constrained by fixed structural geometries, the sensing characteristics of the present system can be flexibly tuned through adjustments to the fiber-loop configuration. The number of turns, bending-induced loss, and optical-path intensity ratio jointly determine the interference contrast and, consequently, the AE detection sensitivity. This tunability represents a distinctive advantage, as it enables post-fabrication optimization without requiring any microstructuring or precision alignment.
A key observation of this study is that the highest AE sensitivity is achieved when the sensing fiber exhibits either equal or slightly higher optical intensity than the reference fiber. This balance maximizes interference modulation depth while avoiding excessive bending loss that reduces the fringe visibility. The systematic mapping of different loop combinations demonstrates that configurations with fewer turns (15–20) retain sufficient mechanical responsiveness to capture high-frequency AE components at 20–40 kHz, whereas 30-turn loops suffer from pronounced attenuation. The results verify that loop configuration is not merely a secondary structural factor but a primary mechanism governing the sensor’s frequency response and sensitivity. It should also be noted that the spiral loop geometry used in this work is not designed to provide multi-directional or vectorial AE sensing. Rather, it improves strain-transfer efficiency and installation practicality by distributing the fiber–surface contact over a wider area, while the underlying interferometric detection remains essentially one-dimensional along the fiber.
When detecting real AE signals generated during tensile fracture, the proposed system successfully measured broadband components from 20 kHz to 1 MHz. The AE waveforms exhibited clear transient characteristics consistent with those captured by a commercial AE device used as reference, confirming the practicality of the interferometric approach. Importantly, the fully passive nature of the system, consisting only of standard telecom-grade fibers and a narrowband laser, ensures inherent immunity to electromagnetic interference, a well-known limitation of piezoelectric AE sensors.
- Comparison with other optical fiber AE sensors
Relative to other classes of fiber-optic AE sensors, the present interferometric loop configuration offers a favorable balance of performance and implementation simplicity:
- FBG-based AE sensors provide high strain sensitivity, but their AE performance is often affected by Bragg-wavelength drift due to temperature fluctuations. This drift requires compensation strategies or high-speed wavelength demodulators, increasing system complexity and potentially degrading effective SNR during high-frequency AE measurements.
- Fabry–Perot (FP) cavity sensors can achieve excellent acoustic sensitivity when the cavity length, diaphragm thickness, or reflective surfaces are precisely fabricated. However, their response is highly dependent on the microcavity geometry, making them sensitive to packaging stress and long-term stability issues. Once fabricated, the sensing characteristics are fixed and cannot be tuned without reconstructing the cavity.
- Proposed interferometric loop sensor (this work) achieves competitive AE sensitivity and stable SNR using only standard single-mode fibers and a fiber coupler, without gratings, cavities, or micro-machined structures. Sensitivity can be tuned by simply adjusting the loop configuration (number of turns, intensity ratio), enabling post-fabrication optimization, a practical advantage not available in cavity-based designs.
- Overall significance
The results indicate that the proposed interferometric AE sensor not only provides a simple and cost-effective alternative to cavity-based optical fiber sensors but also introduces a practical design philosophy based on loop-configuration optimization. By leveraging bending-induced phase modulation and controllable optical-path differences, the sensor bridges the gap between fully passive fiber structures and high-performance AE detection requirements. This positions the device as an attractive candidate for structural health monitoring applications, especially in environments where electromagnetic noise, temperature fluctuation, or installation constraints limit the use of piezoelectric or cavity-based optical sensors.
6. Conclusions
This study experimentally investigated a simple and cost-effective acoustic emission (AE) measurement device using optical interference as the vibration detection mechanism. The key results of this research are summarized as follows:
- Pseudo-AE signals were generated through pencil lead break tests, and the results demonstrated the superiority of the narrowband laser as a light source. FFT analysis of the acquired waveforms further confirmed the device’s capability to detect frequency components characteristic of AE waves.
- The influence of the number of fiber turns and the difference in signal intensity between the sensing fiber and reference fiber was investigated. It was confirmed that stronger interference and higher sensitivity were achieved when the sensing fiber had equal or higher intensity than the reference fiber, and when the number of turns was optimized to avoid excessive bending loss.
- Real AE signals were successfully detected during tensile testing of metal specimens. The developed optical fiber sensor, combined with an AE measurement device and proper filtering, captured signals in the 20 kHz to 1 MHz range during fracture periods, confirming the system’s applicability to real AE detection.
Overall, the proposed system offers a viable alternative to conventional piezoelectric-based AE sensors, particularly in environments where electromagnetic interference and temperature variation are concerns. The experimental results confirm that waveform characteristics and frequency sensitivity can be tuned by modifying the fiber configuration, and that the system can detect both pseudo and actual AE signals.
Author Contributions
L.Q.T.: Methodology, Validation, Formal analysis, Investigation, Data curation, Writing—original draft, Writing—review & editing, Visualization, Project administration. Y.T.: Methodology, Validation, Formal analysis, Investigation, Data curation. M.H.: Methodology, Validation, Formal analysis, Investigation, Data curation. S.O.: Conceptualization, Methodology, Validation, Investigation, Resources, Project administration, Funding acquisition. N.K.: Conceptualization, Methodology, Validation, Formal analysis, Investigation, Resources, Writing—review & editing, Supervision, Funding acquisition. All authors have read and agreed to the published version of the manuscript.
Funding
This research received no external funding.
Data Availability Statement
The dataset is available upon request from the authors.
Conflicts of Interest
The authors declare no conflict of interest.
References
- Yudamson, A.; Trung, L.Q.; Okazaki, S.; Khuong, N.D.; Kasai, N. High-Frequency Triboacoustic Emission Detection of Closed Cracks in Metallic Structures Using a Flexible Sagnac-Based Fiber Optic Sensor. Sens. Actuators A Phys. 2026, 397, 117244. [Google Scholar] [CrossRef] [Scilit]
- Khan, T.M.; Taha, R.; Zhang, T.; Ozevin, D. Multi-Frequency MEMS Acoustic Emission Sensor. Sens. Actuators A Phys. 2023, 362, 114648. [Google Scholar] [CrossRef] [Scilit]
- Wang, Y.; Yang, Z.; Yuan, Z.; Li, J.; Meng, F. Temperature Insensitive Acoustic Probe Based on Optical Fiber In-Line Silica Microbubble with Ultrathin Wall. Sens. Actuators A Phys. 2025, 382, 116163. [Google Scholar] [CrossRef] [Scilit]
- Madan, A.; Zhao, C.; Han, C.; Dong, Y.; Yang, Y. Monitoring Rail Track Bolt Loosening Using Fiber-Optic Distributed Acoustic Sensing. Sens. Actuators A Phys. 2025, 382, 116176. [Google Scholar] [CrossRef] [Scilit]
- Unterreitmeier, M.; Nagler, O.; Pfitzner, L.; Weigel, R.; Holmer, R. An Acoustic Emission Sensor System for Thin Layer Crack Detection. Microelectron. Reliab. 2018, 88–90, 16–21. [Google Scholar] [CrossRef] [Scilit]
- Quy, T.B.; Kim, J.-M. Crack Detection and Localization in a Fluid Pipeline Based on Acoustic Emission Signals. Mech. Syst. Signal Process. 2021, 150, 107254. [Google Scholar] [CrossRef] [Scilit]
- Holford, K.M.; Eaton, M.J.; Hensman, J.J.; Pullin, R.; Evans, S.L.; Dervilis, N.; Worden, K. A New Methodology for Automating Acoustic Emission Detection of Metallic Fatigue Fractures in Highly Demanding Aerospace Environments: An Overview. Prog. Aerosp. Sci. 2017, 90, 1–11. [Google Scholar] [CrossRef] [Scilit]
- Aggelis, D.G.; Kordatos, E.Z.; Matikas, T.E. Acoustic Emission for Fatigue Damage Characterization in Metal Plates. Mech. Res. Commun. 2011, 38, 106–110. [Google Scholar] [CrossRef] [Scilit]
- Song, Y.; Tang, Z.; Shi, R.; Wang, S.; Lin, D.; Luo, C. Design of PMN-PT-Based Dual-Resonance Acoustic Emission Sensor for Partial Discharge Detection. Sens. Actuators A Phys. 2024, 373, 115432. [Google Scholar] [CrossRef] [Scilit]
- Hekmati, A. Proposed Method of Partial Discharge Allocation with Acoustic Emission Sensors within Power Transformers. Appl. Acoust. 2015, 100, 26–33. [Google Scholar] [CrossRef] [Scilit]
- Han, C.; Liu, T.; Jin, Y.; Yang, G. Acoustic Emission Intelligent Identification for Initial Damage of the Engine Based on Single Sensor. Mech. Syst. Signal Process. 2022, 169, 108789. [Google Scholar] [CrossRef] [Scilit]
- Song, J.; Leng, J.; Li, J.; Wei, H.; Li, S.; Wang, F. Application of Acoustic Emission Technique in Landslide Monitoring and Early Warning: A Review. Appl. Sci. 2025, 15, 1663. [Google Scholar] [CrossRef] [Scilit]
- Kabir, M.; Kazari, H.; Ozevin, D. Piezoelectric MEMS Acoustic Emission Sensors. Sens. Actuators A Phys. 2018, 279, 53–64. [Google Scholar] [CrossRef] [Scilit]
- Masmoudi, S.; El Mahi, A.; Turki, S. Use of Piezoelectric as Acoustic Emission Sensor for in Situ Monitoring of Composite Structures. Compos. Part B Eng. 2015, 80, 307–320. [Google Scholar] [CrossRef] [Scilit]
- Bhuiyan, Y.; Lin, B.; Giurgiutiu, V. Characterization of Piezoelectric Wafer Active Sensor for Acoustic Emission Sensing. Ultrasonics 2019, 92, 35–49. [Google Scholar] [CrossRef] [Scilit]
- Innes, M.; Davis, C.; Rosalie, C.; Norman, P.; Rajic, N. Acoustic Emission Detection and Characterisation Using Networked FBG Sensors. Procedia Eng. 2017, 188, 440–447. [Google Scholar] [CrossRef] [Scilit]
- Zhang, H.; Liu, T.; Lu, J.; Lin, R.; Chen, C.; He, Z.; Cui, S.; Liu, Z.; Wang, X.; Liu, B.; et al. Static and Ultrasonic Structural Health Monitoring of Full-Size Aerospace Multi-Function Capsule Using FBG Strain Arrays and PSFBG Acoustic Emission Sensors. Opt. Fiber Technol. 2023, 78, 103316. [Google Scholar] [CrossRef] [Scilit]
- Yu, F.; Okabe, Y. Linear Damage Localization in CFRP Laminates Using One Single Fiber-Optic Bragg Grating Acoustic Emission Sensor. Compos. Struct. 2020, 238, 111992. [Google Scholar] [CrossRef] [Scilit]
- Zhang, H.; Wu, Q.; Xu, W.; Xiong, K. Damage Evaluation of Complex Composite Structures Using Acousto-Ultrasonic Detection Combined with Phase-Shifted Fiber Bragg Grating and Dual-Frequency Based Data Processing. Compos. Struct. 2022, 281, 115000. [Google Scholar] [CrossRef] [Scilit]
- Hao, C.; Li, D. Research on Electromagnetic Interference Resistance of Piezoelectric VibrationAcceleration Sensor. Ferroelectrics 2014, 466, 77–85. [Google Scholar] [CrossRef] [Scilit]
- Huang, A.-B.; Wang, C.-C.; Lee, J.-T.; Ho, Y.-T. Applications of FBG-Based Sensors to Ground Stability Monitoring. J. Rock Mech. Geotech. Eng. 2016, 8, 513–520. [Google Scholar] [CrossRef] [Scilit]
- Chen, C.; Wu, Q.; Xiong, K.; Zhai, H.; Yoshikawa, N.; Wang, R. Hybrid Temperature and Stress Monitoring of Woven Fabric Thermoplastic Composite Using Fiber Bragg Grating Based Sensing Technique. Sensors 2020, 20, 3081. [Google Scholar] [CrossRef] [Scilit]
- Yassin, M.H.; Farhat, M.H.; Soleimanpour, R.; Nahas, M. Fiber Bragg Grating (FBG)-Based Sensors: A Review of Technology and Recent Applications in Structural Health Monitoring (SHM) of Civil Engineering Structures. Discov. Civ. Eng. 2024, 1, 151. [Google Scholar] [CrossRef] [Scilit]
- Campanella, C.E.; Cuccovillo, A.; Campanella, C.; Yurt, A.; Passaro, V.M.N. Fibre Bragg Grating Based Strain Sensors: Review of Technology and Applications. Sensors 2018, 18, 3115. [Google Scholar] [CrossRef] [Scilit] [PubMed]
- Zhang, M.; Sun, Q.; Wang, Z.; Li, X.; Liu, H.; Liu, D. A Large Capacity Sensing Network with Identical Weak Fiber Bragg Gratings Multiplexing. Opt. Commun. 2012, 285, 3082–3087. [Google Scholar] [CrossRef] [Scilit]
- Han, Y.; Ou, Y.; Lv, H.; Xie, X.; Ma, X.; Wu, P.; Zhang, K.; He, C. A High-Sensitivity Multiplexing Scheme of FBG Sensors Based on Multi-Channel FSI-FCRD Technology. Sens. Actuators A Phys. 2025, 388, 116432. [Google Scholar] [CrossRef] [Scilit]
- Liu, B.; Lin, J.; Liu, H.; Jin, A.; Jin, P. Extrinsic Fabry-Perot Fiber Acoustic Pressure Sensor Based on Large-Area Silver Diaphragm. Microelectron. Eng. 2016, 166, 50–54. [Google Scholar] [CrossRef] [Scilit]
- Zhao, Y.; Chen, M.; Lv, R.; Xia, F. In-Fiber Rectangular Air Fabry-Perot Strain Sensor Based on High-Precision Fiber Cutting Platform. Opt. Commun. 2017, 384, 107–110. [Google Scholar] [CrossRef] [Scilit]
- Miao, S.; Gao, L.; Tong, F.; Zhong, Y. Research on High Precision Optical Fiber Acoustic Emission System for Weak Damage Location on Concrete. Constr. Build. Mater. 2022, 347, 128331. [Google Scholar] [CrossRef] [Scilit]
- Sun, J.; Yan, L.; Jiang, C.; Wang, Y.; Lu, Y.; Zhang, Y.; Wang, T.; Chen, P. Highly Sensitive Fabry-Perot Acoustic Sensor Based on Optic Fiber Spherical End Surface. Opt. Fiber Technol. 2023, 80, 103440. [Google Scholar] [CrossRef] [Scilit]
- Ni, C.; Zhao, M.; Wang, X.; Tan, Z. Research on the Application of Interferometric Optical Fiber Sensors in High-Pressure Gas Pipelines. Opt. Fiber Technol. 2024, 87, 103862. [Google Scholar] [CrossRef] [Scilit]
- Li, D.; Nie, J.-H.; Ren, W.-X.; Ng, W.-H.; Wang, G.-H.; Wang, Y. A Novel Acoustic Emission Source Location Method for Crack Monitoring of Orthotropic Steel Plates. Eng. Struct. 2022, 253, 113717. [Google Scholar] [CrossRef] [Scilit]

Disclaimer/Publisher’s Note: The statements, opinions and data contained in all publications are solely those of the individual author(s) and contributor(s) and not of MDPI and/or the editor(s). MDPI and/or the editor(s) disclaim responsibility for any injury to people or property resulting from any ideas, methods, instructions or products referred to in the content. |
© 2025 by the authors. Licensee MDPI, Basel, Switzerland. This article is an open access article distributed under the terms and conditions of the Creative Commons Attribution (CC BY) license.