


Abstract
Water-based drilling cuttings (WBDCs) are a large-volume solid waste generated during oil and gas drilling. Their weak cementation and loose particle structure limit their direct engineering utilization. In this study, a multi-source solid-waste binder mainly composed of ground granulated blast furnace slag (GGBS) and fly ash (FA) was used to stabilize WBDCs. Portland cement was used as an auxiliary binder, and sodium silicate was used as the alkaline activator. The effects of sodium silicate modulus, sodium silicate dosage, cement dosage, and GGBS-to-FA mass ratio on strength development were investigated. XRD, FTIR, TG, MIP, and SEM-EDS were further employed to clarify the stabilization mechanism. The results showed that binder composition strongly affected the strength level and strength development rate of stabilized WBDCs. At a total binder dosage of 15%, the mixture with a sodium silicate modulus of 1.4, a sodium silicate dosage of 4%, a cement dosage of 10%, and a GGBS-to-FA mass ratio of 6:1 exhibited the best mechanical performance. Its unconfined compressive strengths reached 6.87, 9.74, and 10.17 MPa at 7, 14, and 28 d, respectively. Microstructural analyses indicated that the strength development of stabilized WBDCs was mainly associated with the formation and continued development of poorly crystalline C-S-H/C-(A)-S-H-type gels and a small amount of AFt. From 7 to 28 d, the porosity and total pore volume decreased by 9.5% and 11.0%, respectively, while the average pore diameter decreased by 31.2%. This study provides a basis for the resource utilization of WBDCs and the design of low-cement binders containing multiple industrial solid wastes.
1. Introduction
Oil and gas drilling generates large amounts of drilling cuttings when the drill bit breaks the formation and the drilling fluid transports the rock fragments to the surface. When water-based drilling fluids are used, the separated solid residues are commonly referred to as water-based drilling cuttings (WBDCs) [1,2]. WBDCs mainly contain minerals derived from the geological formation. Their surfaces can also retain drilling fluid additives, soluble salts, and trace contaminants. Their composition therefore varies with the formation characteristics, drilling fluid formulation, and separation process. Previous studies have shown that shale gas drilling cuttings may contain heavy metals and other potentially harmful components. Improper disposal may therefore occupy land and create environmental risks during long-term storage or reuse [3,4].
Researchers have explored several routes for the resource utilization of WBDCs. These routes include cement clinker, non-autoclaved aerated concrete, cement mortar, concrete, ceramsite proppants, road cushion materials, and pavement base materials [5,6]. Wang et al. [7] used WBDCs together with fly ash and phosphogypsum to prepare non-autoclaved aerated concrete. Their results showed that a mixture containing 40% WBDCs could meet the corresponding strength and density requirements after curing. Wang et al. [8] replaced part of the cement in mortar with WBDCs. Their results showed that the mortar could still satisfy specified strength grades, although increasing the WBDC content increased porosity and reduced compressive strength. Yang et al. [9] also used WBDCs and bauxite to prepare low-density ceramsite proppants, which provided another route for high-value utilization of this waste.
Road engineering provides another potential outlet for large-volume WBDC utilization. Li et al. [10] investigated the co-processing of WBDCs and phosphogypsum in a road cushion layer. Wang et al. [11] later designed a road cushion containing 6% cement, 50% WBDCs, and 44% crushed stone. The 7 d unconfined compressive strength met the cited Chinese road base requirements, and the main pollutant concentrations in the leachate met the relevant standards. More recently, Tan et al. [12] used a composite stabilizer containing cement, a liquid stabilizer, and water-reducing powder to treat WBDCs for pavement base applications. The stabilized material reached a maximum 7 d unconfined compressive strength of 3.38 MPa at a stabilizer dosage of 9%. Their microstructural results linked the strength development to the formation of C-S-H gel and AFt. These studies confirm that WBDCs can be converted into usable construction materials after suitable treatment. However, many reported routes still rely on Portland cement, thermal processing, or specially formulated stabilizers to obtain the required engineering performance [13,14].
Alkali-activated industrial by-products provide another option for reducing the dependence on conventional cementitious materials [15,16]. Fly ash (FA) and ground granulated blast furnace slag (GGBS) are widely used precursors in alkali-activated binders [17]. Their chemical roles are different. GGBS normally supplies more reactive calcium, while low-calcium fly ash mainly contributes Si- and Al-bearing components. The alkaline environment promotes the dissolution of reactive species and the subsequent formation of binding products. These products can connect particles and reduce the accessible pore space [18]. Ravikumar et al. [19] showed that alkali-activated fly ash and GGBS developed different reaction products and pore structures. Their study also showed that the activator concentration strongly affected mechanical performance.
The composition of the alkaline activator is also important. Lv et al. [20] reported that sodium silicate modulus and dosage affected the reaction process, strength, and microstructure of fly-ash-based geopolymer materials. John and Thomas showed [21] that a fly ash–GGBS binder could be activated with sodium silicate under ambient curing conditions after the mixture parameters were optimized. Tian et al. [22] further showed that silicate modulus and silicate dosage changed the compressive strength, setting behavior, shrinkage, and microstructure of alkali-activated fly ash/slag pastes. These findings indicate that the effect of sodium silicate cannot be described simply by its dosage. The modulus, precursor composition, calcium availability, and soluble silicate content need to be considered together.
Recent studies have started to apply alkali activation directly to the stabilization of drilling cuttings. Qi et al. [23] used oilfield drilling cuttings and coal-fired furnace ash as the main raw materials. They compared NaOH, sodium silicate, and Ca(OH)2 as activators. Their optimized NaOH-activated system reached a 28 d compressive strength of 4.81 MPa. Their XRD and microscopic analyses identified C-(N)-A-S-H- and C-S-H-type binding products. This study shows that alkali-activated solid wastes can be used to stabilize drilling cuttings. However, this system differs from a GGBS–FA-based binder. The existing studies identified in the present literature search also devote less attention to the combined effects of sodium silicate modulus, sodium silicate dosage, cement dosage, and GGBS-to-FA ratio on WBDC stabilization. These parameters can jointly affect alkalinity, soluble silicate availability, calcium supply, and precursor reactivity.
In this study, WBDCs were stabilized using a multicomponent solid-waste-based binder comprising GGBS and FA as the primary solid-waste-derived precursors, Portland cement as an auxiliary binder, and sodium silicate as the alkaline activator. Unconfined compressive strength tests were conducted to evaluate the effects of different mixture parameters on the strength development of stabilized WBDCs. XRD, FTIR, TG, MIP, and SEM-EDS were further employed to characterize the reaction products and microstructural evolution and to clarify the stabilization mechanism. This study aims to establish the relationship between binder composition, reaction-product development, and macroscopic strength, providing a basis for the engineering reuse of WBDCs and the resource utilization of multiple industrial solid wastes.
2. Experimental and Methods
2.1. Materials
2.1.1. Water-Based Drilling Cuttings (WBDCs)
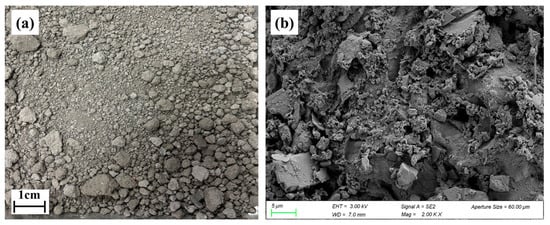
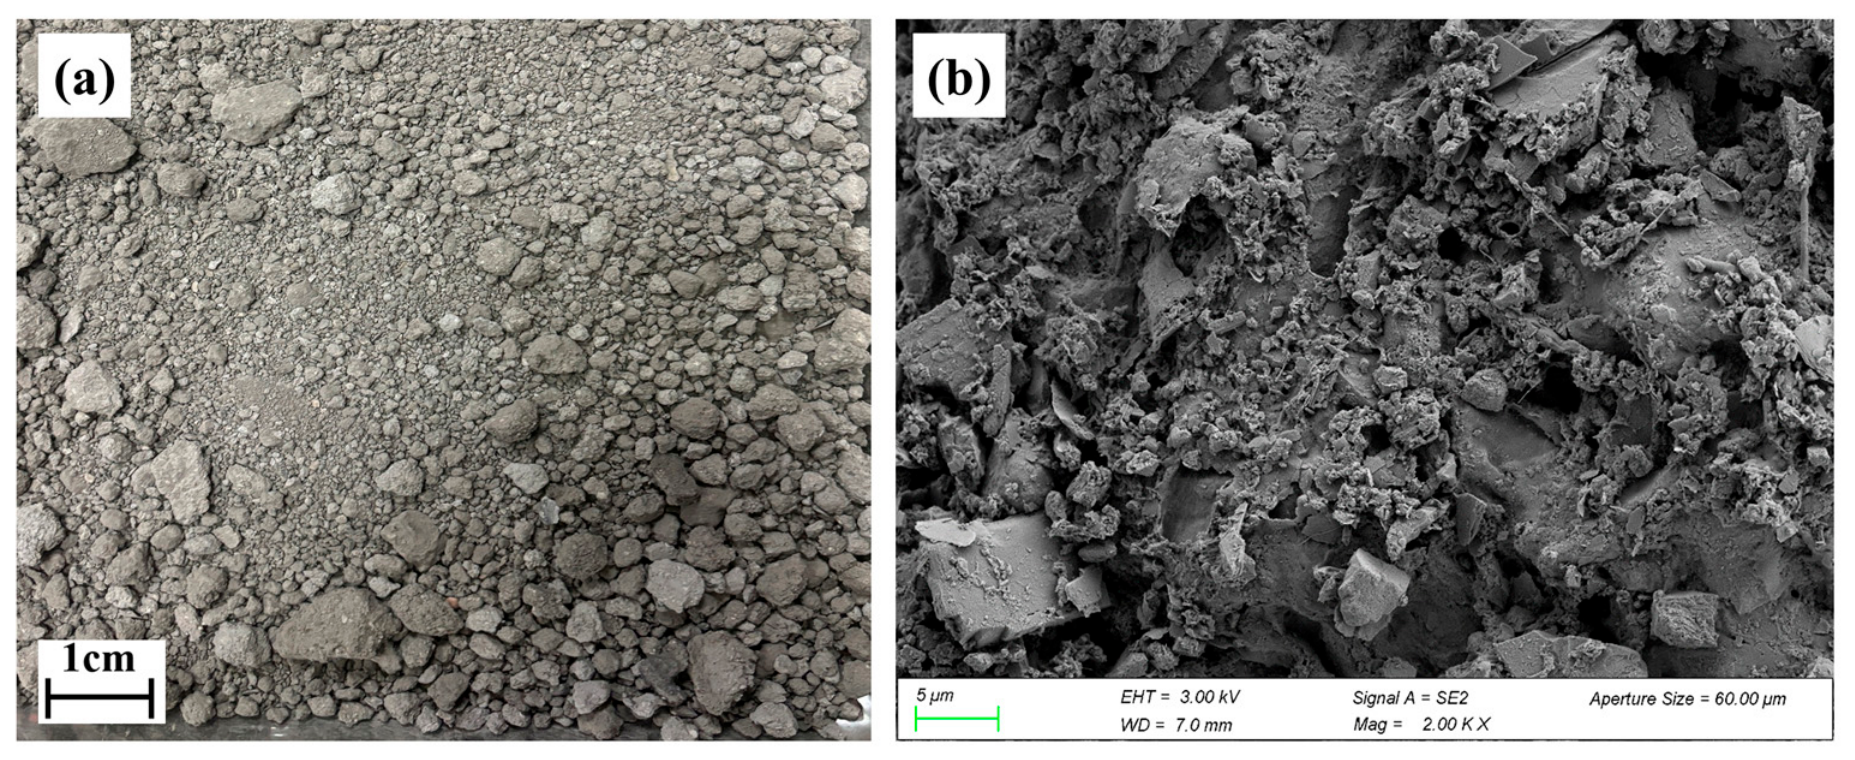
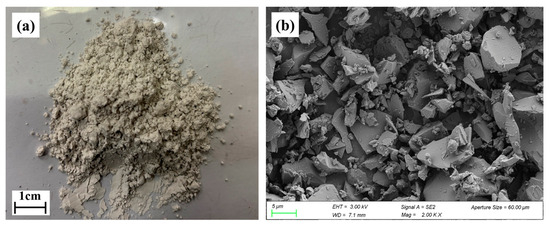
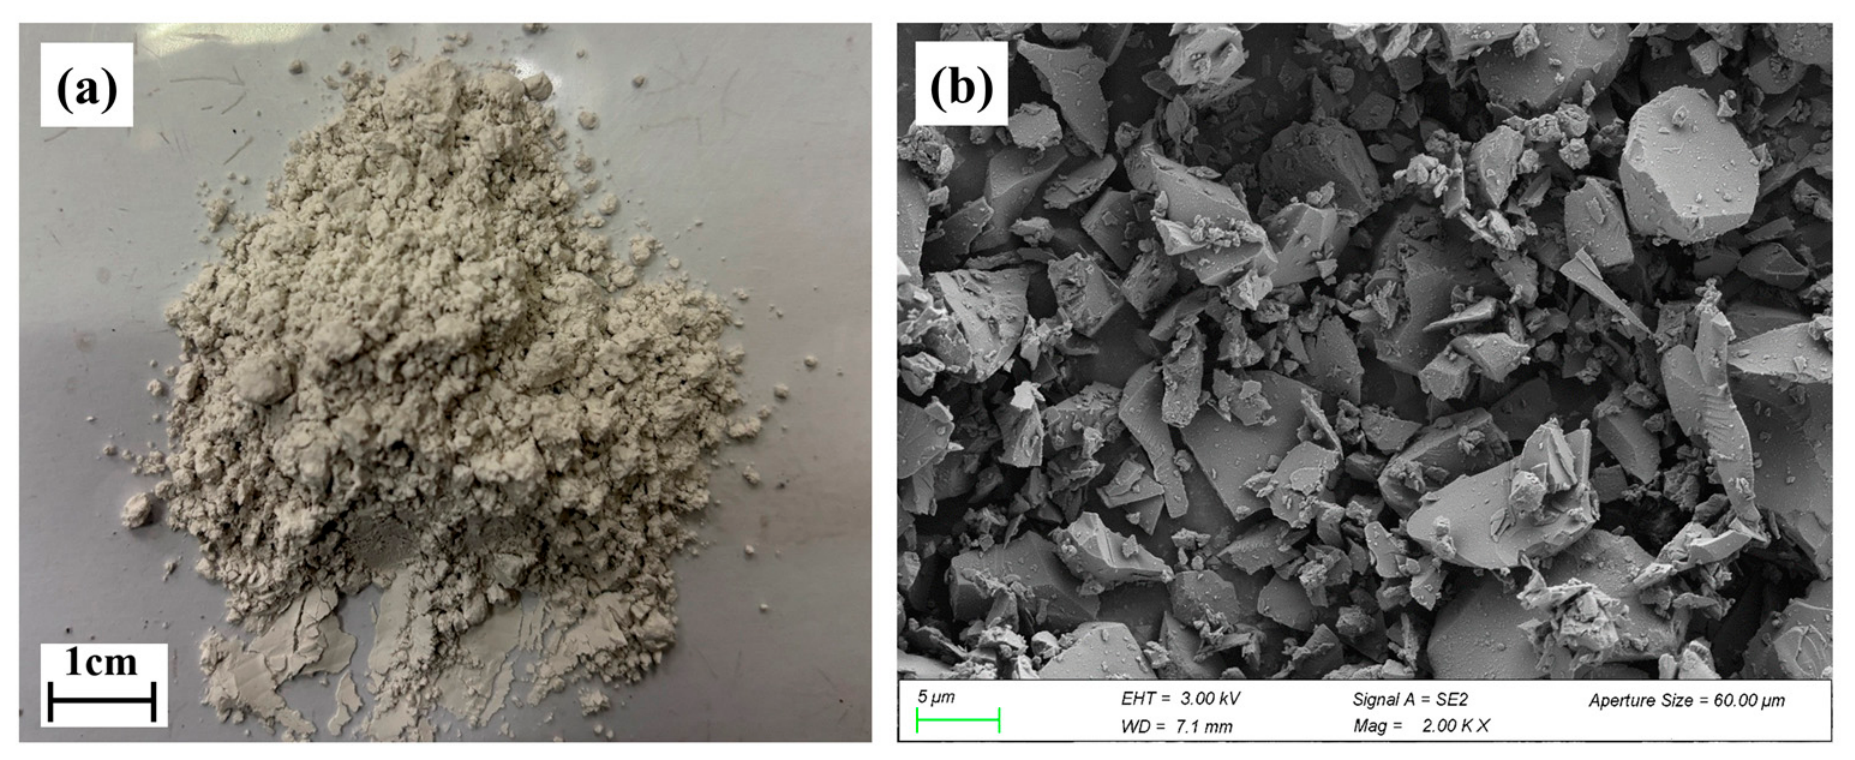
The water-based drilling cuttings (WBDCs) used in this study were obtained from a shale gas drilling site operated by Sichuan Kehong Natural Gas Co., Ltd., Chengdu, China. The WBDCs were separated from the circulating drilling fluid through on-site vibrating screening and subsequent mechanical filter pressing. The resulting mechanically dewatered solid residue, with an initial water content of 25.0%, was sealed and transported to the laboratory. Therefore, the material investigated in this study represented the solid phase recovered from the drilling waste stream rather than an untreated drilling fluid sample. Before testing, the samples were dried, gently disaggregated, and sieved. Figure 1a presents a macroscopic photograph of the as-received WBDCs after mechanical dewatering, captured using a smartphone camera; whereas Figure 1b presents the SEM (Sigma 300, ZEISS, Oberkochen, Germany) morphology of the dried and disaggregated WBDC particles.
Figure 1.
Appearance and microscopic morphology of WBDCs: (a) digital photograph of the as-received WBDCs after mechanical dewatering; (b) SEM image of the dried and disaggregated WBDC particles.
The WBDCs were grey and exhibited irregular particles and local agglomeration after drying and disaggregation. SEM observations showed that the particles were predominantly angular and plate-like, with rough surfaces and abundant interparticle voids, resulting in a relatively loose microstructure. The initial water content of WBDCs was determined using the oven-drying method (T 0103-2019) [24]. The liquid limit and plastic limit were determined using the combined liquid and plastic limit test (T 0118-2007) [25], and the plasticity index was calculated as the difference between the liquid limit and plastic limit. The optimum moisture content and maximum dry density were determined using the compaction test (T 0131-2019) [26]. All tests were conducted in accordance with the Test Methods of Soils for Highway Engineering (JTG 3430-2020) [27]. The results are summarized in Table 1.
Table 1.
Basic physical properties of WBDCs.
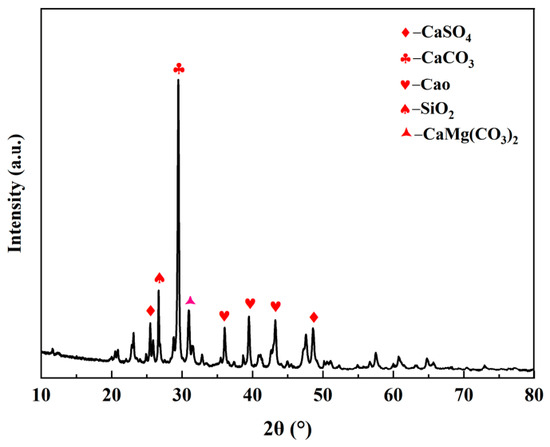
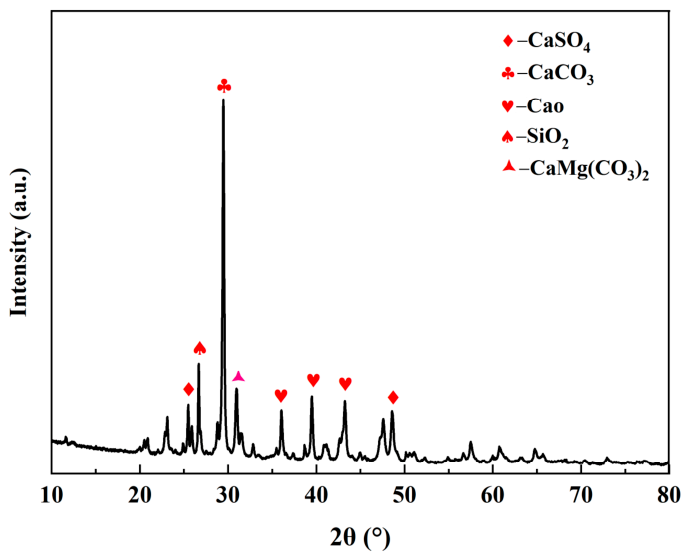
The XRD pattern of the WBDCs is shown in Figure 2. Representative high-intensity diffraction peaks of the identified crystalline phases are labeled in the figure. The main crystalline phases are calcite, dolomite, and quartz, together with a small amount of anhydrite, indicating that the WBDCs are dominated by carbonate minerals. The chemical composition determined by XRF is listed in Table 2. Expressed as oxide equivalents, CaO was the dominant component at 46.87 wt.%, followed by SO3 and BaO at 9.99 wt.% and 7.96 wt.%, respectively. Al2O3, Fe2O3, MgO, Na2O, K2O, and Cl were also detected. Combined with the XRD results, the WBDCs exhibited a Ca-rich and carbonate-dominated mineral composition.
Figure 2.
XRD pattern of WBDCs.
Table 2.
Major chemical components of WBDCs and binder constituents (wt.%).
2.1.2. Blast Furnace Slag and Fly Ash
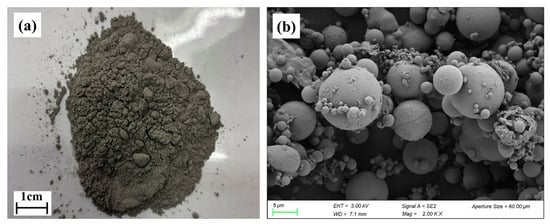
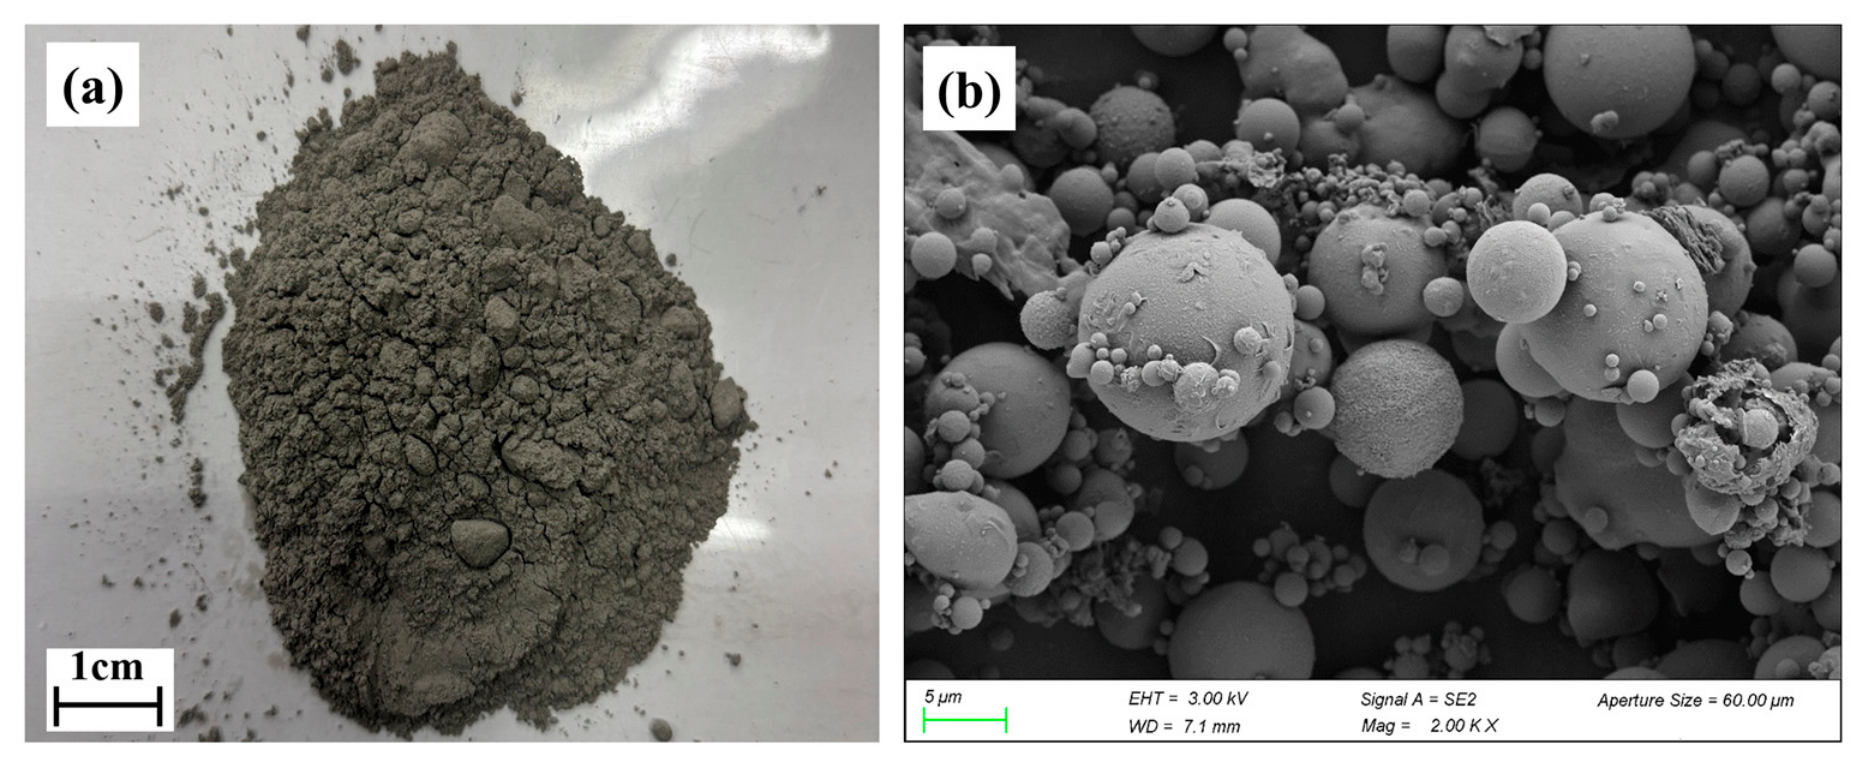
S95-grade ground granulated blast furnace slag (GGBS; Nantong Conch Concrete Co., Ltd., Nantong, China) and fly ash (FA; Guangdong Sanchuang Building Materials Trading Co., Ltd., Dongguan, China) were used as the main solid-waste-derived binder constituents. Their macroscopic appearances and SEM morphologies are shown in Figure 3 and Figure 4, respectively. GGBS was a light-grey powder consisting mainly of irregular angular particles with relatively smooth fracture surfaces. In contrast, FA was a grey fine powder composed predominantly of spherical or near-spherical particles, together with a small proportion of irregular particles and agglomerates.
Figure 3.
Appearance and microscopic morphology of GGBS: (a) digital photograph; (b) SEM image.
Figure 4.
Appearance and microscopic morphology of FA: (a) digital photograph; (b) SEM image.
The chemical compositions of GGBS and FA are presented in Table 2. GGBS mainly contained CaO, SiO2, and Al2O3, with contents of 34.10, 34.10, and 17.61 wt.%, respectively. FA was mainly composed of SiO2 and Al2O3, with contents of 43.00 and 24.00 wt.%, respectively, while its CaO content was only 0.80 wt.%. Thus, GGBS exhibited a Ca-Si-Al-rich composition, whereas FA was predominantly composed of Si- and Al-bearing components.
2.1.3. Cement and Alkaline Activator
P.O. 42.5 ordinary Portland cement manufactured by Anhui Conch Cement Company Limited, Wuhu, China, was used as the auxiliary binder. Its chemical composition is listed in Table 2. The main oxide components were CaO, SiO2, and Al2O3, with contents of 51.42, 24.99, and 8.26 wt.%, respectively.
Liquid sodium silicate was used as the alkaline activator, and its basic properties are listed in Table 3. The Na2O and SiO2 contents were 8.15 and 26.00 wt.%, respectively, and the initial modulus was 3.29. Analytical-grade NaOH with a purity of ≥98% was used to adjust the sodium silicate modulus. The modulus of sodium silicate was defined as the molar ratio of SiO2 to Na2O.
Table 3.
Basic physical properties of alkaline activator.
2.2. Mix Proportion Design
Based on the mixture design results reported in our previous study [28], ten representative mixtures, designated M1–M10, were selected to investigate the strength development and microstructural evolution of stabilized WBDCs. The total binder dosage was fixed at 15% of the total dry mixture mass, with dry WBDCs accounting for the remaining 85%. The sodium silicate and cement dosages were expressed as percentages of the total binder mass. After deducting the sodium silicate and cement contents, the remaining binder fraction consisted of GGBS and FA at the specified mass ratio. The sodium silicate modulus ranged from 1.2 to 1.4, the sodium silicate dosage from 4% to 8%, the cement dosage from 7% to 13%, and the GGBS-to-FA mass ratio from 4:1 to 6:1. The detailed mix proportions are listed in Table 4.
Table 4.
Mix proportions and compaction characteristics of stabilized WBDCs.
2.3. Specimen Preparation and Testing Methods
2.3.1. Specimen Preparation
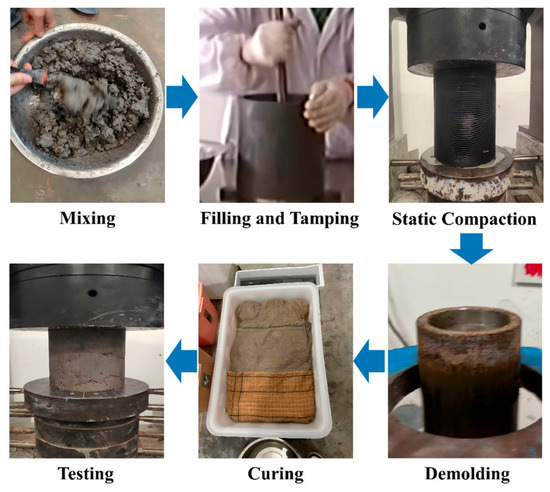
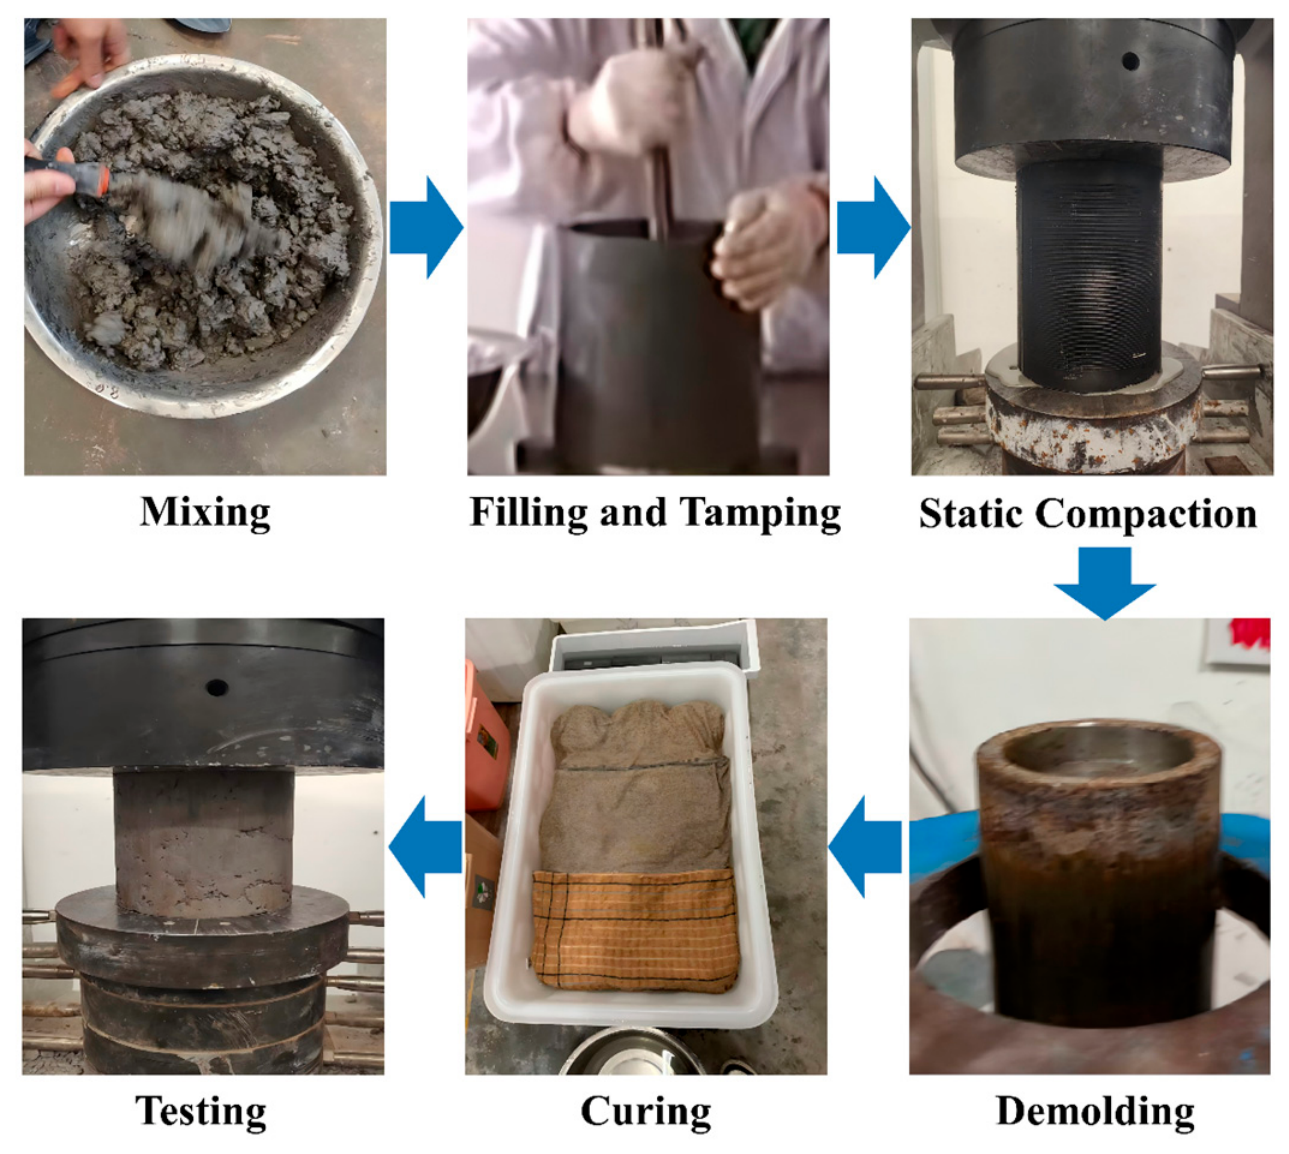
Cylindrical specimens with a diameter of 100 mm and a height of 100 mm were prepared by static compaction. Before specimen preparation, compaction tests were conducted separately for each mixture to determine its optimum moisture content and maximum dry density, as listed in Table 4. The dried WBDCs were first gently disaggregated, and the required amounts of WBDCs and binder constituents were weighed according to the mixture proportions listed in Table 4. Each mixture was prepared using its corresponding optimum moisture content and thoroughly mixed until uniform. The required mass of the fresh mixture was then placed into the cylindrical mold and statically compacted to a target degree of compaction of 96%, based on the corresponding maximum dry density of each mixture. The compacted specimen was maintained under load for 2 min. After 24 h, the specimen was demolded and cured at a temperature of 20 ± 2 °C and a relative humidity of 95% until the specified testing age. A schematic diagram of the specimen preparation and testing procedure is presented in Figure 5.
Figure 5.
Schematic diagram of the molding and testing process for stabilized WBDC specimens.
2.3.2. Unconfined Compressive Strength Test
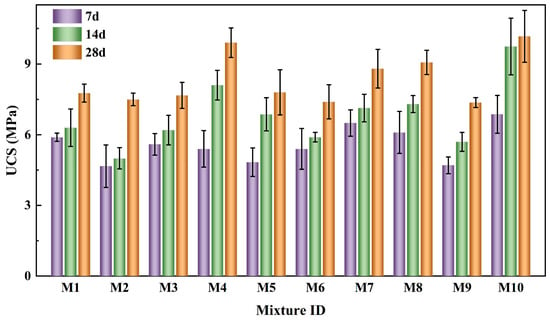
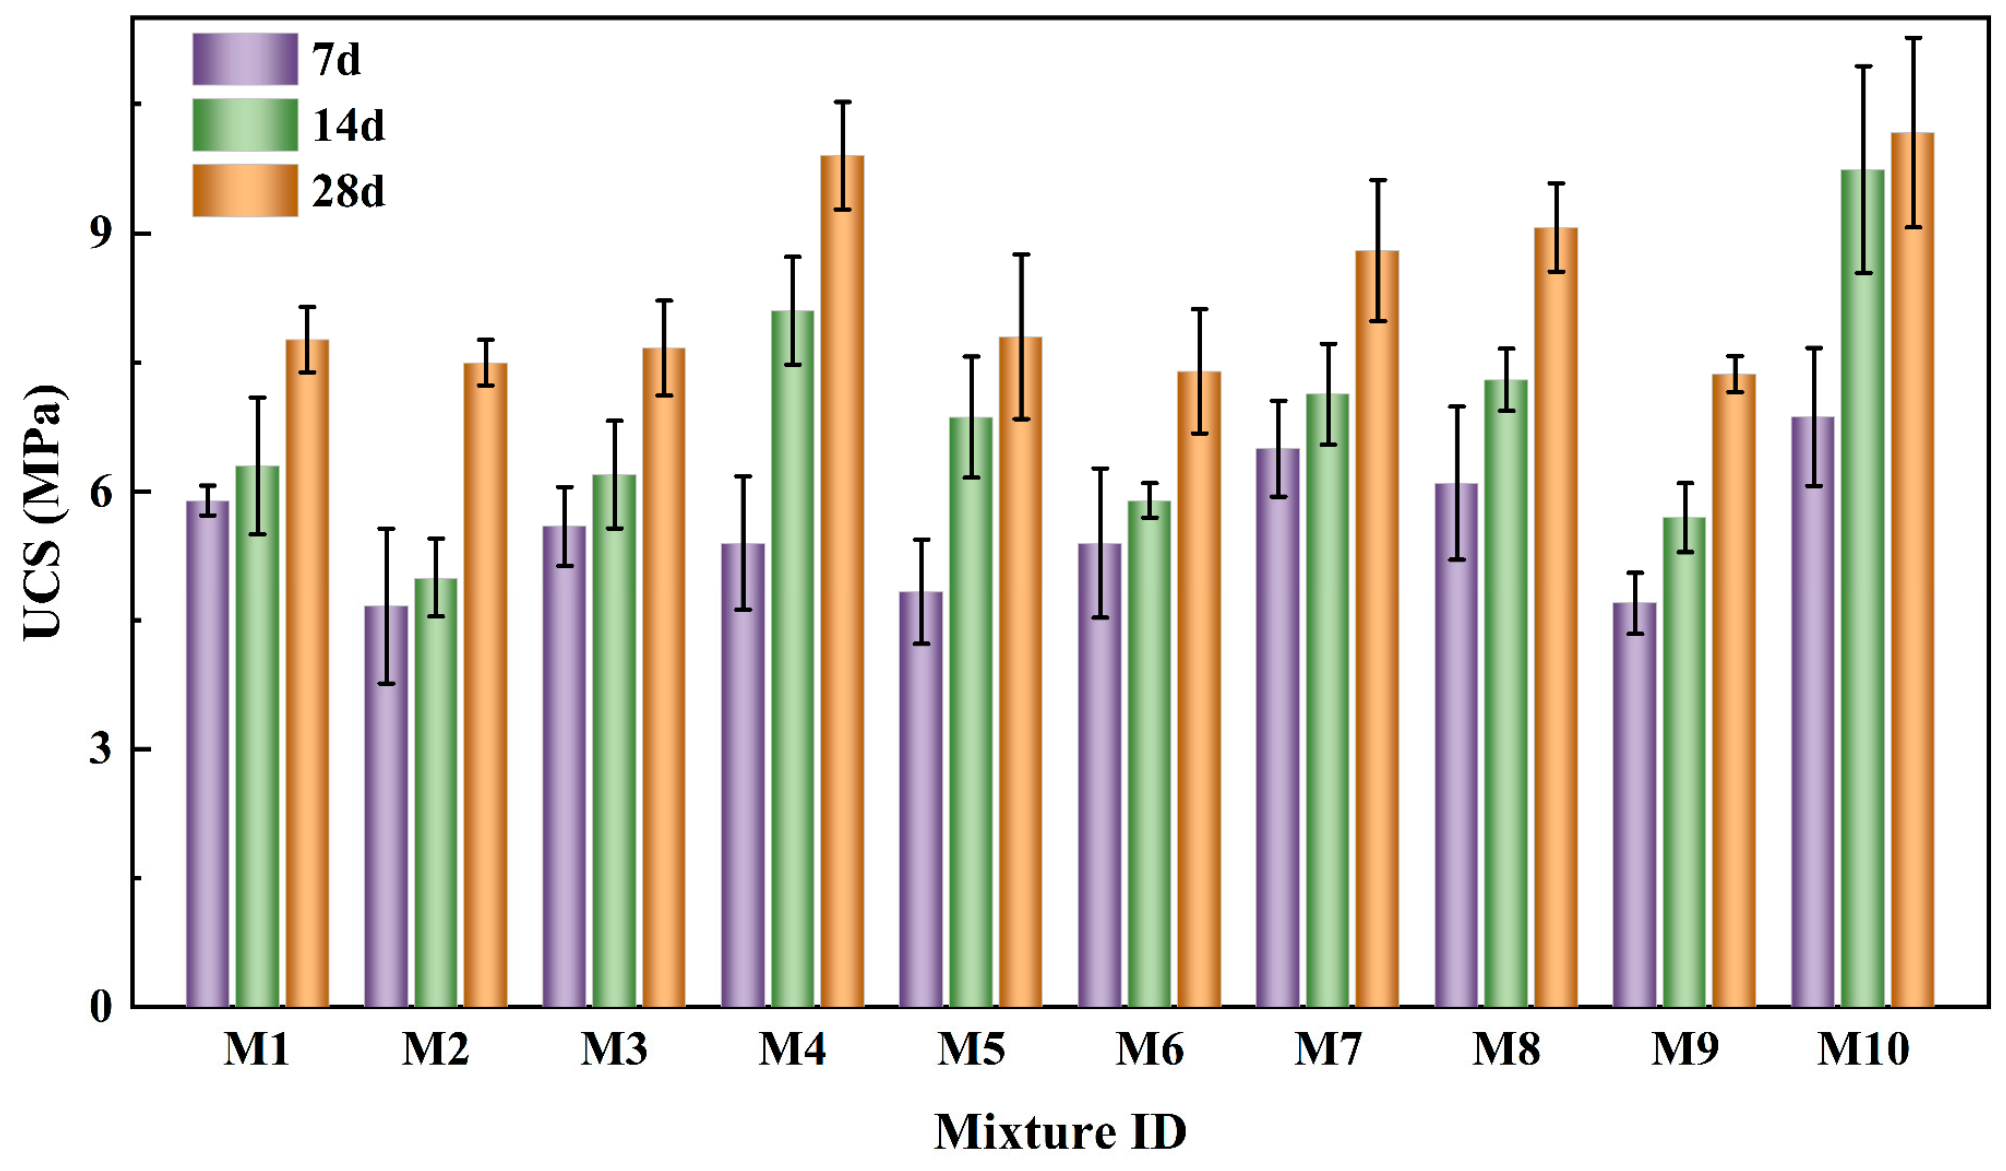
The unconfined compressive strength (UCS) was determined in accordance with JTG 3441-2024 [29] using an electronic universal testing machine. UCS tests were conducted after curing for 7, 14, and 28 d. For each mixture, 3 parallel specimens were tested at each curing age. The UCS results are reported as the arithmetic mean ± standard deviation, and the error bars in Figure 6 represent one standard deviation. The specimens were loaded continuously at a displacement rate of 1 mm/min until failure, and the maximum load was recorded. The UCS was calculated as Equation (1).
where is the unconfined compressive strength (MPa), P is the maximum load at failure (N), and A is the cross-sectional area of the specimen (mm2).
2.3.3. Microstructural Characterization
XRD patterns (D8 Advance, Bruker, Karlsruhe, Germany) were collected using an X-ray diffractometer with Cu Kα radiation (λ = 1.5406 Å). Prior to testing, the samples were ground to pass a 200-mesh sieve. The tube voltage and current were 40 kV and 30 mA, respectively. The diffraction patterns were recorded over a 2θ range of 10–80° at a scanning rate of 2°/min with a step size of 0.02°.
TG measurements (STA 449 F5 Jupiter, Netzsch, Selb, Germany) were performed on approximately 10 mg of powdered sample placed in an alumina crucible. The samples were heated from room temperature to 800 °C at a rate of 10 °C/min under a high-purity N2 atmosphere with a gas flow rate of 50 mL/min.
FTIR spectra (Nicolet iS20, Thermo Fisher Scientific, Waltham, MA, USA) were recorded using the KBr pellet method. The samples and spectroscopic-grade KBr were dried at 105 °C for 2 h and subsequently mixed at a mass ratio of 1:100. The spectra were collected over the wavenumber range of 4000–400 cm−1 at a resolution of 4 cm−1 with 16 scans.
SEM-EDS observations (GeminiSEM 300, ZEISS, Oberkochen, Germany) were performed on approximately 5 × 5 × 5 mm3 fragments. The samples were mounted on conductive carbon tape and sputter-coated with gold prior to testing. SEM images were acquired at an accelerating voltage of 5–15 kV, a working distance of 8–10 mm, and magnifications ranging from 1000× to 10,000×. EDS analysis was performed simultaneously to determine the elemental composition of selected micro-areas, including C, O, Si, Al, Ca, Na, Mg, and S.
MIP measurements (AutoPore IV 9510, Micromeritics, Norcross, GA, USA) were conducted on approximately 5 × 5 × 5 mm3 specimens. The samples were dried at 60 °C for 48 h to constant mass and cooled to room temperature in a desiccator before testing. The low-pressure range was 3.45–310 kPa and the maximum intrusion pressure was approximately 423 MPa, corresponding to a pore size measurement range of approximately 0.003–450 μm. The pore size distribution, total pore volume, porosity, and characteristic pore size parameters were obtained from the intrusion data.
3. Results and Discussion
3.1. Unconfined Compressive Strength Analysis
The development of UCS in stabilized WBDCs with different binder compositions is shown in Figure 6. UCS generally increased with curing age in all mixtures, although the magnitude and rate of strength gain varied considerably among the binder formulations. UCS ranged from 4.67 to 6.87 MPa at 7 d, from 5.00 to 9.74 MPa at 14 d, and from 7.37 to 10.17 MPa at 28 d. These progressively wider strength ranges indicate that binder composition affected both early-age strength and subsequent strength development.
Figure 6.
Unconfined compressive strength of stabilized WBDCs at different curing ages.
The mixtures exhibited distinct age-dependent strength development patterns. M7 achieved a relatively high 7 d UCS of 6.50 MPa but increased to only 8.80 MPa at 28 d, corresponding to a 35.4% gain. By contrast, the UCS of M4 increased from 5.40 MPa at 7 d to 8.10 MPa at 14 d and 9.90 MPa at 28 d, representing an overall increase of 83.3%. Thus, a high early-age UCS did not necessarily correspond to a high rate of subsequent strength development. Binder composition influenced not only the strength level but also the rate at which the cemented structure developed during curing. Among the ten mixtures, M10 exhibited the highest mean UCS at all three curing ages, reaching 6.87 ± 0.80, 9.74 ± 1.20, and 10.17 ± 1.10 MPa at 7, 14, and 28 d, respectively. Its UCS increased by 41.8% from 7 to 14 d but by only 4.4% from 14 to 28 d. Consequently, 95.8% of its 28 d strength had already developed by 14 d. This rapid early-to-intermediate strength development may reflect the combined contributions of cement hydration and alkali activation of GGBS and FA, which progressively enhanced interparticle bonding during curing, Therefore, M10 was selected as the best-performing formulation within the investigated mixture range for further microstructural characterization [30].
The combined compositional effect is further illustrated by comparing M9 and M10. Both mixtures had a sodium silicate modulus of 1.4 and a cement dosage of 10%. M9 contained 8% sodium silicate and had a GGBS-to-FA mass ratio of 4:1, whereas M10 contained 4% sodium silicate and had a GGBS-to-FA mass ratio of 6:1. At 7, 14, and 28 d, M9 exhibited UCS values of 4.70 ± 0.36, 5.70 ± 0.40, and 7.37 ± 0.21 MPa, respectively, whereas the corresponding values of M10 were 6.87 ± 0.80, 9.74 ± 1.20, and 10.17 ± 1.10 MPa. Thus, the UCS values of M10 were 46.2%, 70.9%, and 38.1% higher than those of M9 at the three curing ages, respectively. Excessive activator addition may have increased solution viscosity and altered the balance between alkalinity and soluble silicate availability. In contrast, the higher GGBS proportion may have increased the availability of reactive Ca, Si, and Al species. The mechanical performance of stabilized WBDCs was therefore governed by the combined effects of activator dosage and precursor composition rather than by either parameter independently.
3.2. XRD Analysis
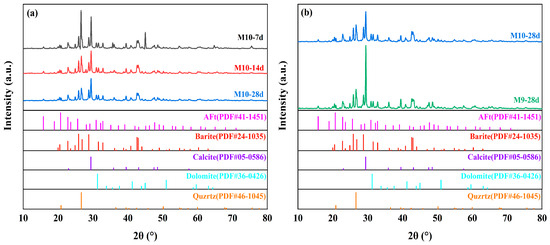
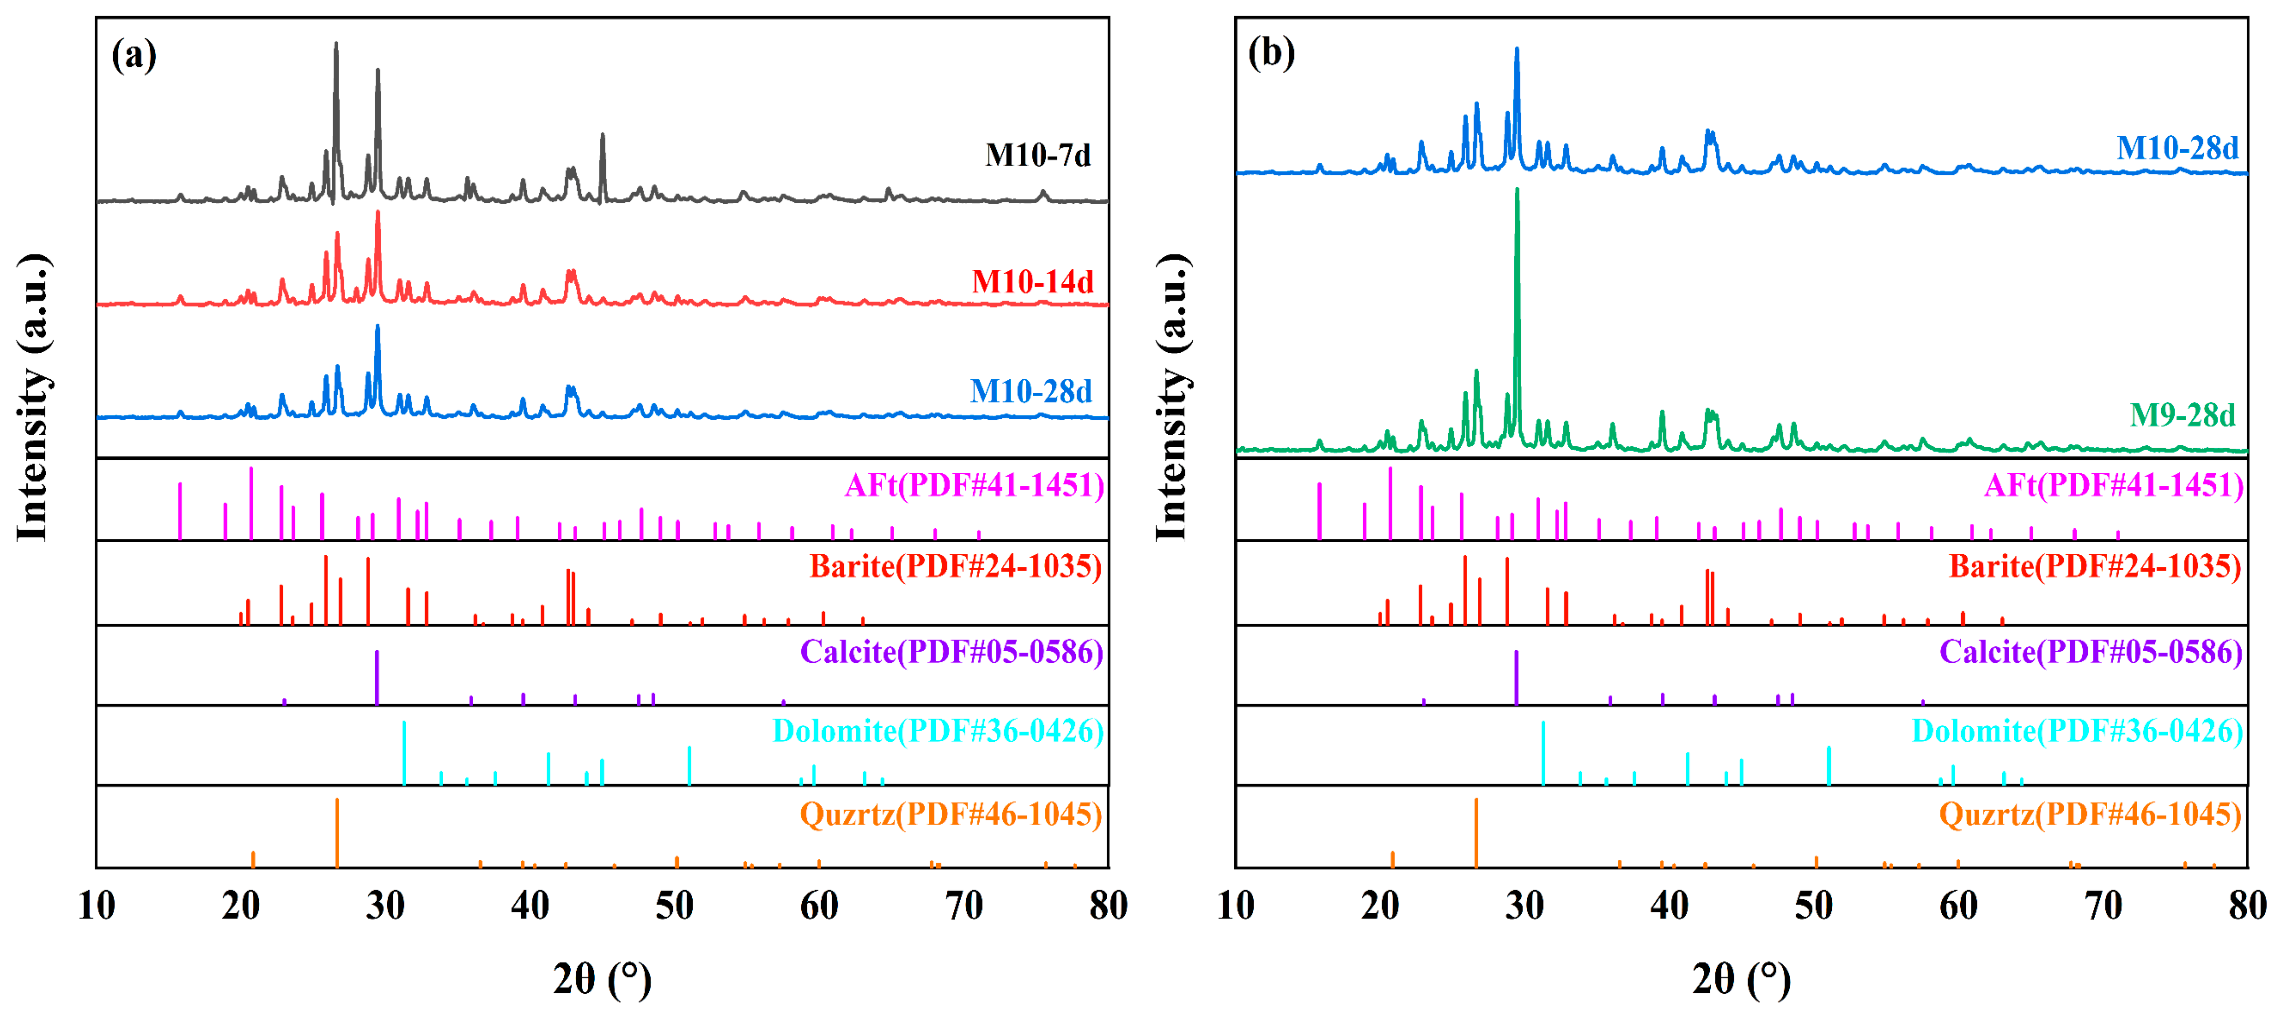
Figure 7 shows the XRD patterns of the stabilized WBDCs together with the corresponding reference patterns. The main crystalline phases were identified as barite, calcite, quartz and dolomite, which were mainly inherited from the original WBDCs. A weak diffraction signal tentatively assigned to an AFt-type phase was observed at approximately 15.8°, suggesting the possible formation of sulfate-bearing hydration products during stabilization. The persistence of the intense barite, calcite and quartz reflections after curing suggests that these crystalline minerals remained as the main mineral skeleton of the stabilized WBDCs.
Figure 7.
XRD patterns of stabilized WBDCs and corresponding reference patterns: (a) M10 cured for 7, 14, and 28 d; (b) M10 and M9 cured for 28 d.
As shown in Figure 7a, the XRD patterns of M10 at 7, 14 and 28 d were generally similar, and no new major crystalline phase appeared with increasing curing age. However, the relative intensities of the crystalline reflections changed during curing. In particular, the calcite-related peaks became less pronounced from 7 to 14 d, while the subsequent variation from 14 to 28 d was relatively limited. A similar trend was observed in the UCS results, where the strength of M10 increased rapidly from 6.87 MPa at 7 d to 9.74 MPa at 14 d but only increased to 10.17 MPa at 28 d. Together with the UCS results, these observations are consistent with more pronounced reaction and structural development of M10 during the first 14 d. The absence of additional strong crystalline reflections indicates that the strength increase was not dominated by the formation of new crystalline phases. Instead, it was likely associated with the continued formation of poorly crystalline C-(A)-S-H-type gels, which generally cannot be clearly distinguished by XRD because of their amorphous or low-crystalline nature. This behavior is commonly reported for alkali-activated slag-containing binders [31].
Figure 7b compares the XRD patterns of M9 and M10 at 28 d. The two mixtures contained essentially the same crystalline phases, whereas clear differences were observed in their relative peak intensities. The calcite reflections, particularly the main peak at approximately 29.4°, were more pronounced in M9 than in M10. Similar differences were also observed for several secondary calcite reflections, suggesting a higher relative contribution of the crystalline carbonate phase in M9. In contrast, the AFt-related diffraction signals of M9 and M10 were comparable. Therefore, the higher 28 d UCS of M10 cannot be simply attributed to the formation of a larger amount of crystalline AFt.
The generally similar phase assemblages of M9 and M10 suggest that their strength difference was not associated with the formation of fundamentally different crystalline products. However, because M9 and M10 differed simultaneously in sodium silicate dosage and GGBS-to-FA mass ratio, the contribution of either parameter cannot be distinguished from the XRD comparison. The observed diffraction differences should therefore be interpreted as being associated with the combined variation in activator dosage and precursor composition. Moreover, because no quantitative phase analysis was performed, the relative diffraction intensities cannot be used to quantify the contents of crystalline or poorly crystalline reaction products [32].
3.3. FTIR Analysis
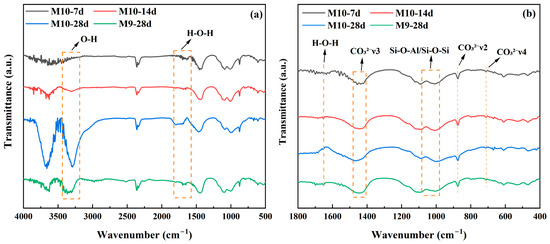
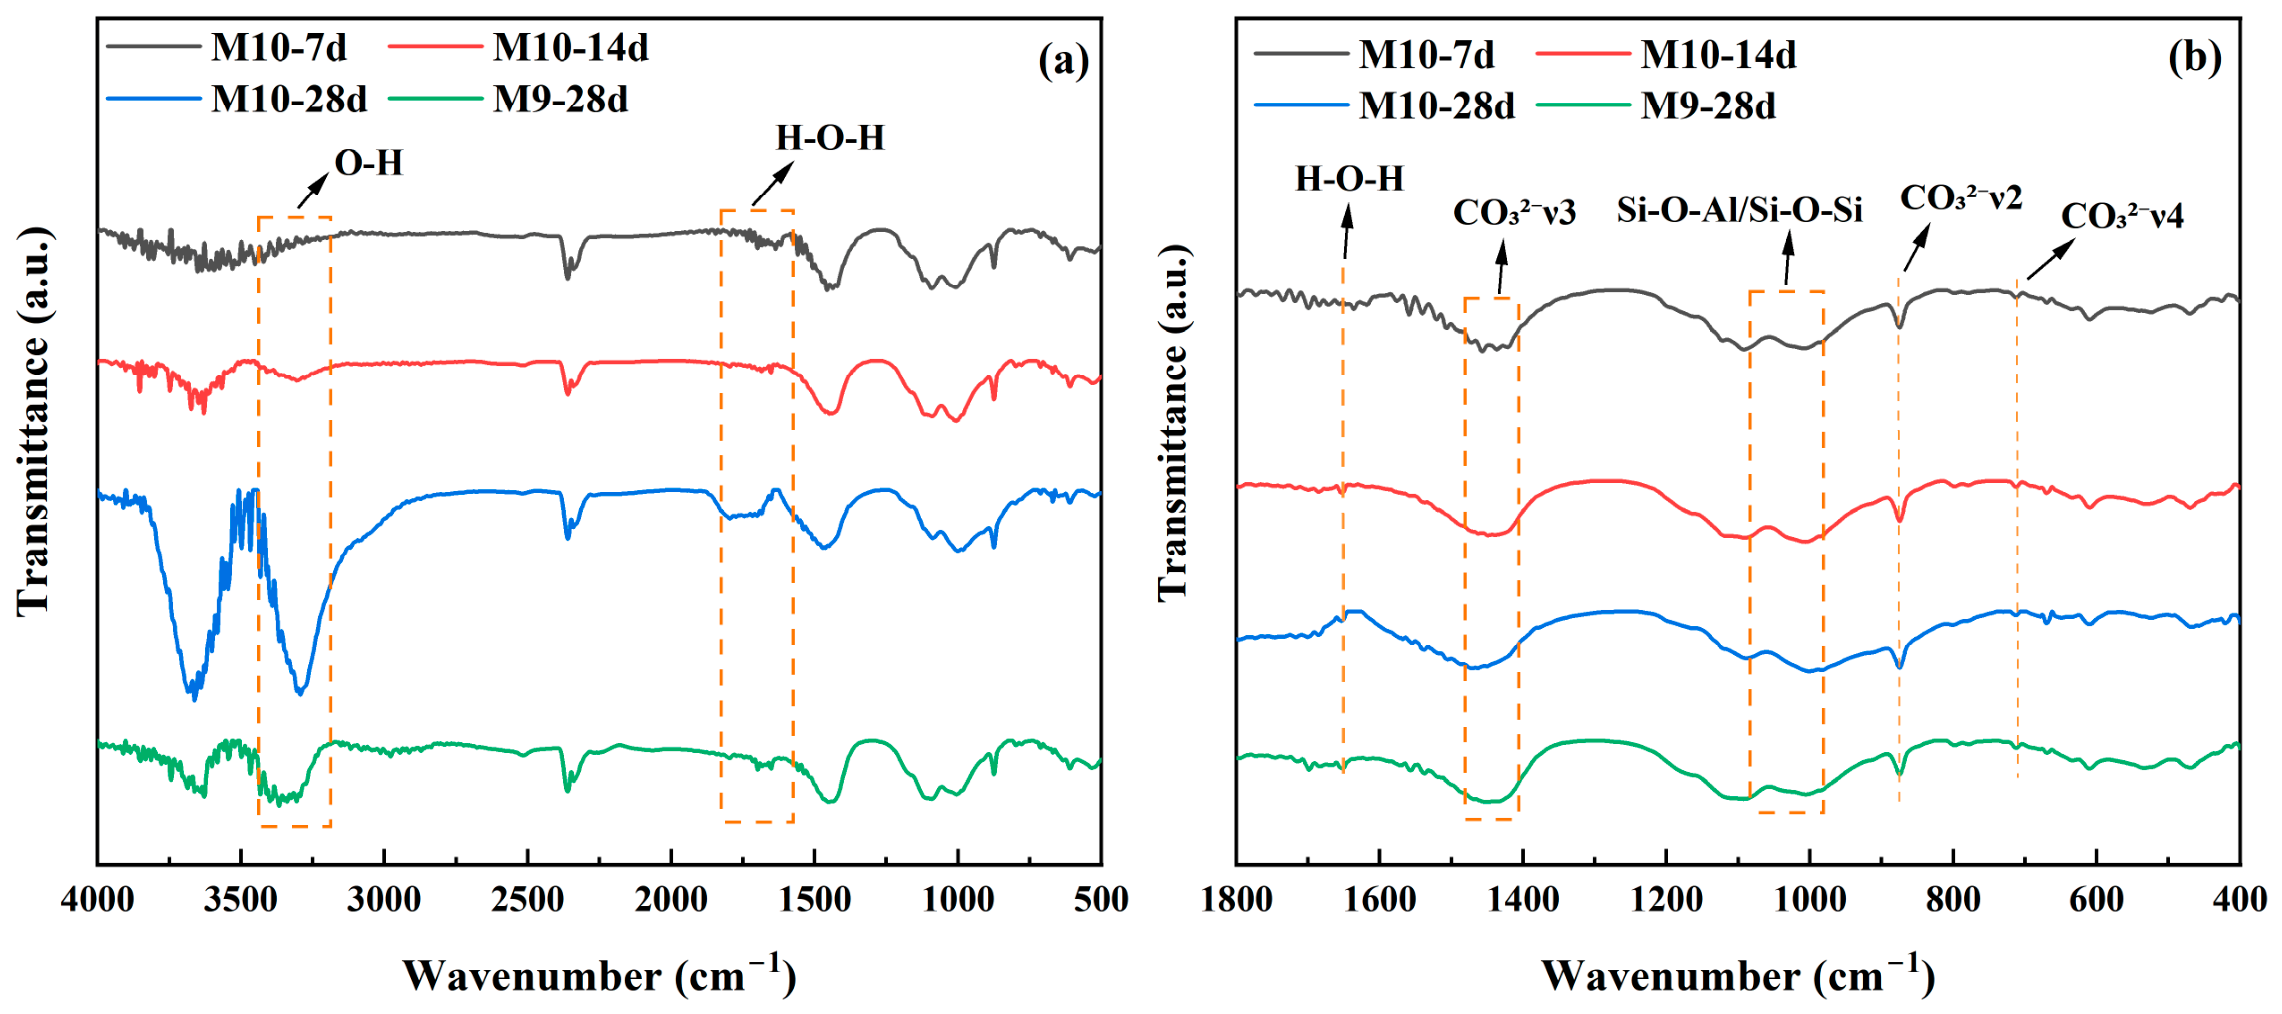
Figure 8 shows the FTIR spectra of M10 at different curing ages and M9 at 28 d. As shown in Figure 8, The spectra exhibited similar characteristic absorption bands, indicating that the main reaction products were generally comparable among the different samples. The broad band at approximately 3400 cm−1 was attributed to O-H stretching vibrations associated with adsorbed water, bound water and hydroxyl groups in hydration products, while the band near 1630 cm−1 corresponded to H-O-H bending vibrations. A broad absorption band was observed in the range of 1000–1100 cm−1, which was mainly associated with the stretching vibrations of Si-O-Si and Si-O-Al bonds in C-S-H, C-A-S-H and aluminosilicate gel structures. The broad nature of this band indicates that these reaction products were predominantly poorly crystalline or amorphous. In addition, the bands near 1450, 875 and 712 cm−1 were assigned to the asymmetric stretching, out-of-plane bending and in-plane bending vibrations of CO32−, respectively [33]. These carbonate-related bands were present in all samples, consistent with the persistence of calcite and dolomite identified by XRD.
Figure 8.
FTIR spectra of stabilized WBDCs: (a) full spectra of M10-7d, M10-14d, M10-28d and M9-28d; (b) enlarged spectra in the fingerprint region.
The Si-O-Si/Si-O-Al absorption band of M10 in the 1000–1100 cm−1 region became progressively more distinct with increasing curing age, indicating continued development of the silicate and aluminosilicate gel network. The change was more evident from 7 to 14 d, whereas the difference between 14 and 28 d was comparatively limited, which is consistent with the rapid strength development of M10 during the first 14 d. At 28 d, M9 and M10 showed essentially the same characteristic band positions, suggesting that the difference between the two mixtures was not mainly associated with different reaction-product types. However, the 1000–1100 cm−1 absorption region was more distinct for M10-28d, which may reflect differences in the development or local chemical environment of Si-O-Si and Si-O-Al structures. In comparison, the water-related bands near 3400 and 1630 cm−1 were relatively more pronounced in M9-28d, suggesting a greater amount of retained adsorbed or bound water. These spectral differences are consistent with differences in the development of Si- and Al-containing structures between the two overall formulations and with the higher 28 d UCS of M10.
3.4. Thermal Decomposition Behavior
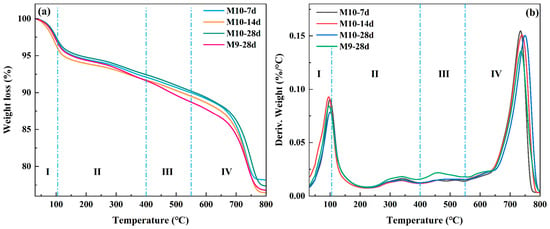
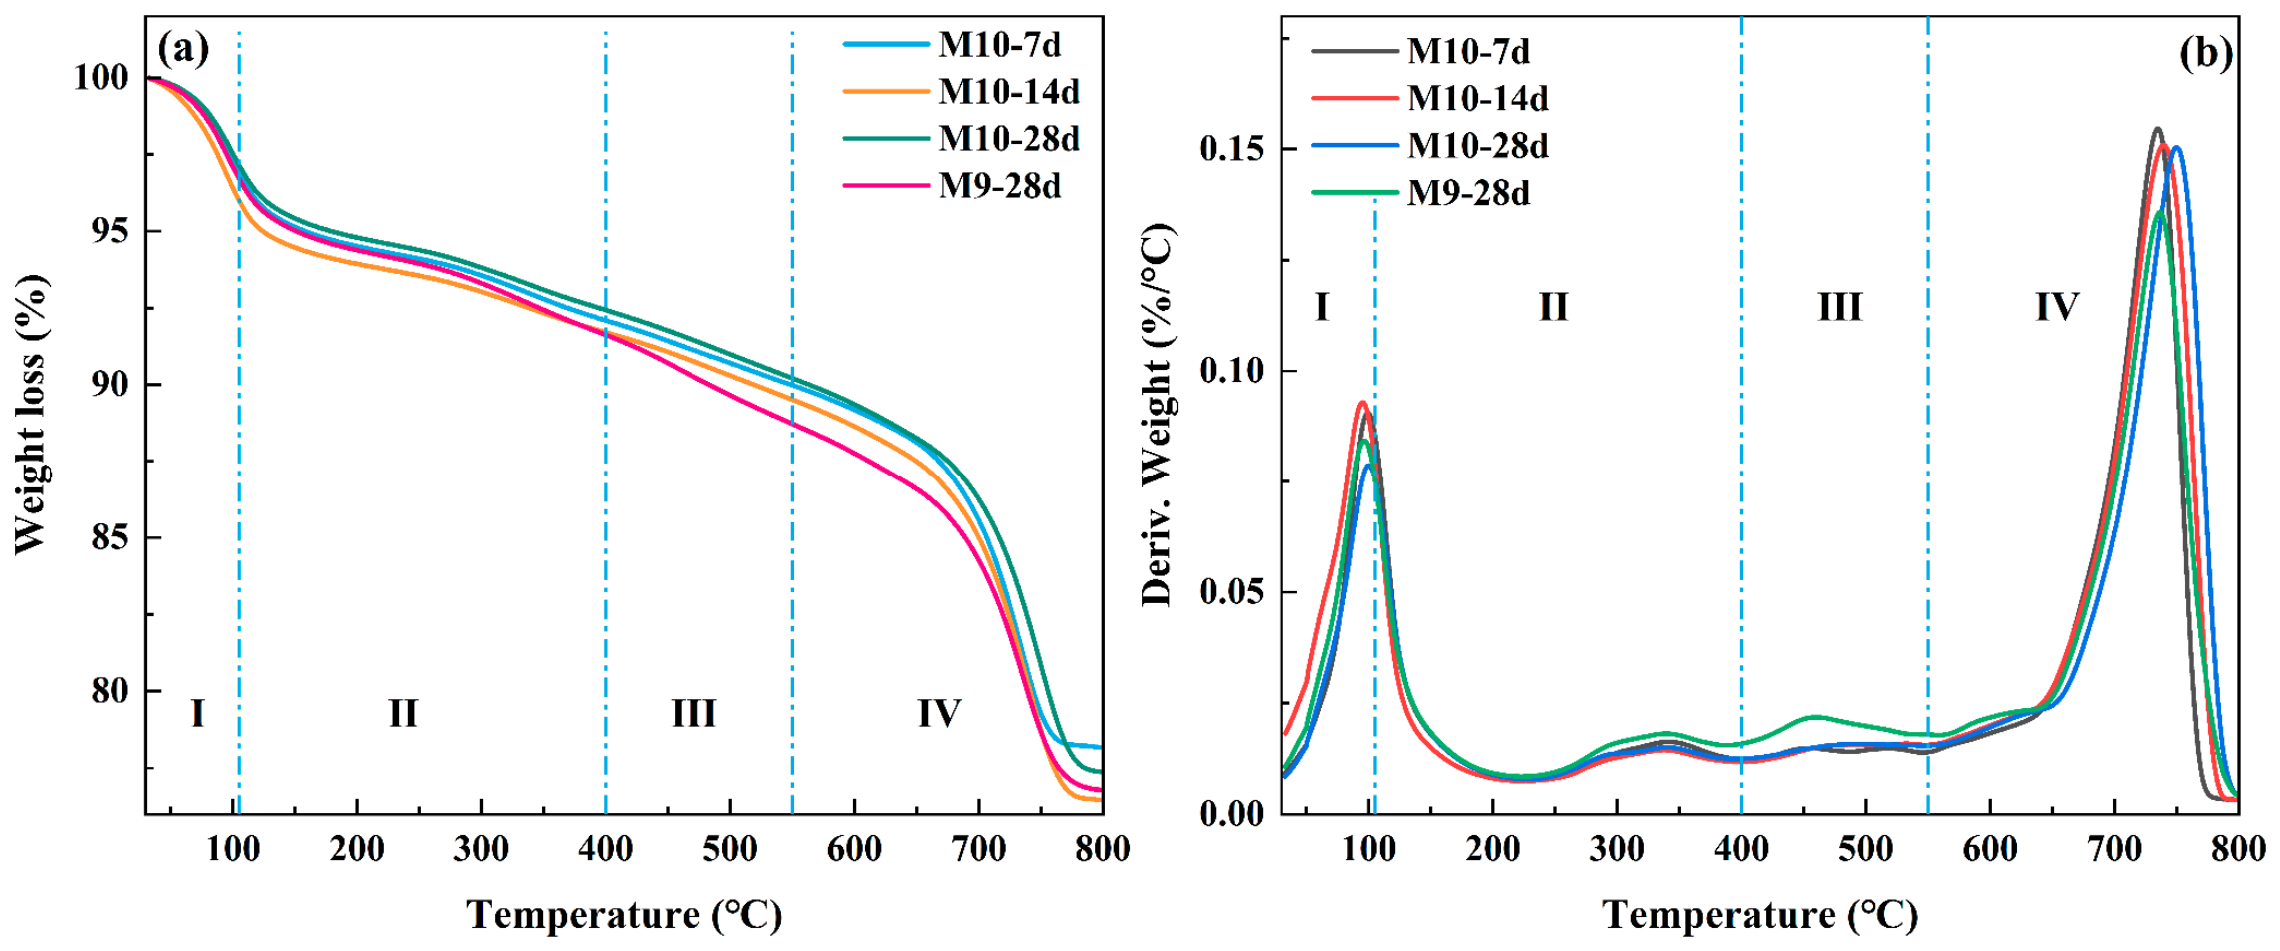
Figure 9 shows the weight-loss and derivative weight curves of M10 at different curing ages and M9 at 28 d, and the corresponding thermal decomposition parameters are summarized in Table 5.
Figure 9.
Thermogravimetric characteristics of stabilized WBDCs: (a) weight-loss curves and (b) derivative weight curves of M10 at different curing ages and M9 at 28 d.
Table 5.
Thermal decomposition characteristics of stabilized WBDCs.
As shown in Figure 9, the weight-loss process can be divided into four stages. Stage I (30–105 °C) is mainly associated with the removal of free and physically adsorbed water. Stage II (105–400 °C) is primarily related to the dehydration of C-S-H, C-A-S-H, AFt, and other bound-water-containing products. Stage III (400–550 °C) is mainly attributed to the dehydroxylation of Ca(OH)2 and other hydroxyl-bearing phases, while Stage IV (550–800 °C) mainly corresponds to the decomposition of carbonate phases such as calcite and dolomite [34].
According to Figure 9 and Table 5, the total weight loss of M10 changed only slightly with curing age, reaching 21.84%, 23.55%, and 22.64% at 7, 14, and 28 d, respectively. In Stage I, the weight loss of M10 decreased to 2.84% at 28 d, compared with 3.03% at 7 d and 4.00% at 14 d, which may be associated with a reduction in free and weakly adsorbed water with prolonged curing. A more distinct difference was observed between M10 and M9 at 28 d. Although their total weight losses were relatively similar, at 22.64% and 23.22%, respectively, the weight loss of M10 in Stage III was only 2.22%, lower than the 2.90% of M9. The corresponding derivative weight peaks occurred at 487.53 °C and 458.41 °C, respectively. The lower Stage III weight loss is consistent with a lower contribution from residual Ca(OH)2 and other hydroxyl-bearing phases in M10, suggesting a greater extent of subsequent reaction.
Stage IV accounted for the largest proportion of the total weight loss in all samples. At 28 d, the weight losses of M10 and M9 in this stage were 12.85% and 11.95%, respectively, while their main carbonate decomposition peaks were located at 749.16 °C and 735.99 °C. The shift of the decomposition peak toward a higher temperature for M10 indicates a difference in the local structural environment of the carbonate phases compared with M9. When considered together with the XRD and FTIR results, the observed thermal differences suggest that the performance difference between M9 and M10 may be associated with differences in the development of their cementitious structures.
3.5. MIP Analysis
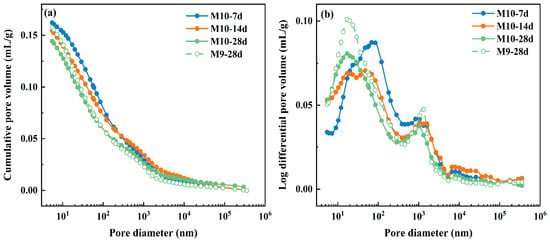
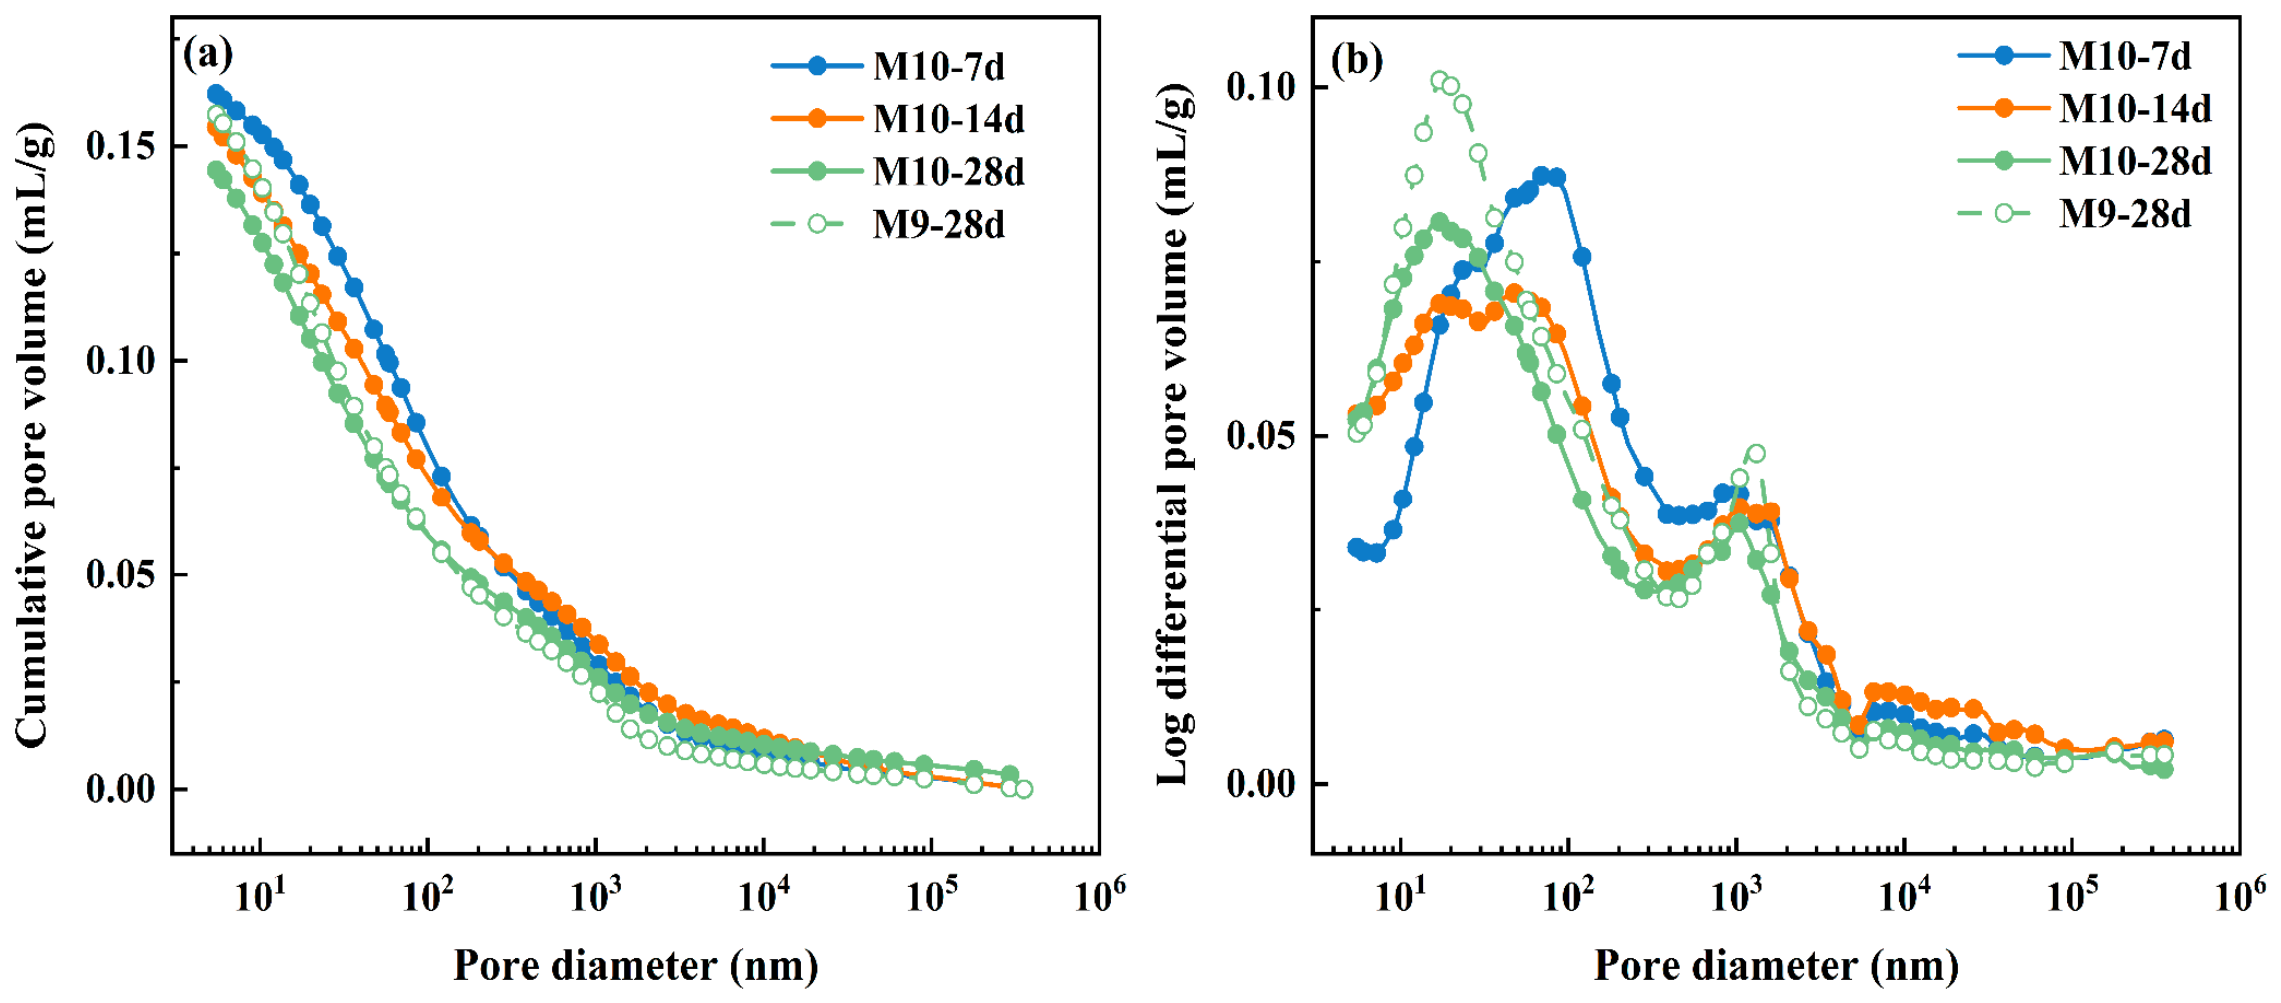
Figure 10 presents the cumulative pore volume and logarithmic differential pore volume distributions of M10 at different curing ages and M9 at 28 d, with the corresponding pore structure parameters listed in Table 6.
Figure 10.
Pore structure characteristics of stabilized WBDCs determined by MIP: (a) cumulative pore volume curves and (b) logarithmic differential pore volume distributions.
Table 6.
Pore structure parameters of stabilized WBDCs determined by MIP.
As shown in Figure 10 and Table 6, the cumulative pore volume of M10 continuously decreased as the curing age increased from 7 to 28 d. The total pore volume decreased from 0.1622 to 0.1444 mL/g, while the porosity decreased from 30.24% to 27.36%, corresponding to reductions of 11.0% and 9.5%, respectively. Meanwhile, the average pore diameter decreased from 40.61 to 27.95 nm, and the median pore diameter decreased from 96.17 to 57.15 nm. These changes indicate that prolonged curing reduced the overall volume of mercury-accessible pores while progressively refining the pore structure. The logarithmic differential pore volume distributions of M10 also changed markedly with curing age. At 7 d, the main peak was relatively pronounced and located within a larger pore size range. With increasing curing age, the main peak shifted toward smaller pore sizes, the contribution from larger pores decreased, and the pore size distribution became progressively flatter. This behavior indicates that larger mercury-accessible pores were gradually filled and subdivided by reaction products during curing, resulting in reduced pore volume and a finer pore structure.
Comparison of M10 and M9 at 28 d reveals distinct differences in both pore volume and pore size distribution. The total pore volume and porosity of M10 were 0.1444 mL/g and 27.36%, respectively, lower than those of M9. This indicates a lower volume of mercury-accessible pores and a higher degree of matrix densification in M10. The cumulative pore volume curve of M9 remained higher over most of the pore size range, while its logarithmic differential pore volume distribution exhibited more pronounced peaks, particularly in the smaller pore size region. In contrast, M10 showed a lower and flatter distribution, indicating a smaller residual accessible pore volume and a more uniform pore structure. Notably, the average and median pore diameters of M9 at 28 d were 27.44 and 49.75 nm, respectively, slightly lower than those of M10 (27.95 and 57.15 nm), despite the higher total pore volume and porosity of M9. This indicates that a reduction in characteristic pore diameter alone does not necessarily represent a higher degree of overall densification. Although part of the pore system in M9 was refined to smaller sizes, a larger total volume of accessible pores remained. M10, by comparison, combined pore refinement with a greater reduction in total pore volume and porosity, resulting in a denser pore structure.
3.6. SEM-EDS Analysis
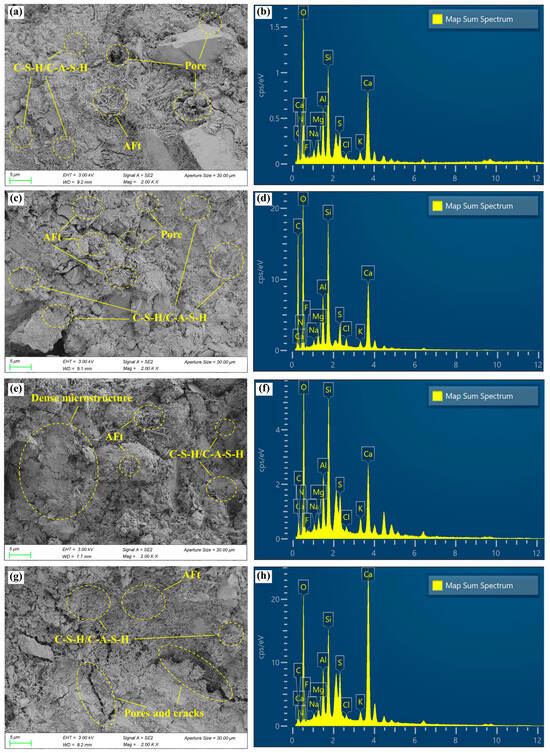
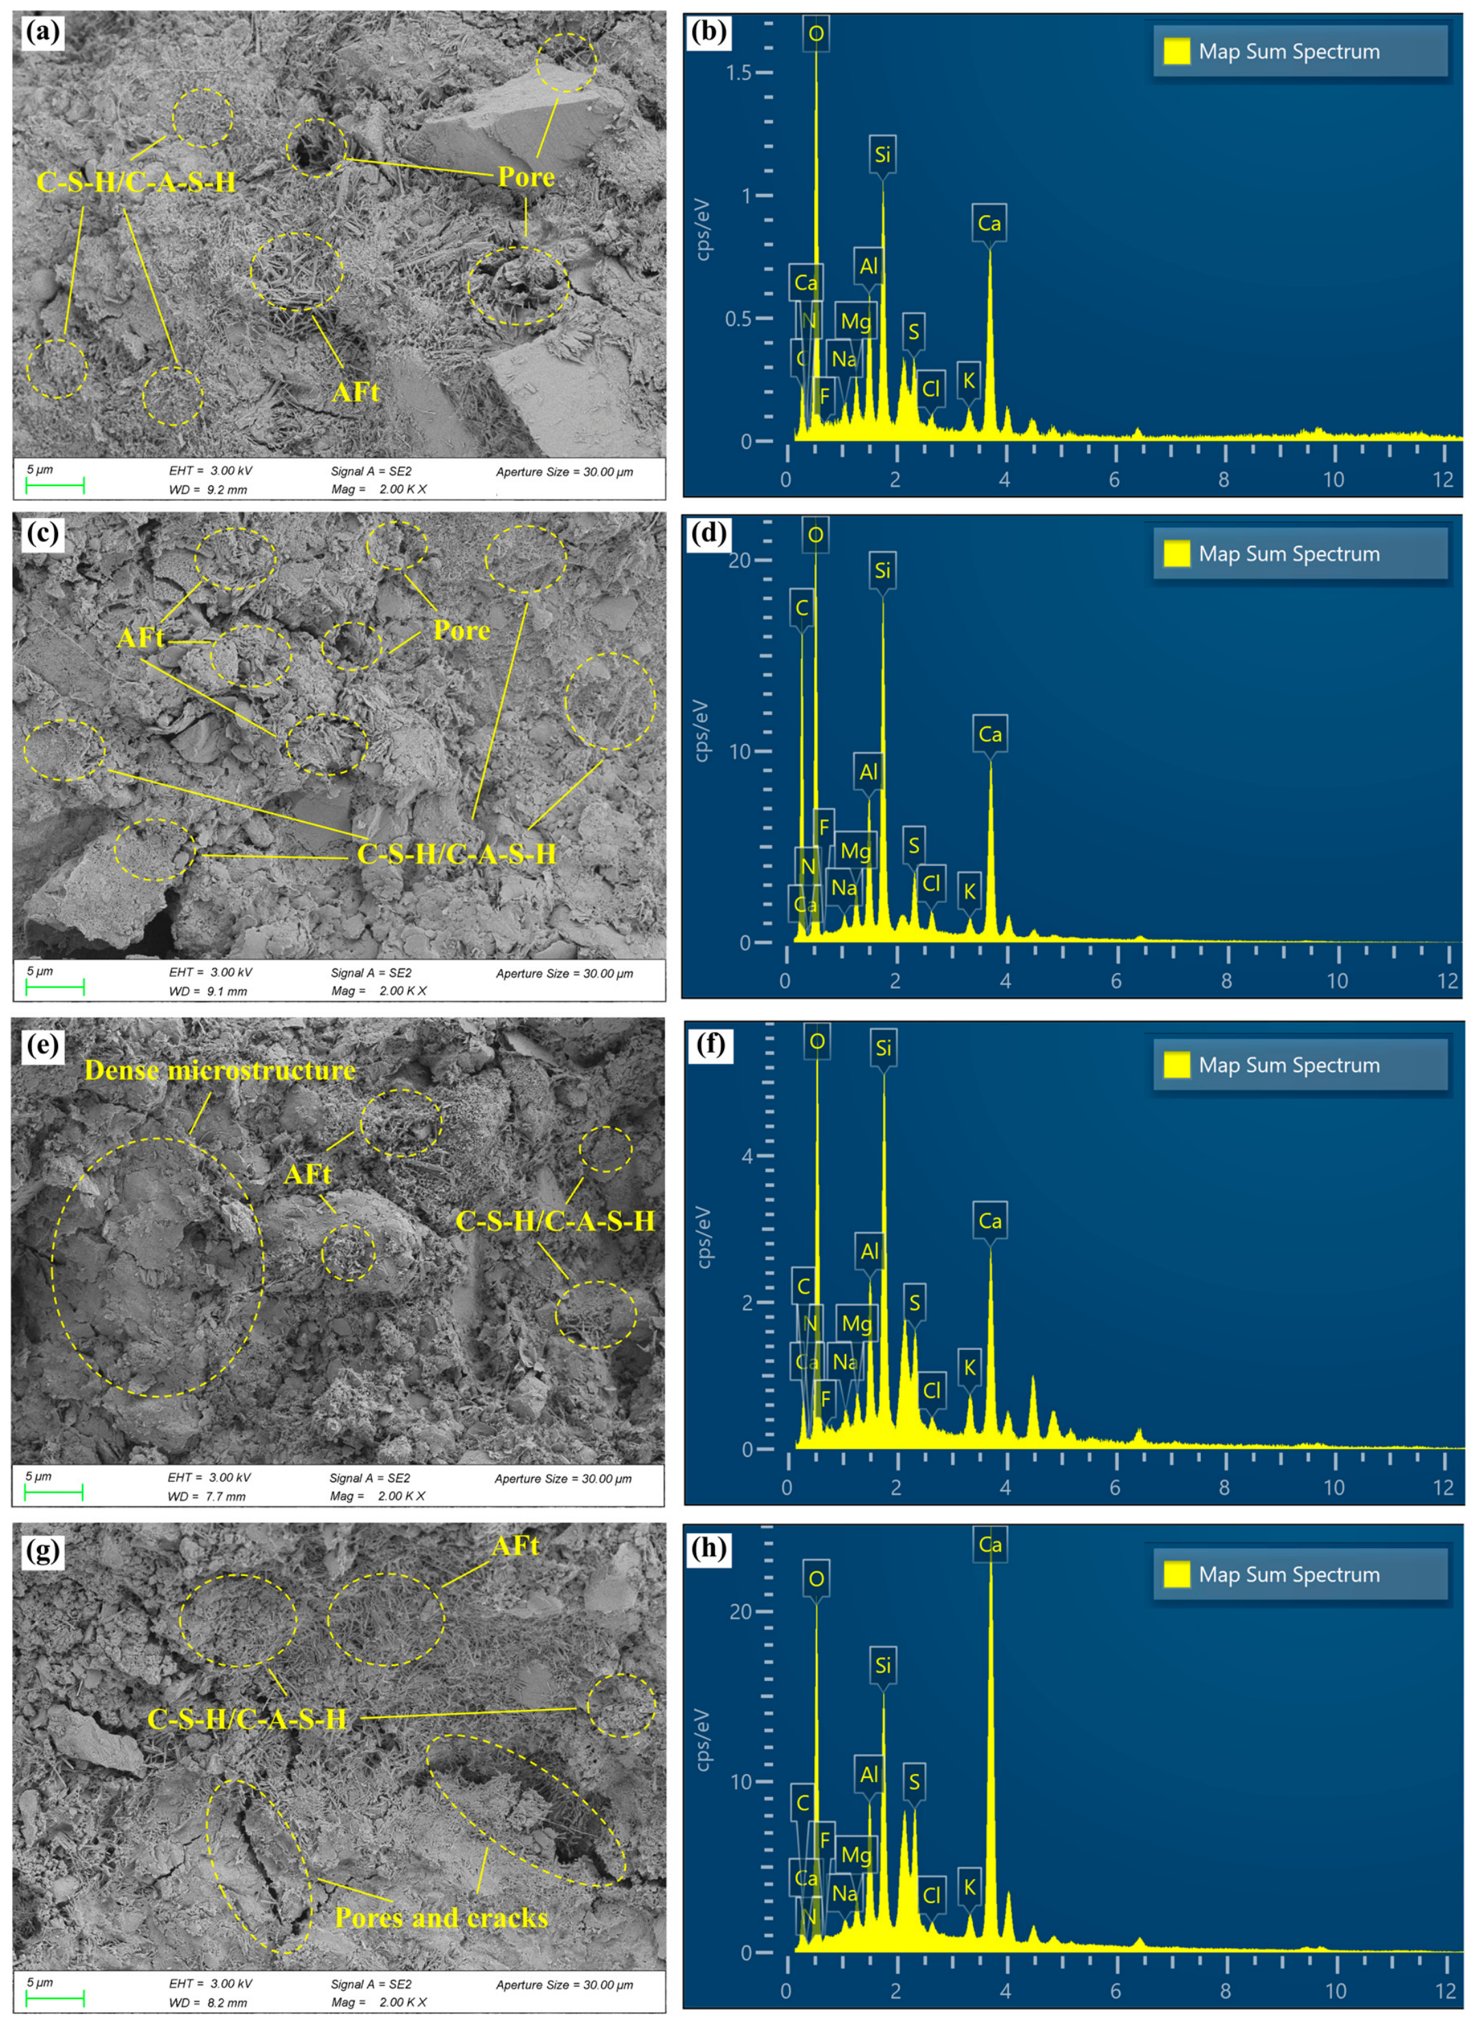
Figure 11 presents the SEM images and corresponding EDS spectra of M10 at different curing ages and M9 at 28 d, while the major elemental compositions are summarized in Table 7.
Figure 11.
SEM morphologies and corresponding EDS spectra of stabilized WBDCs: (a,b) M10-7d; (c,d) M10-14d; (e,f) M10-28d; (g,h) M9-28d.
Table 7.
Major elemental compositions of different samples determined by EDS.
At 7 d, M10 exhibited a relatively loose microstructure with distinct particle boundaries and abundant interparticle pores. Needle-like products together with flocculent and gel-like phases were locally observed on particle surfaces and within pore spaces, indicating that reaction products had already formed but remained discontinuously distributed. At 14 d, the amount of flocculent and gel-like products increased, gradually covering the particle surfaces and filling the interparticle spaces. The particle boundaries became less distinct, and the larger pores were partially filled.
After 28 d of curing, the particles were more extensively coated and interconnected by continuous gel-like products, accompanied by a further reduction in visible pores and loose regions. These observations indicate a progressive transformation of M10 from a loosely packed particulate structure to a more compact and continuously cemented matrix with increasing curing age.
The EDS spectra of M10 at different curing ages consistently detected O, Ca, Si, Al, and S as the major elements. The coexistence of Ca, Si, Al, and O in the cemented regions is consistent with the elemental characteristics of C-S-H/C-A-S-H-type gels, whereas the coexistence of Ca, Al, S, and O agrees with the needle-like AFt-type products observed in the SEM images. At 28 d, the Si and Al contents of M10 reached 10.32% and 4.16%, respectively, compared with 7.38% and 3.92% at 7 d. This indicates a greater abundance of Si- and Al-containing components within the analyzed region at the later curing age, consistent with the more extensively developed gel-like morphology. Since EDS provides local semi-quantitative elemental information, however, variations in elemental contents among different curing ages should be interpreted as differences in the analyzed microregions rather than as direct quantitative measures of individual reaction products.
Distinct microstructural differences were observed between M10 and M9 at 28 d. M10 exhibited a relatively continuous gel-like matrix covering and bridging adjacent particles, with less distinct particle boundaries and fewer visible residual pores. In contrast, M9 retained clearer particle boundaries and locally loose regions, while the reaction products appeared more locally concentrated and less continuously connected to the surrounding particles. The EDS results showed that the Si and Al contents of M10-28d were 10.32% and 4.16%, respectively, higher than those of M9-28d (6.19% and 3.20%), whereas the Ca content of M9-28d reached 24.02%, substantially higher than the 11.96% measured for M10-28d. The higher Ca content indicates pronounced local enrichment of Ca-containing components in the analyzed region of M9, whereas the M10 region contained relatively higher proportions of Si- and Al-bearing cementitious components. Therefore, the difference between M10 and M9 at 28 d is mainly reflected in the spatial distribution and continuity of the reaction products: the more continuous gel-like matrix and more effective interparticle bonding in M10 resulted in a denser microstructure.
3.7. Stabilization Mechanism
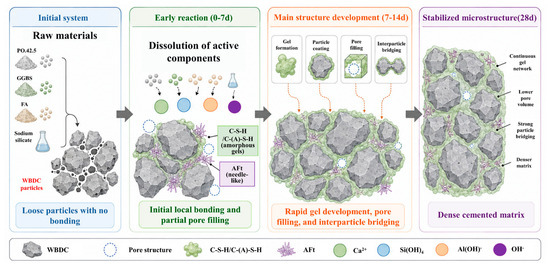
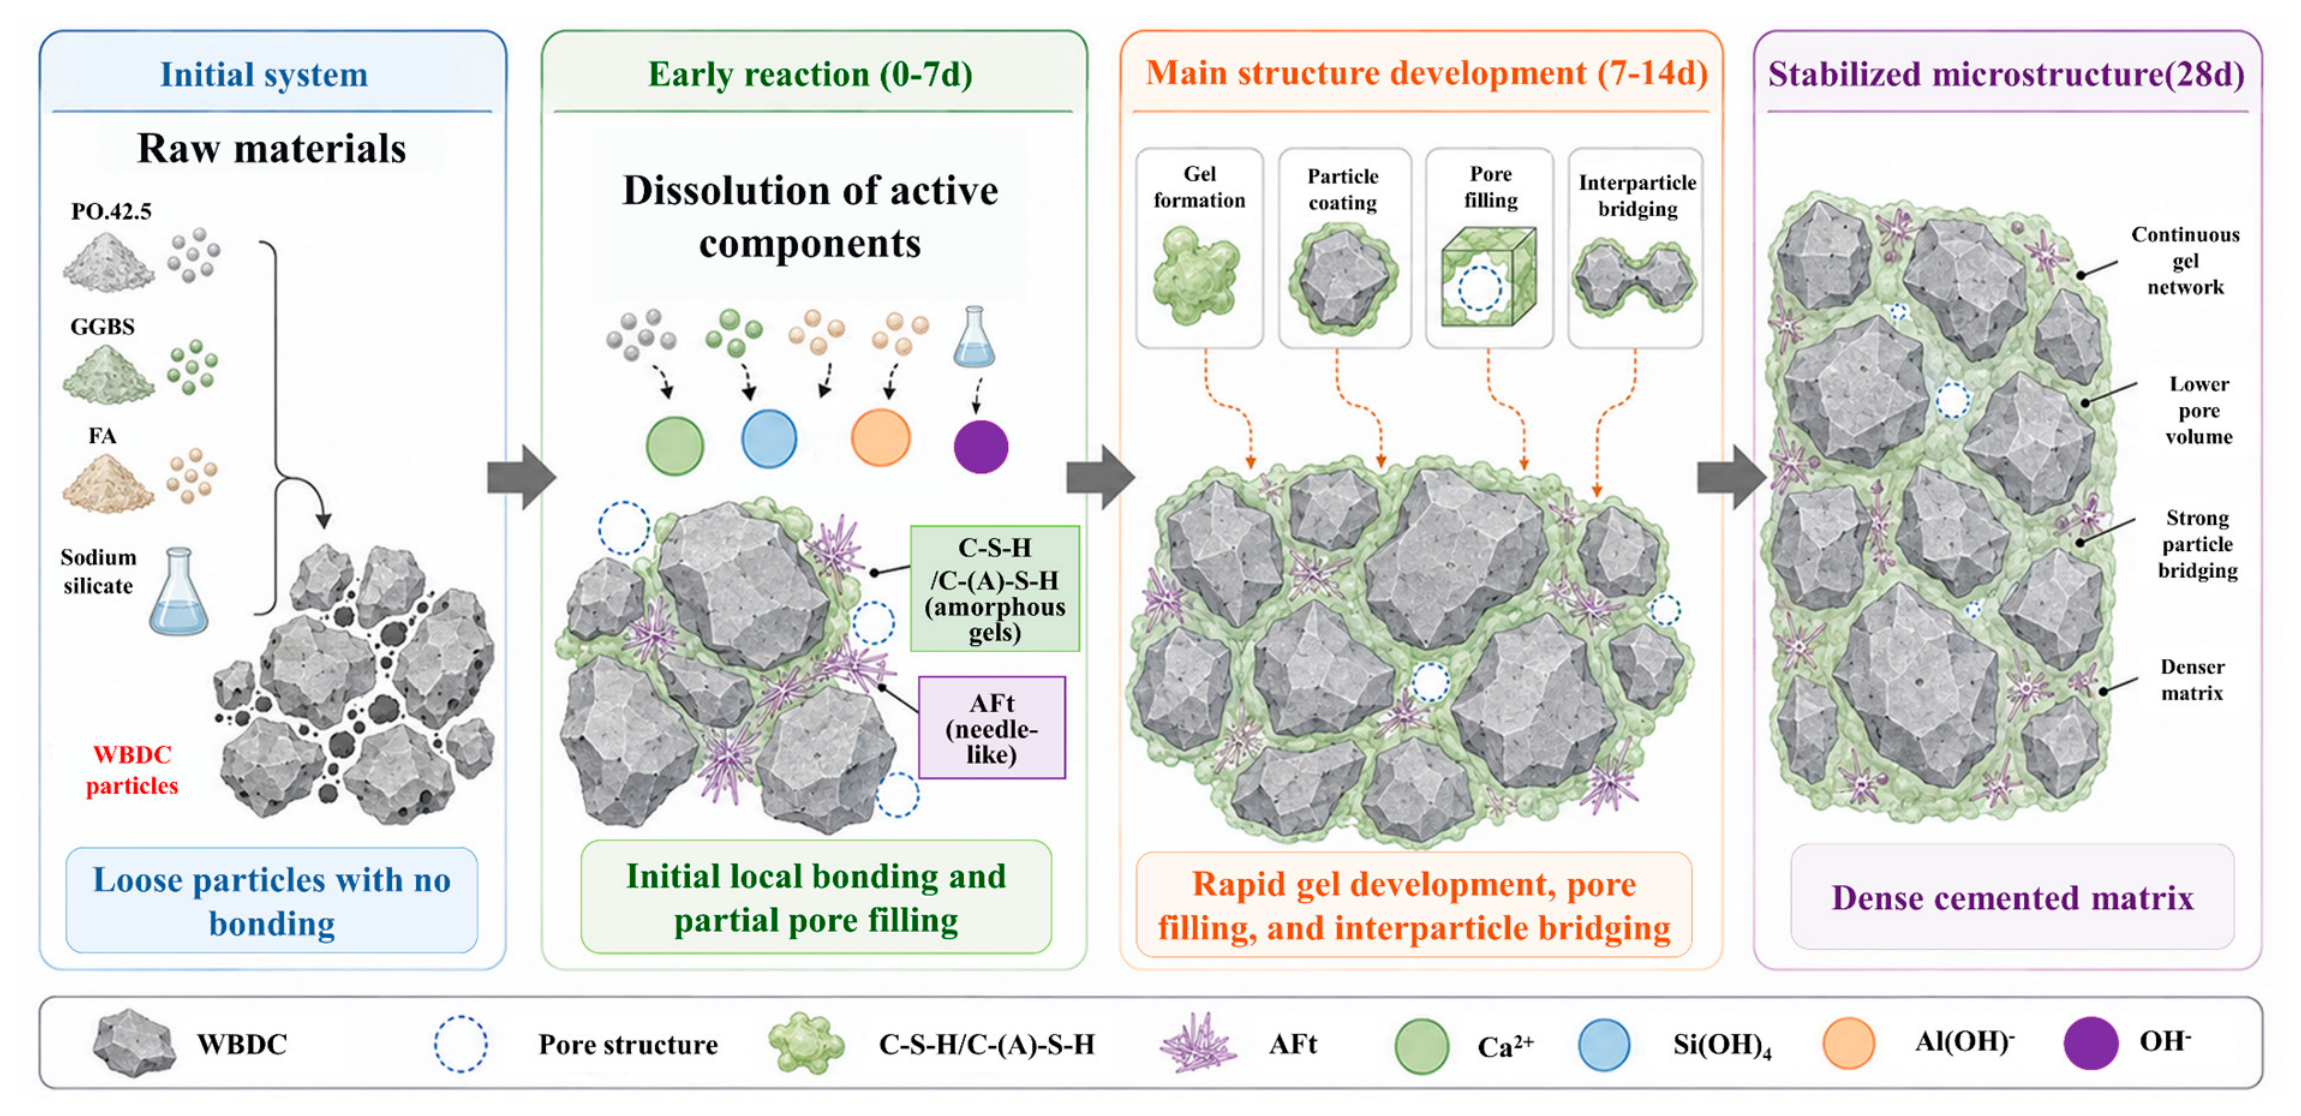
Based on the above experimental observations, the proposed stabilization mechanism of WBDCs is schematically illustrated in Figure 12. The original WBDCs exhibit a loose particle structure with abundant interparticle pores. After the incorporation of cement, GGBS, FA, and sodium silicate, cement hydration and alkaline activation promote the dissolution of reactive Ca-, Si-, and Al-bearing species. These dissolved species participate in the formation of poorly crystalline C-S-H/C-(A)-S-H-type gels and a small amount of AFt. The original crystalline minerals remain mainly as the solid skeleton, as indicated by the XRD results. Meanwhile, the progressive development of the Si-O-Si/Si-O-Al bands in the FTIR spectra and the TG characteristics indicate the continued development of cementitious reaction products.
Figure 12.
Schematic illustration of the stabilization mechanism and microstructural evolution of WBDCs treated with the multi-source solid-waste binder.
At the early curing stage, the reaction products are mainly distributed around the WBDC particle surfaces and contact regions, resulting in local bonding and partial pore filling. The main structural development occurs between 7 and 14 d. During this period, gel-like products progressively coat the particles, fill the interparticle pores, and connect adjacent particles. This development is consistent with the rapid increase in UCS during the same period. With prolonged curing, the reaction products become more continuously distributed and the pore structure is further refined. The MIP results confirm the reductions in porosity and total pore volume, while the SEM observations show a gradual transition from distinct particle boundaries and abundant pores to a more continuous cemented matrix. Therefore, the strength development of stabilized WBDCs mainly results from the continued formation of cementitious products, enhanced interparticle bonding, and progressive densification of the pore structure.
4. Conclusions
In this study, WBDCs were stabilized using a multi-source solid-waste binder mainly composed of GGBS and FA at a total binder dosage of 15%. The effects of binder composition on strength development and microstructural evolution were investigated by UCS, XRD, FTIR, TG, MIP, and SEM-EDS tests. The main conclusions are as follows:
- Binder composition had a clear effect on the strength development of stabilized WBDCs. M10, with a sodium silicate modulus of 1.4, a sodium silicate dosage of 4%, a cement dosage of 10%, and a GGBS-to-FA mass ratio of 6:1, exhibited the highest UCS. Its UCS reached 6.87, 9.74, and 10.17 MPa at 7, 14, and 28 d, respectively. About 95.8% of the 28 d strength developed within the first 14 d. The comparison between M9 and M10 also showed that increasing sodium silicate dosage alone did not continuously improve strength.
- XRD, FTIR, and TG results showed that the main crystalline phases of WBDCs remained after stabilization. A small amount of AFt and poorly crystalline C-S-H/C-(A)-S-H-type gels developed during curing. The Si-O-Si/Si-O-Al network became more developed with curing age, while M10 showed less residual Ca(OH)2 than M9 at 28 d. These results indicate that continued gel development and subsequent reactions were closely related to the strength increase.
- The pore structure of M10 became progressively denser with curing age. From 7 to 28 d, the porosity and total pore volume decreased by 9.5% and 11.0%, respectively, while the average pore diameter decreased by 31.2%. The reaction products gradually filled and subdivided the original pores, which improved the compactness of the stabilized matrix.
- SEM-EDS observations showed that the microstructure gradually changed from a loose particle arrangement to a continuous cemented matrix. The reaction products progressively coated and bridged WBDC particles and filled the interparticle pores. The combined results indicate that cement hydration, alkaline activation of GGBS and FA, gel formation, and pore refinement jointly controlled the strength development of stabilized WBDCs.
These findings clarify the relationship between binder composition, reaction-product development, pore refinement, and macroscopic strength in stabilized WBDCs. Future studies should further evaluate the water stability, dry–wet and freeze–thaw resistance, and environmental safety of the stabilized material. Field-scale tests are also needed to evaluate its application as a construction material for access roads near shale gas drilling sites and to verify its long-term performance under practical service conditions.
Author Contributions
Conceptualization, Q.Z. and B.S.; methodology, B.S.; validation, X.C. and Z.L.; formal analysis, Y.W. and Z.L.; investigation, C.H. and Y.W.; resources, Q.Z.; data curation, Q.Z.; writing—original draft preparation, Q.Z. and B.S.; writing—review and editing, B.S.; supervision, X.C.; funding acquisition, Q.Z. and B.S. All authors have read and agreed to the published version of the manuscript.
Funding
This research was funded by the Science and Technology Program of Xizang Autonomous Region (XZ202601JX0037, XZ202501ZY0077) and the Chongqing Municipal Natural Science Foundation General Project (CSTB2025NSCQ-GPX0884).
Institutional Review Board Statement
Not applicable.
Informed Consent Statement
Not applicable.
Data Availability Statement
The original contributions presented in this study are included in the article. Further inquiries can be directed to the corresponding author.
Acknowledgments
During the preparation of this manuscript, the authors used ChatGPT (OpenAI) to assist in the graphical preparation and visual refinement of Figure 12. The tool was used solely to support the presentation of the schematic illustration and was not used to generate, analyze, or interpret experimental data. The authors reviewed and edited the AI-assisted output and take full responsibility for the content of this publication.
Conflicts of Interest
The authors declare no conflicts of interest.
Abbreviations
The following abbreviations are used in this manuscript:
| XRD | X-ray Diffraction |
| FTIR | Fourier Transform Infrared Spectroscopy |
| TG | Thermogravimetry |
| MIP | Mercury Intrusion Porosimetry |
| SEM | Scanning Electron Microscopy |
| EDS | Energy Dispersive X-ray Spectroscopy |
| C-S-H | Calcium Silicate Hydrat |
| C-(A)-S-H | Calcium Aluminosilicate Hydrate |
| AFt | Ettringite |
References
- Liu, Y.; Ma, E.; Chen, M.; Wu, J.; Yang, J.; Wang, Z.; Yang, L.; Li, H. Efficient mechanical activation for preparing highly active supplementary cementitious materials: High-value resource recovery of water-based drilling cuttings. Process Saf. Environ. Prot. 2026, 208, 108436. [Google Scholar] [CrossRef] [Scilit]
- Liu, D.-S.; Wang, C.-Q.; Mei, X.-D.; Zhang, C. Environmental performance, mechanical and microstructure analysis of non-fired bricks containing water-based drilling cuttings of shale gas. Constr. Build. Mater. 2018, 183, 215–225. [Google Scholar] [CrossRef] [Scilit]
- Wang, C.-Q.; Yu, L.; Zhou, Y.-C.; He, Z.-Y. Utilization of water-based drilling cuttings Composite recycled fine powder in high-performance foamed ceramics. Compos. Part B Eng. 2026, 313, 113396. [Google Scholar] [CrossRef] [Scilit]
- Wang, C.-Q.; Chen, S.; Huang, D.-M.; Chen, Q.; Tu, M.-J.; Wu, K.; Zhang, Z.-J. Pozzolanic activity and environmental risk assessment of water-based drilling cuttings of shale gas. Constr. Build. Mater. 2022, 348, 128657. [Google Scholar] [CrossRef] [Scilit]
- Pang, Z.; Zhang, T.; Zheng, C.; Liu, S.; Xu, H. Preparation of water-based drilling cuttings derived non-fired bricks and insights into heavy metal fixation mechanisms. Energy Sources Part A Recovery Util. Environ. Eff. 2025, 47, 8744–8757. [Google Scholar] [CrossRef] [Scilit]
- Yang, H.; Diao, H.; Zhang, Y.; Xia, S. Treatment and novel resource-utilization methods for shale gas oil based drill cuttings—A review. J. Environ. Manag. 2022, 317, 115462. [Google Scholar] [CrossRef] [Scilit] [PubMed]
- Wang, C.-Q.; Mei, X.-D.; Zhang, C.; Liu, D.-S.; Xu, F.-L. Mechanism study on co-processing of water-based drilling cuttings and phosphogypsum in non-autoclaved aerated concrete. Environ. Sci. Pollut. Res. 2020, 27, 23364–23368. [Google Scholar] [CrossRef] [Scilit] [PubMed]
- Wang, C.-Q.; Liu, K.; Huang, D.-M. Property of concrete made of recycled shale gas drilling cuttings. Environ. Sci. Pollut. Res. 2021, 29, 2098–2106. [Google Scholar] [CrossRef] [Scilit] [PubMed]
- Yang, H.; Liu, Y.-L.; Bai, G.-L.; Feng, Z.; Zhang, Y.; Xia, S.-B. Solidification and utilization of water-based drill cuttings to prepare ceramsite proppant with low-density and high performance. Pet. Sci. 2022, 19, 2314–2325. [Google Scholar] [CrossRef] [Scilit]
- Li, B.; Wei, S.; Zhen, Y.-W. An effective recycling direction of water-based drilling cuttings and phosphogypsum co-processing in road cushion layer. Environ. Sci. Pollut. Res. 2020, 27, 17420–17424. [Google Scholar] [CrossRef] [Scilit] [PubMed]
- Wang, C.-Q.; Chen, S.; Huang, D.-M.; Huang, Q.-C.; Tu, M.-J.; Wu, K.; Liu, Y.-Y. Human carcinogenic risk analysis and utilization of shale gas water-based drilling cuttings in road materials. Environ. Sci. Pollut. Res. 2022, 30, 12741–12768. [Google Scholar] [CrossRef] [Scilit] [PubMed]
- Tan, S.; Wen, H.; Tang, H.; Fu, W.; Guo, X.; Bai, B.; Wu, J.; Tan, X. Utilization of Water-Based Drill Cuttings Stabilized by a Novel Composite Stabilizer for Pavement Base Applications. Coatings 2026, 16, 406. [Google Scholar] [CrossRef] [Scilit]
- Deming, X.; Chaoqiang, W. Physical characteristics and environmental risks assessment of oil-based drilling cuttings residues used for subgrade materials. J. Clean. Prod. 2021, 323, 129152. [Google Scholar] [CrossRef] [Scilit]
- Huang, W.; Lei, M.; Li, G.; Wang, Y.; Du, K.; Chen, W.; Qiu, Z. Surface coating on solidified water-based drilling waste materials and its mechanism for resource reuse. J. Chem. Technol. Biotechnol. 2020, 95, 2149–2158. [Google Scholar] [CrossRef] [Scilit]
- Abadel, A.A.; Alghamdi, H.; Alharbi, Y.R.; Alamri, M.; Khawaji, M.; Abdulaziz, M.A.M.; Nehdi, M.L. Investigation of Alkali-Activated Slag-Based Composite Incorporating Dehydrated Cement Powder and Red Mud. Materials 2023, 16, 1551. [Google Scholar] [CrossRef] [Scilit] [PubMed]
- Wang, Q.; Peng, X.; He, Y.; Yang, Z.; Li, Z.; Wang, Y.; Wei, T.; Wang, R.; Li, H. Mechanical Properties, Hydration Mechanisms, and Microwave-Absorbing Properties of Alkali-Activated Blast-Furnace Slag Containing Steel Slag. Materials 2026, 19, 2761. [Google Scholar] [CrossRef] [Scilit] [PubMed]
- Song, N.; Xia, D.; Li, B.; Zheng, Y.; Yao, Y.; Mou, B.; Yan, W.; Li, S. Synergetic shrinkage mitigation and anti-cracking mechanism of SAP and expansive agent in alkali-activated slag/fly ash-based concrete. J. Build. Eng. 2025, 104, 112238. [Google Scholar] [CrossRef] [Scilit]
- Chen, M.; Wu, D.; Chen, K.; Liu, C.; Zhou, G.; Cheng, P. The effects of solid activator dosage and the liquid-solid ratio on the properties of FA-GGBS based one-part geopolymer. Constr. Build. Mater. 2025, 463, 140067. [Google Scholar] [CrossRef] [Scilit]
- Ravikumar, D.; Peethamparan, S.; Neithalath, N. Structure and strength of NaOH activated concretes containing fly ash or GGBFS as the sole binder. Cem. Concr. Compos. 2010, 32, 399–410. [Google Scholar] [CrossRef] [Scilit]
- Lv, Q.; Yu, J.; Ji, F.; Gu, L.; Chen, Y.; Shan, X. Mechanical Property and Microstructure of Fly Ash-Based Geopolymer Activated by Sodium Silicate. KSCE J. Civ. Eng. 2021, 25, 1765–1777. [Google Scholar] [CrossRef] [Scilit]
- John, V.T.; Thomas, R.M. Optimising Compressive Strength: Investigating the Ideal Conditions for Sodium Silicate-Activated Fly Ash–GGBS-Based Binder. Iran. J. Sci. Technol. Trans. Civ. Eng. 2023, 48, 2061–2076. [Google Scholar] [CrossRef] [Scilit]
- Tian, L.; Liang, G.; Yao, X.; Wu, Q.; Zhu, H.; Zhu, Z.; Yang, M.; Shen, B.; Zhu, J. Investigation on the workability, shrinkage behavior and microstructure of alkali-activated cements prepared by different silicate moduli and dosages. J. Therm. Anal. Calorim. 2025, 150, 13051–13064. [Google Scholar] [CrossRef] [Scilit]
- Qi, A.; Wang, P.; Zhu, Y.; Liu, W.; Jia, J.; Wang, Z.; Hu, W.; Liu, Y. Study on Macroscopic Mechanical Properties and Microscopic Mechanism of Drilling Cuttings Solidified by Alkali-Activated Furnace Ash. Coatings 2026, 16, 266. [Google Scholar] [CrossRef] [Scilit]
- T 0103-2019; Oven-Drying Method. China Communications Press Co., Ltd.: Beijing, China, 2020.
- T 0118-2007; Combined Liquid and Plastic Limit Test. China Communications Press Co., Ltd.: Beijing, China, 2020.
- T 0131-2019; Compaction Test. China Communications Press Co., Ltd.: Beijing, China, 2020.
- JTG 3430-2020; Test Methods of Soils for Highway Engineering. China Communications Press Co., Ltd.: Beijing, China, 2020.
- Zhan, Q.; Shan, B.; Cao, X.; Xu, Y.; Wang, L.; Li, X. Stabilization of water-based drilling cuttings using an alkali-activated GGBS–FA-based composite binder for road construction. Front. Mater. 2026, 13, 1947086. [Google Scholar] [CrossRef]
- JTG 3441-2024; Test Methods of Materials Stabilized with Inorganic Binders for Highway Engineering. China Com-munications Press Co., Ltd.: Beijing, China, 2024.
- He, J.; Long, G.; Ma, K.; Xie, Y. Influence of fly ash or slag on nucleation and growth of early hydration of cement. Thermochim. Acta 2021, 701, 178964. [Google Scholar] [CrossRef] [Scilit]
- Sun, X.; Sun, R.; Liu, D.; Liu, Z.; Wang, D.; Cao, W.; Zhao, Y. Preparation of coal gasification coarse slag-based alkaline activator and its activation mechanism in alkali-activated slag. Cem. Concr. Compos. 2024, 152, 105648. [Google Scholar] [CrossRef] [Scilit]
- Su, L.; Li, J.; Wu, S.; Zhang, X.; Liang, B. Performance optimization and heavy metal solidification mechanism of salt-alkali activated all-solid waste filling material. J. Build. Eng. 2025, 107, 112754. [Google Scholar] [CrossRef] [Scilit]
- Yusuf, M.O. Bond Characterization in Cementitious Material Binders Using Fourier-Transform Infrared Spectroscopy. Appl. Sci. 2023, 13, 3353. [Google Scholar] [CrossRef] [Scilit]
- Cao, Y.; Mei, Y.; Yao, H.; Hu, B. Mechanical and microstructural characterization of one-part binder incorporated with alkali-thermal activated red mud. Case Stud. Constr. Mater. 2024, 21, e03634. [Google Scholar] [CrossRef] [Scilit]

Disclaimer/Publisher’s Note: The statements, opinions and data contained in all publications are solely those of the individual author(s) and contributor(s) and not of MDPI and/or the editor(s). MDPI and/or the editor(s) disclaim responsibility for any injury to people or property resulting from any ideas, methods, instructions or products referred to in the content. |
© 2026 by the authors. Licensee MDPI, Basel, Switzerland. This article is an open access article distributed under the terms and conditions of the Creative Commons Attribution (CC BY) license.