


Highlights
What are the main findings?
- Hybrid PEEK showed a higher numerical mean COF in all dry conditions.
- Both materials operated stably over PV = 0.3–3.2 MPa·m/s.
- Neat PEEK showed denser fine grooves, while hybrid PEEK had greater local height variation.
What are the implications of the main findings?
- Bearing-grade fillers do not necessarily reduce dry friction.
- Operating condition had a strong effect on steady-state COF.
- Material selection should consider friction, surface response, and thermal behaviour.
Abstract
Bearing-grade PEEK composites are intended to improve sliding performance, but filler addition does not necessarily reduce friction. This study compared the dry sliding tribological behaviour of neat PEEK and hybrid PEEK containing PTFE, graphite, and carbon fibre against 42CrMo4+QT steel. Ring-on-block tests were performed at nominal PV values of 0.3–3.2 MPa·m/s, contact pressures of 0.87–5.82 MPa, and sliding velocities of 0.26–0.55 m/s. Each material–condition combination was tested using three independent specimens. Coefficient of friction was calculated from simultaneously measured tangential and normal forces, and subsurface temperature was recorded continuously. Initial and post-test surfaces were examined using optical and extended depth-of-field microscopy. Group mean COF values ranged from 0.052 to 0.123. Hybrid PEEK exhibited a higher numerical mean COF than neat PEEK in all six operating conditions, with relative differences of approximately 1.53–8.36%. Two-factor ANOVA estimated an overall hybrid-minus-neat difference of +0.003388 COF units (95% CI 0.001279–0.005496; p = 0.0029), whereas none of the six condition-specific neat–hybrid comparisons was significant after Holm correction. Initial temperature, maximum temperature, and baseline-normalised temperature rise were reported for every specimen and treated descriptively. Both materials reached stable sliding states without seizure or uncontrolled thermal escalation. Post-test EDF observations showed a denser pattern of fine grooves on neat PEEK, whereas hybrid PEEK exhibited comparatively smoother intervening regions interrupted by fewer but locally deeper features. Mass changes remained close to the capability of the applied balance and did not permit quantitative wear-rate comparison. The results show that the investigated hybrid formulation did not provide a dry-friction reduction advantage over neat PEEK under the tested conditions.
1. Introduction
Sliding bearings and other polymer–steel contacts are used in mechanical systems where low friction, wear resistance, load-carrying capacity, and thermal stability are required [1]. Their tribological performance depends strongly on normal pressure, sliding velocity, counterface condition, and lubrication regime. Under high loads or insufficient lubrication, increased direct interaction between the polymer and the steel counterface may intensify frictional heating and material loss [2]. Consequently, the selection of the polymer material is particularly important in contacts operating under boundary-lubricated or temporarily dry conditions [3,4].
Polyether ether ketone (PEEK) is a high-performance thermoplastic used in demanding tribological applications because of its mechanical strength, thermal stability, chemical resistance, dimensional stability, and comparatively good wear resistance [3,5,6,7,8]. Neat PEEK has been investigated under a wide range of dry and lubricated sliding conditions, while modified PEEK grades have been developed to improve friction, wear resistance, load support, and thermal performance [5,6,7,9,10,11]. Nevertheless, the tribological response of PEEK is not determined by the polymer matrix alone. It also depends on contact pressure, sliding velocity, temperature, counterface roughness and the type and distribution of fillers [6,7,9,10,11].
Commercial bearing-grade PEEK materials commonly combine friction-modifying and reinforcing fillers [12]. PTFE is introduced primarily to reduce interfacial shear, while graphite is expected to support solid lubrication [5,6,10]. Carbon fibre increases stiffness and load-carrying capacity and can alter the transport of frictional heat within the composite [9,13,14,15,16]. The interaction of these additives may therefore affect not only the coefficient of friction and wear behaviour but also the temperature measured beneath the sliding surface. Because carbon-based fillers can form thermally conductive pathways in a polymer matrix, the subsurface temperature of a carbon-fibre-containing composite may reflect both frictional heat generation and heat transfer from the interface into the specimen [15,16].
However, the tribological effects of PTFE, graphite, and carbon fibre are not necessarily additive or universally beneficial. The sliding surface of a hybrid composite is heterogeneous and may contain locally exposed filler-rich regions, matrix–filler discontinuities, and detached particles [17]. Previous studies have shown that the release of rigid particles from carbon-fibre- and graphite-containing PEEK can change the tribological response and promote abrasive or third-body interactions [10]. The effectiveness of solid lubricants also depends on their distribution, retention in the matrix, and ability to participate in the formation of a stable transfer layer [6,10,11]. Consequently, the presence of nominally lubricating fillers does not guarantee that a hybrid PEEK grade will exhibit a lower coefficient of friction than neat PEEK under every operating condition [6,7,9,10,11,13,14].
Although the dry sliding behaviour of PEEK and filled PEEK composites has been widely studied, directly matched experimental data of commercial neat and hybrid bearing-grade PEEK under identical polymer–steel contact conditions across several operating regimes remain comparatively limited.
The aim of this study was to compare the steady-state dry-friction response of neat PEEK and hybrid PEEK containing PTFE, graphite, and carbon fibre against 42CrMo4+QT steel across six dry sliding operating conditions combining different nominal contact pressures and sliding velocities. Coefficient of friction was calculated from simultaneously measured tangential and normal forces, while initial temperature, maximum subsurface temperature, and baseline-normalised temperature rise were reported descriptively for every specimen, and subsurface temperature was recorded continuously. Initial and post-test surfaces were examined using optical and extended depth-of-field microscopy. It was hypothesised that the PTFE- and graphite-containing hybrid formulation would reduce steady-state friction relative to neat PEEK.
The comparison was based on three independently tested specimens for each material–condition combination, and statistical analysis was used to evaluate the steady-state COF response across the investigated matrix. The surface observations were used qualitatively to describe differences in post-test morphology.
2. Materials and Methods
2.1. Polyether Ether Ketone Materials
Two commercially available polyether ether ketone materials supplied by Röchling Industrial Lahnstein SE & Co. KG (Lahnstein, Germany) were investigated: unfilled SustaPEEK natural, hereafter referred to as neat PEEK, and SustaPEEK MOD black, hereafter referred to as hybrid PEEK. According to the manufacturer, SustaPEEK MOD black is specifically developed as a high-performance sliding material and is recommended for applications including bearings and bushings. This application-oriented designation, together with its PTFE-, graphite-, and carbon-fibre-modified composition, provided the basis for selecting the hybrid grade for comparison with neat PEEK under the investigated journal-bearing-type sliding conditions [18]. The nominal compositions were not independently verified by chemical analysis in the present study. The publicly available product information confirms that SustaPEEK MOD black contains graphite, PTFE, and carbon fibre and has a nominal density of 1.46 g/cm3 [19]. The nominal material characteristics are summarised in Table 1.
Table 1.
Nominal PEEK material characteristics.
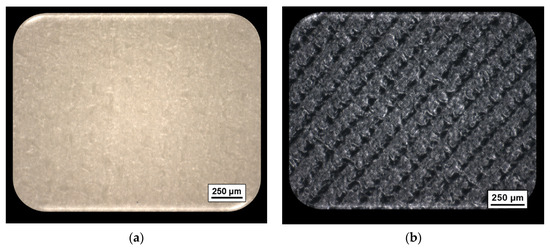
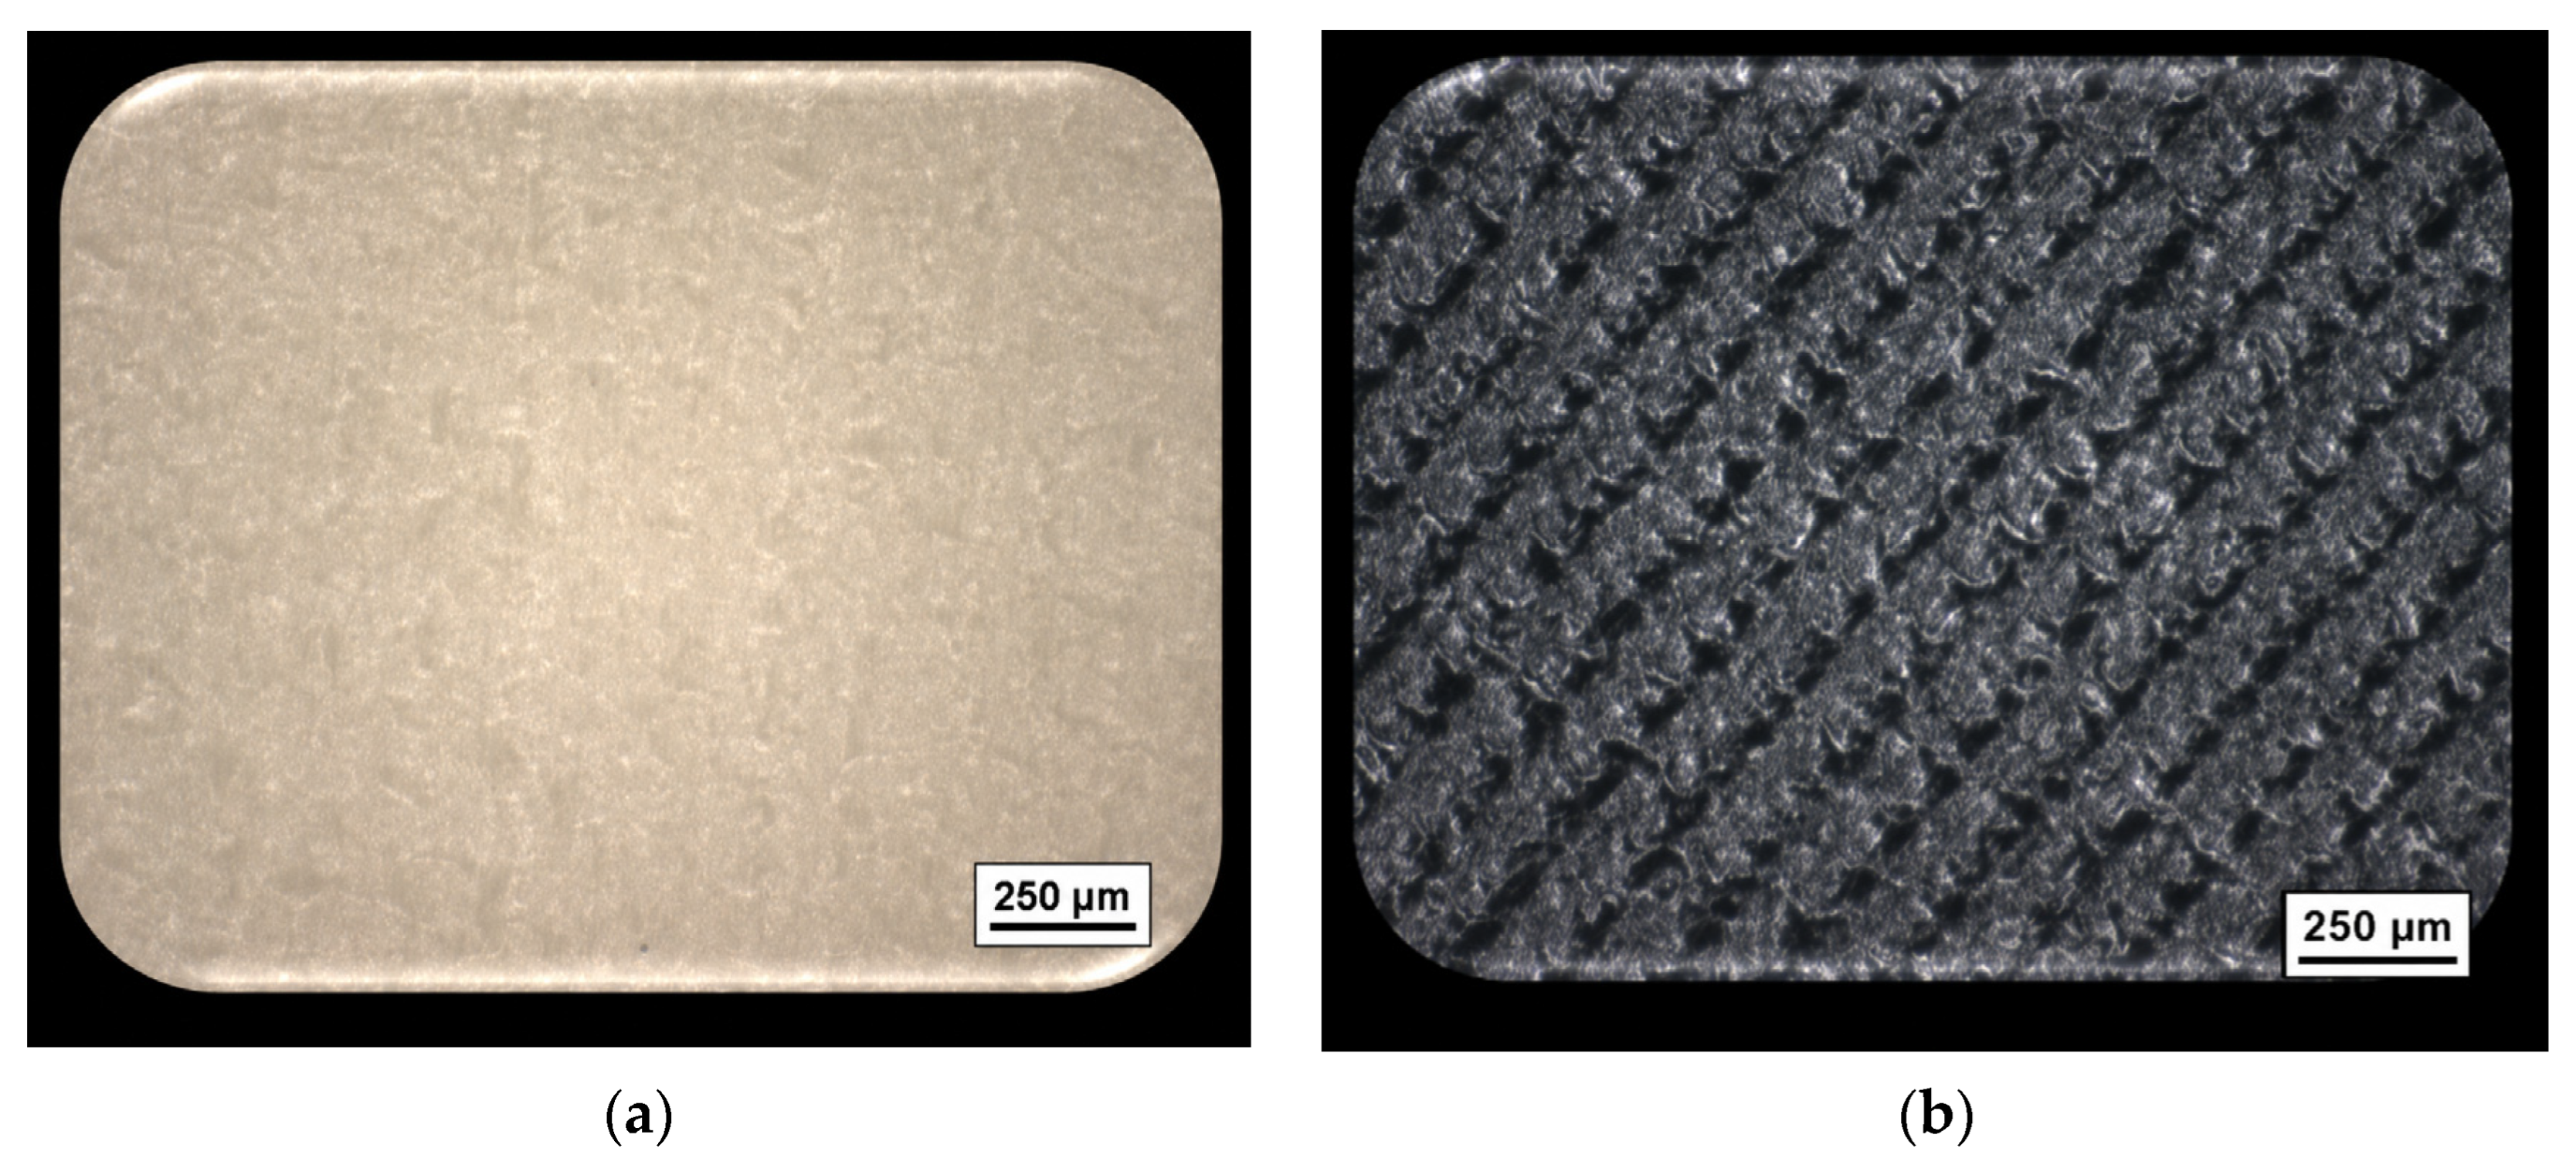
Both materials were obtained as extruded semi-finished PEEK stock. Figure 1 shows the surface appearance of the supplied bulk materials before machining of the ring-on-block test specimens. The specimens used for tribological testing were subsequently machined from this stock to the geometry described below. Neat PEEK exhibited a comparatively uniform natural-coloured surface, whereas hybrid PEEK showed a darker and visibly heterogeneous morphology associated with its multiphase composition. The row-like surface features visible in the hybrid material were already present on the supplied bulk material and were not produced during machining of the ring-on-block specimens. Their exact origin was not investigated in the present study. Because individual phases were not chemically identified, these images are described as surface morphology rather than material microstructure.
Figure 1.
Surface appearance of the supplied bulk PEEK materials before machining of the ring-on-block specimens, at 8× magnification: (a) neat PEEK; (b) hybrid PEEK.
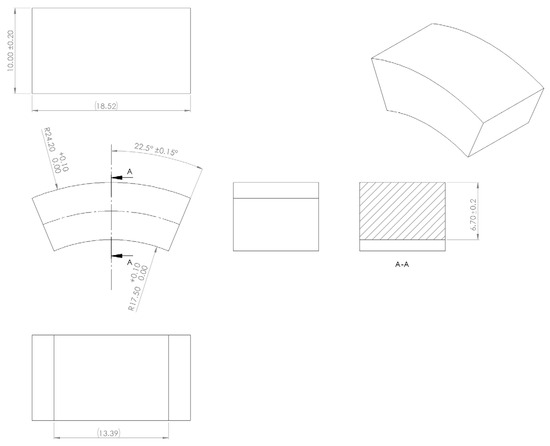
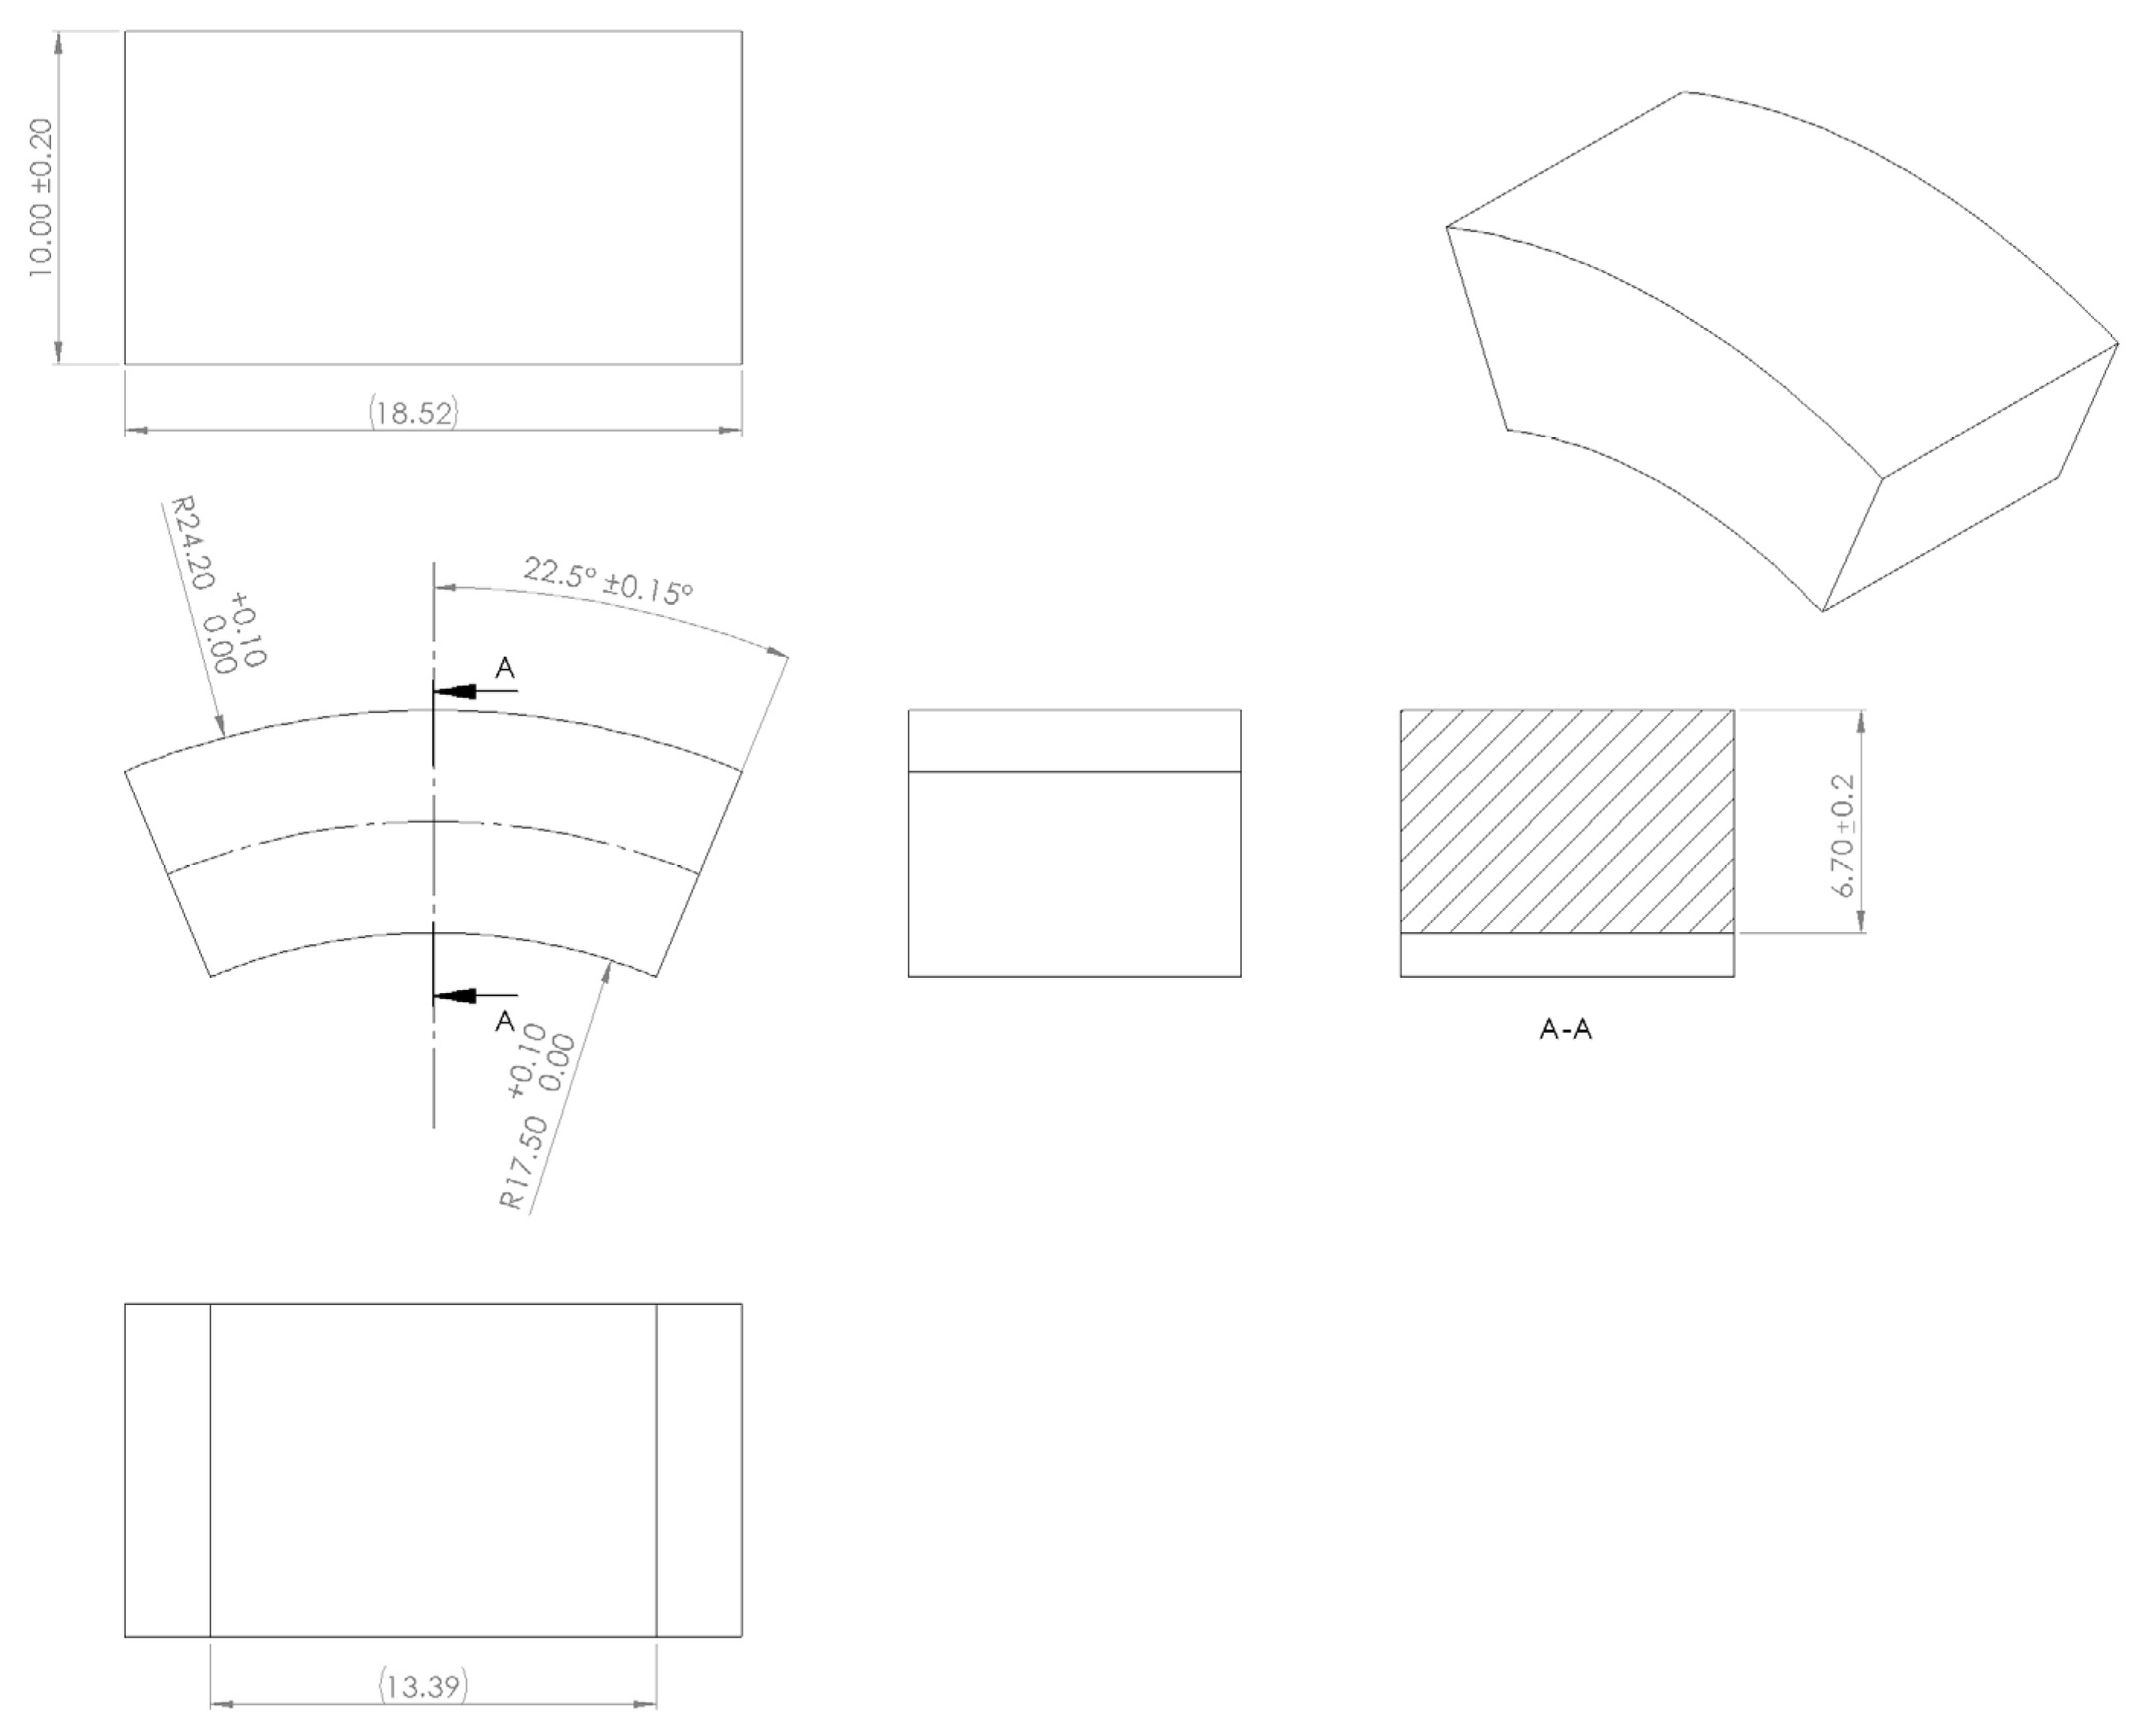
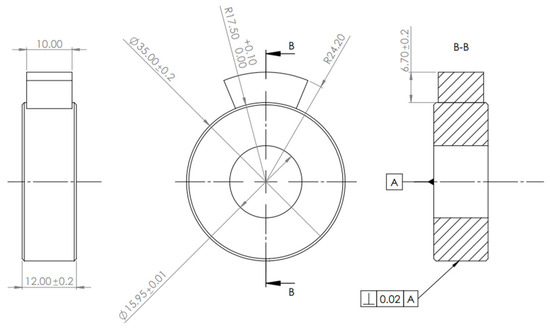
The specimens were machined from semi-finished stock into curved blocks suitable for the ring-on-block configuration. The contact surface was machined with a nominal concave radius of 17.5 mm to conform to the 35 mm outer diameter of the steel ring. The complete specimen dimensions and tolerances are presented in Figure 2. The PEEK blocks were manufactured from extruded rods using CNC turning and milling operations.
Figure 2.
Geometry of the machined PEEK specimen used for ring-on-block testing.
Before testing, the PEEK specimens were wiped with a clean, dry cloth to remove loose particles and visible contamination. No solvent or ultrasonic cleaning was applied.
2.2. 42CrMo4+QT Steel Counterface
The counterface was manufactured from quenched and tempered 42CrMo4+QT steel. Its mechanical properties and chemical composition are presented in Table 2 and Table 3.
Table 2.
Mechanical properties of the 42CrMo4+QT steel counterface.
Table 3.
Chemical composition of 42CrMo4+QT steel, wt.%.
The steel counterface was manufactured as a dedicated ring specimen following the general block-on-ring arrangement described in ASTM G77-17 (2022). This test configuration uses a stationary block loaded against a rotating ring and permits variation in load, rotational speed, lubrication, and material combination [20].
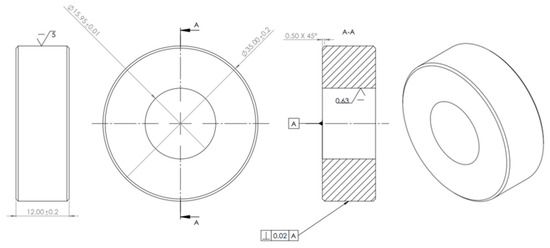
The ring had an outer diameter of 35.0 ± 0.2 mm and a width of 12.0 ± 0.2 mm. Its external radius matched the nominal concave radius of the PEEK specimen. The edges were chamfered by 0.50 mm at 45° and deburred to minimise unintended cutting and edge-loading effects. The steel rings were manufactured from steel rod by turning.
The sliding surface of each steel ring was prepared by turning operation. Across the 36 newly machined rings used for the confirmatory tests, the measured pre-test arithmetic mean roughness ranged from Ra = 4.80 to 5.69 µm, with an overall mean ± sample standard deviation of Ra = 5.35 ± 0.26 µm. The same machining procedure was applied to the rings used for comparative testing. The complete ring dimensions and tolerances are presented in Figure 3.
Figure 3.
Geometry of the machined 42CrMo4+QT steel ring used for ring-on-block testing.
2.3. Ring-on-Block Tribological Testing
2.3.1. Tribological Pair and Test Configuration
Tribological tests were performed using an SMC-2 tribometer in a ring-on-block configuration. A stationary neat or hybrid PEEK block was pressed against a rotating 42CrMo4+QT steel ring under a controlled normal load. The concave PEEK surface conformed to the external ring surface, producing a curved polymer–steel contact representative of a journal-bearing-type sliding interface [21]. The complete tribological-pair geometry is presented in Figure 4.
Figure 4.
Ring-on-block test configuration comprising a rotating 42CrMo4+QT steel ring and a stationary PEEK block.
The sliding velocity was calculated as:
where v is the sliding velocity in m/s, D is the external ring diameter in metres, and n is the rotational speed in rpm.
The angular velocity of the ring was calculated as:
where ω is the angular velocity in rad/s.
The nominal contact pressure was calculated as:
where p is the nominal contact pressure in MPa, FN is the applied normal load in N, and A0 is the nominal projected contact area in mm2.
Because the contact surfaces were conformal and curved, p represents a nominal engineering pressure rather than the maximum local contact pressure.
The pressure–velocity parameter was calculated as:
where PV is expressed in MPa·m/s.
The sliding distance was related to velocity and test duration as:
where L is the sliding distance in m and t is the test duration in s.
Friction was measured with the modified SMC-2 in its non-shaft configuration. The shaft-mounted torque transducer (T channel) was disabled. Tangential reaction force Ft,i was measured in the stationary-specimen reaction assembly using a SCAIME AG10F single-point load cell (AG10 C3, 10 kg rated capacity, SCAIME, Juvigny, France; manufacturer-specified combined error ± 0.017% of full scale), while the simultaneous normal force Fn,i was measured through the loading lever using a SCAIME ZFA tension/compression load cell (manufacturer-specified combined error ±0.03% of full scale). The acquisition software calculated the instantaneous coefficient of friction as μi = Ft,i/Fn,i. Both force channels were sampled at 4 ms intervals, and the acquisition software stored the mean of 500 consecutive samples, giving a nominal exported record interval of approximately 2.0 s. No additional numerical smoothing or filtering was applied after export. Thus, the COF channel was force-based and did not use either the rotating-ring radius or the configured passive-side radius. Friction measurements and reporting followed general principles of ASTM G77-17 (2022) and ASTM G115-24 [20,22].
Consequently, the nominal test duration was:
The force-based COF relation can be written equivalently as [23]:
where Ff,i is the measured tangential reaction force, μi is the instantaneous force ratio COF, and FN,i is the simultaneously measured normal force.
The auxiliary torque channel exported by the software was formed as [24]:
where Mi is the software-derived auxiliary torque and R = Rp = 27.8 mm is the configured passive-side radius. The 27.8 mm value was a software configuration parameter, not the radius of the PEEK specimen or steel ring, and it did not enter the calculation of μi. A numerical consistency check of the record showed that the exported T values satisfied Mi ≈ μiFN,iRp within the displayed rounding precision, confirming that the radius-dependent torque column was generated downstream from the force-ratio COF. Because Mi is only a deterministic transformation of Ff,i (or μi and FN,i) and the configured radius, the exported torque and any frictional power derived from it were excluded from the analysis and interpretation. More generally, the choice of friction-calculation method and the underlying system representation can influence the resulting friction estimate [25]. ASTM G115-24 identifies consistent measurement and reporting of friction coefficients as important for the comparability and long-term usefulness of tribological results [22]. Before the test program, each force channel was calibrated by applying known static loads over the intended working range and storing linear signal-to-force coefficients in the acquisition software. Immediately before each test, force-channel zero offsets were established. The working ranges encountered in this study were 60–400 N for normal force, approximately 3.1–51.2 N for tangential force, and 0.049–0.128 for specimen-level steady-state COF. The AG10F nominal capacity was 10 kg (approximately 98.1 N). The exported files stored normal force to 0.001 N and COF to five decimal places (increment 0.00001). These are digital output increments and must not be interpreted as transducer resolution or measurement accuracy. Between-specimen variability was characterised using the sample standard deviation and confidence intervals from three independent tests. These statistics do not represent the measurement uncertainty of the installed force-measurement chain.
2.3.2. Test Parameters and Experimental Programme
The normal load and rotational speed were selected to produce six nominal pressure–velocity conditions within the operating capability of the SMC-2 tribometer. Four conditions covered nominal pressures of 0.87–2.91 MPa and PV values of 0.3–1.3 MPa·m/s. Two additional conditions used an ±elevated nominal pressure of 5.82 MPa at sliding velocities of 0.26 and 0.55 m/s, producing PV values of 1.5 and 3.2 MPa·m/s, respectively.
Each material–condition combination was tested using three independently machined PEEK specimens. The experimental programme therefore comprised two materials, six operating conditions, and three independent repetitions per combination, giving a total of 36 dry sliding tests. Test parameters and repetition matrix are presented in Table 4.
Table 4.
Dry ring-on-block test parameters and repetition matrix.
2.3.3. Dry Sliding Conditions
All tests were performed under dry sliding conditions without intentional lubricant application. Before each test, the PEEK block and steel ring were wiped using a clean, dry cloth to remove loose particles and visible contamination. No solvent cleaning, ultrasonic cleaning, or lubricant application was used. The same specimen preparation procedure was applied to both materials and all operating conditions. A new ring was used for each test.
2.3.4. Subsurface Temperature Measurement
Subsurface temperature was measured using a thermocouple inserted into a blind hole drilled from the side of the PEEK specimen. The hole had a nominal diameter of 3 mm and extended approximately to the midpoint of the specimen width. The thermocouple measuring junction was positioned approximately 3 mm beneath the sliding surface.
The thermocouple remained in the hole throughout the complete test. Temperature was recorded continuously in real time together with the COF and normal-load signals. Testing was conducted under normal laboratory ambient conditions. The laboratory journal recorded from 18 to 22 °C and 48% relative humidity during the testing. The tribometer was not operated in a dedicated climatic chamber.
For every specimen, the baseline-normalised maximum subsurface temperature rise was defined as:
where Tmax,j is the maximum recorded subsurface temperature and T0,j is the initial temperature for specimen j.
For descriptive analysis of an available temperature time history, the mean steady-state subsurface temperature was calculated as:
where Ti,j is the measured subsurface temperature at data point i within the selected steady-state interval.
Where heating-rate analysis is required, the average rate of subsurface temperature increase up to the maximum measured temperature can be estimated as:
where βj is expressed in °C/s.
Equation (14) is preferable to dividing temperature rise by the complete test duration because the time at which the maximum temperature occurs may differ among specimens.
The measured temperature represents a subsurface specimen temperature rather than an instantaneous flash temperature at the sliding interface.
2.3.5. Mass-Change Measurement
The PEEK specimens were weighed before and after testing using a KERN EG 420-3NM precision balance (KERN & SOHN GmbH, Balingen, Germany) with a readability of 0.001 g and stated linearity of ± 0.003 g.
Before weighing, specimens were wiped with a clean, dry cloth to remove loose particles and visible contamination. No solvent cleaning, ultrasonic cleaning, or elevated-temperature drying was applied.
Mass change was calculated as:
where m0,j and m1,j are the specimen masses before and after testing, respectively.
The relative mass change can be expressed as:
Because the observed mass changes were comparable with the stated balance linearity, gravimetric results were treated as supporting observations and were not used to calculate specific wear rates.
2.4. Optical and Extended Depth-of-Field Surface Characterisation
The initial and worn PEEK surfaces were examined using a Nikon DS-Ri2 digital camera mounted on a Nikon Eclipse LV100ND optical microscope (Nikon Europe B.V., Amstelveen, The Netherlands). Images were acquired at nominal magnifications of 8× and 10×.
Because the sliding surfaces were curved and exhibited local height variation, image stacks were acquired at different focal positions and combined using the extended depth-of-field method. This produced images in which surface regions at different heights remained simultaneously in focus.
The images were used to evaluate:
- Initial optical heterogeneity;
- Direction surface grooves;
- Grooves and depressions;
- Comparatively smooth regions;
- Local height variation;
- Other visible topographical changes.
Three-dimensional surface reconstructions and profile plots were generated from the extended depth-of-field image stacks where suitable data were available.
No elemental or chemical mapping was performed. Individual optical features were therefore not definitively assigned to graphite, PTFE, or carbon fibre solely from their appearance.
The EDF images were not used to identify wear debris, transferred material, or transfer films, and the steel counterfaces were not characterised after testing.
2.5. Data Processing and Statistical Analysis
2.5.1. Steady-State Interval
The recorded COF and temperature curves were inspected to distinguish the initial running-in stage from the subsequent stable sliding stage. For consistency, the steady-state interval was defined as the final 20% of the valid recorded sliding distance for each test.
Before averaging, each curve was inspected to confirm that this interval did not contain an abrupt transition, continuing systematic drift, test termination, or another non-steady event. Shutdown and post-test cooling portions were excluded.
2.5.2. Specimen-Level Mean Values
For each individual specimen j, the mean steady-state coefficient of friction was calculated as:
where μi,j is the instantaneous COF at data point i.
The arithmetic mean in Equation (14) is appropriate because the force-ratio COF samples were recorded at a uniform interval. Each specimen-level mean was calculated directly from the COF channel; torque and frictional power were not analysed.
Each specimen-level value represented one independent experimental result. The real-time points within a single test were not treated as independent repetitions.
2.5.3. Group Mean and Variability
For each combination of material and operating condition, three independent specimen-level values were available.
The group mean was calculated as:
where Xj represents the specimen-level value of COF, temperature, or temperature rise.
The sample standard deviation was calculated as:
and the coefficient of variation was calculated as:
The standard error of the mean was calculated as:
The two-sided 95% confidence interval for the group mean was calculated as:
For n = 3, the degrees of freedom are n − 1 = 2, and the corresponding t-multiplier is approximately 4.303. Consequently, confidence intervals will be relatively wide for tribology results.
Results are reported as:
with 95% confidence intervals included in the figures or Supplementary tables where appropriate.
2.5.4. Relative Difference Between Hybrid and Neat PEEK
For each operating condition, the relative difference between hybrid and neat PEEK was calculated as:
where XH and XN are the group means for hybrid and neat PEEK, respectively.
A positive value indicates that hybrid PEEK produced a higher response, whereas a negative value indicates a lower response.
This equation was used to report percentage differences in steady-state COF and maximum subsurface temperature rise.
2.5.5. Two-Factor Statistical Analysis
The effects of material and operating condition on steady-state COF were evaluated using a two-factor fixed-effects analysis of variance (ANOVA) [26]. Material was treated as a categorical factor with two levels (neat PEEK and hybrid PEEK), while operating condition was treated as a categorical factor with six levels corresponding to the investigated pressure–velocity combinations. Three independent specimen-level steady-state COF values were available for each material–condition combination (n = 3). Operating condition was treated as a categorical factor because pressure and sliding velocity changed simultaneously among the six conditions and were not varied independently in a full factorial arrangement. Temperature variables were not included in this inferential model; T0, Tmax, and ΔT were reported for every specimen and summarised descriptively as mean ± sample standard deviation for each material–condition combination.
The COF analysis used the 36 unrounded specimen-level steady-state means retained to five or six decimal places. All 36 planned confirmatory COF observations were included, and no statistical exclusions were applied. The temperature dataset likewise contained T0 and Tmax for all 36 specimens; ΔT was calculated as Tmax − T0 without imputation and analysed descriptively. Preliminary pilot pairs used only to observe machine and configuration behaviour were defined before the confirmatory programme and were not part of the 36-test analytical dataset. Complete specimen-level COF, T0, Tmax, and ΔT values are provided in Supplementary File S1. Specimen identifiers followed the format PV number_PEEK type_repetition number. Tests were performed sequentially in the prepared specimen series; no formal randomisation or blocking was used. Each independent PEEK block was tested against its own newly machined steel ring to prevent carry-over of transferred film between tests.
Consequently, the present experimental design does not permit the independent effects of pressure and sliding velocity, or their interaction, to be estimated, and no attempt was made to model these effects separately:
where Yijk is the specimen-level steady-state COF for repetition k, μ0 is the overall mean, Mi is the effect of material i, Cj is the effect of operating condition j, (MC)ij is the material × operating condition interaction effect, and εijk is the residual error.
Planned COF comparisons between neat PEEK and hybrid PEEK were performed separately for each operating condition. The six resulting p-values were adjusted using the Holm method. Statistical significance was defined as p < 0.05, and effect magnitude for the COF ANOVA terms was quantified using partial eta squared ().
The magnitude of each ANOVA effect can be expressed using partial eta squared [27]:
where SSeffect is the sum of squares associated with the evaluated effect and SSerror is the corresponding residual sum of squares.
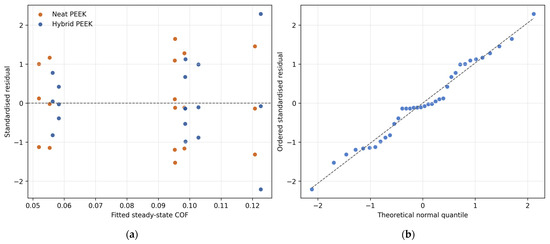
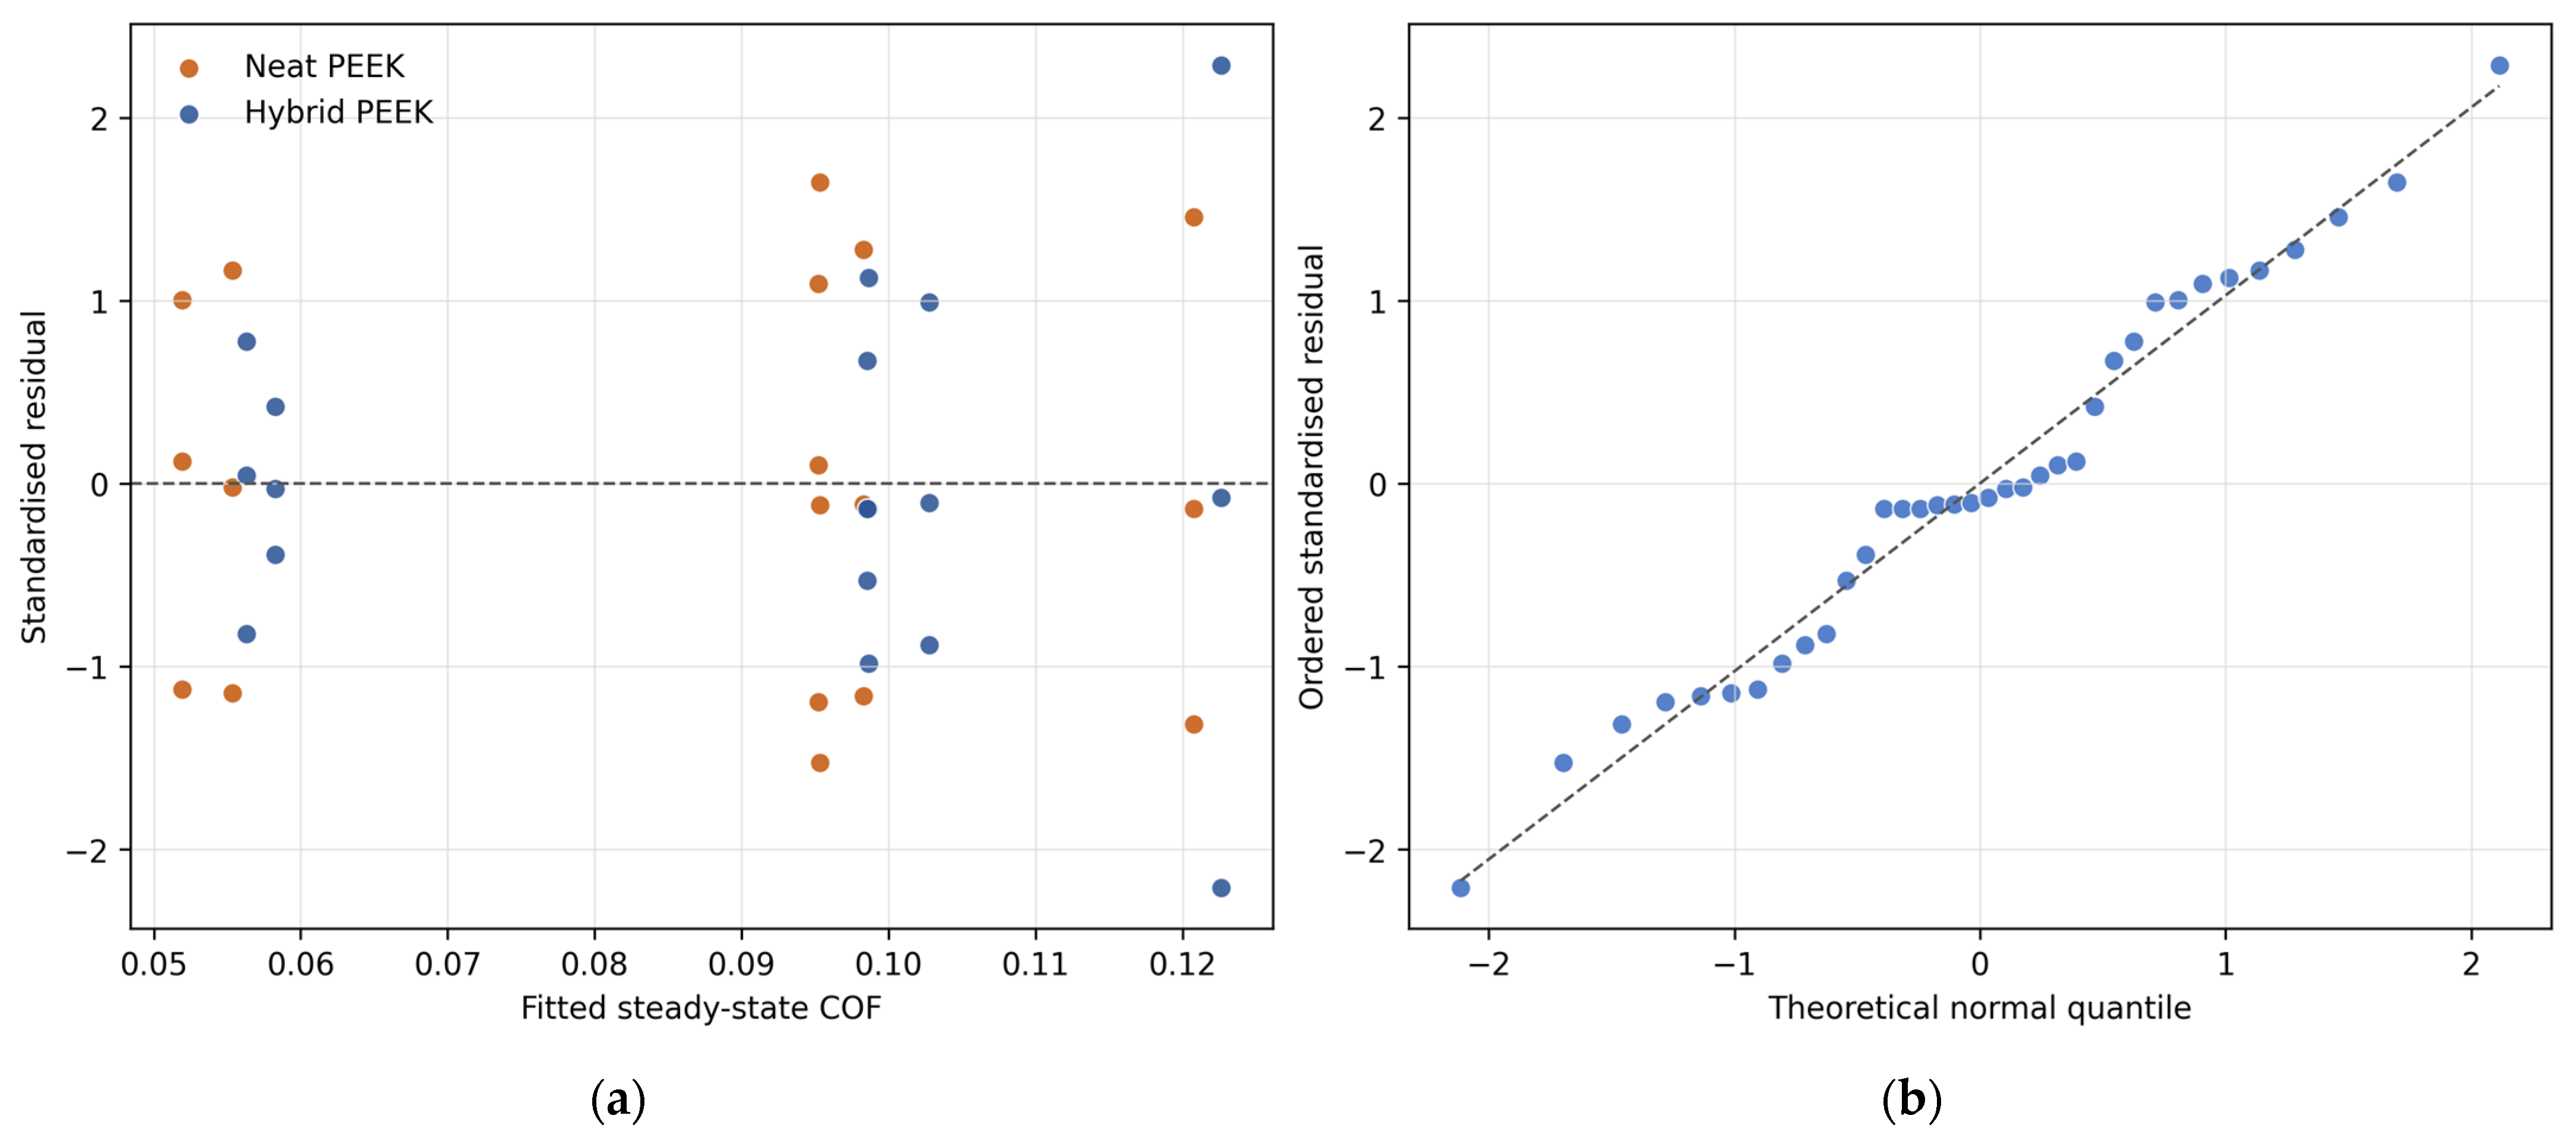
Residual normality and variance behaviour were assessed graphically using quantile–quantile and residual versus fitted plots. Because only three independent repetitions were available per material–condition combination, formal assumption tests were not interpreted in isolation.
3. Results
3.1. Overview of the Dry Sliding Results
The dry ring-on-block test programme covered nominal PV values from 0.3 to 3.2 MPa·m/s, contact pressures from 0.87 to 5.82 MPa, and sliding velocities from 0.26 to 0.55 m/s. The steady-state COF and maximum subsurface temperature values obtained from the three independent tests for each material–condition combination are presented in Table 5 and Table 6. Initial temperatures and baseline-normalised rises for every specimen are provided in Supplementary File S1.
Table 5.
Dry ring-on-block steady-state COF results from three independent tests for each material–condition combination within the investigated PV range.
Table 6.
Dry ring-on-block maximum temperature results from three independent tests for each material–condition combination within the investigated PV range.
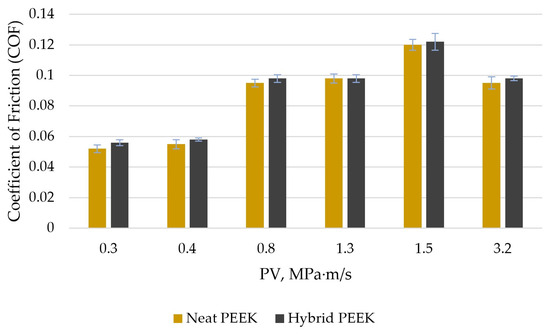
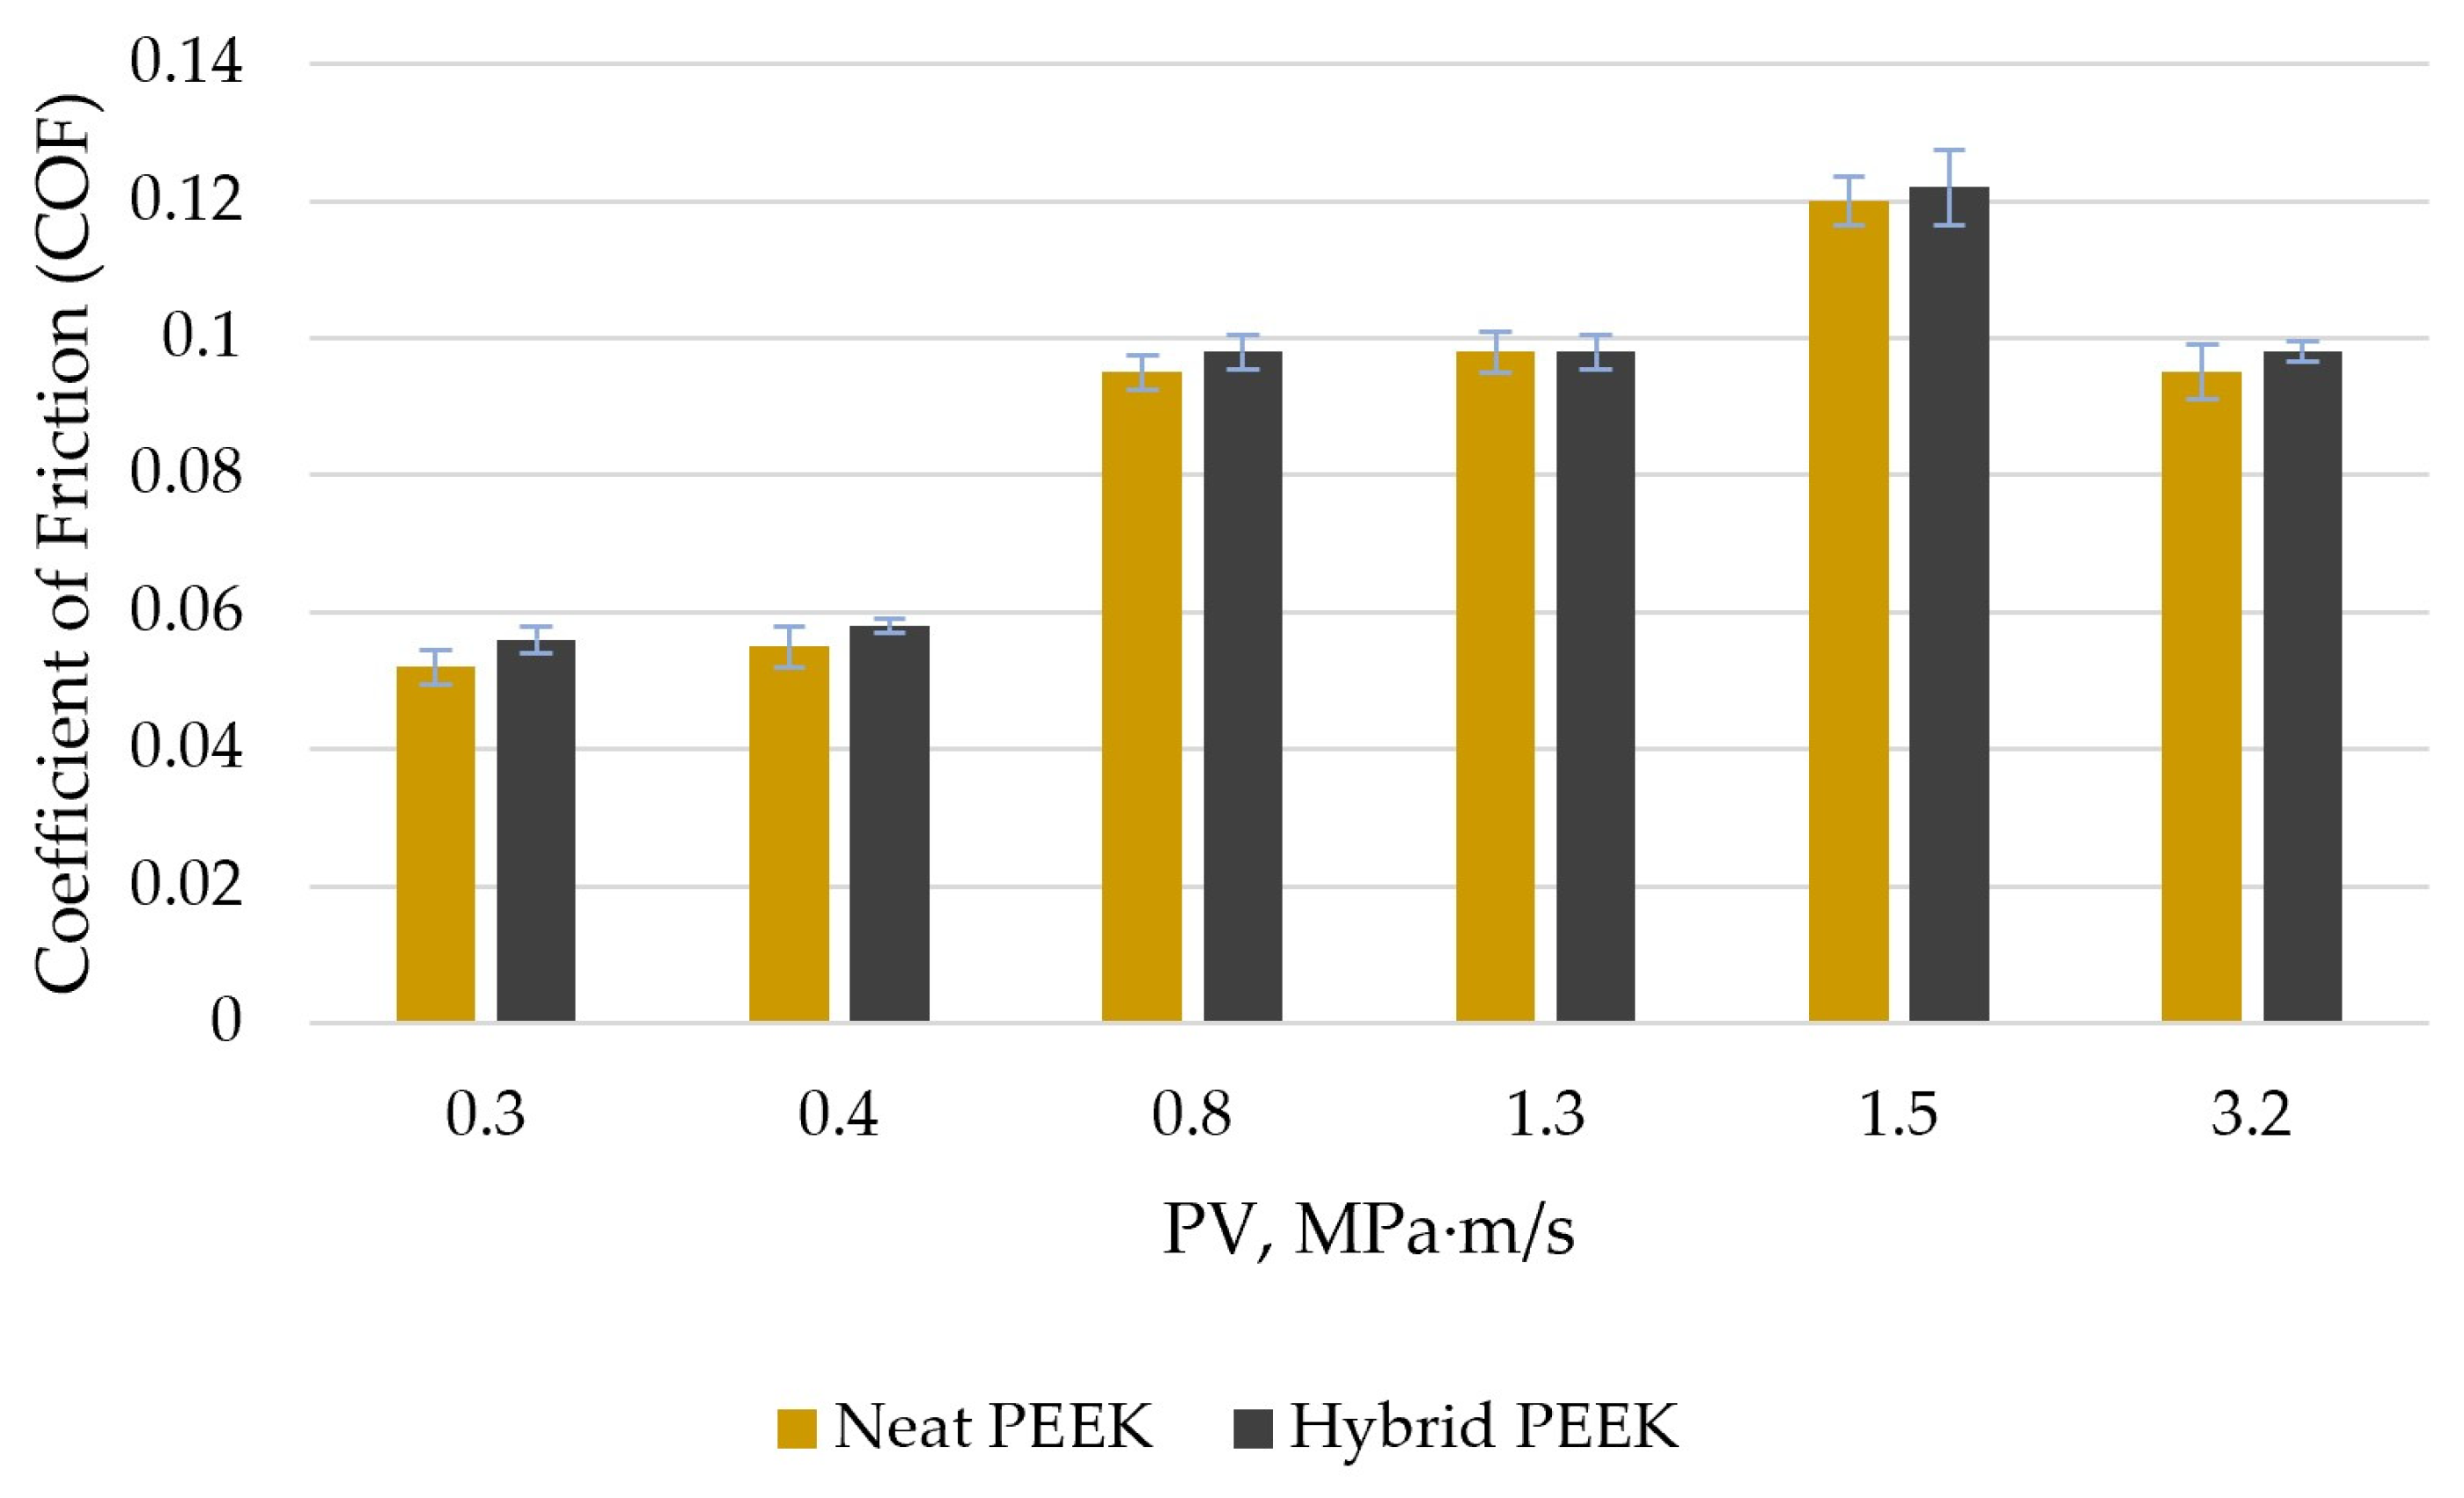
The unrounded group mean steady-state COF values ranged from 0.051958 to 0.122637. The lowest group mean was obtained for neat PEEK at PV = 0.3 MPa·m/s, whereas the highest was obtained for hybrid PEEK at PV = 1.5 MPa·m/s. Hybrid PEEK exhibited a higher numerical group mean COF than neat PEEK in all six operating conditions. Based on the unrounded group means, the relative differences ranged from approximately 1.53% to 8.36%.
The group mean absolute maximum subsurface temperatures ranged from 21.8 to 36.0 °C (Table 6). Starting temperatures differed among specimens and conditions; consequently, Tmax was not interpreted alone as a material–condition response. Initial temperatures, Tmax values, and baseline-normalised rises for all 36 specimens are provided in Supplementary File S1, with condition-level descriptive summaries in Table 9.
3.2. Initial Surface Morphology
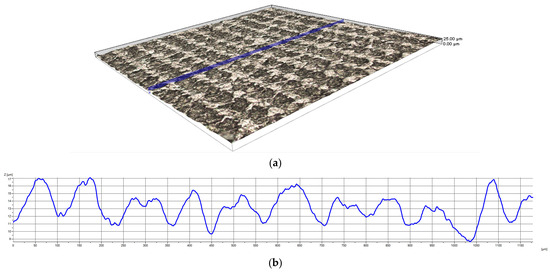
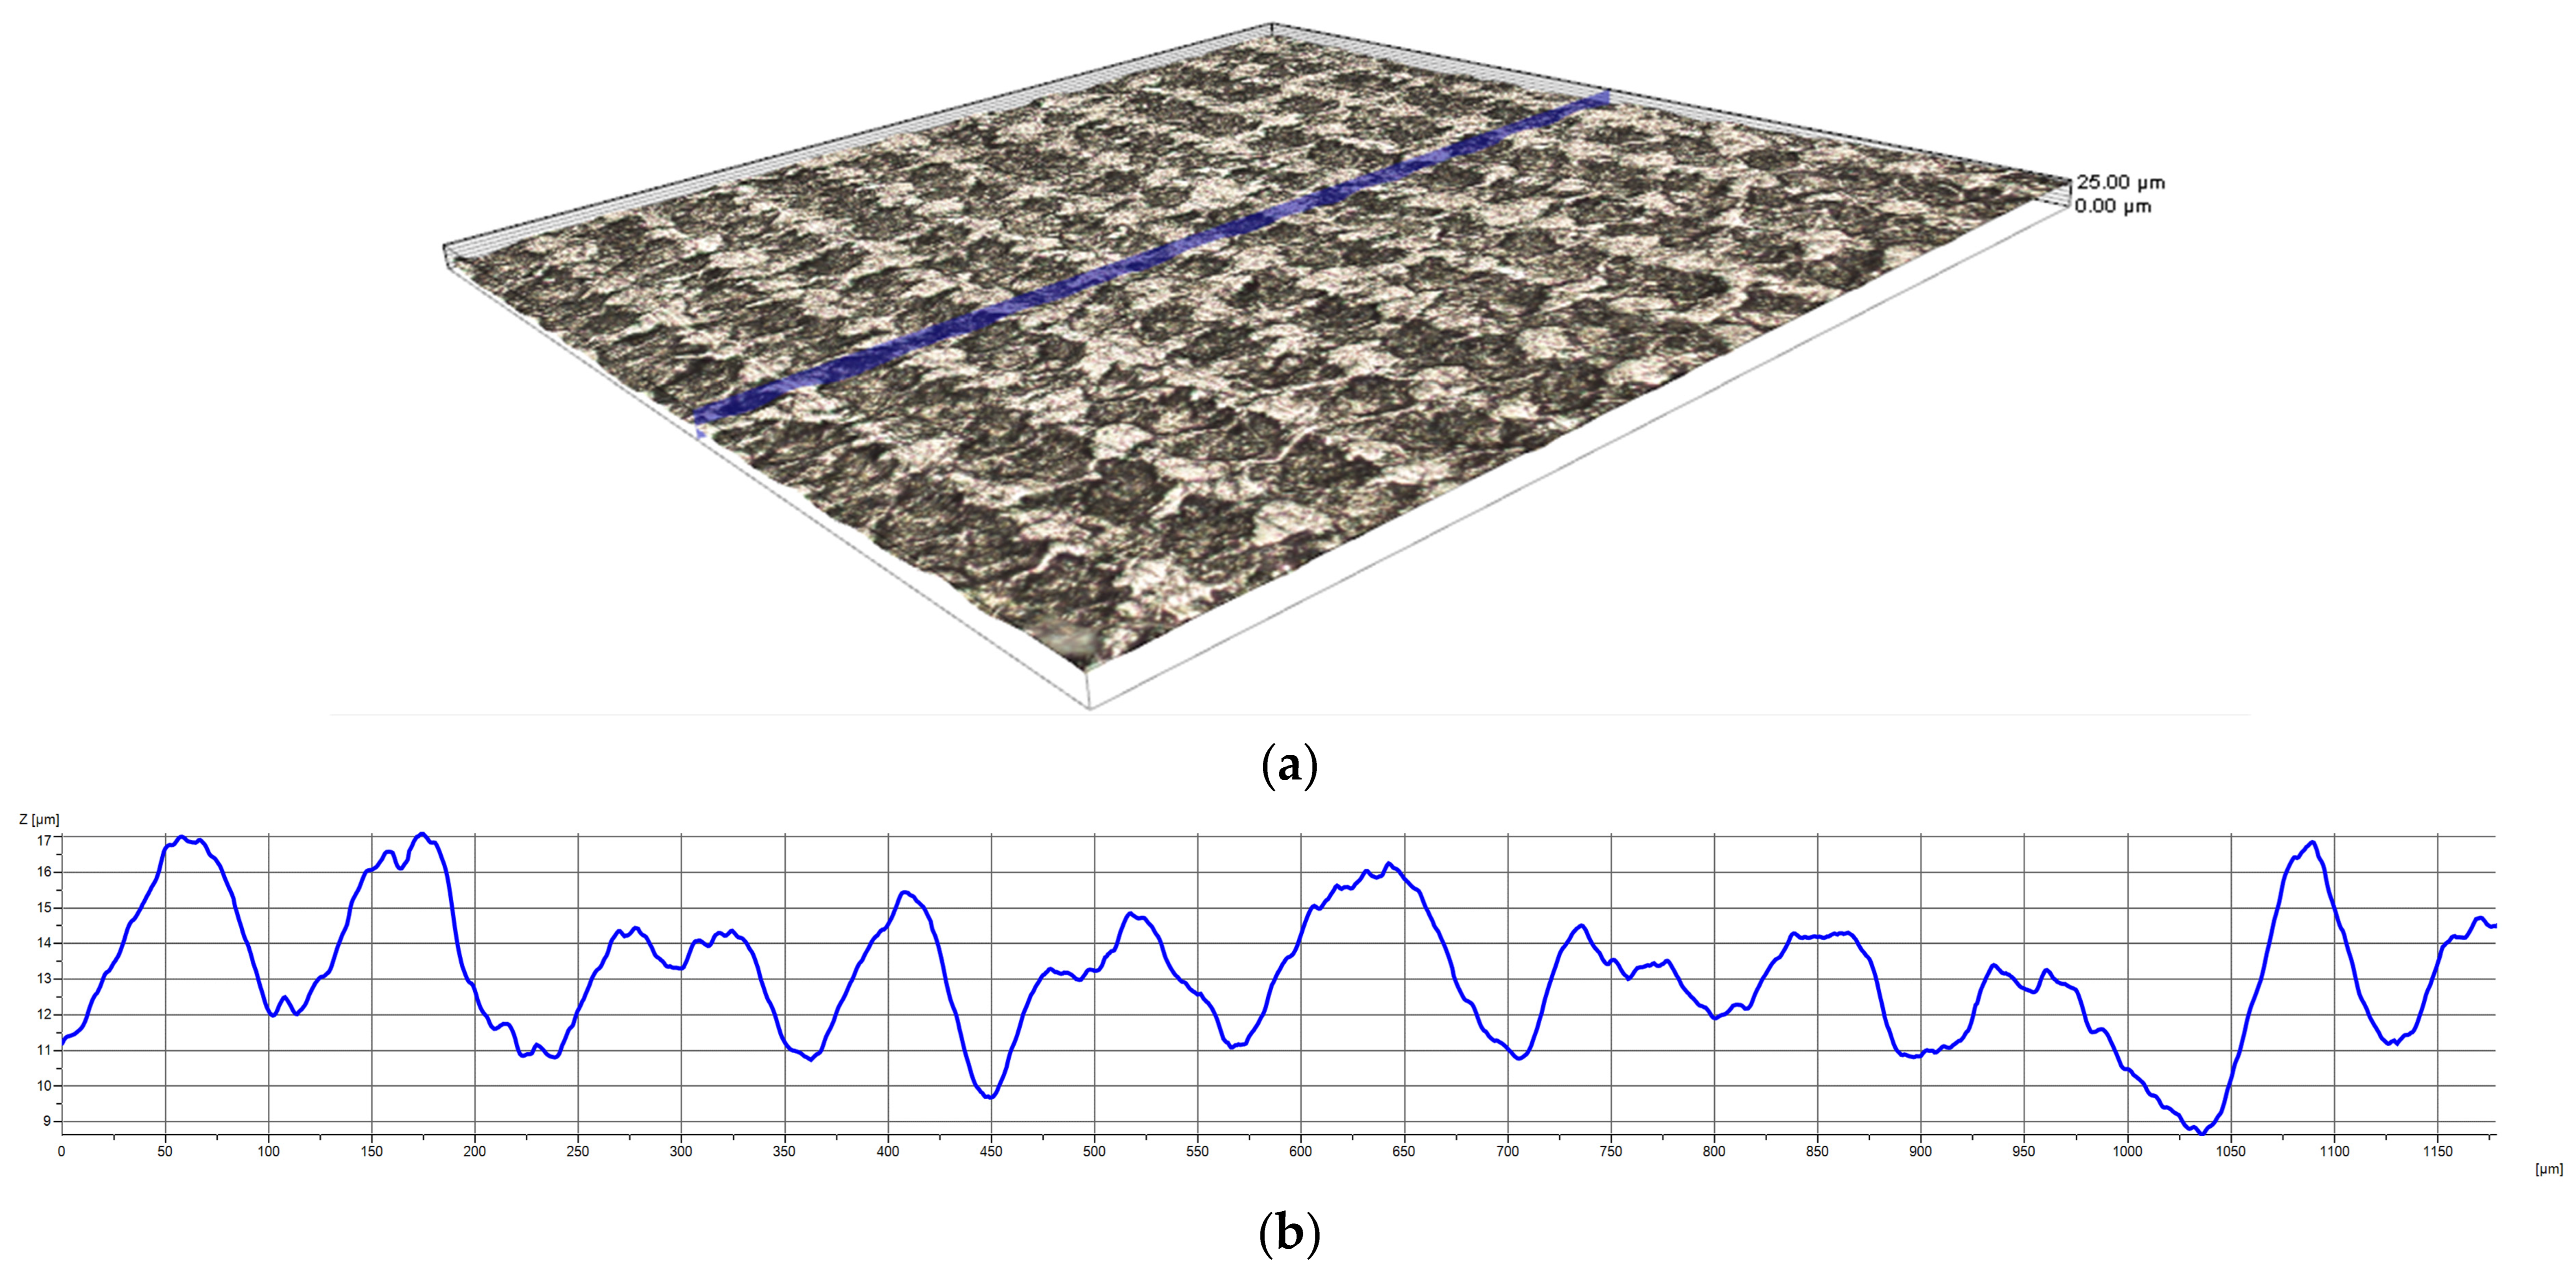
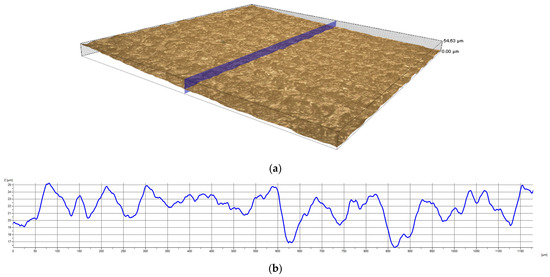
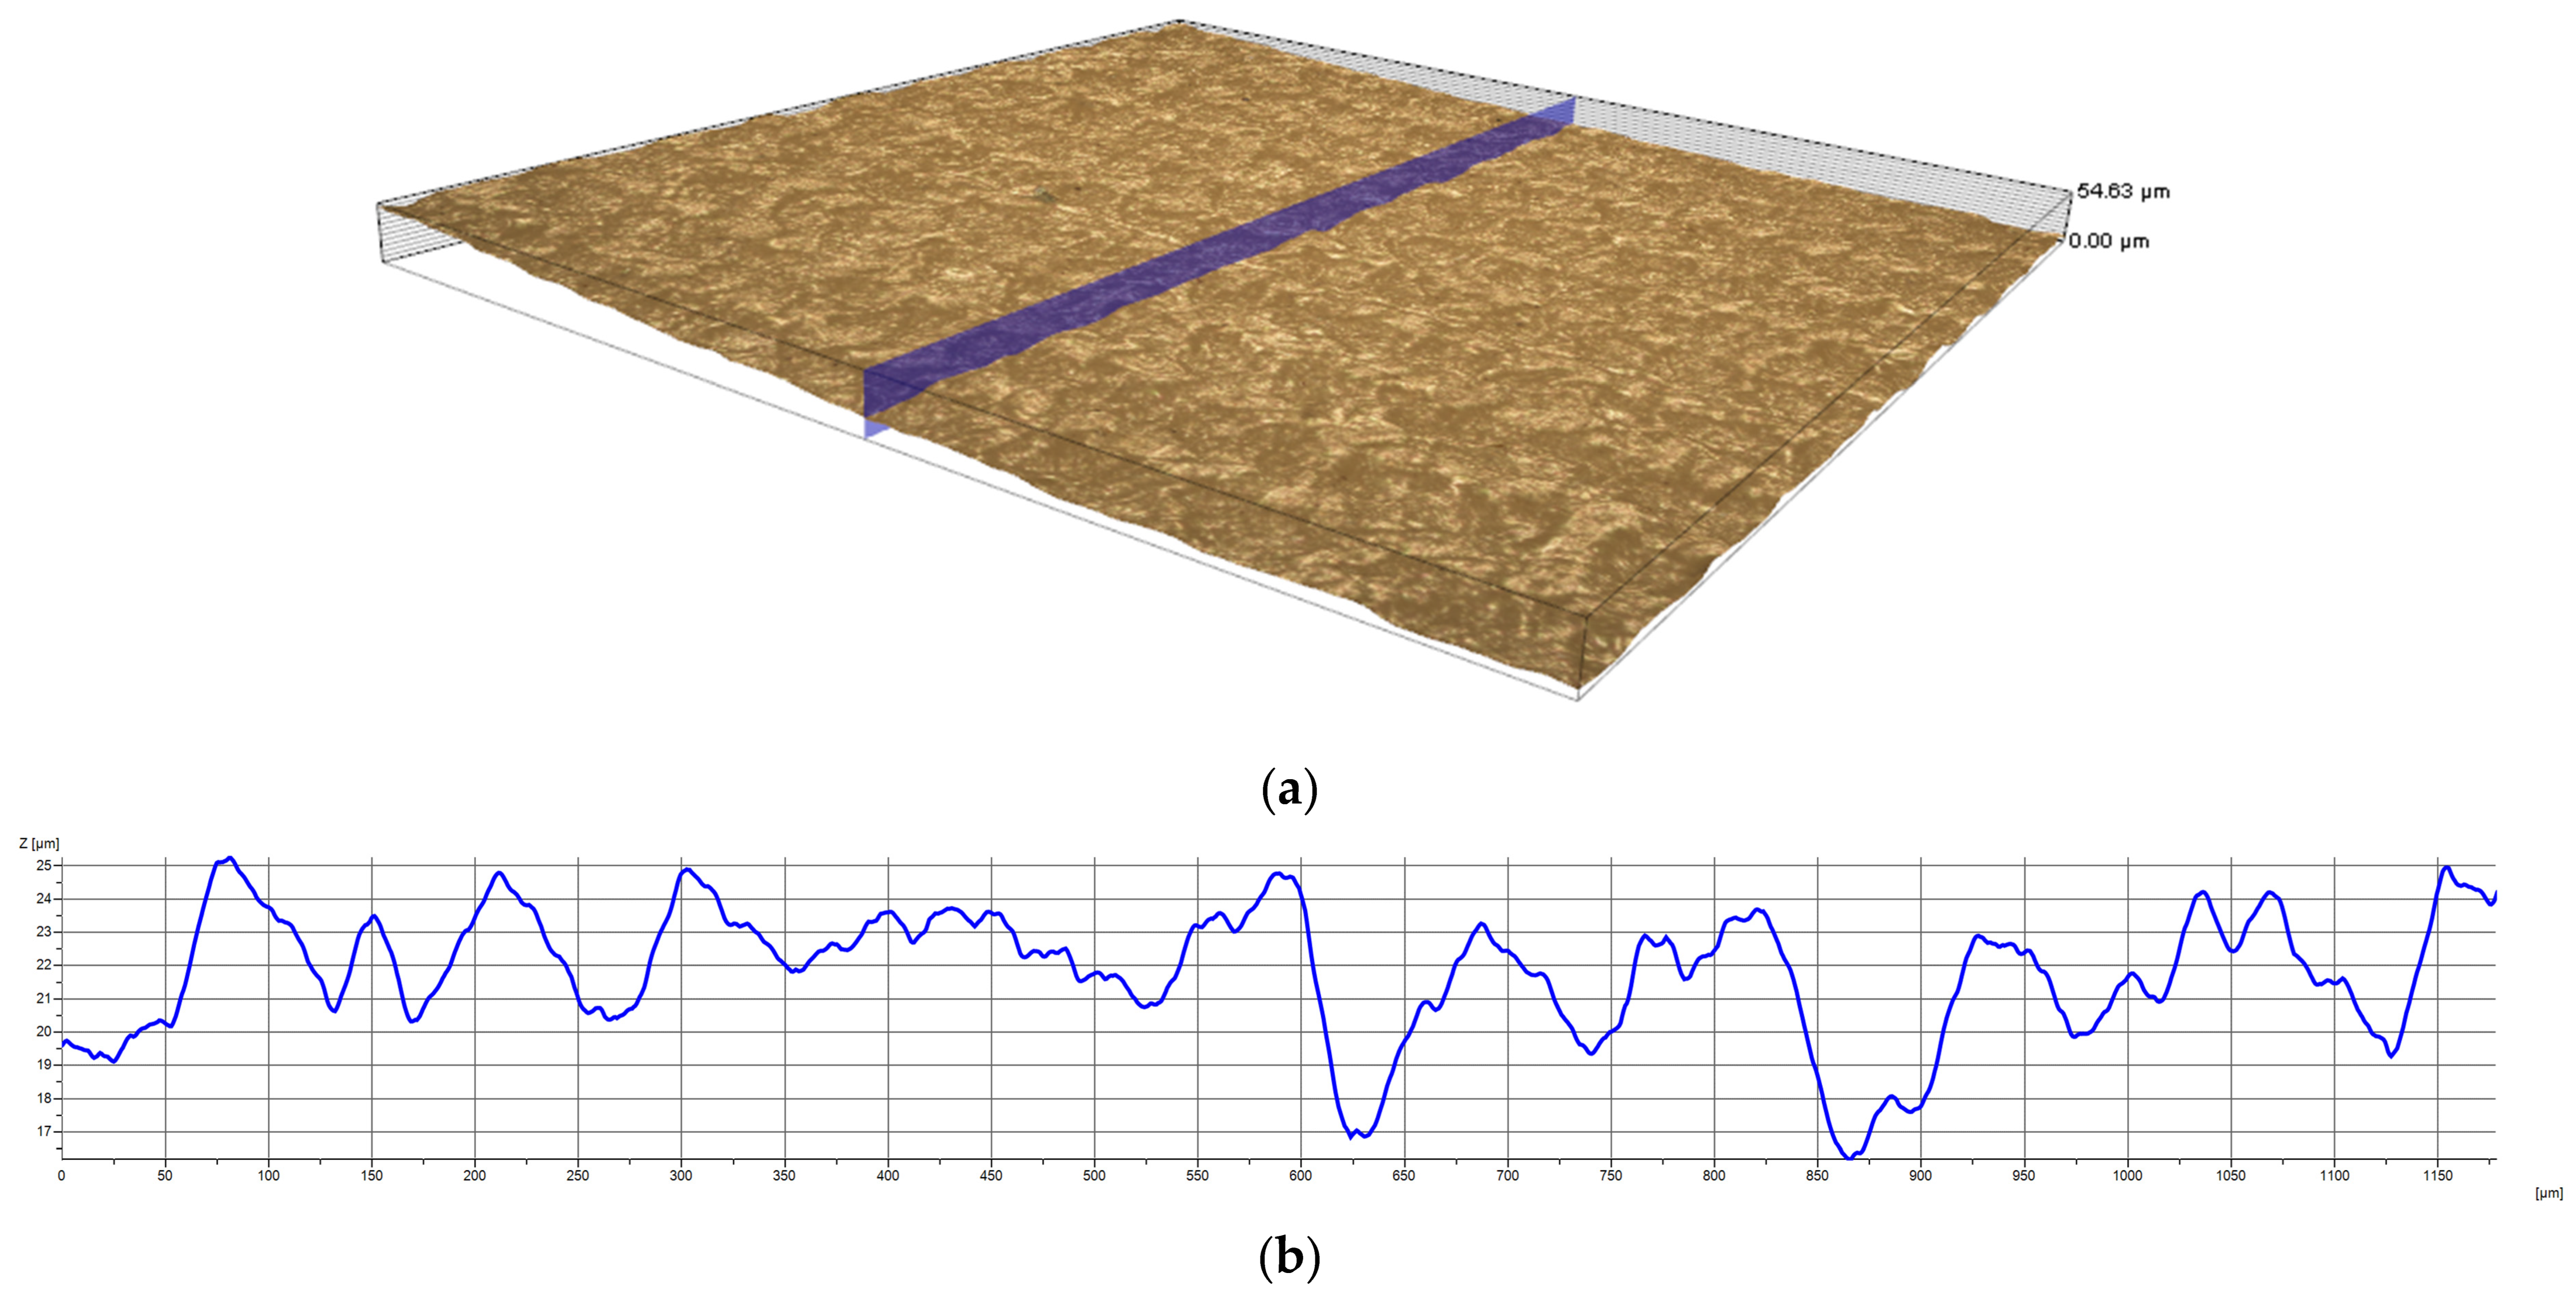
Before tribological testing, neat and hybrid PEEK exhibited distinctly different optical surface morphologies. Hybrid PEEK showed a heterogeneous, high-contrast surface containing irregularly distributed light and dark regions, whereas neat PEEK appeared comparatively uniform over the same observation area, as shown in Figure 5 and Figure 6.
Figure 5.
Initial surface topography of hybrid PEEK after turning operation: (a) 3D EDF reconstruction, with the blue line indicating the path used for profile extraction; (b) corresponding transverse surface profile extracted along the blue line shown in (a).
Figure 6.
Initial surface topography of neat PEEK after turning operation: (a) 3D EDF reconstruction, with the blue line indicating the path used for profile extraction; (b) corresponding transverse surface profile extracted along the blue line shown in (a).
The 3D EDF reconstruction of hybrid PEEK showed an undulating surface with an approximate peak-to-valley height variation of 8–9 µm along the selected transverse profile, as presented in Figure 5. This selected-path range describes local height variation and surface pattern. No deep isolated defects, cracking, or extensive pre-test material pull-out were visible.
The neat PEEK surface showed a more visually homogeneous but continuously undulating profile, as presented in Figure 6. The approximate peak-to-valley variation was 10–11 µm.
The selected profiles showed local peak-to-valley height variations of the same order, whereas hybrid PEEK displayed considerably greater optical heterogeneity. Therefore, the initial comparison is restricted to local height variation, optical heterogeneity, and the spatial pattern of the selected profiles.
3.3. Coefficient of Friction Under Dry Sliding
3.3.1. Response Across the Investigated Conditions
The mean steady-state dry sliding COF values calculated from the unrounded results of three independent tests are presented in Figure 7. Hybrid PEEK exhibited a higher numerical mean COF than neat PEEK in all six operating conditions. The largest relative difference between the group means occurred at PV = 0.3 MPa·m/s (8.36%), whereas the smallest occurred at PV = 1.5 MPa·m/s (1.53%).
Figure 7.
Mean steady-state dry sliding coefficient of friction of neat and hybrid PEEK under the investigated operating conditions. Error bars indicate the sample standard deviation of three independent tests (n = 3).
For both materials, the mean COF increased from the lower-severity conditions at PV = 0.3–0.4 MPa·m/s to the conditions at PV = 0.8–1.5 MPa·m/s. The highest mean COF was recorded at PV = 1.5 MPa·m/s, where the unrounded group means were 0.120787 for neat PEEK and 0.122637 for hybrid PEEK. At PV = 3.2 MPa·m/s, the corresponding mean values decreased to 0.095311 and 0.098570, respectively.
The two-factor fixed-effects ANOVA results are presented in Table 7. Significant effects of material (F(1,24) = 11.00, p = 0.0029) and operating condition (F(5,24) = 456.51, p < 0.001) were identified, whereas the material × operating condition interaction was not significant (F(5,24) = 0.149, p = 0.978). The effect magnitude associated with operating condition was substantially greater than that associated with materials. The residual-versus-fitted and normal quantile-quantile plots in Figure 8 show no pronounced systematic pattern or marked departure from approximate normality.
Table 7.
Two-factor fixed-effects ANOVA for steady-state COF.
Figure 8.
Residual diagnostics for the two-factor fixed-effects ANOVA based on unrounded specimen-level COF values: (a) standardised residuals versus fitted COF values; (b) normal Q–Q plot of the standardised residuals. Orange markers represent neat PEEK, and blue markers represent hybrid PEEK; dashed lines indicate the zero-residual and fitted normal-reference lines, respectively.
The estimated marginal mean COF was 0.086149 for neat PEEK and 0.089536 for hybrid PEEK. The overall hybrid-minus-neat difference was +0.003388 COF units (95% CI 0.001279–0.005496), corresponding to 3.93% of the neat PEEK marginal mean. This is an overall model-based contrast across the six operating conditions and is not evidence of a significant material difference in each individual condition.
Planned comparisons between neat and hybrid PEEK were performed separately for each operating condition. The results are presented in Table 8. Although the mean COF of hybrid PEEK was numerically higher in all six conditions, none of the individual neat–hybrid comparisons reached statistical significance after Holm correction for multiple comparisons.
Table 8.
Comparisons of steady-state COF between neat and hybrid PEEK in each operating condition.
Thus, although the two-factor fixed-effects ANOVA identified a statistically significant overall material effect and hybrid PEEK exhibited a higher numerical mean COF in all six operating conditions, none of the condition-specific neat–hybrid differences were statistically significant after Holm correction. The statistical results therefore support an overall material-related difference across the experimental programme, without demonstrating a significant neat–hybrid difference in any single operating condition.
3.3.2. Representative Response at PV = 0.8 MPa·m/s
At PV = 0.8 MPa·m/s, the unrounded group mean COF was 0.095217 for neat PEEK and 0.098670 for hybrid PEEK, corresponding to a 3.63% difference.
The direct material comparison was performed at:
p = 1.75 MPa, v = 0.46 m/s, PV = 0.8 MPa⋅m/s.
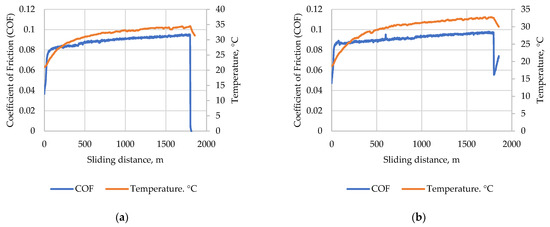
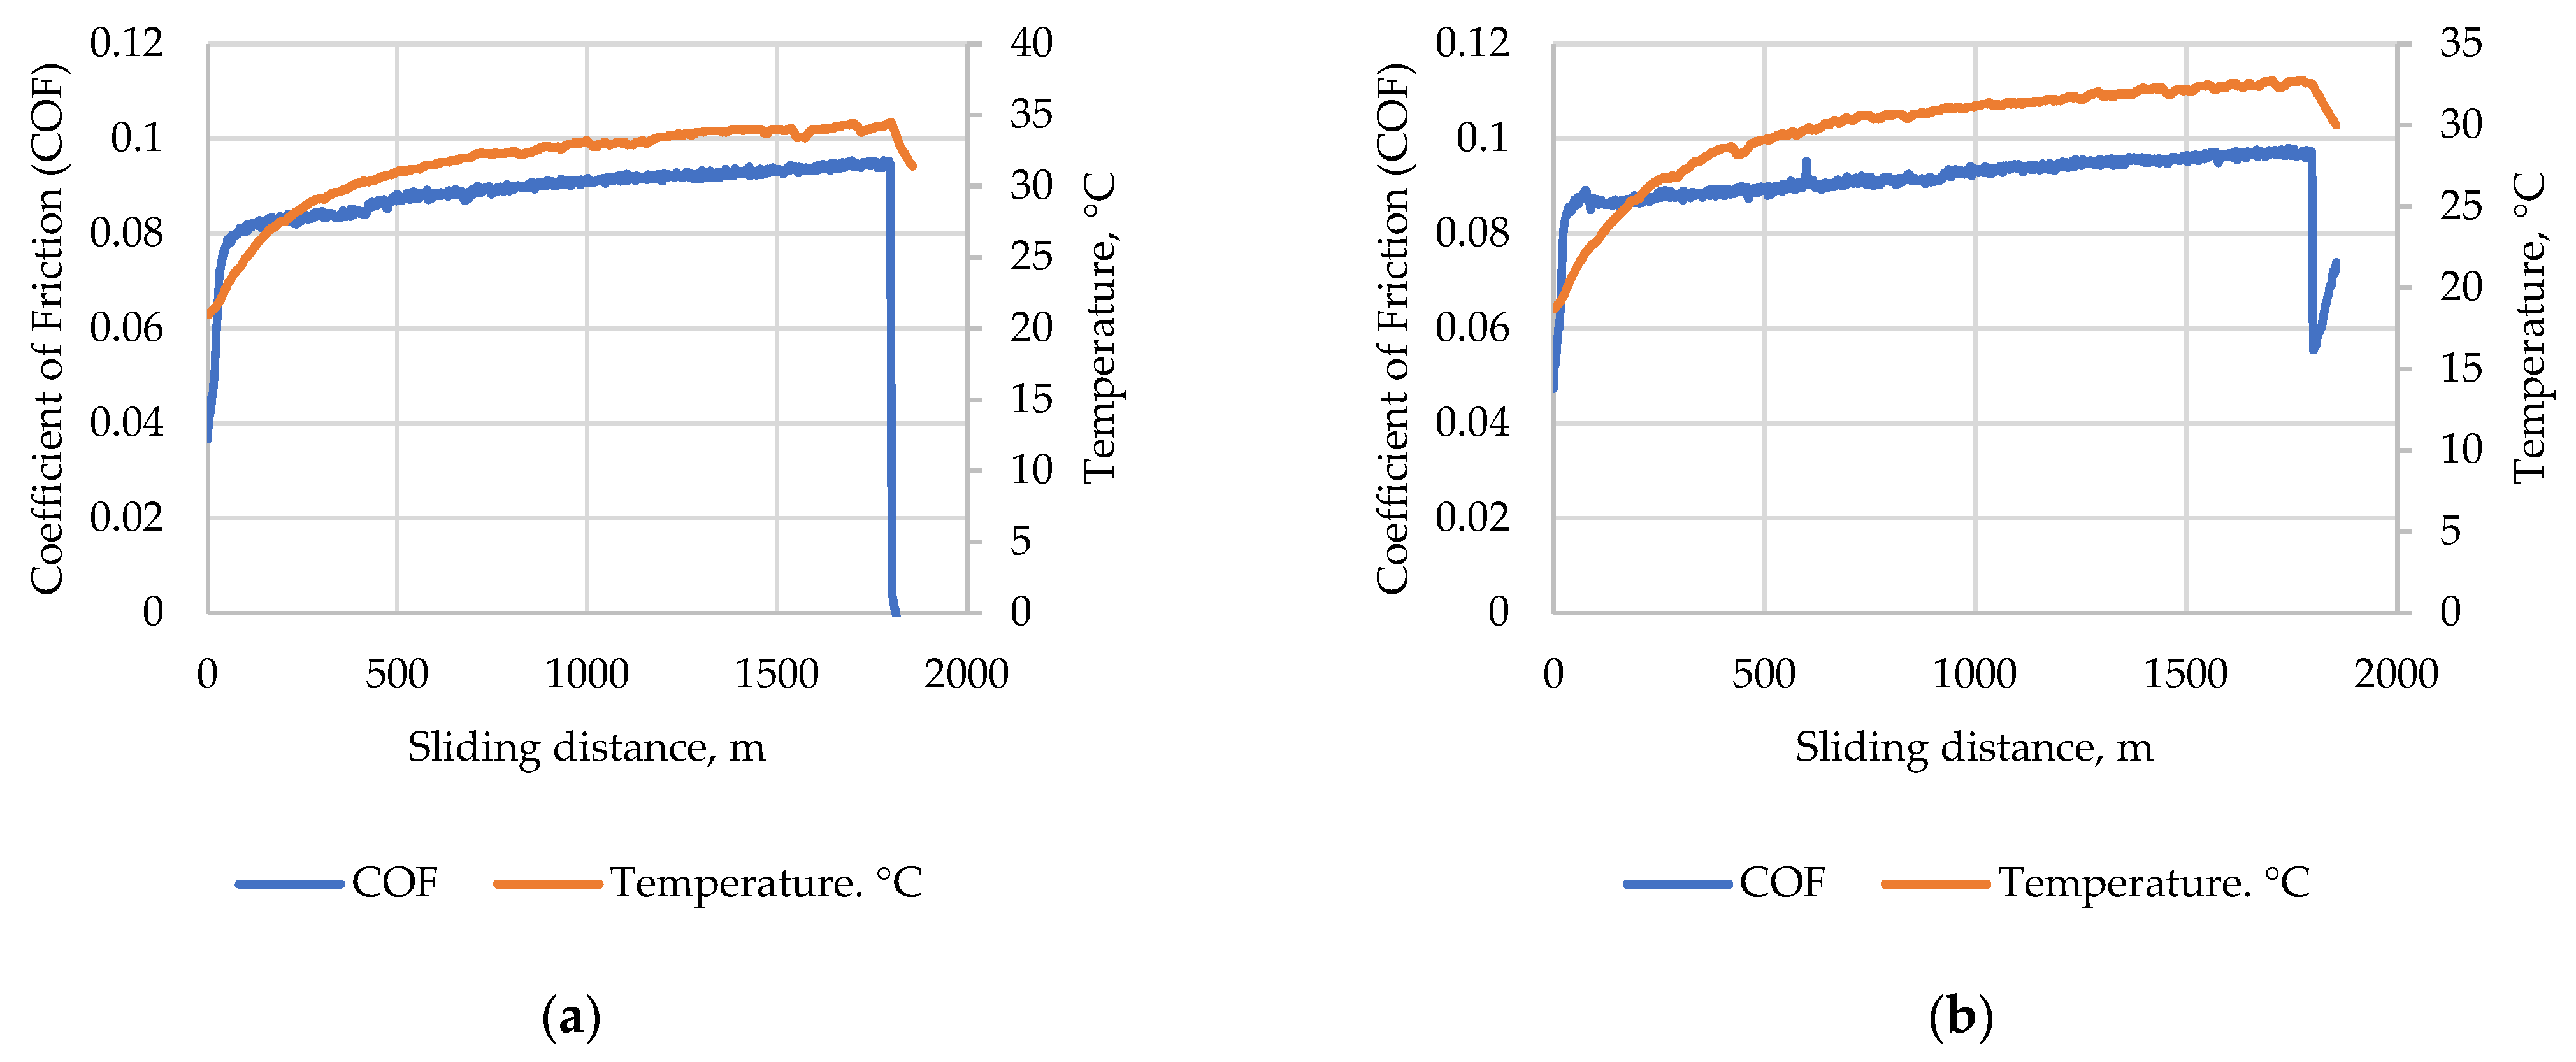
Representative raw records were selected to illustrate running-in and steady-state behaviour in Figure 9. The actual mean loads in these records were 123.92 N for neat PEEK and 123.84 N for hybrid PEEK, while the corresponding mean rotational speeds were 256.43 and 256.29 rpm, respectively. The differences in load and speed were below 0.1%.
Figure 9.
Representative evolution of the force-ratio COF with sliding distance at PV = 0.8 MPa·m/s, p = 1.75 MPa, and v = 0.46 m/s: (a) neat PEEK; (b) hybrid PEEK. Each panel represents one individual test record selected to illustrate the temporal friction response.
The relative difference in actual normal load was:
The two records were therefore considered mechanically comparable.
Within the final 20% of the valid representative records, the mean force-ratio COF values were 0.09403 for neat PEEK and 0.09651 for hybrid PEEK. These values represent individual time-series records and should not be substituted for the n = 3 group means.
The mean steady-state COF values calculated from the final 20% of the recovered signals were:
and:
The absolute difference was:
The relative difference was calculated as:
giving:
In the selected representative records, hybrid PEEK showed a 2.64% higher steady-state COF than neat PEEK.
Both materials exhibited an initial running-in increase followed by a comparatively stable friction response. No abrupt frictional transition or seizure was observed before test termination.
3.4. Steady-State Friction Stability
Within the selected steady-state portions of the representative PV = 0.8 MPa·m/s records, the temporal COF standard deviations were 0.00071 for neat PEEK and 0.00067 for hybrid PEEK. The corresponding temporal coefficients of variation were 0.76% and 0.69%, respectively.
For each representative record, the temporal coefficient of variation was calculated as:
For neat PEEK:
For hybrid PEEK:
Both values were below 1%, indicating low short-term relative variability within the selected representative records. These temporal values describe signal stability within individual tests and do not represent repeatability among the three independently tested specimens, and these within-record temporal statistics are not estimates of transducer accuracy and were not used to resolve the condition-specific material differences.
3.5. Subsurface Temperature Response
The maximum subsurface temperatures across the dry sliding test matrix remained below 37 °C. At PV = 0.8 MPa·m/s, the mean maximum temperature calculated from three independent tests was 34.5 ± 0.8 °C for neat PEEK and 32.8 ± 1.0 °C for hybrid PEEK. Starting temperatures differed among specimens and operating conditions; therefore, absolute Tmax values were not used to rank the materials. After baseline normalisation, hybrid PEEK showed a higher mean ΔT in three operating conditions and a lower mean ΔT in three conditions. The descriptive thermal response consequently showed no consistent material-related direction.
Every replicate is provided in Supplementary File S1, and Table 9 summarises the condition-level means and sample standard deviations. T0 ranged from 18.2 to 22.3 °C. Hybrid PEEK showed a higher mean ΔT in three conditions and a lower mean ΔT in three conditions; accordingly, no consistent material thermal advantage is inferred.
Table 9.
Descriptive summary of initial subsurface temperature, maximum temperature, and baseline-normalised temperature rise for neat and hybrid PEEK.
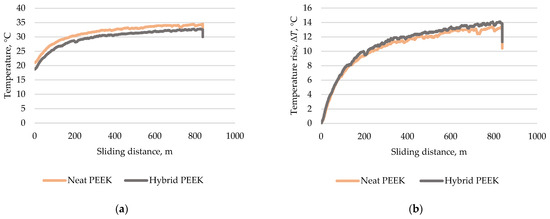
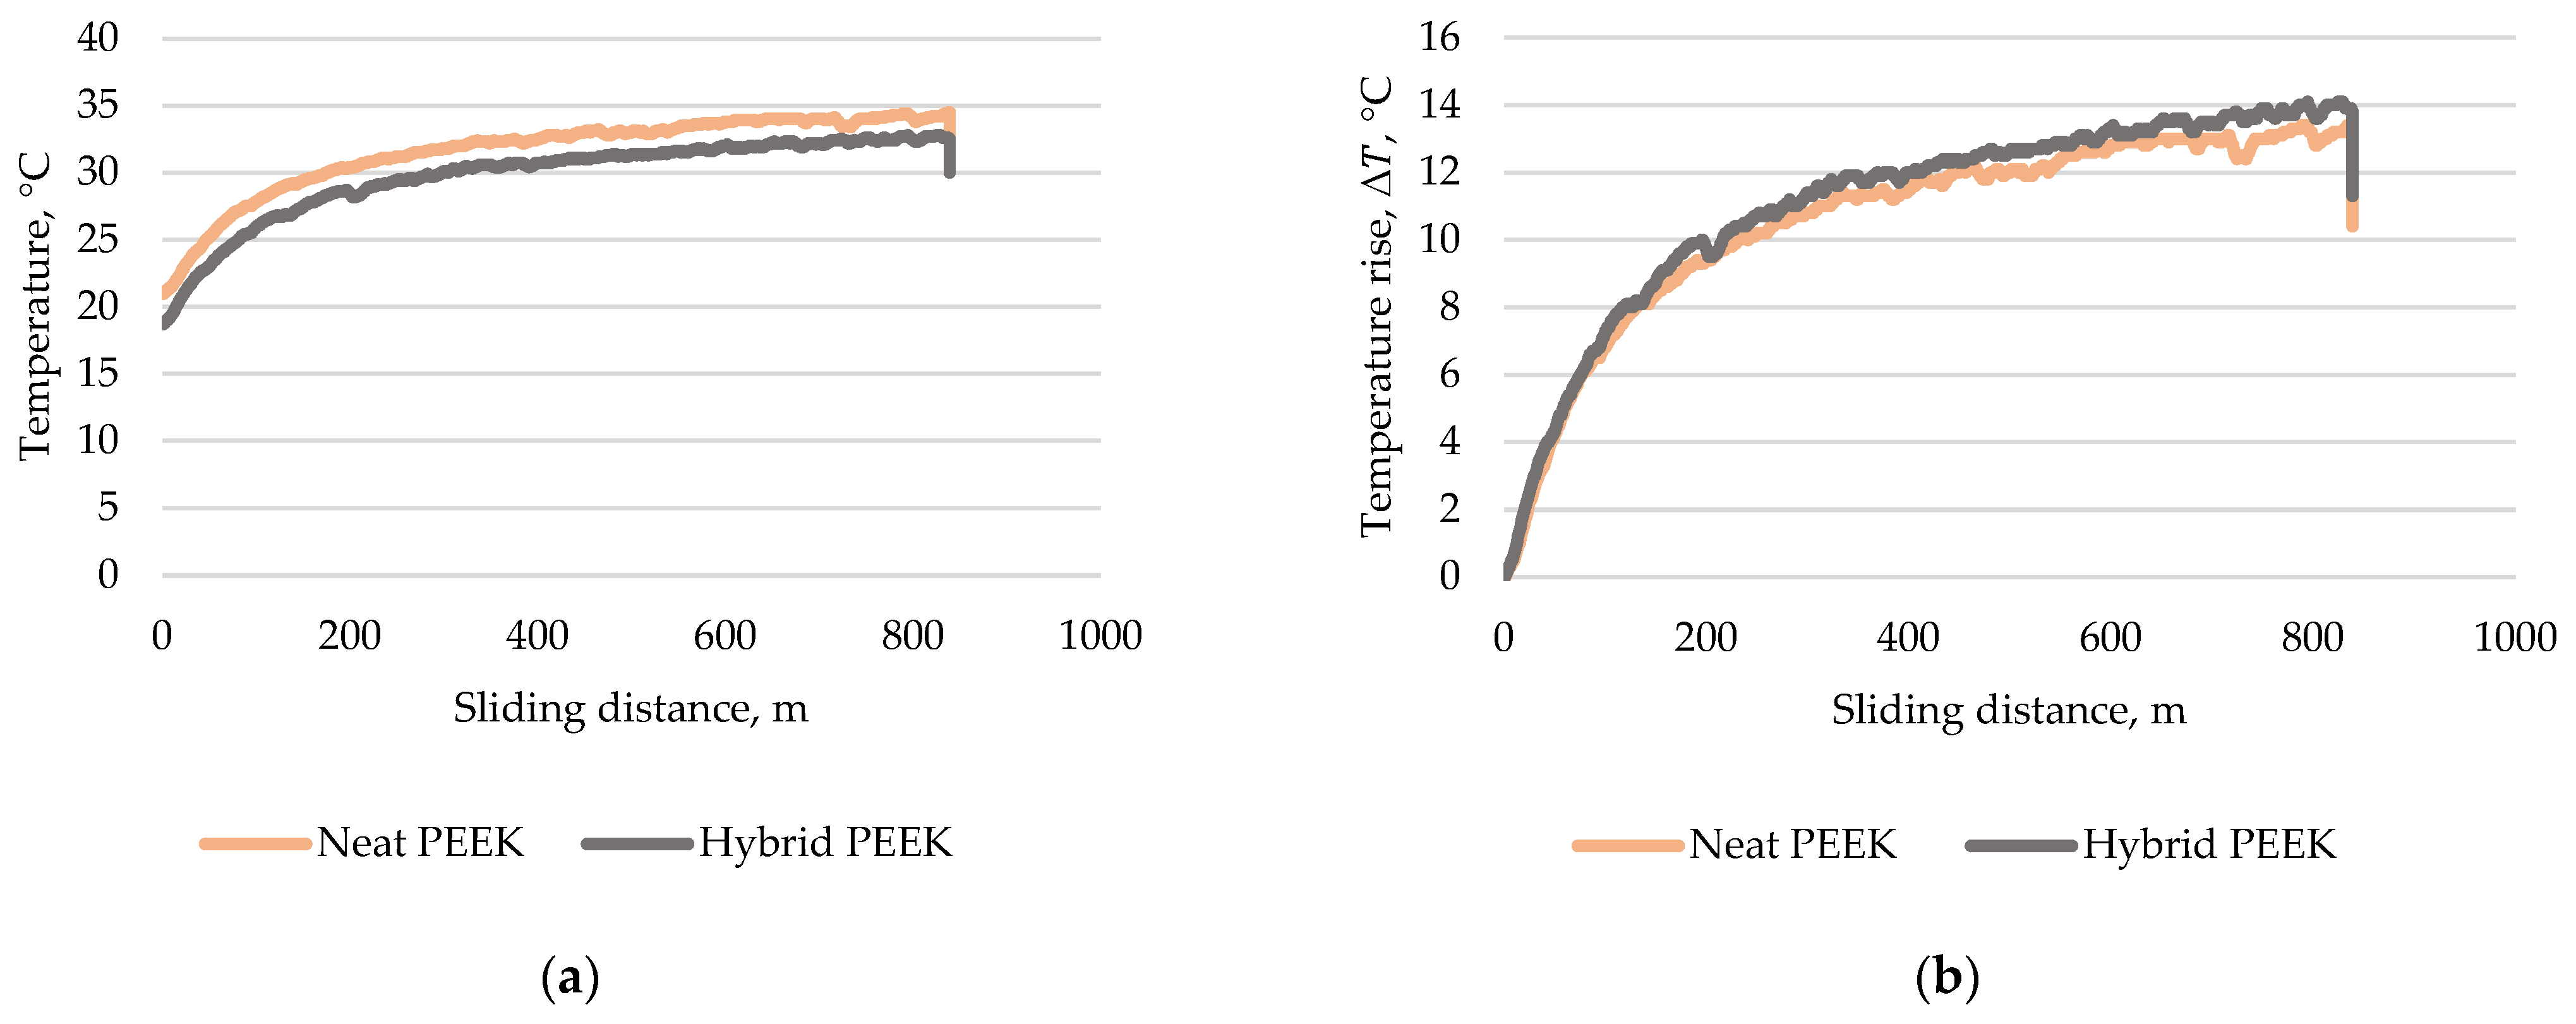
Values are mean ± sample standard deviation (n = 3 independent specimens per material–condition combination). The complete replicate-level values are provided in Supplementary File S1. At PV = 0.8 MPa·m/s, the mean initial temperatures across three specimens were 22.0 ± 0.2 °C for neat PEEK and 18.5 ± 0.4 °C for hybrid PEEK, while the corresponding mean maximum temperatures were 34.5 ± 0.8 and 32.8 ± 1.0 °C, respectively. The temperature rises relative to the respective initial values (21.0° C for neat PEEK and 18.7° C for hybrid PEEK) shown in Figure 10 were, therefore, 13.5 and 14.1 °C, respectively:
Figure 10.
Representative subsurface thermal response at PV = 0.8 MPa·m/s, p = 1.75 MPa, and v = 0.46 m/s: (a) absolute temperature as a function of sliding distance; (b) temperature rise relative to the initial specimen temperature. Each curve represents one individual test record selected to illustrate temporal evolution and is not a group mean.
For neat PEEK:
For hybrid PEEK:
The representative-record difference in temperature rise was only 0.6 °C. At the group level, for PV = 0.8 MPa·m/s, the descriptive means differed by 1.8 °C in the opposite direction to the absolute Tmax difference: hybrid PEEK had the lower Tmax but the higher baseline-normalised rise. It is therefore not interpreted as evidence of a material-dependent difference in temperature rise. The representative records are used only to illustrate the temporal evolution of subsurface temperature during sliding.
Across the complete test matrix, maximum subsurface temperatures remained below 37 °C, and no rapid or uncontrolled temperature escalation was observed within the recorded dry sliding interval. The measured values therefore indicated a stable subsurface thermal response under the analysed moderate condition.
3.6. Gravimetric Results
The individual specimen mass measurements showed no displayed change for neat PEEK in any of the six dry sliding conditions and no displayed change for hybrid PEEK at PV = 0.3, 0.4, 0.8, and 1.3 MPa·m/s. For these specimens, the recorded mass before and after testing was identical at the 0.001 g readability of the balance, corresponding to Δm = 0.000 g. At PV = 1.5 and 3.2 MPa·m/s, hybrid PEEK showed an apparent decrease from 1.307 to 1.306 g, corresponding to Δm = 0.001 g for each specimen, whereas neat PEEK remained unchanged at 1.314 g before and after testing.
The observed mass changes therefore ranged from 0 to 0.001 g and were all within the stated measurement capability of the balance (readability of 0.001 g and a stated linearity of ± 0.003 g). Accordingly, a displayed mass change of 0.000 g should not be interpreted as an absence of microscopic material loss, while the apparent 0.001 g decrease observed for hybrid PEEK at PV = 1.5 and 3.2 MPa·m/s is insufficient to establish greater wear than neat PEEK. The gravimetric results were therefore treated as supporting observations only and were not used to calculate specific wear rates or quantitatively rank the materials.
3.7. Post-Test Surface Appearance
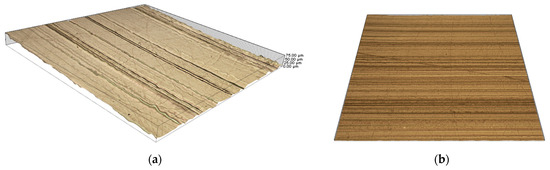
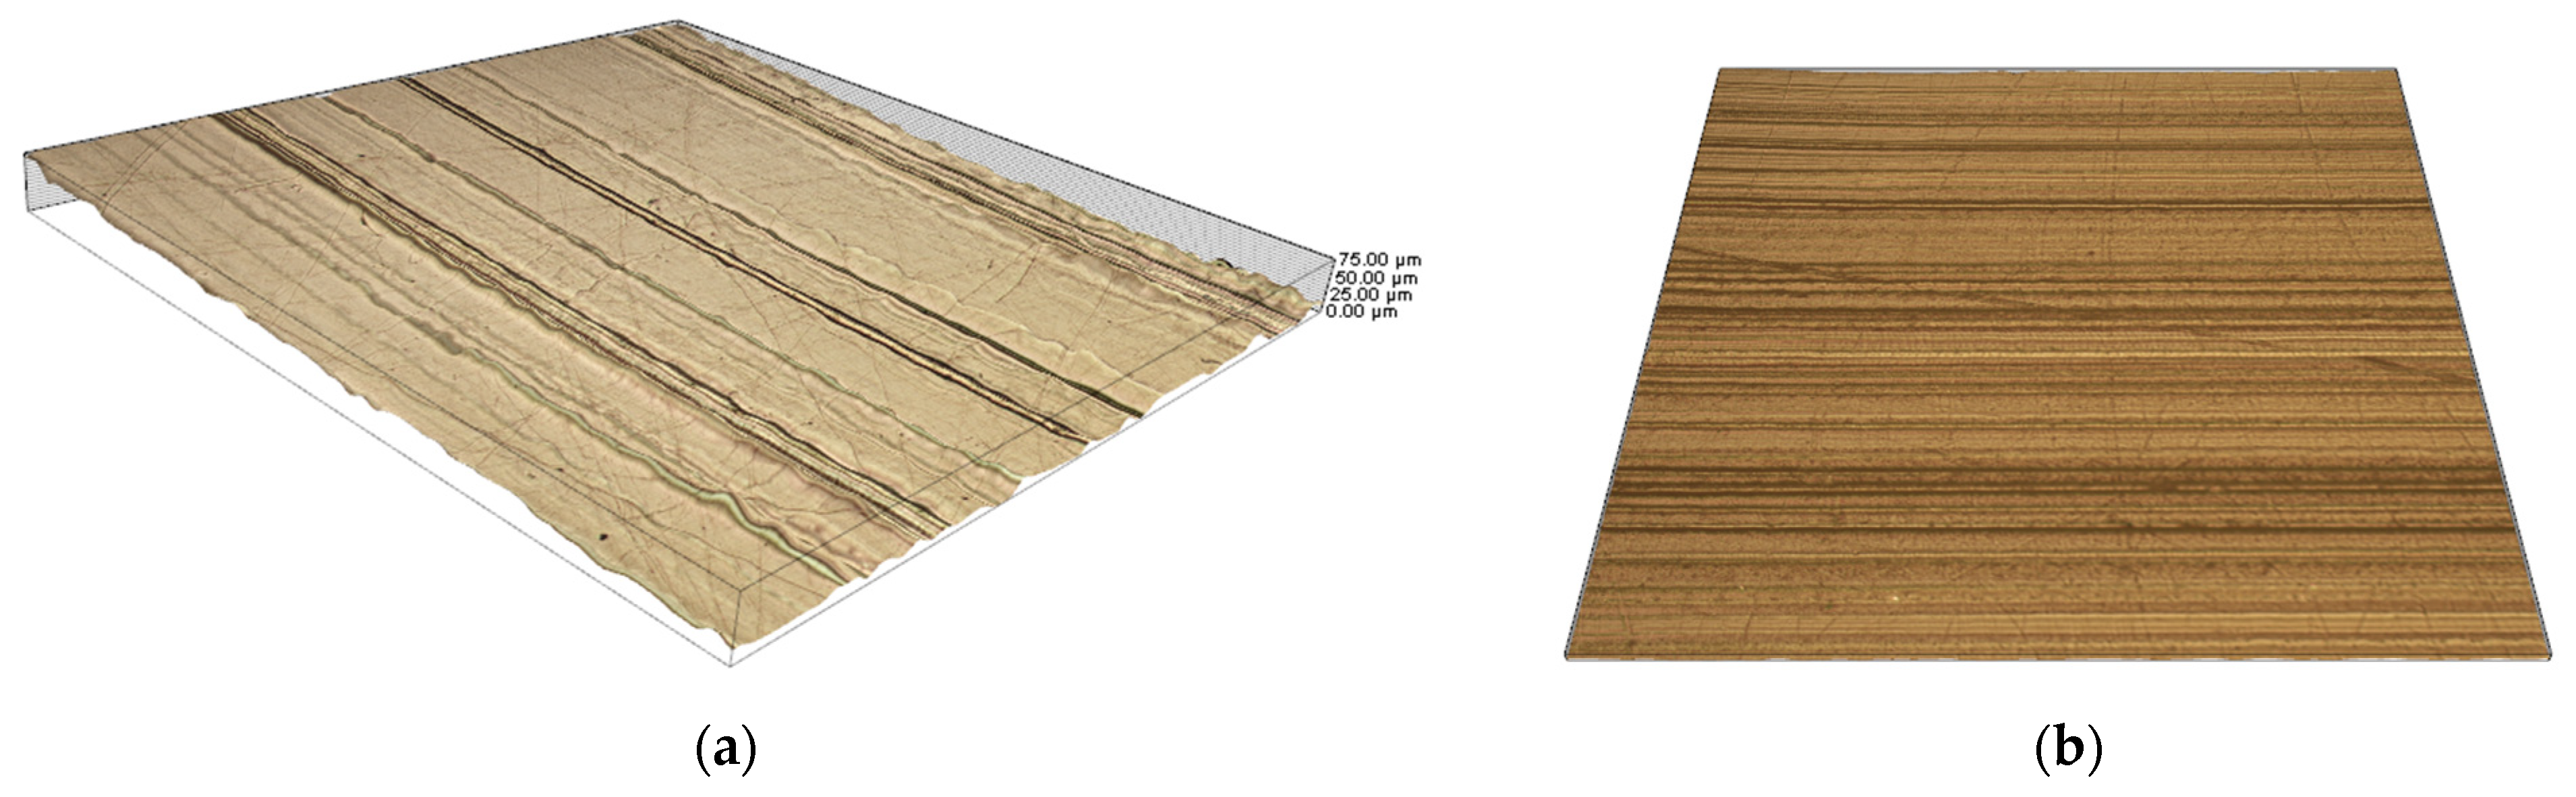
Post-test EDF surface reconstructions obtained after dry ring-on-block sliding at PV = 3.2 MPa·m/s, corresponding to a nominal pressure of 5.82 MPa and a sliding velocity of 0.55 m/s, are presented in Figure 11. Both materials exhibited directional surface features aligned predominantly with the sliding direction. Hybrid PEEK showed relatively broad and visually smooth regions interrupted by locally pronounced grooves and depressions. By contrast, neat PEEK exhibited a denser and more continuous pattern of fine, approximately parallel sliding marks. No extensive cracking, fragmentation, or gross material removal was visible within the analysed areas.
Figure 11.
Post-test EDF surface reconstructions after dry ring-on-block sliding at PV = 3.2 MPa·m/s, p = 5.82 MPa, and v = 0.55 m/s: (a) hybrid PEEK; (b) neat PEEK.
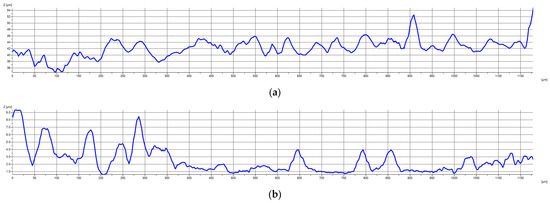
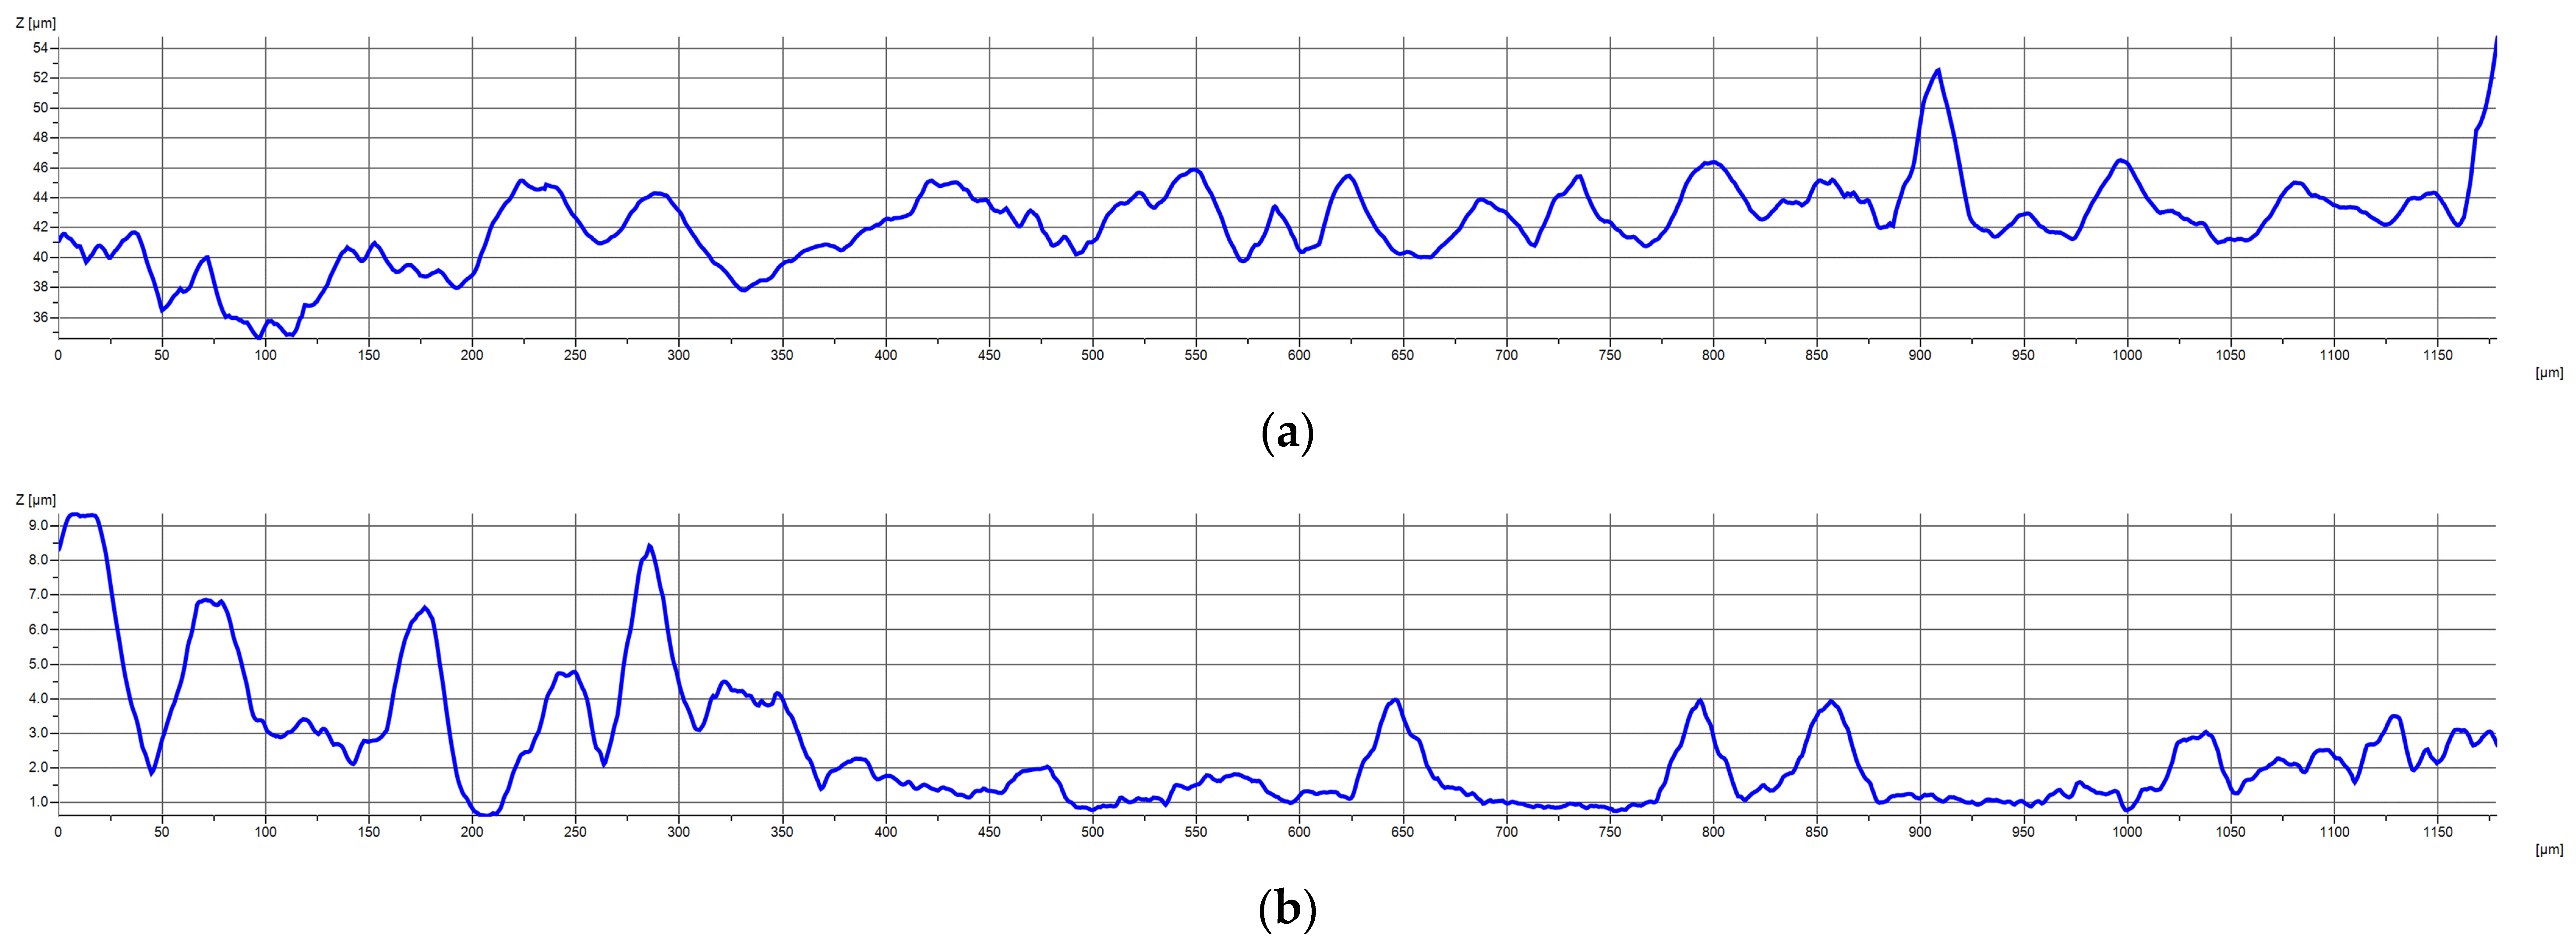
The corresponding surface-height profiles are shown in Figure 12. Both profiles covered an evaluation length of approximately 1.174 mm. The selected hybrid PEEK profile exhibited a local peak-to-valley height range of approximately 17.97 µm, whereas the neat PEEK profile showed a lower range of approximately 8.73 µm. Thus, neat PEEK showed a greater density of fine surface marks, while hybrid PEEK exhibited larger local height variations. The profiles also permit qualitative inspection of groove and depression depths relative to adjacent profile levels and of the overall spatial pattern.
Figure 12.
Surface-height profiles extracted from selected paths of the post-test EDF reconstructions after dry sliding at PV = 3.2 MPa·m/s, p = 5.82 MPa, and v = 0.55 m/s: (a) hybrid PEEK; (b) neat PEEK. The profiles represent individual selected paths and are intended for qualitative comparison of local height variation rather than as standardised whole-surface roughness or wear-depth measurements.
No additional surface levelling, form removal, or roughness filtering was applied to the displayed EDF-derived profiles. The evaluation lengths were approximately 1.174 mm, with local peak-to-valley height ranges of approximately 17.97 µm for hybrid PEEK and 8.73 µm for neat PEEK. Accordingly, these profiles represent local height variation along the selected paths rather than standardised roughness or wear-depth measurements; the determination of Ra, Rq, or areal roughness parameters would require appropriate levelling, form removal, filtering, and evaluation of multiple representative regions.
4. Discussion
4.1. Friction Response and Working Hypothesis
The working hypothesis was that the addition of PTFE, graphite, and carbon fibre would reduce the steady-state friction of PEEK during dry sliding against steel. The results did not support this hypothesis. Hybrid PEEK exhibited a higher numerical mean steady-state COF than neat PEEK in all six investigated operating conditions, with relative differences of approximately 1.53–8.36% based on the unrounded group means.
The two-factor analysis identified a statistically significant overall effect of material on steady-state COF (p = 0.0029, = 0.314), while the material × operating condition interaction was not significant (p = 0.978). The estimated overall hybrid-minus-neat difference was +0.003388 COF units (95% CI 0.001279–0.005496). However, none of the six individual neat–hybrid comparisons reached statistical significance after Holm correction; the smallest adjusted p-value was 0.521. This indicates that the material-related difference was generally consistent in direction across the investigated operating conditions. However, none of the individual neat–hybrid comparisons reached statistical significance after Holm correction for multiple comparisons. The results should therefore not be interpreted as demonstrating a statistically significant material difference in each individual operating condition. Instead, they indicate a consistent overall tendency towards higher COF for hybrid PEEK across the complete experimental matrix. Friction depends on filler concentration and distribution, matrix–filler adhesion, counterface condition, particle release, and transfer-layer development [5,6,9,11].
PTFE and graphite can reduce interfacial shear, but their effectiveness depends on the surrounding matrix, other fillers, and operating conditions [6,9,28]. Carbon-fibre reinforcement may improve stiffness and load support while also producing local mechanical interaction when fibre-containing regions are exposed. Studies of carbon-modified PEEK similarly show that tribological behaviour results from the coupled effects of filler structure, loading, and temperature rather than filler identity alone [10,11,13,14,28].
The results therefore should not be interpreted as showing that hybrid PEEK is generally inferior to neat PEEK. Although the two-factor analysis identified a significant overall material effect towards higher COF, none of the condition-specific neat–hybrid comparisons were significant after Holm adjustment. The findings instead show that the expected dry-friction benefit of the solid-lubricant-containing hybrid formulation was not realised under the investigated conditions.
4.2. Surface Appearance
Initial EDF observations showed that hybrid PEEK was optically more heterogeneous than neat PEEK. The selected EDF profiles provide information on local height ranges and spatial pattern, but such a difference therefore cannot be explained simply by appearance. The steel-ring counterfaces were separately measured at Ra = 4.80–5.69 µm and were produced using the same machining procedure; counterface roughness was therefore treated as a preparation characteristic rather than an independently varied experimental factor [23]. The observed heterogeneity may reflect differences between matrix- and filler-containing regions; however, the individual optical features could not be assigned to specific filler phases by EDF microscopy alone [29].
During running-in, differences between the PEEK matrix and reinforcing or lubricating phases have been reported to result in non-uniform deformation, local filler exposure, and the release of composite fragments [30]. Previous studies have shown that the tribological response of carbon-fibre- and graphite-containing PEEK depends strongly on particle release, movement, and incorporation into the transfer layer [9,11,13,14]. After testing, neat PEEK exhibited a denser pattern of fine, approximately parallel marks, whereas hybrid PEEK showed comparatively smoother intervening regions interrupted by fewer but locally deeper features. These mechanisms are therefore considered possible interpretations of the present surface observations rather than processes directly identified by EDF microscopy.
Filler exposure, fragment release, third-body action, transferred material, and trans-fer-layer formation are possible mechanisms discussed in the literature for PEEK composites [31].
The post-test topography indicates that the higher numerical COF of hybrid PEEK did not correspond directly to a greater density of visible sliding grooves [32]. Neat PEEK exhibited numerous fine and approximately parallel marks, which are morphologically consistent with shallow scratching or ploughing of the unreinforced polymer matrix [33,34].
Hybrid PEEK showed larger visually smooth regions but also greater local peak-to-valley variation. Particle release and local interaction near carbon fibres have been reported for reinforced PEEK composites and can influence both friction and surface evolution [35]. The larger local peak-to-valley range observed for hybrid PEEK is therefore not necessarily inconsistent with reinforcement; rather, it may reflect more localised surface modification associated with the heterogeneous filler-containing structure.
The visually smoother appearance of parts of the hybrid PEEK track should not necessarily be interpreted as evidence of lower wear. Apparent surface smoothness does not always correlate directly with PEEK material loss because contact pressure, polymer morphology, counterface condition, and operating parameters also influence surface evolution [36,37].
4.3. Subsurface Thermal Response
Across the investigated operating condition matrix, maximum subsurface temperatures remained below 37 °C and did not indicate severe thermal instability. Because pressure and sliding velocity were changed simultaneously among the tested conditions and were not varied independently in a full factorial arrangement, their individual contributions to frictional and thermal responses cannot be separated from the present dataset. The temperature results are therefore interpreted as responses to the specific tested operating conditions rather than as independent effects of pressure or velocity [38].
Hybrid PEEK exhibited a lower numerical mean Tmax than neat PEEK in all six operating conditions. This tendency was also observed at the two highest-load conditions, both performed at 400 N. At PV = 1.5 MPa·m/s, the mean Tmax values were approximately 36.0 °C for neat PEEK and 35.6 °C for hybrid PEEK, whereas at PV = 3.2 MPa·m/s, they were approximately 34.3 and 32.8 °C, respectively. At PV = 0.8 MPa·m/s, the group mean maximum temperatures obtained from three independent tests were 34.5 ± 0.8 °C for neat PEEK and 32.8 ± 1.0 °C for hybrid PEEK.
However, the absolute Tmax values should not be interpreted directly as evidence of a material-dependent difference in heat generation or thermal conductivity. In the representative PV = 0.8 MPa·m/s records, the temperature rises relative to the respective initial specimen temperatures were 13.5 °C for neat PEEK and 14.1 °C for hybrid PEEK. The resulting difference in temperature rise was only 0.6 °C and occurred together with a 2.3 °C difference in the initial specimen temperatures. It is therefore not considered evidence of a material-dependent difference in temperature rise.
The specimen-level dataset confirms that absolute Tmax values cannot be used to rank the materials because starting temperatures differed among specimens and conditions. After baseline normalisation, hybrid PEEK showed a higher mean ΔT than neat PEEK at PV = 0.3, 0.8, and 1.5 MPa·m/s and a lower mean ΔT at PV = 0.4, 1.3, and 3.2 MPa·m/s. The descriptive response therefore had no consistent direction across the six operating conditions.
At PV = 0.8 MPa·m/s, the mean T0 values were 22.0 °C for neat PEEK and 18.5 °C for hybrid PEEK, while the mean Tmax values were 34.5 and 32.8 °C, respectively. The corresponding mean ΔT values were 12.4 and 14.2 °C, respectively. Thus, the lower absolute Tmax for hybrid PEEK coincided with a lower starting temperature and did not demonstrate a lower baseline-normalised rise.
The thermocouple was positioned approximately 3 mm below the sliding surface, and the measured temperature consequently reflected the combined effects of frictional heat generation, heat conduction through the polymer, heat partition into the steel ring, and heat losses to the surroundings. Carbon fibre and graphite can enhance thermal transport in PEEK-based composites, although the effective response depends on filler orientation, dispersion, connectivity, and interfacial thermal resistance [15,16]. Therefore, the descriptive temperature response is not interpreted as evidence of enhanced heat transport, higher thermal conductivity, or a specific heat-transfer mechanism in hybrid PEEK. Direct measurement of thermal conductivity and interfacial temperature would be required to establish this mechanism conclusively.
4.4. Engineering Implications, Limitations, and Future Research
The results show that classification as a bearing-grade hybrid PEEK does not automatically imply lower dry friction. Hybrid formulations are commonly designed to balance friction, wear resistance, stiffness, creep resistance, dimensional stability, and thermal transport. Carbon-containing PEEK composites may therefore provide mechanical or multifunctional benefits not captured by COF alone [3,4,39,40].
The present findings should not be interpreted as evidence that reinforcing or friction-modifying fillers are unnecessary. The investigated hybrid formulation did not provide a dry-friction reduction under the present test conditions, but this does not exclude potential advantages under other loading, thermal, wear, or lubrication regimes. The maximum applied load was 400 N, corresponding to a nominal pressure of 5.82 MPa, and no severe thermal instability was reached. More severe loading may alter friction, transfer-layer development, surface damage, and heat transport and could therefore produce a stronger differentiation between neat and hybrid PEEK. However, the magnitude and direction of such differences cannot be established from the present dataset.
This study is subject to several limitations. Only one neat and one hybrid commercial PEEK grade were investigated, and the nominal filler composition of the hybrid material was based on supplier documentation and was not independently verified by chemical analysis. Three independent specimens were tested for each material–condition combination. Pressure and sliding velocity were not varied independently in a full factorial arrangement; therefore, their separate main effects and interaction cannot be quantified from the present dataset. Surface characterisation was limited to optical and EDF microscopy without chemical or elemental identification of individual fillers, wear debris, or transferred material, and transfer films on the steel counterface were not characterised. In addition, the sensitivity of the gravimetric measurements was insufficient for quantitative wear-rate ranking. Consequently, the findings should be interpreted as a comparative assessment of the investigated commercial grades under the specific tested operating conditions rather than as a general ranking of neat and hybrid PEEK materials. The tests were conducted sequentially without formal randomisation or blocking; consequently, a small run-order drift cannot be separated retrospectively from the material effect.
The estimated overall material difference (+0.003388) was only about 1.11 times the pooled residual standard deviation (0.003065), and the 12 within-cell sample standard deviations ranged from approximately 0.0010 to 0.0056. The condition-specific absolute mean differences ranged from 0.00185 to 0.00447, and none was significant after Holm correction. The practical importance of differences of a few thousandths in COF therefore cannot be established conclusively relative to total instrumental uncertainty. The temperature variables were therefore treated descriptively, and no material-level thermal advantage or heat-transport mechanism is claimed. The laboratory journal documented ambient conditions from 18 to 22 °C and 48% relative humidity. The condition-specific differences are treated as numerical tendencies, while the significant overall contrast is interpreted cautiously as a small matrix-wide effect.
Future research should extend the matched neat–hybrid comparison to higher-load and higher-severity dry sliding conditions, as well as to controlled limited-supply and continuously supplied lubrication. Examination of the PEEK wear tracks and steel transfer layers using SEM and EDS, supplemented where appropriate by Raman spectroscopy or XPS, would permit more reliable identification of whether filler-containing debris, transferred carbonaceous material, or transfer films are present. Three-dimensional wear-volume measurements would also provide a quantitative wear response with greater sensitivity than the present specimen mass readings.
Overall, the results reject the simple assumption that PTFE-, graphite-, and carbon-fibre-modified PEEK must exhibit lower dry friction than neat PEEK. Material selection should instead consider the complete tribological system, including filler distribution, pressure, velocity, counterface condition, surface evolution, and thermal response.
5. Conclusions
This study compared the steady-state dry sliding behaviour of neat PEEK and hybrid PEEK containing PTFE, graphite, and carbon fibre against 42CrMo4+QT steel under six operating conditions.
The investigated hybrid PEEK did not provide a dry-friction reduction relative to neat PEEK. Hybrid PEEK exhibited a higher numerical mean steady-state COF in all six operating conditions, with relative differences of 1.53–8.36%. The overall hybrid-minus-neat difference was +0.003388 COF units (95% CI 0.001279–0.005496; p = 0.0029, = 0.314); however, none of the condition-specific neat–hybrid comparisons were statistically significant after Holm correction. The working hypothesis that the hybrid formulation would reduce steady-state dry friction was therefore not supported.
Steady-state COF did not vary monotonically with nominal PV across the investigated operating condition matrix. The highest mean COF occurred at PV = 1.5 MPa·m/s rather than at PV = 3.2 MPa·m/s. Thus, nominal PV alone did not provide a monotonic ranking of frictional severity within the tested matrix. Because pressure and sliding velocity were not varied independently, the observed differences should be interpreted as responses to the specific pressure–velocity combinations investigated rather than as separate pressure or velocity effects.
Post-test EDF observations showed different surface responses for the two materials. Neat PEEK exhibited a denser pattern of fine, approximately parallel grooves, whereas hybrid PEEK showed comparatively smoother regions interrupted by fewer but locally deeper features. These optical observations support a difference in surface evolution between the materials, although they do not permit chemical identification of individual fillers, wear debris, or transferred material.
Hybrid PEEK showed a higher mean ΔT in three operating conditions and a lower mean ΔT in three, so no consistent material thermal advantage was identified. The single subsurface thermocouple channel does not establish enhanced heat transport or a thermal-conductivity mechanism.
Overall, the expected dry-friction benefit of the investigated hybrid formulation was not realised under the tested conditions. Material selection for dry polymer–steel contacts should therefore consider the complete tribological system rather than relying solely on the nominal bearing-grade classification. These conclusions are specific to the investigated commercial grades and test matrix and should be interpreted within the stated experimental limitations.
Supplementary Materials
The following supporting information can be downloaded at: https://www.mdpi.com/article/10.3390/coatings16091012/s1. Supplementary File S1: Specimen-level COF and subsurface-temperature data, including 36 unrounded specimen-level COF values, two-factor fixed-effects ANOVA calculations, condition-specific contrasts, residual data and diagnostic plots, replicate-level T0, Tmax and ΔT values, descriptive temperature summaries, and pre-test steel-ring roughness measurements. Figure S1: Residual diagnostics for the two-factor fixed-effects ANOVA based on unrounded specimen-level steady-state COF values: (a) standardised residuals versus fitted COF values; (b) normal Q–Q plot of the standardised residuals.
Author Contributions
Concept of research, T.K. and S.B.; formal analysis, T.K. and V.G.; methodology, T.K. and S.B.; validation, T.K.; visualisation, T.K., S.B. and V.G.; investigation, T.K. and V.G.; resources, S.B.; data curation, T.K.; writing—original draft preparation, S.B.; supervision, T.K.; writing—review and editing, S.B. and T.K.; analysed the data, T.K., project administration, S.B. All authors have read and agreed to the published version of the manuscript.
Funding
This research received no external funding.
Institutional Review Board Statement
Not applicable.
Informed Consent Statement
Not applicable.
Data Availability Statement
The original contributions presented in this study are included in the article and Supplementary Material. Further inquiries can be directed to the corresponding author.
Acknowledgments
The authors have reviewed and edited the output and take full responsibility for the content of this publication.
Conflicts of Interest
The authors declare that there are no conflicts of interest.
Abbreviations
The following abbreviations are used in this manuscript:
| COF | coefficient of friction |
| EDF | extended depth of field |
| PEEK | polyether ether ketone |
| PTFE | polytetrafluoroethylene |
| CF | carbon fibre |
| PV | pressure times velocity |
References
- Xia, Z.; Wu, D.; Zhang, X.; Wang, J.; Han, E. Rolling contact fatigue failure mechanism of bearing steel on different surface roughness levels under heavy load. Int. J. Fatigue 2024, 179, 108042. [Google Scholar] [CrossRef] [Scilit]
- Lin, Z.; Zhang, K.; Tao, P.; Gao, B.; Zhao, X.; Zong, X.; Chen, Z.; Zhang, Z. Coupled effect of filler and countersurface roughness on the tribological performance of the PEEK-PTFE-steel hybrid wear system. Wear 2023, 523, 204841. [Google Scholar] [CrossRef] [Scilit]
- Liu, W.; Wei, L.; Zhang, Y.; Chen, S.; Zhao, G.; Gao, G.; Wang, H. Investigation of tribological behavior and failure mechanisms of PEEK-based composites, Babbitt alloy, and CuSn10Pb10 bimetal for wind turbine main shaft sliding bearings under simulated operational conditions. Tribol. Int. 2025, 204, 110522. [Google Scholar] [CrossRef] [Scilit]
- An, J.Q.; Zhang, B.J.; Liang, T.H.; Liu, S.H.; Lei, M.K. Elastohydrodynamic lubrication analysis of misaligned compliant journal bearings with fiber orientation-tailored CF/PEEK coatings. Compos. Part A Appl. Sci. Manuf. 2025, 198, 109148. [Google Scholar] [CrossRef] [Scilit]
- Lu, Z.P.; Friedrich, K. On sliding friction and wear of PEEK and its composites. Wear 1995, 181–183, 624–631. [Google Scholar] [CrossRef] [Scilit]
- Rodriguez, V.; Sukumaran, J.; Schlarb, A.K.; De Baets, P. Influence of solid lubricants on tribological properties of polyetheretherketone (PEEK). Tribol. Int. 2016, 103, 45–57. [Google Scholar] [CrossRef] [Scilit]
- Kalin, M.; Zalaznik, M.; Novak, S. Wear and friction behaviour of poly-ether-ether-ketone (PEEK) filled with graphene, WS2 and CNT nanoparticles. Wear 2015, 332–333, 855–862. [Google Scholar] [CrossRef] [Scilit]
- Trivedi, P.D. Specialty Thermoplastics. In Specialty Thermoplastics, 1st ed.; Smith, M., Ed.; Carl Hanser Verlag GmbH & Co. KG: Munich, Germany, 2020; pp. I–XV. [Google Scholar]
- Dhakal, N.; Espejo, C.; Morina, A.; Emami, N. Tribological performance of 3D printed neat and carbon fiber reinforced PEEK composites. Tribol. Int. 2024, 193, 109356. [Google Scholar] [CrossRef] [Scilit]
- Lin, L.; Schlarb, A.K. Tribological response of the PEEK/SCF/graphite composite by releasing rigid particles into the tribosystem. Tribol. Int. 2019, 137, 173–179. [Google Scholar] [CrossRef] [Scilit]
- Lin, Z.; Zhang, K.; Ye, J.; Li, X.; Zhao, X.; Qu, T.; Liu, Q.; Gao, B. The effects of filler type on the friction and wear performance of PEEK and PTFE composites under hybrid wear conditions. Wear 2022, 490–491, 204178. [Google Scholar] [CrossRef] [Scilit]
- Panin, S.V.; Nguyen, D.A.; Buslovich, D.G.; Alexenko, V.O.; Pervikov, A.V.; Kornienko, L.A.; Berto, F. Effect of Various Type of Nanoparticles on Mechanical and Tribological Properties of Wear-Resistant PEEK + PTFE-Based Composites. Materials 2021, 14, 1113. [Google Scholar] [CrossRef] [Scilit]
- Feng, C.; Guo, Y.; Yu, Z.; Chen, K.; Wang, D.; Li, X.; Luo, Y.; Wang, Q.; Zhang, D. Tribological properties of PEEK composites reinforced by MoS2 modified carbon fiber and nano SiO2. Tribol. Int. 2023, 181, 108315. [Google Scholar] [CrossRef] [Scilit]
- Guo, L.; Zhang, G.; Wang, D.; Zhao, F.; Wang, T.; Wang, Q. Significance of combined functional nanoparticles for enhancing tribological performance of PEEK reinforced with carbon fibers. Compos. Part A Appl. Sci. Manuf. 2017, 102, 400–413. [Google Scholar] [CrossRef] [Scilit]
- Tian, J.; Liu, J.; Li, X.; Song, J.; Yang, L. Effect of carbon-based fillers on the thermal conductivity of polymers: A review. Int. J. Heat Mass Transf. 2025, 253, 127576. [Google Scholar] [CrossRef] [Scilit]
- Latif, Z.; Ali, M.; Lee, E.; Zubair, Z.; Lee, K.H. Thermal and Mechanical Properties of Nano-Carbon-Reinforced Polymeric Nanocomposites: A Review. J. Compos. Sci. 2023, 7, 441. [Google Scholar] [CrossRef] [Scilit]
- Baig, M.M.A.; Samad, M.A. Epoxy\Epoxy Composite\Epoxy Hybrid Composite Coatings for Tribological Applications—A Review. Polymers 2021, 13, 179. [Google Scholar] [CrossRef] [Scilit]
- Liu, W.; Miao, X.; Tao, S.; Li, J.; Ma, J.; Yang, J.; Li, H. Effect of Polyether Ether Ketone Melt Fluidity on Crystallization Behavior of Carbon Fiber Reinforced Polyether Ether Ketone Composites. Molecules 2026, 31, 1810. [Google Scholar] [CrossRef] [Scilit]
- Röchling Industrial Lahnstein SE & Co. KG. SustaPEEK MOD Black: Product Handling Information Sheet, Version 2.0; Röchling Industrial: Lahnstein, Germany, 2024.
- ASTM G77-17(2022); Standard Test Method for Ranking Resistance of Materials to Sliding Wear Using Block-on-Ring Wear Test. ASTM International: West Conshohocken, PA, USA, 2022.
- Li, D.; Leroux, P. Block on Ring Sliding Wear Evaluation, 1st ed.; NANOVEA: Irvine, CA, USA, 2016; p. 9. [Google Scholar]
- ASTM G115-24; Standard Guide for Measuring and Reporting Friction Coefficients. ASTM International: West Conshohocken, PA, USA, 2024.
- Wang, S.; Niu, C. Torsional Tribological Behavior and Torsional Friction Model of Polytetrafluoroethylene against 1045 Steel. PLoS ONE 2016, 11, e0147598. [Google Scholar] [CrossRef] [Scilit][Green Version]
- Schmitz, T.L.; Action, J.E.; Ziegert, J.C.; Sawyer, W.G. The Difficulty of Measuring Low Friction: Uncertainty Analysis for Friction Coefficient Measurements. J. Tribol. 2005, 127, 673–678. [Google Scholar] [CrossRef] [Scilit]
- Zander, M.; Otto, M.; Lohner, T.; Stahl, K. Evaluation of friction calculation methods for rolling bearings. Forsch. Ingenieurwesen 2023, 87, 1307–1316. [Google Scholar] [CrossRef] [Scilit]
- Günay, M.; Boy, M.; Korkmaz, M.E. Multi-Response Optimization and Predictive Modeling of Drilling Performance in PEEK-CF30 Composites Considering Drill Coating and Cutting Parameters. Polymers 2026, 18, 1064. [Google Scholar] [CrossRef] [Scilit]
- Lakens, D. Calculating and reporting effect sizes to facilitate cumulative science: A practical primer for t-tests and ANOVAs. Front. Psychol. 2013, 4, 863. [Google Scholar] [CrossRef] [Scilit] [PubMed]
- Ain, Q.U.; Wani, M.F.; Sehgal, R.; Singh, M.K. Tribological and mechanical characterization of carbon-nanostructures based PEEK nanocomposites under extreme conditions for advanced bearings: A molecular dynamics study. Tribol. Int. 2024, 196, 109702. [Google Scholar] [CrossRef] [Scilit]
- Yavas, D. High-temperature fracture behavior of carbon fiber reinforced PEEK composites fabricated via fused filament fabrication. Compos. Part B Eng. 2023, 266, 110987. [Google Scholar] [CrossRef] [Scilit]
- Wang, Q.; Wang, X.; Zhang, X.; Li, S.; Wang, T. Tribological properties study and prediction of PTFE composites based on experiments and machine learning. Tribol. Int. 2023, 188, 108815. [Google Scholar] [CrossRef] [Scilit]
- Panin, S.V.; Alexenko, V.O.; Buslovich, D.G. High Performance Polymer Composites: A Role of Transfer Films in Ensuring Tribological Properties—A Review. Polymers 2022, 14, 975. [Google Scholar] [CrossRef] [Scilit]
- Li, Y.; Chen, Y.; Guo, Y.; Bian, D.; Zhao, Y. Tribological Behavior of PEEK/PTFE Composites Reinforced with Carbon Fibers and Graphite. Materials 2022, 15, 7078. [Google Scholar] [CrossRef] [Scilit]
- Pei, X.; Lin, L.; Schlarb, A.K.; Bennewitz, R. Novel Experiments Reveal Scratching and Transfer Film Mechanisms in the Sliding of the PEEK/Steel Tribosystem. Tribol. Lett. 2016, 63, 40. [Google Scholar] [CrossRef] [Scilit]
- Puhan, D.; Wong, J.S.S. Properties of Polyetheretherketone (PEEK) transferred materials in a PEEK-steel contact. Tribol. Int. 2019, 135, 189–199. [Google Scholar] [CrossRef] [Scilit]
- Lin, L.; Schlarb, A.K. Effect of the varied load conditions on the tribological performance and the thermal characteristics of PEEK-based hybrid composites. Tribol. Int. 2016, 101, 218–225. [Google Scholar] [CrossRef] [Scilit]
- Zhang, G.; Zhang, C.; Nardin, P.; Li, W.-Y.; Liao, H.; Coddet, C. Effects of sliding velocity and applied load on the tribological mechanism of amorphous poly-ether-ether-ketone (PEEK). Tribol. Int. 2008, 41, 79–86. [Google Scholar] [CrossRef] [Scilit]
- Laux, K.A.; Schwartz, C.J. Effects of contact pressure, molecular weight, and supplier on the wear behavior and transfer film of polyetheretherketone (PEEK). Wear 2013, 297, 919–925. [Google Scholar] [CrossRef] [Scilit]
- Liu, K.; Zheng, J.; Shan, Z.; Yu, X.; Zhang, X.; Chen, X.; Fan, C.; Chen, Y.; Song, W.; Li, Z.; et al. Tensile deformation behavior and phenomenological constitutive model of PEEK over a wide temperature range. Mater. Des. 2025, 258, 114672. [Google Scholar] [CrossRef] [Scilit]
- Patadia, M.; Quinn, A.; Tank, M.; Jolowsky, C.; Luiz, L.; Psulkowski, A.; Kurilich, M.; De Leon, A.; Liang, R.; Sweat, R. Enhanced multifunctionality in carbon fiber/carbon nanotube reinforced PEEK hybrid composites: Superior combination of mechanical properties, electrical conductivity, and EMI shielding. Compos. Part B Eng. 2024, 284, 111674. [Google Scholar] [CrossRef] [Scilit]
- On, S.Y.; Kim, Y.S.; You, J.I.; Lim, J.W.; Kim, S.S. Dynamic characteristics of composite tilting pad journal bearing for turbine/generator applications. Compos. Struct. 2018, 201, 747–759. [Google Scholar] [CrossRef] [Scilit]

Disclaimer/Publisher’s Note: The statements, opinions and data contained in all publications are solely those of the individual author(s) and contributor(s) and not of MDPI and/or the editor(s). MDPI and/or the editor(s) disclaim responsibility for any injury to people or property resulting from any ideas, methods, instructions or products referred to in the content. |
© 2026 by the authors. Licensee MDPI, Basel, Switzerland. This article is an open access article distributed under the terms and conditions of the Creative Commons Attribution (CC BY) license.