


Highlights
What are the main findings?
- An icing wind tunnel characterized by low LWC and small MVD was developed.
- Icing conditions are realized by using cold air, ultrasonic atomization, and an airfoil configuration.
- The icing tests of the NACA 0018 airfoil were carried out under different temperatures.
- Several parameters characterizing the icing process and distribution were defined.
- Effects of temperature and airfoil material on icing characteristics of the airfoil were analyzed.
Abstract
In cold and humid environments in high-latitude, high-altitude, and offshore regions, ice accretion sometimes occurs on airfoil blade surfaces, such as those of wind turbines. Therefore, a potential hazard exists for the equipment. For this reason, the aerodynamic characteristics of the airfoil blade degrade and power generation decreases. In the present study, the icing characteristics of airfoils in cold and foggy environments were investigated. A novel icing wind tunnel with a low LWC of 0.3 g/m3 and a small MVD of 10 μm was designed and built. An airfoil sample with the aerodynamic profile of NACA 0018 was selected, and the effects of the airfoil material and the temperature on the icing area, the thickness of ice, and the coverage scope of ice were tested and analyzed. The experimental results showed that the temperature had a more significant effect on the icing characteristics in comparison with the airfoil material. At the medium temperature, −7 °C in the present study, the icing area, the thickness of ice, and coverage scope all reached their maximum value. Specifically, the maximum cross-sectional icing areas (CIAs) on the aluminum airfoil at −4 °C, −7 °C, and −10 °C for 60 min were 35.088 mm2, 66.357 mm2, and 51.538 mm2, respectively, and those on the FRP airfoil were 36.204 mm2, 70.352 mm2, and 47.814 mm2, respectively. The FRP airfoil had a larger icing area and thickness of ice. In contrast, the aluminum airfoil had a larger coverage scope of ice, which was −0.10~0.15. In addition, the aerodynamic performance of the iced airfoil, including Cd and Cm, was also obtained through CFD. The research findings provided a foundation for further exploring the atmospheric icing of wind turbines and other structures with airfoil profiles.
1. Introduction
With the intensification of global environmental pollution in recent years because of fossil fuel use, renewable energies are being developed rapidly around the world. Wind energy is one of the widely used renewable energies, which is commonly utilized to generate electric power [1]. However, most high-quality wind energy resources are predominantly distributed in high-altitude and high-latitude regions. Additionally, with the decrease in the available onshore wind resources, the offshore regions are being developed in many countries. In these regions, temperatures are usually low in winter, which may result in icing problems for wind turbines [2,3,4]. When icing occurs on a wind turbine blade, it changes the profile of the blade airfoil. For this reason, the aerodynamic characteristics of the blade degrade, and the power generation decreases [5,6,7]. In addition, icing on the blade surface also increases the loads on the rotor and transmission system, which may lead to serious accidents, such as reducing the lifespan of wind turbines [8]. Occasionally, ice shedding and collapse of wind turbines happen and threaten nearby people and buildings [9]. Therefore, it is necessary to explore the icing characteristics of airfoil blades to clarify the effects of icing on blade aerodynamic characteristics and power generation efficiency [10].
In addition to active deicing methods, passive anti-icing coatings, as an energy-saving solution for mitigating ice formation on engineering surfaces, are receiving increasing attention [11]. Such surfaces can relieve icing phenomena by repelling water droplets upon impact and reducing ice bond strength [12]. Therefore, recent research has increasingly emphasized the performance of anti-icing coatings for practical applications in terms of mechanical durability and adhesion between the coating and the substrate [13,14]. However, in addition to surface modification via functional coatings, the inherent properties of the substrate itself can influence the ice accretion behavior. Therefore, it is necessary to determine whether different commonly used blade materials exhibit significant differences during the ice accretion process under atmospheric icing conditions.
At present, scholars at home and abroad have carried out some studies. The research methods included simulation and experimental methods [15,16,17,18,19]. The numerical simulation can quantitatively explain the ice distribution on an airfoil surface under different icing conditions, and the effect of ice on the aerodynamic characteristics can also be analyzed directly [20,21]. However, compared with the experimental method, the simulation method still can not describe the icing characteristics accurately, because the real icing condition is complex. Therefore, the experimental method is still the key research method right now [22]. Usually, the icing tests of airfoil blades were carried out in the icing wind tunnel, which could modulate the wind speed, temperature, liquid water content (LWC), and so on [23,24].
For this kind of icing wind tunnel, accurate characterization of droplet size and droplet-size distribution is important. Various optical techniques, including laser diffraction, phase Doppler methods, light-scattering probes, and imaging-based techniques, have been developed for droplet-size measurements [25,26]. The LWC and droplet-size distribution are essential for ensuring reliable icing wind-tunnel tests [27]. However, different measurement principles may yield discrepancies because of differences in sampling strategy, measurable size range, droplet concentration, and optical characteristics.
Nevertheless, in most works, the icing conditions were characterized by high LWC and large median volume diameter (MVD), with a nozzle used for atomization. In this way, the LWC and MVD could not simulate the real icing conditions in nature. In a natural icing environment, the LWC is usually lower than 0.5 g/m3, and the MVD is about 10~15 μm [28,29]. Therefore, it is difficult to reproduce natural icing conditions using a nozzle. For this reason, it is imperative to explore the icing characteristics of airfoils under low-LWC and small-MVD conditions.
In the present study, an icing wind tunnel was designed and built with low-LWC and small-MVD conditions. Based on the icing wind tunnel, the icing characteristics of the NACA 0018 airfoil were explored at different icing temperatures and using different airfoil materials. The icing thickness and distribution were defined and analyzed quantitatively. The research findings provided a foundation for further exploring the atmospheric icing of wind turbines and other structures with airfoil profiles.
2. Experimental Schemes
In the present study, the icing characteristics of the NACA 0018 airfoil under low-LWC and small MVD conditions were investigated. The experimental schemes are listed in Table 1.
Table 1.
Experimental scheme.
As listed in Table 1, the NACA 0018 airfoil type was selected as the icing object, and two kinds of airfoil materials, aluminum alloy (6061) and fiber-reinforced plastics (FRPs), were selected. The surface roughness of the two materials was 0.17 μm and 0.236 μm, and the contact angles were 83° and 53°. The test samples are shown in Figure 1.
Figure 1.
Test samples of NACA 0018 airfoils: (a) aluminum airfoil; (b) FRP airfoil.
As shown in Figure 1, the chord lengths of the two NACA 0018 airfoil samples were both 100 mm. NACA 0018 airfoil has a symmetrical structure, which is widely used in the fields of small-scale wind turbines and basic research. Additionally, for large-scale wind turbines, the blades are usually made of FRP to reduce the weight. Therefore, two types of materials were selected in the present study. In the present study, the icing tests were carried out under low wind speed. For common working conditions of wind turbines, the average wind speed was 4~6 m/s, so the wind speed of 4 m/s was decided as the experimental parameter. For each icing condition, the tests were carried out 5~10 times.
3. Experimental System
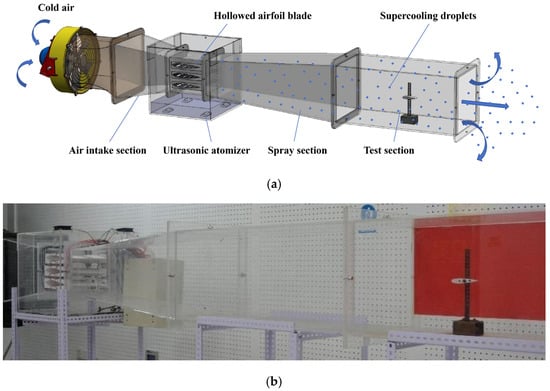
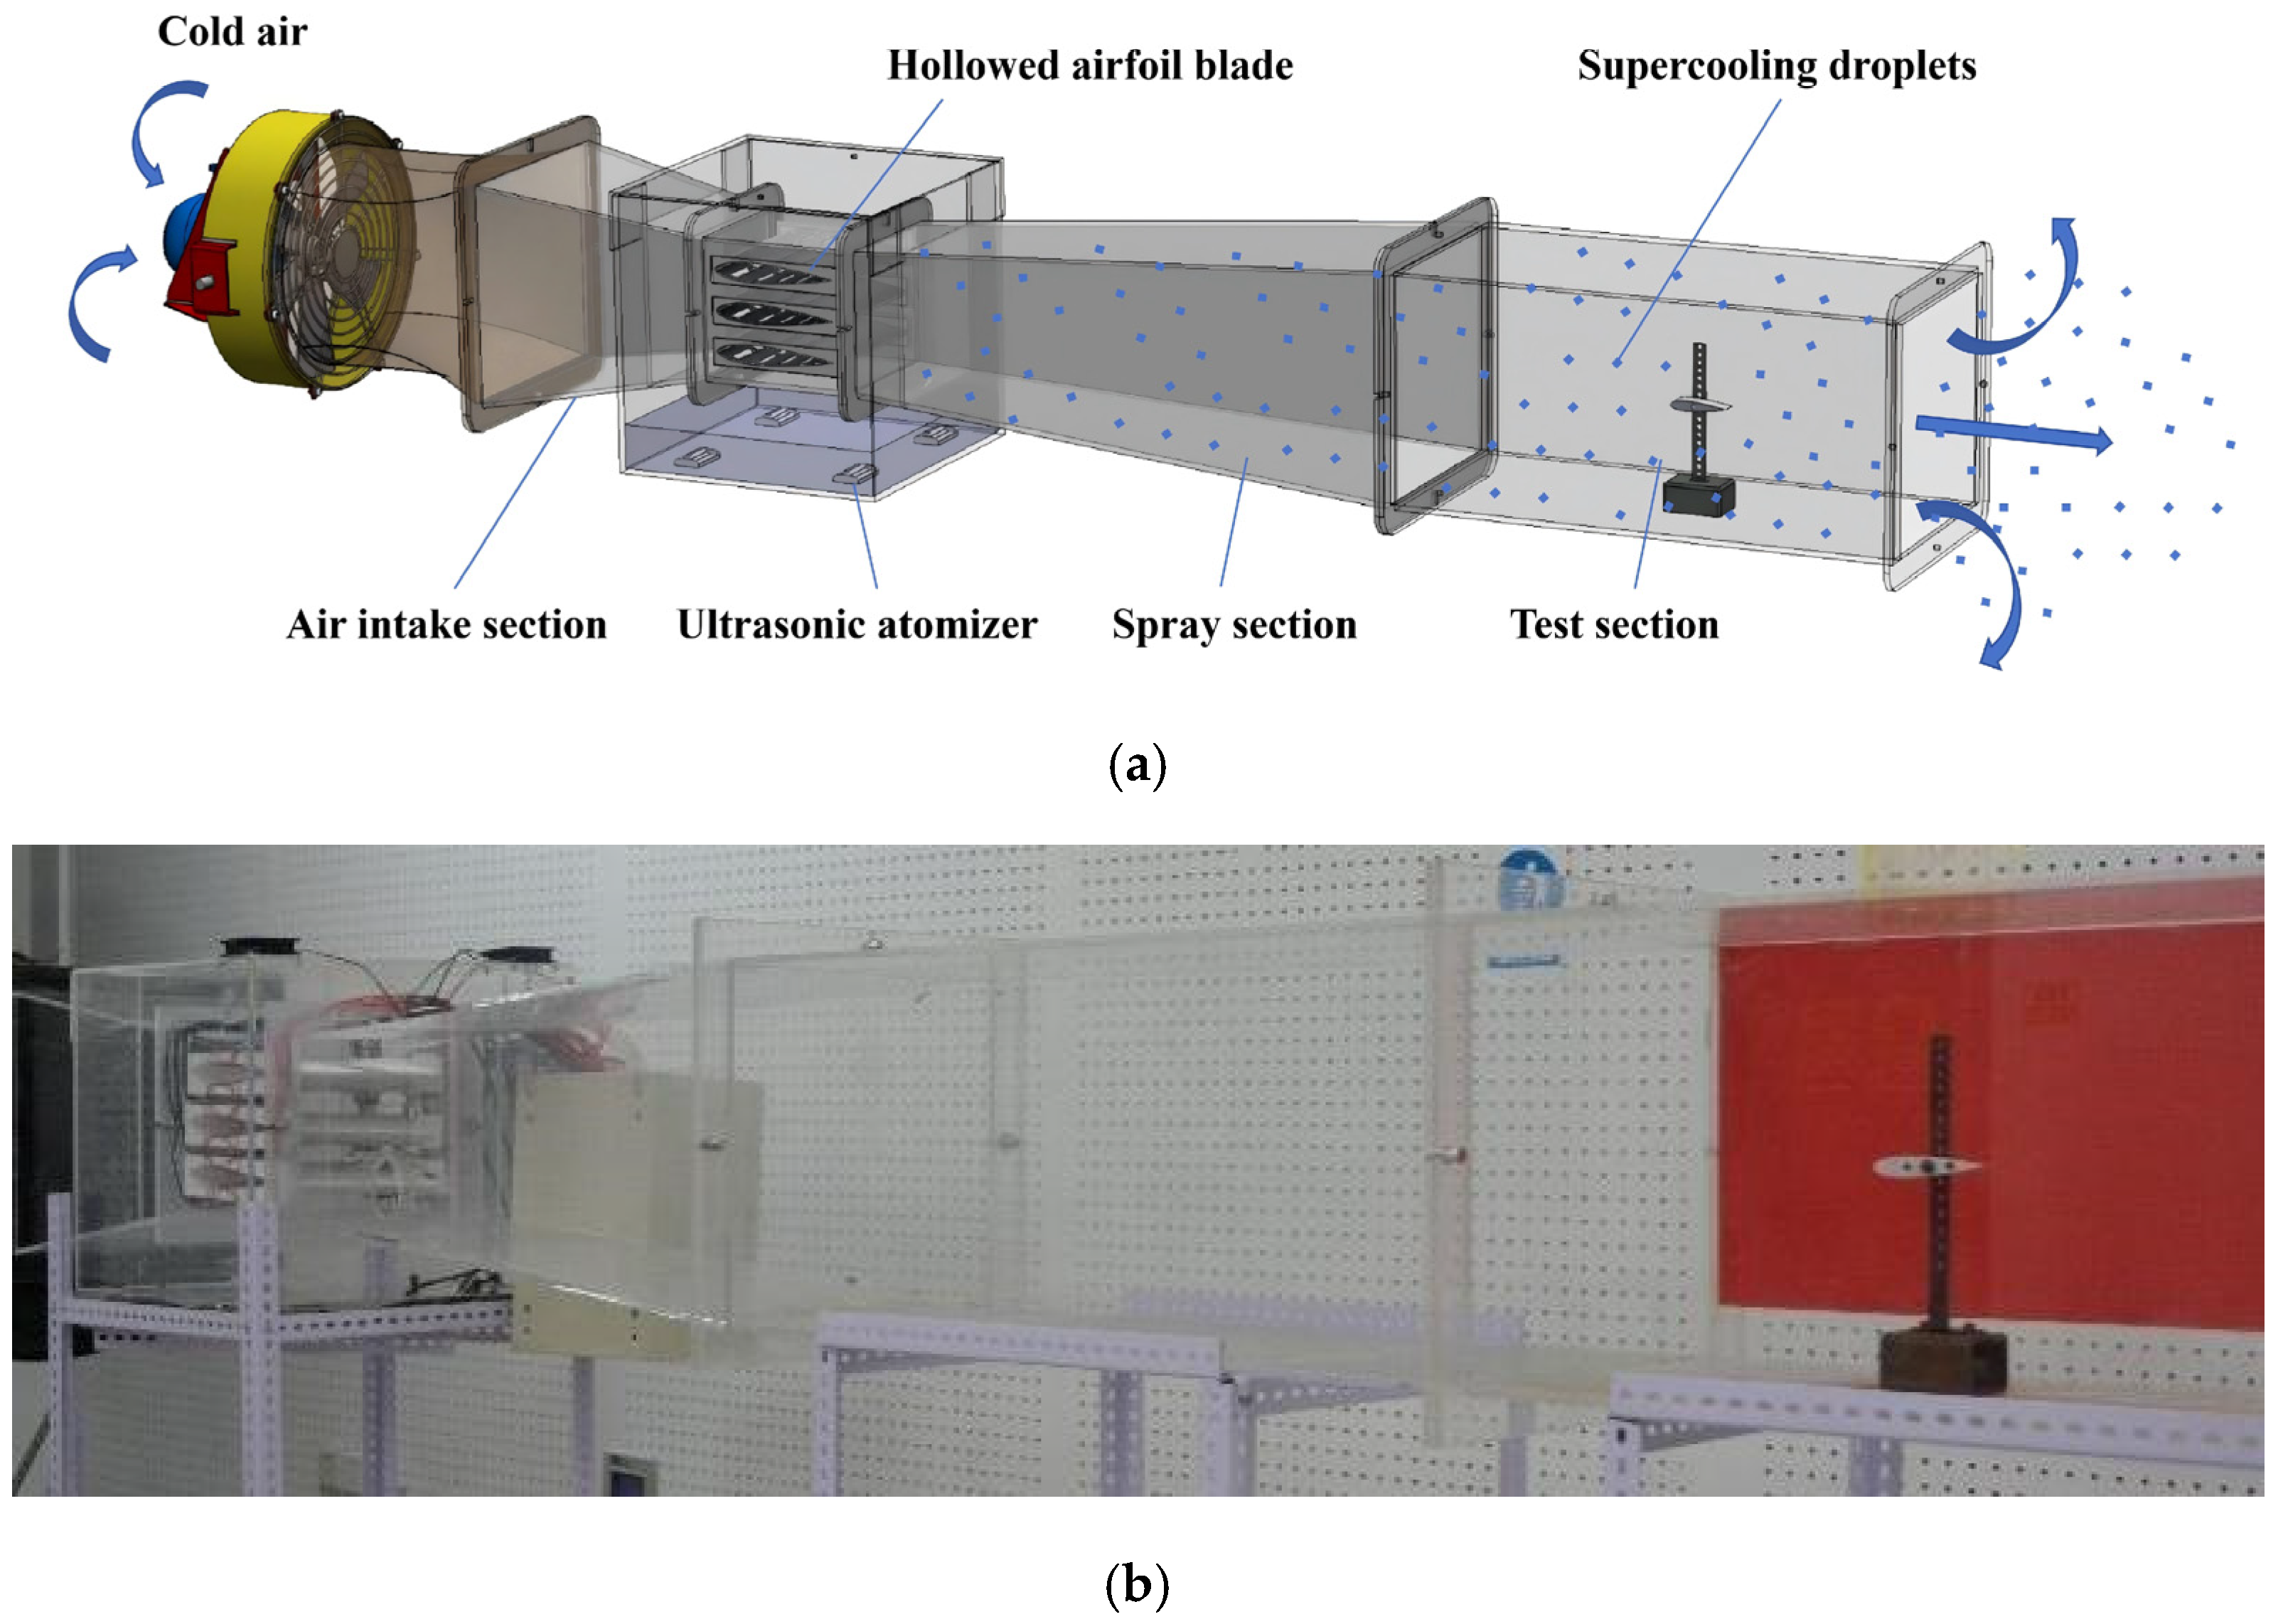
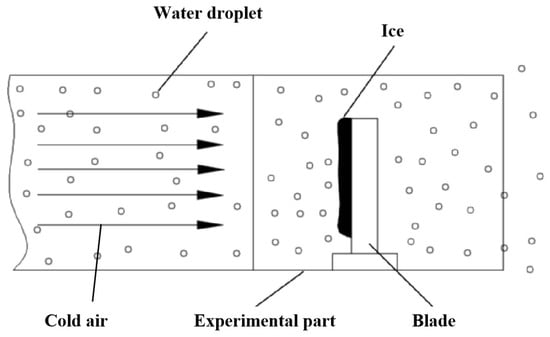
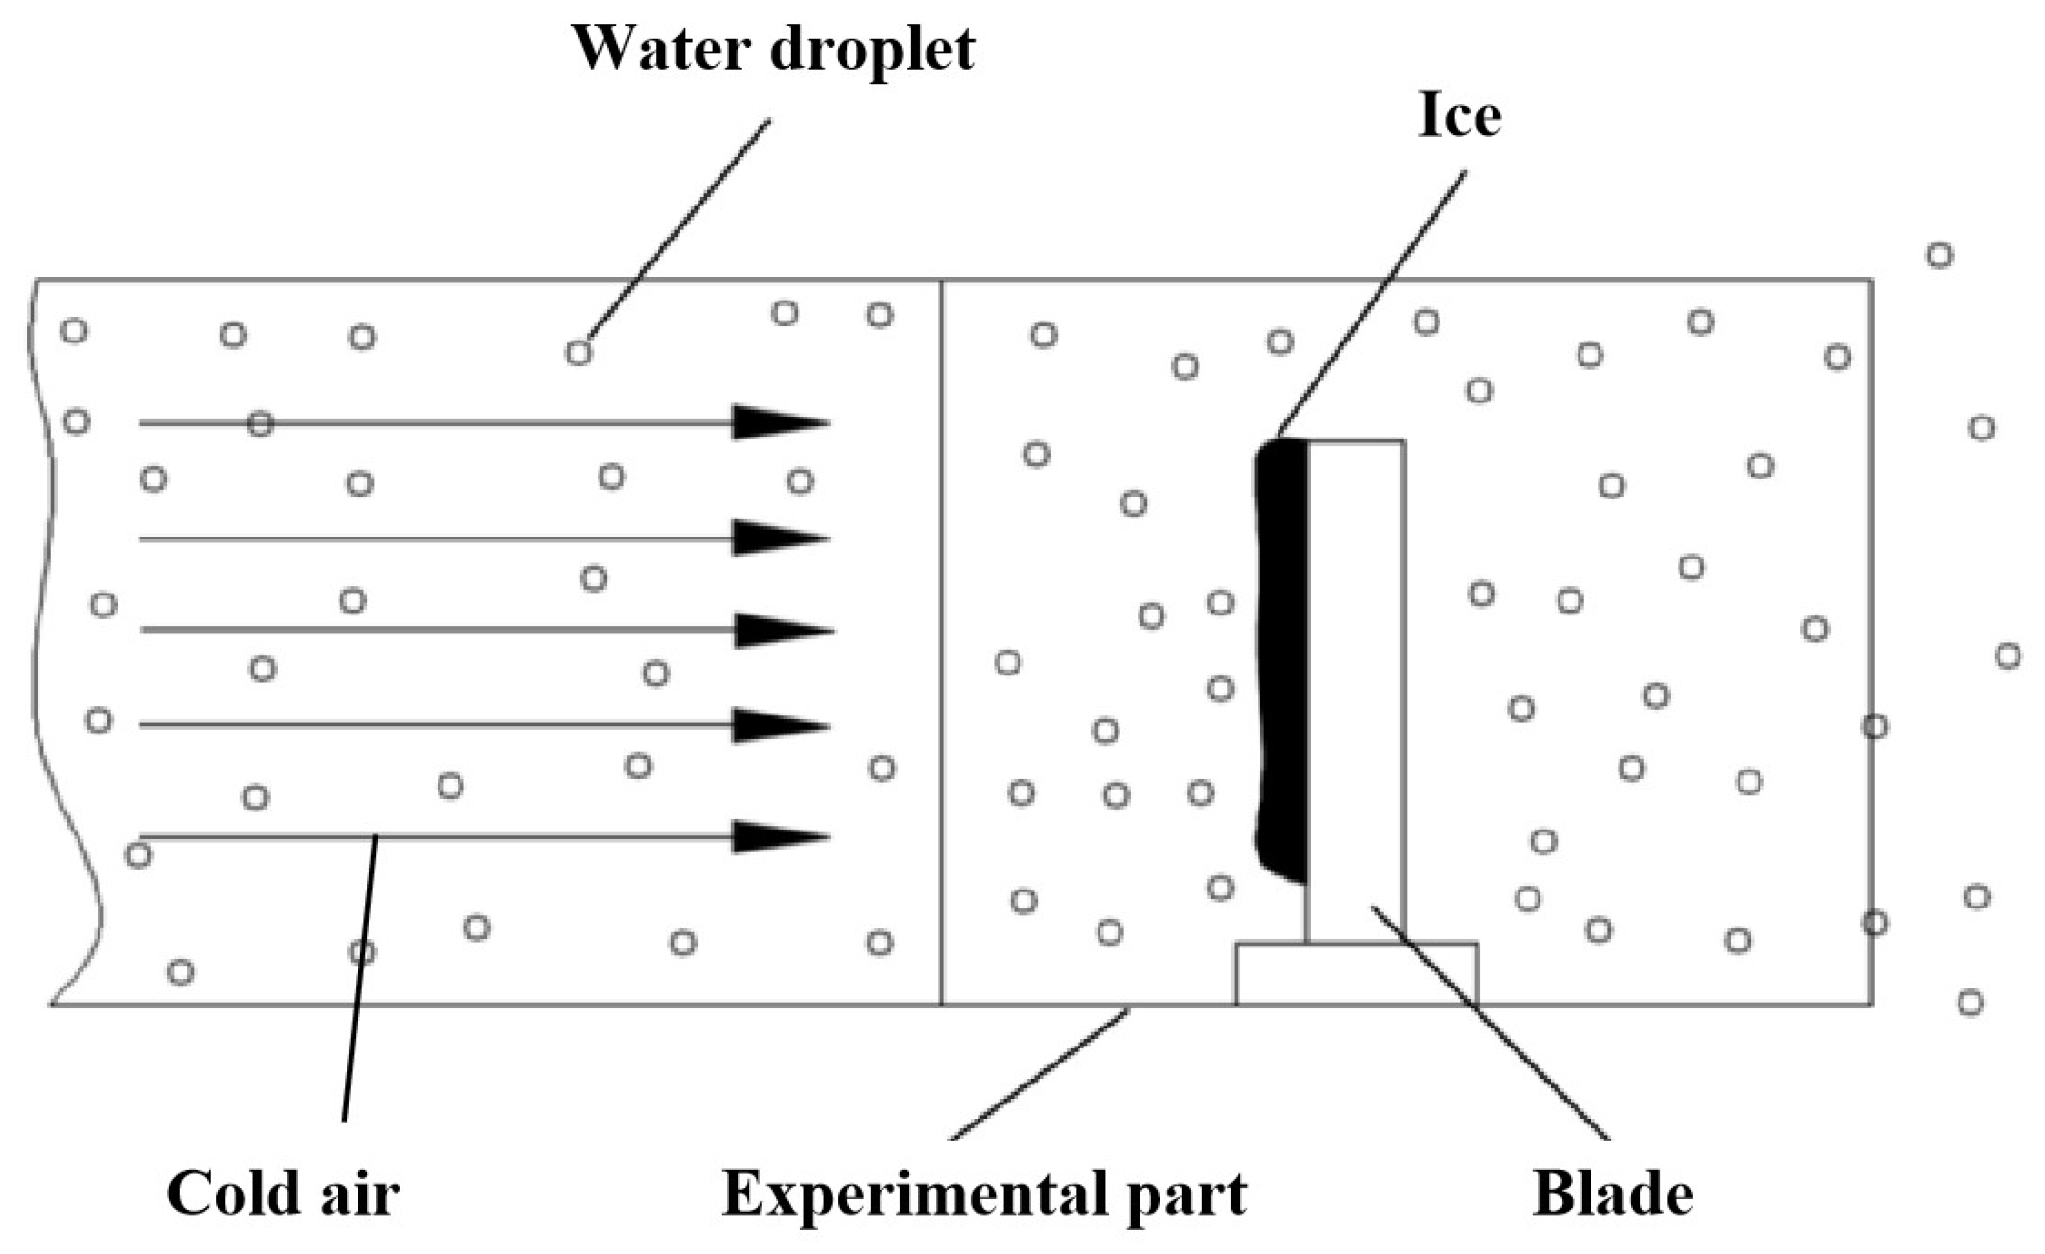
Based on the experimental scheme, an experimental system for icing tests was designed and built, as shown in Figure 2.
Figure 2.
Experimental system: (a) schematic diagram of the experimental system; (b) prototype of the icing wind tunnel.
The icing wind tunnel had the advantages of low LWC and small MVD. The icing wind tunnel mainly comprises three parts: the low-temperature air intake part, the fog generation part, and the experimental part. The test section is 900 mm in length, 400 mm in width, and height.
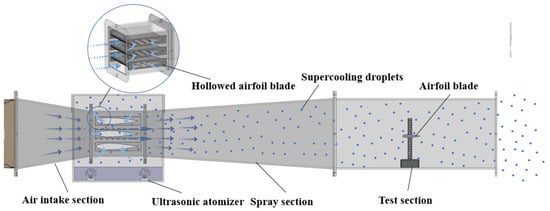
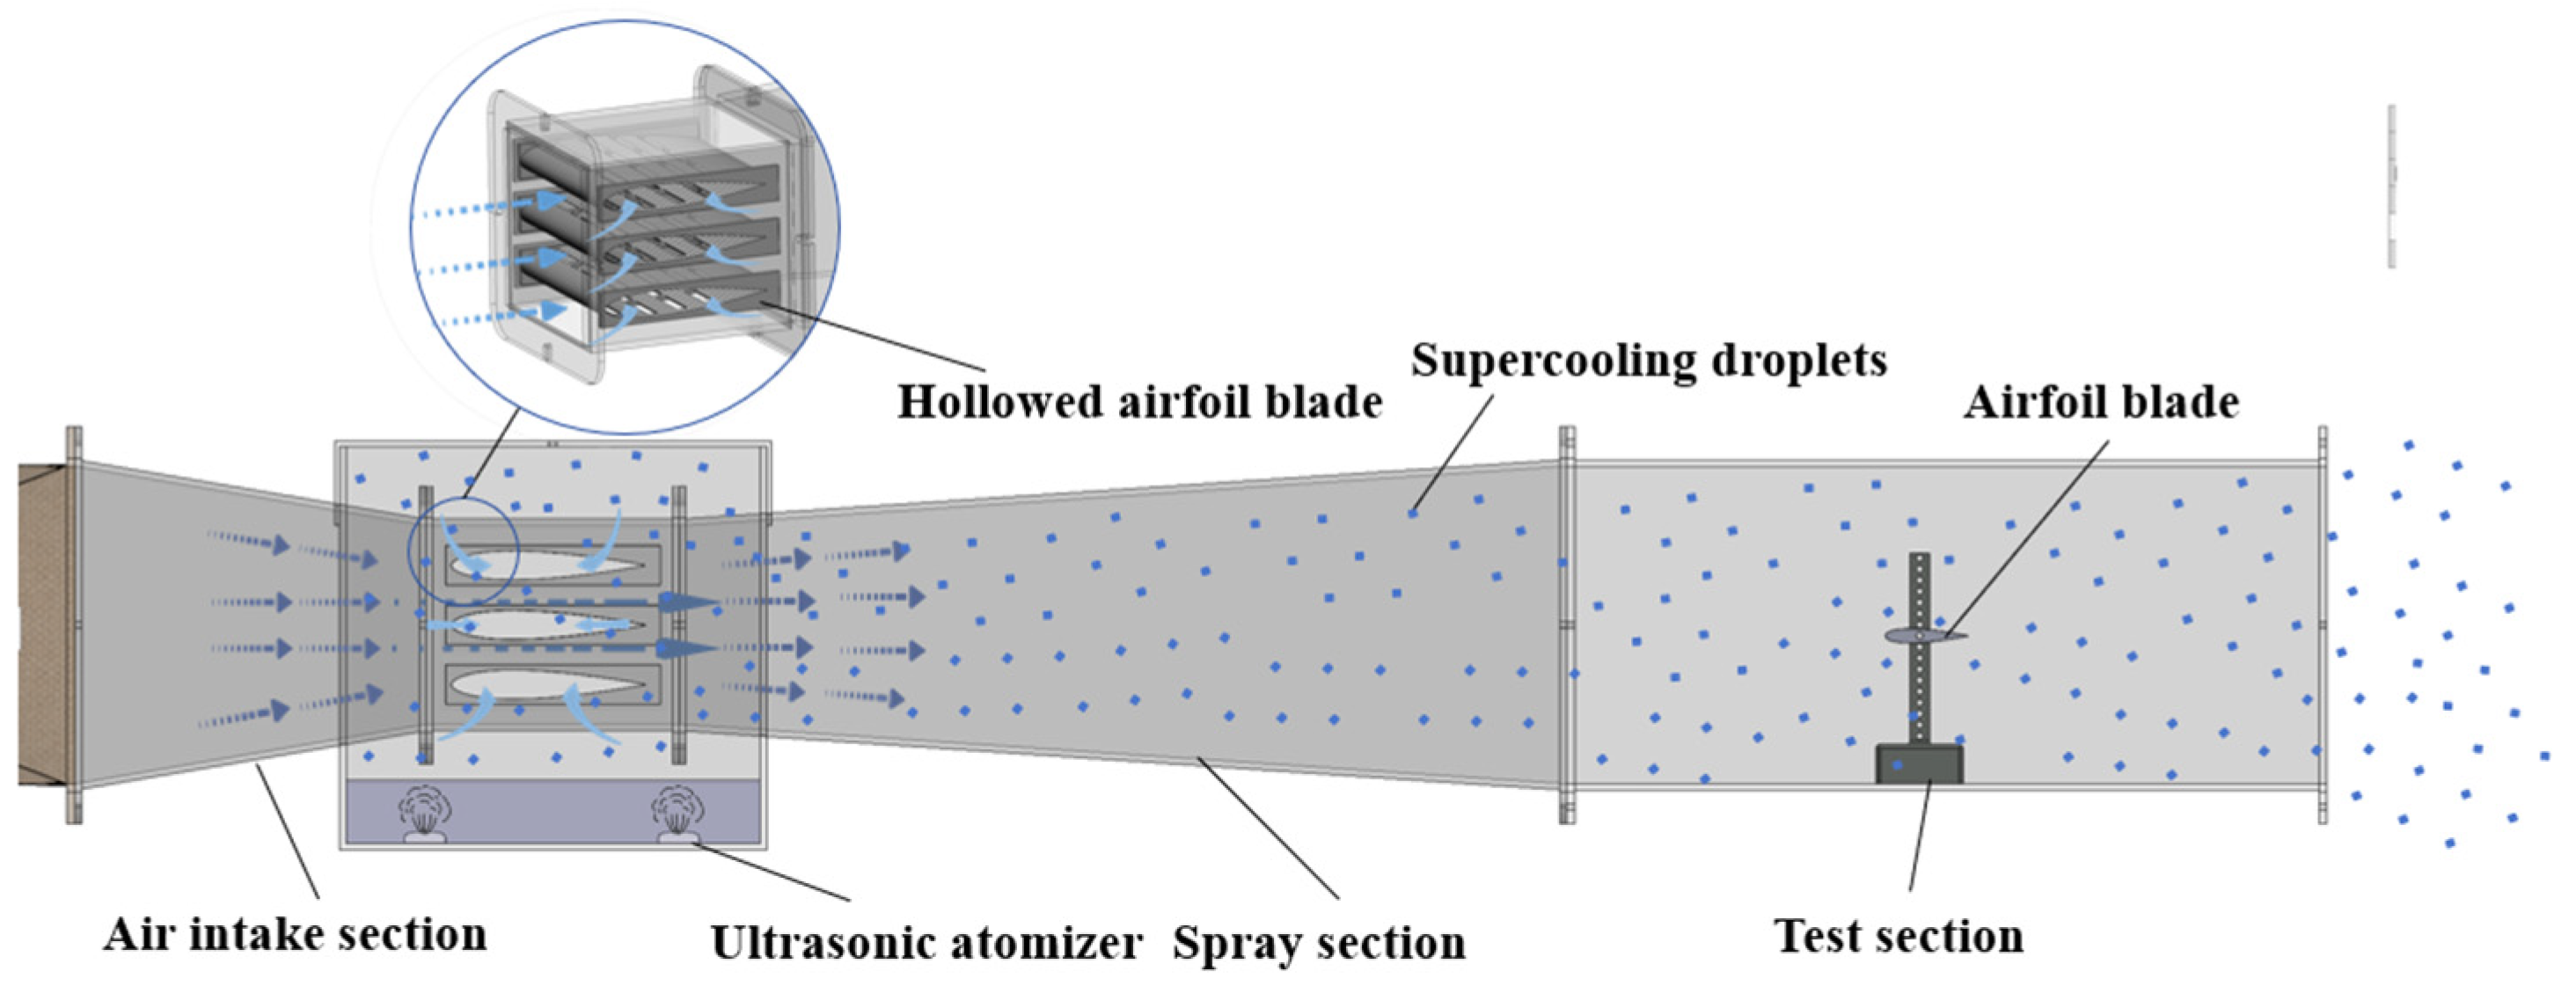
For the low-temperature air intake part, the cold air was sucked into the icing wind tunnel from the outdoor environment in winter. In the present experimental system, the refrigeration device was omitted because our lab was located in the northeast of China. In winter, the outdoor temperature was usually in the range of −10~−25 °C. Therefore, there was a large amount of cold air resource for experiments. In this way, it could reduce the energy consumption for long-term refrigeration. In the fog generation part, a brand-new method was developed in the present study. In previous works, most experiments used nozzles to atomize the water into droplets, which might result in high LWC and large MVD. For this reason, the icing conditions could not simulate the real icing environment. To avoid this problem, some scholars carried out the icing tests in the outdoor field. However, the experimental parameters in the natural environment were not stable; thus, it was difficult to carry out icing tests systematically. To solve the problem, a brand-new atomization method was developed in our research. The principle is shown in Figure 3.
Figure 3.
The principle of atomization in the present study.
As shown in Figure 3, the atomization section was composed of two parts: the fog generation part and the inhalation part. The fog generation part produced fog by ultrasonic atomization. In this way, the MVD was small and approximately equal to the real size of water droplets in the natural environment. After that, the fog was sucked into the wind tunnel by the inhalation part. The inhalation part had a profile of a NACA 0018 airfoil with a hollow structure that had slots along the airfoil surface. As the cold air flew along the airfoil surface, the wind speed increased, and the atmospheric pressure decreased. Then the fog was inhaled into the wind tunnel and mixed with the cold air. After mixing, the cold air with the micro water droplets flew into the test section. In the present study, the temperature of the water droplets was stable, and their state was similar to that of the supercooled water droplets. The ice-water mixture located in the water tank was used in the tests.
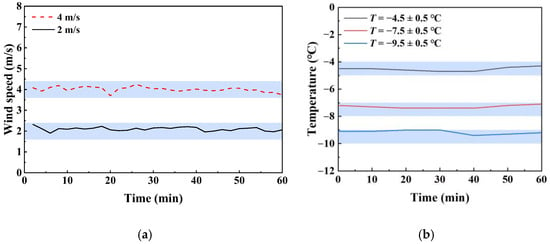
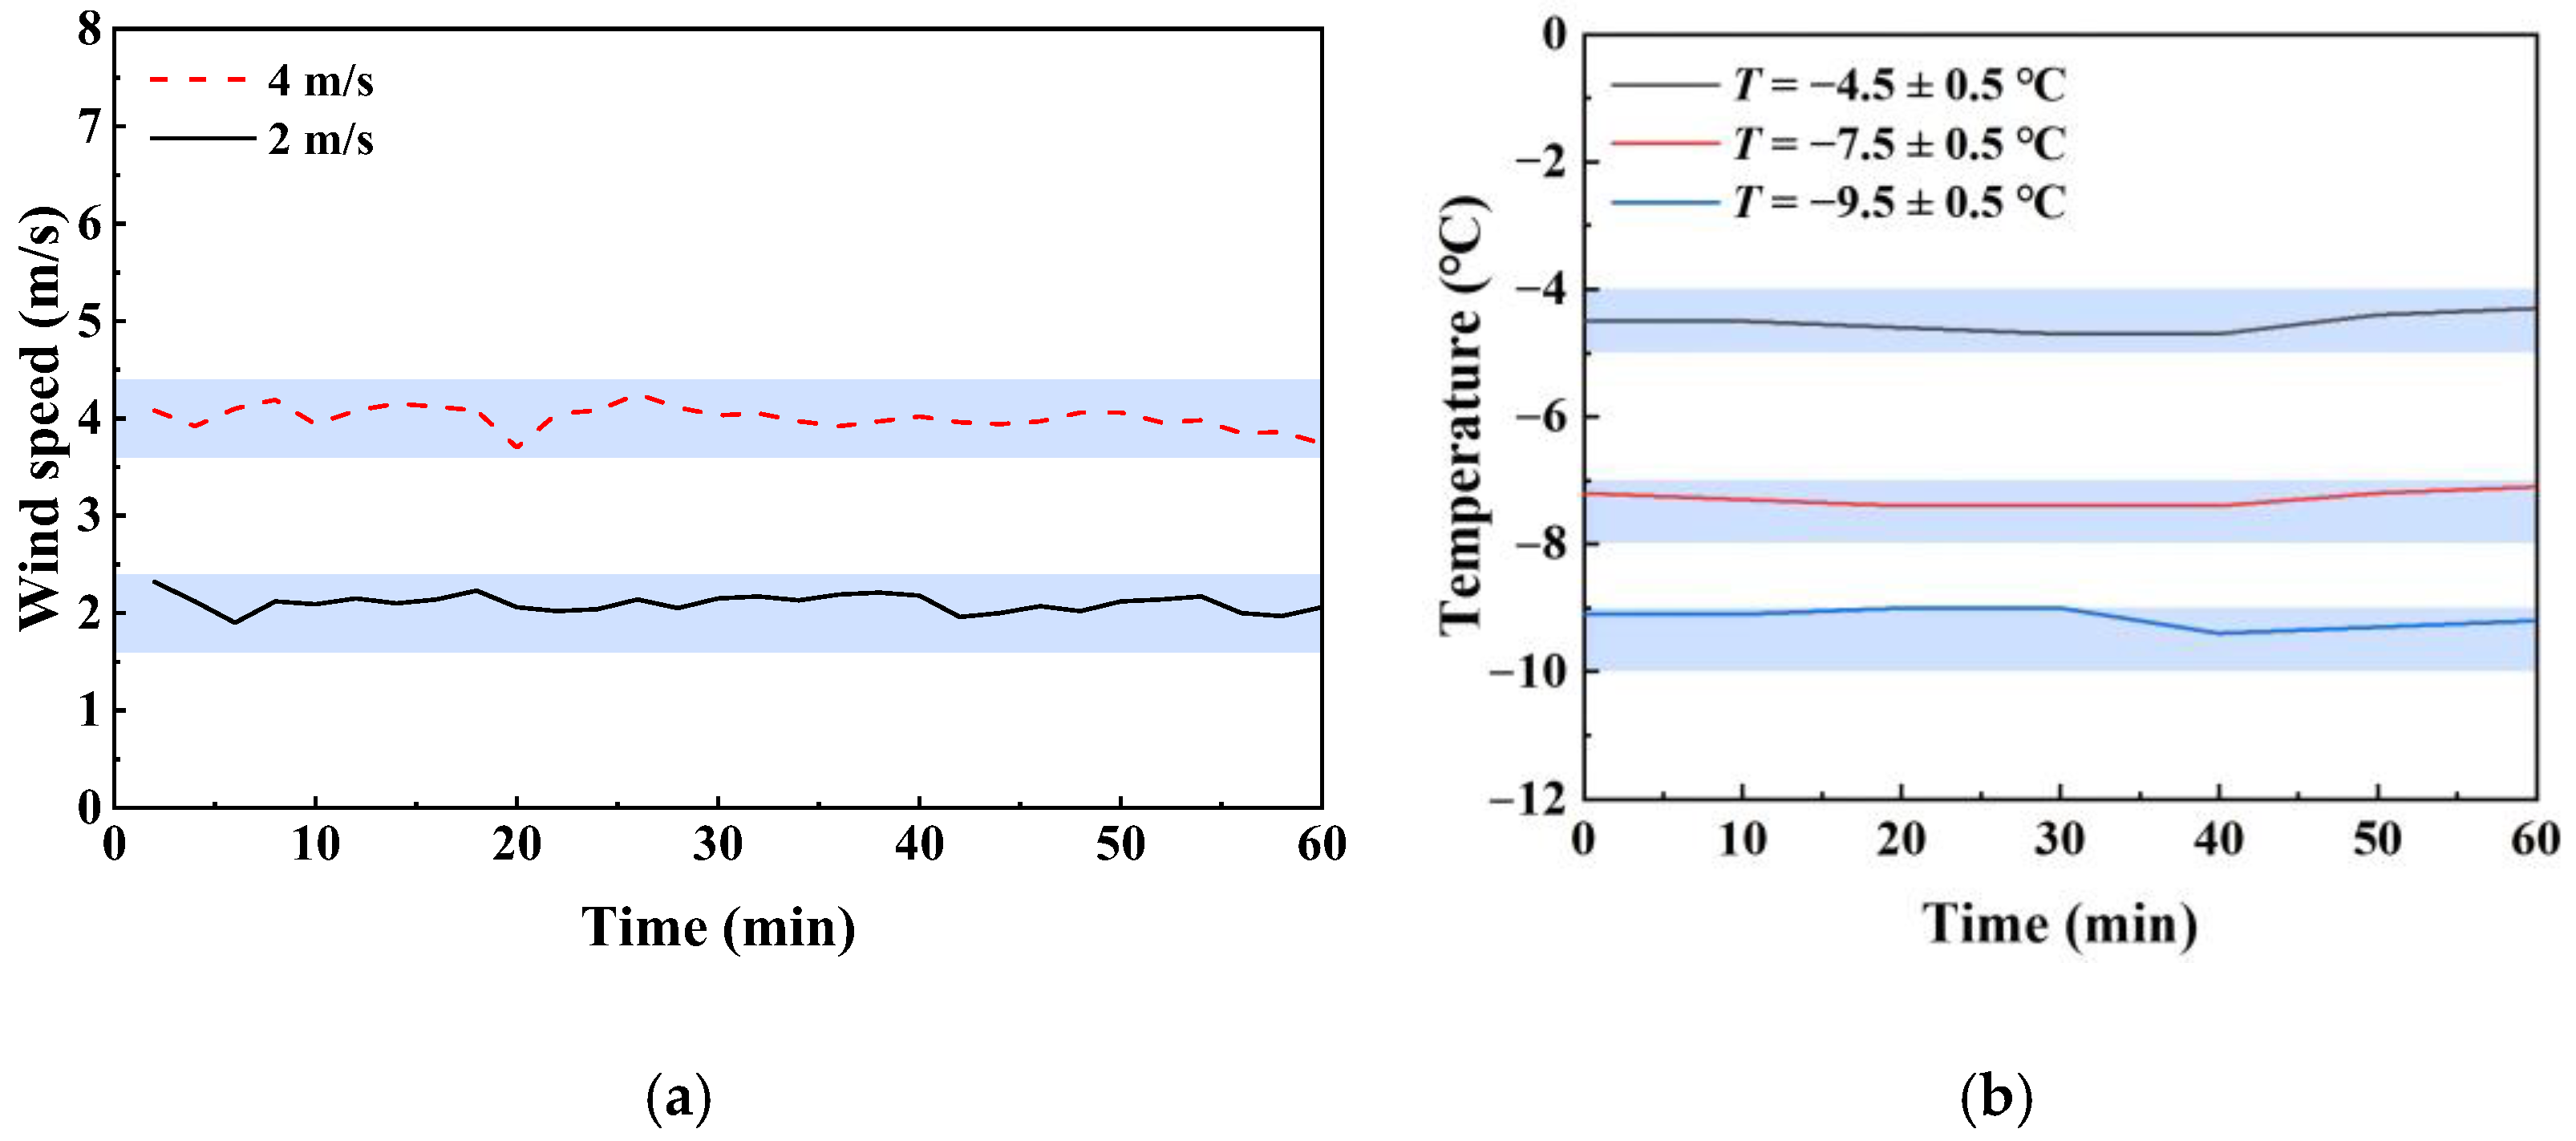
Before the icing tests, the stability of the wind speed and the total temperature in the icing wind tunnel were calibrated, as shown in Figure 4. In this stage, a thermal anemometer with model DT-3880C was used for wind speed and temperature measurement. Its measurable wind-speed range is 0–30 m/s, with a resolution of 0.01 m/s. At the experimental wind speed of 4 m/s, the corresponding instrumental uncertainty was approximately ±0.19 m/s. The temperature measurement range of the instrument is −20 to 70 °C, with a resolution of 0.1 °C.
Figure 4.
Variations in the wind speed and total temperature in the icing wind tunnel: (a) wind speed; (b) total temperature.
Calibration and acceptance of icing wind tunnels (SAE ARP5905) have gained widespread recognition in the international field of aircraft icing certification. This document provides indicators for the quality of the heat flow field in an icing wind tunnel. It should be noted that the document gives the static air temperature as an indicator, but since static air temperature cannot be measured directly with a total temperature probe and needs to be calculated indirectly from total air temperature and airspeed, the total temperature was selected as the parameter to represent the heat flow field, which is more representative.
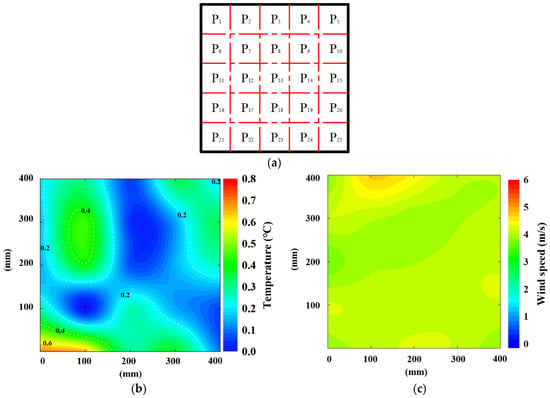
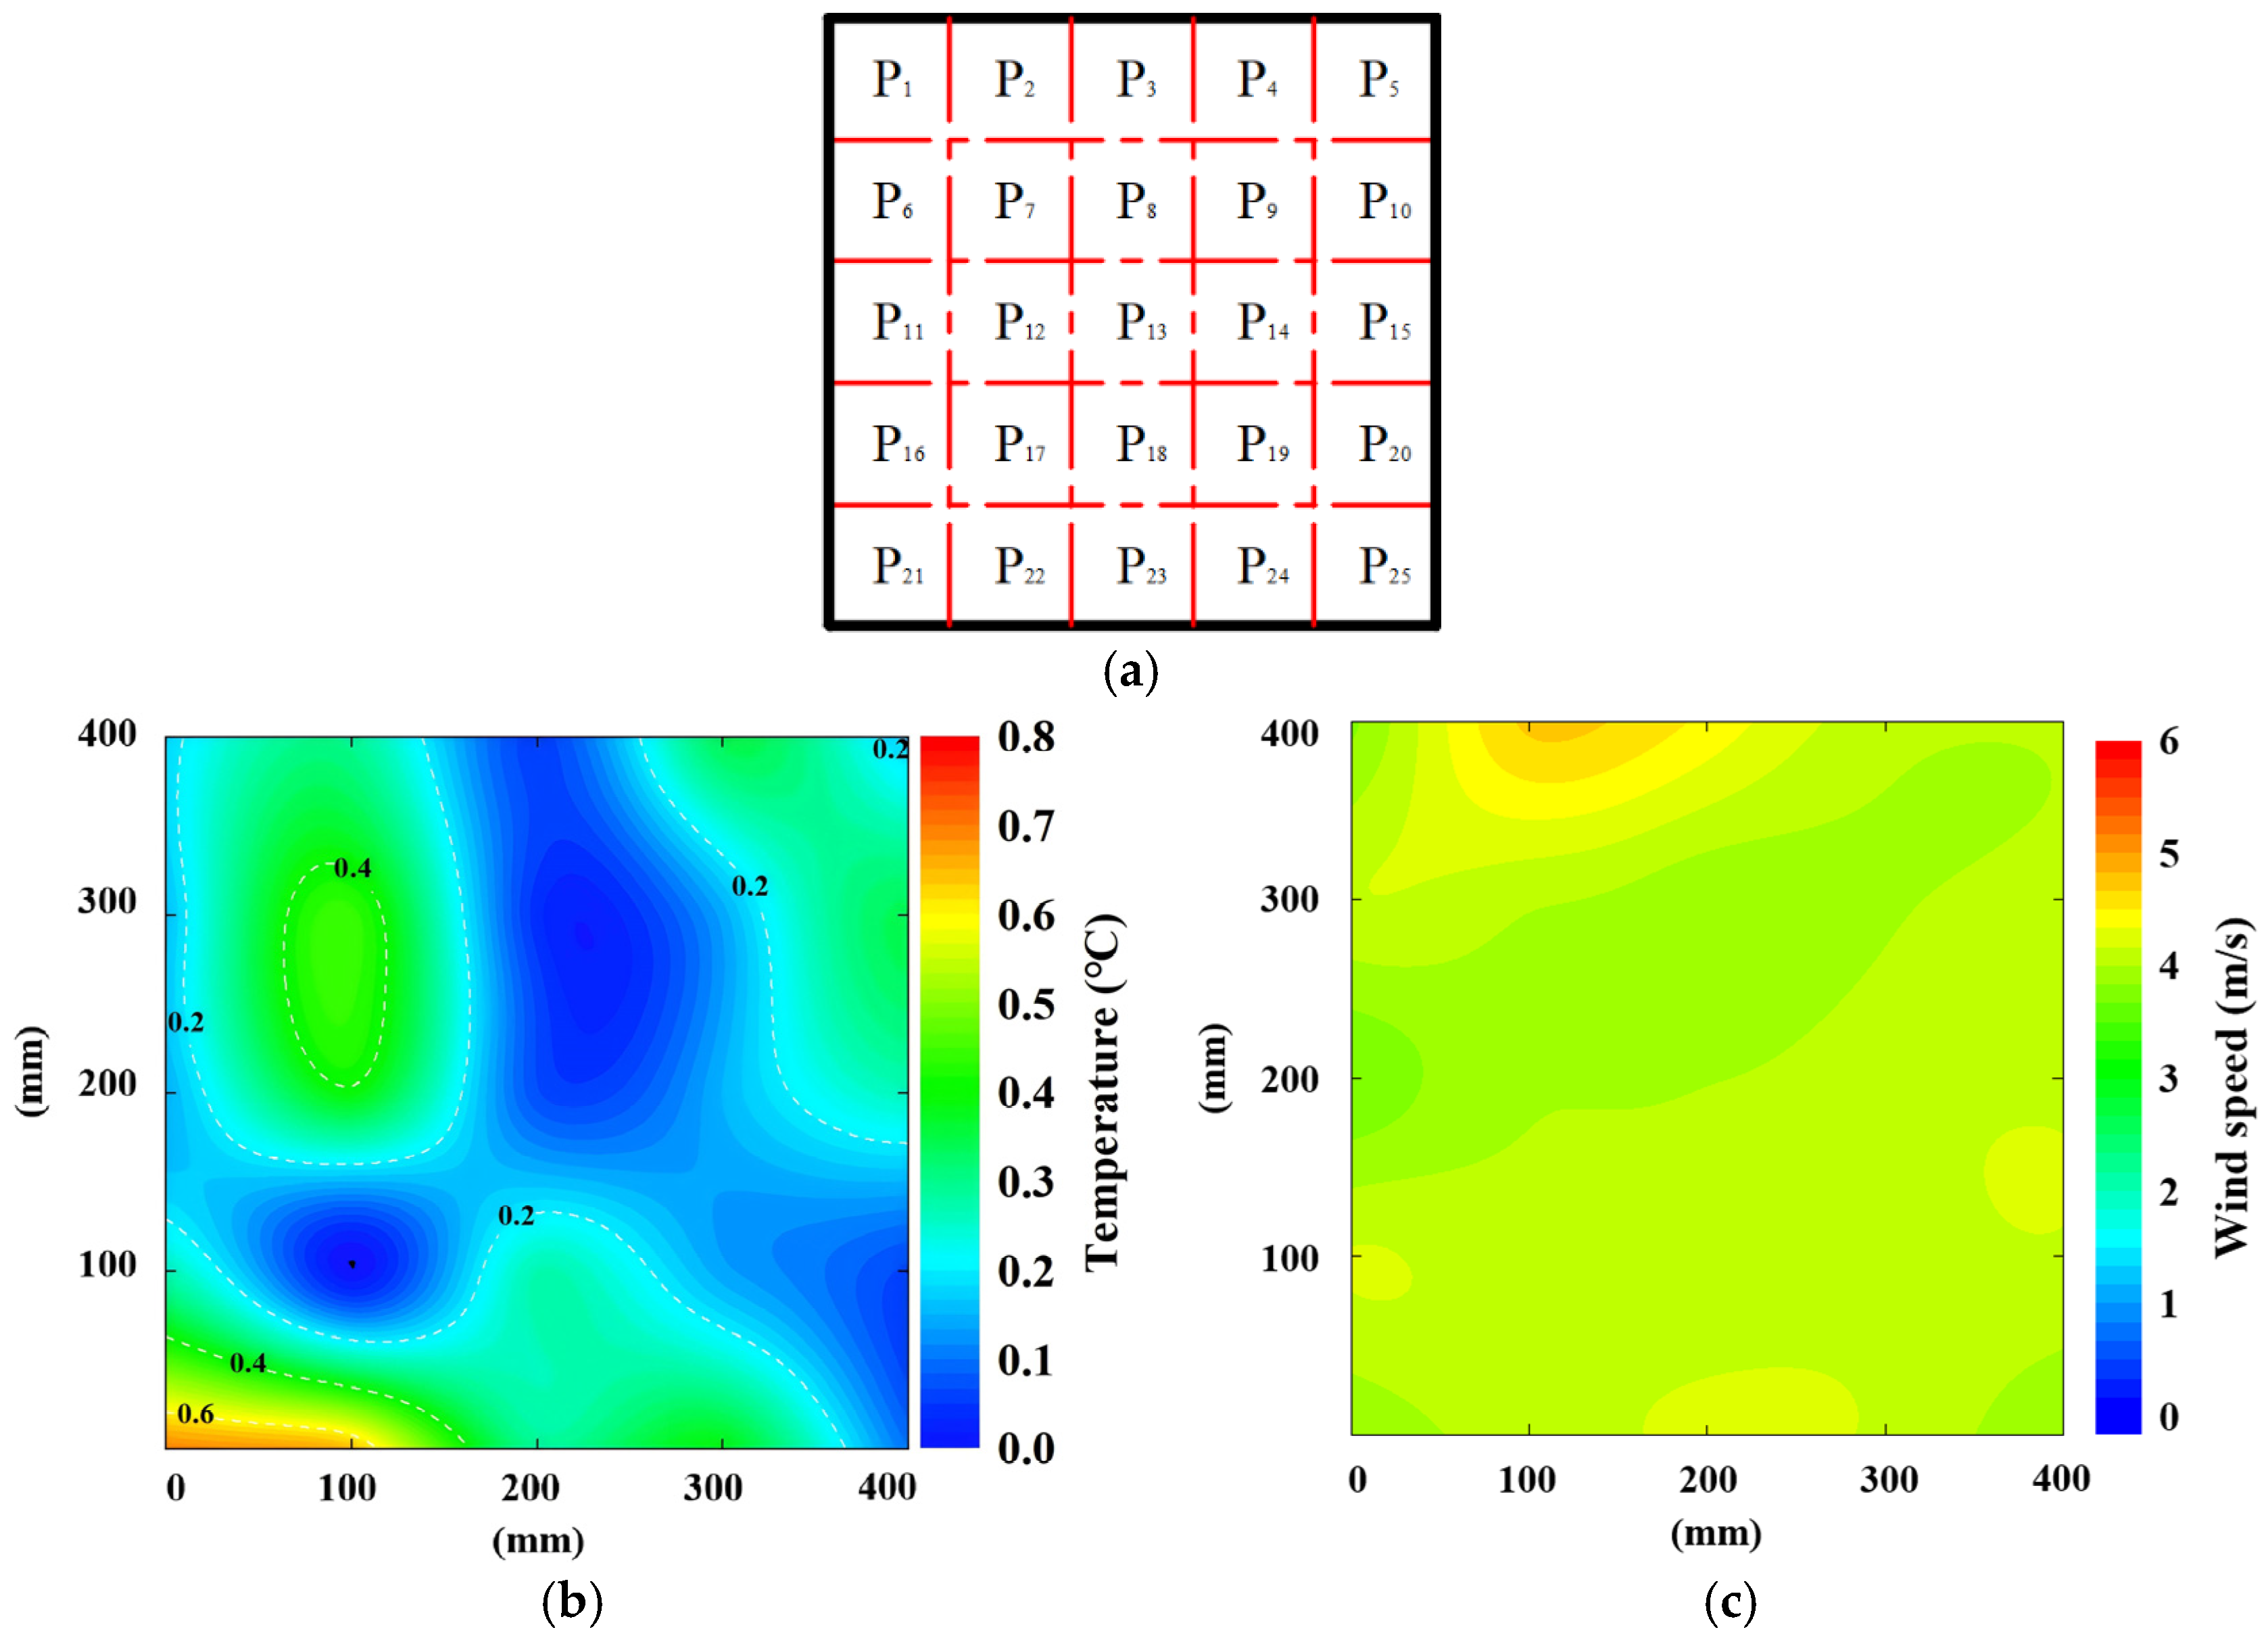
As shown in Figure 4, the wind speed and the temperature in the icing wind tunnel were measured continuously for one hour. As shown in Figure 4, they were stable during the operation of the wind tunnel. The wind speeds of 4 m/s and 2 m/s were measured. When the wind speed was 4 m/s, the error was lower than 6%. In contrast, when the wind speed was 2 m/s, the error was lower than 16%. Therefore, the icing tests were carried out at a wind speed of 4 m/s first. Similarly, the variation in temperature was lower than 0.5 °C. Additionally, their distributions in the icing wind tunnel were also measured and analyzed, as shown in Figure 5.
Figure 5.
Distributions of the wind speed and the total temperature in the icing wind tunnel: (a) positions of measuring points at the cross-section of the experimental part; (b) error distribution at the temperature of −6 °C; (c) distribution of wind speed.
As shown in Figure 5, at the cross-section of the experimental part, twenty-five measuring points were selected uniformly to calibrate the distributions of temperature and wind speed before tests. The selected temperature and wind speed were −6 °C and 4 m/s, respectively. According to the plot contours, their distributions were uniform to meet the SAE ARP5905 and experimental requirements.
Additionally, the LWC, which is an important parameter affecting atmospheric icing characteristics such as the icing type, icing shape, and icing amount, was also measured under a wind speed of 4 m/s. The measuring method was based on the grid method and icing blade method, as shown in Figure 6.
Figure 6.
Measurement of LWC.
As shown in Figure 6, a piece of blade with a thickness of 2 mm was placed in the center of the experimental part. In this way, the blade could collect the water droplets colliding with it and freeze gradually over time. In this process, water droplets were assumed to freeze completely upon impacting the blade, and the windward surface of the blade was assumed to completely capture all droplets. Then the LWC could be calculated by Equation (1).
where ρi is the density of rime ice, h is the thickness of ice, v is the wind speed, and Δt is the icing time.
According to the measuring method and Equation (1), the LWC in the present icing wind tunnel under a wind speed of 4 m/s was about 0.25~0.32 g/m3, which was far lower than our previous experimental conditions. In the natural environment with a fog climate, the LWC in the air was usually lower than 0.5 g/m3 [30,31]. Therefore, the LWC in the present study was approximately equal to that under natural conditions. In addition, the MVD of water droplets generated by ultrasonic atomization with the W0403-1 model was 1~10 μm, which was also similar to that in the natural environment.
4. Experimental Results
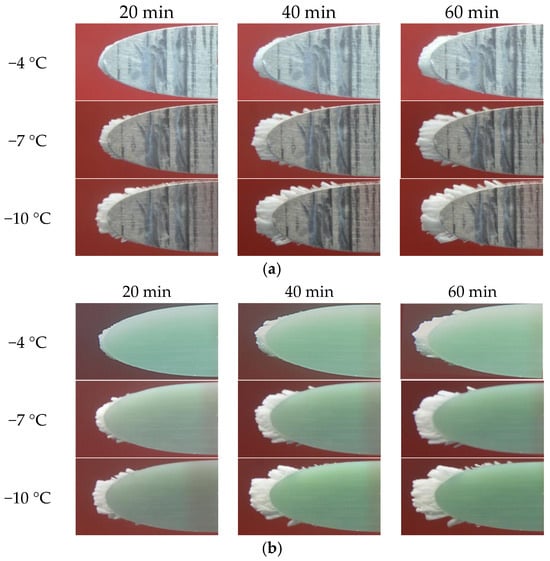
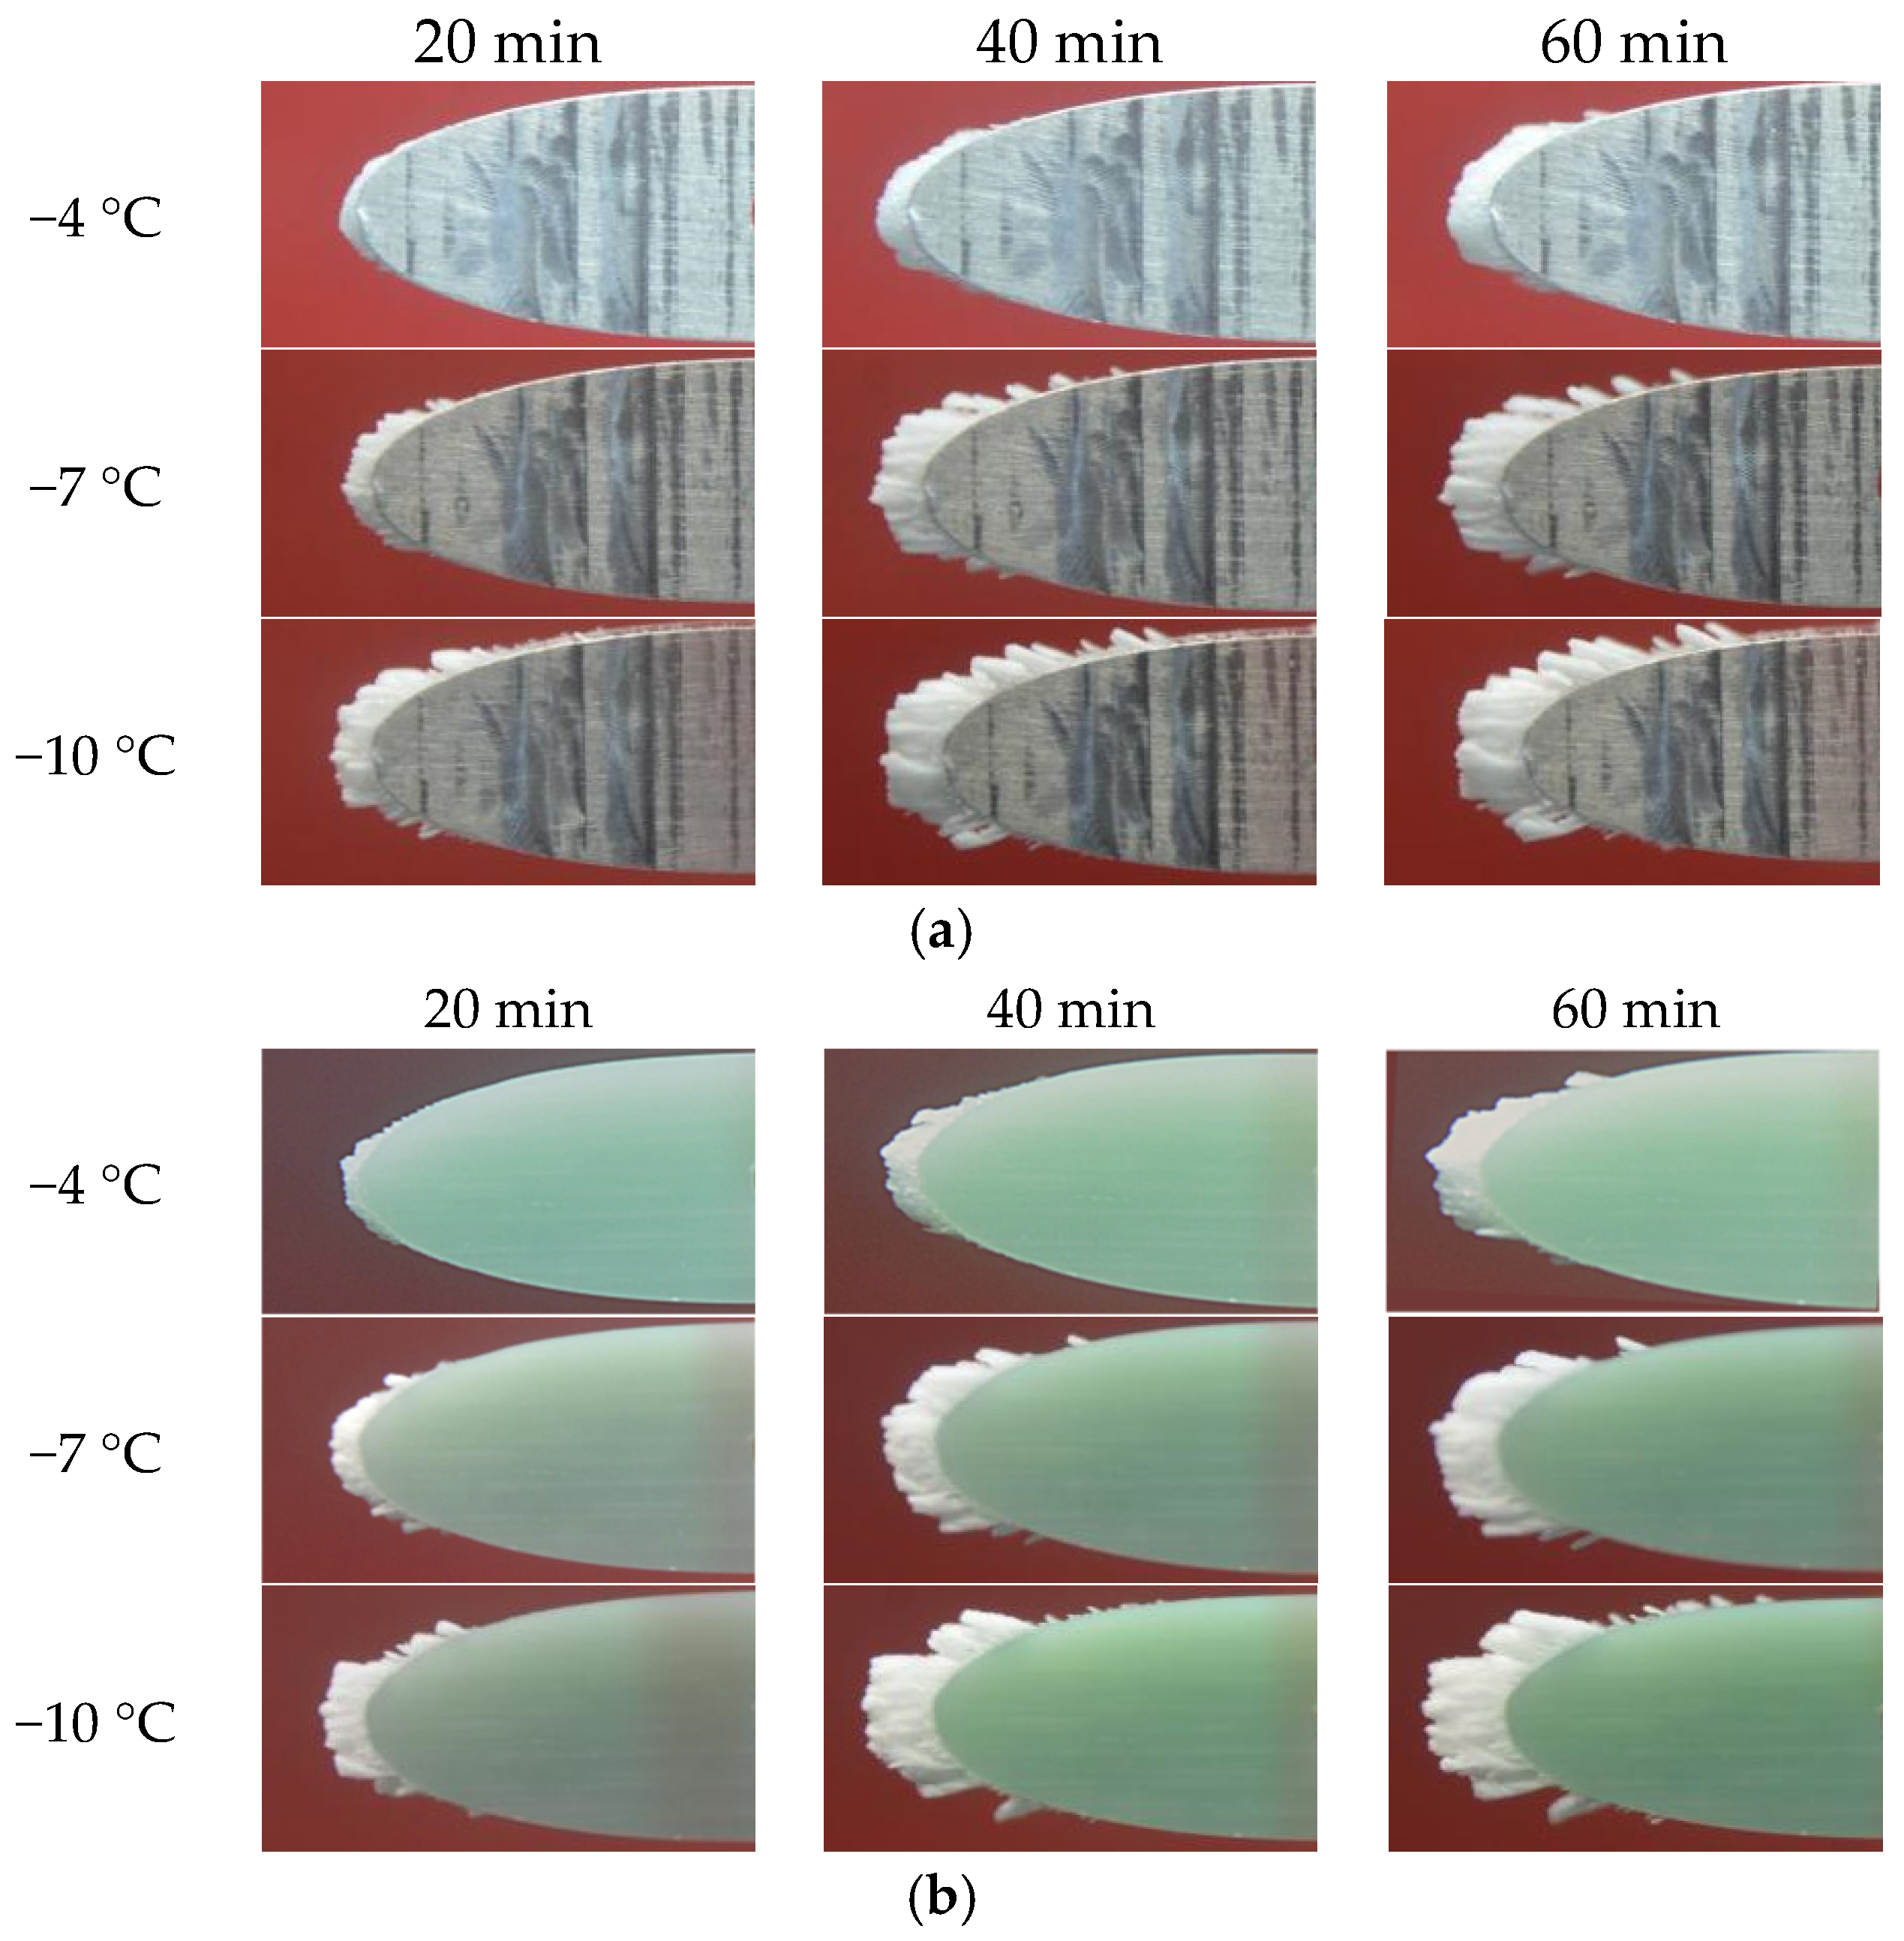
Based on the above experimental scheme and system, the icing tests of NACA 0018 airfoils were carried out, and the experimental results are shown in Figure 7.
Figure 7.
Experimental results of the icing tests of airfoils: (a) icing on the aluminum airfoil; (b) icing on the FRP airfoil.
As shown in Figure 7, icing tests were carried out on the surfaces of the aluminum and the FRP airfoils. It was found that the icing events occurred mainly on the leading edge of the airfoils. The ice layer increased slowly over 60 min. The slowly increasing rate of ice was similar to that in the natural environment. This validated that the natural icing event was a slow process and that the developed experimental system could simulate the real icing environment in nature. As shown in these figures, the icing results under the different temperatures had some discrepancies. For both airfoils, which were made of two types of materials, the ice types changed noticeably as the temperature changed. For instance, when the temperature was relatively high, such as −4 °C, the ice type on both kinds of airfoil material was mixed ice with glaze ice and rime ice, and the amount of it was very small. However, as the temperature decreased, such as −7 °C and −10 °C, the ice type changed to rime ice, and the amount of it increased significantly.
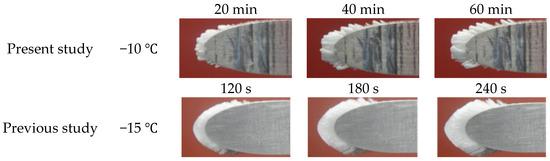
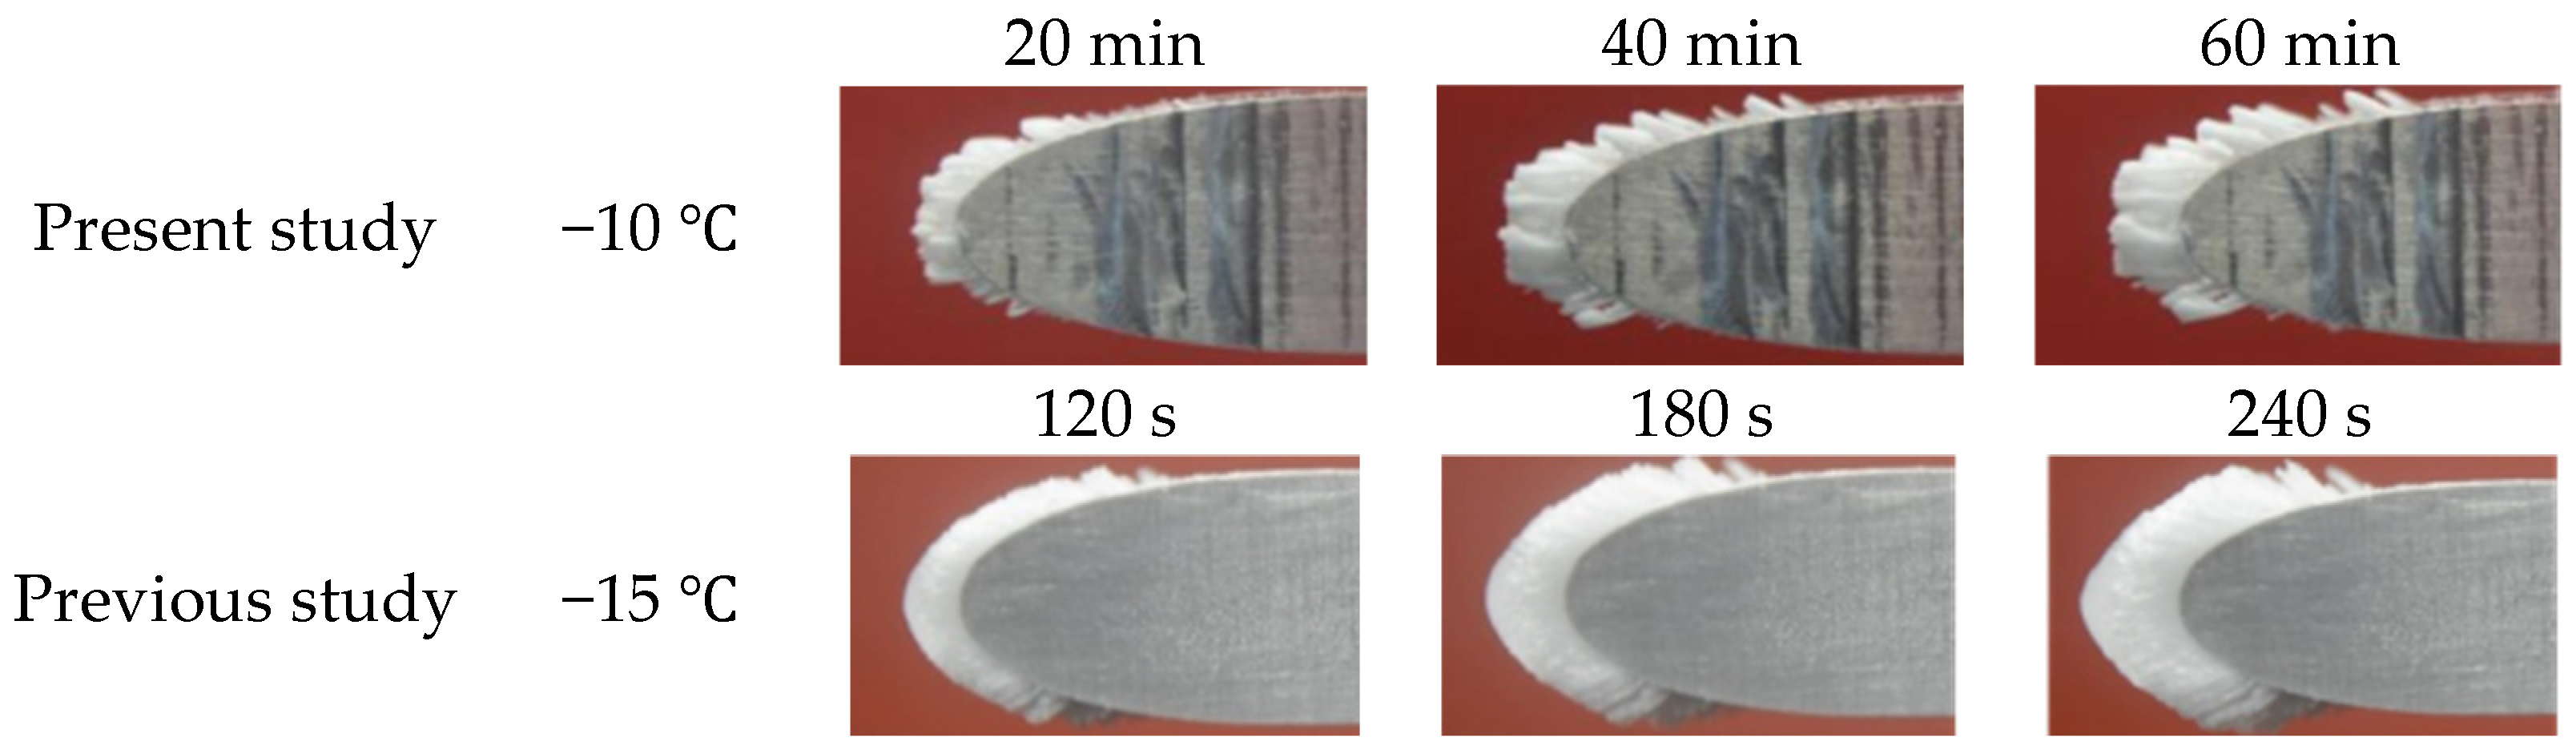
In comparison with the previous study, the ice accretion was significantly different, as shown in Figure 8.
Figure 8.
Comparison of icing results between the present and previous studies. Reprinted from Ref. [32].
As shown in Figure 8, although the icing temperature in the previous study (−15 °C) was lower than that in the present study (−10 °C), the type of ice was still mixed ice. However, in the present study, the temperature was −10 °C, but the type of ice was clearly rime ice. In addition, it was also found that the rate of ice in the previous study was far higher than that in the present study. As discussed in Section 3, the difference in the LWC and the MVD was the key reason for the discrepancy in icing. In the previous study, the LWC and the MVD were high, at 1.8 g/m3 and 50 μm, respectively. The icing condition was similar to the freezing rain environment. In contrast, in the present study, the icing condition was similar to the fog climate, which had a low LWC and MVD. For this reason, the water droplets froze in a short time as they impacted the blade surface [33]. The type of ice belonged to rime ice, which was non-transparent, milky white, and had a rough surface and a porous structure. According to these experimental results, it was concluded that the rougher surface of the rime ice had a more negative effect on the aerodynamic characteristics of the airfoils.
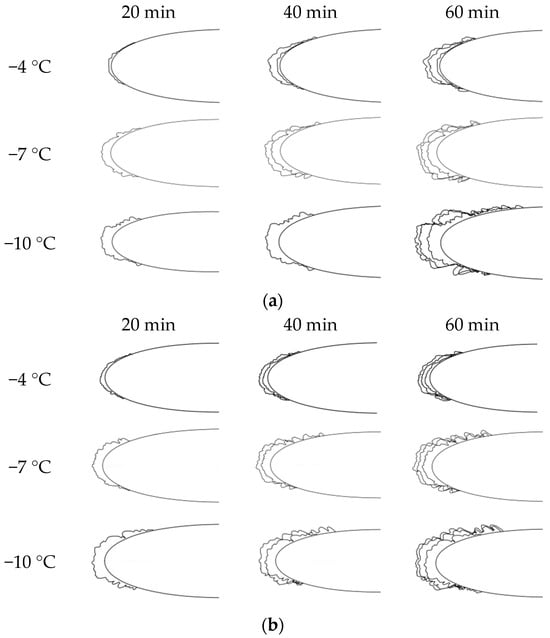
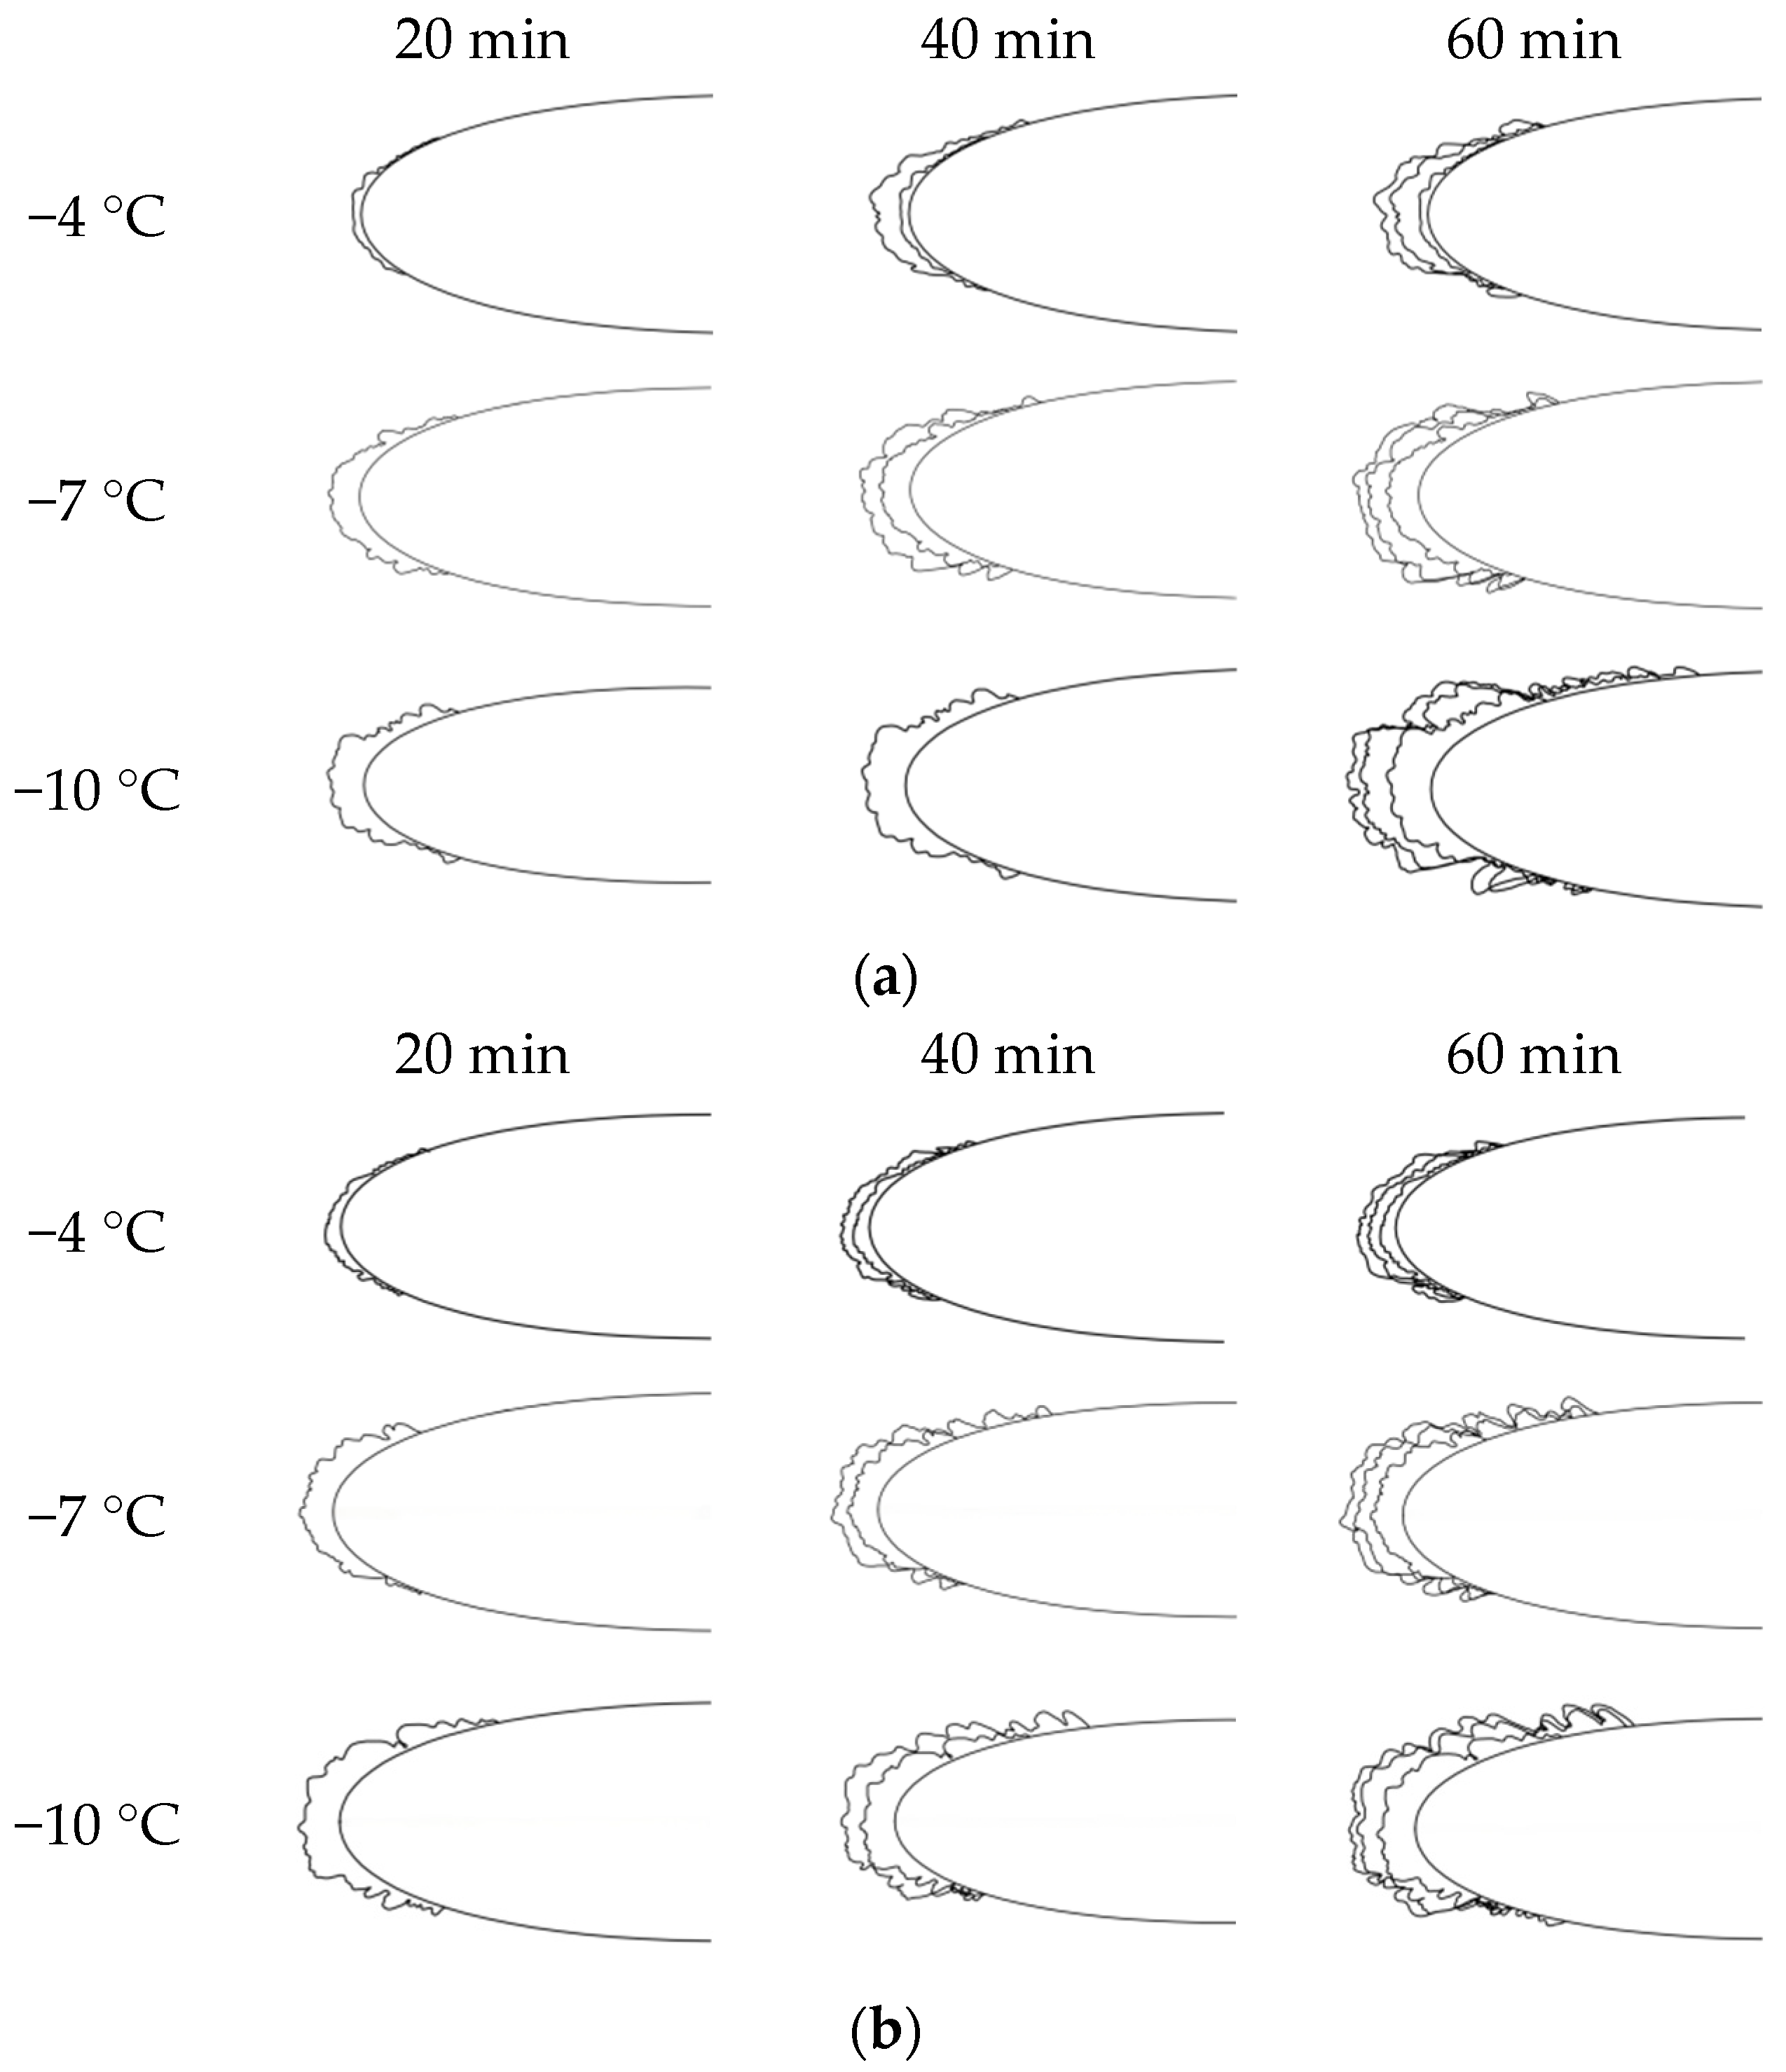
To analyze the characteristics of icing on the airfoil surface quantitatively, the profile of ice was acquired by using an image processing method; the process is as follows.
The images of the iced airfoil were acquired using a fixed camera position, angle of view, and lens magnification. After obtaining the edge contour of each image in MATLAB R2025a, Origin 2021 was used to extract the coordinates of the iced airfoil. The coordinates acquired by the above method can be imported into CAD to reconstruct the final ice shape. The processed profiles of ice under different temperatures are shown in Figure 9.
Figure 9.
Profiles of ice on the airfoil surface with different materials: (a) profiles of icing on the aluminum airfoil; (b) profiles of icing on the FRP airfoil.
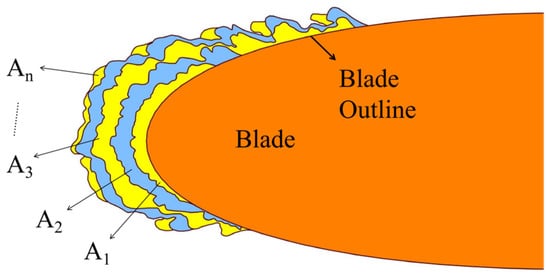
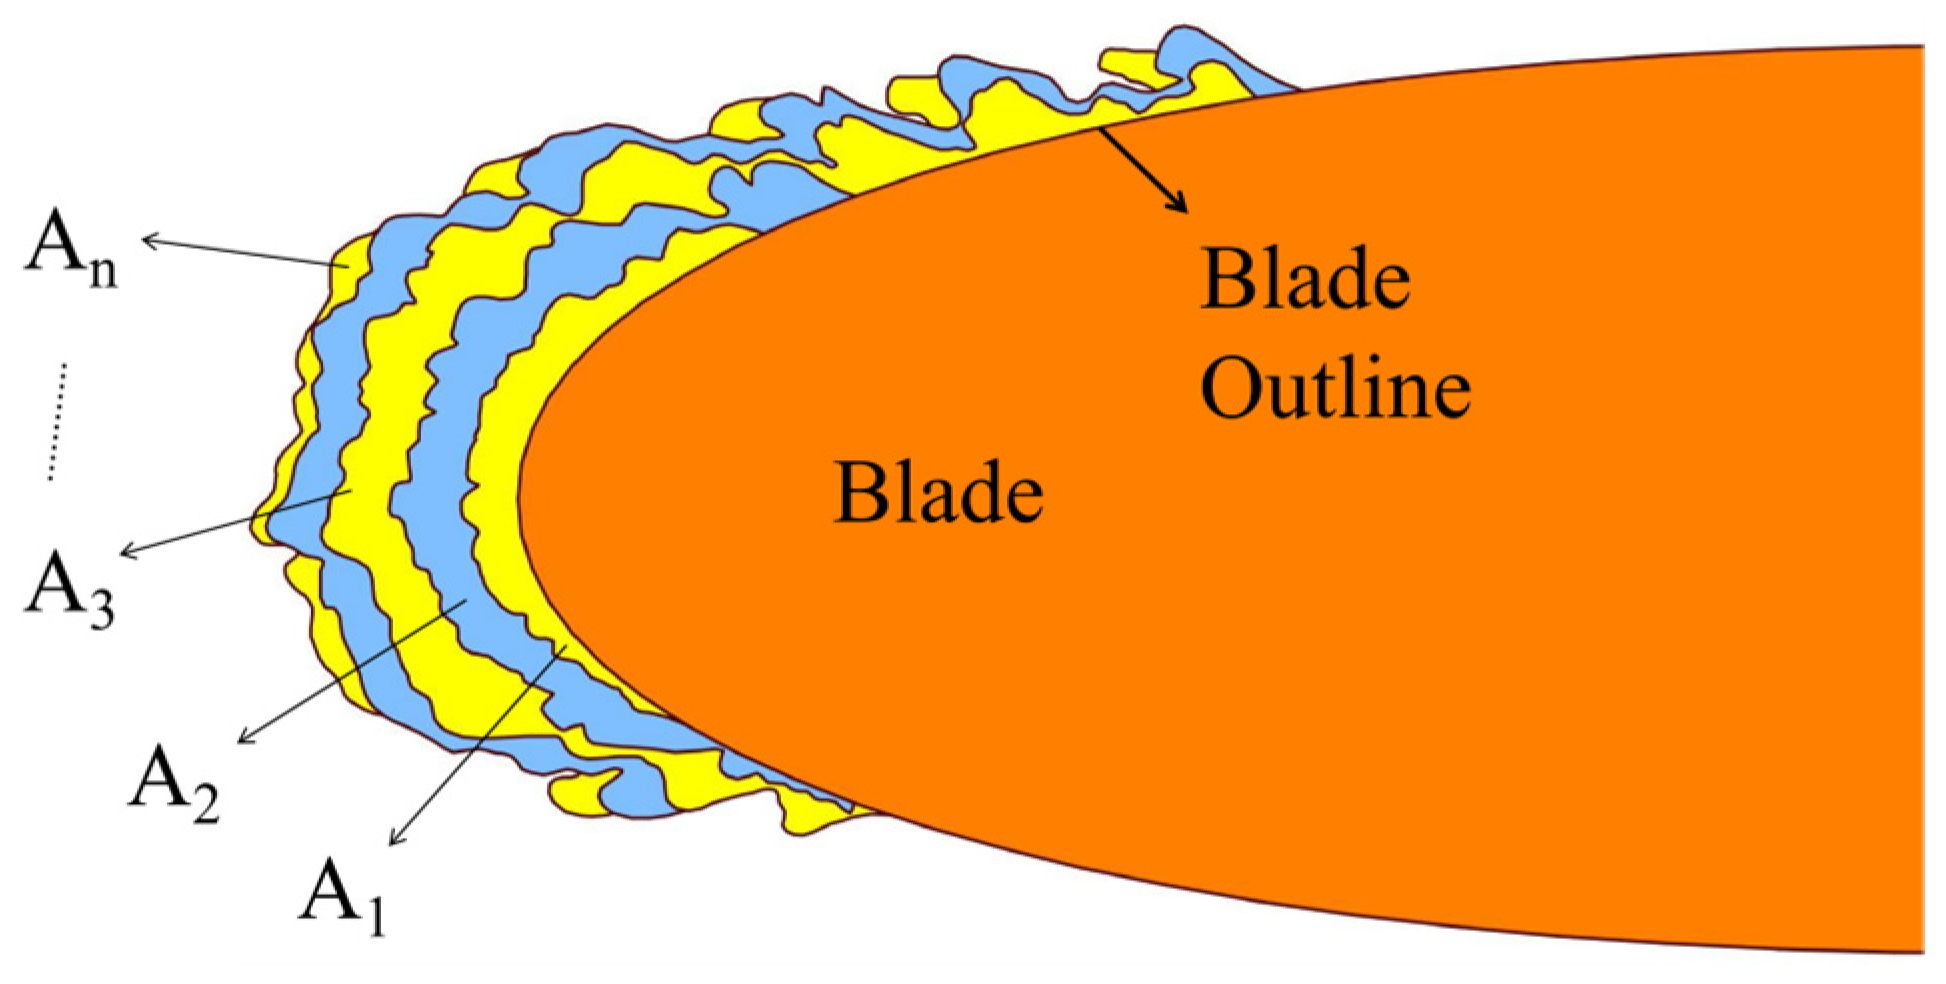
As shown in Figure 9, the ice increased layer by layer with the icing time. To analyze the process of icing quantitatively, several parameters were defined and used in the present study, which were the cross-sectional icing area (CIA), the average growth rate of icing area (AGRIA), and the maximum thickness of ice (MTI). The definitions of these parameters are given as follows.
Among these parameters, the cross-sectional icing area (CIA) and the average growth rate of icing area (AGRIA) are important parameters that characterize the amount and the growth rate of ice on the airfoil of NACA 0018. Their definitions are expressed in Equations (2) and (3) and shown in Figure 10.
where Ai is the icing area generated in the i th time interval, which is 20 min in the present study; t is the icing time from the beginning of ice to the i th time interval.
Figure 10.
Schematic definitions of the icing parameters.
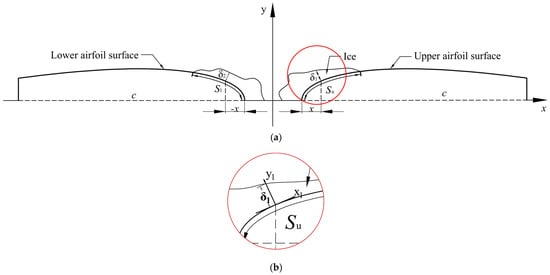
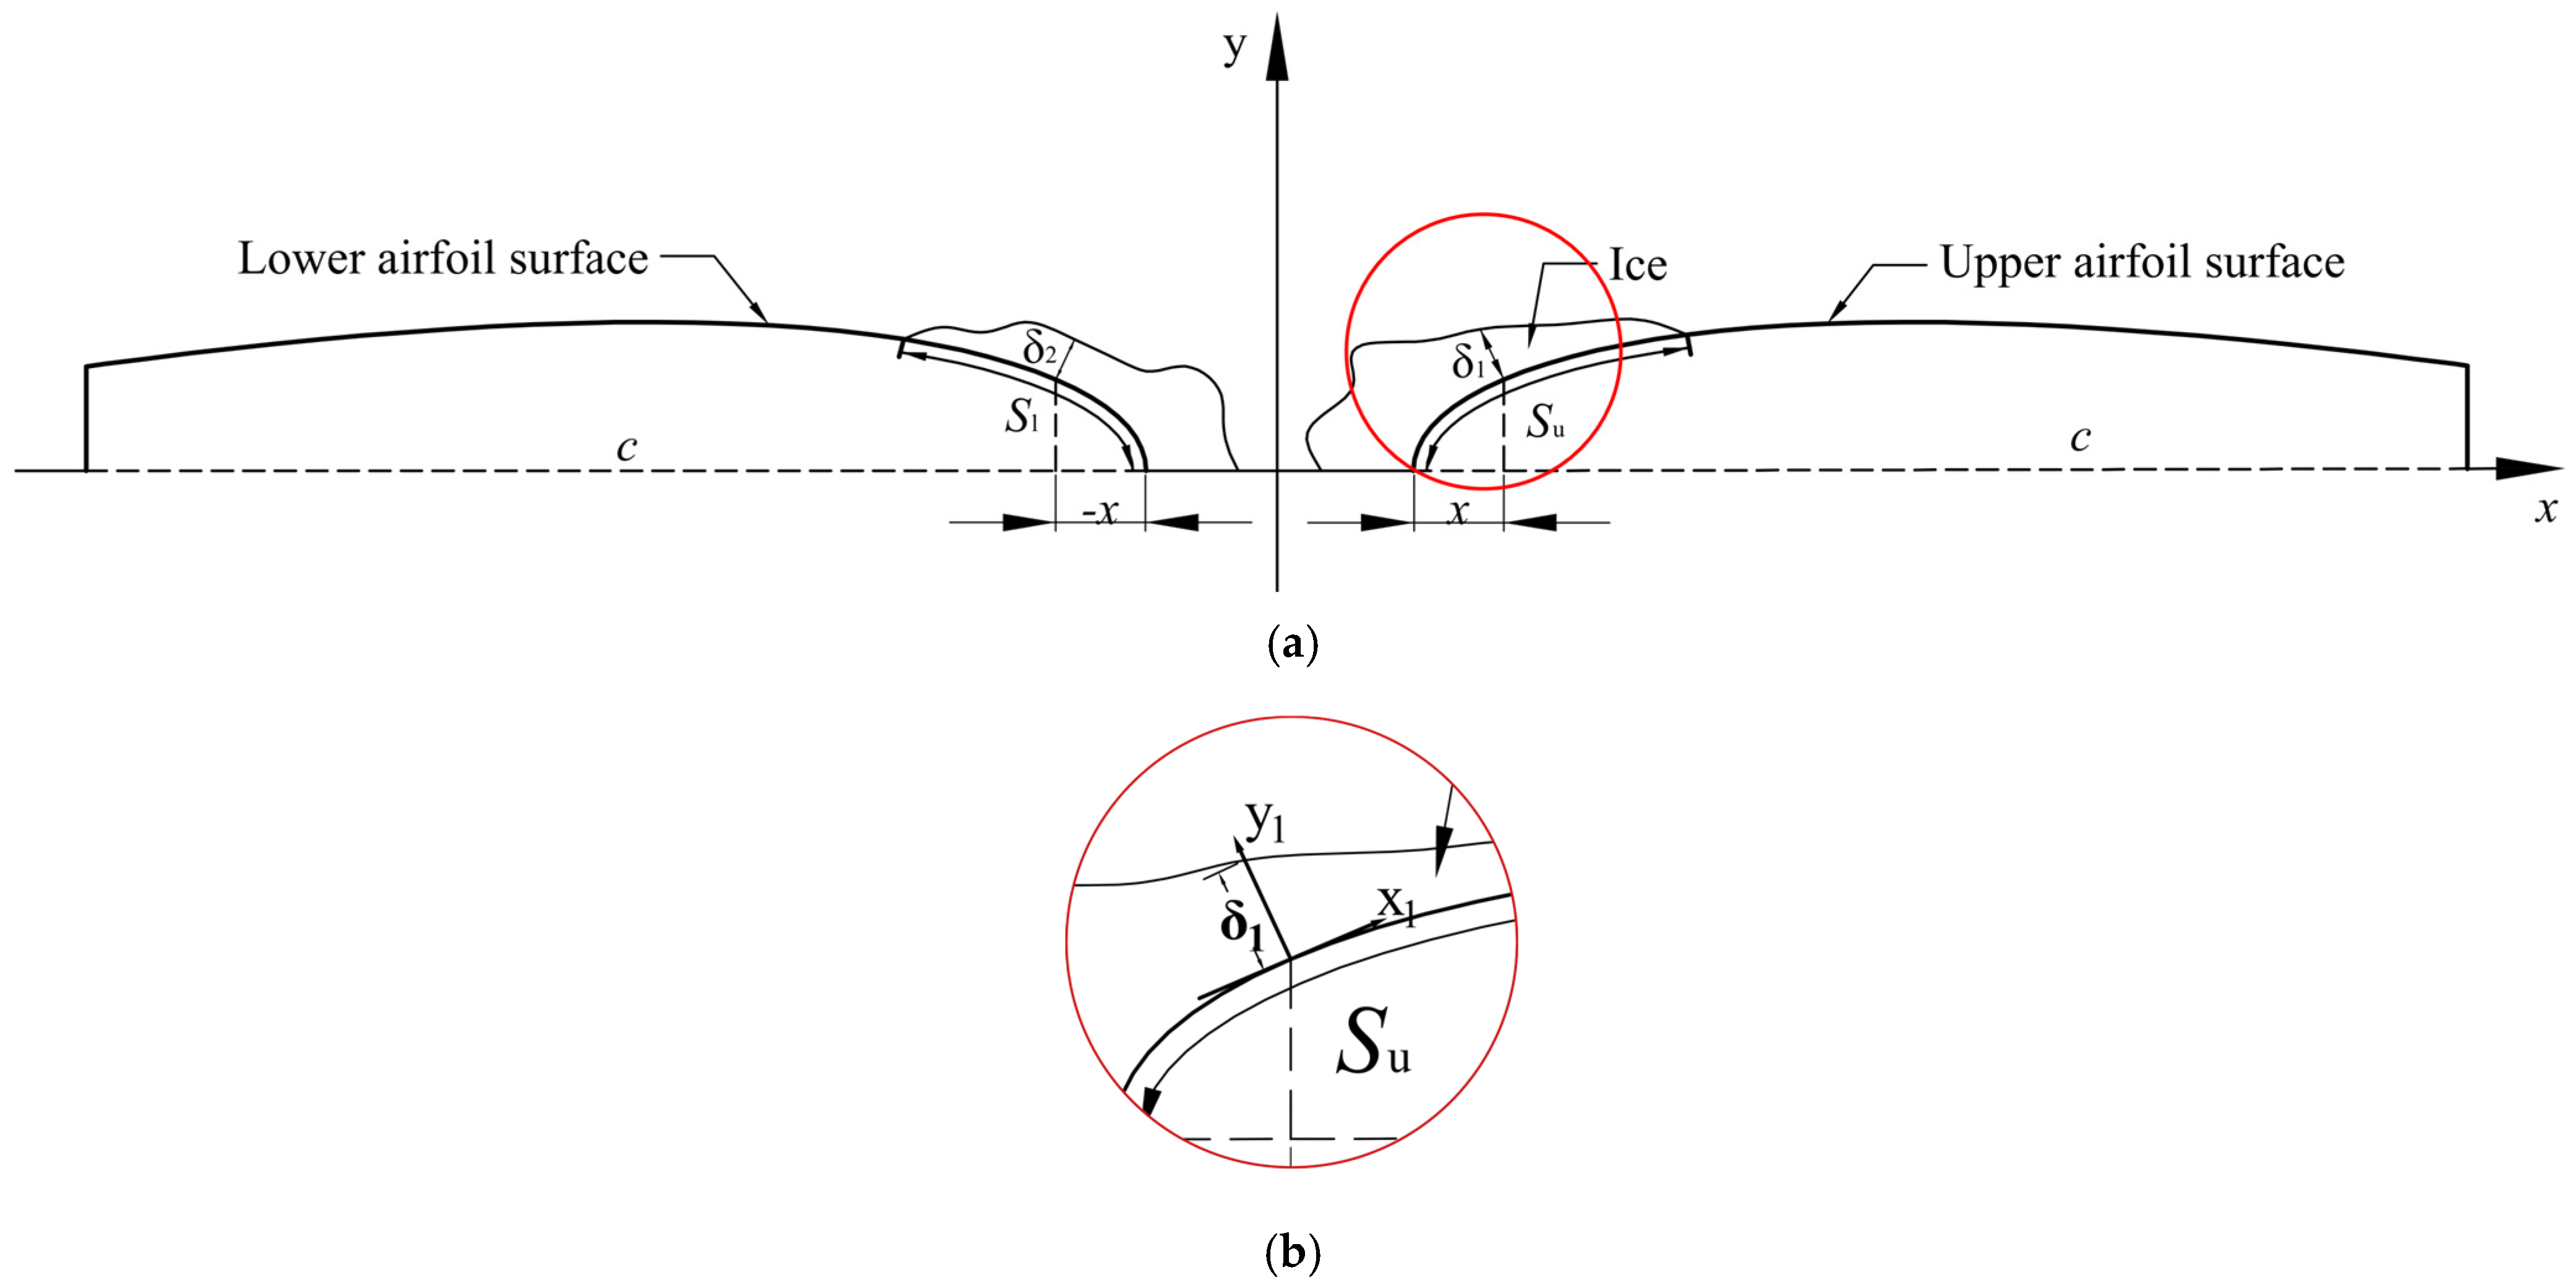
For analyzing the variation in the thickness of ice along the airfoil surface, the thickness of ice was defined along the chord direction. The schematic definition of the parameter is shown in Figure 11.
Figure 11.
Schematic definition of the thickness of ice along the chord direction: (a) overall diagram; (b) partial enlarged drawing.
As shown in Figure 11, for analyzing the variation in thickness on the whole airfoil surface quantitatively, the airfoil is divided into two parts along the chord, which are the upper airfoil surface and the lower airfoil surface. To characterize the thickness of ice at an exact position parametrically, a ratio parameter p is used to express a relative position along the chord, which is expressed in Equation (4) and shown in Figure 11.
where p is the relative value of any point on the chord; x is the distance of any point from the leading edge; c is the chord length of the airfoil.
As shown in Figure 11, on the upper airfoil surface, a local coordinate system was established by using the tangential and normal directions at a specific point on the blade surface. The position with the thickness of ice δ1 is expressed by the relative position x/c, where the position x on the chord is the vertical projection of the surface point onto the chord. The thickness of ice δ1 is the vertical distance from the airfoil surface to the ice surface. Similarly, on the lower airfoil surface, to discriminate the position with the same relative position on the upper airfoil surface, the relative position is expressed by the negative value −x/c. In this way, the thicknesses of ice between the upper and the lower airfoil surfaces can be analyzed, respectively.
As shown in Figure 10, in the present study, the cross-section of ice is used to characterize the amount of ice, the thickness of ice, and the range of ice coverage, because the thickness of the airfoil sample along the wing span is just 20 mm. Therefore, the thickness of ice along the wing span is thin and considered to be uniform. Based on this assumption, the cross-sectional area of ice from the end face of an iced airfoil sample is selected to analyze the variation in the amount of ice indirectly.
5. Discussions
5.1. Icing Area
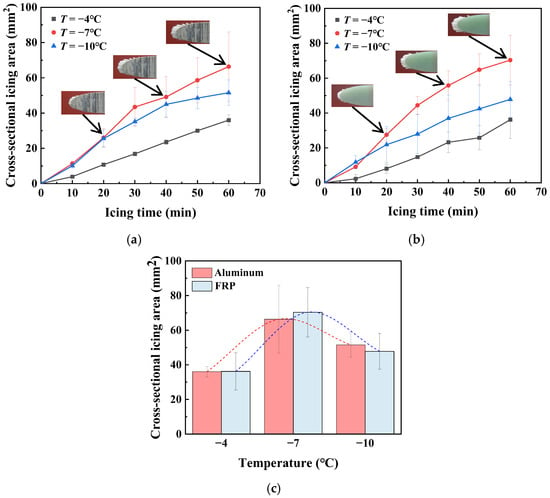
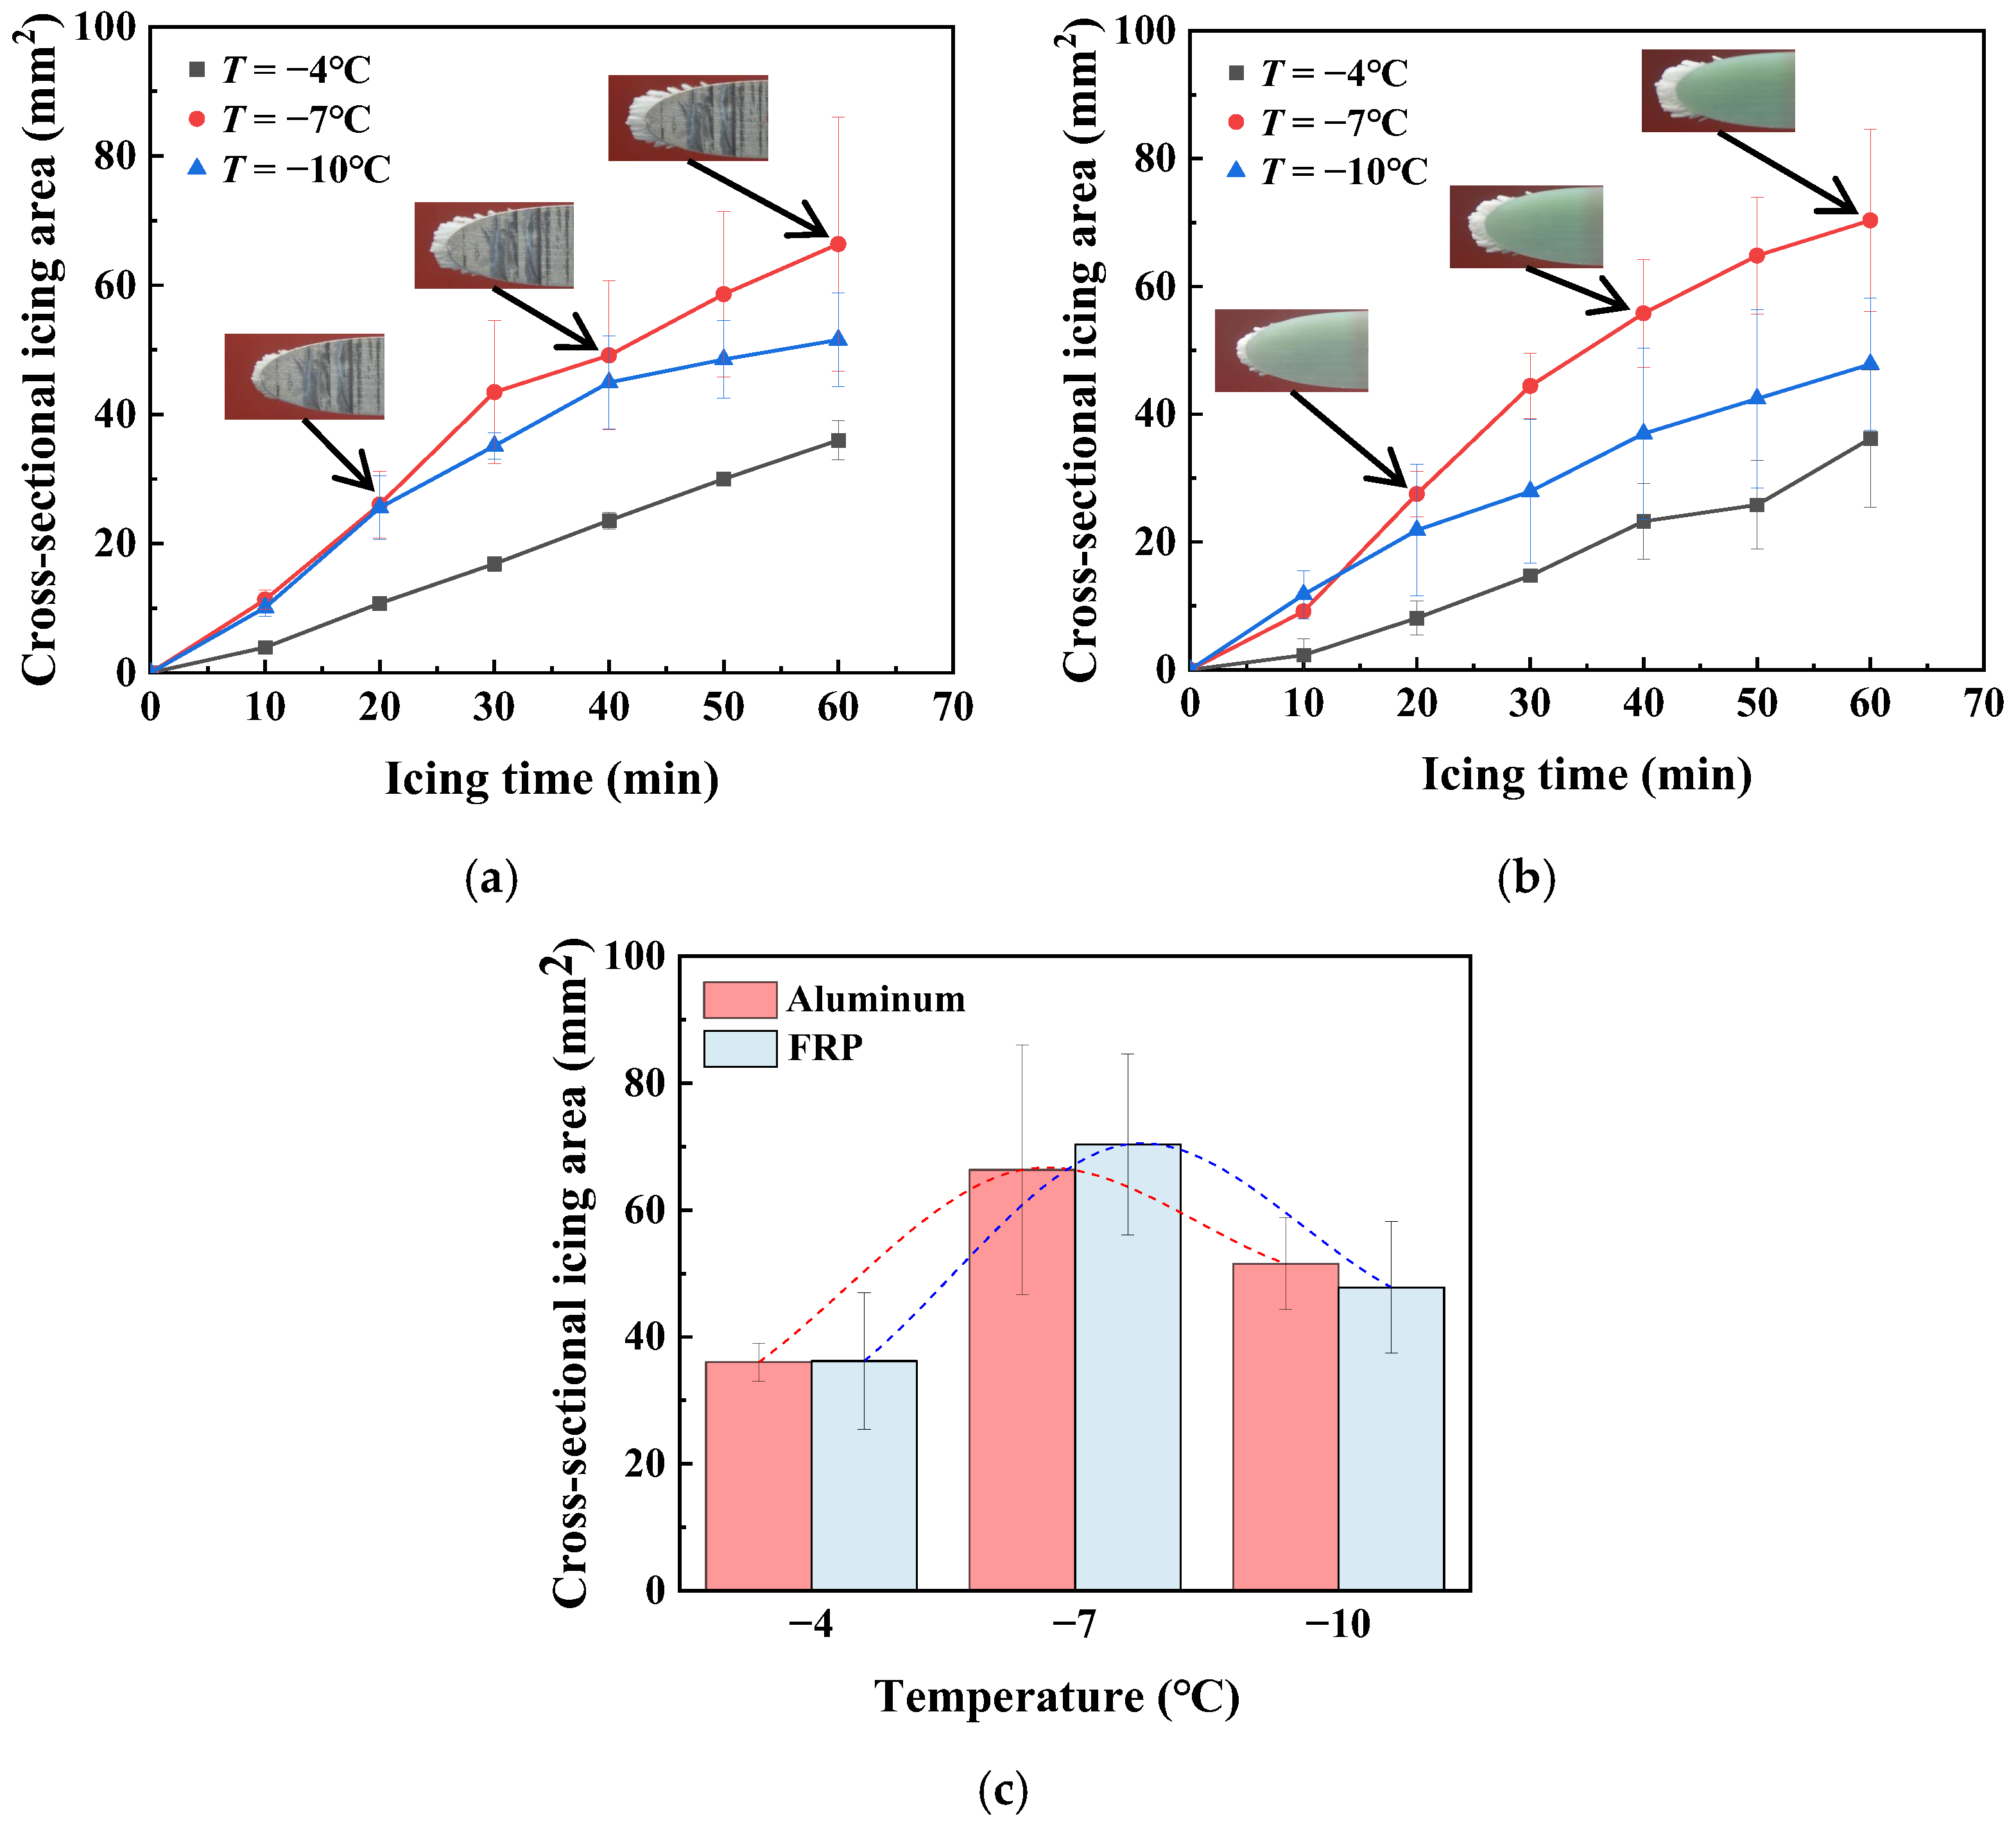
Based on the parametric definitions and the experimental results in Section 4, the variations in the CIAs of the airfoils with the different materials, aluminum and FRP, are shown in Figure 12.
Figure 12.
Variations in the CIAs of the airfoils made of different materials: (a) aluminum airfoil; (b) FRP airfoil; (c) airfoil after 60 min of freezing.
As shown in Figure 12, for both types of airfoil materials, the CIAs increased gradually over time, but the growth rates had significant discrepancies at different icing temperatures. The temperature had the same effect on ice growth for both types of airfoil materials. At a medium temperature, such as −7 °C, the growth rate of ice was the highest. In contrast, as the temperature was higher, such as −4 °C, the CIA of the airfoil was the lowest. The reason for this result was that, as the temperature was higher, the duration of water droplet icing was longer, which led to a decrease in the amount of ice, or CIA. Additionally, under the high-temperature condition, the type of ice was mixed ice with glaze ice and rime ice. The glaze ice had a compact or non-porous structure, which also resulted in a small volume of ice. Moreover, as the temperature decreased to −7 °C, the heat conduction between the water droplet and the airfoil surface intensified, and the water droplets froze in a shorter time as they impacted the airfoil surface. For this reason, the amount of ice increased fast and significantly. However, as the temperature decreased continuously, such as −10 °C, the amount of ice, or CIA, decreased again. The reasons for the decrease were that the low temperature increased the heat transfer rate between the water droplet and the cold air, and the water droplets had a small MVD in the present study. During the experiments at −10 °C, it was observed that part of the atomized water droplets deposited and froze prematurely on the inner walls of the icing wind tunnel. This wall icing resulted in an additional loss of droplets during their transport toward the test section and consequently reduced the effective number of droplets reaching the airfoil surface. For these reasons, more water droplets in the cold air froze on the walls of the wind tunnel before impacting the airfoil surface, which led to a decrease in the amount of ice and CIA. The experimental results also confirmed that the occurrence of icing decreased at low temperatures.
In addition, in the present study, it was also found that there were small differences in the CIAs between the aluminum and the FRP airfoils at different temperatures. This confirmed that the airfoil material had little effect on the amount of ice. The CIAs of the aluminum airfoil were just a little higher than those of the FRP airfoil at temperatures of −4 °C and −10 °C. The small discrepancies might result from the difference in the heat transfer rates between the aluminum and the FRP materials. For the aluminum material, the thermal conductivity is high, which is about 167~180 W/(m·K). The water droplets impacting the aluminum airfoil had a high heat transfer rate with the airfoil, which decreased the icing time. Then more water droplets froze on the aluminum surface.
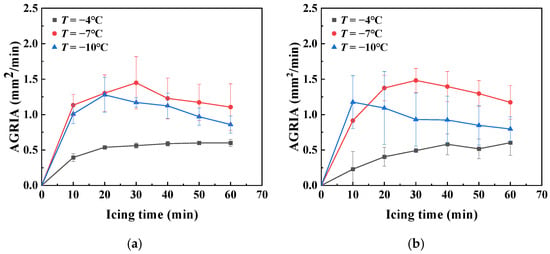
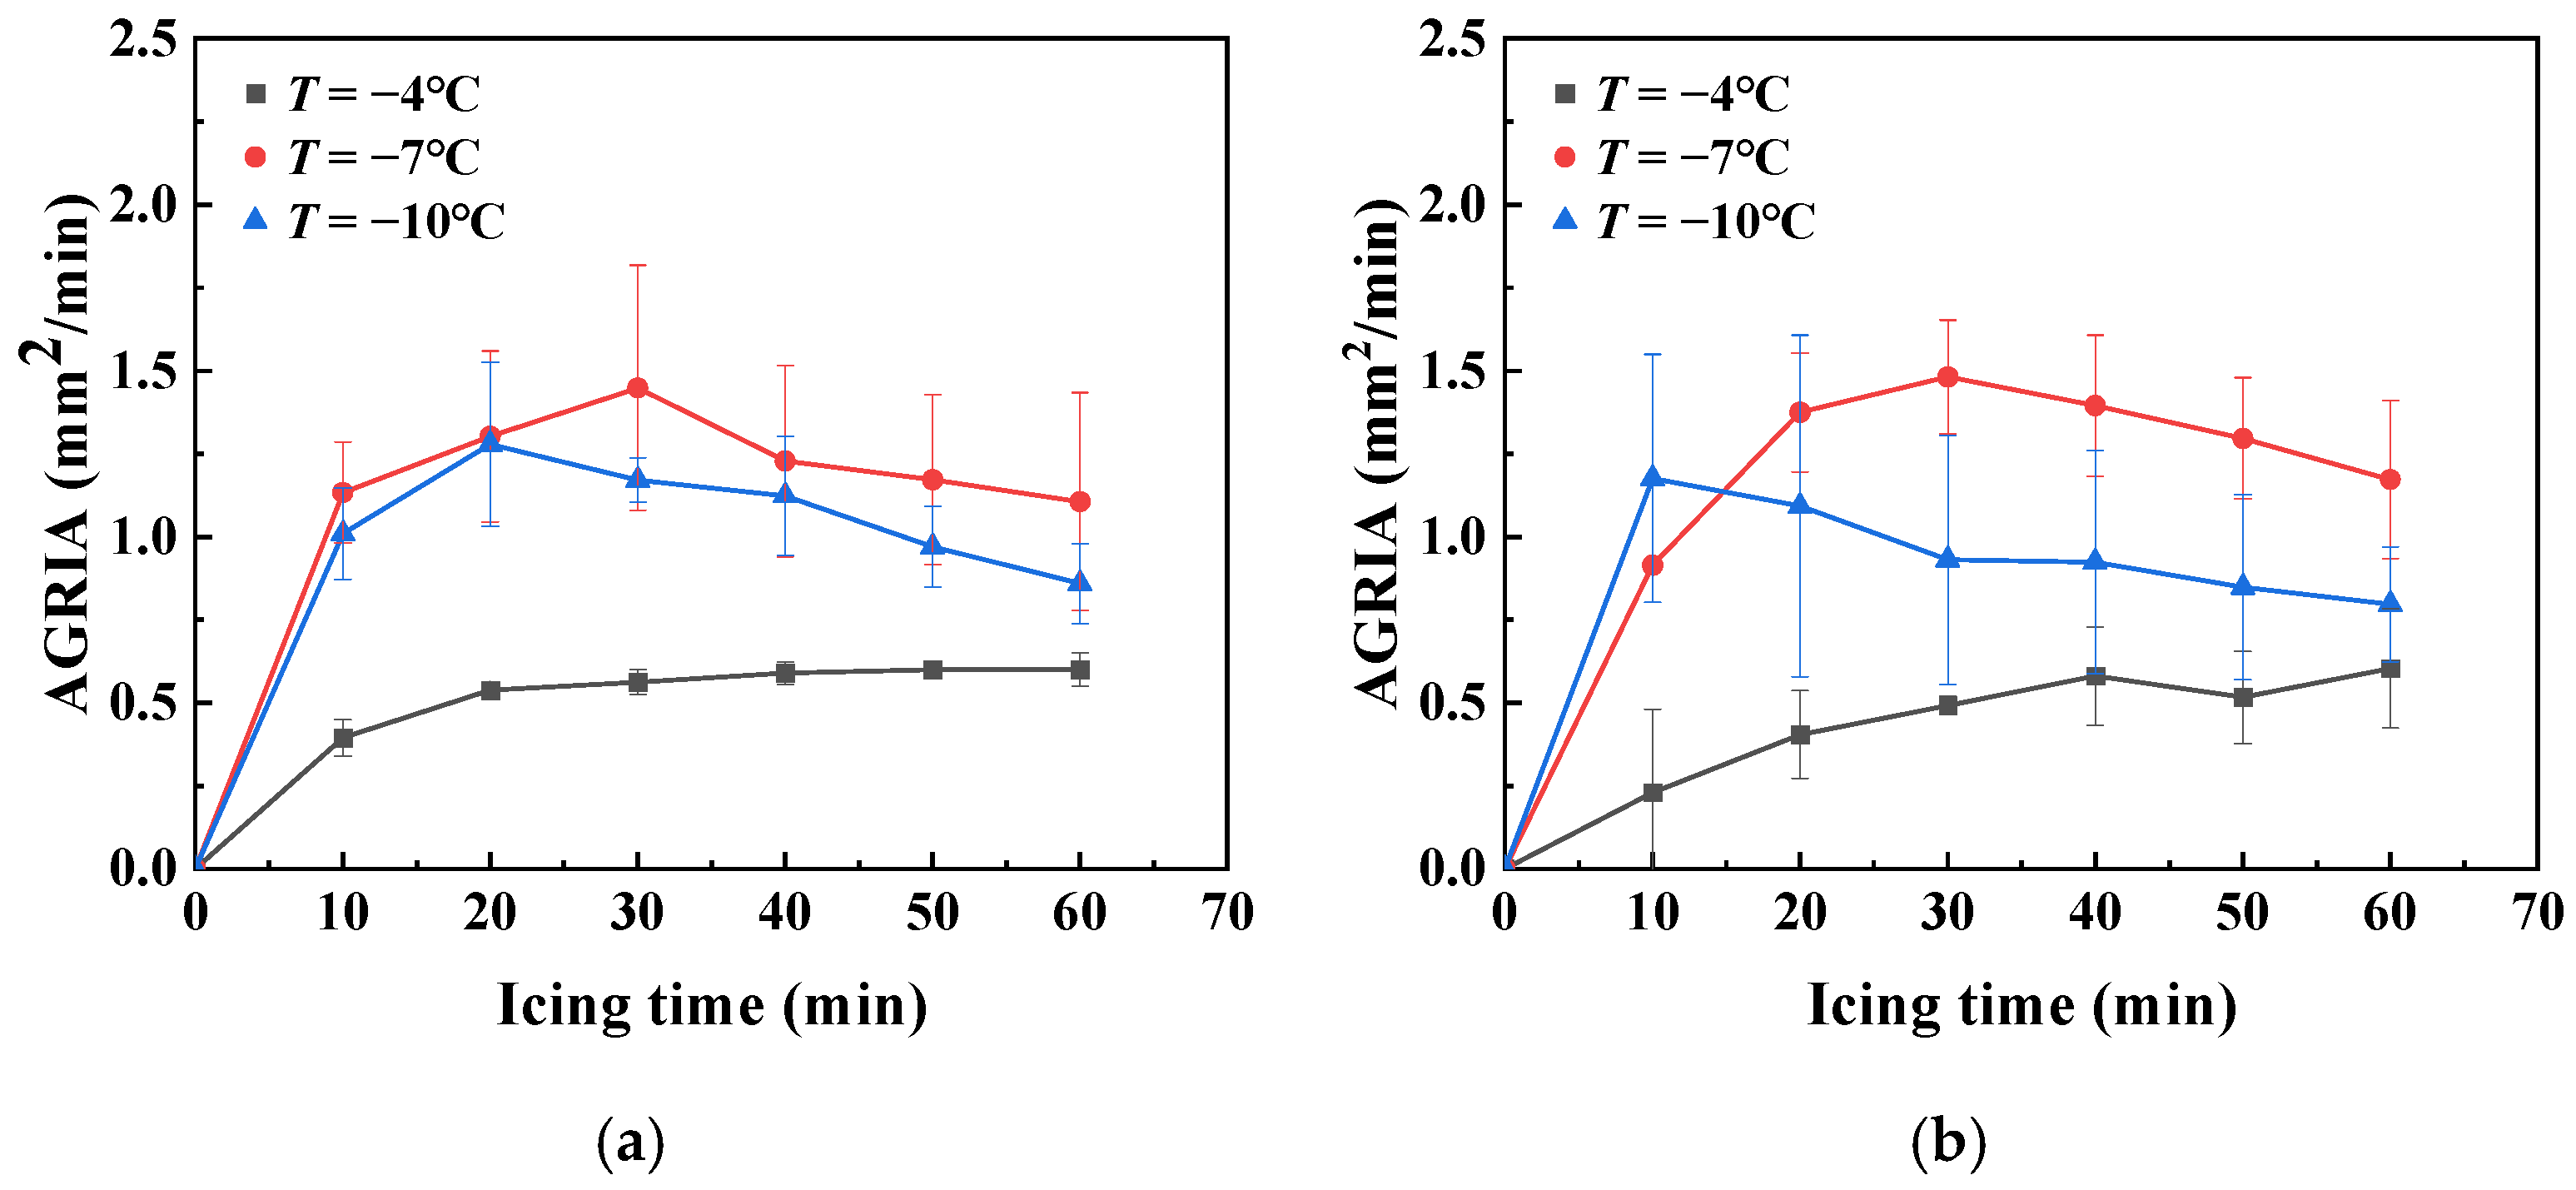
According to the above discussion, the parameter CIA characterizes the total amount of ice throughout the icing process, but it cannot characterize the growth rate of ice per unit time. Therefore, based on the analyses of the CIAs, the AGRIAs of the airfoils at different icing temperatures were analyzed further, as shown in Figure 13.
Figure 13.
Variations in the AGRIA at the different icing temperatures: (a) aluminum airfoil; (b) FRP airfoil.
As shown in Figure 13, for both types of airfoil materials, the AGRIAs of the airfoil at −7 °C and −10 °C were higher than those at −4 °C. As previously discussed, when the temperature was higher, such as −4 °C, the heat transfer rate was slow between the water droplet and the airfoil or air, which led to a slow increase in ice accretion. However, as the temperature was lower, such as −7 °C or −10 °C, the heat transfer intensified, and the growth rate of ice increased. From the figures, it was found that the AGRIAs first increased and then decreased gradually at the temperatures of −7 °C or −10 °C. The reason for this result was that the thermal conductivity varied during the process of icing. In the initial stage of icing, the water droplets impacted the airfoil surface directly, and the heat transfer rate was high because of the high thermal conductivities of aluminum and FRP. For this reason, the ice accretion rate was high per unit time. Nevertheless, as the icing process continued, the airfoil surface was covered by an ice layer. The subsequent water droplets could not contact the airfoil surface directly. The water droplets transferred heat through the ice layer. According to the experimental results, as the temperature was low, the ice type was rime ice, which had the characteristic of a porous structure. In this case, the air in the porous space decreased the heat transfer rate. Then the growth rate of ice decreased gradually. In contrast, at −4 °C, the AGRIA increased gradually with the icing time, but the growth rate increased slowly. Based on the above analyses, the ice type at −4 °C was mixed ice, which had a higher heat transfer rate than rime ice, resulting in an increase in AGRIA.
5.2. Thickness of Ice
In the previous discussion, the icing area indirectly characterizes the amount and process of icing on the airfoil surface. However, the thickness of ice characterizes the damage of airfoil icing to the aerodynamic profile of the blade. Therefore, the effects of the icing temperature and the airfoil material on the thickness of ice were explored and discussed in the present study.
Based on the definition of the position in Figure 11, the thickness of ice located at any position of the airfoil surface can be characterized according to the relative position along the airfoil chord.
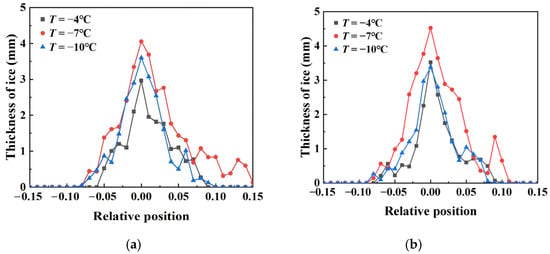
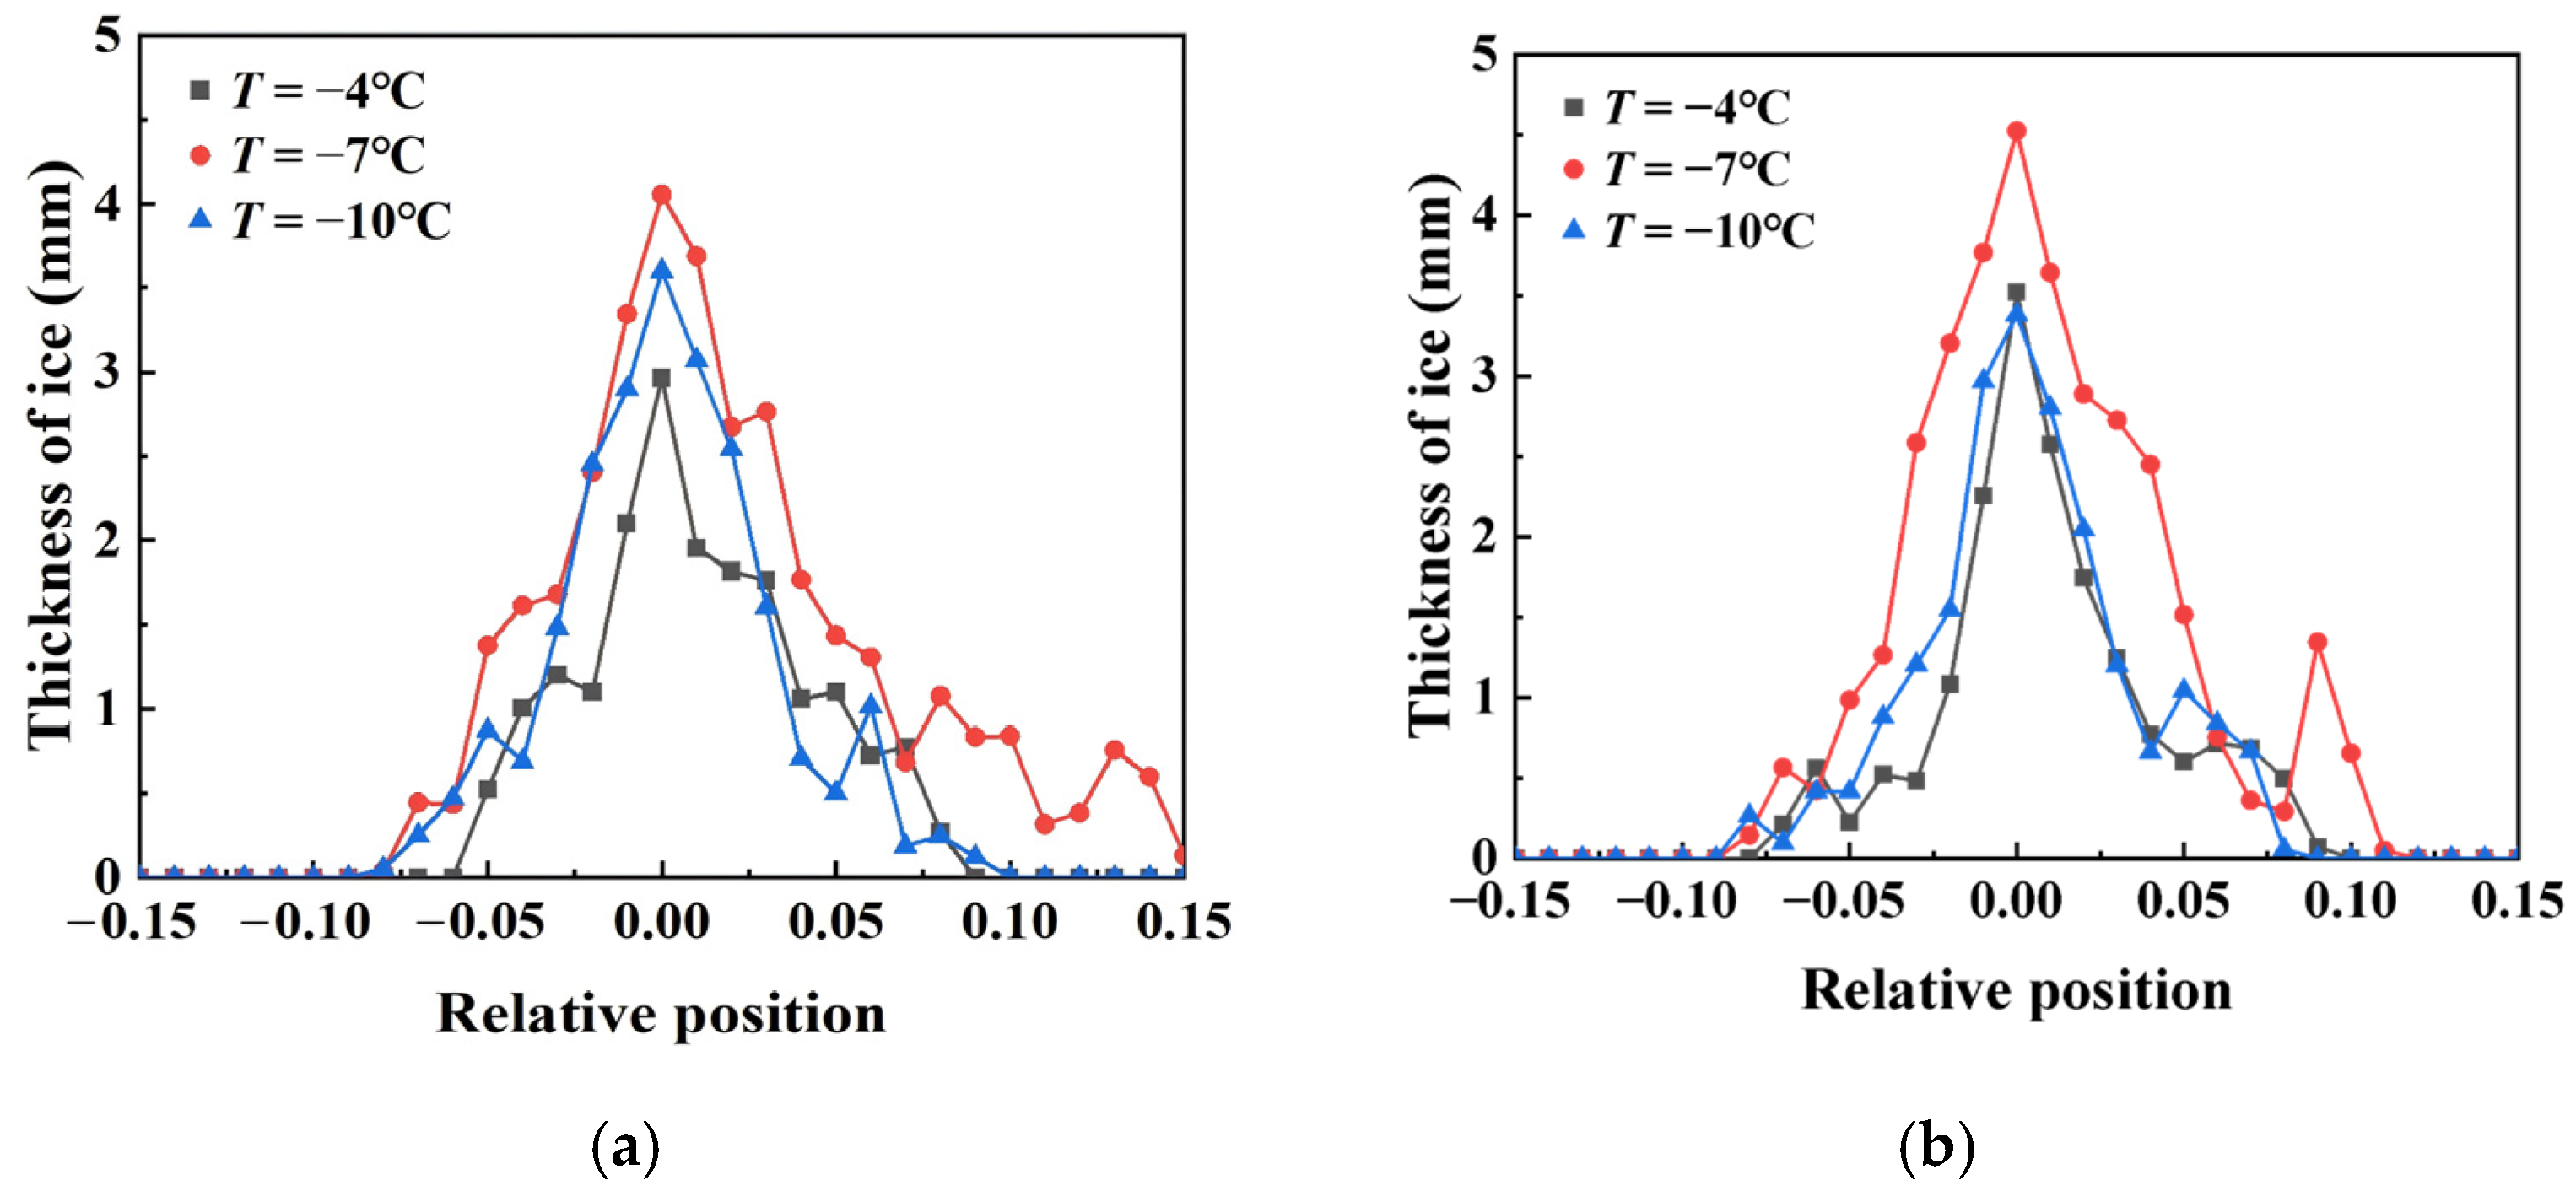
According to the experimental results and the definition of the thickness of ice, the variations in the thickness of ice along the airfoil surface at different icing temperatures are shown in Figure 14.
Figure 14.
Variations in the thicknesses of ice at the different icing temperatures: (a) aluminum airfoil; (b) FRP airfoil.
As shown in Figure 14, at the tip of the leading edge, the thickness of ice was maximum because the tip region of an airfoil was the stagnation point of airflow. In the vicinity of this region, the airflow carried droplets that impacted the leading edge of the airfoil; the airflow is then divided into upper and lower streams, while the droplets, due to their inertia, struck the blade and froze. At the same time, under the present airfoil configuration, droplets that fail to completely follow the rapidly turning airflow are preferentially collected near the leading-edge region; the local droplet collection in this region was relatively high. Furthermore, under the low-temperature icing conditions investigated in the present study, an increase in airflow velocity enhances the convective heat transfer between the airflow and the blade, thereby leading to an increase in ice accumulation. For these reasons, ice accretion occurred at this point.
With the increase in the thickness of ice, the stagnation region of the airflow expanded, and the coverage scope of ice increased gradually. Then, along the upper airfoil surface and the lower airfoil surface, the thickness of ice decreased gradually. For both types of airfoil materials, the thickness of ice was largest at −7 °C. The thicker the ice was, the larger the coverage area of ice was. As discussed above, the amount of ice on the airfoils was largest at −7 °C compared with that at the other temperatures (−4 °C and −10 °C). That is why the ice layer was thick at that temperature. For the aluminum airfoil, the coverage scope of ice was −0.10~0.15, which was larger than that of the FRP airfoil. The obvious icing scope was in the range of −0.05~0.05. In this range, icing events had a negative effect on the aerodynamic characteristics of the airfoil. As the amount of ice was small, the coverage scope of ice on the upper and lower airfoil surfaces was approximately symmetrical. However, as the amount of ice increased, the accumulated ice modified the local geometry around the leading edge. As described above, some droplets impacted the leading edge of the blade and froze, while another portion followed the separated airflow toward both the upper and lower surfaces. After the incoming airflow is divided at the leading edge of the airfoil, the airflow accelerates along both surfaces, resulting in a decrease in local static pressure near the upper and lower surfaces. For the droplets moving toward the upper surface, gravity causes the droplets to deviate downward from their original trajectories. Meanwhile, the low-pressure region enhances the tendency of the droplets to move toward the upper surface. In contrast, for the droplets moving toward the lower surface, the aerodynamic effect associated with the local low-pressure region tends to induce an upward deflection of the droplet trajectories toward the lower surface. However, this upward aerodynamic tendency is largely counterbalanced by the downward gravitational force. In summary, the coverage scope of ice on the upper airfoil surface was larger than that on the lower airfoil surface, especially for the aluminum airfoil. It was confirmed that the symmetrical aerodynamic profile was significantly damaged because the ice layer was too thick.
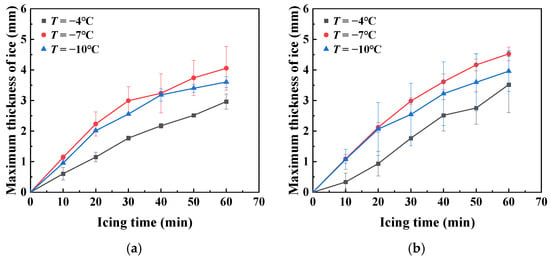
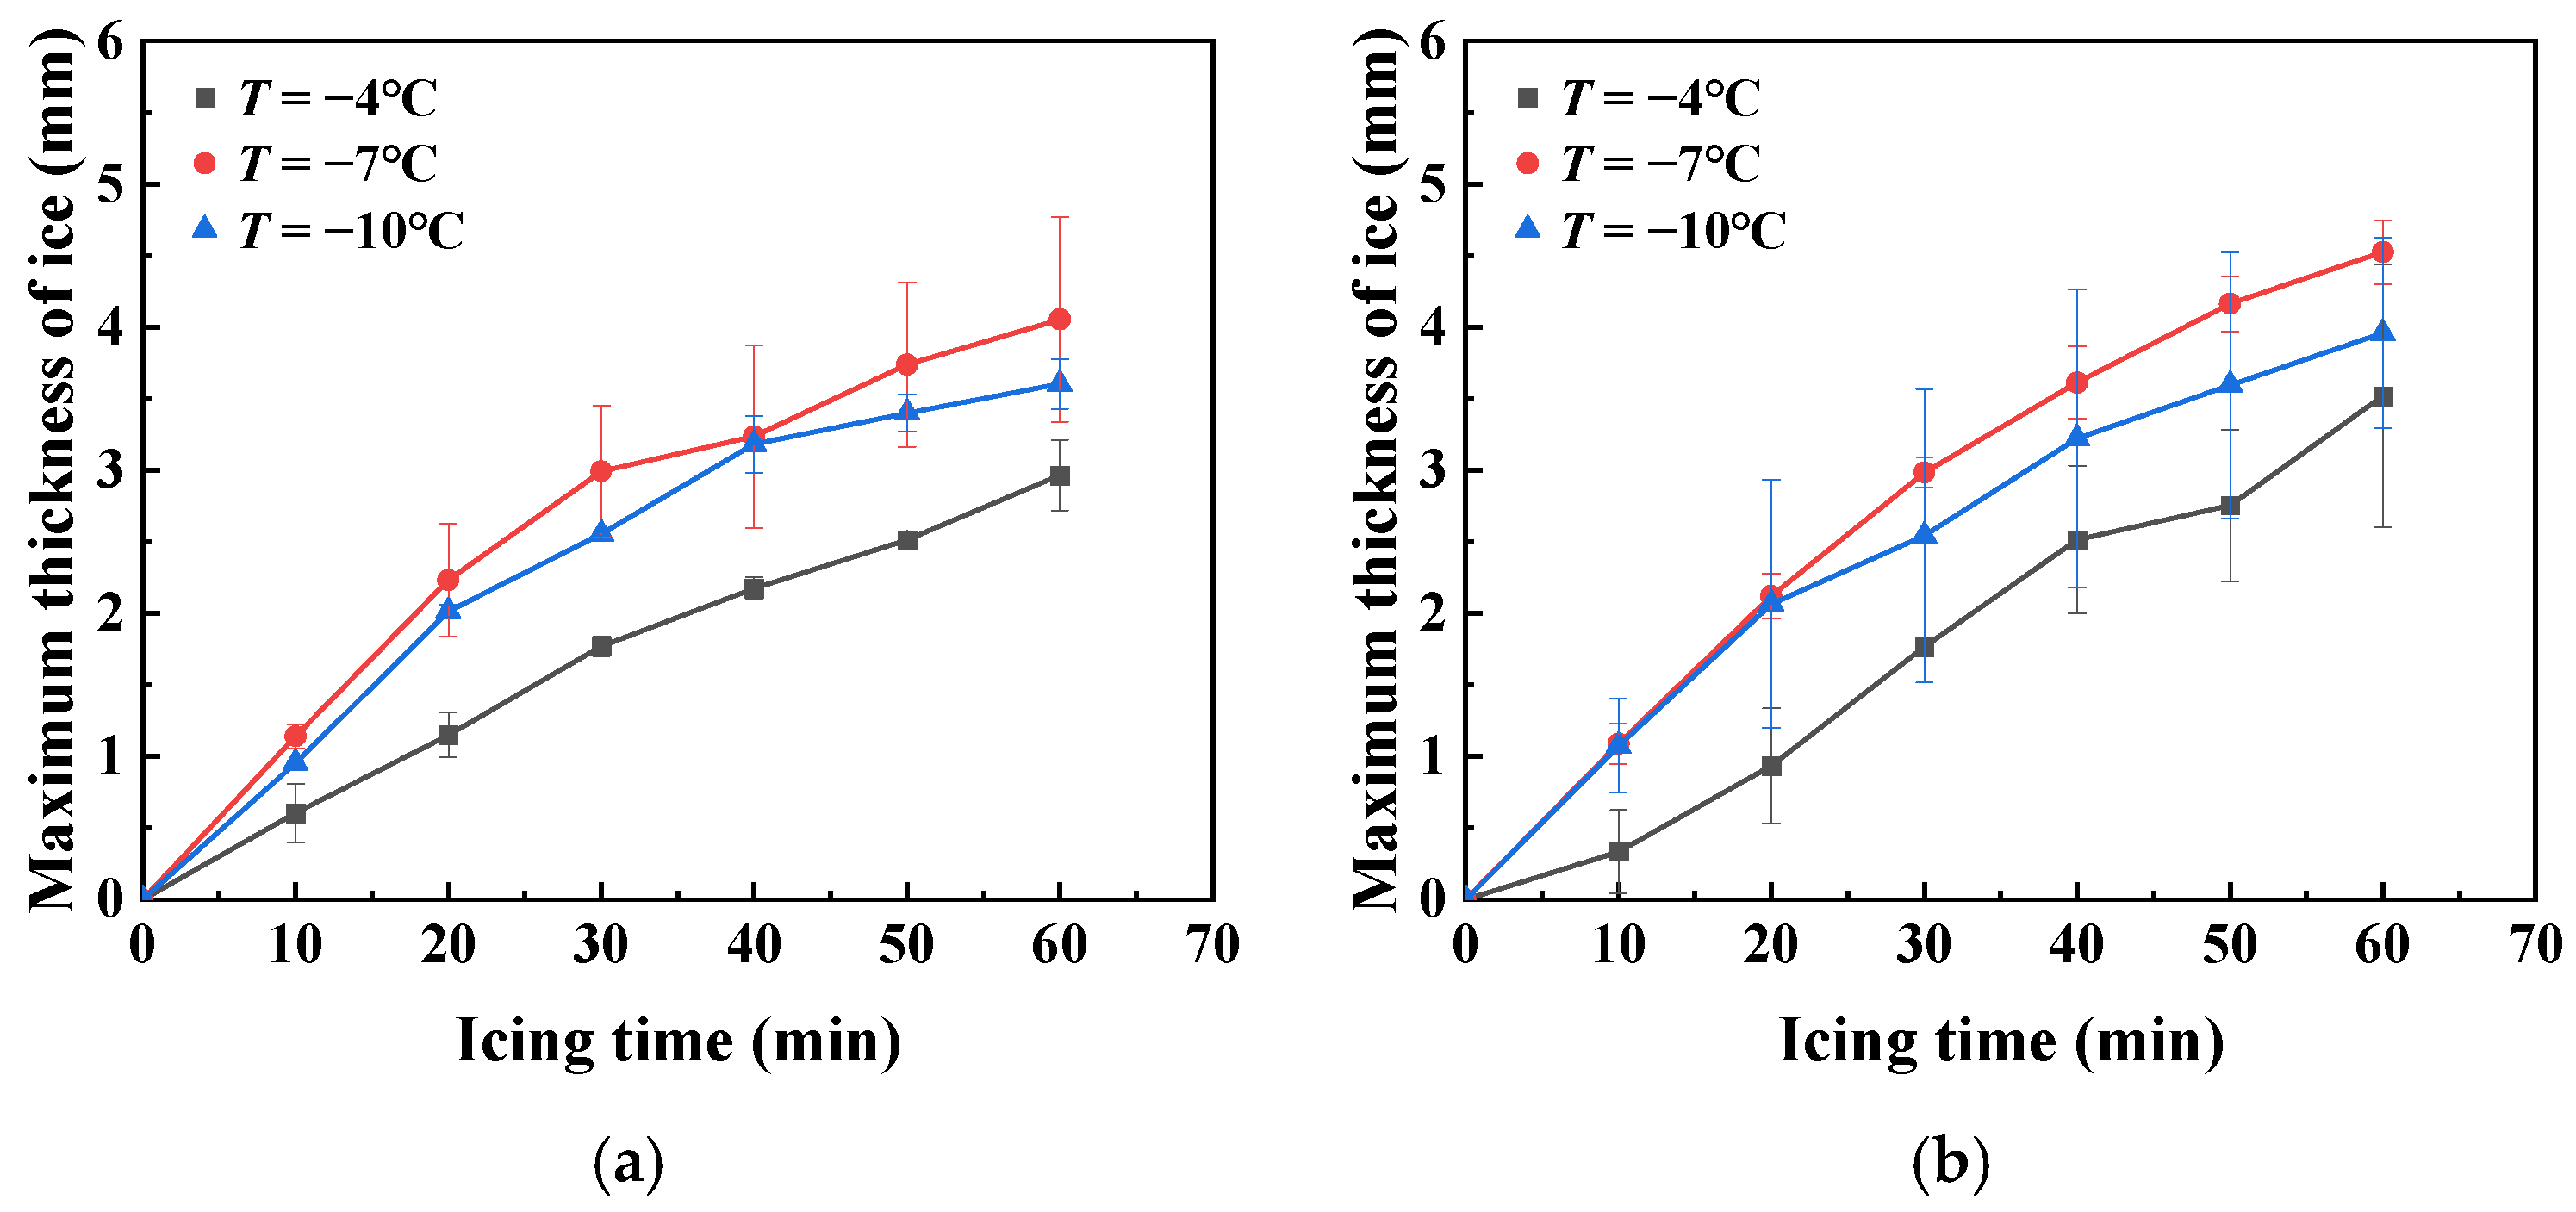
According to the above analyses, it was found that the maximum ice thickness was located at the tip of the leading edge, which caused serious damage to the profile of the airfoil. Therefore, in the present study, the effects of the temperature and the airfoil material on the maximum thickness of ice were further analyzed. The variations in the maximum thicknesses of ice at the different temperatures are shown in Figure 15.
Figure 15.
Variations in the maximum thicknesses of ice at the different temperatures: (a) aluminum airfoil; (b) FRP airfoil.
As shown in Figure 15, in the process of icing, the variation laws of the maximum thicknesses of ice were similar at different temperatures and for different materials. The maximum thickness of ice increased along with icing time under each condition, but the growth rate was different. At −7 °C, the maximum thickness of ice increased fast. By contrast, the one at the temperature of −4 °C increased most slowly. Additionally, the growth rate of the maximum thickness of ice decreased gradually with icing time. These variation laws were the same as those of the icing area. The affecting factors were discussed previously.
5.3. Scope of Ice
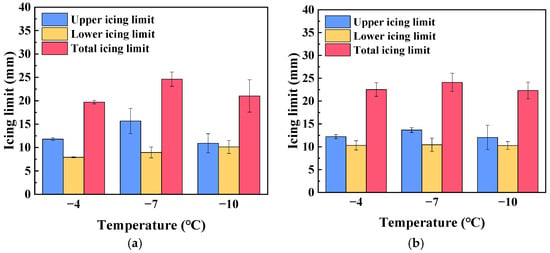
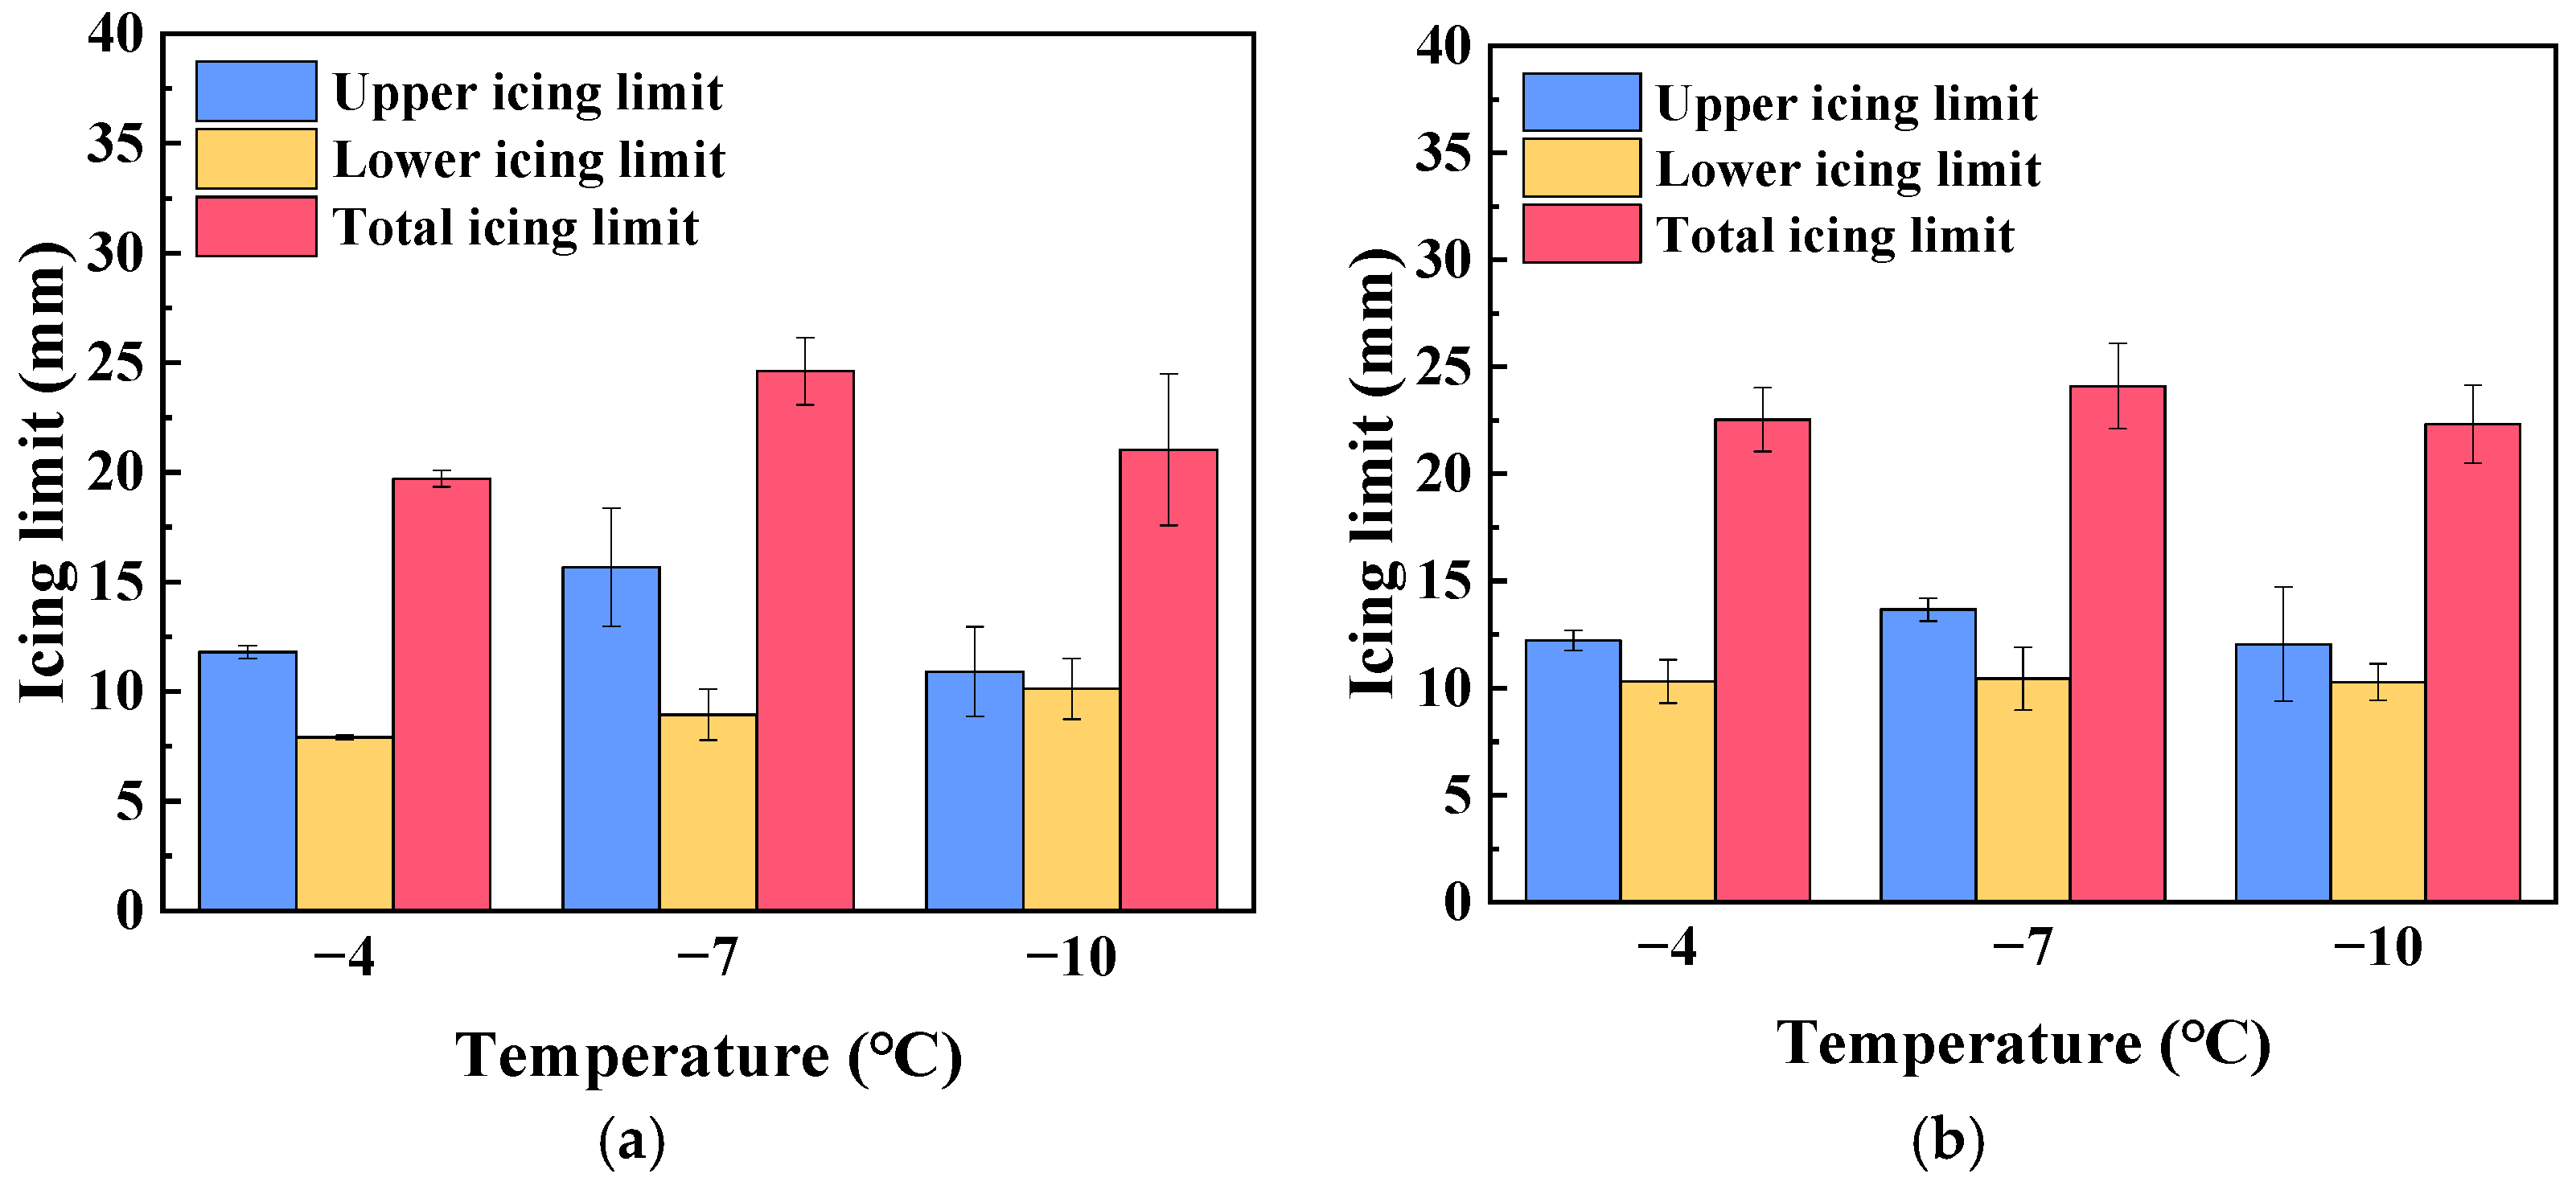
Based on the analyses of the icing area and the thickness of ice, the coverage scope of ice on the airfoil surface was also explored in the present study. To analyze this kind of characteristic quantitatively, two schematic parameters, Su and Sl, are shown in Figure 13. The parameters Su and Sl are the arc lengths of the airfoil covered by the ice layer on the upper airfoil surface and the lower airfoil surface, respectively. Therefore, Su and Sl express the upper icing limit and the lower icing limit in the present study. Then, the sum of them is the total icing limit along the airfoil surface. According to the experimental results and the definitions of the icing scopes, the variations in the icing limits on the upper airfoil surface and the lower airfoil surface are shown in Figure 16.
Figure 16.
Variations in icing scopes at different temperatures: (a) aluminum airfoil; (b) FRP airfoil.
As shown in Figure 16, for both types of airfoil materials, the temperature factor had a significant effect on the upper icing limit. For each icing condition, the upper icing limit was higher than the lower icing limit, especially for the aluminum airfoil. At the temperature of −7 °C, the upper icing limit and the total icing limit were highest. There was an obvious discrepancy in icing scope between the upper icing limit and the lower icing limit for the aluminum airfoil. However, the discrepancy for the FRP airfoil was indistinct at each temperature. The maximum discrepancies between the upper icing limit and the lower icing limit were 6.72 mm and 3.22 mm for the aluminum airfoil and the FRP airfoil, respectively. The experimental results further confirm that temperature has a more significant effect on the aerodynamic characteristics of the aluminum airfoil.
In summary, according to the analysis results of the icing area, ice thickness, and ice coverage, it was found that the airfoil material has a weakening effect on the icing characteristics of the NACA 0018 airfoil. As the wind speed was constant, temperature was the key affecting factor, because icing on the airfoil is a slow process under low-LWC and small MVD conditions. In this case, although the thermal conductivity rates have significant discrepancies between the airfoil materials, they still have enough capability to transfer the heat from water droplets to the airfoil substrate. The material properties have a slight effect on the icing process of the airfoil under low-LWC and small-MVD conditions.
5.4. Aerodynamic Performance Analysis
Based on the iced airfoil model, CFD simulations were carried out to analyze the pressure distribution around the iced airfoil. The effects of ice shapes on aerodynamic performance were explored to provide a theoretical foundation for the experimental research.
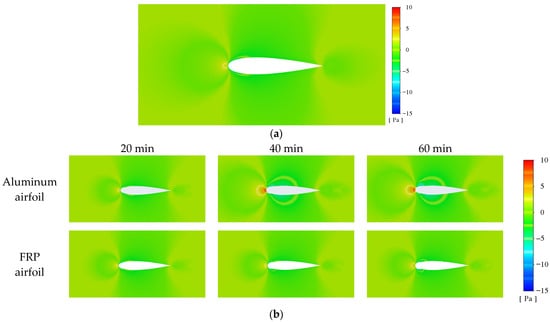
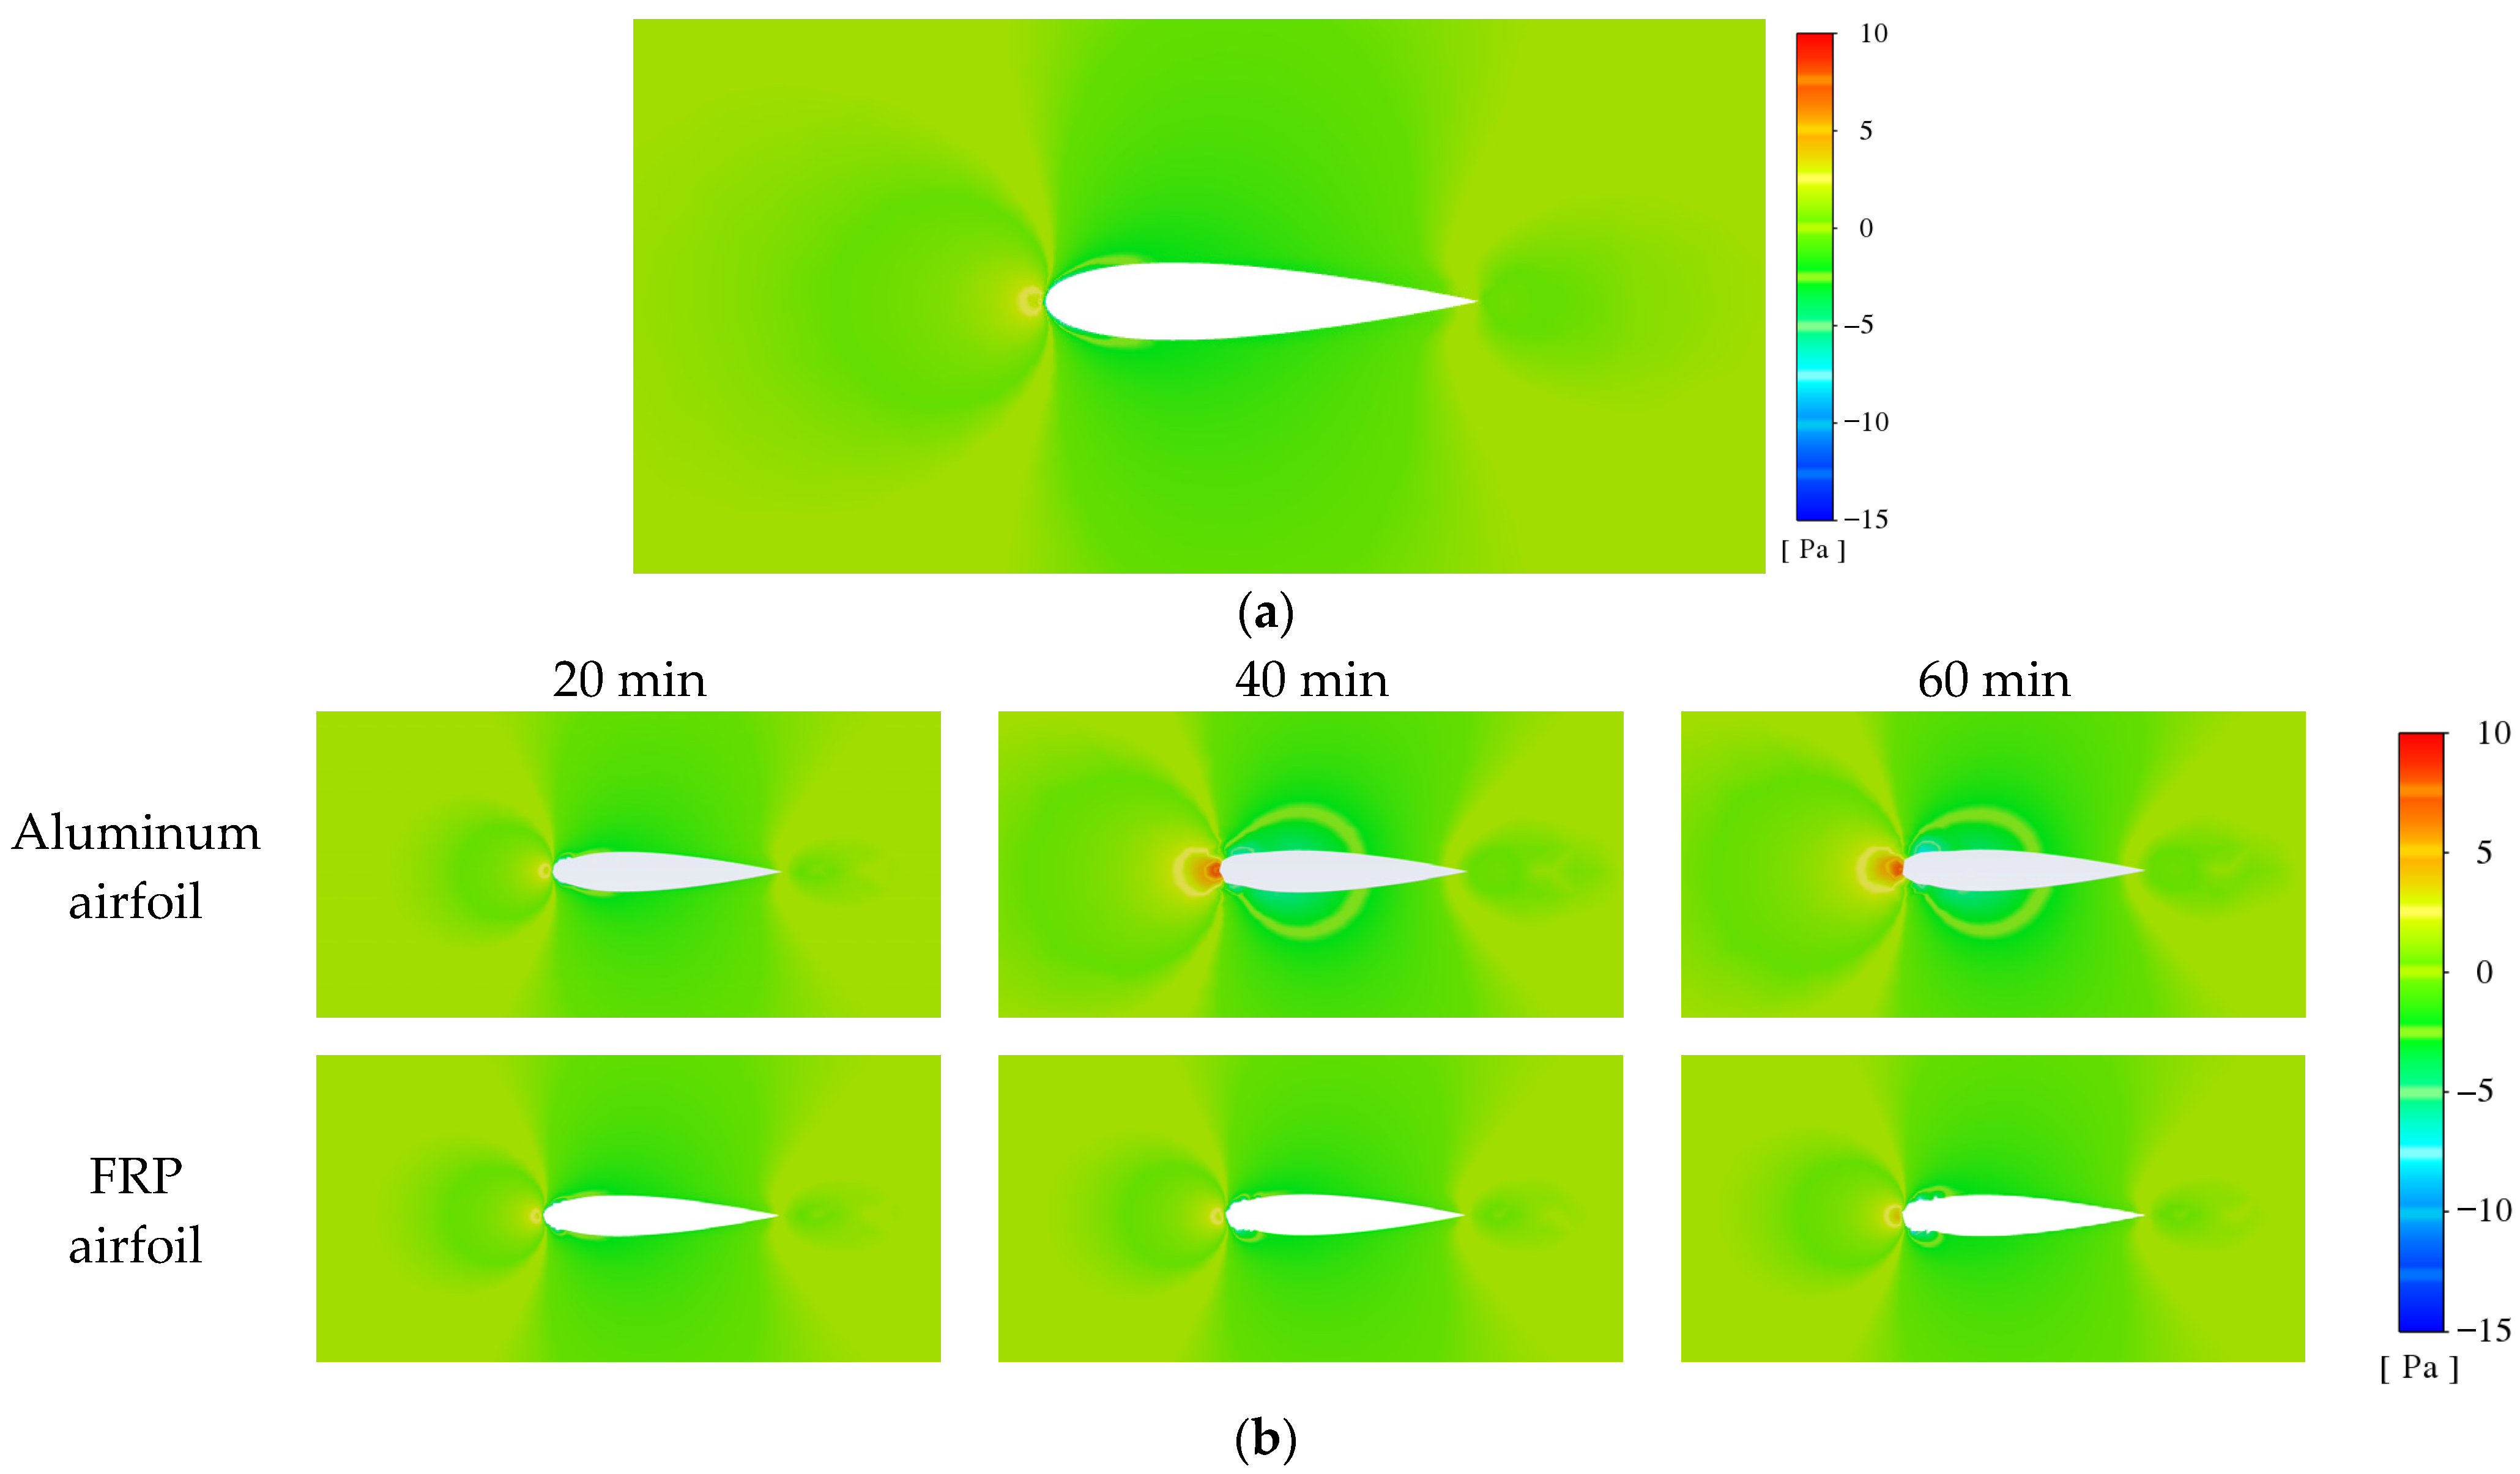
The models in Figure 9 were selected for the simulation analysis of the aerodynamic performance of iced airfoils. The static pressure on the icy surface under the inlet velocity of 4 m/s was analyzed to evaluate the effect of icing. The calculation results are shown in Figure 17.
Figure 17.
The contour plots of the static pressure under the different ice shapes: (a) clean airfoil; (b) iced airfoil at the temperature of −7 °C.
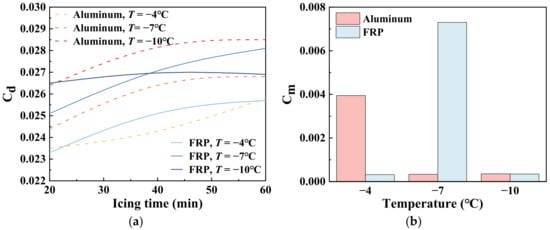
As shown in Figure 17, the distribution of static pressure at the leading edge varied significantly. In the first 20 min, the high-pressure area at the leading edge was small, and the pressure field was close to that of a clean airfoil. As the icing time gradually extended to 60 min, ice started to build up at the leading edge; the high-pressure area around the stagnation point expanded significantly, with the flow distortion gradually worsening. To further validate the effect of the ice, additional aerodynamic performance analyses, including Cd and Cm, were carried out. The variations in aerodynamic parameters at different temperature conditions are shown in Figure 18.
Figure 18.
Variations in power parameters at the different temperatures: (a) Cd; (b) Cm after 60 min of freezing.
As shown in Figure 18, with the increase in the icing time, the Cd of the iced airfoil under different conditions showed a gradually increasing trend. The increasing of CIA led to a higher drag coefficient. As the temperature decreased, the Cd increased. Under low-temperature conditions, feather-like ice formed more easily, and it brought a higher increase in drag.
For the aluminum airfoil, the coverage scope of ice was −0.10~0.15; the asymmetry became more obvious as the temperature decreased. Changes in the scope of surface icing caused a noticeable increase in Cd at different temperatures. Similarly, the icing scope for FRP airfoil sections was ±0.1, and the symmetrical structure had little effect on Cd. Therefore, its highest Cd value was affected by thickness and reached the maximum at −7 °C.
As mentioned in the previous analysis of the icing parameters, the amounts of ice were most significant at −7 °C; therefore, the maximum value of Cm occurred at −7 °C. As the temperature ranged from −4 °C to −10 °C, the aluminum airfoil had more stable aerodynamic performance compared to the FRP airfoil.
6. Conclusions
In the present study, the icing characteristics of the NACA 0018 airfoil under low-LWC and small-MVD conditions were explored experimentally. The main conclusions are summarized as follows.
- (1)
- A novel icing wind tunnel was developed in the present study. It was intended for icing experiments under foggy conditions within the temperature range of −4 to −10 °C, low LWC, and small MVD, using ultrasonic atomization and the negative suction method. Under these experimental conditions, the uncertainty of the temperature measured in the wind tunnel was approximately 0.6 °C. The LWC in the icing wind tunnel was 0.3~0.4 g/m3, and the MVD was below 10 μm. In terms of refrigeration, the icing wind tunnel used natural cold air in winter, which could save energy and keep the temperature stable. Compared with the previous nozzle arrangement and atomization methods, an optimized droplet-generation configuration driven by a pressure-differential suction mechanism was developed. The system integrated naturally cooled airflow, ultrasonic atomization, and suction-assisted atomized-droplet transport, representing an innovative atomization approach tailored to the present laboratory-scale icing wind tunnel.
- (2)
- In the present study, as the temperature was −4 °C, the ice type was mixed ice. In contrast, at −7 °C and −10 °C, the ice type was rime ice. The experiment confirmed that under the low-LWC and small-MVD conditions, rime ice was the dominant type for airfoil icing.
- (3)
- The icing characteristics of the airfoil were explored by experiments, including the icing area, the thickness of ice, and the coverage scope of ice. The temperature had a significant effect on the icing characteristics of the airfoil. At a medium temperature, such as −7 °C, the amounts of ice, including the icing area, the thickness of ice, and the coverage scope of ice, were all the largest for both types of airfoil materials. In contrast, as the temperature was higher or lower, such as −4 °C or −10 °C, the amount of ice decreased. The discrepancy between the icing characteristics of the airfoils with the different materials was minor.
- (4)
- The airfoil material had a slight effect on the icing characteristics of the airfoil. There were minor discrepancies between the two types of airfoils in the present study. At −4 °C or −7 °C, the amount of ice for the FRP airfoil was a little higher than that of the aluminum airfoil, but the coverage scope of ice on the aluminum airfoil surface was larger than that of the FRP airfoil at −7 °C.
Author Contributions
Conceptualization, W.G.; methodology, Y.Z.; software, H.D. and Y.S.; validation, H.D., Y.S. and J.D.; investigation, Y.Z., H.D. and Y.S.; writing—original draft preparation, Y.S., H.D. and W.G.; writing—review and editing, Y.Z. and W.G.; project administration, G.H.; funding acquisition, Y.Z. and W.G.; supervision, B.L. All authors have read and agreed to the published version of the manuscript.
Funding
This research was funded by the Natural Science Foundation of Heilongjiang Province of China, Grant No. LH2023E002.
Institutional Review Board Statement
Not applicable.
Informed Consent Statement
Not applicable.
Data Availability Statement
The original contributions presented in this study are included in the article. Further inquiries can be directed to the corresponding authors.
Conflicts of Interest
Authors Baisheng Liu was employed by the company ZhaoDong HuaNeng Thermal Power Co., Ltd. The remaining authors declare that the research was conducted in the absence of any commercial or financial relationships that could be construed as potential conflicts of interest.
References
- Saidur, R.; Rahim, N.A.; Islam, M.R.; Solangi, K.H. Environmental Impact of Wind Energy. Renew. Sustain. Energy Rev. 2011, 15, 2423–2430. [Google Scholar] [CrossRef] [Scilit]
- Parent, O.; Ilinca, A. Anti-Icing and de-Icing Techniques for Wind Turbines: Critical Review. Cold Reg. Sci. Technol. 2011, 65, 88–96. [Google Scholar] [CrossRef] [Scilit]
- Lamraoui, F.; Fortin, G.; Benoit, R.; Perron, J.; Masson, C. Atmospheric Icing Impact on Wind Turbine Production. Cold Reg. Sci. Technol. 2014, 100, 36–49. [Google Scholar] [CrossRef] [Scilit]
- Mu, Z.; Li, Y.; Guo, W.; Shen, H.; Tagawa, K. An Experimental Study on Adhesion Strength of Offshore Atmospheric Icing on a Wind Turbine Blade Airfoil. Coatings 2023, 13, 164. [Google Scholar] [CrossRef] [Scilit]
- Gao, L.; Liu, Y.; Zhou, W.; Hu, H. An Experimental Study on the Aerodynamic Performance Degradation of a Wind Turbine Blade Model Induced by Ice Accretion Process. Renew. Energy 2019, 133, 663–675. [Google Scholar] [CrossRef] [Scilit]
- Gao, L.; Hu, H. Wind Turbine Icing Characteristics and Icing-Induced Power Losses to Utility-Scale Wind Turbines. Proc. Natl. Acad. Sci. USA 2021, 118, e2111461118. [Google Scholar] [CrossRef] [Scilit] [PubMed]
- Zhang, X. The impact of blade tip icing on the aerodynamic performance of wind turbines using common airfoil profiles. J. Agric. Eng. 2024, 40, 93. (In Chinese) [Google Scholar] [CrossRef]
- Kraj, A.G.; Bibeau, E.L. Phases of Icing on Wind Turbine Blades Characterized by Ice Accumulation. Renew. Energy 2010, 35, 966–972. [Google Scholar] [CrossRef] [Scilit]
- Li, Y.; Tagawa, K.; Feng, F.; Li, Q.; He, Q. A Wind Tunnel Experimental Study of Icing on Wind Turbine Blade Airfoil. Energy Convers. Manag. 2014, 85, 591–595. [Google Scholar] [CrossRef] [Scilit]
- Gao, L.; Liu, Y.; Hu, H. An Experimental Investigation of Dynamic Ice Accretion Process on a Wind Turbine Airfoil Model Considering Various Icing Conditions. Int. J. Heat Mass Transf. 2019, 133, 930–939. [Google Scholar] [CrossRef] [Scilit]
- Esmeryan, K.D. From Extremely Water-Repellent Coatings to Passive Icing Protection—Principles, Limitations and Innovative Application Aspects. Coatings 2020, 10, 66. [Google Scholar] [CrossRef] [Scilit]
- He, Z.; Zhuo, Y.; Zhang, Z.; He, J. Design of Icephobic Surfaces by Lowering Ice Adhesion Strength: A Mini Review. Coatings 2021, 11, 1343. [Google Scholar] [CrossRef] [Scilit]
- Jiang, X.; Zhuo, Y.; Wang, P.; Yang, M.; Liao, Y.; Chen, B. The Perspectives of Hydrophobic Coatings for Mitigating Icing on Atmospheric Structures. Coatings 2023, 13, 326. [Google Scholar] [CrossRef] [Scilit]
- Niu, T.; Li, Y.; Liu, Z.; Liu, J. Application of Carbon Nanotube Coatings in Anti-Icing of Wind Turbine Blades: A Brief Review. Coatings 2026, 16, 689. [Google Scholar] [CrossRef] [Scilit]
- Wang, H.; Liu, Y.; Bao, C.; Kai, G.; Baoyin, H. Experimental and Numerical Study on Icing Characteristics of Integrated Wind Turbines under Operating Conditions. Cold Reg. Sci. Technol. 2026, 246, 104846. [Google Scholar] [CrossRef] [Scilit]
- Caccia, F.; Guardone, A. Numerical Simulations of Ice Accretion on Wind Turbine Blades: Are Performance Losses Due to Ice Shape or Surface Roughness? Wind Energy Sci. 2023, 8, 341–362. [Google Scholar] [CrossRef] [Scilit]
- Yang, P.; Li, H.; Chen, J.; Duan, Y.; Zhang, Y. Influence of Air Flow Field Computation on an Ice Accretion Simulation of Airfoils. Aerosp. Sci. Technol. 2024, 151, 109315. [Google Scholar] [CrossRef] [Scilit]
- Liu, X.; Niu, C.; Chen, X.; Wang, Z.; Cheong, K.B. Experimental Investigation on the Characteristics of Saltwater Droplets Ice Accretion on an NACA0018 Airfoil. Appl. Therm. Eng. 2025, 264, 125420. [Google Scholar] [CrossRef] [Scilit]
- Wang, X.; Ru, Y.; Zhao, H.; Wang, Z. Study on the Effect of Mixed-Phase Icing on the Aerodynamic Characteristics of Wind Turbine Airfoil. Energies 2025, 18, 559. [Google Scholar] [CrossRef] [Scilit]
- Homola, M.C.; Virk, M.S.; Wallenius, T.; Nicklasson, P.J.; Sundsbø, P.A. Effect of Atmospheric Temperature and Droplet Size Variation on Ice Accretion of Wind Turbine Blades. J. Wind Eng. Ind. Aerodyn. 2010, 98, 724–729. [Google Scholar] [CrossRef] [Scilit]
- Wang, X.; Ru, Y.; Zhao, H.; Wang, Z. Numerical Investigation of Wind Turbine Airfoil Icing and Its Influencing Factors under Mixed-Phase Conditions. Energies 2024, 17, 4993. [Google Scholar] [CrossRef] [Scilit]
- Martini, F.; Ilinca, A.; Rizk, P.; Ibrahim, H.; Issa, M. A Survey of the Quasi-3D Modeling of Wind Turbine Icing. Energies 2022, 15, 8998. [Google Scholar] [CrossRef] [Scilit]
- Guo, W.; Shen, H.; Li, Y.; Feng, F.; Tagawa, K. Wind Tunnel Tests of the Rime Icing Characteristics of a Straight-Bladed Vertical Axis Wind Turbine. Renew. Energy 2021, 179, 116–132. [Google Scholar] [CrossRef] [Scilit]
- Fujiwara, G.E.C.; Bragg, M.B. Method for Designing Hybrid Airfoils for Icing Wind-Tunnel Tests. J. Aircr. 2019, 56, 137–149. [Google Scholar] [CrossRef] [Scilit]
- Tropea, C. Optical Particle Characterization in Flows. Annu. Rev. Fluid Mech. 2011, 43, 399–426. [Google Scholar] [CrossRef] [Scilit]
- Privitera, S.; Manetto, G.; Pascuzzi, S.; Pessina, D.; Cerruto, E. Drop Size Measurement Techniques for Agricultural Sprays: A State-of-the-Art Review. Agronomy 2023, 13, 678. [Google Scholar] [CrossRef] [Scilit]
- ARP5905; Calibration and Acceptance of Icing Wind Tunnels. SAE International: Warrendale, PA, USA, 2009. [CrossRef] [Scilit]
- Davis, N.; Hahmann, A.N.; Clausen, N.-E.; Žagar, M. Forecast of Icing Events at a Wind Farm in Sweden. J. Appl. Meteorol. Climatol. 2014, 53, 262–281. [Google Scholar] [CrossRef] [Scilit]
- Jeck, R.K. Icing Design Envelopes (14 CFR Parts 25 and 29, Appendix C) Converted to a Distance-Based Format; Federal Aviation Administration (FAA): Washington, DC, USA, 2002. [Google Scholar]
- Zu, F.; Yuan, C.; Wu, H.; Wang, H.; Zhu, Y.; Zhu, C. Microphysical Structure of Fog Droplets in Different Levels of Fog and a Case Study in Northern Jiangsu Province. Acta Meteorol. Sin. 2020, 78, 691–704. (In Chinese) [Google Scholar] [CrossRef]
- Xu, F.; Han, L.; Lü, J.; Wang, J.; Tu, S.; Ji, Q.; Zhang, Y. Analysis of the microphysical and chemical characteristics of a sea fog event in the northwestern South China Sea. J. Trop. Meteorol. 2019, 35, 596–603. (In Chinese) [Google Scholar] [CrossRef]
- Shi, W.; Shen, S.; Hou, G.; Ding, J.; Guo, W.; Zhang, Y. Icing and Adhesive Characteristics of Iced Airfoils under Rime Ice Conditions. Coatings 2025, 15, 606. [Google Scholar] [CrossRef] [Scilit]
- ISO 12494:2017; Atmospheric Icing of Structures. International Organization for Standardization: Geneva, Switzerland, 2017.


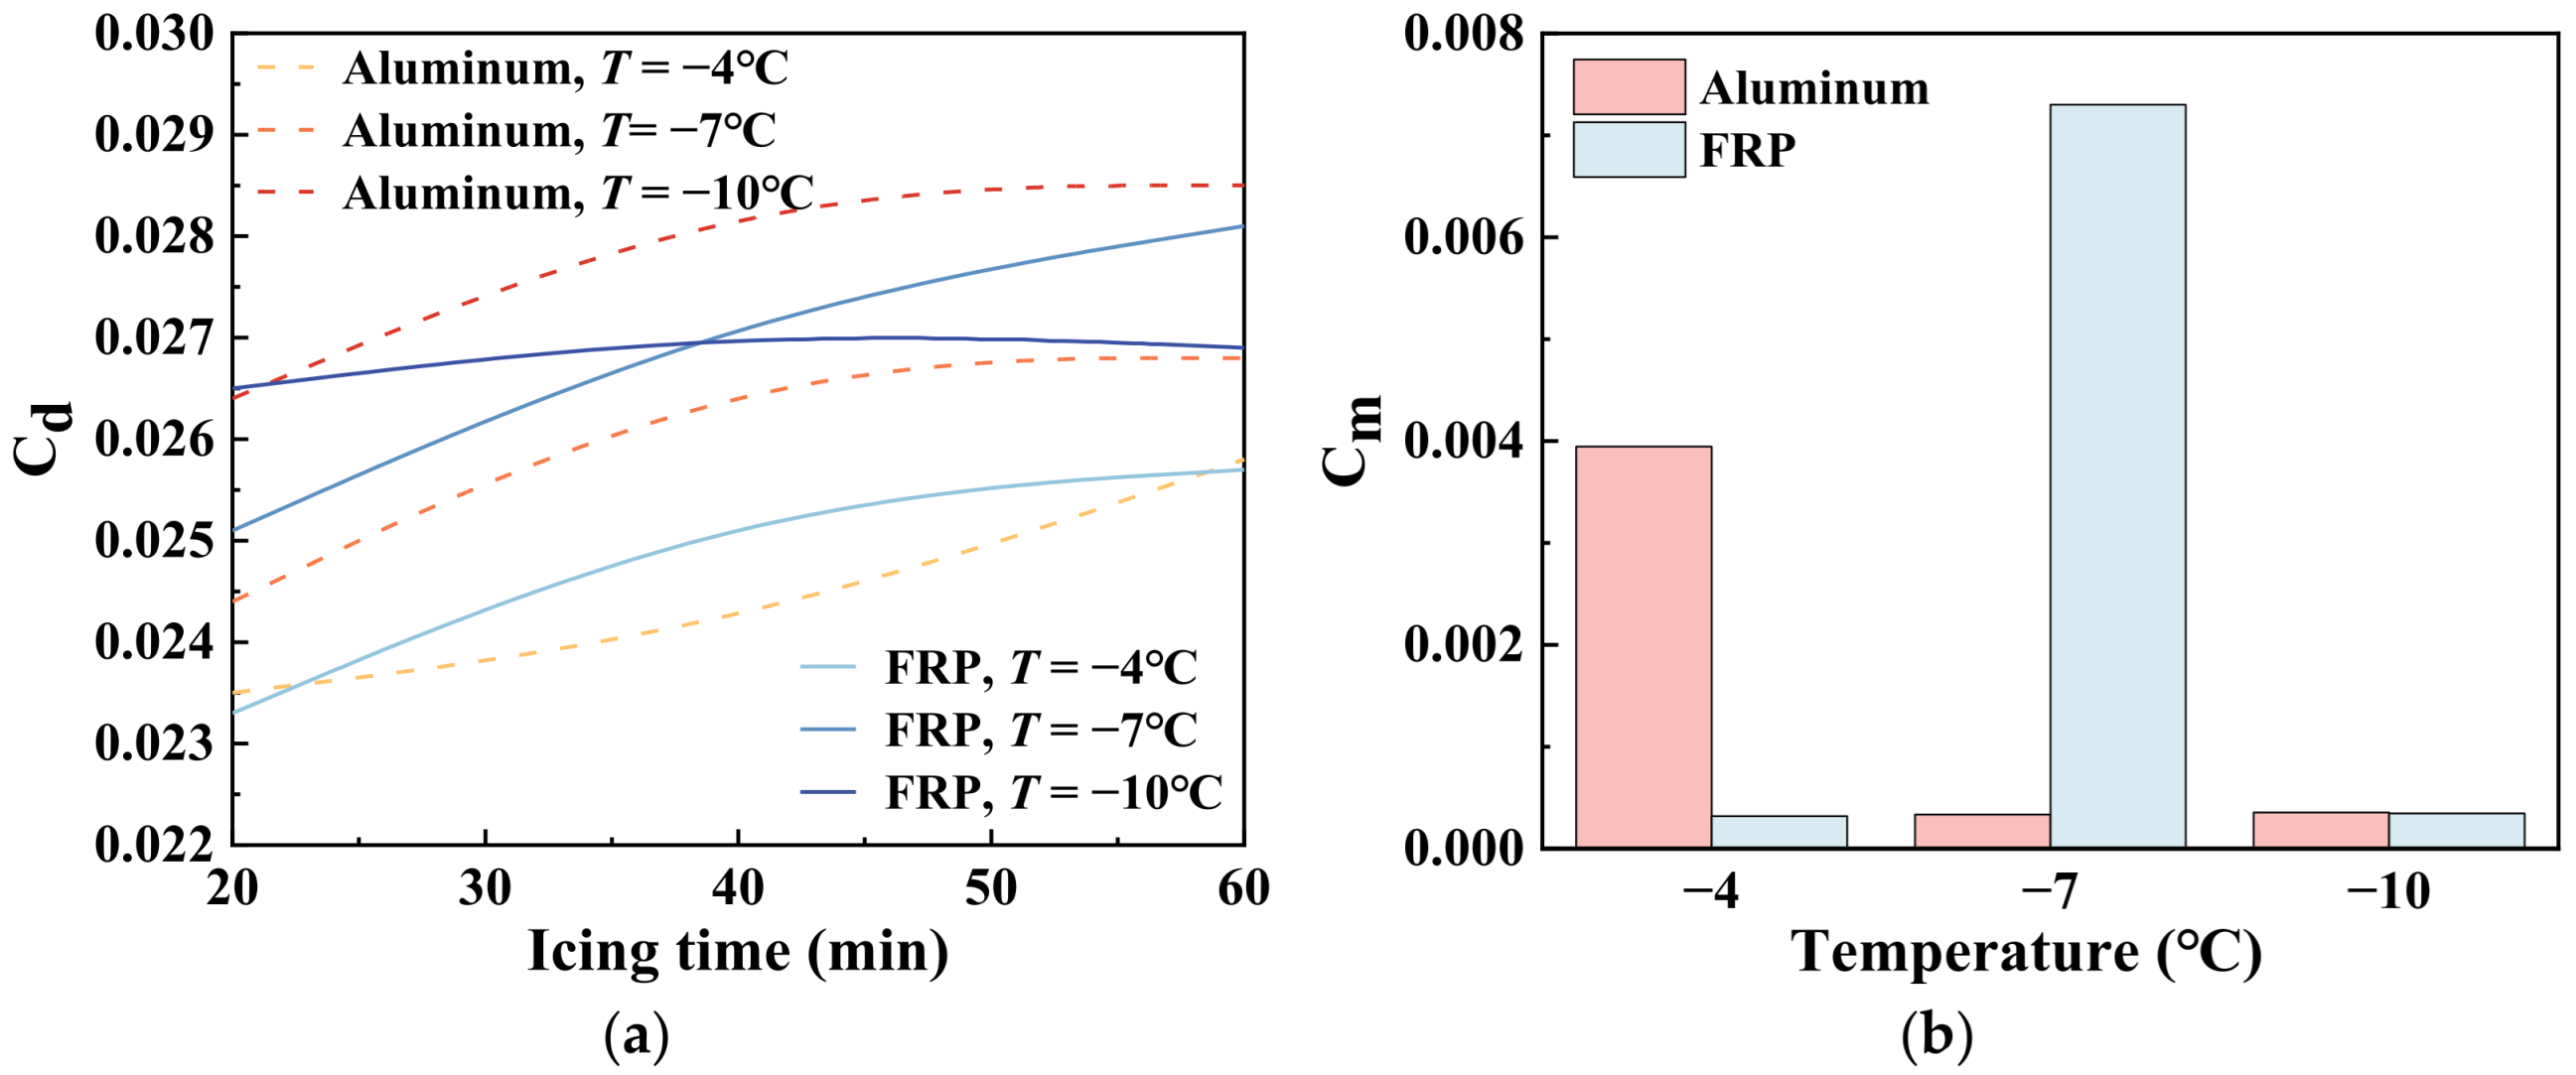

Disclaimer/Publisher’s Note: The statements, opinions and data contained in all publications are solely those of the individual author(s) and contributor(s) and not of MDPI and/or the editor(s). MDPI and/or the editor(s) disclaim responsibility for any injury to people or property resulting from any ideas, methods, instructions or products referred to in the content. |
© 2026 by the authors. Licensee MDPI, Basel, Switzerland. This article is an open access article distributed under the terms and conditions of the Creative Commons Attribution (CC BY) license.