1. Introduction
In China, asphalt pavement is the dominant structure for high-grade highways [
1]. According to statistics, 21,800 traffic accidents occurred in China in 2024, causing over 19,000 fatalities [
2]. Rear-end collisions on rainy days accounted for 13%–28% of the total accidents, and the accident probability on wet pavements was approximately twice that on dry pavements [
3]. The main causes of traffic accidents are twofold: improper driver operation on the one hand, and inadequate skid resistance of the pavement on the other [
4,
5,
6]. Research indicates that when a tire travels rapidly on a pavement, the irregular arrangement of pavement aggregates causes deformation of the tire rubber. Due to the hysteresis effect of rubber deformation—the energy dissipation caused by the lag between loading and unloading cycles during cyclic deformation, which prevents the rubber from recovering its original shape instantaneously—the rubber cannot recover its original shape quickly, and this process leads to energy dissipation. Furthermore, the contact behavior between the tire and the pavement is influenced by multiple factors including tire load, speed, environmental conditions, and pavement texture, exhibiting complex dynamic characteristics [
7,
8,
9]. Therefore, both micro-texture and macro-texture are important sources of friction [
10]. Macro-texture (texture depth) affects the drainage capacity and hydroplaning risk under high-speed conditions, whereas the micro-texture characteristics of aggregates are more important for friction generation under low-speed conditions [
11,
12,
13].
SBS (styrene–butadiene–styrene)-modified asphalt is one of the most widely used polymer-modified binders in high-grade pavements due to its excellent high-temperature rutting resistance and low-temperature cracking resistance. Extensive experimental and theoretical investigations have been carried out on the mechanical properties [
14], durability [
15], and impact resistance [
16] of asphalt mixtures. Previous studies showed that traffic-induced wear and environmental degradation can alter pavement surface characteristics, thereby affecting long-term skid durability. In particular, rubber-modified asphalt mixtures have attracted considerable attention for their enhanced cracking resistance and fatigue performance. Jin et al. [
17] demonstrated that the fracture energy of rubber-modified asphalt surface courses was 17.4%–21.9% higher than that of conventional mixtures, and the mixtures exhibited exceptional deformation resistance after long-term aging. Field applications further confirmed that rubber-modified asphalt overlays, when combined with stress-absorbing membrane interlayers, effectively suppressed reflective cracking and reduced pavement noise by approximately 2 dB [
18]. The incorporation of recycled tire fabric fibers together with ground tire rubber was also found to significantly improve both rutting and cracking resistance, with field sections showing no cracking after two years of service [
19]. Moreover, alternative waste-derived materials such as stamp sand and acrylonitrile styrene acrylate (ASA) composites have been explored as potential asphalt-free pavement materials, demonstrating excellent rutting and moisture damage resistance despite lower fracture energy than conventional asphalt mixtures [
20]. Among the factors influencing tire–pavement friction, surface texture is widely recognized as one of the most critical parameters governing skid resistance [
21]. This texture primarily originates from the fine irregularities on the surface of coarse aggregates, as well as from the size and arrangement of the aggregates, manifesting as large-scale undulations on the pavement surface, and is mainly affected by the mixture gradation type and the asphalt aggregate ratio [
22,
23]. Skid resistance originates from tire–pavement contact behavior. The pressure distribution, friction characteristics, and adhesion in the tire–pavement contact area directly determine the vehicle’s braking efficiency, handling stability, and driving safety. This contact behavior is influenced by multiple factors including tire load, operating speed, environmental conditions, and pavement texture, exhibiting complex dynamic variation characteristics [
24,
25,
26]. Chen et al. [
27] systematically reviewed the skid resistance mechanisms, influencing factors, and evaluation methods for asphalt pavements. Their findings indicate that texture characteristics and service conditions jointly determine skid resistance performance. The relationship between macro- and micro-texture parameters and skid resistance, as revealed through detection and modeling, provides a key reference for improving pavement skid resistance. Recent advances in texture measurement and friction prediction have further enriched this field. Zhong et al. [
28] developed an image-based close-range photogrammetry (CRP) technique to construct three-dimensional surface models of laboratory ring-shaped asphalt specimens, establishing quantitative relationships between texture parameters and skid resistance. Building upon this, a texture-image coupled fusion framework was proposed that integrates computer vision and machine learning to predict the coefficient of friction, demonstrating that computer-encoded image features better represent pavement skid resistance than traditional human-defined texture parameters [
29]. Meanwhile, explainable machine learning approaches have been applied to optimize preventive maintenance strategies for friction restoration, with XGBoost models achieving high prediction accuracy (R
2 = 0.76) and identifying slurry seals as the most effective treatment for maintaining friction above investigatory levels over a five-year period [
30].
Guo et al. [
31] analyzed the relationship between the variation characteristics of contact stress and rolling resistance by establishing a three-dimensional tire-road model, which provided a theoretical basis for the study of tire performance of heavy-duty vehicles. Yu et al. [
32] developed a new test system and found a close linear correlation between the tire–pavement contact area and the dynamic friction coefficient (DFC). Ma et al. [
33] investigated the evolution law of surface texture during the wear process and its effect on the degradation of friction performance; the results showed that after wear, the macro-texture gradually changed from rough to smooth, and the texture direction also shifted from isotropic to anisotropic. La et al. [
34] employed a self-developed testing apparatus and a modified spring-slider model to confirm the significant influence of factors such as temperature, surface roughness, and sand particle size on tire–pavement friction performance. Zhu et al. [
35] conducted accelerated pavement tests using a mobile load simulator (MLS11) and systematically analyzed the skid resistance of different types of asphalt mixtures as well as prediction models for their evolution trends, aiming to optimize skid resistance design and accurately predict long-term service performance. Yu et al. [
36] investigated pavement skid resistance under cumulative loading and overloaded traffic conditions, and found that over the entire service life of the pavement, the most critical factor affecting the pavement friction coefficient is the total traffic volume, followed by the frequency of heavy-load traffic, and then the duration of heavy-load traffic. Chu et al. [
37] employed high-precision three-dimensional laser scanning to characterize the surface morphology of eight asphalt mixtures and developed a comprehensive texture index (F) based on multidimensional parameters and principal component analysis. The proposed index effectively differentiated pavement mixtures with varying air-void contents and showed strong potential for skid-resistance assessment and braking performance prediction. Guo et al. [
38] proposed a novel method for determining the key parameters in Persson’s friction theory, namely the lower cut-off wave number (q
1) and the tire–road contact ratio, to account for the influence of pavement texture evolution on skid resistance under traffic-induced wear. The results demonstrated that the friction trend of worn pavement surfaces could be more accurately predicted when q
1 was set to 500 times the rolling cut-off wave number (q
0). Mache et al. [
39] analyzed the evolution law of anti-sliding performance of SMA-11S and SMA-8NH asphalt pavement wear layers and its relationship with macro-texture and micro-texture parameters in detail. Based on the measurement results of TRT, pendulum, and laser portable frame in the Czech Republic, the SMA-11S wear layer maintained good skid resistance under the condition of 14 years of service and large traffic volume. The SMA-8NH wear layer can achieve similar durability only when using high-quality anti-polishing aggregates.
Although extensive studies have been conducted on the friction mechanism of dry pavements via experiments and numerical simulations, the lack of suitable testing equipment has hindered systematic investigations into friction mechanisms and model development under the combined effects of submerged conditions and pavement distress. Therefore, this study employed a self-developed testing apparatus to characterize the friction behavior of pavement distresses under submerged conditions, considering different roughness levels, water temperatures, loads, and cycle numbers, aiming to provide a mechanistic understanding of friction behavior at the rubber–asphalt interface under quasi-static water-saturated conditions, with particular emphasis on the comparative sensitivity of different distress types to environmental and mechanical factors.
3. Results and Analysis
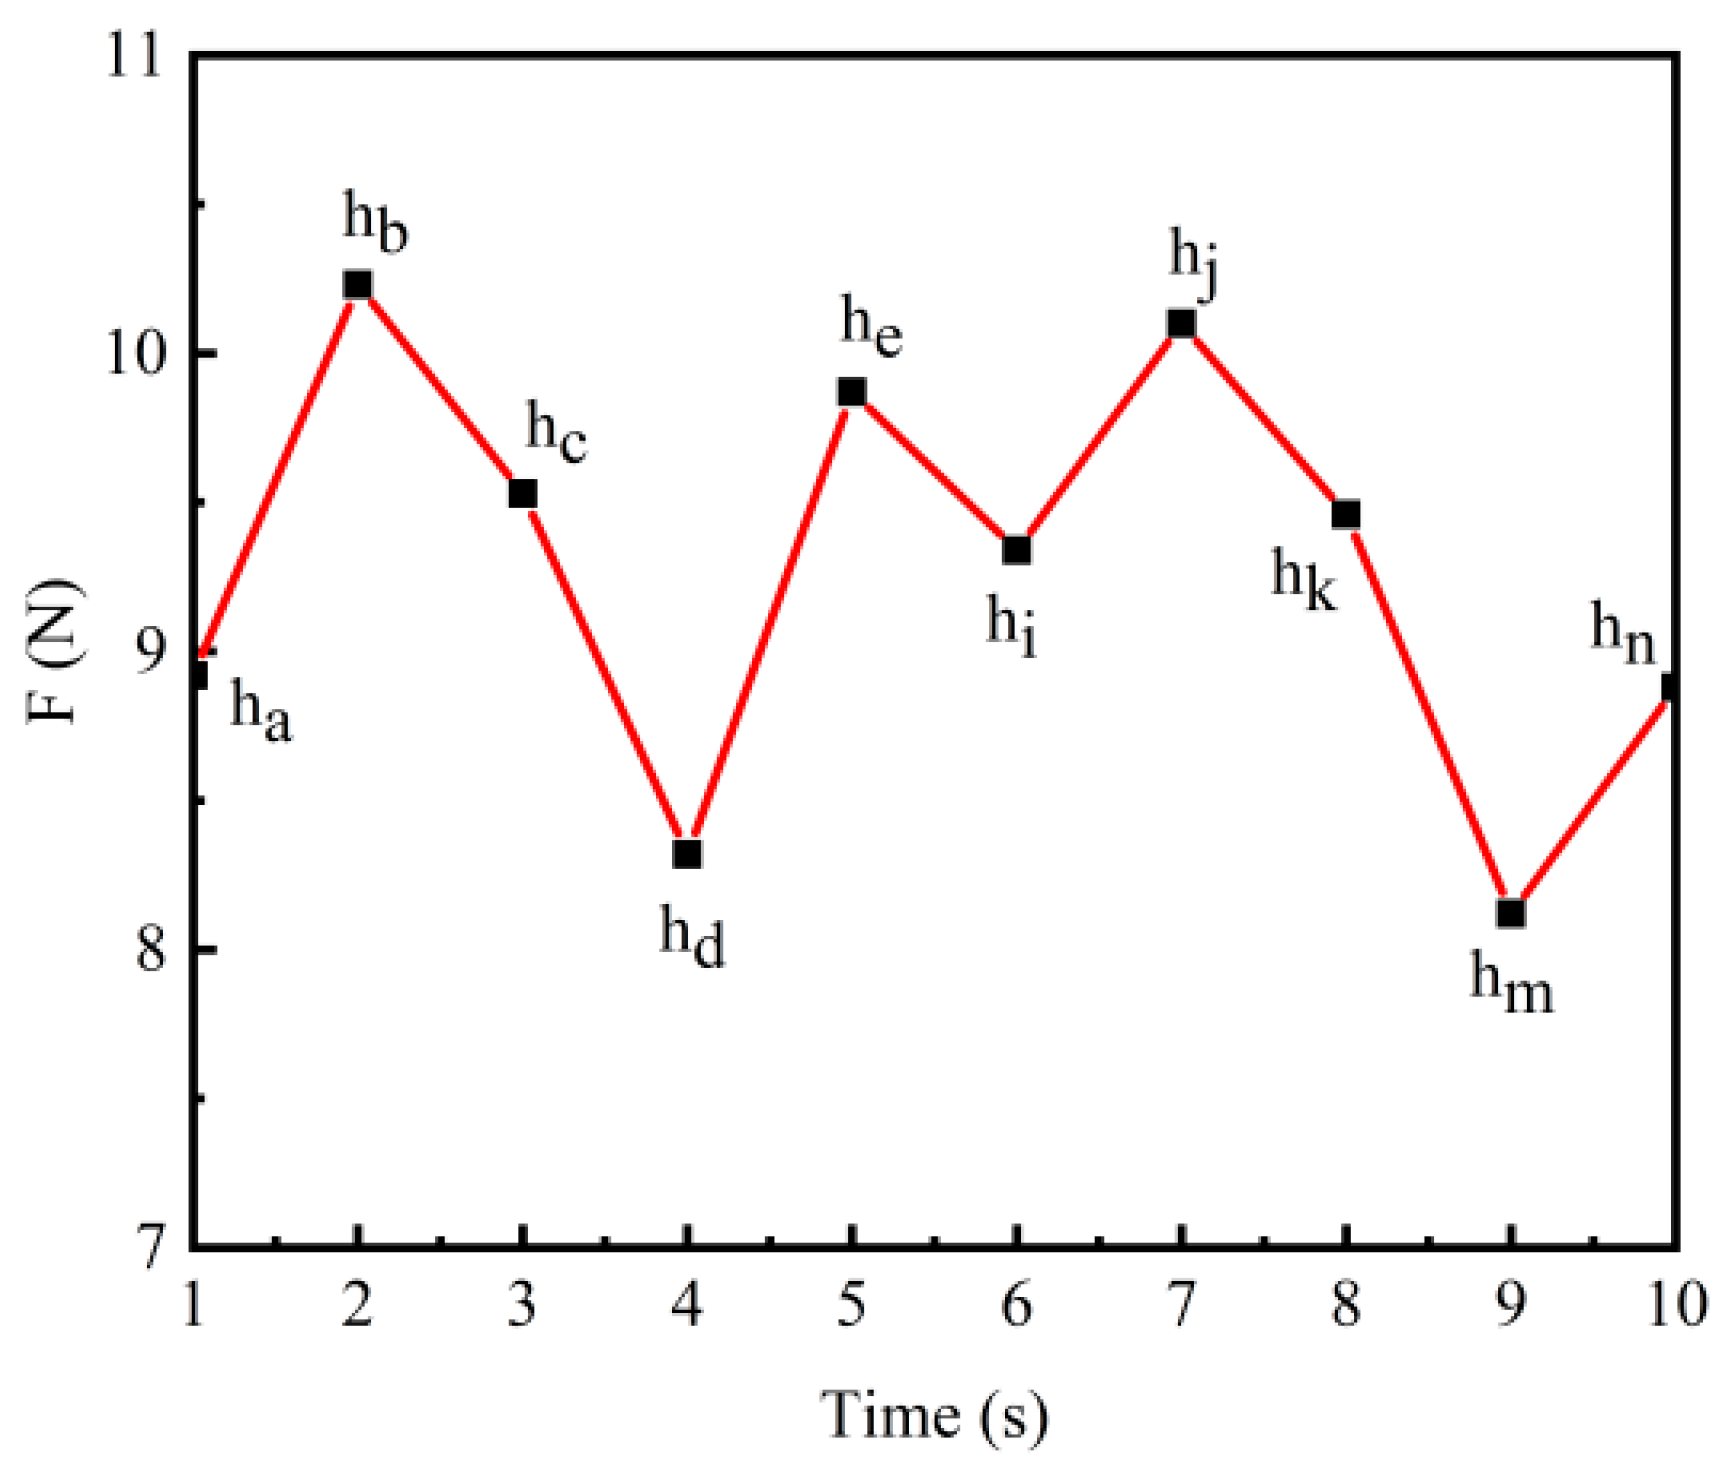
For the data collected in the experiment, Origin 2024 software was used to plot the time–friction force curves. Overall, the curves all show an initial rising phase followed by a period of stability. This is because, at the beginning of sliding, the rubber slider tends to remain stable due to static friction, and dynamic sliding friction begins only after the maximum static friction is reached. Therefore, a 10 s segment of the friction force curve after the maximum static friction was extracted from the sliding friction curve (a schematic definition is shown in
Figure 3), and further analysis was conducted from three aspects—mean value, maximum value, and amplitude—based on the friction data of these 10 s. The calculation formulas for the three factors are shown in Equations (1), (2), and (3), respectively.
For defining the parameters in the schematic diagram see as follows below.
- (1)
Mean value:
- (2)
Maximum value:
- (3)
Amplitude:
It should be clarified that the friction force measured in this study refers to the sliding friction force generated between the rubber slider and the asphalt pavement surface under vertical loading and horizontal sliding motion. This interfacial tangential resistance directly characterizes the skid resistance of the pavement surface, rather than the rolling resistance, since the rubber slider undergoes pure sliding without any rolling motion.
All tests were conducted in triplicate, and the reported values (mean, maximum, and amplitude) were averaged from three parallel measurements. Standard deviations are provided in
Table 4 and
Table 5 to indicate data variability. Prior to presenting the detailed parametric analysis, it is important to clarify the interpretational scope of the test conditions. It should be emphasized that, owing to the quasi-static sliding speed (2 mm/min) adopted in this study, the hydrodynamic lift and viscous squeeze-film effects are negligible. Consequently, the water-film thickness no longer governs the fluid–solid interfacial pressure distribution. Instead, this full-immersion configuration serves as a well-defined “water-saturated interface state,” which eliminates the influence of meniscus effects and ensures complete, stable lubrication at the contact asperities. This setup represents the critical boundary condition for evaluating the intrinsic adhesion and hysteresis friction components of pavement materials under aqueous environments, providing a conservative yet repeatable benchmark for water-induced friction degradation. Within this clearly defined scope, the water depth thickness was held constant (≈10 mm full immersion) across all tests, ensuring that the observed variations in friction can be unambiguously attributed to the parameters under investigation (roughness, load, temperature, and cycles) rather than to changes in water depth.
We acknowledge that this quasi-static configuration does not reproduce tire rotation, drainage, or hydrodynamic effects, and thus does not directly simulate high-speed field conditions. It is a controlled water-saturated rubber–asphalt interface test rather than a direct simulation of wet-road or hydroplaning conditions. Its value lies in the systematic comparison of distress types and the identification of friction mechanisms under consistent boundary conditions, providing a repeatable benchmark rather than field friction coefficients. Friction force is used as the primary metric for roughness, temperature, and cyclic analyses, as the relative comparisons within each distress type are unaffected by conversion to friction coefficient; the coefficient μ is presented separately in
Section 3.2 for load-dependence analysis. The reported loads of 50, 100, and 150 g refer to the additional counterweight mass, not the total normal force; the self-weight remained constant across all tests. This study adopts a one-factor-at-a-time design to isolate individual parameter effects; multi-factor interactions are not examined here but will be pursued in future work through factorial design experiments. The results represent comparative trends under controlled laboratory conditions; extrapolation to actual tire–pavement friction should be made with caution, as the contact pressure, deformation characteristics, and sliding dynamics of a full-scale pneumatic tire differ substantially from those of the rubber slider used in this study. Because the normal load is constant in the roughness, temperature, and cyclic tests, the friction force
is used as a direct friction indicator; the friction coefficient
is applied only in
Section 3.2 where the load varies. The trend descriptions presented in this section are based on visual inspection of the consistent and repeatable experimental data; formal regression modeling is not performed in this exploratory study but will be pursued in future work.
3.1. Effect of Pavement Surface Roughness on Friction Characteristics
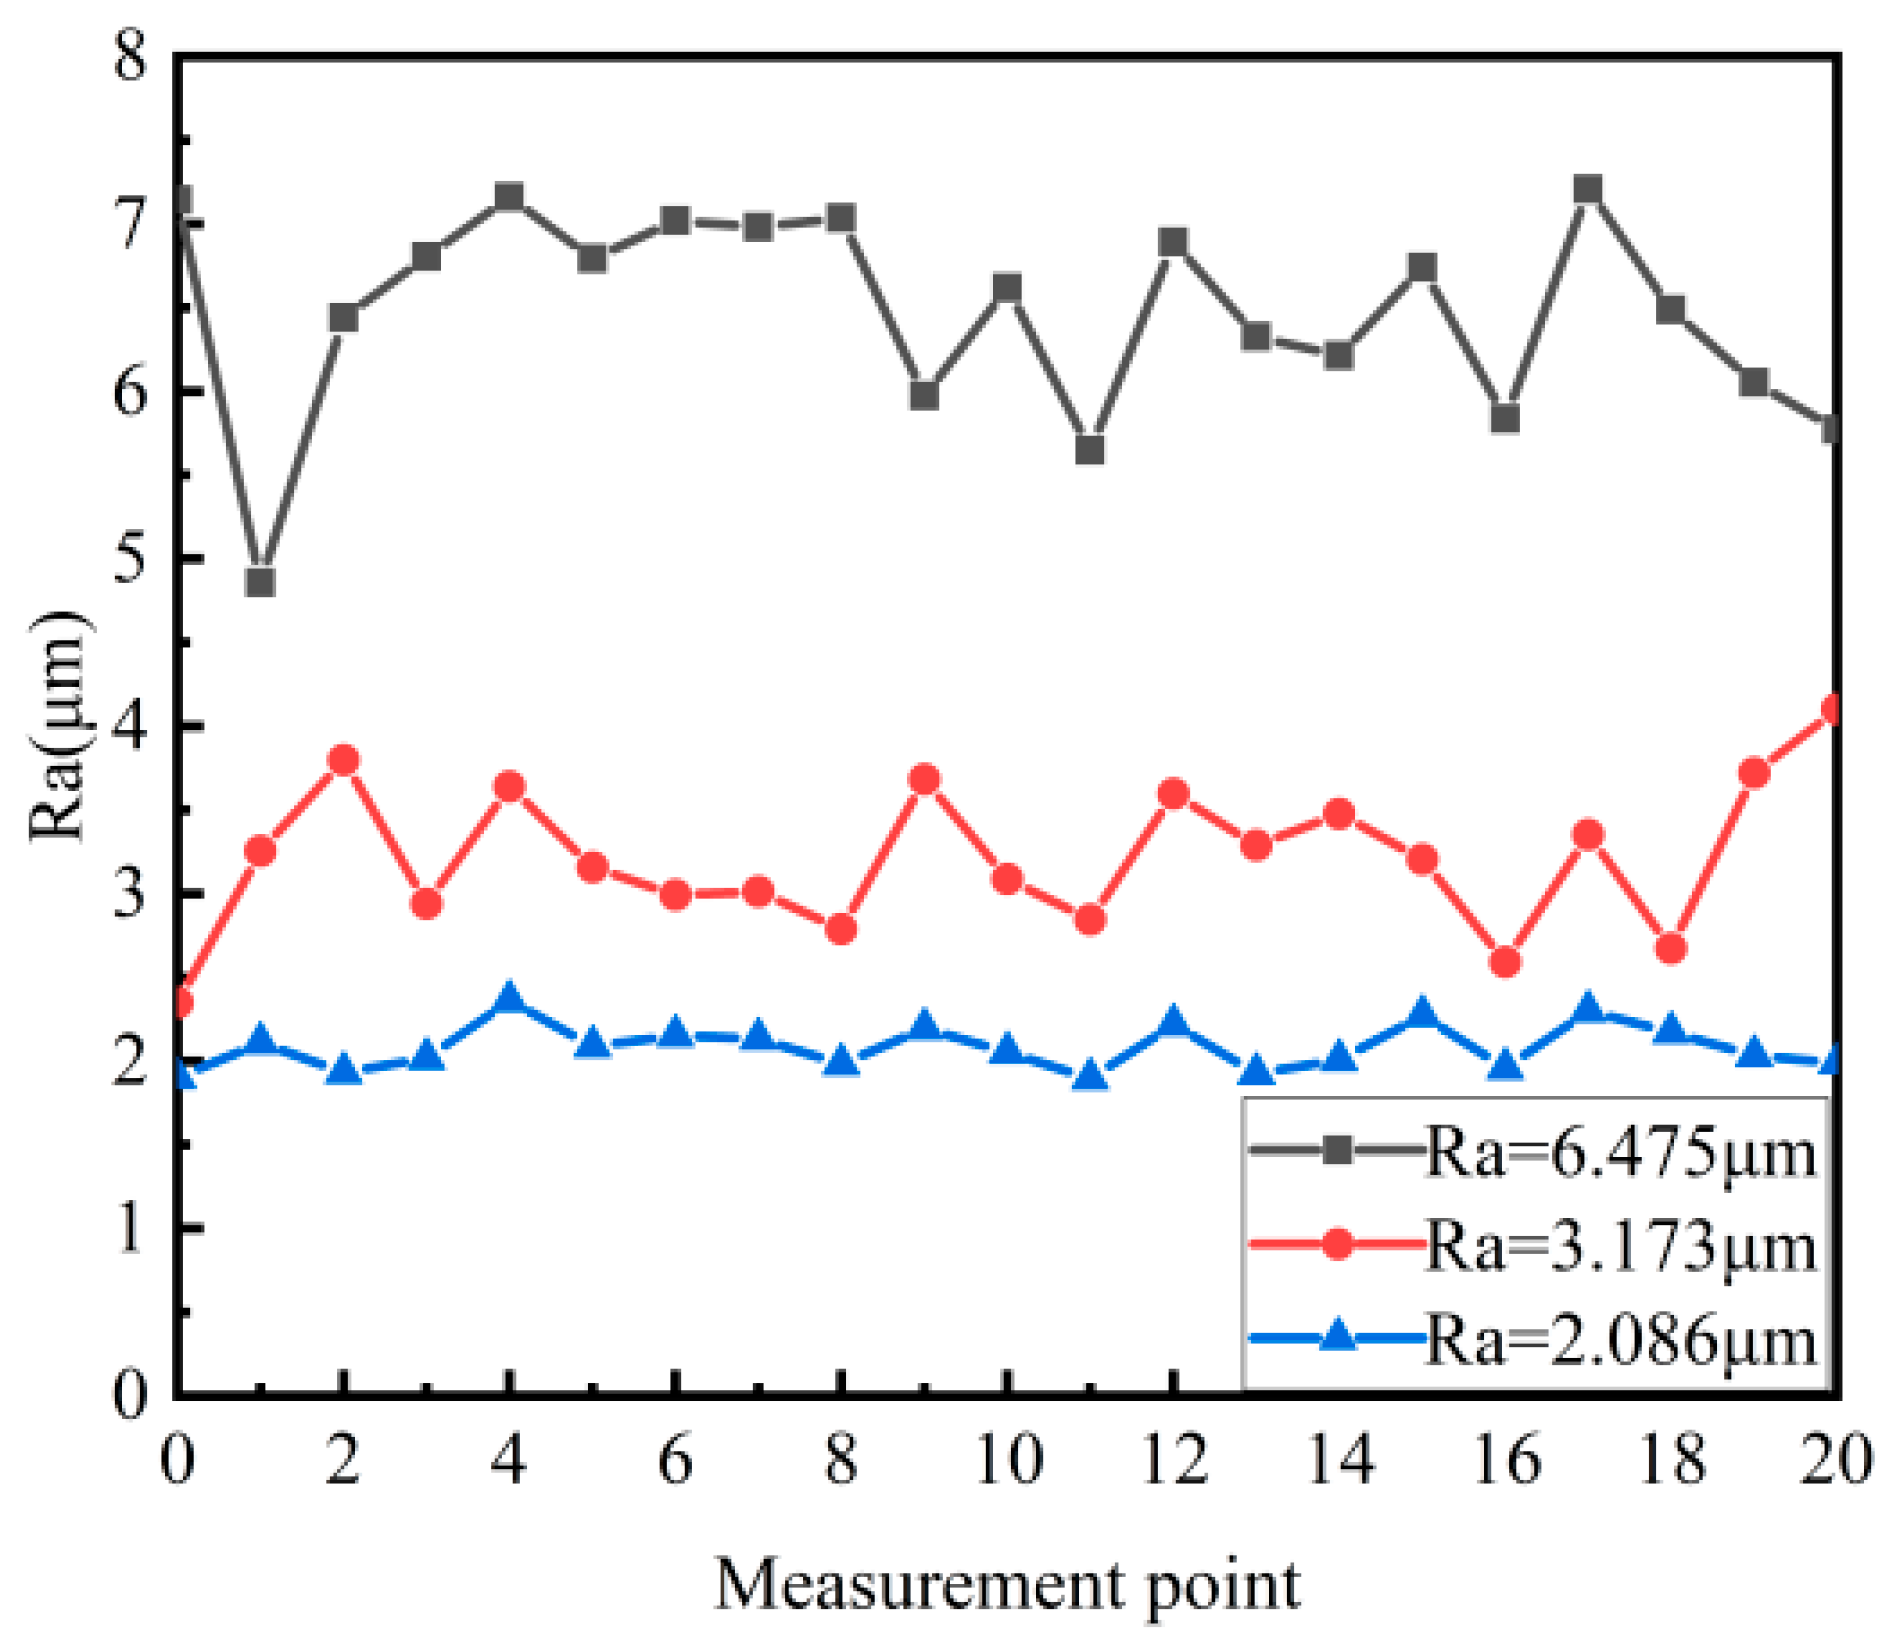
The experiment used three types of sandpaper (180 grit, 1000 grit, and 3000 grit) to polish the asphalt specimen surface for 100 cycles, creating three distinct levels of pavement surface roughness. A high-precision roughness tester was used to randomly measure 20 points on the polished asphalt surface, as shown in
Figure 4. After polishing, the measured average roughness values were Ra = 6.475 μm (180 grit), Ra = 3.173 μm (1000 grit), and Ra = 2.086 μm (3000 grit). These levels were selected to represent typical pavement surface conditions, ranging from polished/worn (Ra ≈ 2 μm) to relatively rough, newly compacted surfaces (Ra ≈ 6.5 μm). The rubber slider surface remained unchanged throughout these tests, ensuring that the observed friction variations were attributed solely to changes in pavement surface roughness, as all tests were conducted under full-immersion conditions where roughness was the only variable.
This study systematically investigated the evolution law of rubber–asphalt interface friction performance under different roughness conditions.
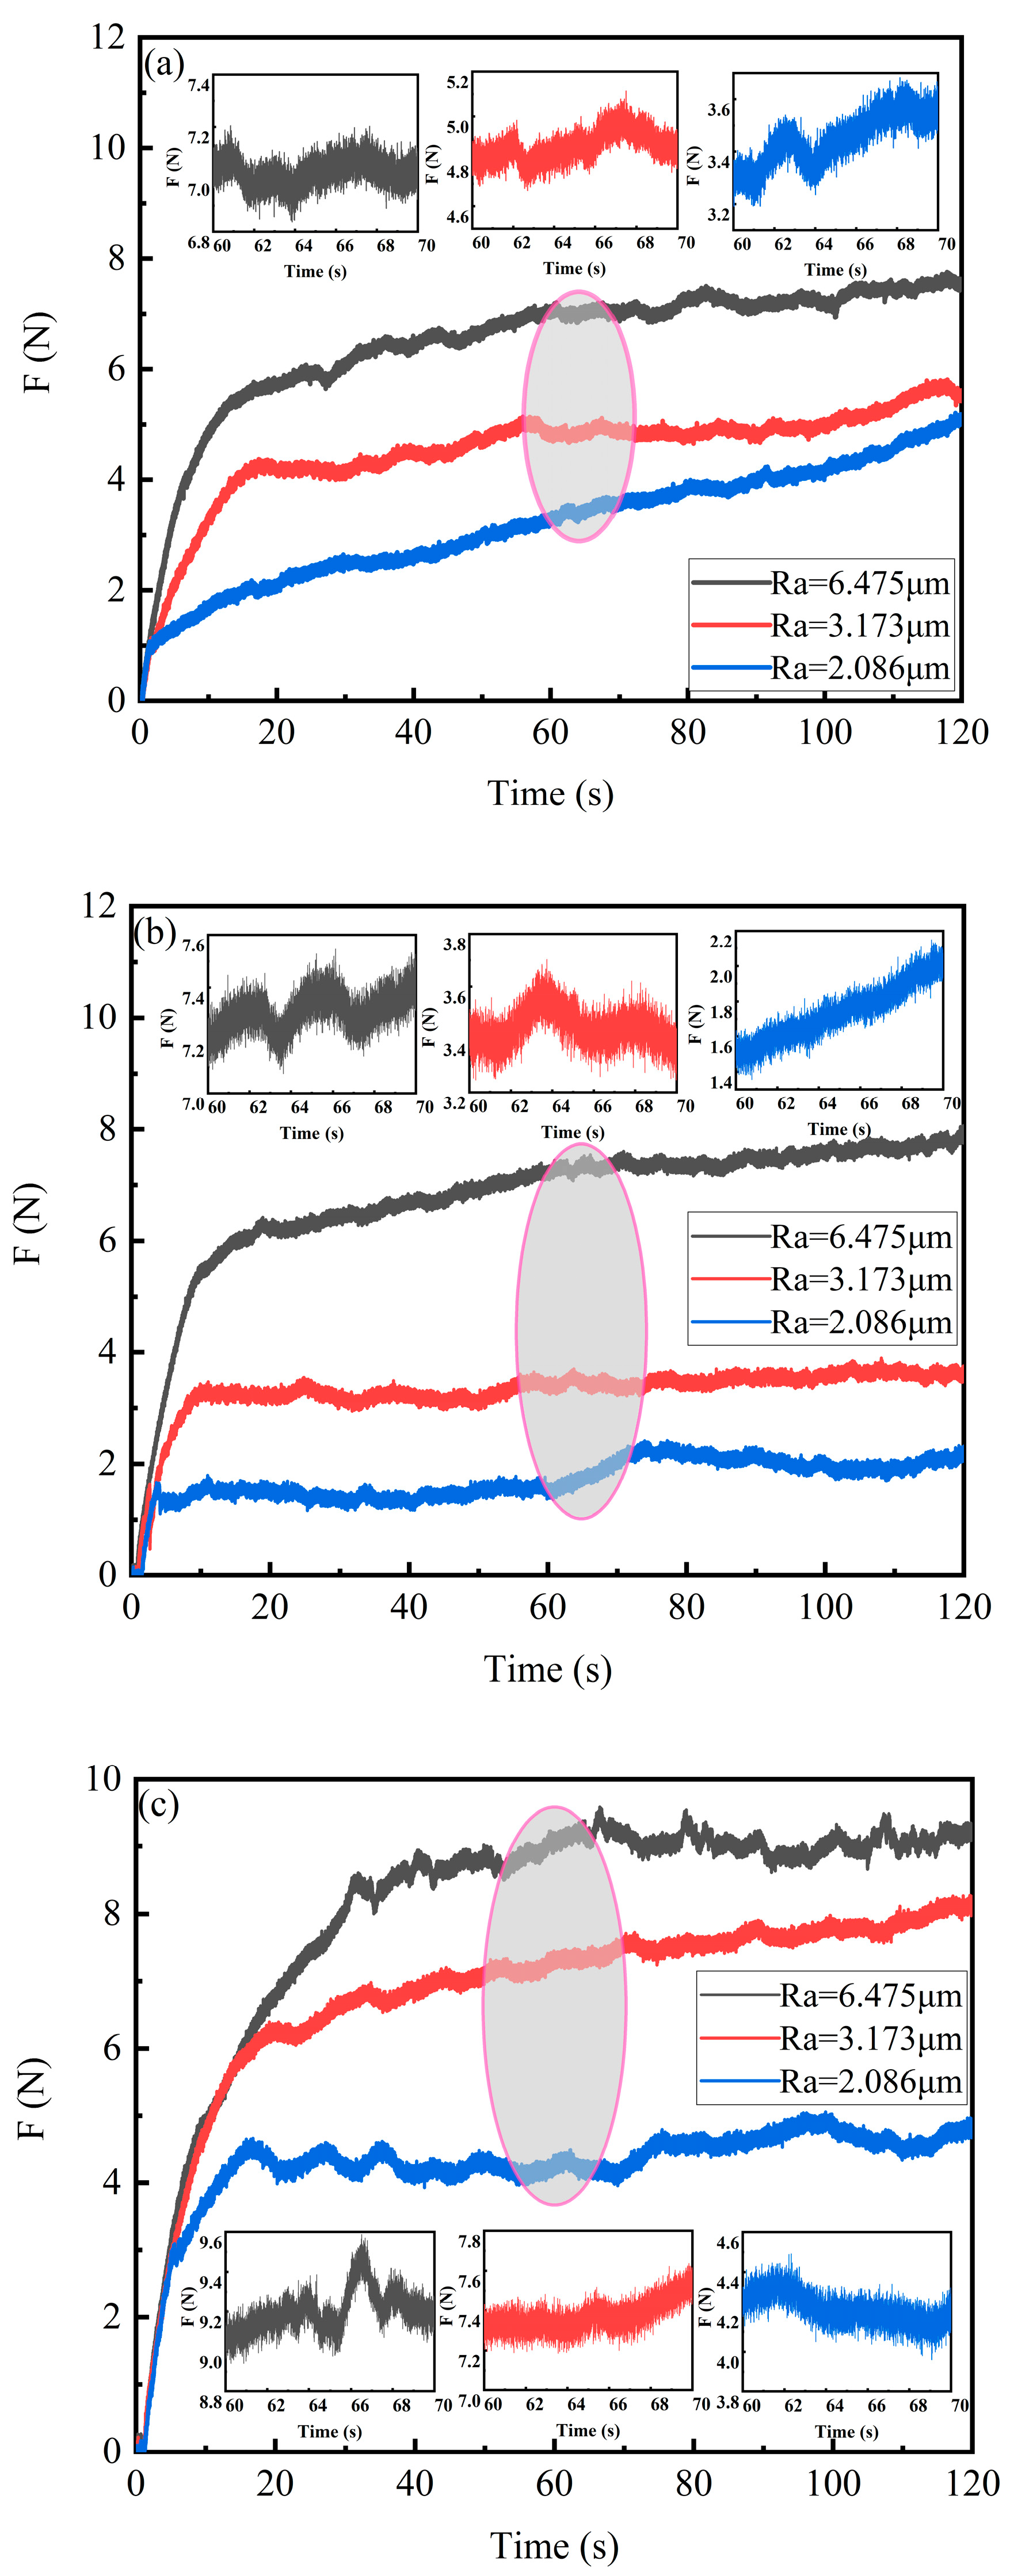
Figure 5a–c, respectively, show the evolution characteristics of friction force variation with respect to different roughness levels for the three types of distressed asphalt pavement under submerged conditions.
Figure 5 presents the evolution of friction force at a constant sliding speed of 2 mm/min and a stroke length of 5 mm.
The study found that pavement surface roughness under submerged conditions influences the friction performance measured at the rubber–asphalt interface. The percentage increases in average friction force under different roughness levels were calculated accordingly, and the results are presented below. After the maximum static friction is reached, the friction force tends to stabilize. Under the influence of the three roughness levels: for rectangular crack distress, the maximum friction forces are 3.99 N, 5.11 N, and 7.41 N; the average friction force increases from 3.60 N to 7.06 N as roughness increases, representing an increase of 49.2%; the friction force fluctuation amplitude is 0.45 ± 0.03 N. For rectangular pothole distress, the maximum friction forces are 2.31 N, 3.72 N, and 7.73 N; the average friction force increases from 1.89 N to 7.39 N as roughness increases, representing an increase of 291%; the friction force fluctuation amplitude is 0.45 ± 0.08 N. For surface void distress, the maximum friction forces are 5.06 N, 7.98 N, and 9.33 N; the average friction force increases from 4.70 N to 9.11 N as roughness increases, representing an increase of 93.8%; the friction force fluctuation amplitude is 0.45 ± 0.15 N. Overall, as roughness increases, the average friction force increases, with the largest increase observed for rectangular pothole distress, and the greatest fluctuation in friction force occurring for surface void distress. In the analysis of dynamic friction characteristics, all three types of distress exhibit a clear roughness–sliding time correlation.
The results indicate that the changes in friction performance mainly originate from the following: an enhanced micro-biting effect and the combined action of viscosity and friction as the water-saturated interface is disrupted. Under the same roughness level, the three types of distress also exhibit a clear correlation between distress type and sliding time, among which the average friction force of surface void distress is far superior to that of crack distress and pothole distress. These findings provide an important basis for understanding the micro-scale interaction mechanism at the rubber–asphalt interface under submerged conditions.
3.2. Effect of Different Loads on Friction Characteristics
This study systematically investigated the evolution law of rubber–asphalt interface friction performance under different load conditions.
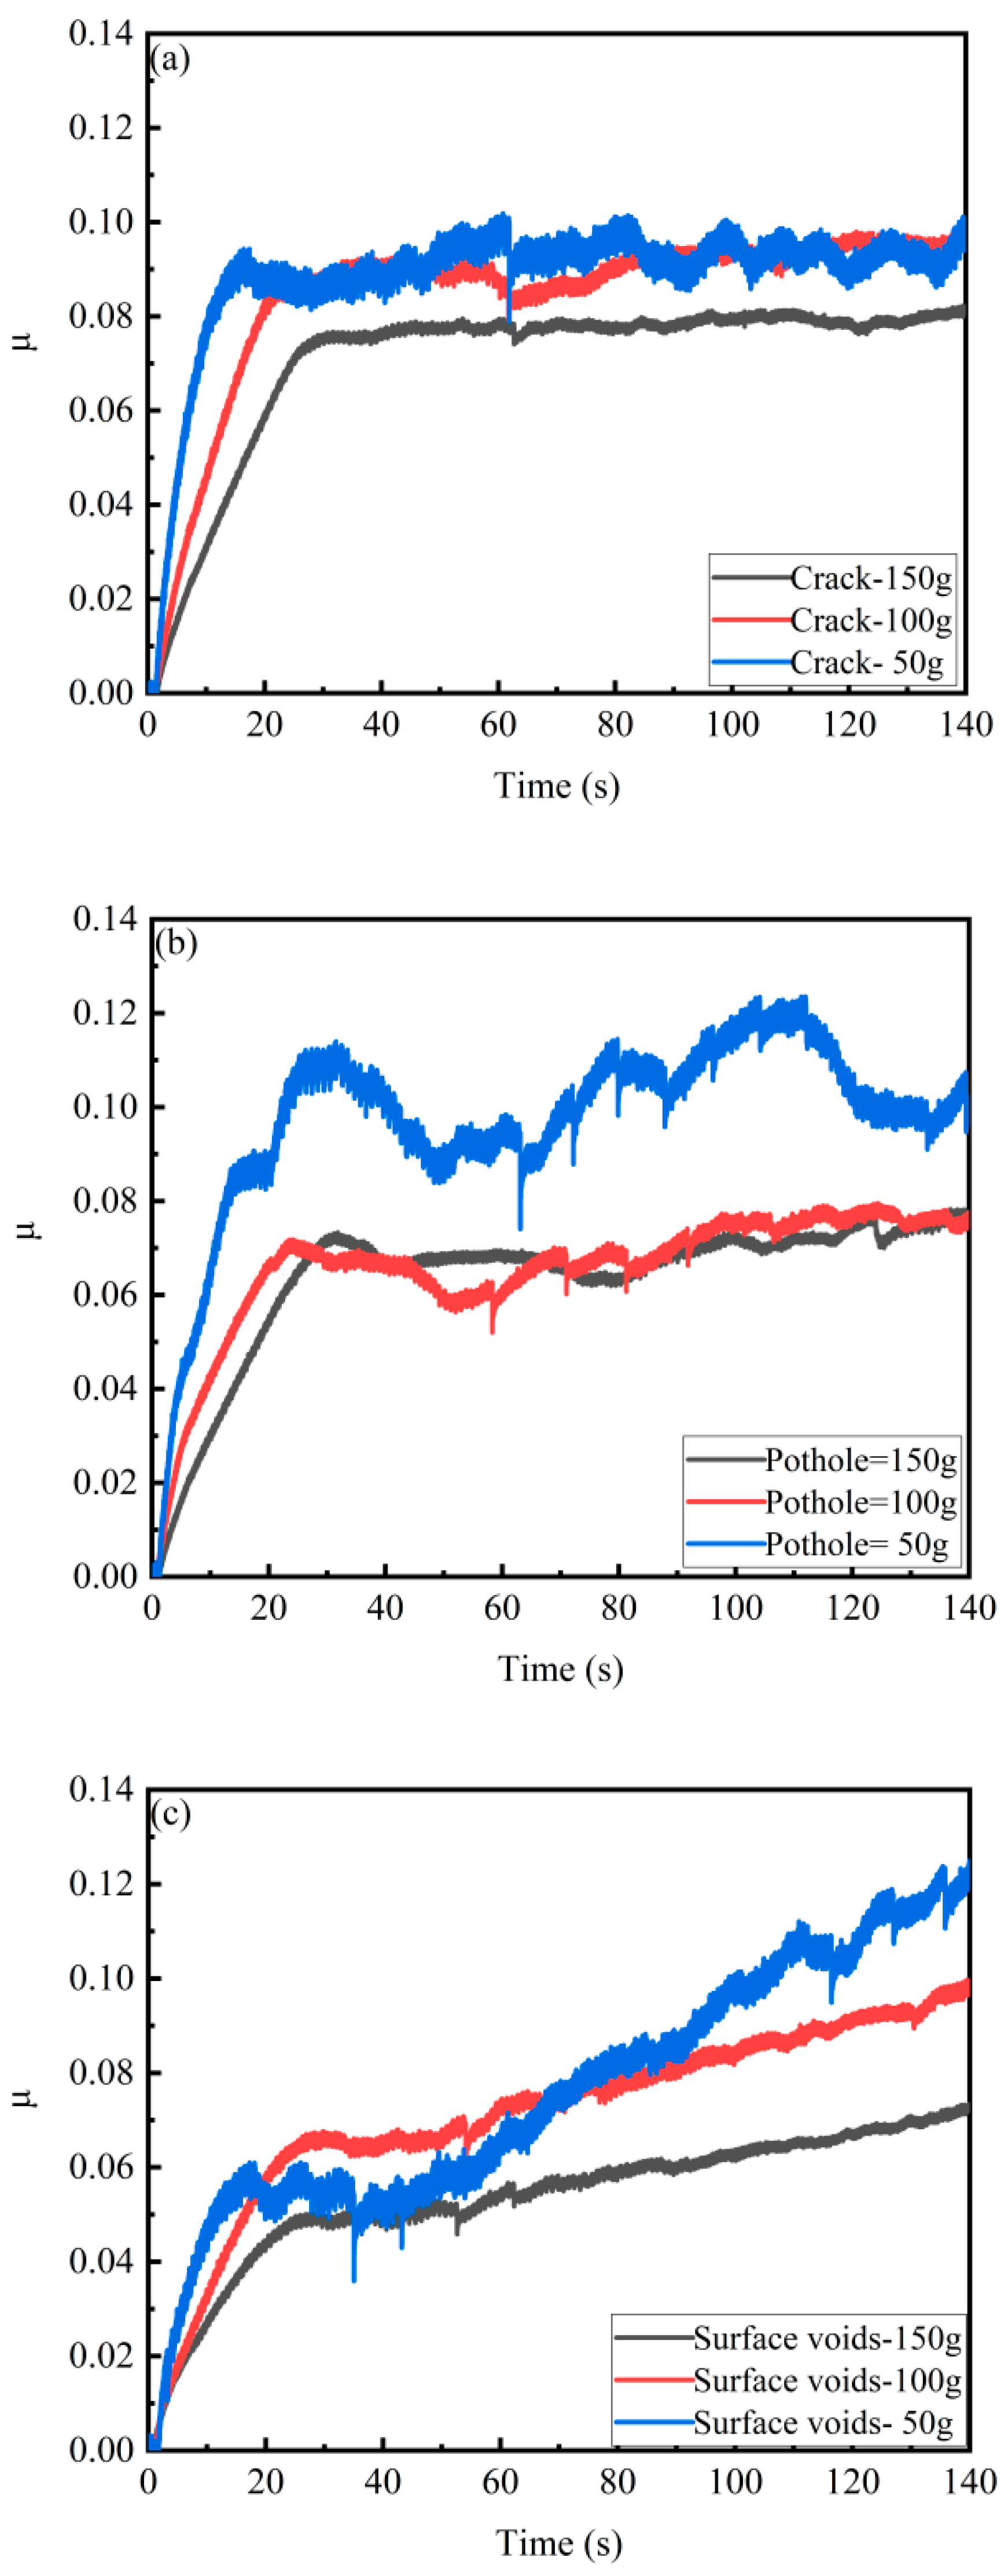
Figure 6a–c, respectively, show the evolution characteristics of friction force variation under different loads for the three types of distress asphalt pavement under submerged conditions. Using the control variable method, three levels of additional counterweight mass (50 g, 100 g, and 150 g) were applied to the sliding assembly to simulate different vertical loads on the pavement. As shown in
Figure 6, under a constant sliding speed of 2 mm/min and a stroke length of 5 mm, the specific friction force characteristics under different load conditions are presented for all three distress types.
The analysis results indicate that crack distress and pothole distress exhibit a similar friction–load relationship. Within the load range of 50–150 g, the average friction force of crack distress increased by 152.5%, and its vibration amplitude increased with increasing load; the average friction force of pothole distress increased by 102.3%, both showing a stable load–friction relationship. Meanwhile, both crack distress and pothole distress also exhibited an observable load sensitivity. As seen in the force–time curves, although surface void distress also demonstrated an observable load sensitivity with an increase of 101.3%, it showed an overall linear upward trend under all three load levels. Moreover, under the same conditions, the average friction force of the crack distress was far superior to that of the surface void distress and pothole distress. However, when expressed as friction coefficient μ = F/N, the values decreased with increasing load due to the sublinear nature of the friction–load relationship (see explanation below). A comparison of friction force values under different load conditions is detailed in
Table 4 below.
The results indicate that the load-dependent friction response is governed by the combined effect of increased real contact area and enhanced interfacial shear stress under higher vertical loads. While the absolute friction force increases with load, the friction coefficient μ decreases because the friction force increases at a slower rate than the applied load—a typical sublinear friction–load relationship. This does not contradict the finding that friction force increases with load; rather, it reflects that the incremental gain in friction diminishes as the load increases. While all three distress types exhibited a stable friction–load relationship, pothole distress showed relatively larger fluctuations under submerged conditions. These findings provide an important basis for understanding the micro-scale interaction mechanism at the rubber–asphalt interface under varying load and submerged conditions.
The friction coefficient
shown in
Figure 6 is defined as
, where
is the measured friction force and
is the vertical force applied by the additional counterweight mass (0.49 N, 0.98 N, and 1.47 N for 50 g, 100 g, and 150 g, respectively). It should be emphasized that
accounts only for the added load and excludes both the self-weight of the sliding assembly and the buoyancy effects. Since these exclusions remain constant across all test conditions, the relative variation of
with increasing load is accurately captured in
Figure 6.
3.3. Effect of Different Water Temperatures on Friction Characteristics
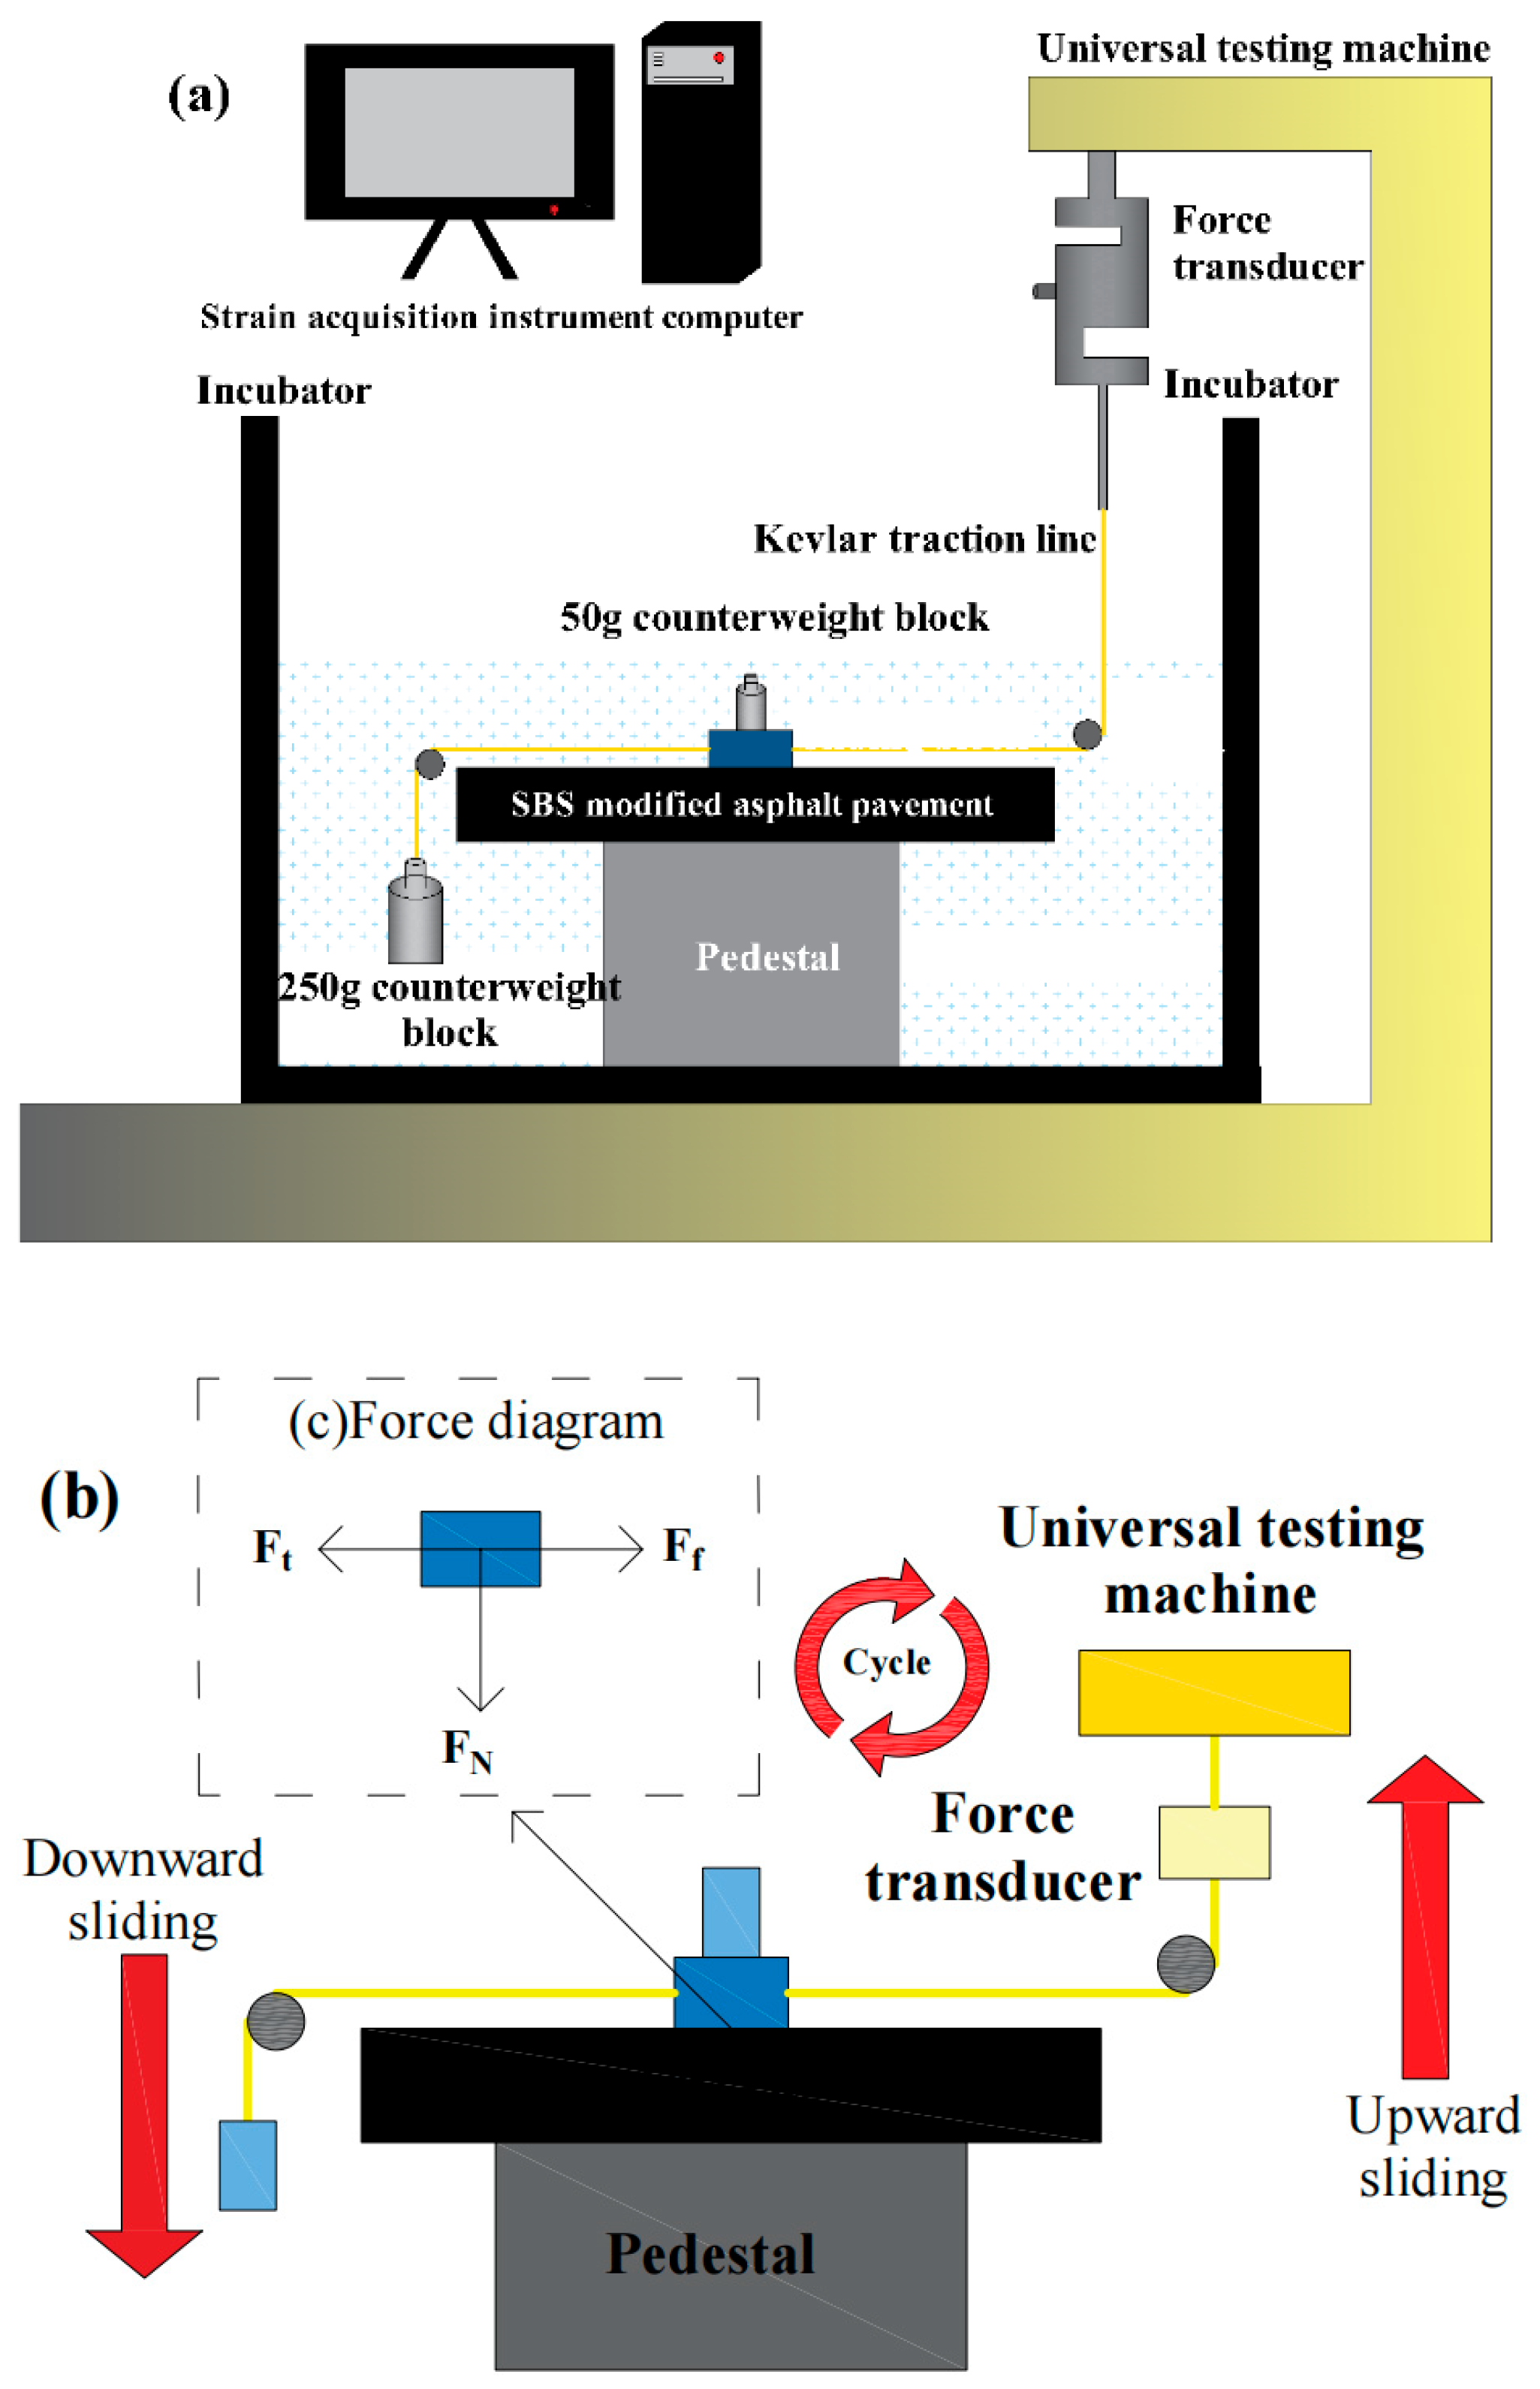
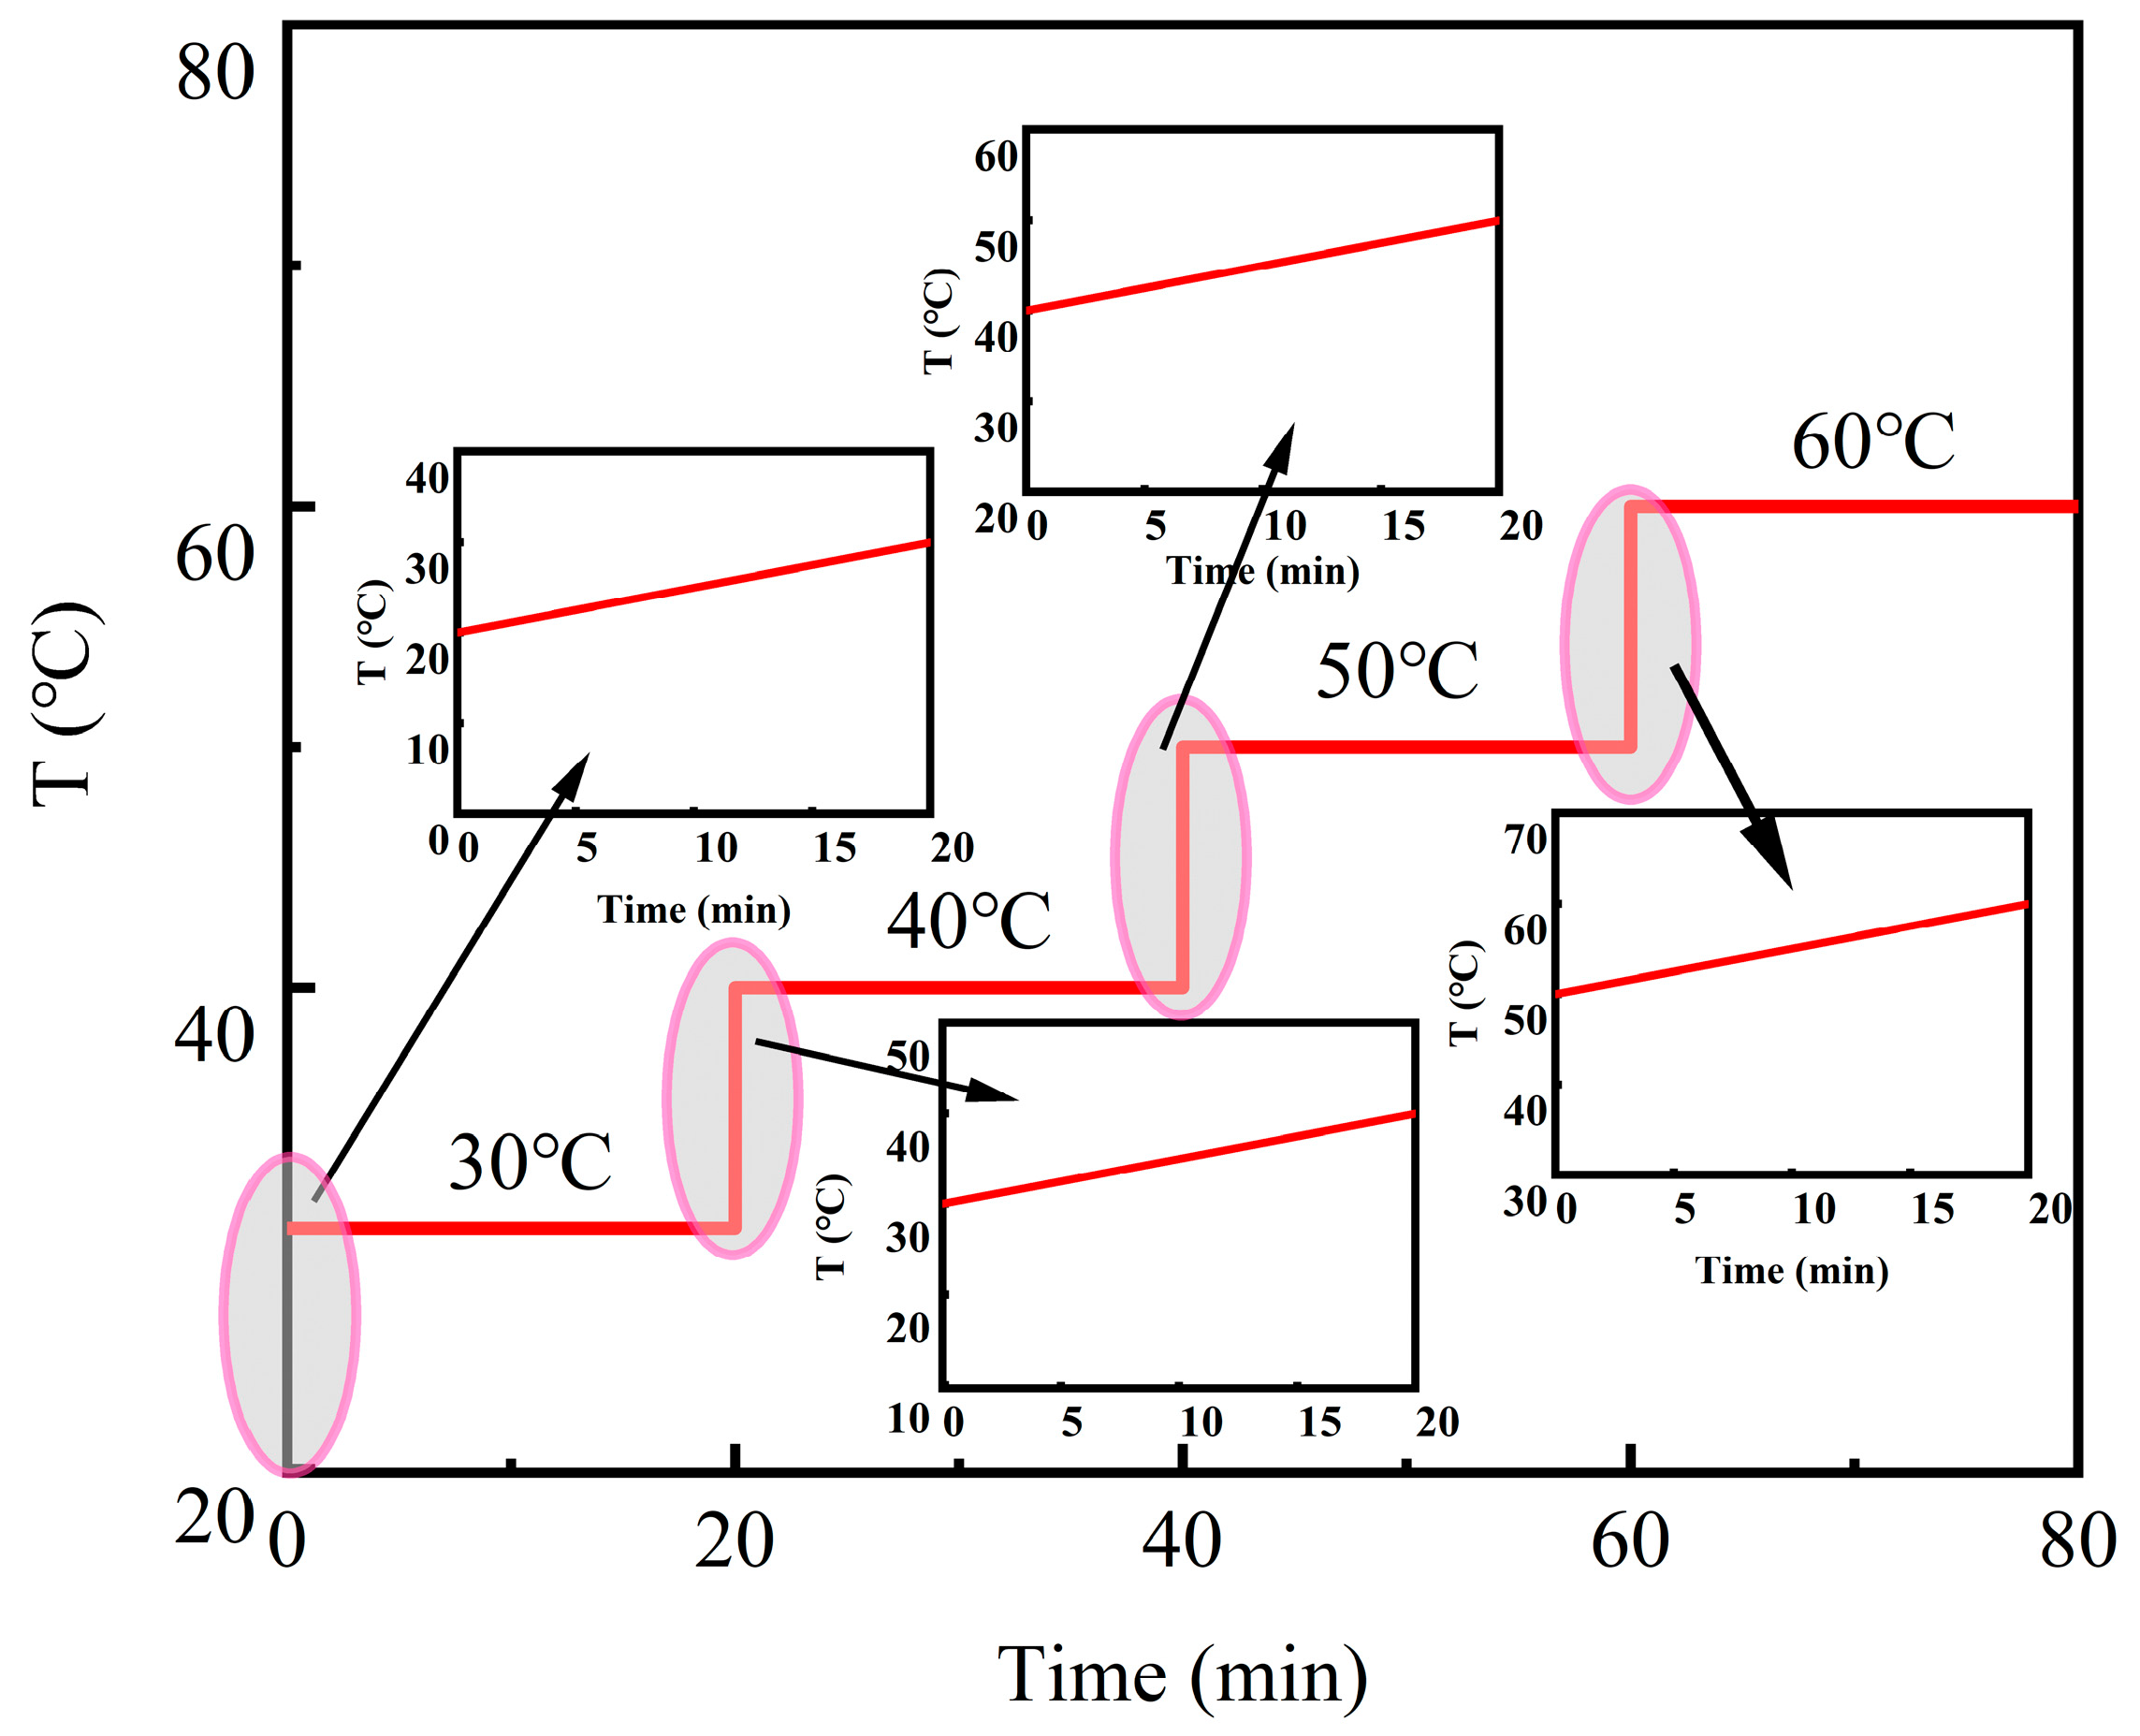
In this study, different water temperatures were analyzed. The aqueous solution was heated by a heating rod and placed in an incubator filled with aqueous solution. The temperature of the aqueous solution was increased by the heat conduction of the heating rod, and the temperature was detected in real time by a thermocouple. The heating table has a power of 50 W, and pre-test calibration was performed to ensure accuracy. The heating rod was heated for about 20 min to increase the temperature of the aqueous solution by 10 °C compared with the original temperature, and when the temperature reached the predetermined temperature, the heating rod was set to standby. The temperature can be kept stable for about 10 min, so that the test is not affected. The water temperature calibration is shown in
Figure 7.
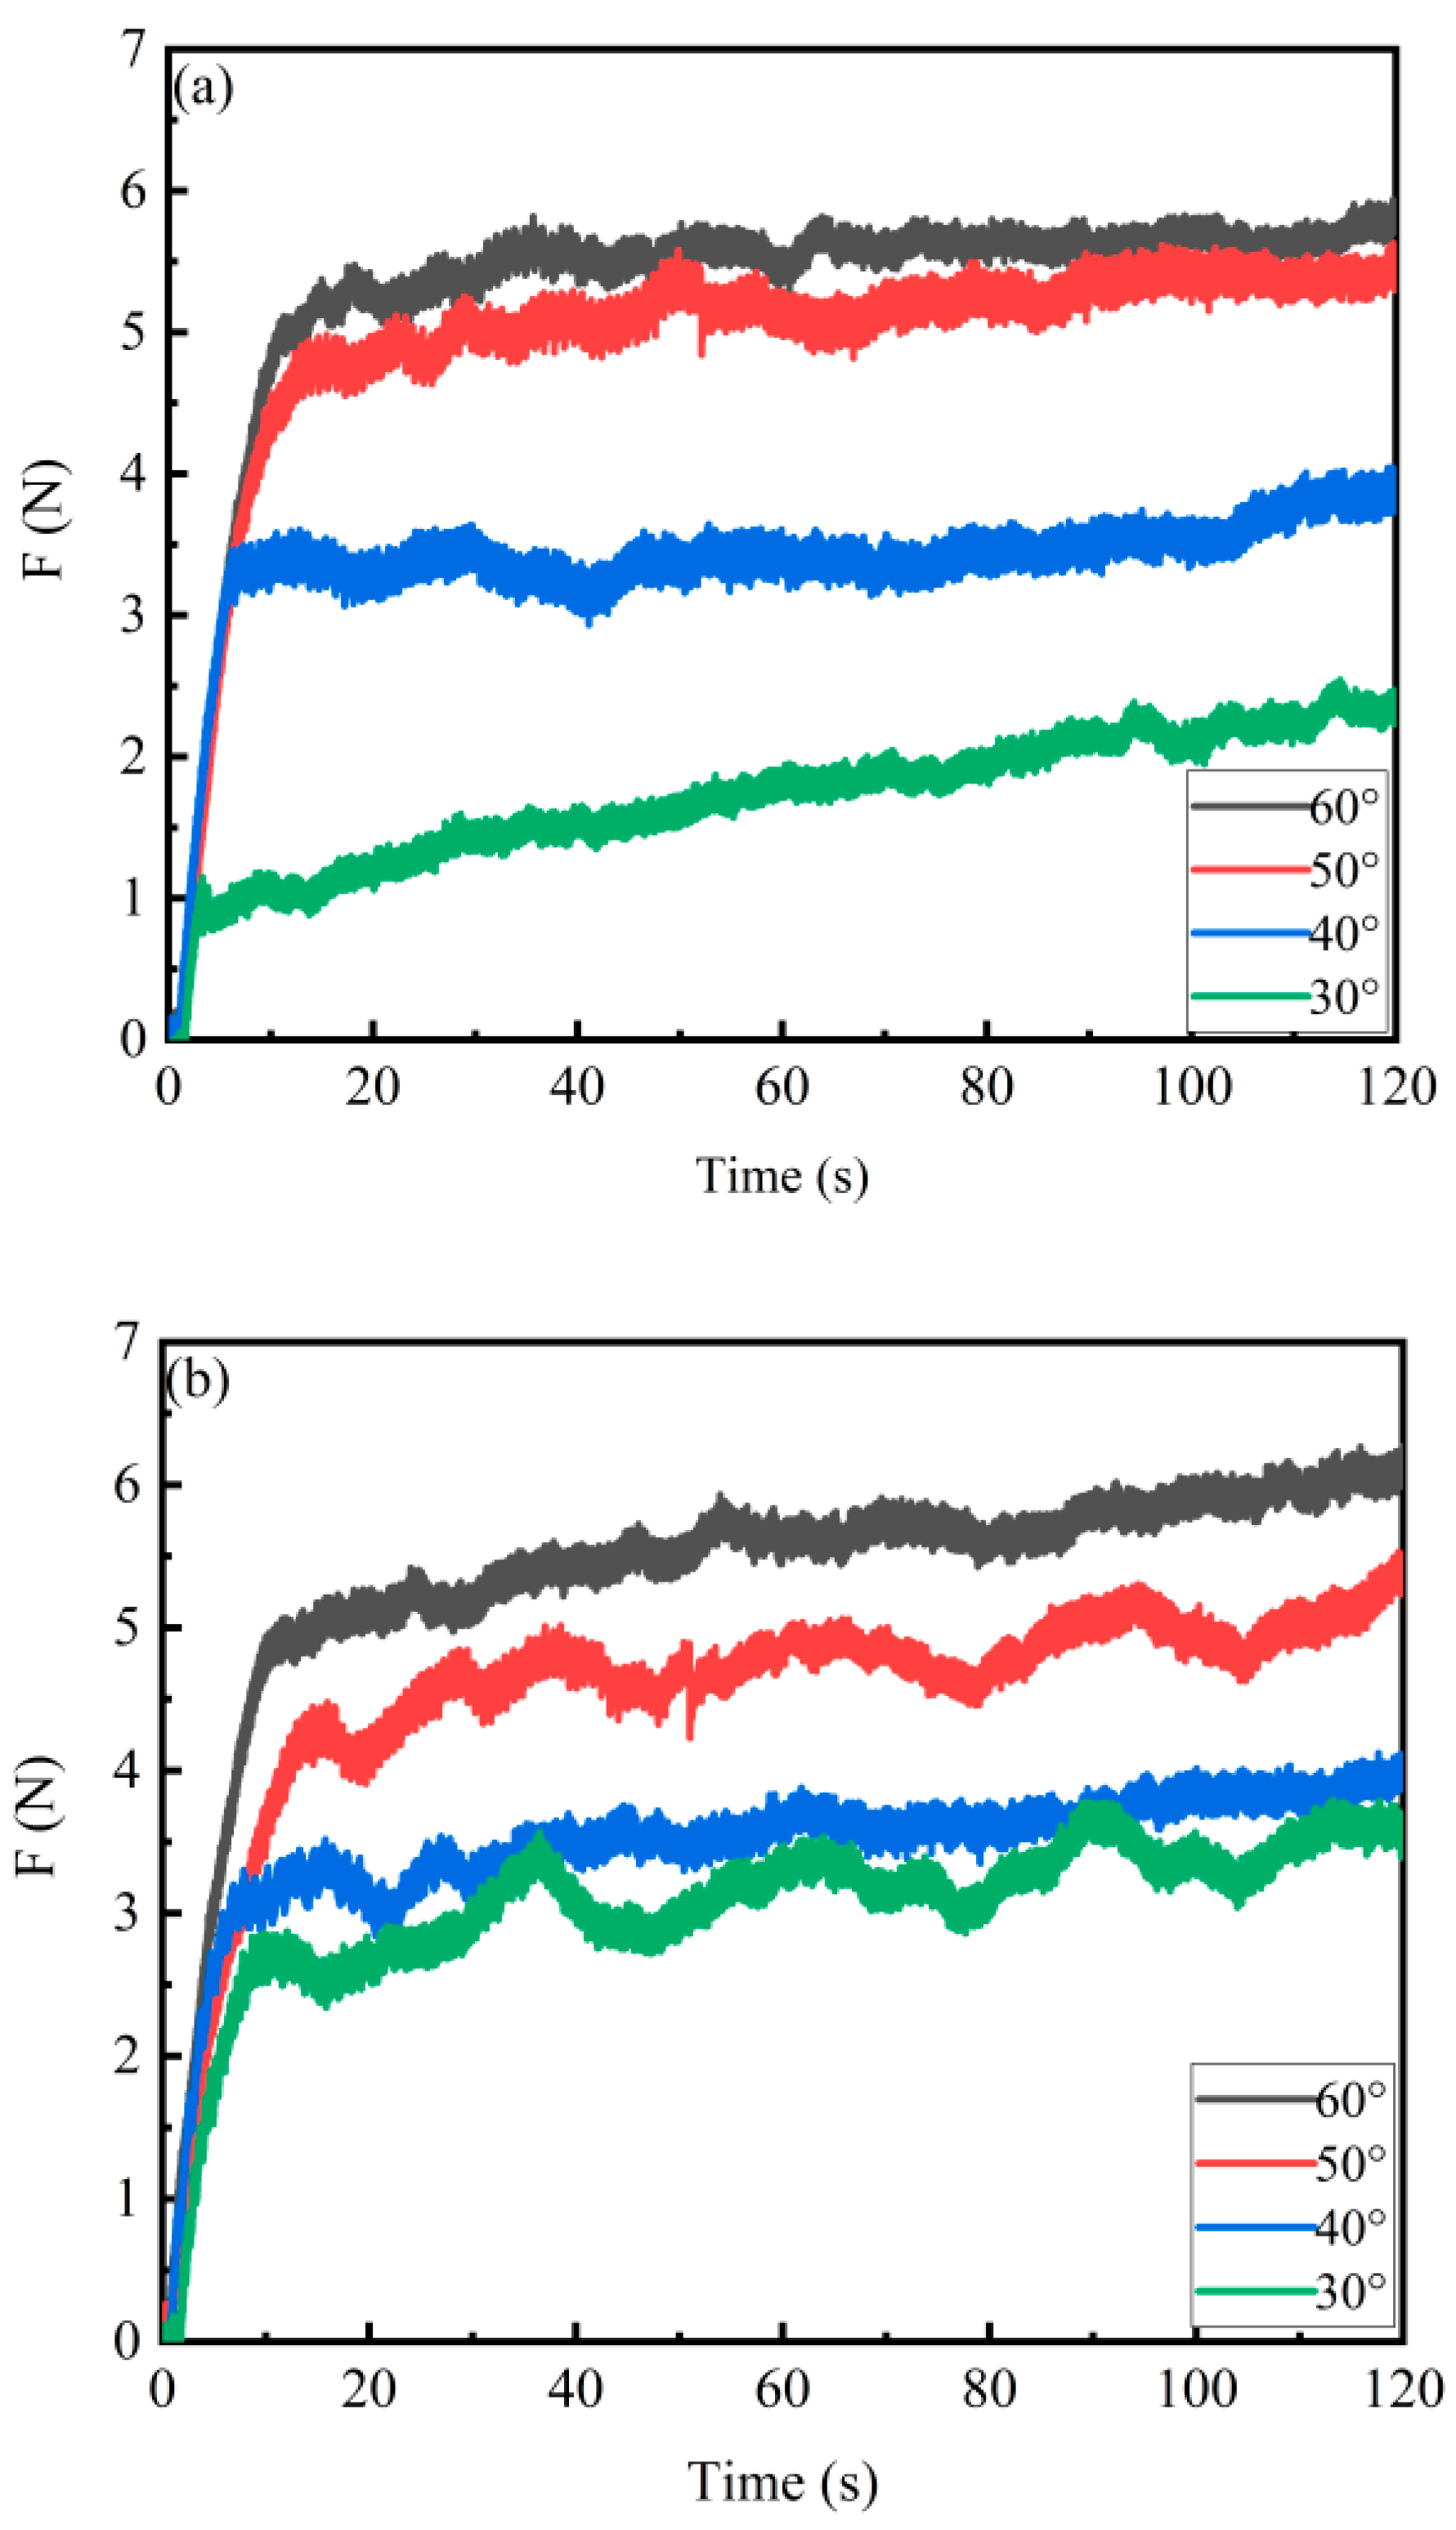
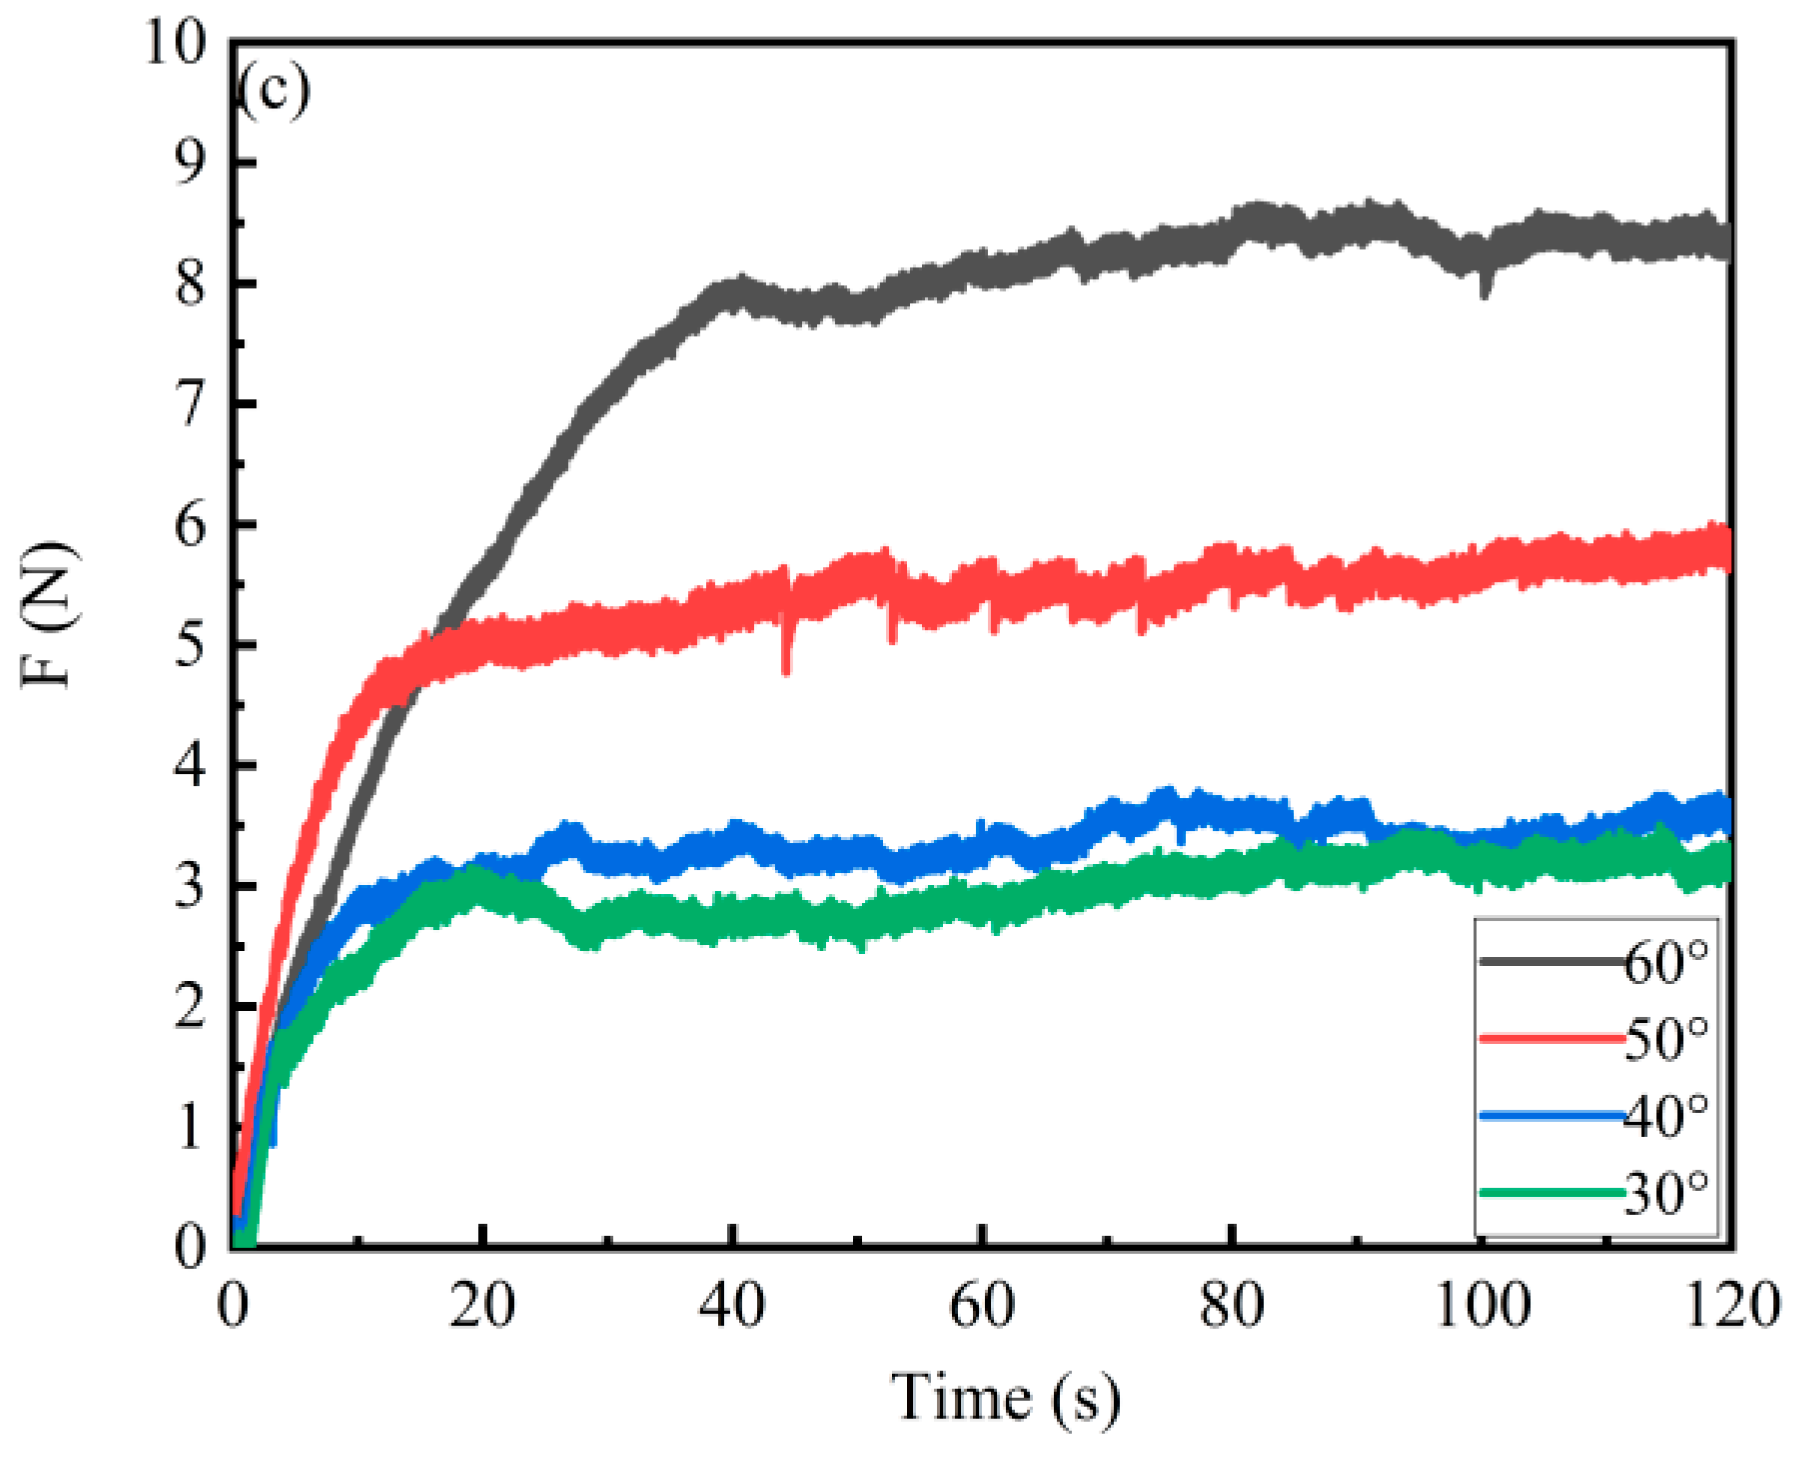
As a key environmental parameter affecting the rubber–pavement friction interface, the influence mechanism of temperature was systematically investigated through experiments. Under a constant sliding speed (2 mm/min) and displacement (4 mm), the friction characteristics were measured at different water temperatures (from 30 °C to 60 °C at 10 °C intervals), and the results are shown in
Figure 8. The experimental results indicate that the friction process exhibits typical stick–slip characteristics: after an initial adhesion phase, the friction force rapidly transitions to a stable friction state. All three types of distress showed consistent increasing trends: In the temperature range of 30–60 °C, the average friction force of crack distress increased by 200%. The crack distress vibration amplitude increased with rising water temperature in the range of 30–50 °C but decreased at 60 °C. The average friction force of pothole distress increased by 75.2%, and that of surface void distress increased by 169.8%. The pothole formation mechanism in SBS-modified asphalt pavements under submerged conditions involves a progressive degradation process. Initially, repeated tire loading generates micro-cracks at the asphalt–aggregate interface, particularly in areas where water infiltration weakens the adhesive bond. Due to the viscoelastic nature of SBS-modified asphalt, the polymer network provides enhanced resistance to crack initiation compared with unmodified asphalt; however, once micro-cracks form, water penetrates the interface and generates dynamic pore pressure under cyclic loading. This pressure accelerates the separation of asphalt film from aggregate surfaces—a process known as stripping. As stripping propagates, loose aggregate particles are dislodged by tire traction forces, leaving surface depressions that gradually expand and coalesce into macroscopic potholes. For SBS-modified mixtures, the higher elasticity and cohesive strength delay the onset of this process, but once the polymer network is compromised by mechanical fatigue or thermal aging, the degradation rate accelerates due to the increased brittleness of the aged binder. The vibration amplitudes of both surface void distress and pothole distress increase with rising water temperature. All three distress types exhibit a stable water temperature–friction relationship. Moreover, crack distress and surface void distress show clear temperature-dependent behavior, with a notable increase in the 30–60 °C range, which is more pronounced than under other complex operating conditions. A comparison of friction force values under different water temperature conditions is detailed in
Table 5 below.
The observed temperature dependence is likely associated with the quasi-static test conditions. At the extremely low sliding speed (2 mm/min), the interface operates in the boundary lubrication regime, where friction is governed primarily by interfacial adhesion rather than fluid viscosity. A plausible explanation is that as the water temperature rises, the SBS-modified asphalt surface softens, and the increased molecular mobility may enhance adhesion, which could dominate over the reduction in bulk shear modulus. This suggests that the increase in friction with temperature under these quasi-static submerged conditions is primarily adhesion-driven. This finding appears to differ from field observations, where high temperatures reduce viscosity and promote flushing, smoothing the texture and reducing mechanical interlock at high speeds. This apparent discrepancy likely arises from fundamentally different regimes, and our finding should be interpreted as adhesion-dominated friction specific to low-speed water-saturated interfaces rather than being extrapolated directly to high-speed field conditions.
3.4. Effect of Different Cycle Numbers on Friction Characteristics
This study systematically investigated the evolution law of rubber–asphalt interface friction performance under different numbers of cycles in aqueous solution.
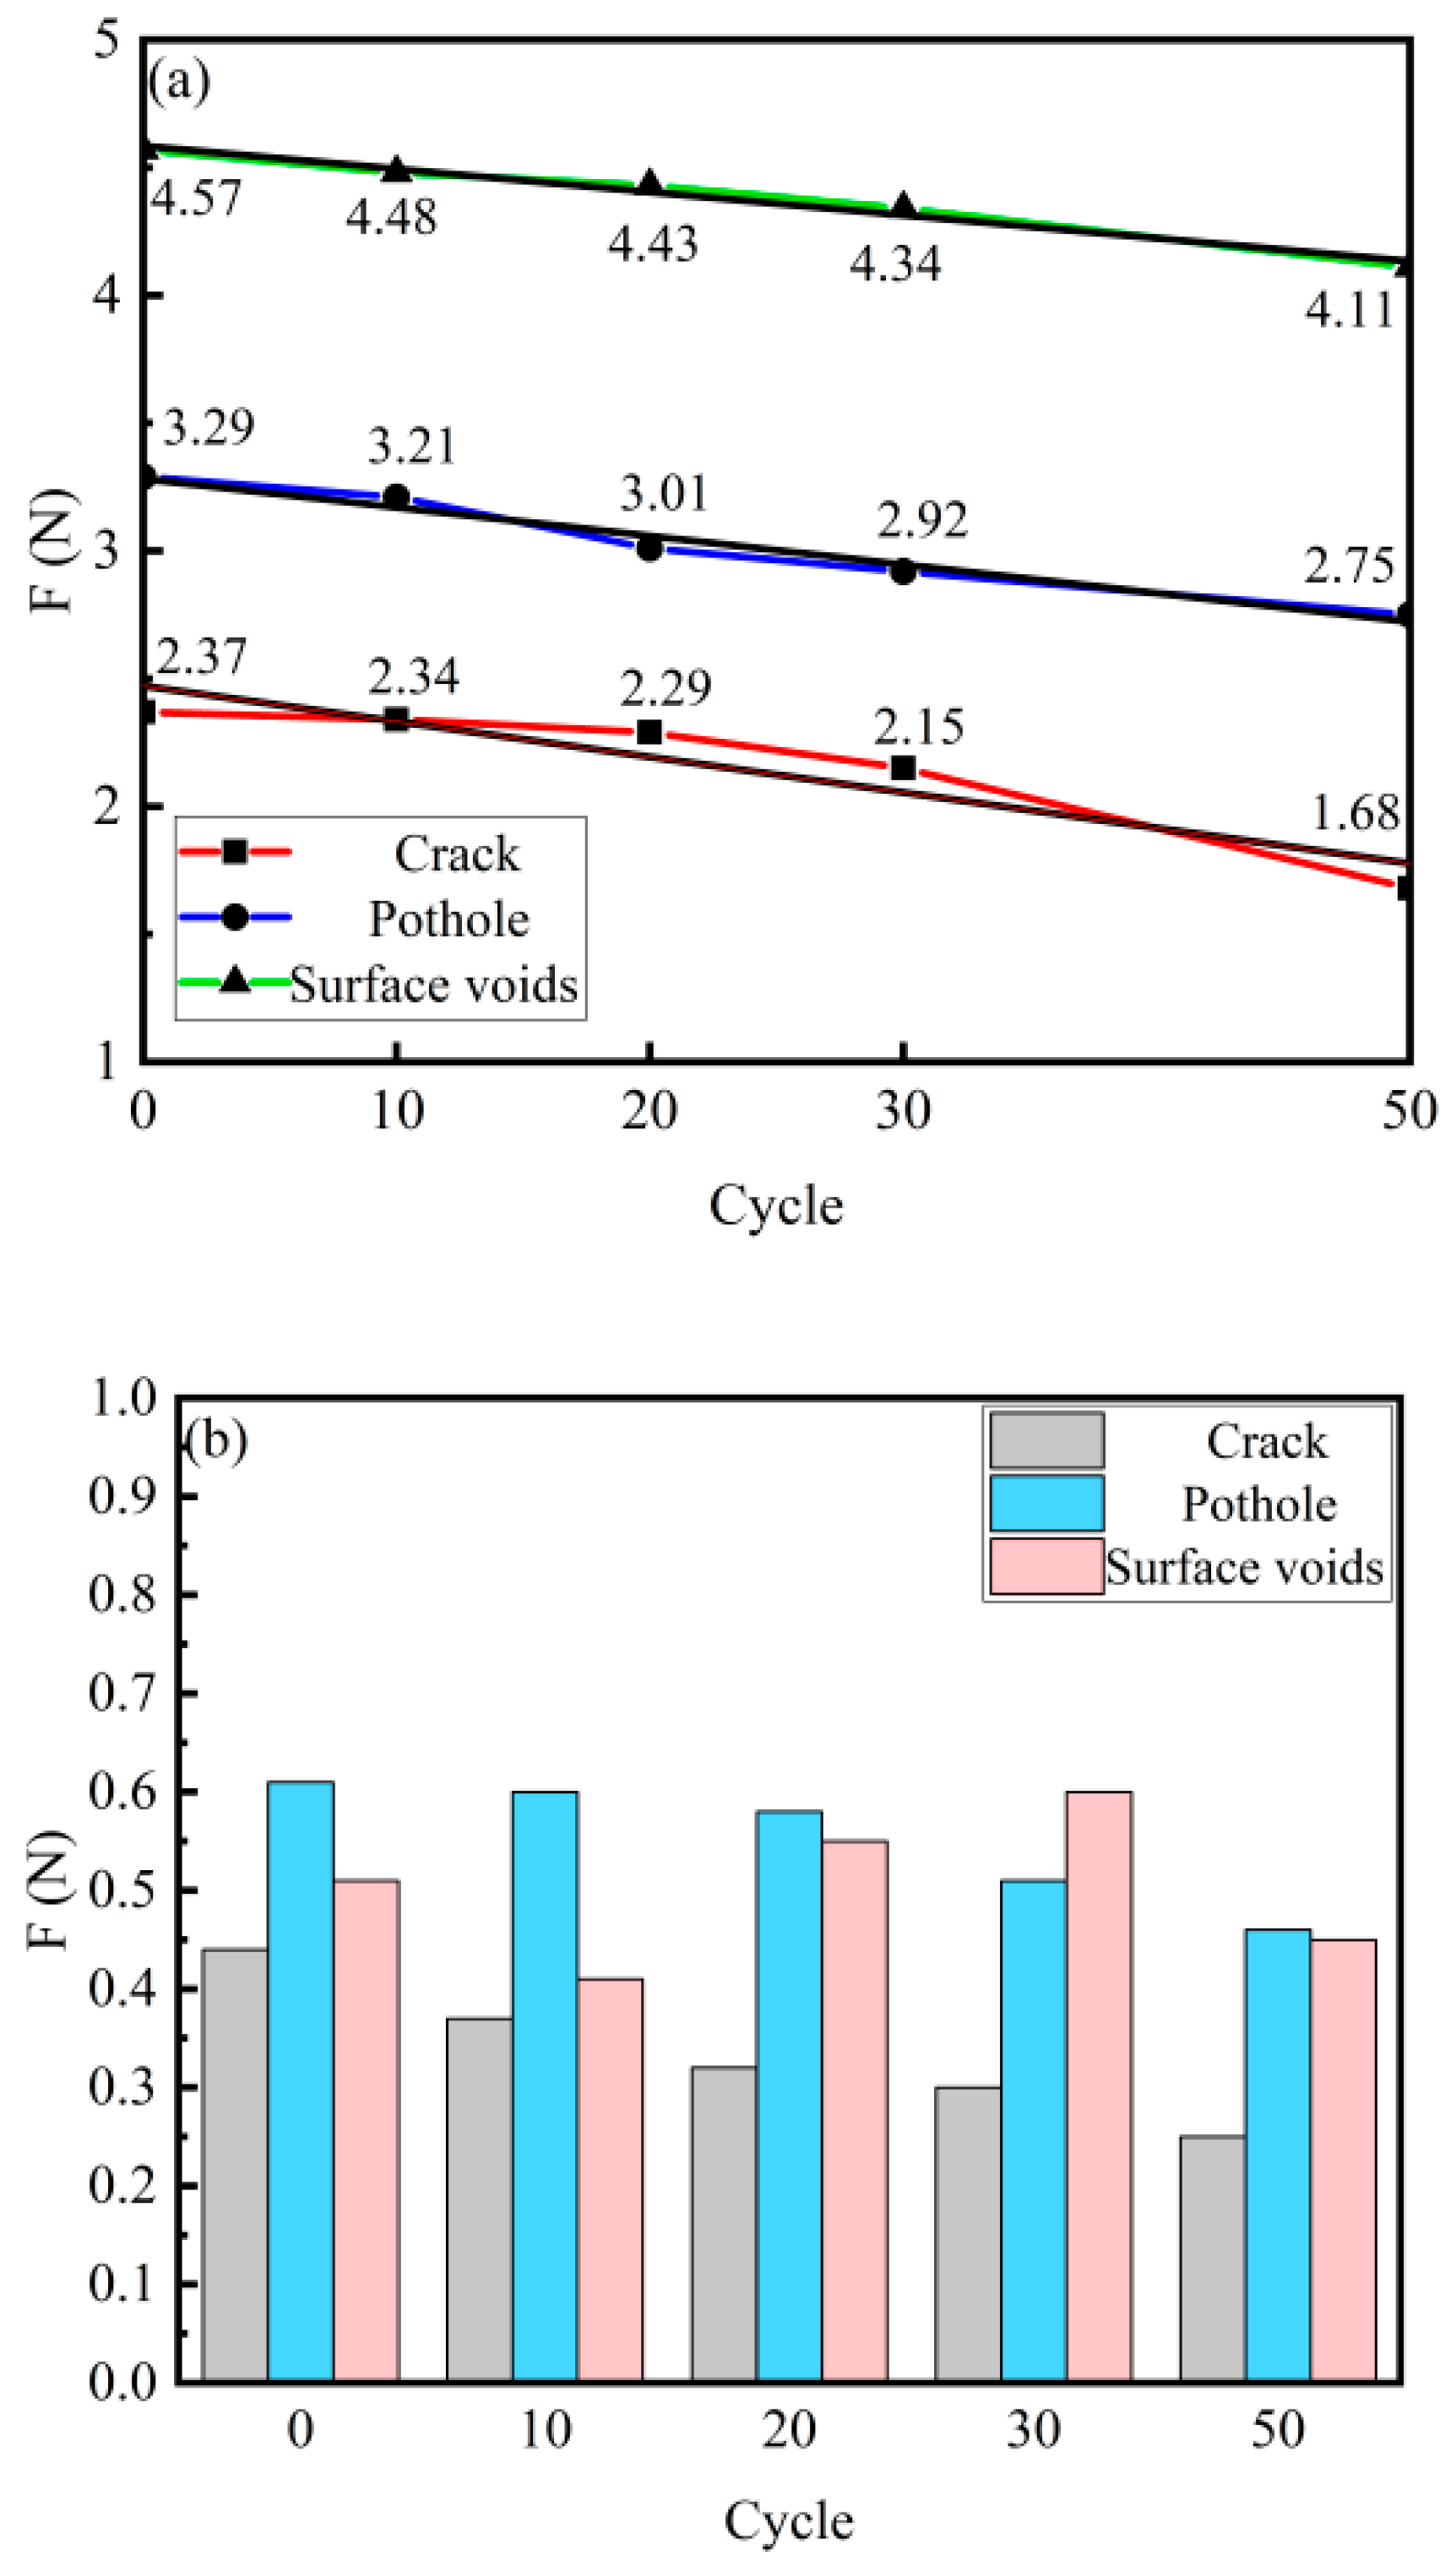
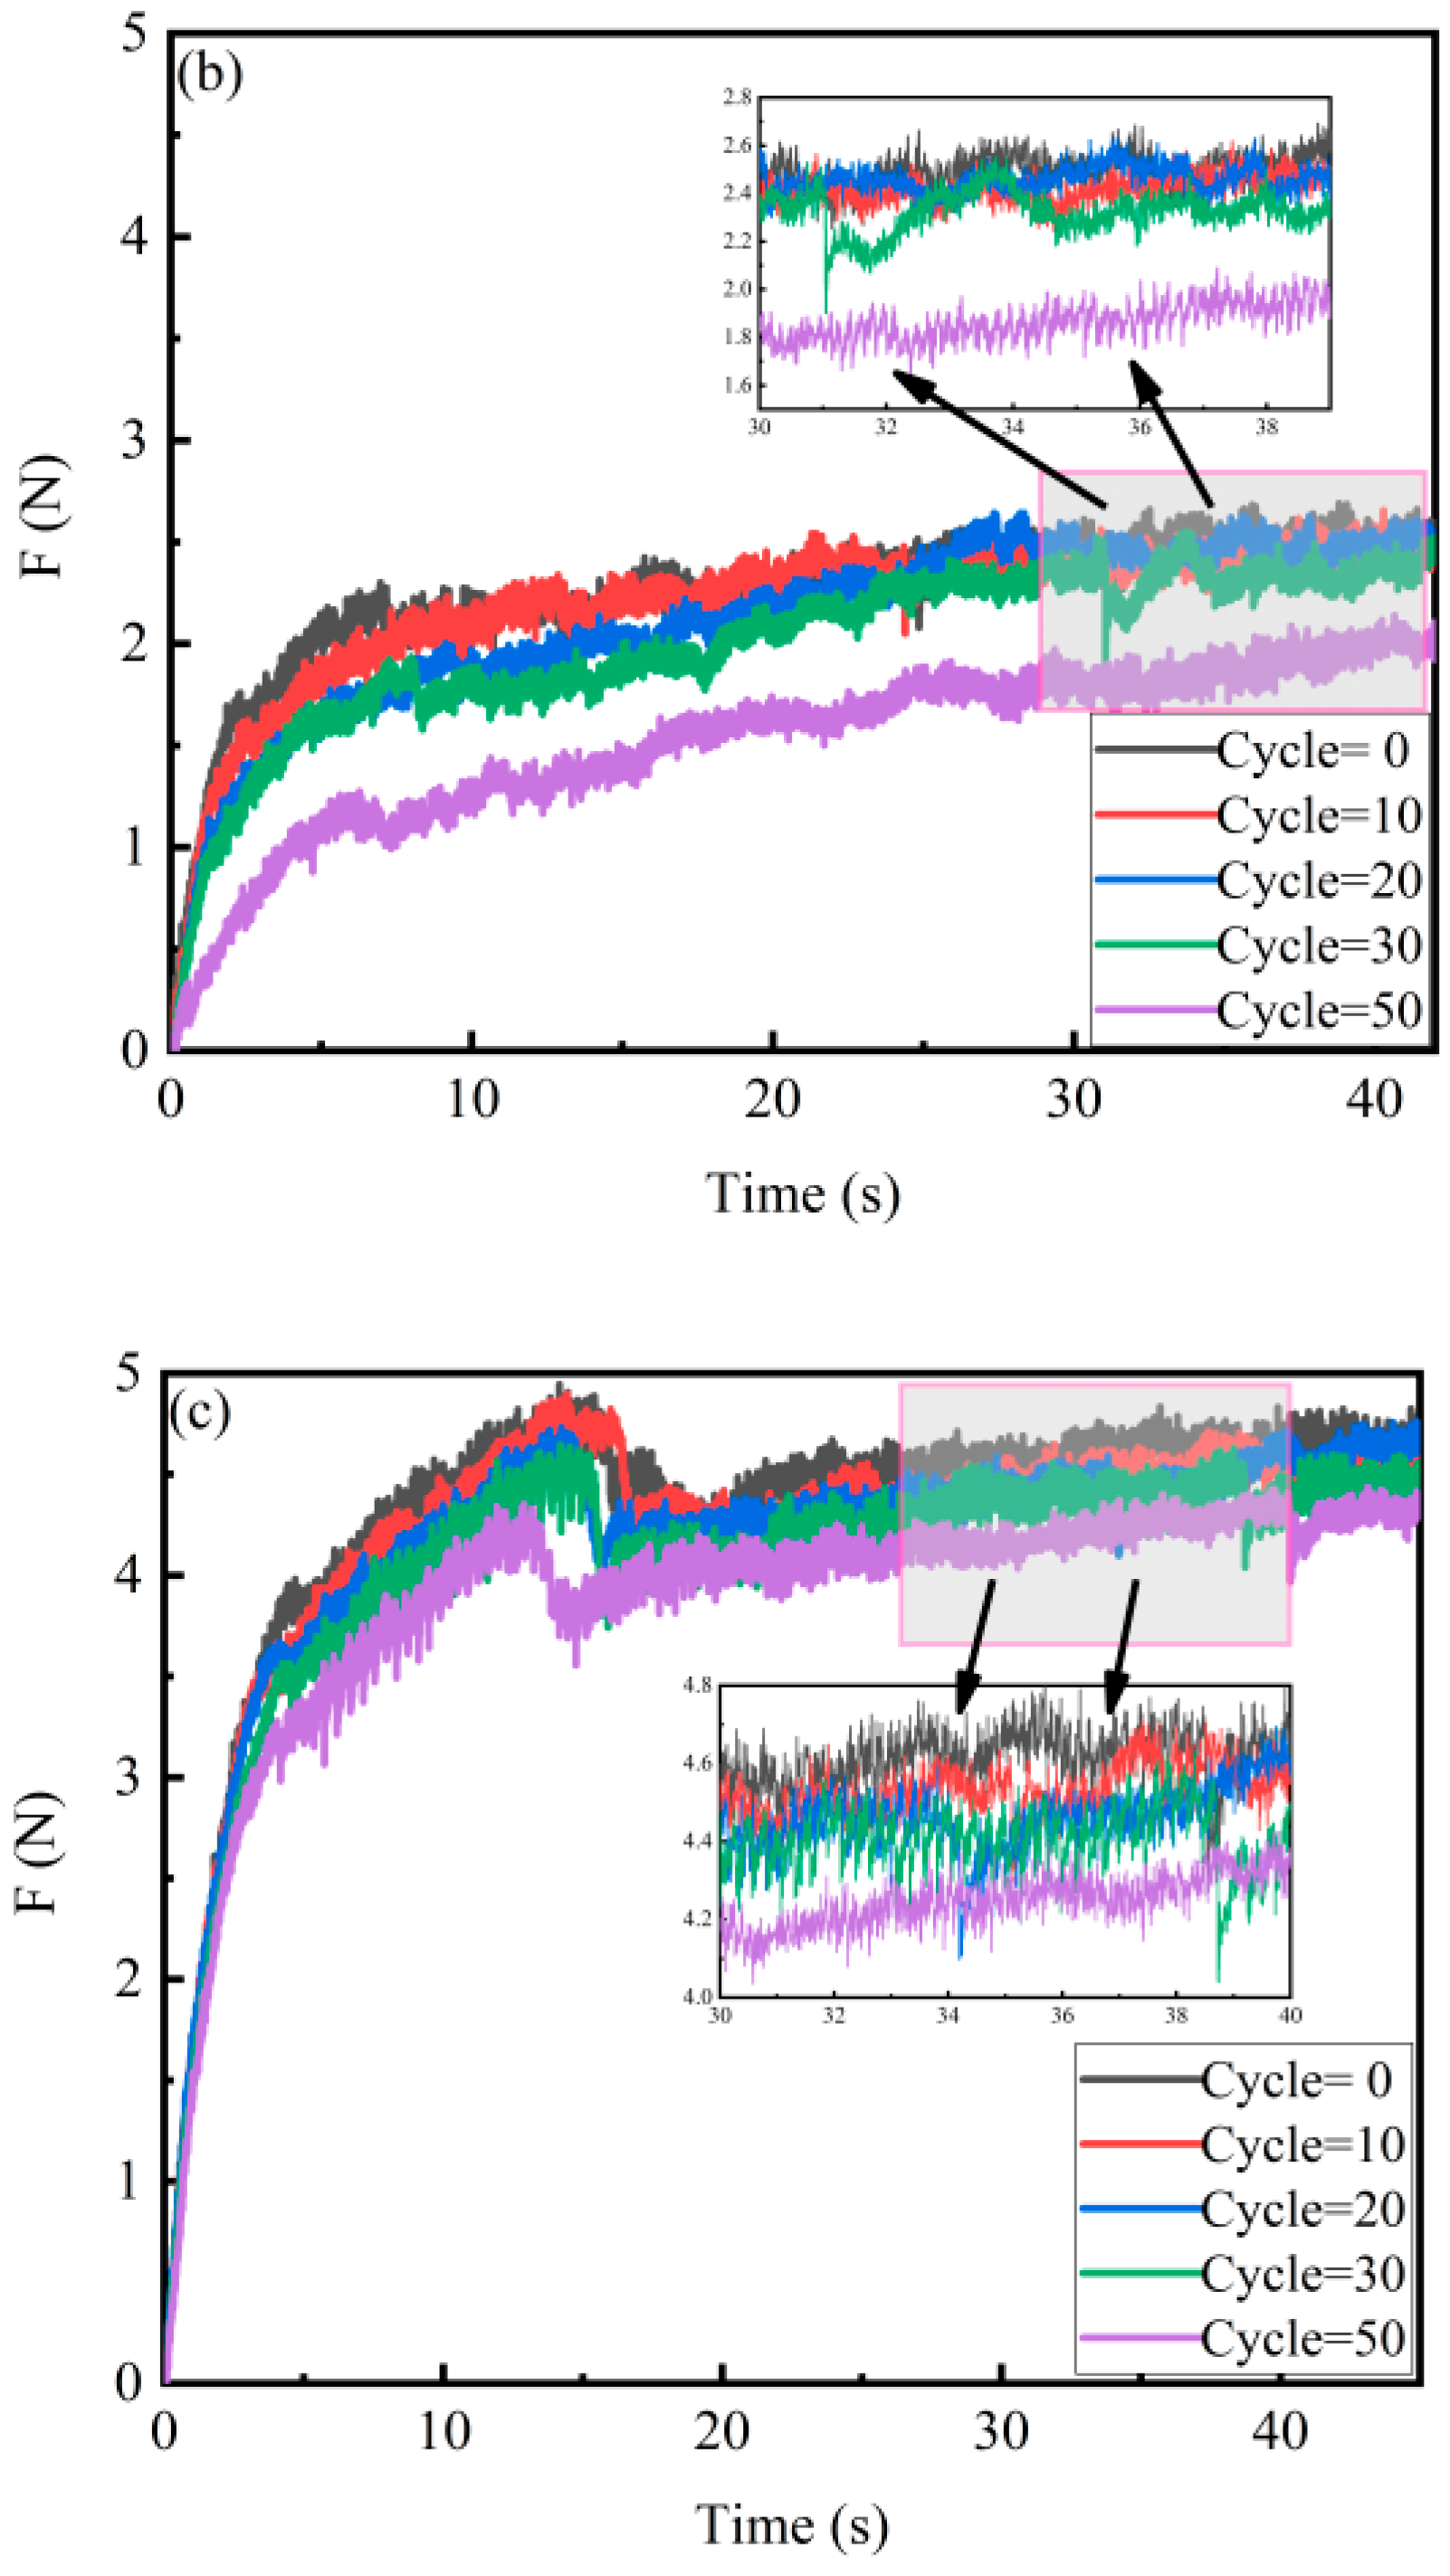
Figure 9 presents the numerical comparison of average friction and amplitude under different cycle numbers, while
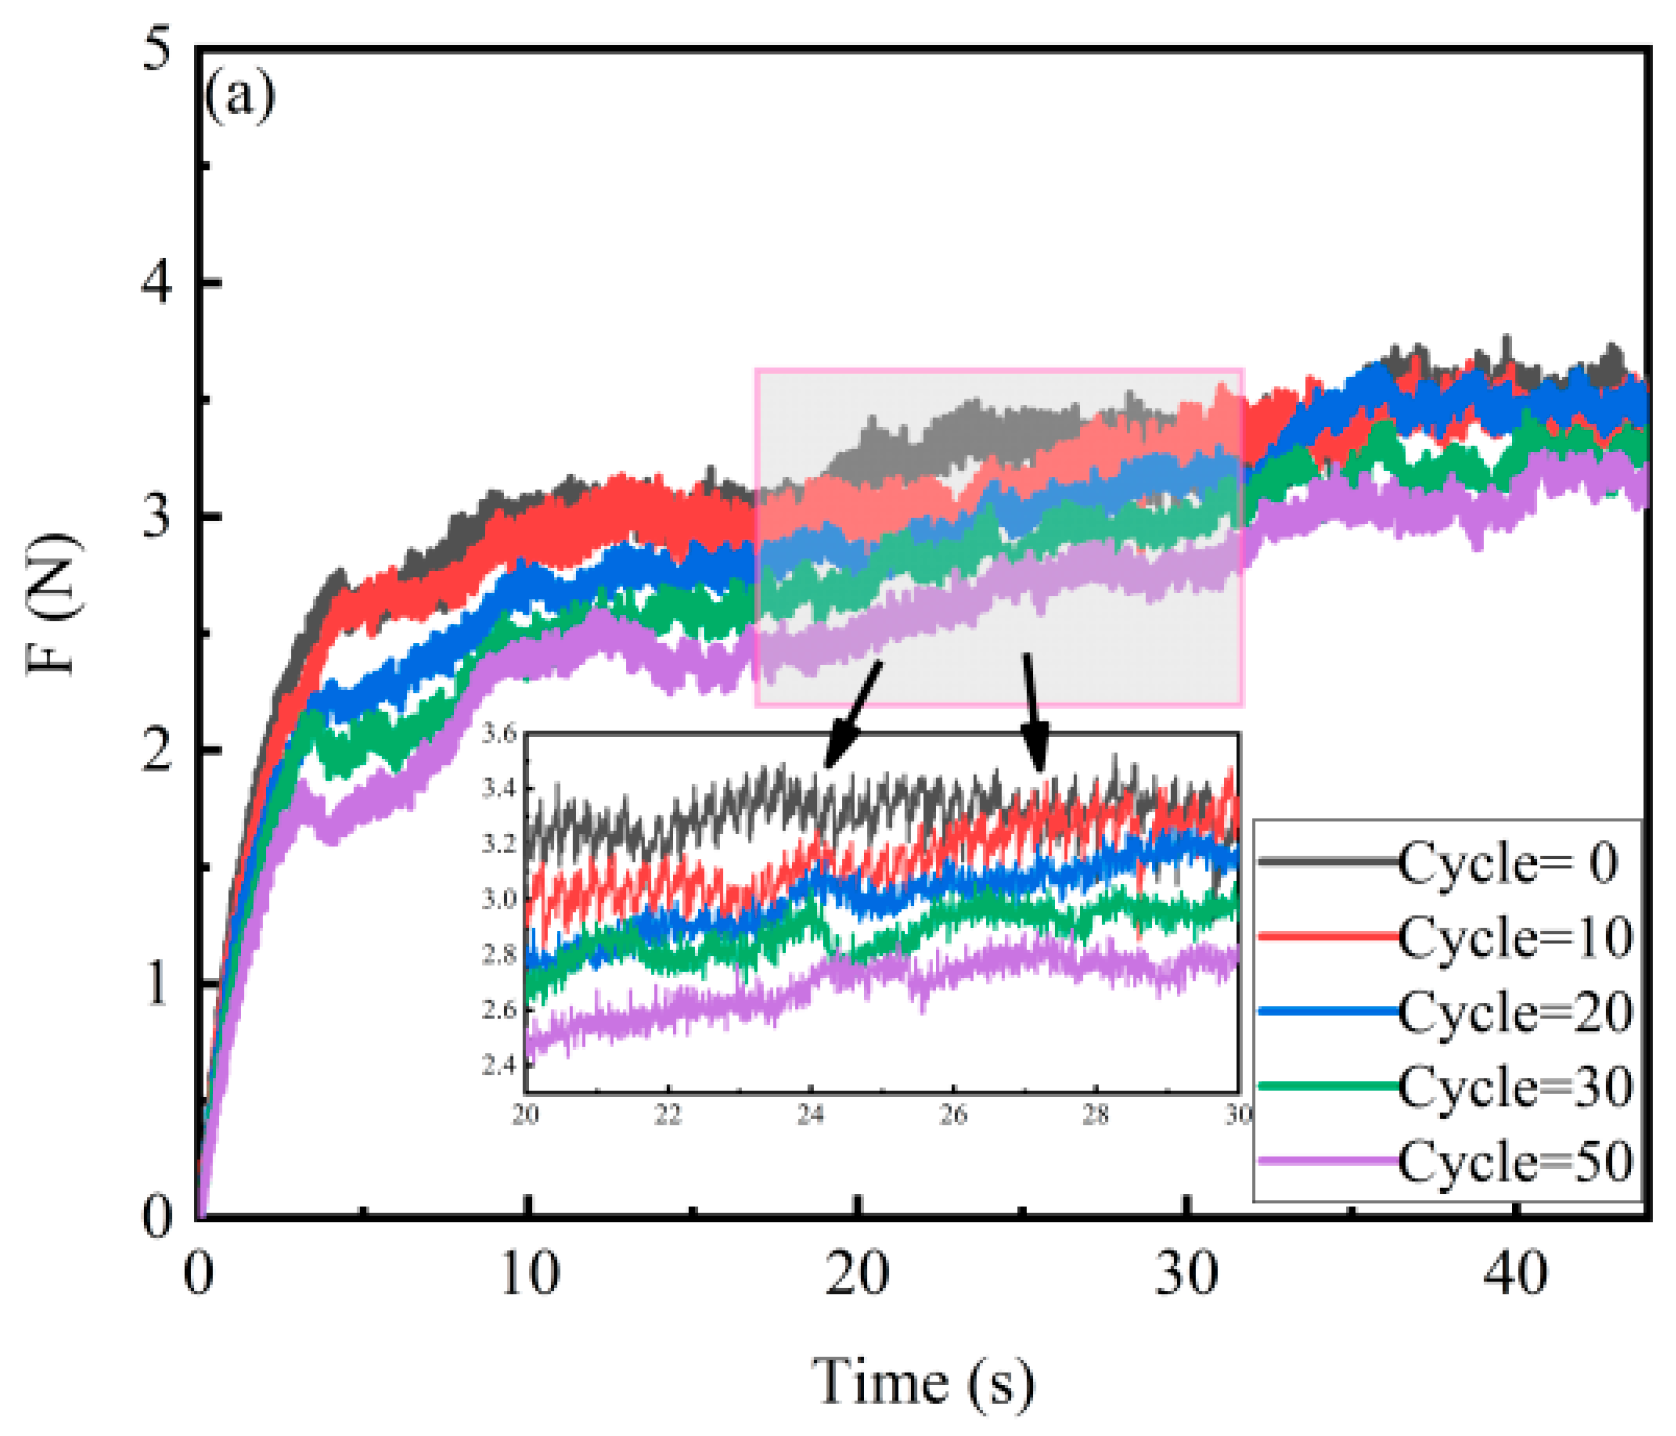
Figure 10a–c, respectively, show the detailed friction force evolution curves for the three distress types at various cycle numbers. The tests were conducted at a constant sliding speed of 5 mm/min and a reciprocating stroke length of 5 mm. The 5 mm/min speed was adopted exclusively for the cyclic tests to accelerate wear accumulation, as this module focuses on comparative degradation trends across cycle numbers rather than absolute friction values. Since the same speed was applied consistently across all tests, the relative comparisons among distress types remain valid.
The first phase (cycles 1–10) is the breaking-in period: for pothole, crack, and surface void distress, the average friction force fluctuates by approximately 1.3%, 2.4%, and 2.0%, respectively, with the vibration amplitude fluctuating by about 0.1 N. The second phase (cycles 31–50) enters the declining period, where the average friction force of the three distress types decreases by 27.97%, 6.2%, and 5.6%, respectively, and the vibration amplitude becomes relatively stable. Overall, all three types of distress exhibit a linear decreasing trend in friction force with an increasing number of cycles, among which pothole distress shows the largest reduction in friction force during the cyclic test, the friction of crack distress is the most stable during the cyclic test, crack distress exhibits the smallest fluctuation in overall friction force, pothole distress presents the largest fluctuation in friction force during cycles 1–30, and surface void distress shows the largest fluctuation in friction force during cycles 30–50.
Figure 9a,b detail the average friction curve and amplitude histogram of the three distresses under different cycles.
It should be clarified that “degradation” in this study refers to the percentage reduction in friction force relative to the initial value at the beginning of cyclic loading, rather than the absolute difference in friction values among distress types. The friction values of crack distress are generally higher than those of pothole distress throughout the cyclic test (as shown in
Figure 9a); however, the degradation severity is evaluated by the relative decrease from the initial stage (cycles 1–10) to the final stage (cycles 31–50). On this basis, pothole distress shows the largest relative reduction (27.97%), while crack distress exhibits the smallest reduction (6.2%), confirming that crack distress is the most stable among the three types.
The results indicate that the degradation of friction performance mainly arises from the following three aspects: (1) changes in contact characteristics caused by wear of the rubber surface; (2) lubrication effects resulting from debris accumulation; and (3) a decrease in elastic recovery capacity under repeated loading. These findings can provide an important basis for understanding early-stage friction degradation and the optimization of maintenance strategies. It should be noted that the maximum of 50 loading cycles was set to capture the early-stage friction evolution, i.e., the running-in and initial degradation phases, rather than the long-term service life. Here, our observations revealed that the first 10 cycles dominate the running-in process, while cycles 10–50 exhibit a steady linear decay trend. Therefore, this cyclic range is sufficient to identify the sensitivity of different distress types to early wear. Long-term friction performance under extended loading will require further accelerated pavement testing, and the present data serve as essential calibration points for future predictive models.
“It should be clarified that the observed enhancements in friction performance with increasing roughness, load, and temperature are reported as relative trends within the SBS-modified asphalt system, rather than as a comparison between modified and unmodified binders. The absolute friction values of SBS-modified asphalt are indeed expected to be superior to those of conventional asphalt under equivalent conditions, a premise that is well established in the literature and recognized by several European pavement design codes, where the enhanced performance of modified asphalt is often accepted without mandatory confirmation testing. Thus, the present study does not aim to revalidate this known superiority, but rather to quantify the sensitivity of SBS-modified pavements to specific environmental and mechanical factors under distressed and submerged conditions, providing data-driven guidance for maintenance prioritization and friction evaluation.
4. Three-Dimensional Micro-Topography Analysis
Following the completion of the cyclic friction tests, a systematic procedure was implemented to characterize the worn surface of the rubber slider. The slider was first carefully extracted from the test assembly and gently cleaned to eliminate any surface contaminants or wear debris that might interfere with subsequent measurements. A three-dimensional profiler was then selected for high-precision surface morphology measurement, as it enables non-destructive, high-resolution characterization of micro-scale wear features. The 3D analysis was performed on the rubber slider rather than the asphalt surface, due to the profiler’s specimen size requirements. The worn morphology of the rubber slider indirectly reflects the mechanical interaction with different distress types, but the following discussion refers specifically to the rubber surface characteristics. However, preliminary scans revealed that the non-conductive nature of the rubber material led to significant signal attenuation and distortion, compromising data quality. To overcome this limitation, a gold sputtering treatment was applied to the slider surface before formal scanning. This treatment is essential because the rubber material is non-conductive and cannot be scanned directly without signal loss and distortion. A sputtering machine was used to uniformly deposit a thin gold layer of approximately 5–20 nm onto the rubber surface. This coating thickness was negligible compared with the reported roughness differences (~1–2 μm) and did not alter the measured surface morphology. This treatment deposits a thin, uniform conductive layer onto the rubber surface, which substantially improves both electrical conductivity and optical reflectivity, thereby ensuring that the profiler can acquire clear and stable topographic data. Using this optimized procedure, the system successfully generated high-fidelity three-dimensional surface maps, from which quantitative parameters—including surface profile, arithmetic mean roughness (Ra), root mean square roughness (Rq), and wear scar morphology—were extracted and analyzed.
Among the three types of pavement distress, the rubber slider after friction with crack distress exhibited discrete and discontinuous wear scars due to localized stress concentrations and edge spalling of the narrow crack specimen during reciprocating friction. Three-dimensional profilometry scanning failed to achieve stable optical focusing on the target area because of the discrete scar distribution and localized debris accumulation, resulting in over 30% missing valid data points. Therefore, reliable 3D texture parameters could not be reconstructed for this condition. Nevertheless, the two analyzed distress types are sufficient to illustrate two distinctly different wear mechanisms; however, this conclusion is limited to pothole and surface void distresses, as crack distress data could not be reliably obtained. Consequently, this section focuses on the two representative and reliably measured distress types—pothole and surface void—which provide comparative evidence of concentrated deep-pit wear versus uniform surface roughening, supporting the macroscopic friction degradation trends observed in
Section 3.4.
4.1. Microscopic Wear Characteristics of the Rubber Slider Surface After Contact with Pothole Distress
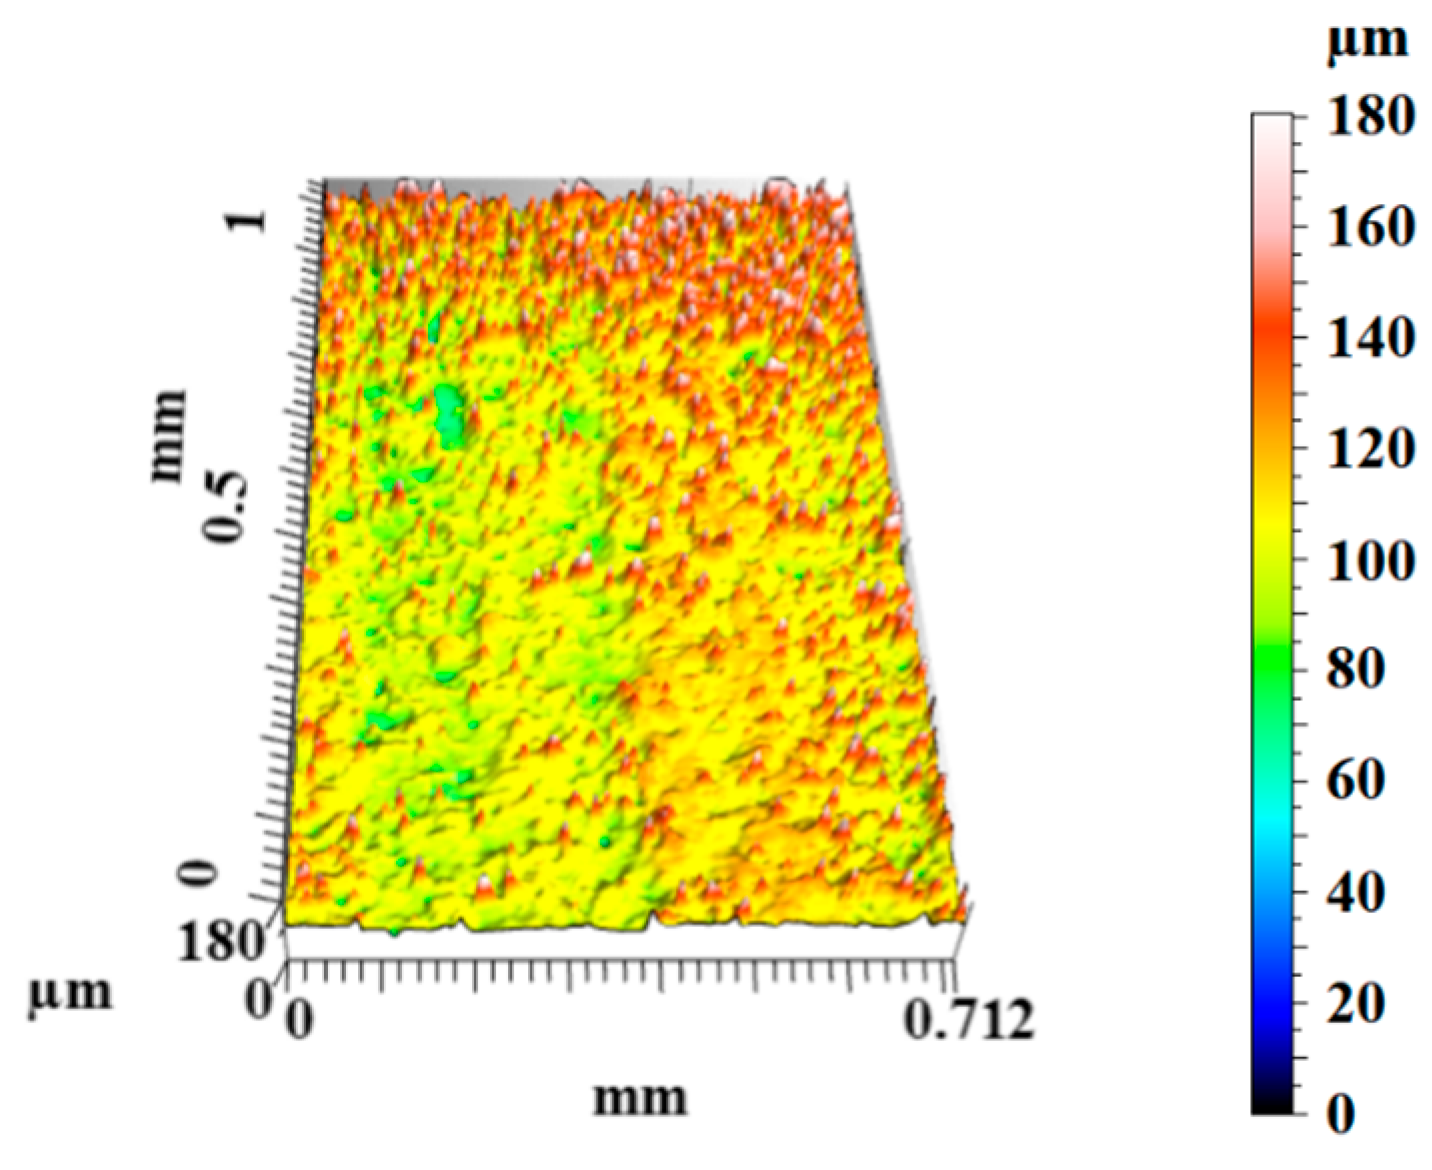
Figure 11 presents the three-dimensional surface morphology of the rubber slider after it came into frictional contact with the densely distributed pothole distress on the asphalt pavement under submerged conditions. The worn surface morphology exhibited the following characteristics: an overall pattern characterized by deep valleys, rapid recovery, and continuous high-amplitude fluctuations. The peak-valley amplitude was large, and strong local abrupt changes occurred; where peaks and deep valleys dominated the surface profile. As shown in
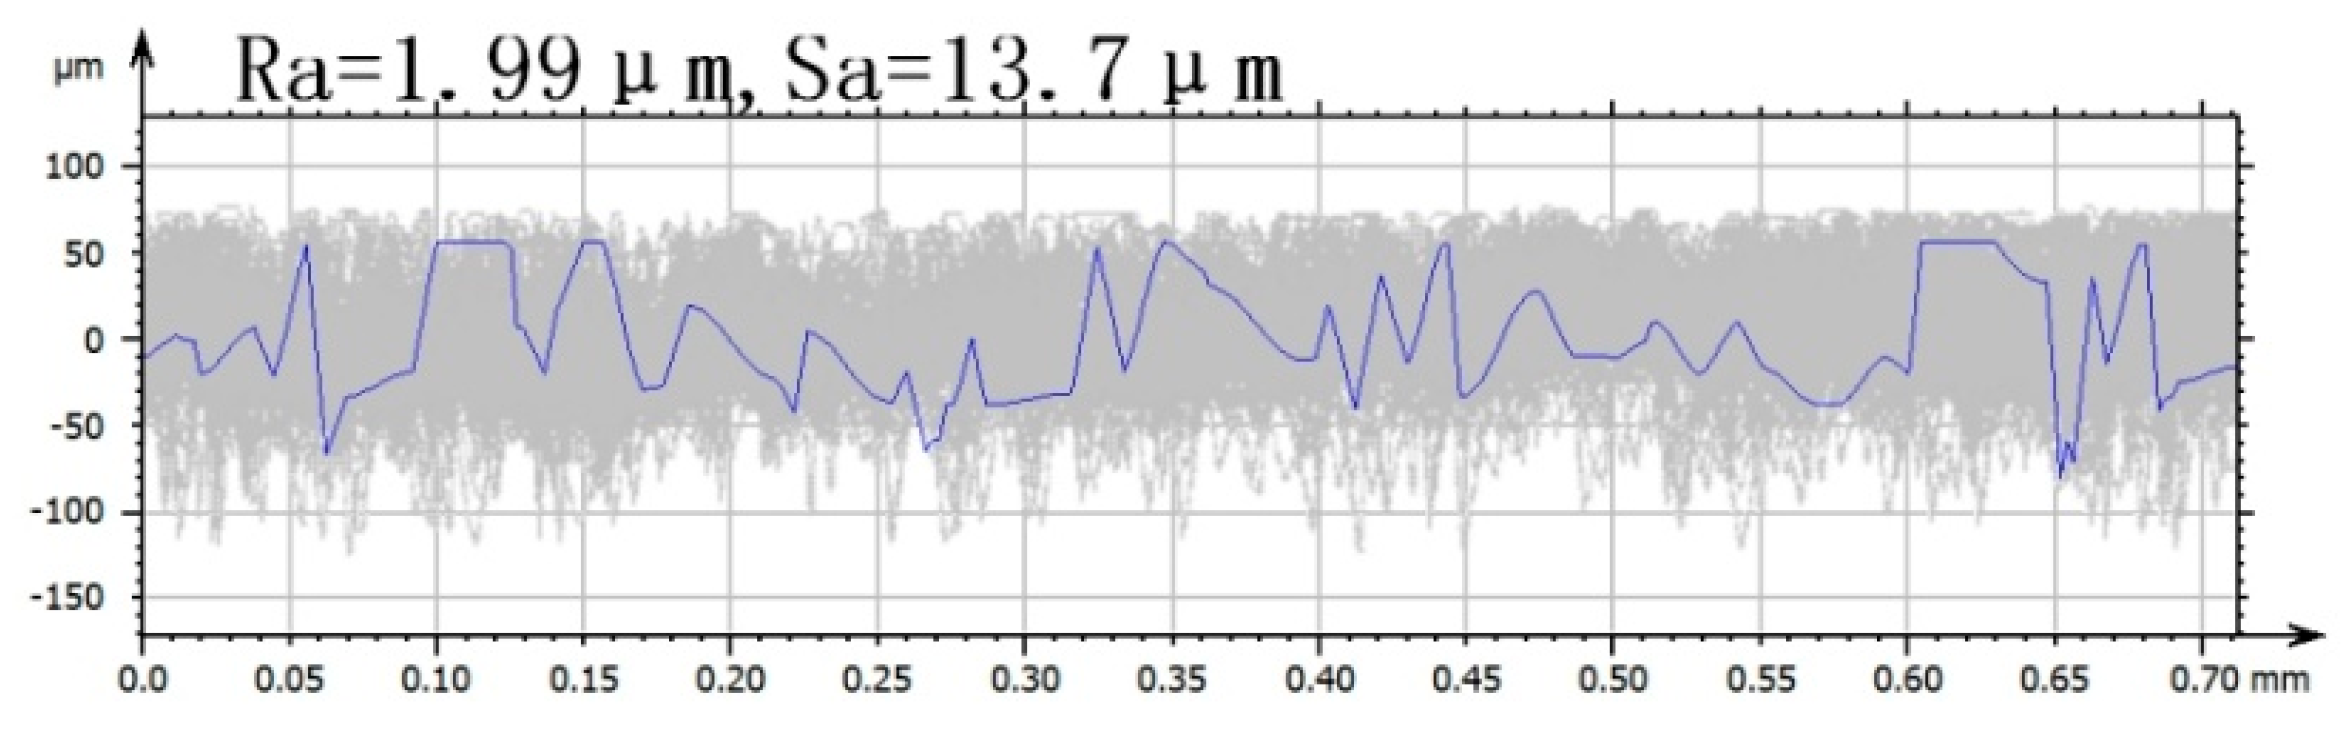
Figure 11, the three-dimensional morphology further increased the height dispersion, with localized pits and severe undulations becoming more pronounced. Numerically, the arithmetical mean height (Sa) and arithmetic mean roughness (Ra) corresponding to the densely distributed pothole distress were approximately 2 μm; detailed parameters are presented in
Figure 12. This indicates that densely distributed pothole distress not only increases the overall surface undulation of the rubber slider but also enhances the irregularity of the profile and reinforces the damage characteristics of localized deep pits and deep grooves on the worn rubber surface.
4.2. Microscopic Wear Characteristics of the Rubber Slider Surface After Contact with Surface Void Distress
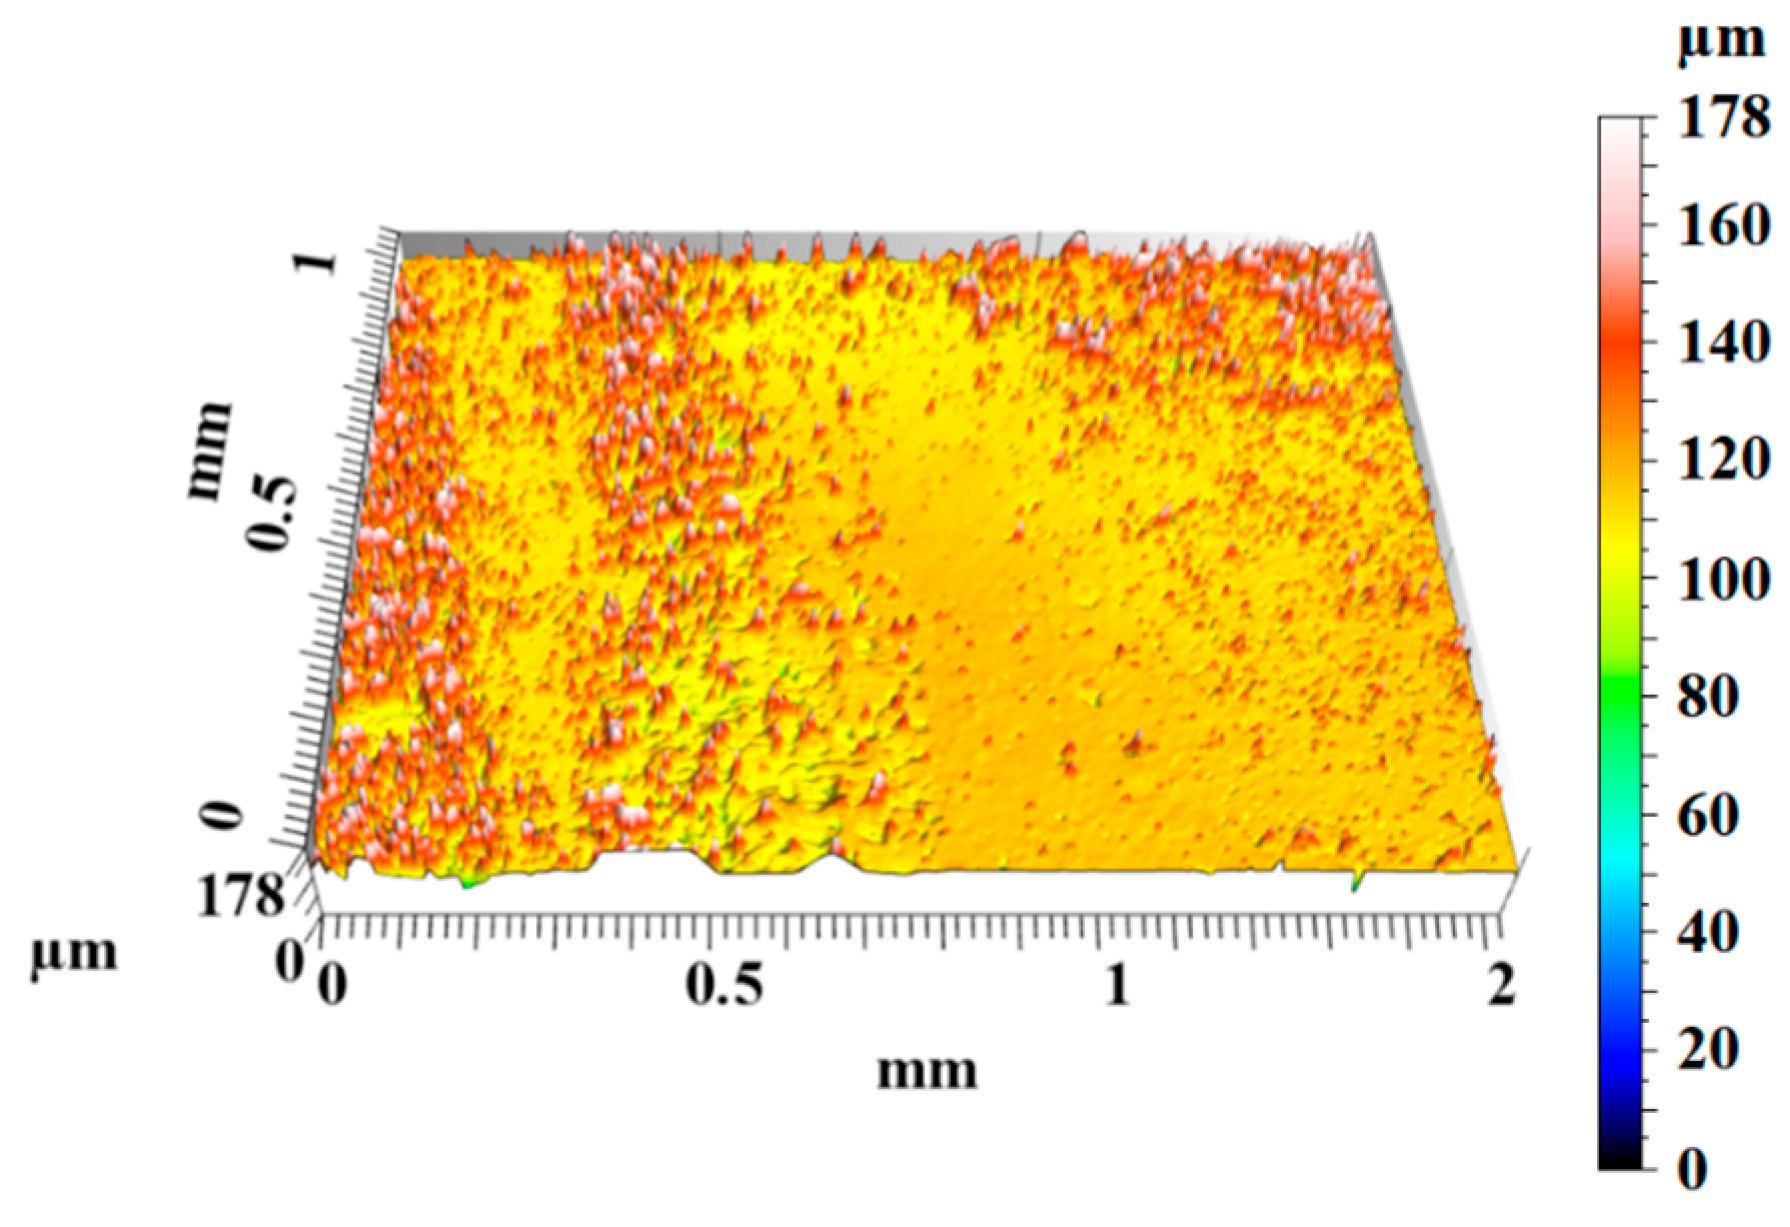
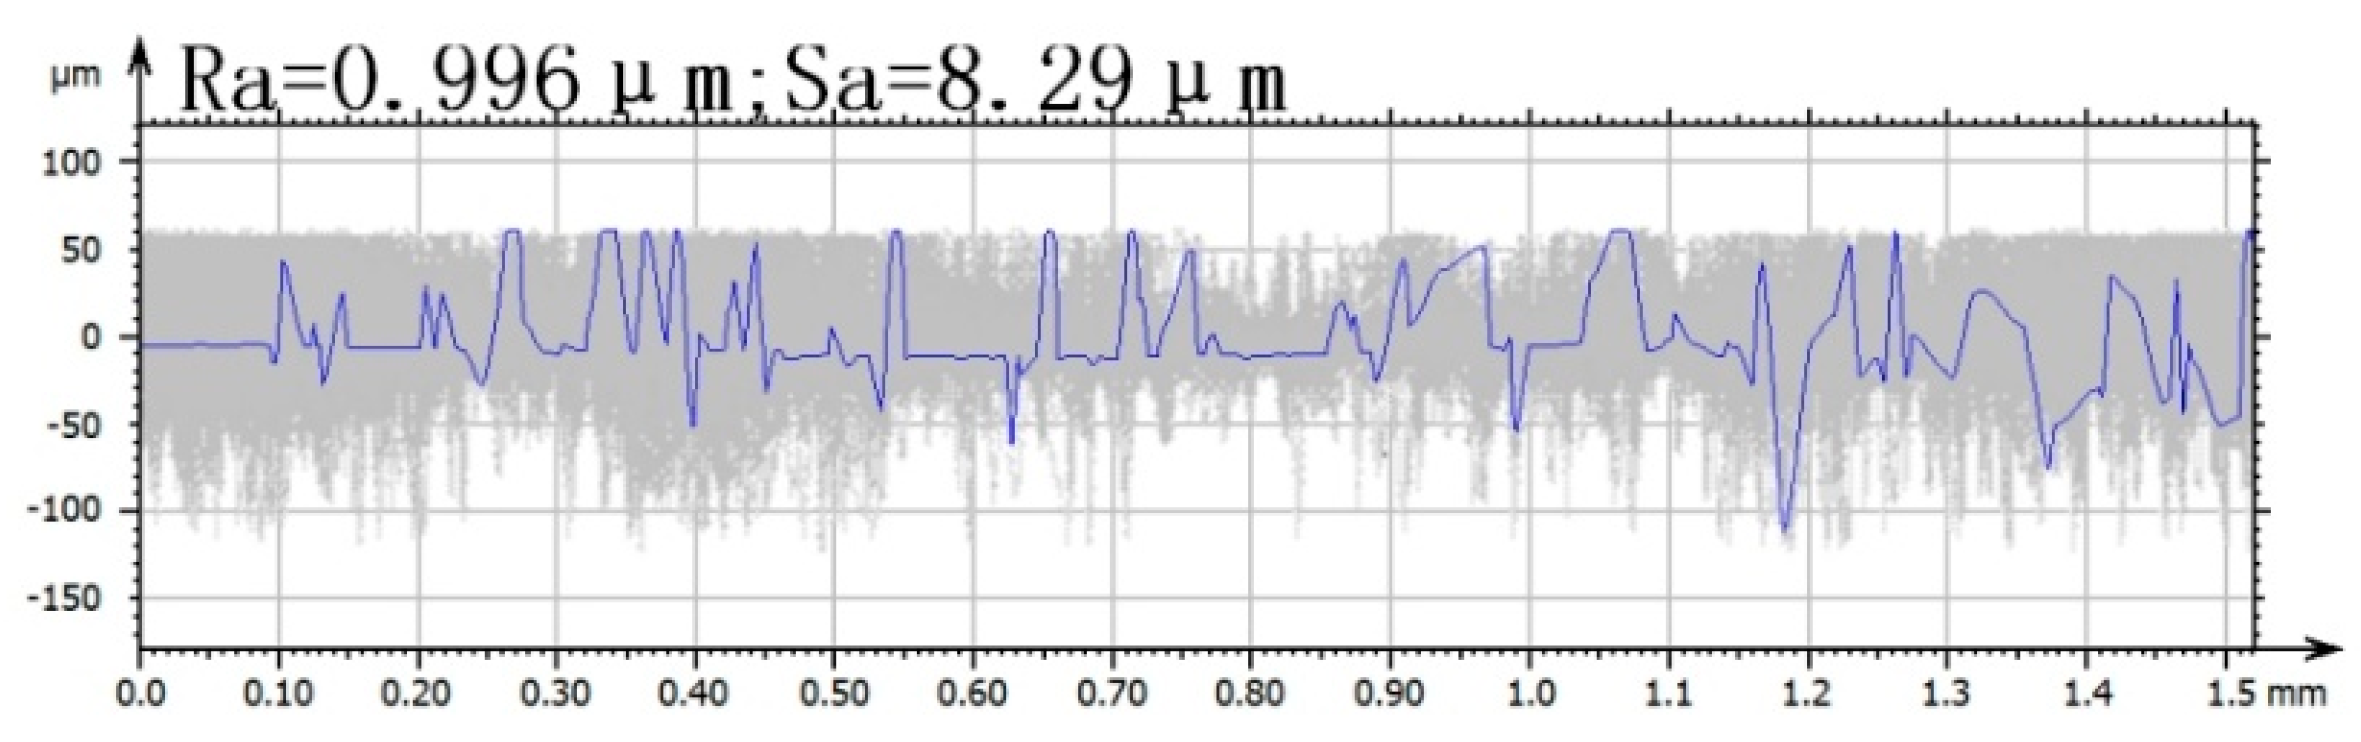
Figure 13 presents the three-dimensional surface morphology of the rubber slider after it came into frictional contact with the densely distributed surface void distress on the asphalt pavement under submerged conditions. The worn surface morphology exhibited the following characteristics: local banded spots were visible, but the overall distribution was relatively uniform; the profile line continuously undulated around the baseline, with a slow downward cut followed by recovery in the middle section; the fluctuations were predominantly high frequency and small amplitude, characterized as “dense but not sharp”, with few abrupt deep valleys. As shown in
Figure 13, the three-dimensional morphology shows a relatively continuous height distribution without a notable tendency toward defect concentration. Numerically, the Sa value corresponding to the densely distributed surface void distress is at a moderately high level, with Ra approximately 1 μm; detailed parameters are presented in
Figure 14. This indicates that this type of distress mainly increases the overall surface undulation of the rubber slider and enhances the characteristic of uniform surface roughening on the worn rubber surface.