


Abstract
To reveal how meniscus dynamics affect wet film uniformity during slot-die coating for perovskite solar cell manufacturing, a 2D numerical model employing the VOF method is established for perovskite precursor fluids. A photoresist is used as a qualitative substitute liquid for auxiliary experimental validation, and dry film thickness is measured to characterize the relative uniformity of wet coating. The results show that the capillary number governs the upstream meniscus shape. Inlet velocity, slot gap, and coating gap influence film thickness by altering the downstream meniscus climbing height. Optimal film thickness uniformity is achieved when the pre-coating liquid volume accounts for about 31% of the total coating volume; this empirical optimal ratio is only valid within the tested inlet flow rate range under the fixed experimental conditions adopted in this work, and further multi-parameter verification under diverse process windows will be carried out in follow-up research.
1. Introduction
Perovskite solar cells (PSCs) have become a research hotspot and industrial focus in the photovoltaic field due to their high power conversion efficiency and low production costs [1,2,3]. Slot-die coating technology, with its advantages of high coating efficiency, good film uniformity, and strong thickness controllability, is a core technique for fabricating high-quality perovskite thin films [4,5,6]. During the slot-die coating process, the meniscus formed between the coating die and the substrate—its morphology, position, and stability—directly governs the spreading behavior of the fluid on the substrate, determines the uniformity of the liquid film thickness, and dominates the formation of defects such as bubble entrainment, flow instability, and edge thickening. Ultimately, these factors influence the microstructure and optoelectronic performance of the perovskite film. Therefore, clarifying the evolution of meniscus characteristics and revealing the influence of fluid properties and coating parameters on the meniscus are key to improving the quality of perovskite coatings.
Researchers have conducted relevant studies on meniscus characteristics and film formation during slot-die coating. For example, Lin et al. [7] used the commercial software FLOW-3D to predict coating defects such as streaks and air entrainment based on the shape or position of the upstream meniscus of the coating bead. Ahn et al. [8] employed computational fluid dynamics to analyze the mechanism of Newtonian liquid upstream meniscus shape and contact angle on bead flow and air entrainment, revealing the intrinsic relationship between meniscus characteristics and coating defects. Malakhov et al. [9] divided the low-flow limit into three characteristic regions and confirmed significant differences in the stabilization or destabilization mechanisms of the coating bead in each region, which are dominated respectively by capillary effects at the upstream meniscus, viscous forces generated by relative motion between the die and substrate, and inertial effects caused by increased internal pressure at the die exit, providing a basis for meniscus stability control in different process parameter ranges. Maier et al. [10] investigated the effect of viscous forces on the coating bead and proposed a correction method for the upper-boundary divergence problem in high-viscosity liquids, offering support for meniscus morphology optimization. Minjae Kim et al. [11] extracted meniscus features to build thickness prediction models for real-time roll-to-roll coating monitoring, cutting material waste. In addition, Li et al. [12] carried out simulation analysis to systematically explore the influence of multiple operating parameters on the internal pressure profile of the coating bead, clarifying the correlation between parameter adjustment, pressure distribution variation and coating bead stability, which provides a numerical reference for optimizing slot-die coating process parameters. Moreover, Zhang et al. [13] further focused on non-Newtonian liquid coating systems and explored the operability limits of dual-layer slot coating under the viscocapillary mode, analyzing the coupling influence of fluid non-Newtonian characteristics and viscocapillary behavior on coating process stability and feasible coating ranges. However, all the above studies only target Newtonian fluids or merely conduct single-parameter simulations and operability limit analyses, and neglect the coupling regulatory effect of pre-coating liquid on meniscus evolution.
Shim et al. [14] prepared perovskite films via blade coating with a focus on post-crystallization processes, and they demonstrated that film conversion duration is a decisive factor for photovoltaic performance. Nevertheless, their research did not investigate the dynamic evolution of the meniscus and the regulation mechanism of pre-coating liquid during slot-die coating.
Overall, the existing literature mainly focuses on single-factor analysis of meniscus evolution, lacking systematic multi-parameter coupling research on the formation mechanism of film thickness uniformity. In addition, few reports take pre-coating volume as a core variable to balance meniscus stability and coating homogeneity for non-Newtonian perovskite ink.
To fill these research gaps, this paper establishes a two-dimensional model of the external flow field in slot-die coating based on ANSYS Fluent 2024 R1, employs the VOF interface tracking method, and divides the coating process into three stages: initial, pre-coating liquid, and stable coating, to accurately capture the dynamic evolution of the meniscus. The contact line position of the meniscus is used as the core evaluation index to systematically investigate the effects of coating liquid viscosity, substrate moving speed, inlet flow velocity, slot gap, and coating gap on meniscus morphology and stability. The regulation of pre-coating liquid volume on film thickness uniformity is further revealed through a combination of numerical simulation and experimental verification. The findings provide theoretical and data-based support for process optimization in perovskite thin-film slot-die coating.
2. Materials and Methods
2.1. Geometric Model Construction and Boundary Condition Setup
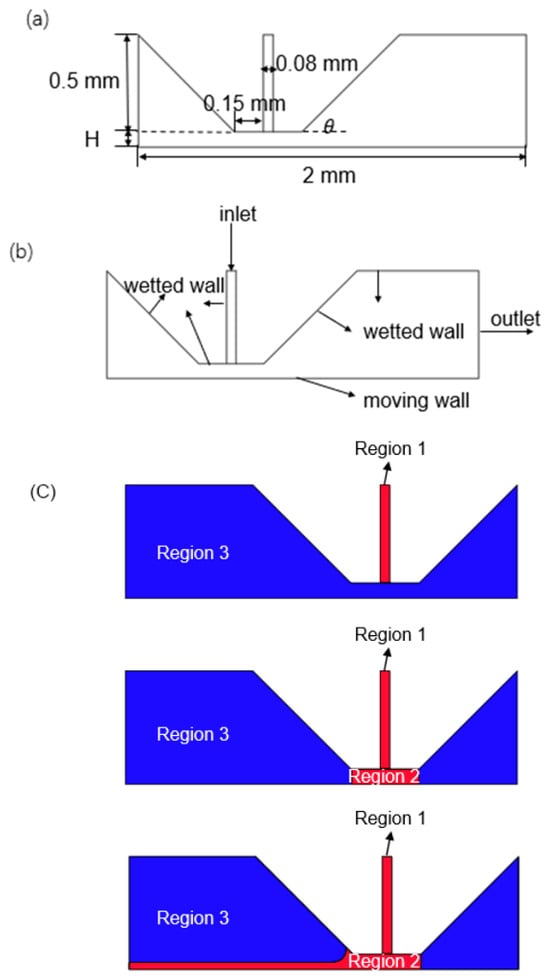
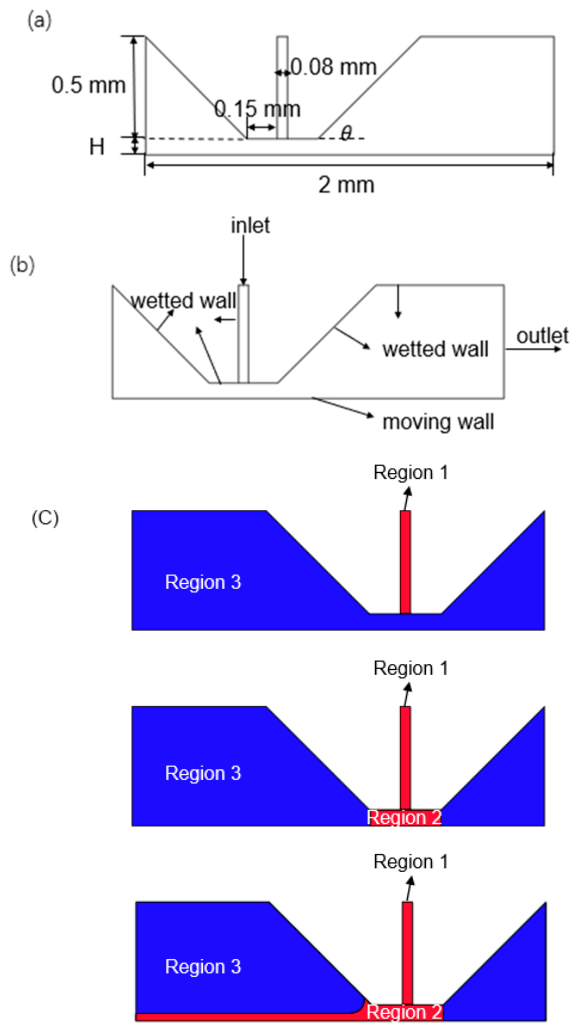
A two-dimensional geometric model of slot-die coating is constructed based on the actual slot-die coating process, as shown in Figure 1a. The die slot width is W (shim thickness), the height of the die from the substrate (coating gap) is H, the length of both the upstream and downstream die lips is 0.15 mm, and the angle between the die and the horizontal plane is 45°. The boundary conditions are set as follows: the inlet is defined as a velocity inlet with constant velocity V; the outlet is defined as a pressure outlet at 101,325 Pa; the substrate is defined as a moving wall with a constant velocity U; the remaining boundaries are defined as stationary walls, as shown in Figure 1b.
Figure 1.
Geometric model construction and boundary condition setup. (a) Two-dimensional geometric model of slot-die coating. (b) Boundary conditions of the model. (c) Stage division of simulation.
The coating process is divided into three stages: initial stage—the die slot is filled with the coating liquid, while the gap between the die and the substrate is filled with air; pre-coating liquid stage—the liquid is extruded from the inlet at a constant velocity, forming a liquid film on the substrate surface and gradually covering the entire coating area; stable coating stage—the coating bead forms, and the upstream and downstream menisci reach dynamic equilibrium, as shown in Figure 1c. This method enables precise capture of the meniscus evolution during the initial stage and aids in optimizing the pre-coating liquid volume to improve coating efficiency and reduce film defects.
2.2. Mesh Generation and Independence Verification
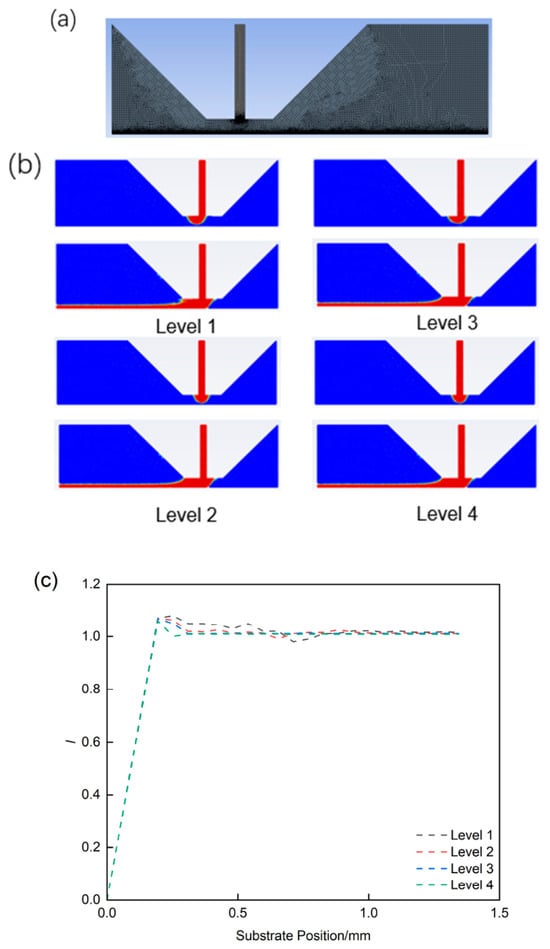
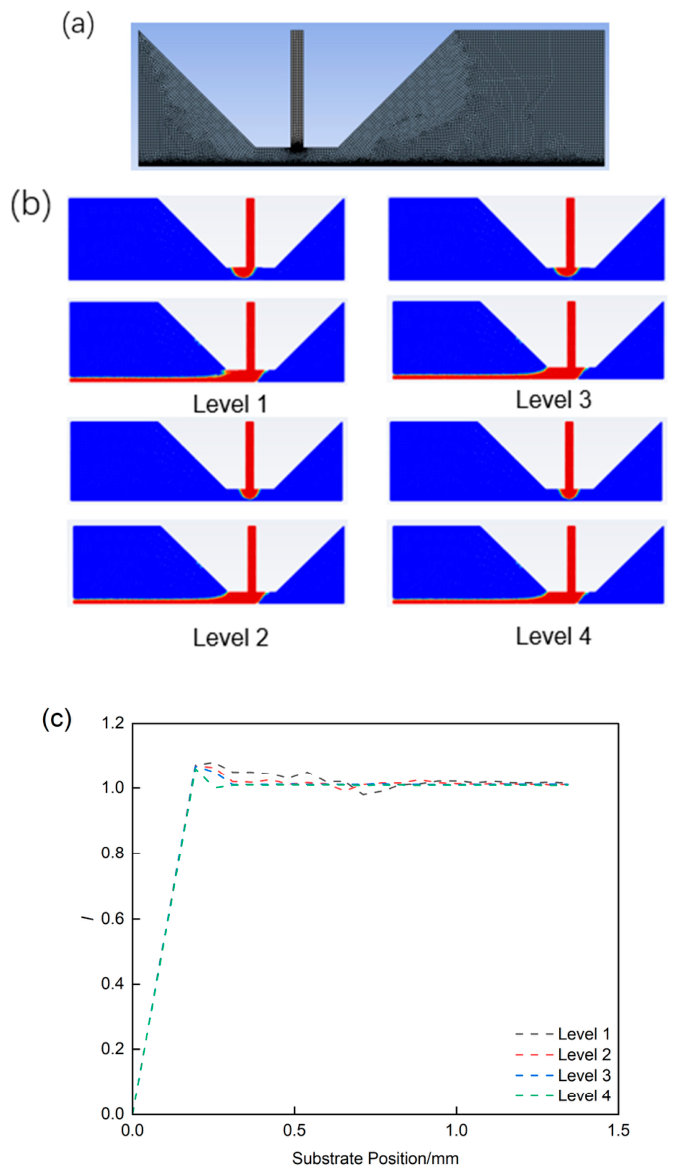
A non-uniform density quadrilateral mesh is employed, with local refinement at the die exit and the substrate boundary. A schematic of the mesh generation is shown in Figure 2a, with an overall mesh quality of 0.55.
Figure 2.
Mesh generation and independence verification. (a) Mesh generation for the model (W = 0.05 mm, H = 0.08 mm, and θ = 45°). (b) Comparison of coating processes with different mesh numbers (the blue area represents air, and the red region denotes the coating liquid). (c) Film thickness distribution under different meshes.
Since the accuracy of free interface tracking using the VOF method is highly dependent on mesh quality and density, a mesh independence study is conducted to ensure the reliability, accuracy, and credibility of the computational results. Four levels of mesh density are used, with mesh counts of 3057, 9228, 22,340, and 43,229. The dimensionless liquid film thickness l is used as the evaluation metric, as defined in Equation (1):
where represents the film thickness at different positions and represents the film thickness under ideal conditions.
By comparing the coating process and film thickness distribution under different mesh conditions (Figure 2b,c), the Level 1 mesh introduces significant errors. The Level 3 mesh balances computational accuracy and efficiency; therefore, the Level 3 mesh is selected for subsequent simulations.
2.3. Solution Method
Numerical calculations are performed using Fluent 2022R1. The coating process is treated as incompressible, unsteady gas–liquid two-phase flow, with the VOF model used to track the free interface [15,16]. Owing to the low Reynolds number of the coating liquid flow, the flow is considered laminar [17,18]. The perovskite precursor solution is set as a non-Newtonian fluid, described by the Carreau rheological model. The rheological parameters are experimentally determined and listed in Table 1.
Table 1.
Fluid performance parameters of coating liquid.
All rheological parameters are characterized using a rotational rheometer (MCR302, Anton Paar, Austria) with a 25 mm parallel-plate fixture at a constant temperature of 25 °C, matching the coating ambient condition. Prior to testing, the precursor solution is allowed to stand for 30 min to remove entrapped bubbles, and a solvent sealing ring is installed around the fixture to minimize solvent evaporation during measurement. Steady-state shear sweep tests are performed over a shear rate range of 0.001–1000 s−1 to record the apparent viscosity. The Carreau model is then fitted to the measured viscosity–shear rate curve to extract the zero-shear viscosity η0, infinite-shear viscosity η∞, relaxation time λ, power-law index n, and characteristic coefficient a. Each rheological test is repeated three times with fresh precursor solution, and the averaged values are adopted; the relative measurement error of all fitted parameters is within ±2%, and the steady shear rheology fitting curve is presented in Figure S1.
In addition, the static contact angle (θ = 15°) is measured on the experimental glass substrate using a contact angle goniometer (JC2000D, Powereach, Shanghai, China) with a 2 μL droplet, averaged over five repeated measurements. Liquid density and surface tension are determined separately using a density meter and a surface tension tester under the same environmental conditions (25 °C, 40% RH).
In the numerical solution, the solver is set for transient calculations [19]. The pressure–velocity coupling is accomplished using the SIMPLEC method. Pressure discretization employs PRESTO, and gradient discretization is performed using the Green–Gauss cell-based method. The time step size is 1 × 10⁻⁵ s, ensuring a Courant number less than 0.2. The convergence criterion for residuals is set to 1 × 10⁻⁴ [20].
3. Numerical Simulation Results and Analysis
3.1. Effects of Process Parameters on Meniscus Characteristics
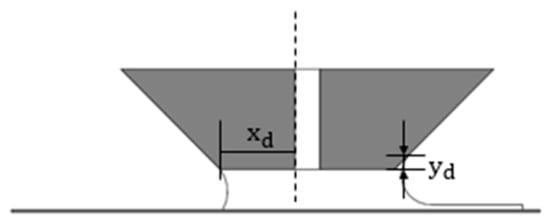
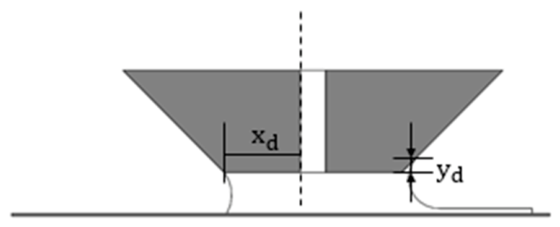
The downstream contact line climbing height and the distance of the upstream contact line from the die lip are selected as the core evaluation indices for meniscus morphology, as shown in Figure 3; these parameters reflect the stability of the meniscus and determine coating uniformity and defect formation.
Figure 3.
Evaluation indices of meniscus morphology.
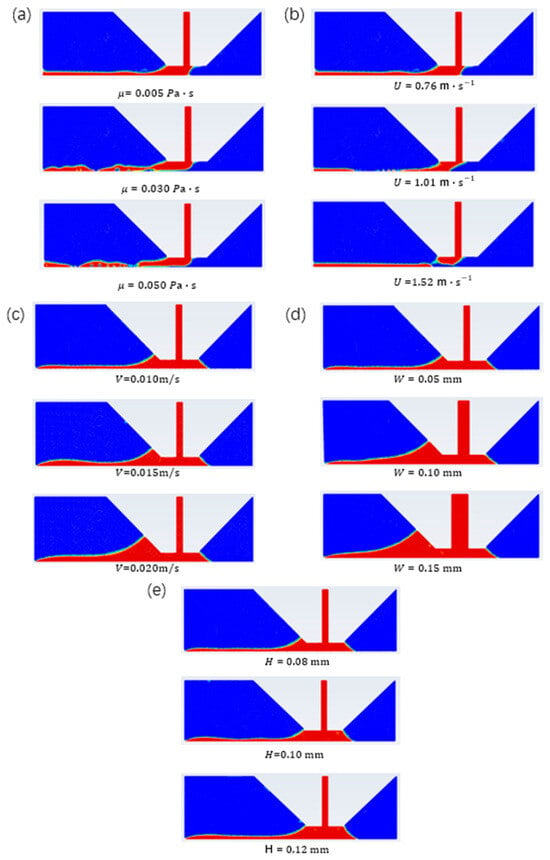
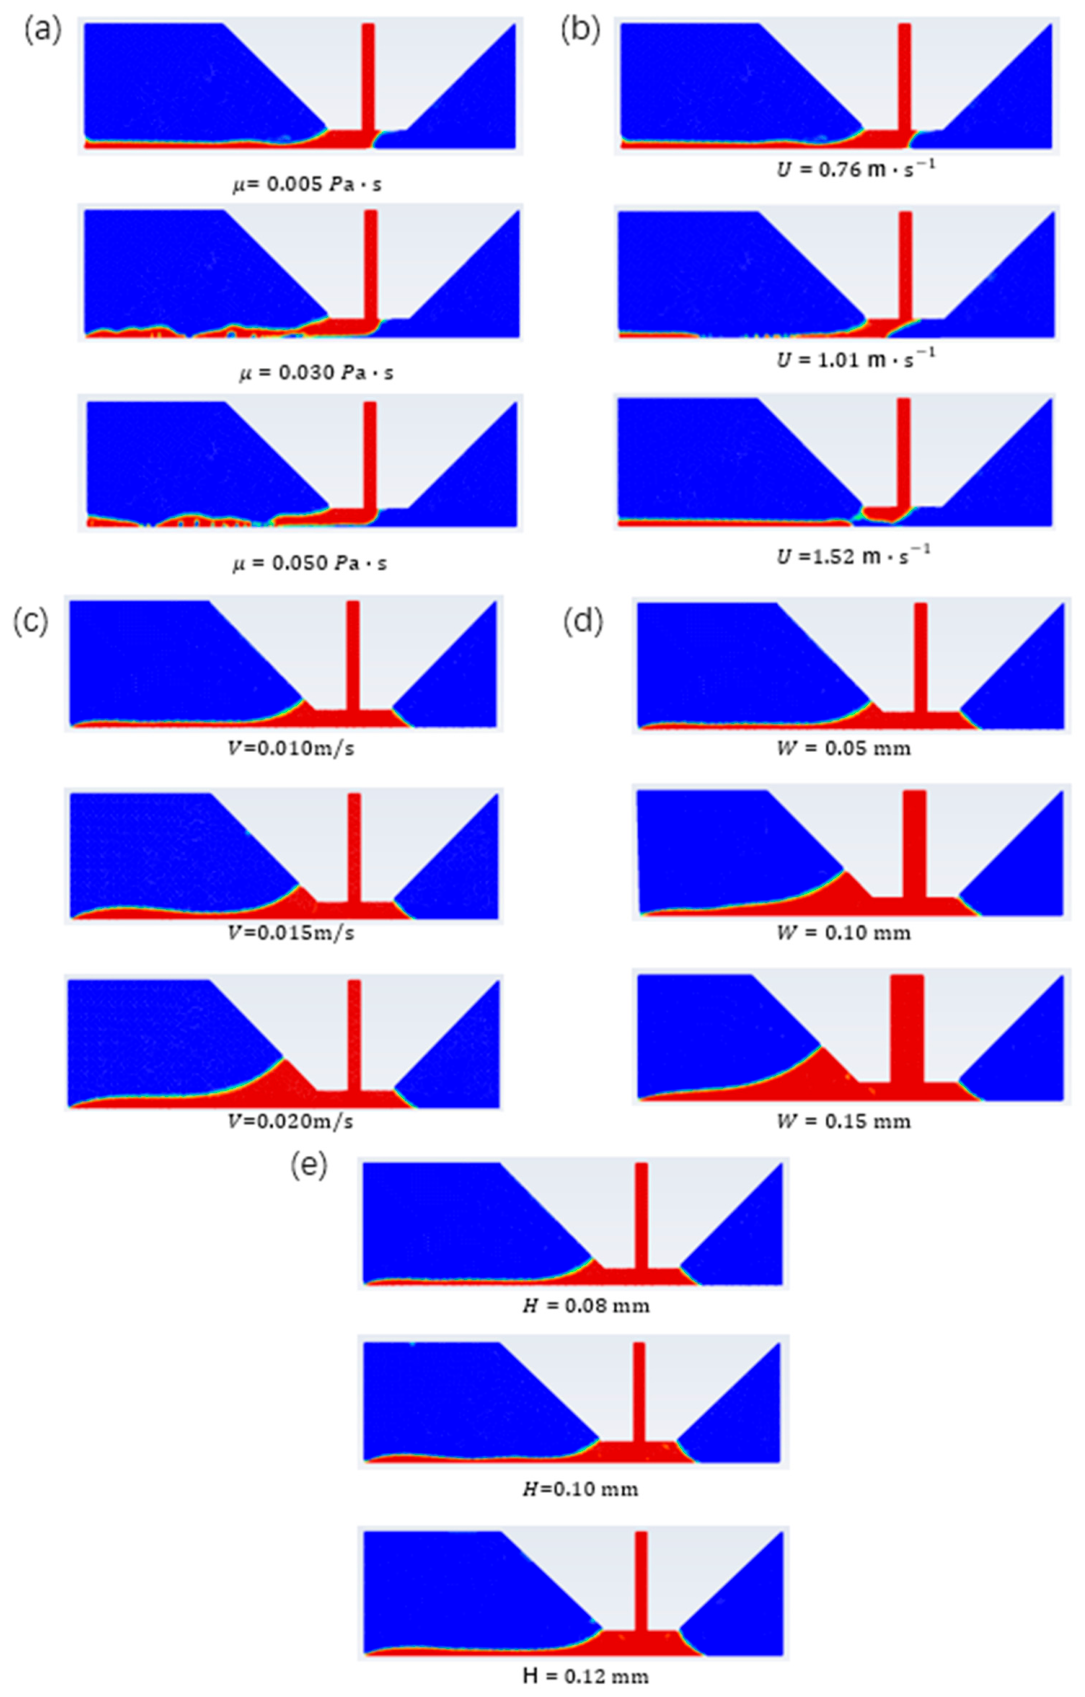
To systematically investigate the influence of key process parameters, we examine coating liquid viscosity, substrate moving speed, inlet flow velocity, slot gap, and coating gap. The results are summarized in Figure 4, with panels (a)–(e) corresponding to each parameter.
Figure 4.
Liquid phase distribution nephograms under different process parameters (the blue area represents air, and the red region denotes the coating liquid): (a) coating liquid viscosity; (b) substrate moving speed; (c) inlet flow velocity; (d) slot gap; (e) coating gap.
Effect of coating liquid viscosity (Figure 4a). Under fixed parameters (V = 0.38 m/s, U = 0.76 m/s, W = 0.05 mm, H = 0.08 mm, and θ = 45°), at low viscosity (0.005 Pa·s), the capillary number Ca is small, capillary forces dominate, and the coating liquid is drawn inward by capillary contraction, resulting in a concave upstream meniscus. As the viscosity increases to 0.03 Pa·s, the viscous force strengthens and reaches a relative equilibrium with the capillary force, and the upstream meniscus gradually becomes convex. The capillary number Ca is defined in Equation (2):
where μ is the coating liquid viscosity (Pa·s), U is the substrate moving speed (m/s), and σ is the surface tension coefficient of the fluid (N/m).
As viscosity increases, the upstream contact line gradually shifts downstream. At low viscosity, mm, μm, and the film thickness uniformity is 96.96%. At high viscosity, = 0.0169 mm, approaching the die lip, which leads to bubble defects and coating breakage. The downstream contact line climbing height remains around 0.0079 mm, and the liquid film thickness remains relatively stable.
Effect of substrate moving speed (Figure 4b). At μ = 0.005 Pa·s, varying U modulates Ca similarly to viscosity. As U increases, Ca increases and the viscous force strengthens, causing the upstream meniscus to gradually change from concave to convex. At U = 0.76 m/s, the upstream contact line is far from the die lip, with = 0.0562 mm, = 0.0079 mm, the meniscus stable and the film thickness uniform. At U = 1.52 m/s, Ca becomes excessively large, the upstream contact line clings to the die lip, = 0.0083 mm, the flow field destabilizes, and a coating breakage defect occurs. The downstream contact line climbing height drops from 0.0079 mm to 0.0008 mm with increasing U, and the liquid film thickness decreases correspondingly.
Effect of inlet flow velocity (Figure 4c). Fixed μ = 0.005 Pa·s and U = 0.03 m/s, varying V shows no significant effect on Ca; the shape of the upstream meniscus remains essentially stable, and the upstream contact line position remains at around 0.1660 mm. However, the downstream contact line climbing height increases from 0.0504 mm to 0.1284 mm, and the wet film thickness increases from 24.64 μm to 39.70 μm; consequently, the film thickness uniformity decreased from 91.74% to 74.26%. As the inlet flow velocity increases, the liquid supply per unit time increases, liquid accumulates downstream of the die, and the film becomes thicker with greater thickness fluctuations. Excessive tends to induce localized edge thickening defects, affecting film formation quality.
Effect of slot gap (Figure 4d). Under fixed μ = 0.005 Pa·s, H = 0.08 mm, and U = 0.03 m/s, varying W shows that as W increases, the flow resistance of the liquid within the slot decreases, flow becomes more abundant, and the downstream contact line climbing height increases from 0.0504 mm to 0.1672 mm. The wet film thickness increases from 24.64 μm to 45.16 μm, the film thickness uniformity decreases to 63.48%, and edge thickening defects become more severe. The upstream contact line position remains essentially stable (0.1657–0.1622 mm), with no defects such as air entrainment or flow instability. This indicates that the slot gap affects the downstream meniscus morphology and film thickness primarily by altering the liquid supply, while having no significant effect on the stability of the upstream meniscus.
Effect of coating gap (Figure 4e). Under fixed μ = 0.005 Pa·s, W = 0.05 mm, and U = 0.03 m/s, varying H shows an opposite trend. As H increases, the space between the die and the substrate expands, providing greater room for liquid spreading. The downstream contact line climbing height decreases from 0.0504 mm to 0.0071 mm, and the wet film thickness decreases from 24.64 μm to 15.98 μm. The upstream contact line position fluctuates within a narrow range (0.1657–0.1500 mm), remaining generally stable. However, when H becomes excessively large, the constraining effect of the die on the liquid weakens, the flow field is prone to destabilization, and flow instability defects may occur, resulting in insufficient film thickness and reduced uniformity. Therefore, the coating gap must be controlled within a reasonable range to balance film thickness and coating stability.
3.2. Effect of Pre-Coating Liquid Volume on Film Thickness Uniformity
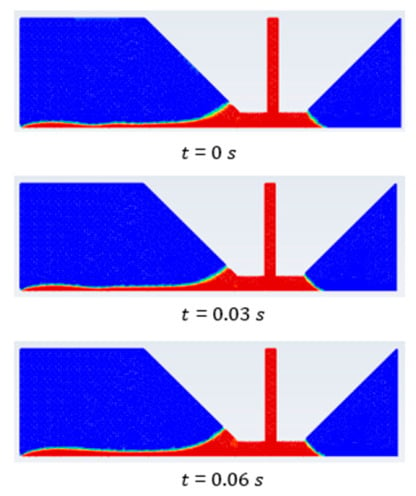
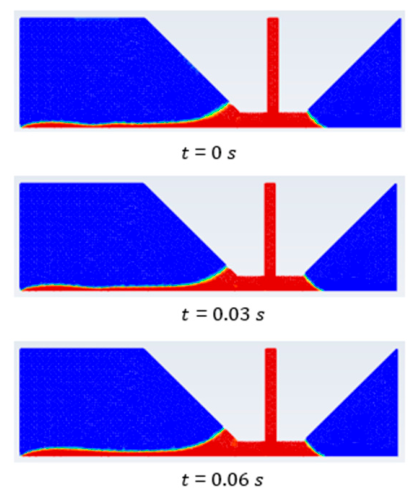
Based on the three defined stages, the regulation effect of pre-coating liquid volume on film thickness uniformity is investigated. Pre-coating liquid volume is defined as the volume of liquid pre-filled in the gap between the die and the substrate before coating begins, characterized by the during the pre-coating stage. Fixed parameters: W = 0.05 mm, H = 0.08 mm, μ = 0.005 Pa·s, V = 0.01 m/s, U = 0.03 m/s. Results are shown in Figure 5.
Figure 5.
Liquid phase distribution nephogram under different pre-coating liquid volumes (the blue area represents air, and the red region denotes the coating liquid).
In the 2D model, the pre-coating liquid volume is given by
where is the inlet velocity, is the liquid supply time during the pre-coating stage, and is the slot width (shim thickness).
To quantitatively evaluate film thickness uniformity, the uniformity coefficient is introduced, and all film thickness uniformity values mentioned in this paper are calculated according to the formula. The average thickness is calculated as (Equation (4)):
where is the film thickness at the i-th measurement point, and k is the number of measurement points.
The standard deviation δ of the film thickness is calculated using Equation (5):
Substituting Equations (3) and (4) into Equation (5) yields the film thickness uniformity coefficient :
The simulation results show that as the pre-coating liquid volume increases, the film thickness uniformity first improves and then deteriorates. When t increases from 0 to 0.03 s, the uniformity improves from 89.4% to 93.5%. When t = 0.06 s, the pre-coating liquid volume becomes excessive, liquid accumulates downstream of the die, increases from 0.0362 mm to 0.0575 mm, the film thickness increases to 31.22 μm, and uniformity declines. Based on the simulation results, the proportion N of pre-coating liquid volume to total coating volume is identified as the core regulatory parameter, defined in Equation (7):
where L is the substrate length (L = 2 mm in the simulation). When N= 31%, the time required for the film thickness to reach a steady state is minimized, coating efficiency is improved, film thickness uniformity is optimal, and no significant start-up defects or edge thickening defects are observed. This 31% volume ratio is only an empirical optimum value derived under the fixed simulation parameter set and cannot be extended to arbitrary coating conditions.
4. Experiments
4.1. Experimental Equipment and Materials
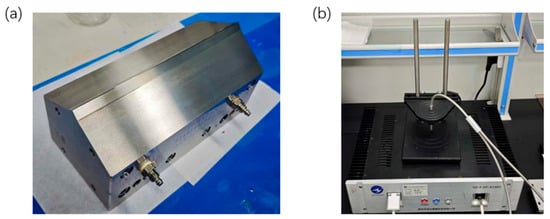
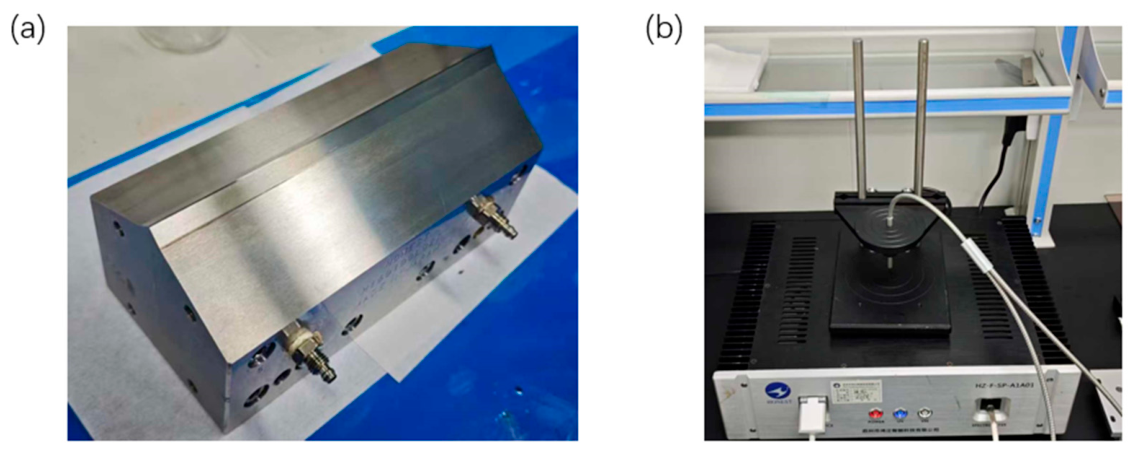
In this work, a 160-type slot-die coating head with an effective coating width of 100 mm was adopted for all coating experiments. Clean glass substrates with a dimension of 100 mm × 100 mm were uniformly utilized throughout the film-forming tests. The dry film thickness after curing was characterized by a chromatic confocal optical thickness meter (Model HZ-F-SP-A1A01, Suzhou Hongzheng Intelligent Technology Co., Ltd., Suzhou, China), and the physical photos of the complete testing setup are displayed in Figure 6. A photoresist with an infinite-shear viscosity of 0.005 Pa·s was selected as the qualitative surrogate liquid, the rheological curve is shown in Supplementary Figure S2. A comprehensive comparison of key parameters between this photoresist and perovskite precursor ink are summarized in Table 2. Multiple groups of gradient process parameters were designed for comparative experiments, aiming to verify the meniscus dynamic evolution laws and the variation tendency of film thickness uniformity predicted by numerical simulations. Three independent parallel substrates were fabricated under each coating condition to guarantee experimental repeatability and support subsequent statistical analysis. It should be clarified that the photoresist only mimics the hydrodynamic behavior of the wet fluid during coating, and it cannot reproduce solvent evaporation, ionic crystallization or optoelectronic properties of the real perovskite precursor solution.
Figure 6.
Experimental apparatus. (a) A 160-type slot-die coating die. (b) Laser confocal thickness measuring device.
Table 2.
Comparison of key parameter between perovskite precursor ink and photoresist surrogate liquid (all coating conditions maintain Reynolds numbers below 0.05, forming viscous- and capillary-dominated laminar flow where density-dependent inertial effects are negligible).
4.2. Experimental Procedure
Coating experiments are conducted using the process parameters optimized through simulation (W = 0.05 mm, H = 0.08 mm). The treated glass substrate is fixed on a marble platform, ensuring parallelism between the substrate and the die to eliminate the influence of equipment deviation on film formation quality.
A high-precision syringe pump is adopted to regulate the inlet liquid delivery rate. Five groups of pre-coating liquid volumes (0 μL, 30 μL, 70 μL, 90 μL, 140 μL) are arranged to explore their influences on film-forming performance. After completing the pre-coating filling procedure, we set the marble table moving speed (namely substrate translation speed U) and the volumetric coating flow rate Q of the syringe pump, and then launch the slot-die coating operation. The whole coating procedure is performed under strictly controlled ambient conditions (25 °C temperature, 40% relative humidity) to reduce external environmental disturbances to liquid film formation. All coated samples are naturally air-dried at room temperature after coating treatment.
Film thickness characterization is implemented by the chromatic confocal optical thickness meter (Model HZ-F-SP-A1A01). The instrument features a thickness resolution of ±0.01 μm, and the relative standard deviation of repeated measurement on the same film position is below 1.2%. Its measurement principle relies on splitting white light into monochromatic beams with distinct focal lengths through a dispersion lens; the system calculates film thickness by analyzing the wavelength difference in reflected signals from the top and bottom surfaces of the film. For each individual glass substrate, 36 uniform measuring points are evenly distributed along the X coating direction to collect thickness data, and the collected datasets are further used to compute the film thickness uniformity coefficient.
4.3. Experimental Results
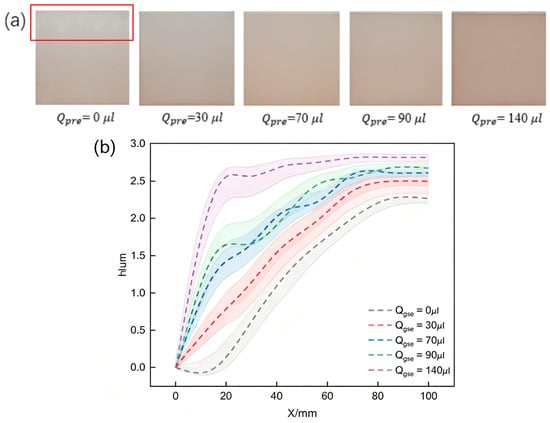
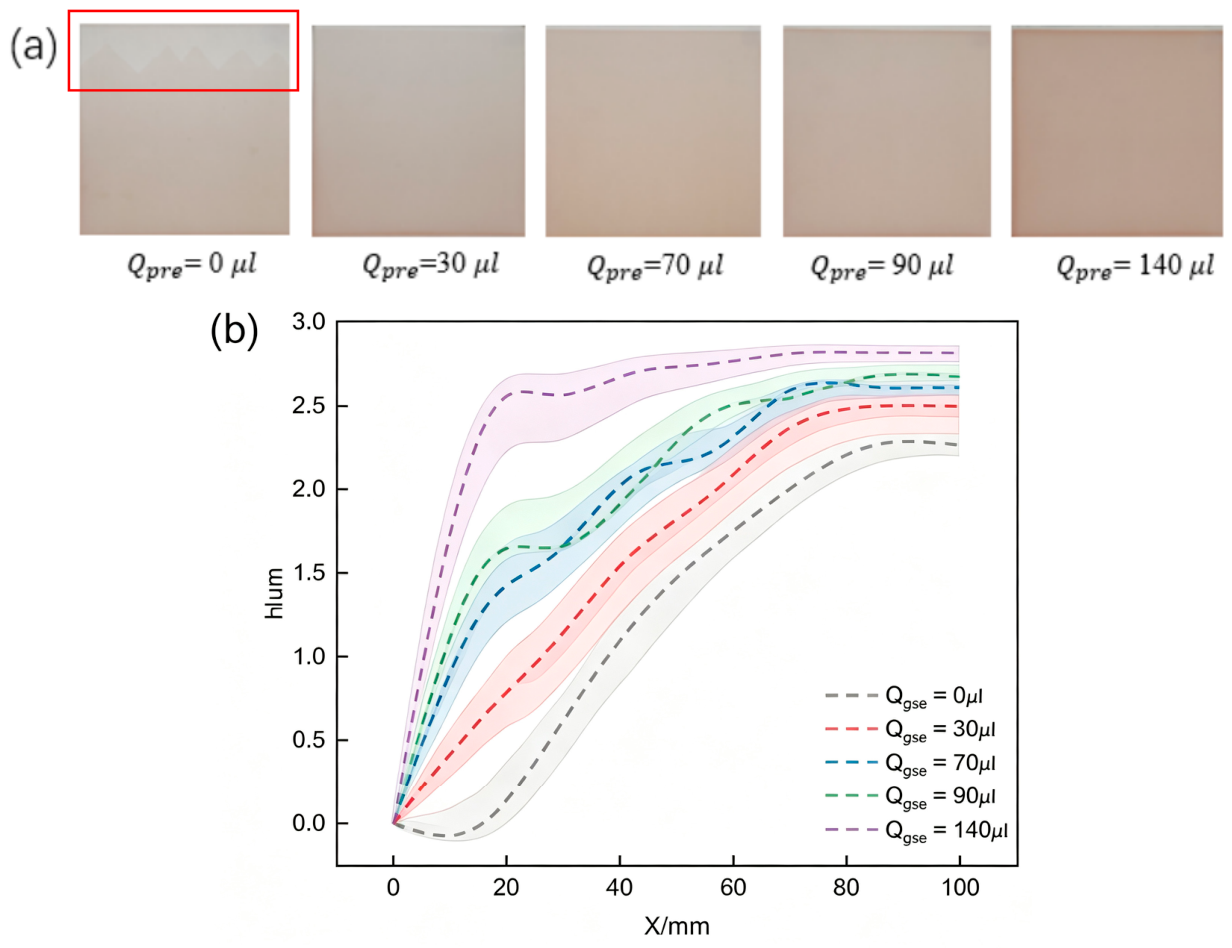
With the coating flow rate fixed at Q = 15 μL/s and substrate moving speed at U = 0.005 m/s, the film-forming performance and film thickness distribution under various pre-coating liquid volumes are displayed in Figure 7; the full quantitative statistics for the three replicate samples plotted in Figure 7b are provided in Table 3. The experimental results demonstrate that no pre-coating liquid leads to insufficient liquid supply at the coating starting segment and the occurrence of dry spots (the red-framed areas in Figure 7a). When the pre-coating liquid volume is 30 μL, the uniformity of the starting segment is improved. At a pre-coating volume of 70 μL, the film thickness at the rear end is 0.27 μm larger than that at the front end, with a thickness uniformity coefficient of 88.44%. Increasing the pre-coating volume to 90 μL greatly enhances film uniformity without visible coating defects. The optimal film quality is obtained at a pre-coating volume of 140 μL, which represents the best-performing value within the evaluated stable coating window, where the uniformity coefficient peaks at 93.97%.
Figure 7.
Experimental results of slot-die coating. (a) Experimental samples with different pre-coating liquid volumes (As the pre-coating volume rises, the front-rear film thickness on the glass slide becomes more uniform, reflected by a more consistent color shade). (b) Film thickness distribution under different pre-coating liquid volumes (the shaded bands represent ±1 standard deviation of thickness data from three parallel repeated samples, which visually reflect measurement dispersion and experimental repeatability).
Table 3.
Quantitative statistical results of three parallel coating samples under different pre-coating volumes.
Based on the experimental parameters, the optimal pre-coating liquid volume proportion is calculated. The glass substrate length L = 100 mm, coating flow rate Q = 15 μL/s, and substrate moving speed U = 0.005 m/s. The total coating time T is given by Equation (8):
Substituting into Equation (9), the coating volume is:
Substituting into Equation (10), the total coating volume on the entire glass substrate is:
where is the pre-coating liquid volume (μL).
The optimal pre-coating liquid proportion N is given by Equation (11):
To verify the process universality of this proportion, experimental groups with different inlet flow rates are established (Q = 10 μL/s, Q = 12 μL/s). For Q = 10 μL/s, the optimal pre-coating liquid volume is 90 μL, and the optimal proportion is 31.03%. For Q = 12 μL/s, the optimal pre-coating liquid volume is 108 μL, and the optimal proportion is 31.03%. Under different inlet flow rates, the optimal proportion of pre-coating liquid volume to total coating volume remains stable at approximately 31% only within the limited flow rate range designed in this experiment; this value cannot be regarded as a universal optimal ratio applicable to all slot-die coating working conditions.
5. Conclusions
Through numerical simulation and experimental verification, this study systematically investigates the effect of meniscus characteristics on film formation quality in the slot-die coating process for perovskite solar cells. The following core conclusions are drawn:
- The morphological transition of the upstream meniscus is essentially governed by a critical change in the capillary number Ca. When Ca is small, capillary forces dominate, and the meniscus is concave. When Ca exceeds a critical value, viscous forces dominate, and the meniscus becomes convex. Viscosity and substrate moving speed regulate this morphological transition by modulating Ca, but this morphological change has a limited impact on film thickness uniformity.
- Inlet flow velocity, slot gap, and coating gap mainly affect the downstream contact line climbing height . There is a positive correlation between downstream contact line climbing height and wet film thickness, when exceeds 0.10 mm, the uniformity coefficient drops below 80%, establishing a quantitative criterion for defect prediction that has not been previously reported. The closer the upstream contact line is to the die lip, the more prone the coating is to destabilization, leading to air entrainment and flow instability defects.
- The pre-coating liquid volume significantly regulates film thickness uniformity. The optimal pre-coating liquid volume is approximately 31% of the total coating volume under the specific experimental and simulation conditions adopted in this study, which effectively improves the uniformity of the starting segment and suppresses edge thickening and streak defects.
6. Limitations and Future Outlook
This study adopted photoresist as a surrogate liquid, which cannot reproduce solvent evaporation and crystallization of real perovskite ink; the 31% optimal pre-coating ratio was only verified under limited working conditions, and the numerical model used fixed static contact angle without solvent evaporation coupling. In addition, only film thickness uniformity was characterized, lacking microscopic and optoelectronic tests of authentic perovskite films.
Subsequent research will build a low-humidity glovebox equipment and use real perovskite precursor for full tests. Optical microscopy, SEM, XRD and UV–Vis absorption tests will be carried out to characterize film microstructure, combined with photovoltaic device performance measurements to further verify the universality of the 31% pre-coating volume proportion. Meanwhile, dynamic contact angle and evaporation modules will be added to optimize the simulation model.
Supplementary Materials
The following supporting information can be downloaded at https://www.mdpi.com/article/10.3390/coatings16080986/s1. Figure S1. Steady shear rheological curve of perovskite precursor ink and Carreau model fitting result. Figure S2. Steady shear rheological curve of photoresist and corresponding fitting results of the Carreau model.
Author Contributions
Conceptualization, Y.C., and H.H.; methodology, Y.C.; software, Y.C.; validation, Y.C.; formal analysis, Y.C.; investigation, Y.C.; resources, H.H.; data curation, Y.C.; writing—original draft preparation, Y.C.; writing—review and editing, H.H.; visualization, Y.C.; supervision, H.H.; project administration, H.H. All authors have read and agreed to the published version of the manuscript.
Funding
This work was supported by the Key Research and Development Program of Shaanxi Province (Characteristic Industry Innovation Chain Project, Grant No. 2024QY2-GJHX-29) and the Key Research and Development Program of Shaanxi Province (General Project, Grant No. 2025CY-YBXM-110).
Institutional Review Board Statement
Not applicable (this study did not involve humans or animals).
Informed Consent Statement
Not applicable.
Data Availability Statement
The data presented in this study are available on request from the corresponding author. The data are not publicly available due to privacy restrictions.
Conflicts of Interest
The authors declare no conflicts of interest.
Abbreviations
The following abbreviations are used in this manuscript:
| VOF | Volume of fluid |
| PSC | Perovskite solar cell |
| Ca | Capillary number |
References
- Cui, D.; Wang, Y. China’s progress of perovskite solar cells in 2019. Sci. Bull. 2020, 65, 1306–1315. [Google Scholar] [CrossRef] [Scilit]
- Xu, Z.T.; Lin, J.; Huang, J.S. Review on preparation technology of large-area perovskite solar cell thin films. Chin. J. Lumin. 2025, 46, 98–109. [Google Scholar] [CrossRef] [Scilit]
- Zafoschnig, L.A.; Nold, S. The race for lowest costs of electricity production: Techno-economic analysis of silicon, perovskite and tandem solar cells. IEEE J. Photovolt. 2020, 10, 1632–1641. [Google Scholar] [CrossRef] [Scilit]
- Lee, D.K.; Park, N.G. Materials and methods for high-efficiency perovskite solar modules. Sol. RRL 2022, 6, 2100455. [Google Scholar] [CrossRef] [Scilit]
- Huang, Q.F.; Huang, Z.H. Analysis of coating quality defects of slot extrusion coating. Mod. Manuf. Technol. Equip. 2020, 56, 158–159. [Google Scholar] [CrossRef]
- Schmidt, T.M.; Larsen-Olsen, T.T.; Carlé, J.E.; Angmo, D.; Krebs, F.C. Upscaling of perovskite solar cells: Fully ambient roll processing of flexible perovskite solar cells with printed back electrodes. Adv. Energy Mater. 2015, 5, 1500569. [Google Scholar] [CrossRef] [Scilit]
- Lin, C.F. Operating windows of slot die coating: Comparison of theoretical predictions with experimental observations. Adv. Polym. Technol. 2010, 29, 31–44. [Google Scholar] [CrossRef] [Scilit]
- Ahn, G.W.; Lee, H.S. Effect of upstream meniscus shape on dynamic wetting and operating limits of Newtonian coating liquids in slot coating bead flows. J. Coat. Technol. Res. 2018, 15, 1067–1076. [Google Scholar] [CrossRef] [Scilit]
- Malakhov, R.; Tjipto Widjojo, K.; Schunk, P.R. Mechanics of the low-flow limit in slot-die coating with no vacuum. AIChE J. 2019, 65, e16593. [Google Scholar] [CrossRef] [Scilit]
- Maier, L.; Briesen, H.; Nasato, D.S. Viscosity driven variations in slot die coating of nanocellulosic barrier layers. AIChE J. 2025, 71, e70041. [Google Scholar] [CrossRef]
- Kim, M.; Noh, J.; Cho, G.; Jo, J.; Lee, C. Predicting Quality of Coated Layer Based on Meniscus Features Associated with Thickness for Sustainable Roll-to-Roll Processes. Int. J. Precis. Eng. Manuf.-Green Technol. 2025, 12, 813–828. [Google Scholar] [CrossRef] [Scilit]
- Pan, S.F.; Chen, J.N.; Wei, Y.K.; Wu, C.Y.; Jia, J.M.; Yao, K. Simulation Analysis of the Influence of Operating Parameters on the Pressure Profile in the Coating Bead. Coatings 2024, 14, 1413. [Google Scholar] [CrossRef] [Scilit]
- Jung, H.W.; Ji, H.S.; Ahn, W.G.; Kwon, I. Operability limits for non-Newtonian liquids in dual-layer slot coating processes using the viscocapillary mode. J. Coat. Technol. Res. 2021, 18, 1127–1138. [Google Scholar] [CrossRef] [Scilit]
- Shim, R.; Nishikubo, R.; Pylnev, M.; Ishiwari, F.; Wakamiya, A.; Saeki, A. Bar Coating Process of Two-Dimensional Lead Iodide Perovskite Solar Cells: Effects of Vertical Orientation, Anisotropic Photoconductivity. ACS Appl. Energy Mater. 2023, 6, 9381–9389. [Google Scholar] [CrossRef] [Scilit]
- Wu, X.K. Simulation study on initial flow field of slot die coating for lithium-ion battery slurry. Chin. J. Power Sources 2018, 42, 500–503. [Google Scholar]
- Schmitt, M.; Baunach, M. Slot-die processing of lithium-ion battery electrodes—Coating window characterization. Chem. Eng. Process. Process Intensif. 2013, 68, 32–37. [Google Scholar] [CrossRef] [Scilit]
- Hong, H.B.; Zhang, H.K. Numerical simulation of fluid flow pattern in slot die coating process. Adv. Text. Technol. 2025, 33, 75–82. [Google Scholar]
- Lang, M.Q.; Yang, J.; Zhang, Z.C.; Peng, J.L.; Yang, X.L. Design optimization of slot die wide coating die for lithium-ion battery electrode. Energy Storage Sci. Technol. 2025, 14, 2339–2351. [Google Scholar] [CrossRef]
- Chen, Y.X.; Yang, J.M.; Lian, C.; Liu, X.L. Analysis of stable coating window for lithium battery electrode slurry based on phase field model. Energy Storage Sci. Technol. 2023, 12, 2185–2193. [Google Scholar] [CrossRef]
- Romero, O.J. Low-flow limit in slot coating of dilute solutions of high molecular weight polymer. J. Non-Newton. Fluid Mech. 2004, 118, 137–156. [Google Scholar] [CrossRef]

Disclaimer/Publisher’s Note: The statements, opinions and data contained in all publications are solely those of the individual author(s) and contributor(s) and not of MDPI and/or the editor(s). MDPI and/or the editor(s) disclaim responsibility for any injury to people or property resulting from any ideas, methods, instructions or products referred to in the content. |
© 2026 by the authors. Licensee MDPI, Basel, Switzerland. This article is an open access article distributed under the terms and conditions of the Creative Commons Attribution (CC BY) license.