


Abstract
The oxide interface on silicon carbide is a critical microstructural feature that enhances the mechanical properties of its reinforced composites; therefore, investigating the oxidation behavior and oxide layer morphology of silicon carbide is of great significance. This work systematically elucidates the oxidation behavior and oxide layer morphology evolution of silicon carbide particles within the temperature range of 1100 to 1400 °C through quantitative analysis and visual characterization. Meanwhile, based on the measurement results of mass, particle size, and atomic ratio, three semi-quantitative estimation formulas for oxide layer thickness are derived (1.214rk, 2.226Δh, and 193pH/(213-126p), respectively), providing a reference for rapid assessment of oxide layer thickness when direct and macroscopic observation means are lacking. This work provides a reference for understanding the oxidation behavior of silicon carbide particles and for related composite material research.
1. Introduction
Silicon carbide, as a ceramic phase, is widely used in composites owing to its high elastic modulus, low thermal expansion coefficient, and excellent thermal stability [1,2]. In particular, aluminum-based silicon carbide composites exhibit broad application prospects in fields such as aerospace, energy and power, and transportation [3,4]. However, in these composites, the lack of strong chemical bonds and poor wettability at the interface between aluminum and silicon carbide compromise the second-phase strengthening effect, thereby limiting the enhancement of mechanical properties [5].
The oxidation of the silicon carbide surface leads to the formation of a SiO2 film. The strong interfacial interaction between SiO2 and aluminum can effectively mitigate the above-mentioned limitations [6,7]. Consequently, the oxide layer on silicon carbide is the key factor in enhancing the performance of aluminum-based silicon carbide composites. According to the classic Deal–Grove model, SiC oxidation can be divided into a linear reaction-controlled stage and a parabolic diffusion-controlled stage, with the transition temperature between the two being closely related to the material microstructure and ambient oxygen partial pressure [8,9,10,11]. Studies have shown that below 1200 °C, the oxidation is primarily controlled by chemical reactions, forming a dense amorphous SiO2 layer; above 1300 °C, the oxide layer begins to undergo significant crystallization, and the oxidation mechanism transitions to a diffusion-controlled process, accompanied by an increase in activation energy from approximately 120 kJ/mol to about 260 kJ/mol [10,11]. This complex oxidation process, together with the combination of various phases and structures within the oxide layer, imposes complicated effects on the composite performance. Therefore, a thorough investigation of the surface oxidation behavior and oxide layer morphology of silicon carbide is urgently required.
Meanwhile, the silicon carbide powder is extremely fine and hard, making it difficult to directly and precisely measure the thickness of its surface oxide layer by conventional means. Furthermore, in industrial-scale oxidation of bulk particle batches, significant thickness variations naturally exist across different particles and surface locations. In this context, a macroscopic bulk method that provides an average oxide thickness is not only reasonable but often practically essential for process monitoring and quality control, where microscopic characterization of every individual particle is unfeasible. Therefore, there is an urgent need to develop an indirect and convenient method for estimation.
Herein, this work selects the 1100–1400 °C temperature range to fully cover this transition process, and based on preliminary results, chooses a holding time of 2 h to ensure that the variations in all major research parameters are clear and measurable. Through qualitative and quantitative analyses of phase composition, energy spectrum, and mass and particle size changes, combined with microstructural characterization, the structural evolution of the oxidation products was systematically characterized. At the same time, estimation models for oxide layer thickness based on measurement principles were established, providing multiple semi-quantitative calculation methods for the rapid assessment of the silicon carbide oxide layer.
2. Materials and Methods
Material: The material employed was silicon carbide powder with a particle size of 2 μm, obtained from McLean (Clermont, FL, USA).
Method: We placed 1 g of silicon carbide powder into a ceramic crucible and placed it in the heating zone in the middle of a muffle furnace. We heated it at 20 °C/min to 1100, 1200, 1300, and 1400 °C, and kept it at each temperature for 2 h, followed by air cooling.
Characterization: We used X-ray diffraction (XRD, Rigaku, Ultima IV, Tokyo, Japan) for phase analysis. We then performed elemental analysis using an energy-dispersive spectrometer (EDS, Zeiss, Sigma 300, Oberkochen, Germany). The sample mass was weighed using a high-precision balance with a range of 50 g and an accuracy of 0.0001 g (average of five experiments). A laser particle size analyzer (Beckman Coulter, LS 13 320 XR, Brea, CA, USA) was used for particle size analysis. We observed the particle morphology using scanning electron microscopy (SEM, Zeiss, Sigma 300, Oberkochen, Germany).
3. Results and Discussion
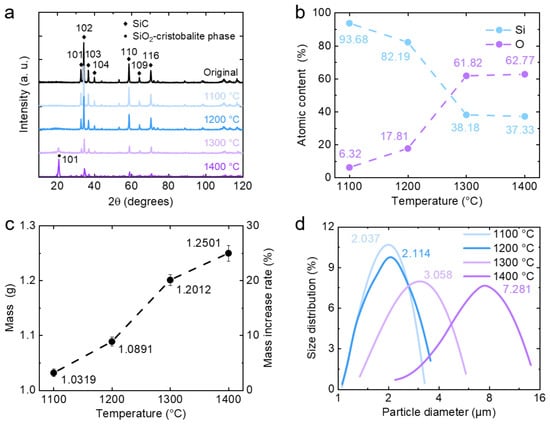
The XRD patterns of silicon carbide (SiC) powder after heat treatment at different temperatures are presented in Figure 1a. As the sintering temperature increases, the characteristic peak of SiC gradually decreases, while the characteristic peak of SiO2 increases. For the sample treated at 1200 °C, a weak and broad hump centered at approximately 21° is observed, indicating the incipient formation of amorphous SiO2. At 1300 °C, distinct characteristic peaks of SiO2 become discernible. Upon further elevation of the temperature to 1400 °C, the intensity of the SiO2 peaks continues to increase, accompanied by a marked sharpening of the peak profiles, which signifies an enhanced degree of crystallinity. The statistical results of the EDS analysis are illustrated in Figure 1b. The oxygen atom content increases significantly with temperature and stabilizes at around 62% after 1300 °C. The resulting oxygen-to-silicon atomic ratio approaches 2:1, indicating that the oxidation products are close to the stoichiometry of SiO2. The mass curve of silicon carbide powder is shown in Figure 1c. With increasing sintering temperature, the mass exhibits a monotonic increase, with the most pronounced increment observed between 1200 and 1300 °C. The curve of silicon carbide particle size is shown in Figure 1d, where the size increment increases progressively with temperature elevation.
Figure 1.
Spectrum and statistics of the oxidation behavior of silicon carbide particles. (a) XRD patterns of silicon carbide powder. As the sintering temperature increases, the characteristic peak of SiC gradually decreases, while that of SiO2 increases. (b) EDS statistics of silicon carbide powder. The ratios of oxygen atoms to silicon atoms at each temperature (1100, 1200, 1300 and 1400 °C) are 6.32%: 93.68%; 17.81%: 82.19%; 61.82%: 38.18%; and 62.77%: 37.23%, respectively. (c) Mass curve of silicon carbide powder. As the sintering temperature increases, the mass increases, with growth rates of 3.19%, 8.91%, 20.12%, and 25.01%, respectively. (d) Particle size curve of silicon carbide powder. As the sintering temperature increases, the particle size grows, with measured sizes of 2.037, 2.114, 3.058, and 7.281 μm, respectively.
Based on the above results, it can be determined that oxidation of SiC has already initiated at 1100 °C and proceeds further at 1200 °C. At this stage, however, the SiO2 layer remains too thin to exert a noticeable effect on the XRD and EDS measurements. In the temperature range of 1200–1300 °C, the extent of SiC oxidation increases substantially, with the SiO2 layer completely covering the original SiC surface, accompanied by the emergence of partial crystallization. It has been reported that the crystallization transformation of amorphous SiO2 into cristobalite can significantly reduce the diffusion coefficient of oxygen within the oxide layer, thereby suppressing the subsequent oxidation rate; this effect gradually becomes evident above 1300 °C [2]. As the temperature rises to 1400 °C, extensive crystallization of SiO2 occurs [12], resulting in a thicker and denser crystalline oxide layer that effectively impedes the inward progression of the oxidation reaction [13]. Meanwhile, new grains generated during the crystallization process bridge the oxide layers across adjacent SiC particles, forming sintering necks that lead to particle agglomeration and a sharp increase in particle size.
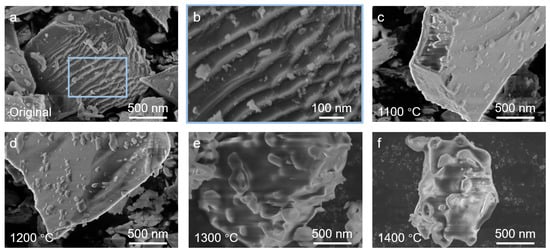
The SEM images of silicon carbide particles during the oxidation process are illustrated in Figure 2. The original particles have sharp edges and a large number of steplike structures on the surface, accompanied by debris (Figure 2a,b). Following heat treatment, as the sintering temperature increases, the original edges and steplike features gradually smooth out and disappear, while debris becomes embedded into the particle surface (Figure 2c,d). As the temperature further increases to 1300 °C, partial crystallization transformation occurs in the amorphous SiO2 within the oxide layer, leading to the formation of a granular surface morphology (Figure 2e). This observation is consistent with previous reports indicating that the oxide layer on SiC surfaces begins to undergo a phase transformation from the amorphous to the crystalline state above 1300 °C, accompanied by significant changes in the density, uniformity, and fluidity of the oxide layer [2,14]. Subsequently, when the temperature reaches 1400 °C, abnormal grain growth occurs during recrystallization, resulting in the formation of large granular structures embedded within the oxide layer (Figure 2f).
Figure 2.
SEM images of silicon carbide particles during the oxidation process. The original particles have sharp edges and numerous steplike structures on the surface, accompanied by debris (a,b). As the sintering temperature increases, the edges, steps, and debris gradually smooth out and disappear, while granular structures appear on the surface (c–f).
It is worth noting that the thin and smooth amorphous SiO2 layer formed at 1200 °C may introduce modifications in toughness and plasticity in the composite material [6]. The mixed SiO2 structure comprising both amorphous and crystalline phases, formed at 1300 °C, offers a potential avenue for microstructural tailoring in the interfacial design of composites [6]. In contrast, although the crystalline oxide layer formed at 1400 °C is denser and more robust, the volume changes and particle agglomeration effects associated with crystallization may adversely affect the dispersion uniformity of SiC particles within the matrix. Furthermore, additional attention should be paid to the thermodynamic stability of the core–shell structure. Owing to the significant mismatch in the coefficients of thermal expansion between SiC and SiO2, thermal mismatch stresses will accumulate at the interface during cooling. For thinner oxide layers (<0.3 μm) that are predominantly amorphous, such stresses can be partially relieved through viscous flow or microplastic deformation [15]; however, for thicker and highly crystallized oxide layers (e.g., those formed at 1400 °C), the brittle nature of the crystalline phase impedes stress relaxation, thereby potentially compromising the structural integrity of the oxide layer [16]. In addition to the oxidation state of SiC, the mechanical properties are also closely dependent on the microstructure of the matrix and the interfacial bonding characteristics [17]; nevertheless, this aspect lies beyond the core scope of the present work and is provided here only as a theoretical reference.
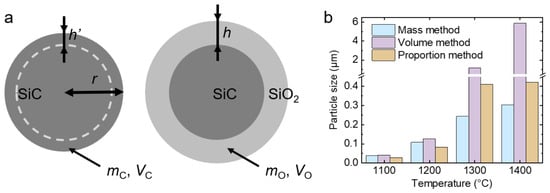
The oxide layer thickness was derived from the experimental measurements. A schematic representation of the oxide layer model is displayed in Figure 3a. The model employs an ideal spherical approximation, which facilitates the comparative evaluation of relative variation trends across different temperatures. Nevertheless, it is acknowledged that factors including particle angularity, surface roughness, and non-uniform particle size distribution may introduce deviations, and these aspects will be addressed in the Section 3 [17].
Figure 3.
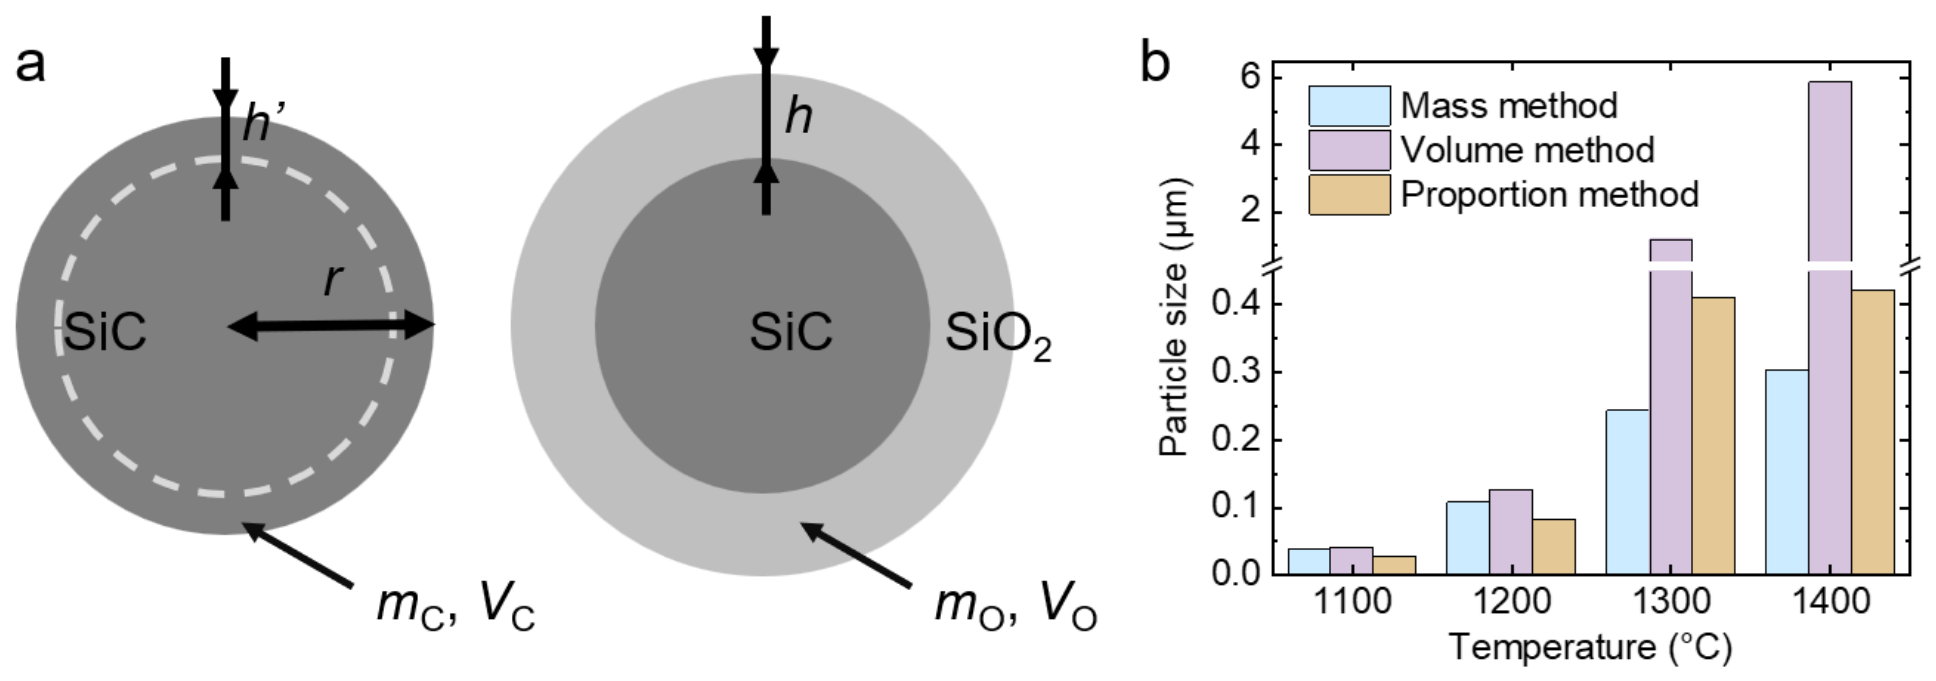
Characterization of the oxide layer thickness on silicon carbide particles. (a) Schematic diagram of the oxide layer on silicon carbide particles. (b) Statistical chart of oxide layer thickness calculations. The values calculated by the mass method are 0.039, 0.108, 0.244, and 0.304 μm, respectively. The values calculated by the volume method are 0.041, 0.126, 1.178, and 5.878 μm, respectively. The values calculated using the proportion method are 0.028, 0.083, 0.411, and 0.421 μm, respectively.
First, the calculation was performed using the mass method, with mass increment as the main parameter. The relationships among the quantity (n), total mass (m), average particle mass (ma), total surface area (S), and average particle surface area (Sa) of the original silicon carbide particles can be expressed as follows:
Approximating silicon carbide particles as spheres with a radius of r, ma and Sa can be expressed as:
After simplification, the total surface area (S) can be expressed as:
According to the chemical equation of SiC oxidation,
it can be determined that the molar ratio of SiC (MC) to SiO2 (MO) before and after the reaction is 1:1. From this, the mass and volume relationship of SiC and SiO2 participating in the reaction can be obtained:
where mC represents the mass of SiC involved in the reaction, VC represents the volume of SiC involved in the reaction, ρC represents the density of SiC, mO represents the mass of SiO2 generated in the reaction, VO represents the volume of SiO2 generated in the reaction, and ρO represents the density of SiO2. After the changes, it can be concluded that:
The thickness of SiO2, i.e., the thickness of the oxide layer (h), can be expressed as:
After substitution, h can be expressed as:
Assume that MC is 40.10 g/mol, MO is 60.09 g/mol, ρC is 3.21 g/cm3, and ρO is 2.65 g/cm3. After substitution, h can be expressed as:
where k represents the percentage increase in mass. Using Formula (10), the oxide layer thickness of silicon carbide particles sintered at 1100, 1200, 1300, and 1400 °C can be calculated to be 0.039, 0.108, 0.244, and 0.304 μm, respectively.
Subsequently, the calculation was performed using the volume method with particle size increment as the main parameter. The volume mean diameter reported by the laser diffraction particle size analyzer was adopted as the input value for the equivalent particle radius in the model. The corresponding volume thickness relationship can be obtained from the molar ratio of SiC to SiO2:
After sorting, it can be expressed as:
where Δh represents the increment of particle size. After inputting the values of each variable, it can be expressed as:
Using Formula (14), the oxide layer thickness of silicon carbide particles sintered at 1100, 1200, 1300, and 1400 °C can be calculated to be 0.041, 0.126, 1.178, and 5.878 μm, respectively.
In addition, the proportion method with atomic ratio as the main parameter obtained from energy spectrum testing can be used for calculation. The atomic ratio p of oxygen atoms nO and silicon atoms nSi measured within the testing depth H can be expressed as:
By introducing the test thickness H, test area A, and oxide layer thickness h, as well as the density and molar mass of SiO2 and SiC, the equation can be expressed as:
After the change, it is expressed as:
After entering each numerical value, it can be expressed as:
Using Formula (18), the thickness of the oxide layer on silicon carbide particles sintered at 1100, 1200, 1300, and 1400 °C can be calculated as 0.060H, 0.181H, 0.885H, and 0.907H, respectively. H can be accurately measured using standard samples and variable voltage methods, or it can be inferred from experience or other test results. Here, the average value of H is determined to be 0.464 μm based on the results obtained by the mass method. The final oxide layer thicknesses were 0.028, 0.083, 0.411, and 0.421 μm, respectively.
The statistical results obtained from the three calculation methods are presented in Figure 3b. The mass method is subject to influences from particle angularity, surface roughness, and non-uniform particle size distribution, all of which are inherent to the ideal spherical model. However, as the temperature increases and the SiC particle surfaces become progressively rounded, such influences gradually diminish. The volume method yields consistently higher values than the mass method, with the discrepancy becoming increasingly pronounced with rising sintering temperature. This observation may be attributable to particle agglomeration, particularly following the crystallization transformation of SiO2 at 1400 °C, where the change in particle size can no longer be equated to the thickening of the oxide layer on individual particles. Consequently, the volume method is more applicable to the low-to-intermediate temperature range. The proportion method, derived from EDS measurements, is subject to substantial interference from the depth distribution of elements (with a greater weighting of surface-layer atoms), thereby introducing deviations into the results. Nevertheless, both the volume-based and proportion methods are capable of circumventing the interference arising from particle morphology factors inherent in the ideal spherical model. In summary, the synergistic application of the three methods, complemented by corrections based on the specific morphology of the pristine particles and the relevant instrumental parameters, constitutes the primary task for enhancing computational accuracy in subsequent investigations. The diverse compositions, morphologies, and thicknesses of the oxide layers on SiC particles confer considerable value for further research and broad prospects for practical applications.
4. Conclusions
This work elaborates on the oxidation behavior and oxide layer morphology of silicon carbide particles at temperatures ranging from 1100 to 1400 °C through quantitative analysis and visual characterization, and estimates the average oxide layer thickness using quantitative characterization results and oxidation models. The study found that the oxidation process of silicon carbide particles proceeds slowly at 1100–1200 °C, during which the edges and steplike structures disappear, forming a thin and smooth amorphous SiO2 layer. Oxidation occurs vigorously at 1200–1300 °C, causing the oxide layer to thicken and crystallize. As a result, the particles become rounded, and recrystallized granules appear, forming a mixed structure consisting of amorphous and crystalline SiO2 phases. At 1300–1400 °C, the oxide layer further thickens and undergoes significant crystallization, which slows down the oxidation rate of the internal silicon carbide particles. The particles aggregate extensively, and the surface exhibits a crystalline SiO2 layer embedded with granules. The estimation methodology proposed in the present work provides a semi-quantitative reference for the rapid assessment of oxide layer thickness in cases where direct observational means are unavailable. Using the mass, particle size, and atomic ratio measurement results, the following calculation formulas for the oxide layer thickness were derived: 1.214rk, 2.226Δh, and 193pH/(213-126p), respectively.
Author Contributions
Conceptualization, X.Y. (Xiaotong Yin); methodology, T.Z.; software, X.Y. (Xiaotong Yin); validation, X.Y. (Xiaojuan Yin); formal analysis, R.L.; investigation, X.Y. (Xiaotong Yin); resources, T.Z.; data curation, X.Y. (Xiaojuan Yin); writing—original draft preparation, X.Y. (Xiaotong Yin); writing—review and editing, T.Z.; visualization, R.L.; supervision, T.Z.; project administration, X.Y. (Xiaotong Yin); funding acquisition, T.Z. All authors have read and agreed to the published version of the manuscript.
Funding
This research received no external funding.
Data Availability Statement
All data can be obtained from the corresponding author upon request.
Acknowledgments
The authors appreciate the support from the School of Chemistry, Beihang University.
Conflicts of Interest
The authors declare no conflicts of interest.
References
- Jiang, W.; Zhu, J.; Li, G.; Guan, F.; Yu, Y.; Fan, Z. Enhanced Mechanical Properties of 6082 Aluminum Alloy via SiC Addition Combined with Squeeze Casting. J. Mater. Sci. Technol. 2021, 88, 119–131. [Google Scholar] [CrossRef] [Scilit]
- Kwon, D.-J.; Shin, P.-S.; Kim, J.-H.; Baek, Y.-M.; Park, H.-S.; DeVries, K.L.; Park, J.-M. Interfacial Properties and Thermal Aging of Glass Fiber/Epoxy Composites Reinforced with SiC and SiO2 Nanoparticles. Compos. Part B Eng. 2017, 130, 46–53. [Google Scholar] [CrossRef] [Scilit]
- Su, N.; Su, Y.; Liu, K.; Cai, Y.; Ouyang, Q.; Zhang, D. Tailoring Mechanical Properties through Multi-Scale SiC Particle Size (Nano, Submicron, Micro) with Fixed CNT and Nano SiC in Aluminum Matrix Composites. Compos. Part A Appl. Sci. Manuf. 2026, 204, 109611. [Google Scholar] [CrossRef] [Scilit]
- Li, Z.; Wang, D.; Fu, Q.; Zhu, S.; Pan, M.; Li, B.; Kang, P.; Wu, G. The Effect of SiC Nanowires on the Mechanical Properties of Carbon Fiber Reinforced Aluminum Matrix Composites. Compos. Part A Appl. Sci. Manuf. 2026, 200, 109381. [Google Scholar] [CrossRef] [Scilit]
- So, K.P.; Jeong, J.C.; Park, J.G.; Park, H.K.; Choi, Y.H.; Noh, D.H.; Keum, D.H.; Jeong, H.Y.; Biswas, C.; Hong, C.H.; et al. SiC Formation on Carbon Nanotube Surface for Improving Wettability with Aluminum. Compos. Sci. Technol. 2013, 74, 6–13. [Google Scholar] [CrossRef] [Scilit]
- Peng, Y.; Song, M.; Li, C.; Xu, Z.; Fu, L.; Liu, L.; Liu, L.; Chen, X.; Yi, J.; Eckert, J. Strength and Ductility Synergy of SiC Reinforced Aluminum Matrix Composites through Interface Replacement Strategy. Int. J. Plast. 2025, 193, 104450. [Google Scholar] [CrossRef] [Scilit]
- Behmanesh, N.; Heshmati-Manesh, S.; Ataie, A. Role of Mechanical Activation of Precursors in Solid State Processing of Nano-Structured Mullite Phase. J. Alloys Compd. 2008, 450, 421–425. [Google Scholar] [CrossRef] [Scilit]
- Elomari, S.; Skibo, M.D.; Sundarrajan, A.; Richards, H. Thermal Expansion Behavior of Particulate Metal-Matrix Composites. Compos. Sci. Technol. 1998, 58, 369–376. [Google Scholar] [CrossRef] [Scilit]
- Biscay, N.; Henry, L.; Adschiri, T.; Yoshimura, M.; Aymonier, C. Behavior of Silicon Carbide Materials under Dry to Hydrothermal Conditions. Nanomaterials 2021, 11, 1351. [Google Scholar] [CrossRef] [Scilit] [PubMed]
- Chatillon, C.; Teyssandier, F. Thermodynamic Assessment of the Different Steps Observed during SiC Oxidation. J. Eur. Ceram. Soc. 2022, 42, 1175–1196. [Google Scholar] [CrossRef] [Scilit]
- Opila, E.J. Oxidation Kinetics of Chemically Vapor-Deposited Silicon Carbide in Wet Oxygen. J. Am. Ceram. Soc. 1994, 77, 730–736. [Google Scholar] [CrossRef] [Scilit]
- Hu, C.; Tang, S.; Pang, S.; Cheng, H.-M. Long-Term Oxidation Behaviors of C/SiC Composites with a SiC/UHTC/SiC Three-Layer Coating in a Wide Temperature Range. Corros. Sci. 2019, 147, 1–8. [Google Scholar] [CrossRef] [Scilit]
- Cai, X.; Lin, H.; Sun, Z.; Zhang, L.; Jiang, S.; Meng, N.; Wen, Z.; Feng, T.; Sun, S.; Yue, Z. Anomalous High-Temperature Oxidation Behavior of SiC Coatings on Cf/SiC Composites: Degradation Mechanisms and Microstructural Evolution from 1200 °C to 1400 °C. Compos. Part B Eng. 2025, 303, 112605. [Google Scholar] [CrossRef] [Scilit]
- Chayasombat, B.; Kato, T.; Hirayama, T.; Tokunaga, T.; Sasaki, K.; Kuroda, K. Oxidation Kinetics of Single Crystal Silicon Carbide Using Electron Microscopy. J. Ceram. Soc. Jpn. 2012, 120, 181–185. [Google Scholar] [CrossRef] [Scilit][Green Version]
- Lin, H.; Liang, W.; Miao, Q.; Qi, Y.; Zhou, S.; Jia, F.; Lan, H.; Xu, S. Investigation of the Microstructure and Oxidation Behavior of Monolayer and Bilayer ZrB2-SiC-Y2O3/SiC Coatings on C/C Composites. Surf. Coat. Technol. 2024, 487, 131007. [Google Scholar] [CrossRef] [Scilit]
- Li, X.; Ermakov, A.; Amarasinghe, V.; Garfunkel, E.; Gustafsson, T.; Feldman, L.C. Oxidation Induced Stress in SiO2/SiC Structures. Appl. Phys. Lett. 2017, 110, 141604. [Google Scholar] [CrossRef] [Scilit]
- Cho, Y.J.; Lu, K. Water Vapor Oxidation of SiC Layer in Surrogate TRISO Fuel Particles. Compos. Part B Eng. 2021, 215, 108807. [Google Scholar] [CrossRef] [Scilit]
Disclaimer/Publisher’s Note: The statements, opinions and data contained in all publications are solely those of the individual author(s) and contributor(s) and not of MDPI and/or the editor(s). MDPI and/or the editor(s) disclaim responsibility for any injury to people or property resulting from any ideas, methods, instructions or products referred to in the content. |
© 2026 by the authors. Licensee MDPI, Basel, Switzerland. This article is an open access article distributed under the terms and conditions of the Creative Commons Attribution (CC BY) license.