


Highlights
- Carbon dots were synthesized as a high-sensitivity fluorescence probe, demonstrating excellent water solubility and a specific response to copper ions.
- A feature-level fusion strategy was developed to integrate the complementary information from UV-Vis absorption and PL emission spectra.
- Combined CARS and SPA methods were used for characteristic wavelength extraction to construct a robust prediction model.
- The proposed optimized XGBoost model based on ultraviolet-fluorescence feature-level fusion achieved outstanding detection performance.
Abstract
In response to the increasingly severe issue of heavy metal pollution in water, this paper proposes a method for the robust quantitative analysis of copper ions in purified water and real water samples based on the feature-level fusion of ultraviolet-visible absorption (UV-Vis) spectra and fluorescence spectra, combined with the Extreme Gradient Boosting (XGBoost) algorithm. Specifically, this study introduces a feature-level fusion strategy to overcome the limitations of single-spectrum detection, while the optimized XGBoost algorithm is employed to model the complex non-linear relationships that are difficult to capture using traditional linear regression methods. An optimization algorithm is introduced to fine-tune the model’s hyperparameters, thereby enhancing its predictive performance. Using the coefficient of determination (R2) and root mean square error (RMSE) as evaluation metrics, rapid and accurate detection of copper ions in water is achieved. Experimental results show that, for standard solutions, the optimized XGBoost model achieves a coefficient of determination of 0.9915 and a root mean square error of 2.6663 mg/L; for actual water samples, the optimized XGBoost model achieved a coefficient of determination of 0.9892 and RMSE of 1.2738 mg/L. This demonstrates the model’s strong generalization ability in overcoming the physical limitations of optical probes. This method effectively identifies and quantifies copper ions in water samples, demonstrating good accuracy and stability.
1. Introduction
Water serves as a vital resource for sustaining life and is essential for the sustainable development of human societies. Nevertheless, numerous regions both domestically and internationally are confronting significant pollution challenges to their water resources, primarily as a result of industrial wastewater discharges [1], agricultural runoff [2], and domestic sewage [3]. Notably, contamination by heavy metals has become one of the most pressing threats to ecological integrity and human health [4], attributable to their non-degradable nature, high toxicity, and tendency to bioaccumulate within the food chain [5]. Currently, the most commonly used methods for detecting heavy metals in water samples include atomic absorption spectrometry (AAS) [6], atomic fluorescence spectrometry (AFS) [7], and inductively coupled plasma mass spectrometry (ICP-MS) [8]. Although these methods exhibit high detection accuracy, they generally suffer from issues such as complex operational procedures, time-consuming processes, and potential for secondary pollution, making them difficult to meet the demands of rapid detection and large-scale water quality monitoring. Therefore, exploring an efficient and low-cost method for detecting heavy metal ions in water is of great significance.
In recent years, advancements in optical sensing technology [9] and artificial intelligence [10] have led to a growing interest in methods that combine multispectral data with machine learning. Multispectral imaging technology offers advantages such as non-contact, non-destructive analysis, and rapid response times, demonstrating promising applications in the field of water quality detection [11]. Commonly used spectroscopic detection techniques include UV absorption spectroscopy [12] and fluorescence spectroscopy [13]. These methods offer the advantages of real-time detection and minimal contamination from chemical reagents. However, due to the limitations of individual UV absorption and fluorescence emission spectra, these techniques are susceptible to external environmental factors and other influences. Consequently, they do not fully meet the growing demands for accuracy in water samples measurement. To further enhance the measurement accuracy of water spectral analysis, multispectral information fusion technology can provide more comprehensive and accurate information by integrating the advantages of different spectral data sources.
It is noteworthy that in the field of sensing technology, many luminescent materials are utilized as sensing probes for highly sensitive fluorescent responses to target substances. A typical example is carbon dots (CDs), which are emerging in the category of carbon-based nanomaterials. CDs are zero-dimensional carbon-based nanomaterials with diameters generally below 20 nm, composed of disordered carbon-based structures [14]. They exhibit remarkable optical properties, particularly fluorescence characteristics, capable of emitting visible light under ultraviolet excitation. Due to the functionalization modification of the surface of carbon dots, they can form specific coordination interactions or electron transfer reactions with metal ions, leading to changes in their fluorescence intensity or shifts in emission wavelength [15]. This variation can be utilized to detect trace amounts of metal ions in the environment, offering high sensitivity and selectivity compared to traditional metal ion detection techniques such as atomic absorption spectrometry and inductively coupled plasma mass spectrometry. The novel sensing platform constructed based on CDs demonstrates significant technical advantages [16]. Its nanoscale structural characteristics not only simplify the detection process and reduce equipment costs but also highlight its unique value in complex application scenarios due to its excellent structural stability and anti-interference capability, combined with green chemistry characteristics such as low cytotoxicity and environmental friendliness.
Against the aforementioned research background, the primary motivation of this paper is to explore a quantitative detection technology for metal copper ions in purified water and real water samples, utilizing feature-level information fusion modeling based on UV-Vis and fluorescence spectra. Specifically, a feature-level fusion strategy is introduced to overcome the inherent limitations of single-spectrum detection, such as the Inner Filter Effects and scattering interference, which often compromise the accuracy of traditional methods. Furthermore, to accurately model the complex non-linear relationships between spectral features and copper ions, this study employs the Extreme Gradient Boosting (XGBoost) algorithm. An optimization algorithm is also incorporated to fine-tune the model’s hyperparameters, thereby enhancing its predictive performance and generalization ability. By combining two types of spectral data, feature extraction is performed using the Competitive Adaptive Reweighted Sampling (CARS) [17] method and the Successive Projections Algorithm (SPA) [18]. Finally, a fusion model is constructed using Bayesian optimization random forest (RF) [19] and the optimization algorithm XGBoost [20] to improve generalization ability and prediction accuracy. Experimental results demonstrate that this study provides an efficient and reliable technical approach for water quality monitoring, which is of great significance for environmental protection and water resource management.
2. Materials and Methods
2.1. Preparation of CDs
Accurately weigh 0.39 g of sodium citrate and 0.20 g of cysteine solids using an electronic balance(Shanghai Tianmei Scientific Instruments Co., Ltd., Minyi Road, Songjiang District, Shanghai, China), and dissolve them in 20 mL of purified water. Transfer the prepared solution to a high-pressure autoclave (generally, the filling degree should not exceed 80% of the autoclave’s volume to prevent the solution from overflowing due to volume expansion during the reaction process), and seal the autoclave. Place the autoclave in an oven (Shanghai Shu Li Instrument Co., Ltd., Hu-Yi Highway, Jiading District, Shanghai, China), heat it up to 180 °C, and maintain this temperature for 8 h. Under the high-temperature and high-pressure hydrothermal environment, the precursor undergoes hydrolysis, polycondensation, carbonization, and other processes, gradually forming carbon dots. After the reaction is complete, turn off the oven power and allow the autoclave to cool naturally to room temperature in the oven (the autoclave was allowed to cool naturally to room temperature to preserve the structural integrity of the CDs). Remove the cooled autoclave, open it, and transfer the reaction solution to a centrifuge tube. Use a centrifuge to centrifuge(Changzhou Jintan Dadi Automation Instrument Factory, Xicheng Subdistrict, Jintan District, Changzhou, China) at 12,000 r/min for 15 min to precipitate unreacted impurities and larger particles, obtaining a solution containing carbon dots. Finally, transfer the resulting solution into sample bottles to obtain quantum dots suspension.
2.2. Preparation of Cu2+ Standard Solutions
Using a standard solution of Cu2+ as the experimental sample, 2.115 g of copper chloride was accurately weighed and dissolved in purified water to prepare a 1000 mg/L Cu2+ standard solution. Subsequently, the solution was gradually diluted at a certain ratio to prepare 25 sets of Cu2+ standard solutions with concentrations ranging from 4 mg/L to 100 mg/L. This range was selected to cover the linear response region of the CDs probe and to evaluate the robustness of the spectral fusion algorithm under varying degrees of fluorescence quenching. Each sample was added with the same volume of 0.5 mL carbon dots solution. The TU-1901 dual-beam UV-visible spectrophotometer(Beijing Puxi General Instrument Co., Ltd., Pingsan Road, Pinggu District, Beijing, China) and F98 fluorescence spectrophotometer(Shanghai Lenguang Technology Co., Ltd., Jiuting Central Road, Jiuting Town, Songjiang District, Shanghai, China) were used to measure the UV and fluorescence spectral data of the 25 samples, respectively. Each sample was measured 50 times to reduce accidental errors during the measurement process and ensure the accuracy of the data. To account for the repeated measurements and avoid pseudo-replication bias, a Group 5-Fold Cross-Validation strategy was employed. The 50 spectral replicates for each of the 25 concentration levels were grouped together. The validation was performed in a Leave-One-Concentration-Out manner, where all replicates of one concentration level served as the independent test set, ensuring strict separation between training and testing data.
2.3. Spectral Data Acquisition
The 25 sets of standard solutions prepared were collected for UV-Vis absorption spectra and fluorescence emission spectra, with the blank solution serving as the reference for UV spectra collection. The parameters for UV-Vis spectra were set as follows: the spectral scanning range was between 200 and 900 nm, with an integration time of 2 ms. Based on the measured UV spectral data, significant absorption peaks were observed in the standard solution within the wavelength range of 260 to 300 nm. This indicates a good correlation between solution concentration and UV absorbance. When recording fluorescence emission spectra, the spectra were recorded at an excitation wavelength of 355 nm, with the excitation slit width set to 5 nm and the emission slit width set to 1 nm. Raman scattering and Rayleigh scattering signals may be present during fluorescence data measurement [21]. To ensure the validity and reliability of the spectra, scattering peaks should be removed from the fluorescence emission spectra.
2.4. Feature Extraction
2.4.1. Successive Projections Algorithm
The SPA is a forward feature variable selection method. SPA employs projection analysis of vectors [22] by projecting wavelengths onto other wavelengths, comparing the magnitudes of the projection vectors, and selecting the wavelength with the largest projection vector as the candidate for selection. The final feature wavelength is determined based on the correction model, which aims to identify a combination of variables that contains minimal redundant information and covariance. The brief steps of the algorithm are as follows:
Choose any one column (the j column) of the spectral matrix and assign it to the first column of the modeling set to xj, denoted as xk (0).
Denote the set of unchecked column vector positions as s.
Compute the projection of xj onto the remaining column vectors, respectively.
Extract the spectral wavelength of the maximum projection vector.
Order
n = n + 1, if n < N, the calculation is repeated in accordance with Equation (1). The final extracted variable is . Corresponding to k (0) and N in each loop, a multiple linear regression (MLR) model [23] is constructed to obtain the modeling set interaction validation root mean square error (RMSECV) for the various candidate subsets [24]. The optimal values are identified as the smallest RMSECV values corresponding to k (0) and N.
2.4.2. Competitive Adaptive Reweighting Sampling
CARS is a feature variable selection method that integrates Monte Carlo techniques with Partial Least Squares (PLS) regression coefficients to emulate the principle of “survival of the fittest” from Darwin’s theory. CARS is designed to select the most representative bands [25] in hyperspectral data by simulating biological evolution, adaptively reweighting and selecting spectral bands, and gradually eliminating redundant and unimportant bands. The method employs the absolute values of regression coefficients as weights and continuously adjusts and optimizes band selection through an iterative process, thereby retaining the bands that contribute most significantly to model predictions. The algorithm demonstrates strong stability and robustness, which can substantially enhance the model’s predictive performance while reducing data dimensionality and computational complexity.
2.4.3. XGBoost Algorithm
XGBoost is a gradient boosting algorithm that serves as an efficient implementation of Gradient Boosting Decision Trees (GBDT) [26]. It enhances the traditional gradient boosting algorithm by utilizing Newton’s method to approximate the loss function’s extremes through a second-order Taylor expansion. Additionally, a regularization term is incorporated into the objective function. During training, the objective function comprises two components: the first component represents the loss from the gradient boosting algorithm, while the second component accounts for the regularization term. The loss function is defined as follows:
where n represents the number of samples in the training dataset, l denotes the loss for a single sample, y′i is the predicted value of the model for the training sample, and yi is the true label value for that sample. The regularization term quantifies the complexity of the model:
where T represents the number of leaf nodes, ω represents the weight of the leaf, γ controls the number of leaf nodes, and λ controls the magnitude of the leaf weights (L2 regularization). The fundamental concept is to tackle the target incrementally using an additive model and a forward distribution algorithm. This approach generates multiple weak learners, whose predictions are then aggregated to form the final prediction.
2.5. Modeling
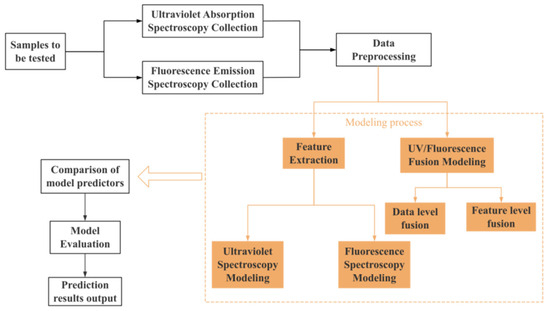
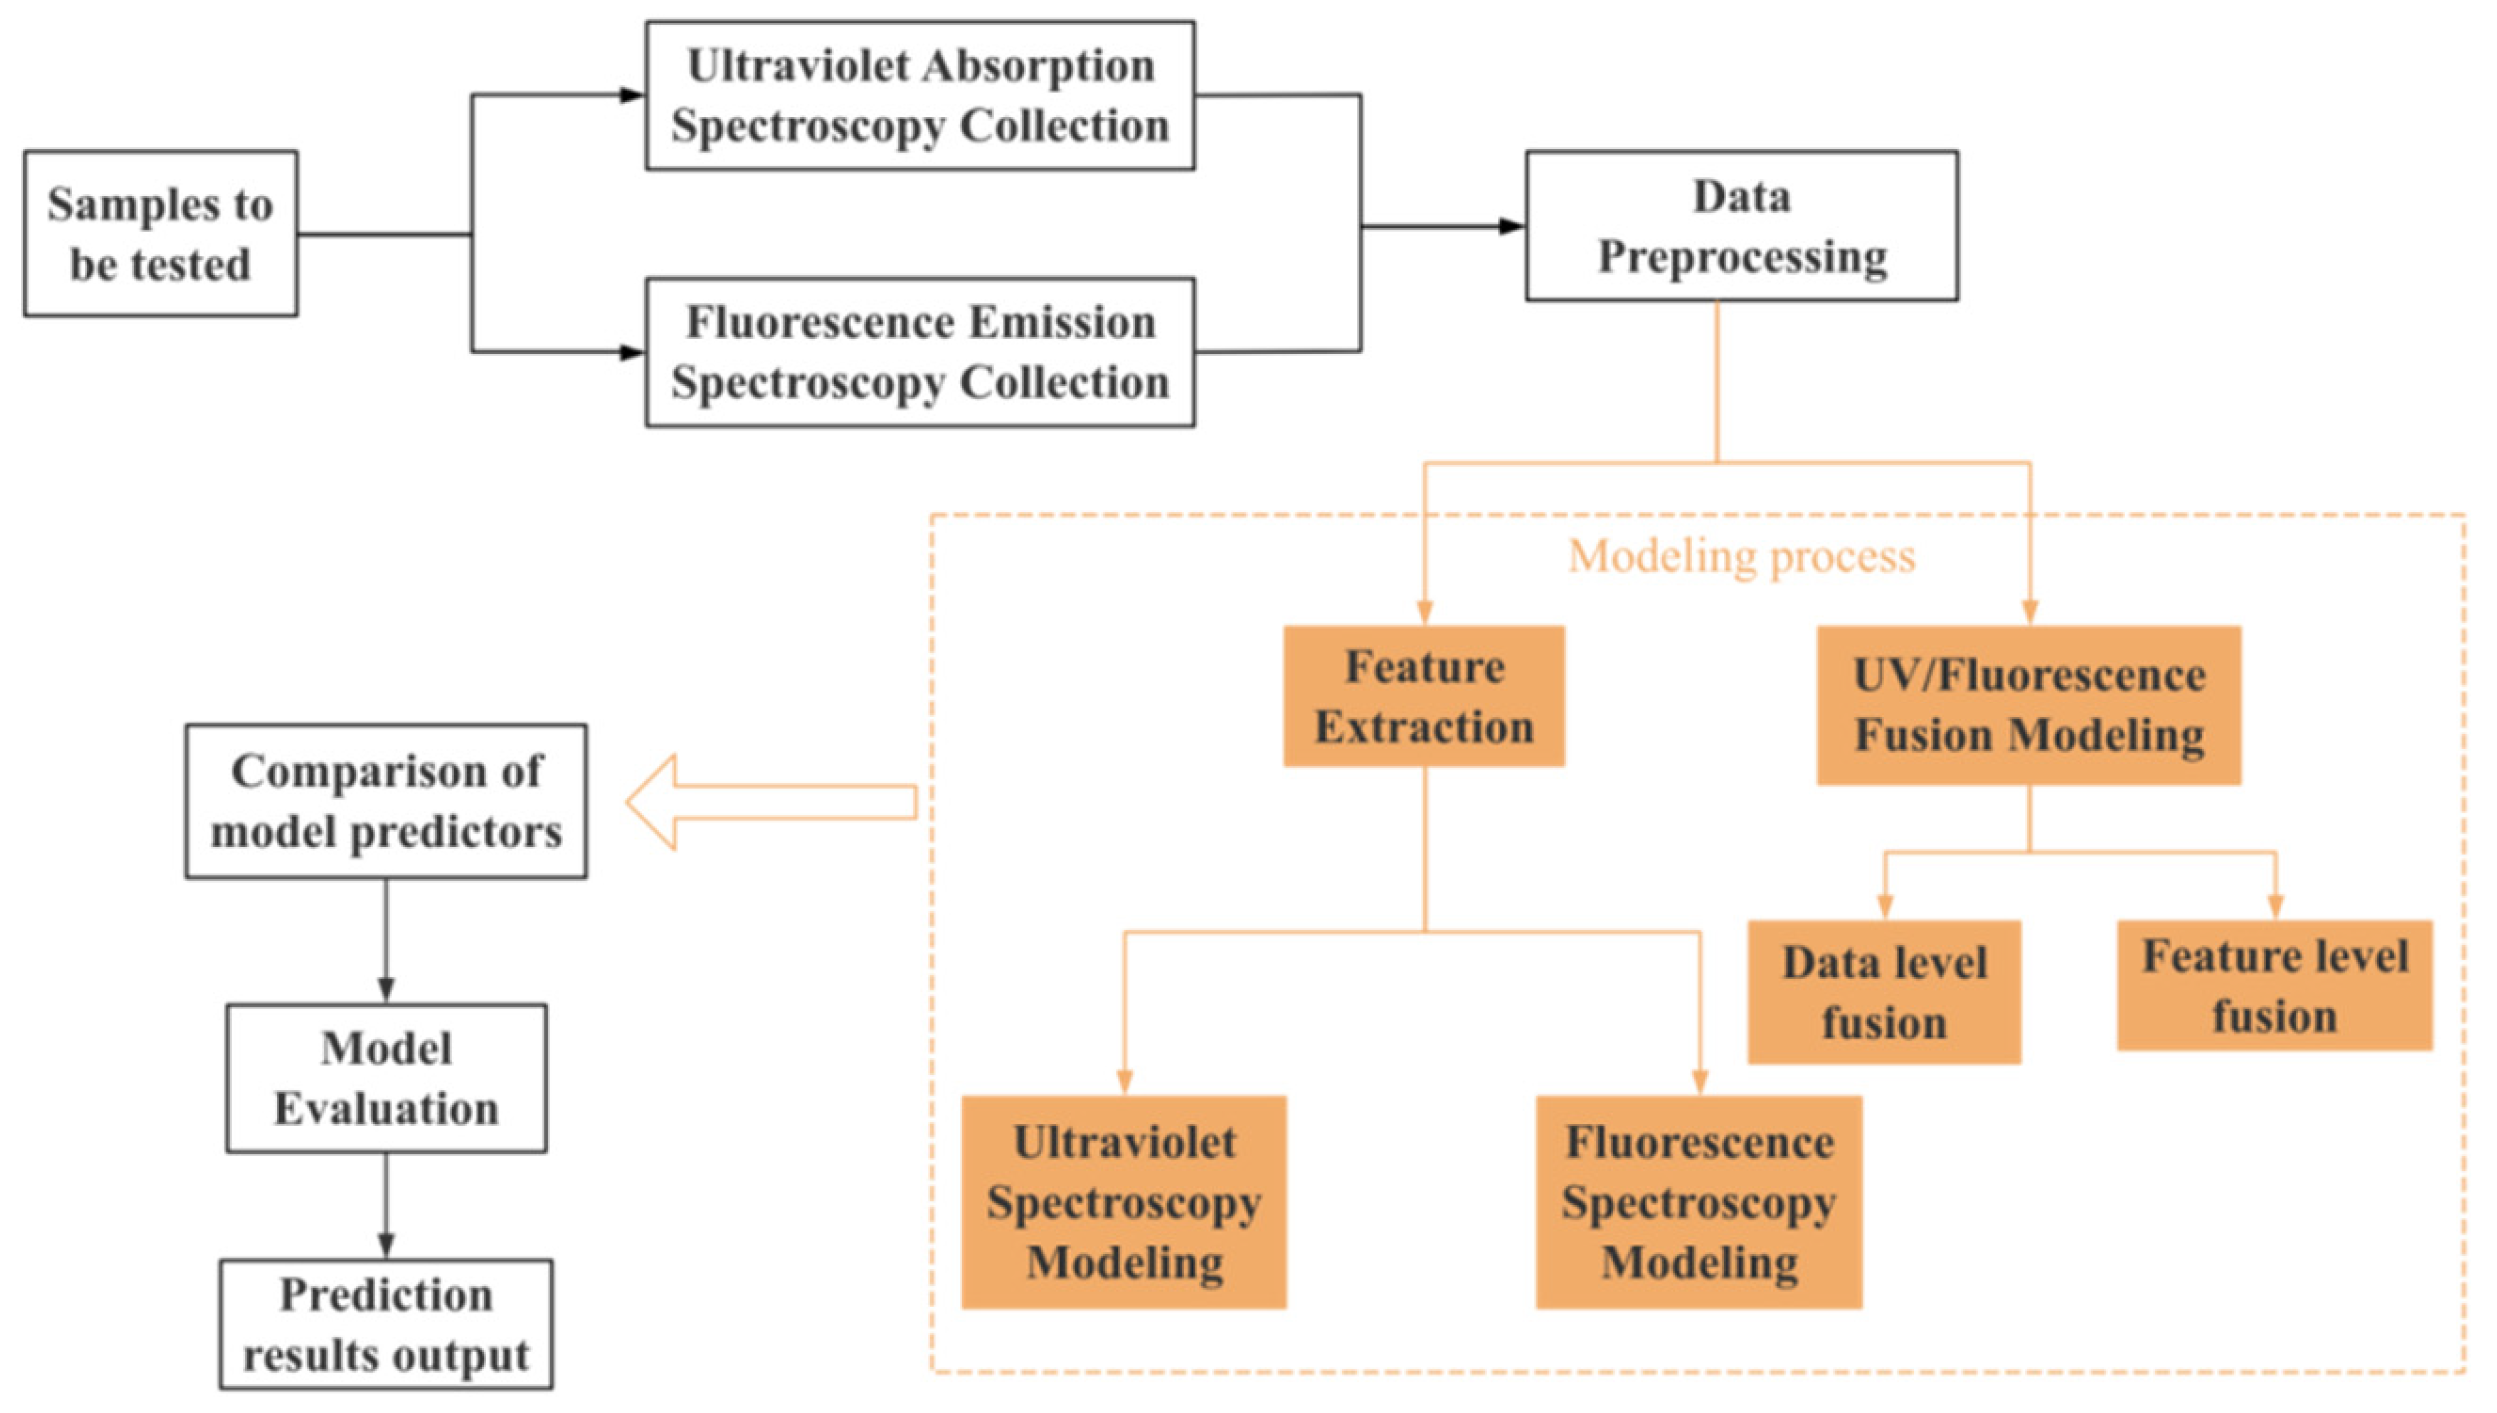
The experimental data were divided into a training set and a test set in an 8:2 ratio. During the data preprocessing stage, the Savitzky–Golay filtering method was employed to reduce noise and normalize the spectral data. For feature selection, SPA and CARS were utilized to extract spectral features. This study constructed four prediction models: one based on UV absorption spectra, one based on fluorescence emission spectra, one based on UV-fluorescence data-level fusion, and one based on UV-fluorescence feature-level fusion. All models employed the Bayesian-optimized random forest algorithm and the optimized XGBoost algorithm. By comparing and analyzing the prediction performance of each model, the optimal prediction model was ultimately identified, and its workflow is detailed in Figure 1.
Figure 1.
Flowchart of model establishment.
3. Results and Discussion
3.1. Structural Characteristics of CDs
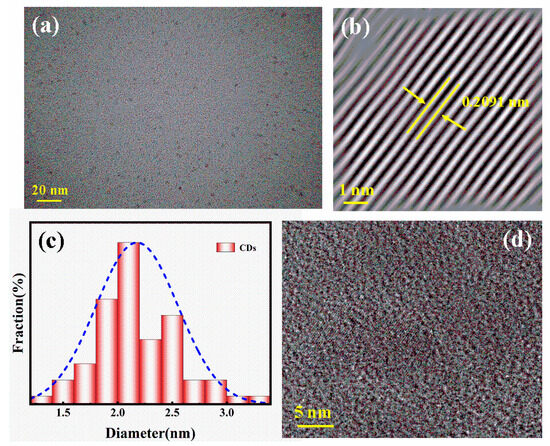
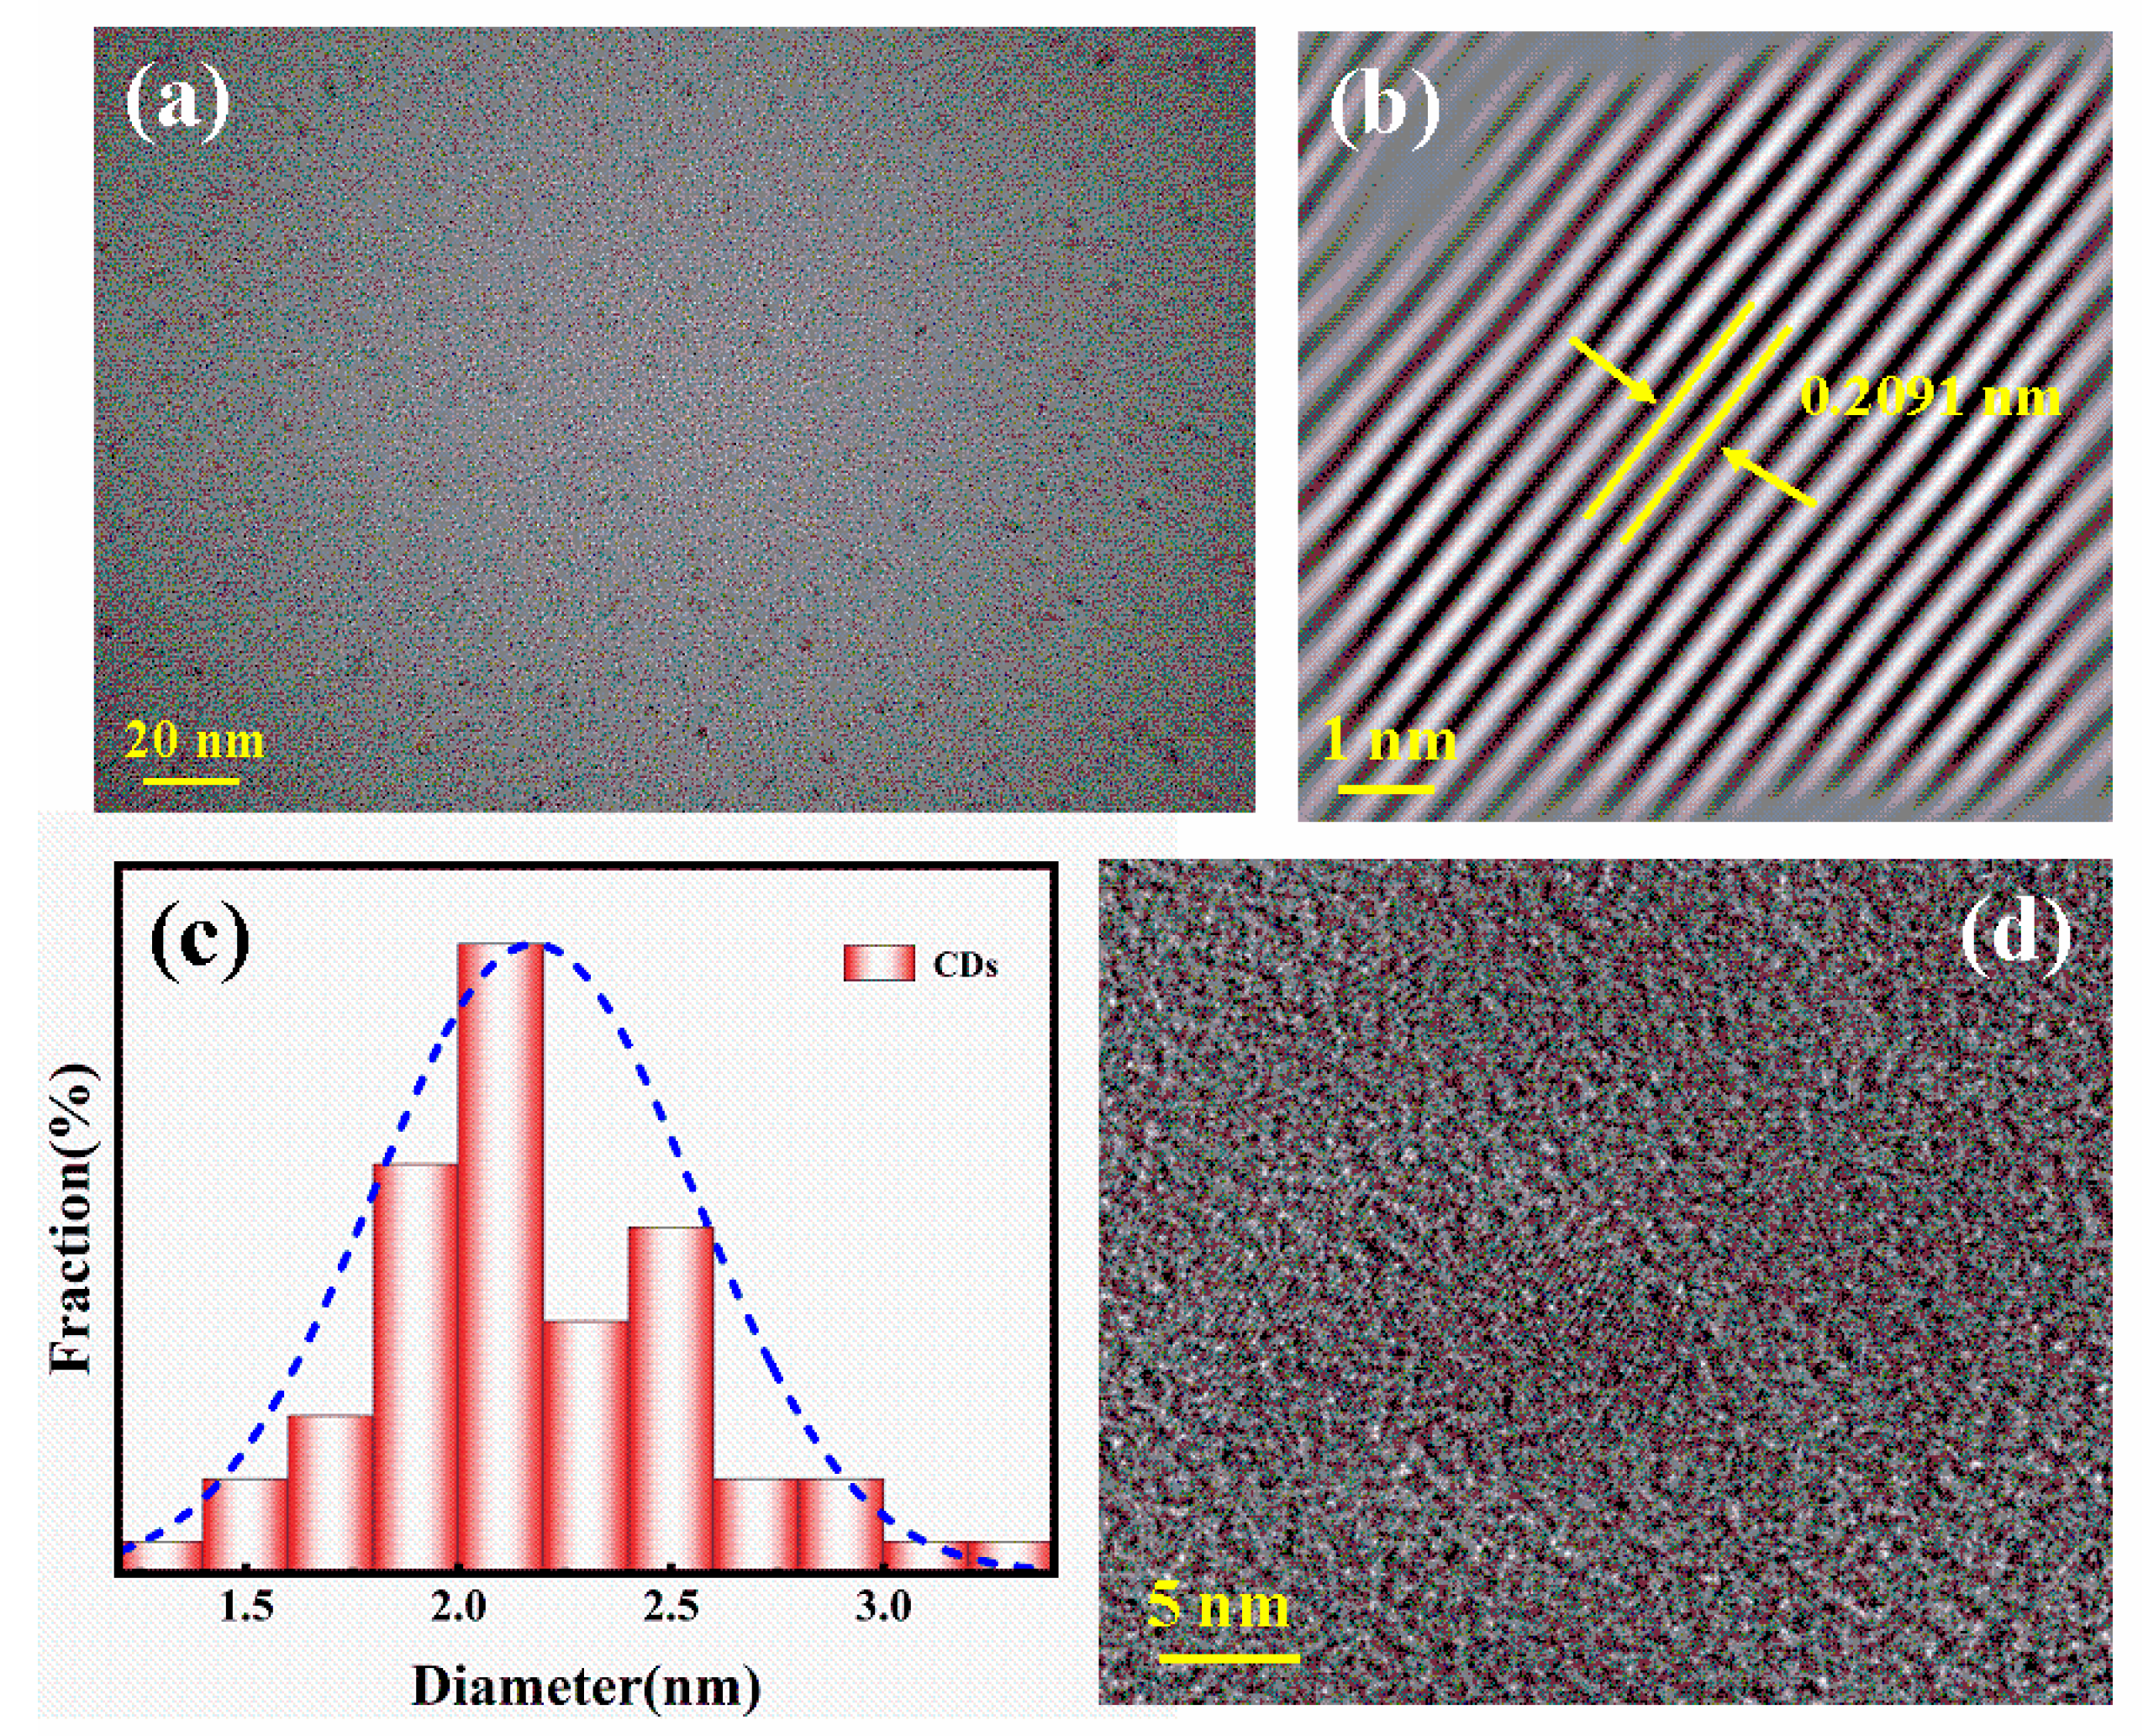
The morphological (Japan Electronics Co., Ltd., Fuwai Street, Xicheng District, Beijing, China) characteristics of CDs were characterized using transmission electron microscopy. As can be seen from Figure 2a, these CDs are well distributed. As shown in Figure 2c, the particle size of CDs follows a quasi-normal distribution, with an average diameter of 2.31 nm, which was obtained through statistical analysis of more than 200 particles using the ImageJ (version 1.53). Figure 2b,d show clear lattice fringes of CDs, with a lattice spacing of approximately 0.2091 nm, similar to the (111) lattice plane of graphite carbon, indicating good crystallinity of CDs [27].
Figure 2.
TEM image of CDs (a); particle size distribution diagram (c); (b,d) are HRTEM images of CDs.
3.2. Optical Property Characterization of CDs
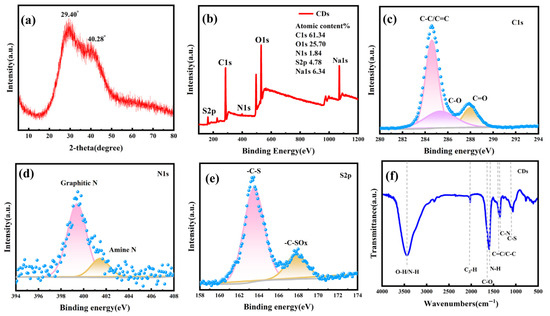
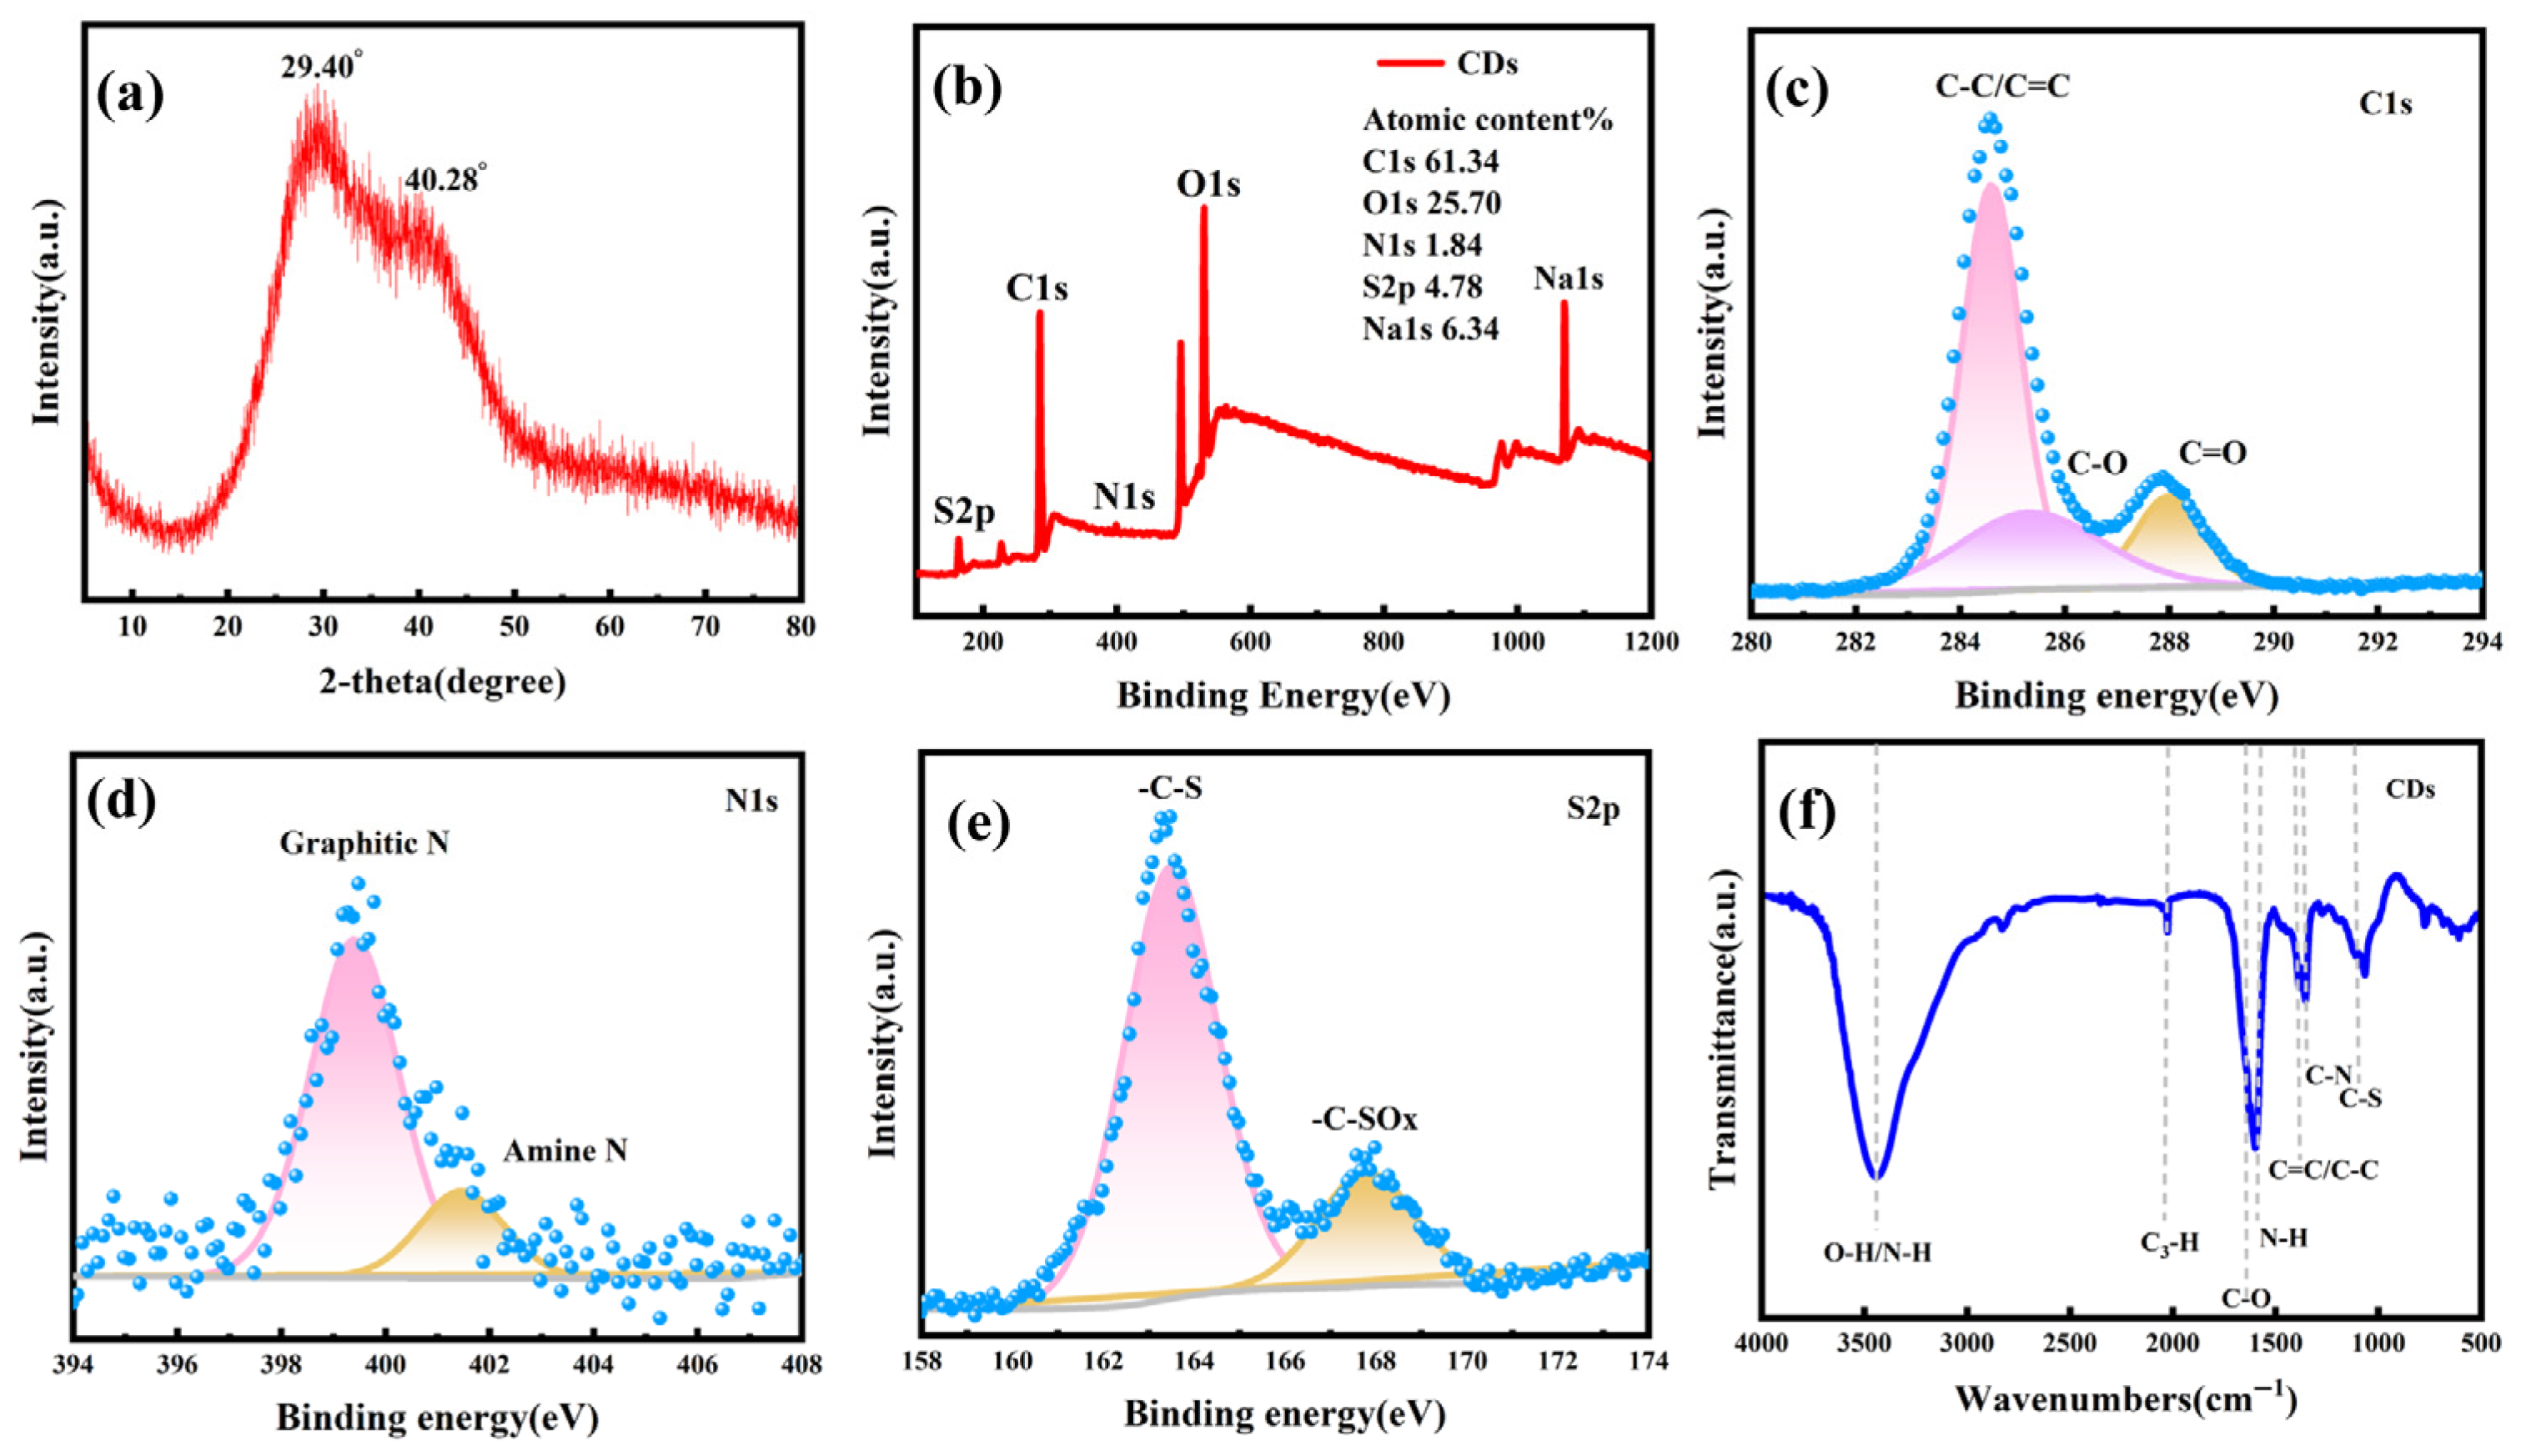
The Raman spectrum of CDs (Figure 3a) exhibits a broad diffraction peak at 29.40° and 40.28°, corresponding to the (002) and (100) crystal faces of sp2 hybridized graphitic carbon, respectively. This result indicates that the synthesized CDs possess a graphitic structure [28,29]. X-ray photoelectron spectroscopy was utilized to investigate and analyze the chemical composition, surface state, and bonding conditions of CDs. As shown in Figure 3b, CDs primarily consist of five elements, C, N, O, S, and Na, with atomic percentages of C1s, O1s, N1s, S2p, and Na1s being 61.34%, 25.70%, 1.84%, 4.78%, and 6.34%, respectively. Figure 3c,d depict the high-resolution energy spectra of C1s and N1s of CDs, respectively. The high-resolution energy spectrum of C1s displays three characteristic peaks at 284.60 eV, 285.4 eV, and 288.1 eV, corresponding to C-C/C=C, C-O, and C=O groups [29,30], respectively. The high-resolution energy spectrum of N1s exhibits two characteristic peaks at 399.4 eV and 401.4 eV, corresponding to graphitic nitrogen (N-C-N) and amine groups (C-NH2) [31], respectively. In the high-resolution energy spectrum of S2p shown in Figure 3e, a characteristic peak at 163.50 eV is associated with the C-S-C group, while the peak at 268.1 eV is related to the -C-SOx group. From the above analysis, it can be inferred that amine, hydroxyl, and carbonyl groups exist on the surface of CDs. This indicates that N and S elements have been successfully doped into CDs, and due to the presence of numerous hydrophilic groups, CDs exhibit good water solubility. Figure 3f presents the FT-IR spectrum of CDs, revealing a prominent broad peak near 3500 cm−1, indicating the presence of O-H/N-H functional groups. There is a weaker absorption at approximately 2000 cm−1, indicating the presence of C-H bonds; a strong absorption peak appears at approximately 1700 cm−1, which is due to the stretching and bending vibrations of C-O. Absorption related to the skeleton (C=C/C-C) appears in the region around 1387 cm−1, reflecting the conjugation/skeleton vibrations of the carbon core. Meanwhile, there is an N-H-related absorption peak near 1500 cm−1. Characteristic absorptions of C-N and C-S appear at 1976 cm−1 and 1153 cm−1, respectively [29,30,31,32]. These experimental results collectively demonstrate that nitrogen and sulfur elements have been successfully introduced into the carbon dots, which may contain amino, carboxyl, hydroxyl, sulfur-containing functional groups, etc. They also indicate that the CDs exhibit good water solubility [33]. The analysis results of FT-IR spectroscopy correspond to the aforementioned XPS results.
Figure 3.
Raman spectrum (a), full-scan XPS photoelectron spectrum (b), C1s high-resolution spectrum (c), N1s high-resolution spectrum (d), S2p high-resolution spectrum (e), and FT-IR spectrum (f) of CDs.
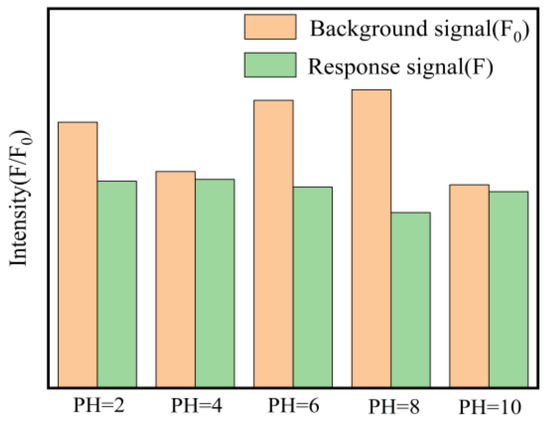
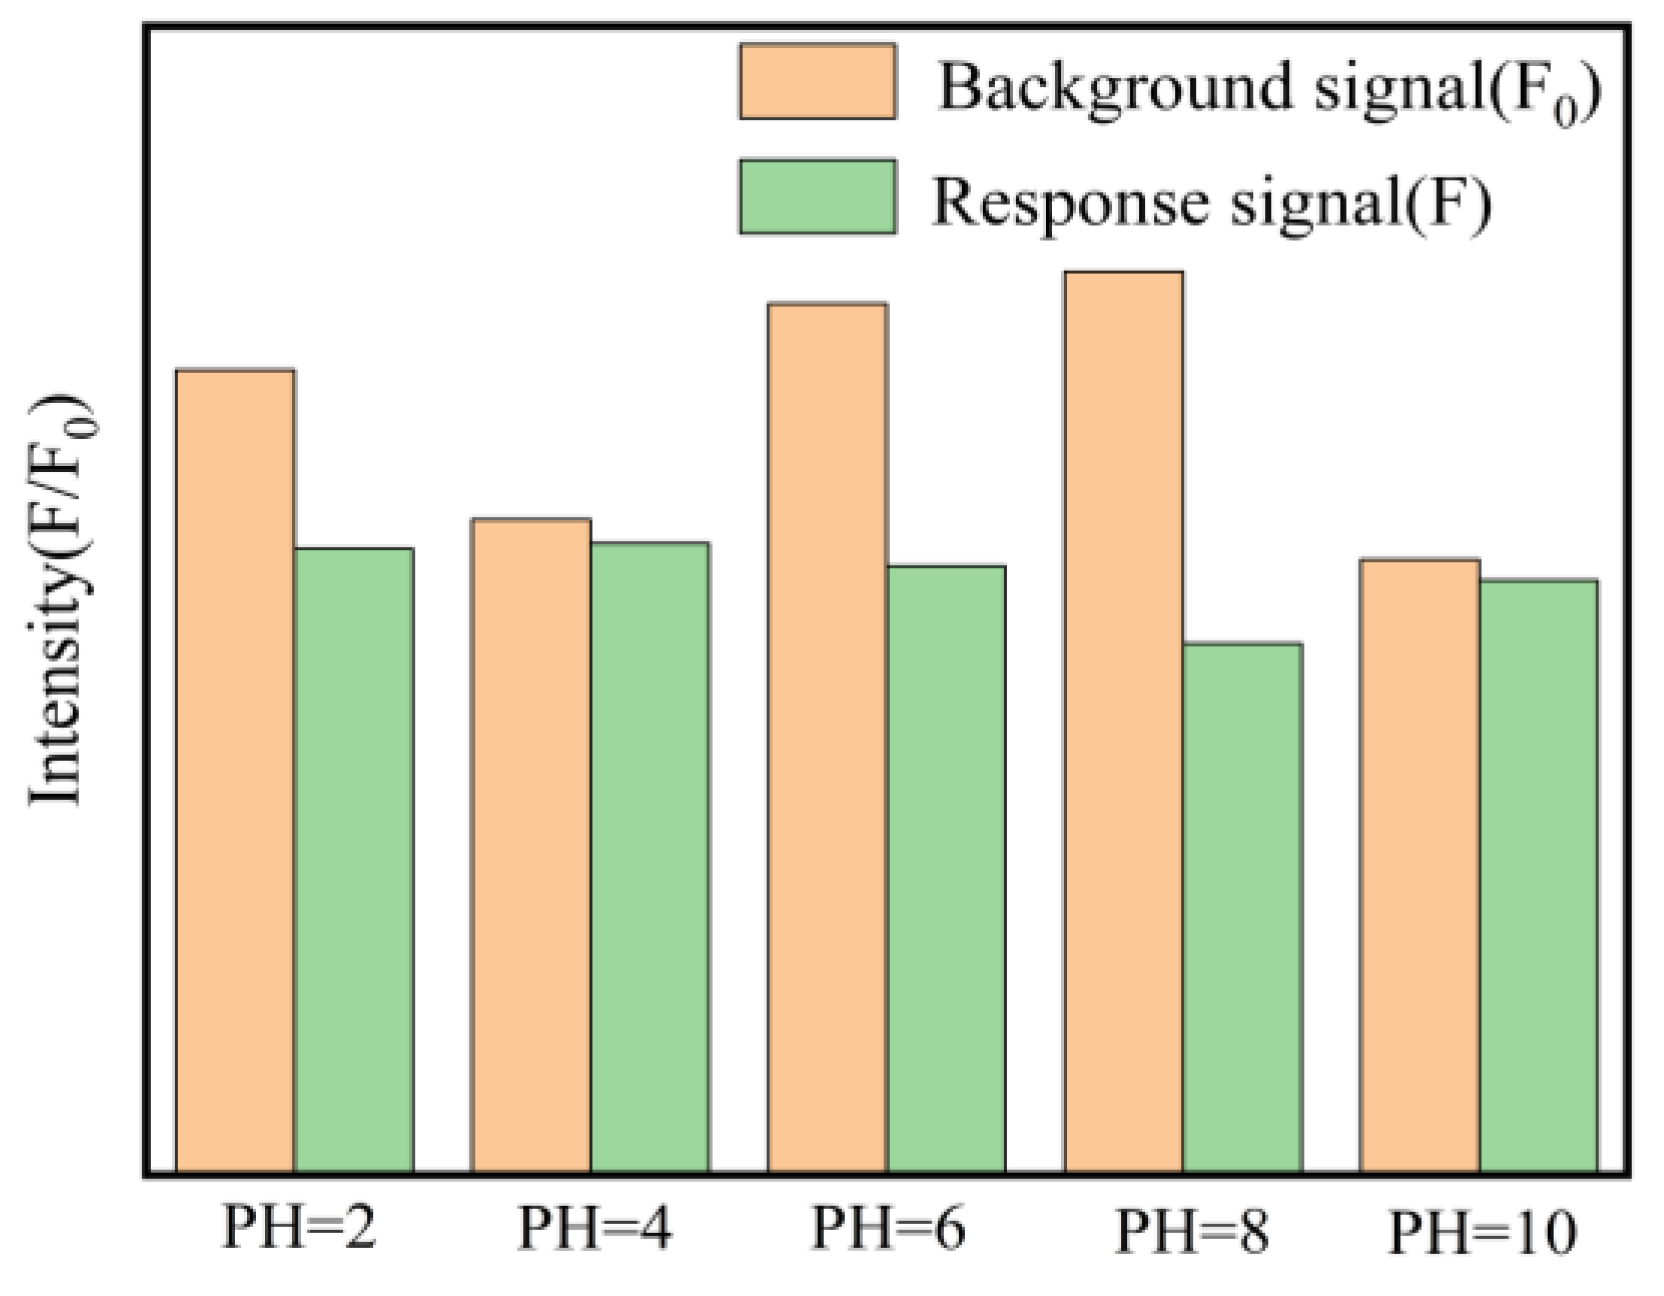
In addition, the effects of pH values ranging from 2 to 10 on the fluorescence intensity of CDs and their response to Cu2+ were investigated at room temperature. As shown in Figure 4, the fluorescence intensity (F0) of CDs remained relatively stable within the pH range of 6–8, indicating good pH stability. However, the fluorescence quenching efficiency (F0/F) varied significantly with changes in PH. The maximum quenching efficiency was observed at pH 6. At strongly acidic conditions, the fluorescence intensity decreased, possibly due to the protonation of surface groups. At pH > 8, the sensitivity towards Cu2+ decreased, which might be attributed to the hydrolysis of Cu2+ ions or the deprotonation of surface functional groups affecting the coordination with Cu2+. Therefore, a pH of 6 was selected as the optimal condition for the subsequent detection of Cu2+.
Figure 4.
Effect of pH on the fluorescence intensity of the sensor.
Furthermore, to evaluate the sensitivity of the proposed method, the Limit of Detection (LOD) and Limit of Quantification (LOQ) were calculated based on the standard analytical chemistry definitions. The formulas used were
where σ is the standard deviation of the response (The standard deviation of 11 consecutive measurements of a blank sample is 10.07 mg/L) and S is the slope of the calibration curve (0.91489).
The analytical performance of the CDs probe was evaluated. The Limit of Detection and Limit of Quantification were calculated to be 36.32 mg/L and 110.01 mg/L, respectively. Although the detection limit of the probe itself exceeds the World Health Organization’s guideline value for drinking water (2 mg/L), the primary advantage of the UV-Vis-fluorescence feature-level fusion model proposed in this paper lies not in ultra-trace detection, but in improving predictive accuracy (R2 = 0.9915) and robustness in complex matrices.
3.3. Quenching Mechanism Discussion
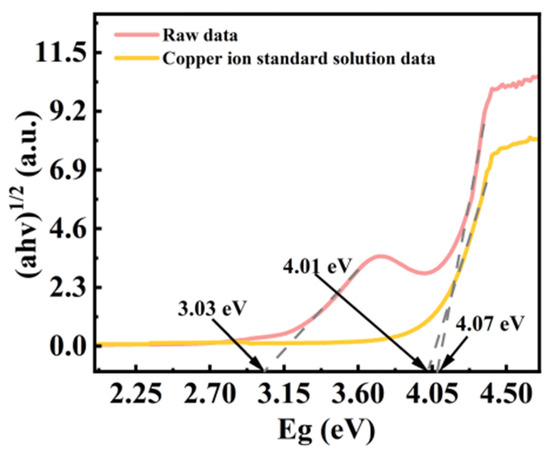
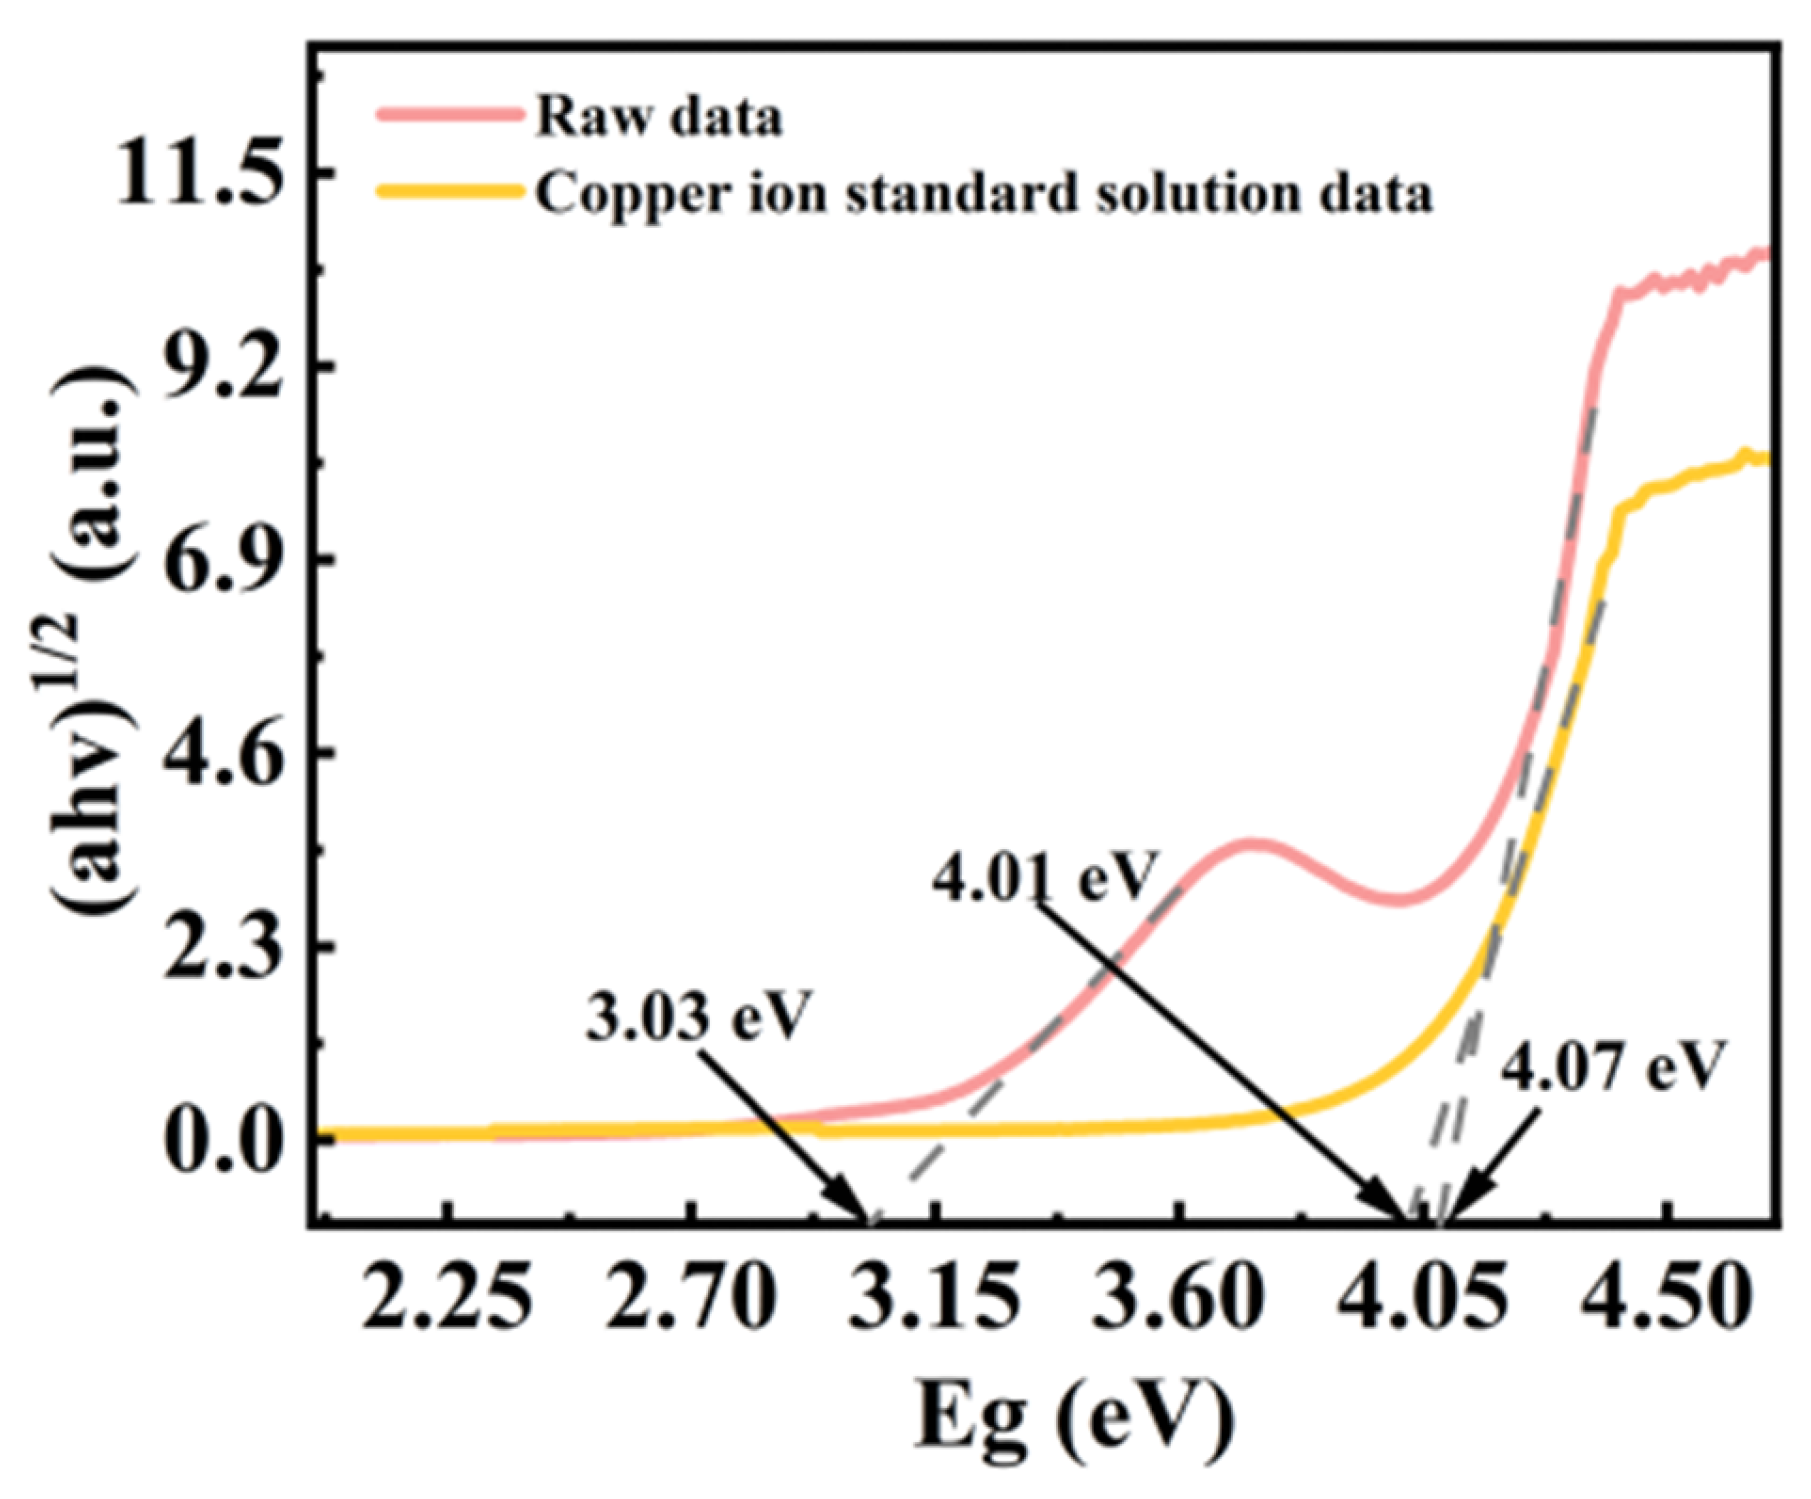
To elucidate the quenching mechanism, we investigated the optical band gap of the CDs and the CDs-Cu2+ system using TAUC plots (Figure 5). The calculated band gap of the pure CDs was approximately 3.03 eV. Upon the addition of Cu2+, the absorption edge shifted, indicating an interaction between the CDs and metal ions. The fluorescence quenching is primarily attributed to the Photo-induced Electron Transfer mechanism. The standard redox potential of Cu2+/Cu is +0.153 V. Based on the band gap of 3.03 eV and the valence band position (determined by XPS/UPS or literature estimation), the conduction band potential of the CDs is estimated to be more negative than the redox potential of Cu2+/Cu. Therefore, under excitation, the electrons in the conduction band of the excited CDs can transfer to the half-filled 3d orbitals of Cu2+ ions. This non-radiative electron transfer process competes with the fluorescence emission, resulting in the observed quenching. Additionally, the paramagnetic nature of Cu2+ may also facilitate non-radiative recombination through the heavy atom effect.
Figure 5.
CDs and their systems with Cu2+ using TAUC spectra.
3.4. Selectivity Studies
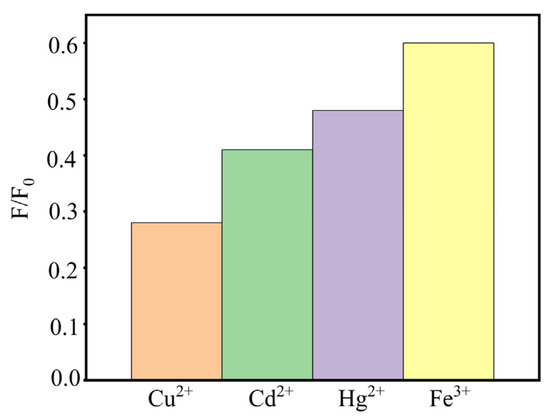
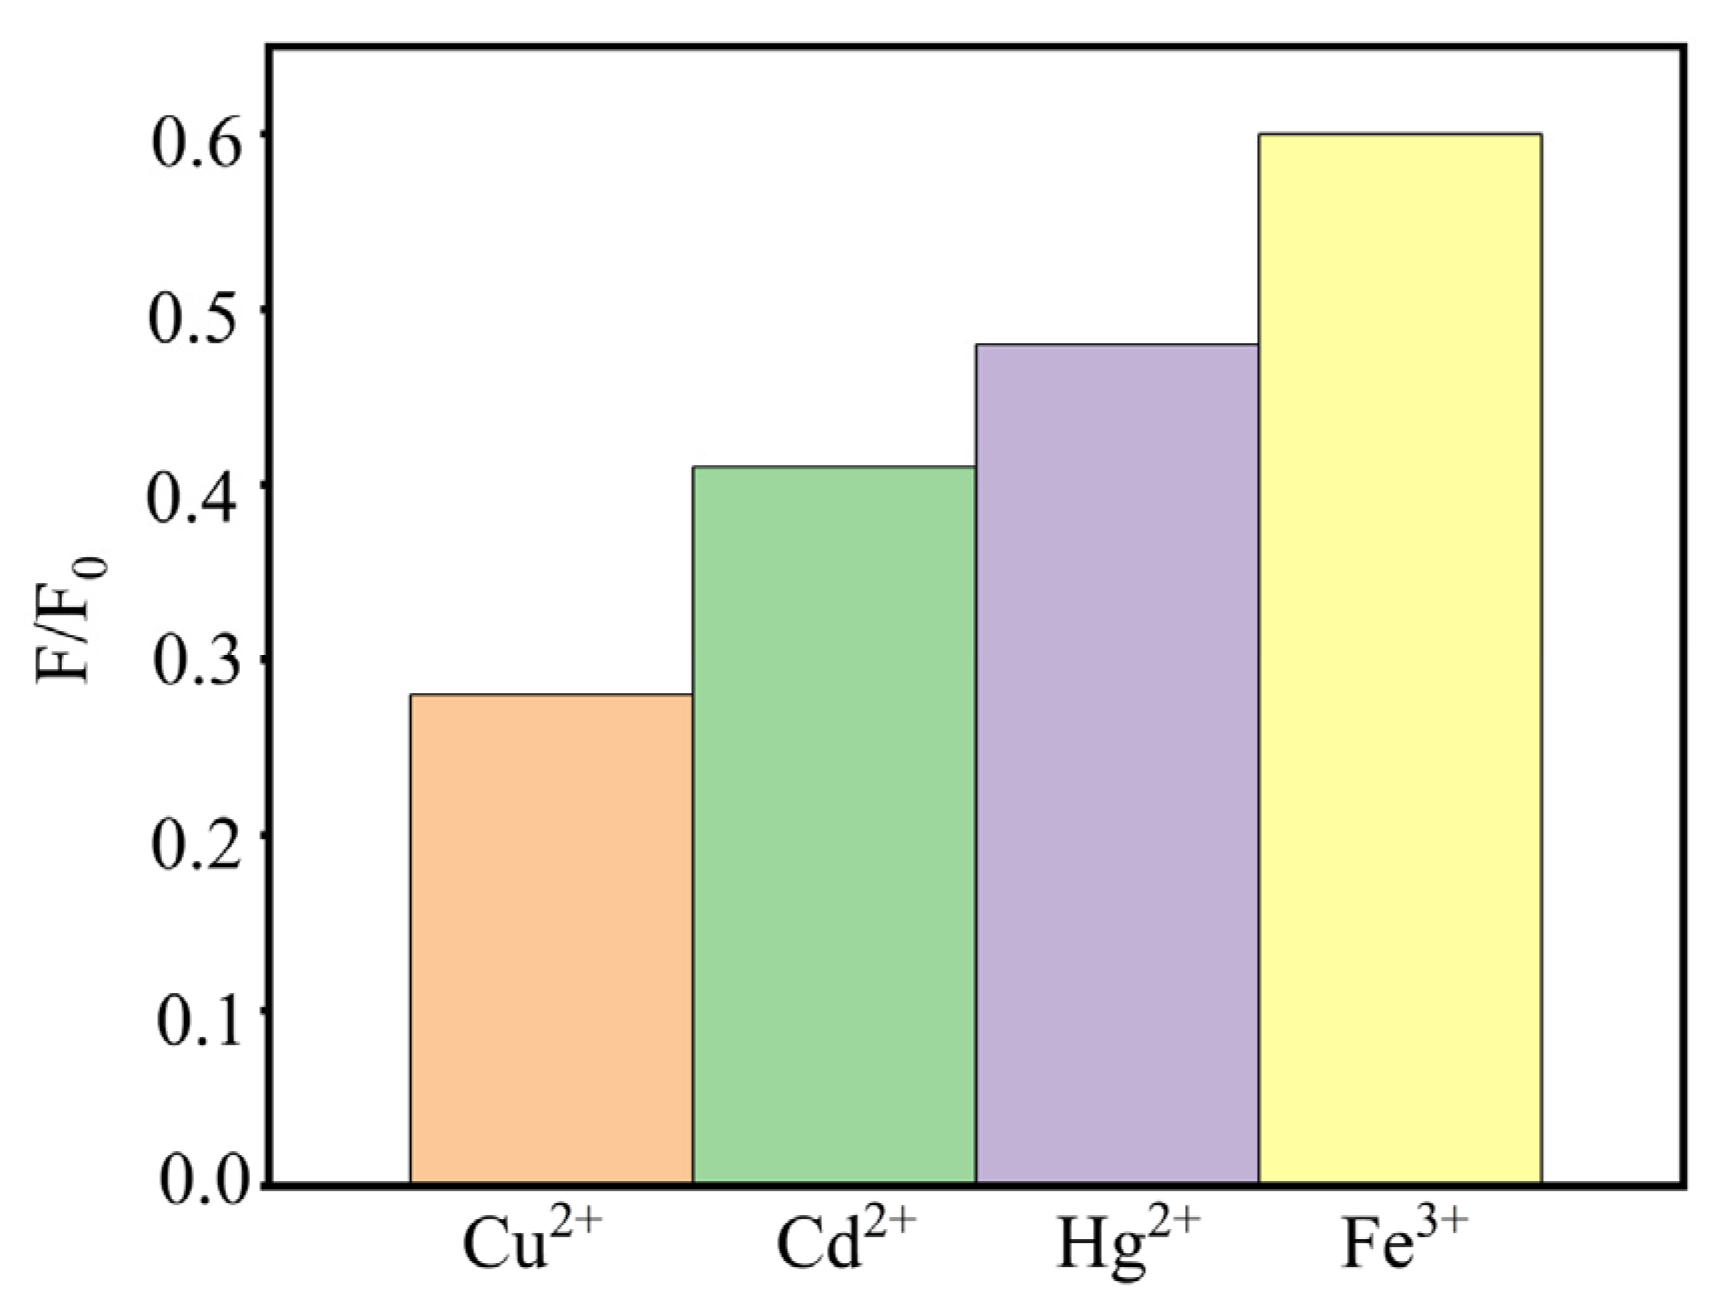
To evaluate the selectivity of the fluorescent probe for Cu2+ detection, the fluorescence response towards three common interfering metal ions, specifically Cd2+, Hg2+, and Fe3+, was investigated under identical experimental conditions. As illustrated in Figure 6, the probe exhibits distinct responses to different metal ions. Upon the addition of Cu2+, the fluorescence intensity was significantly quenched, yielding the lowest F/F0 ratio of approximately 0.28. In contrast, the presence of other metal ions resulted in notably weaker quenching effects. For instance, Cd2+ and Hg2+ reduced the fluorescence intensity to F/F0 ratios of roughly 0.41 and 0.48, respectively, while Fe3+ showed the least interference with an F/F0 ratio of about 0.60. The significant difference in the F/F0 values between Cu2+ and the other competing ions demonstrates the high selectivity of the probe for Cu2+. Although heavy metal ions like Hg2+ and Cd2+ may cause partial quenching due to paramagnetic properties or the heavy atom effect, the response to Cu2+ is clearly distinguishable. This high selectivity ensures that the probe can accurately identify Cu2+ even in the presence of potential interfering ions, making it a promising candidate for practical water quality monitoring applications.
Figure 6.
Selectivity of the probe towards various metal ions (Cu2+, Cd2+, Hg2+, Fe3+). The fluorescence intensity ratio (F/F0) was recorded under optimized conditions.
3.5. Characterization and Pretreatment of UV-Vis and Fluorescence Spectra
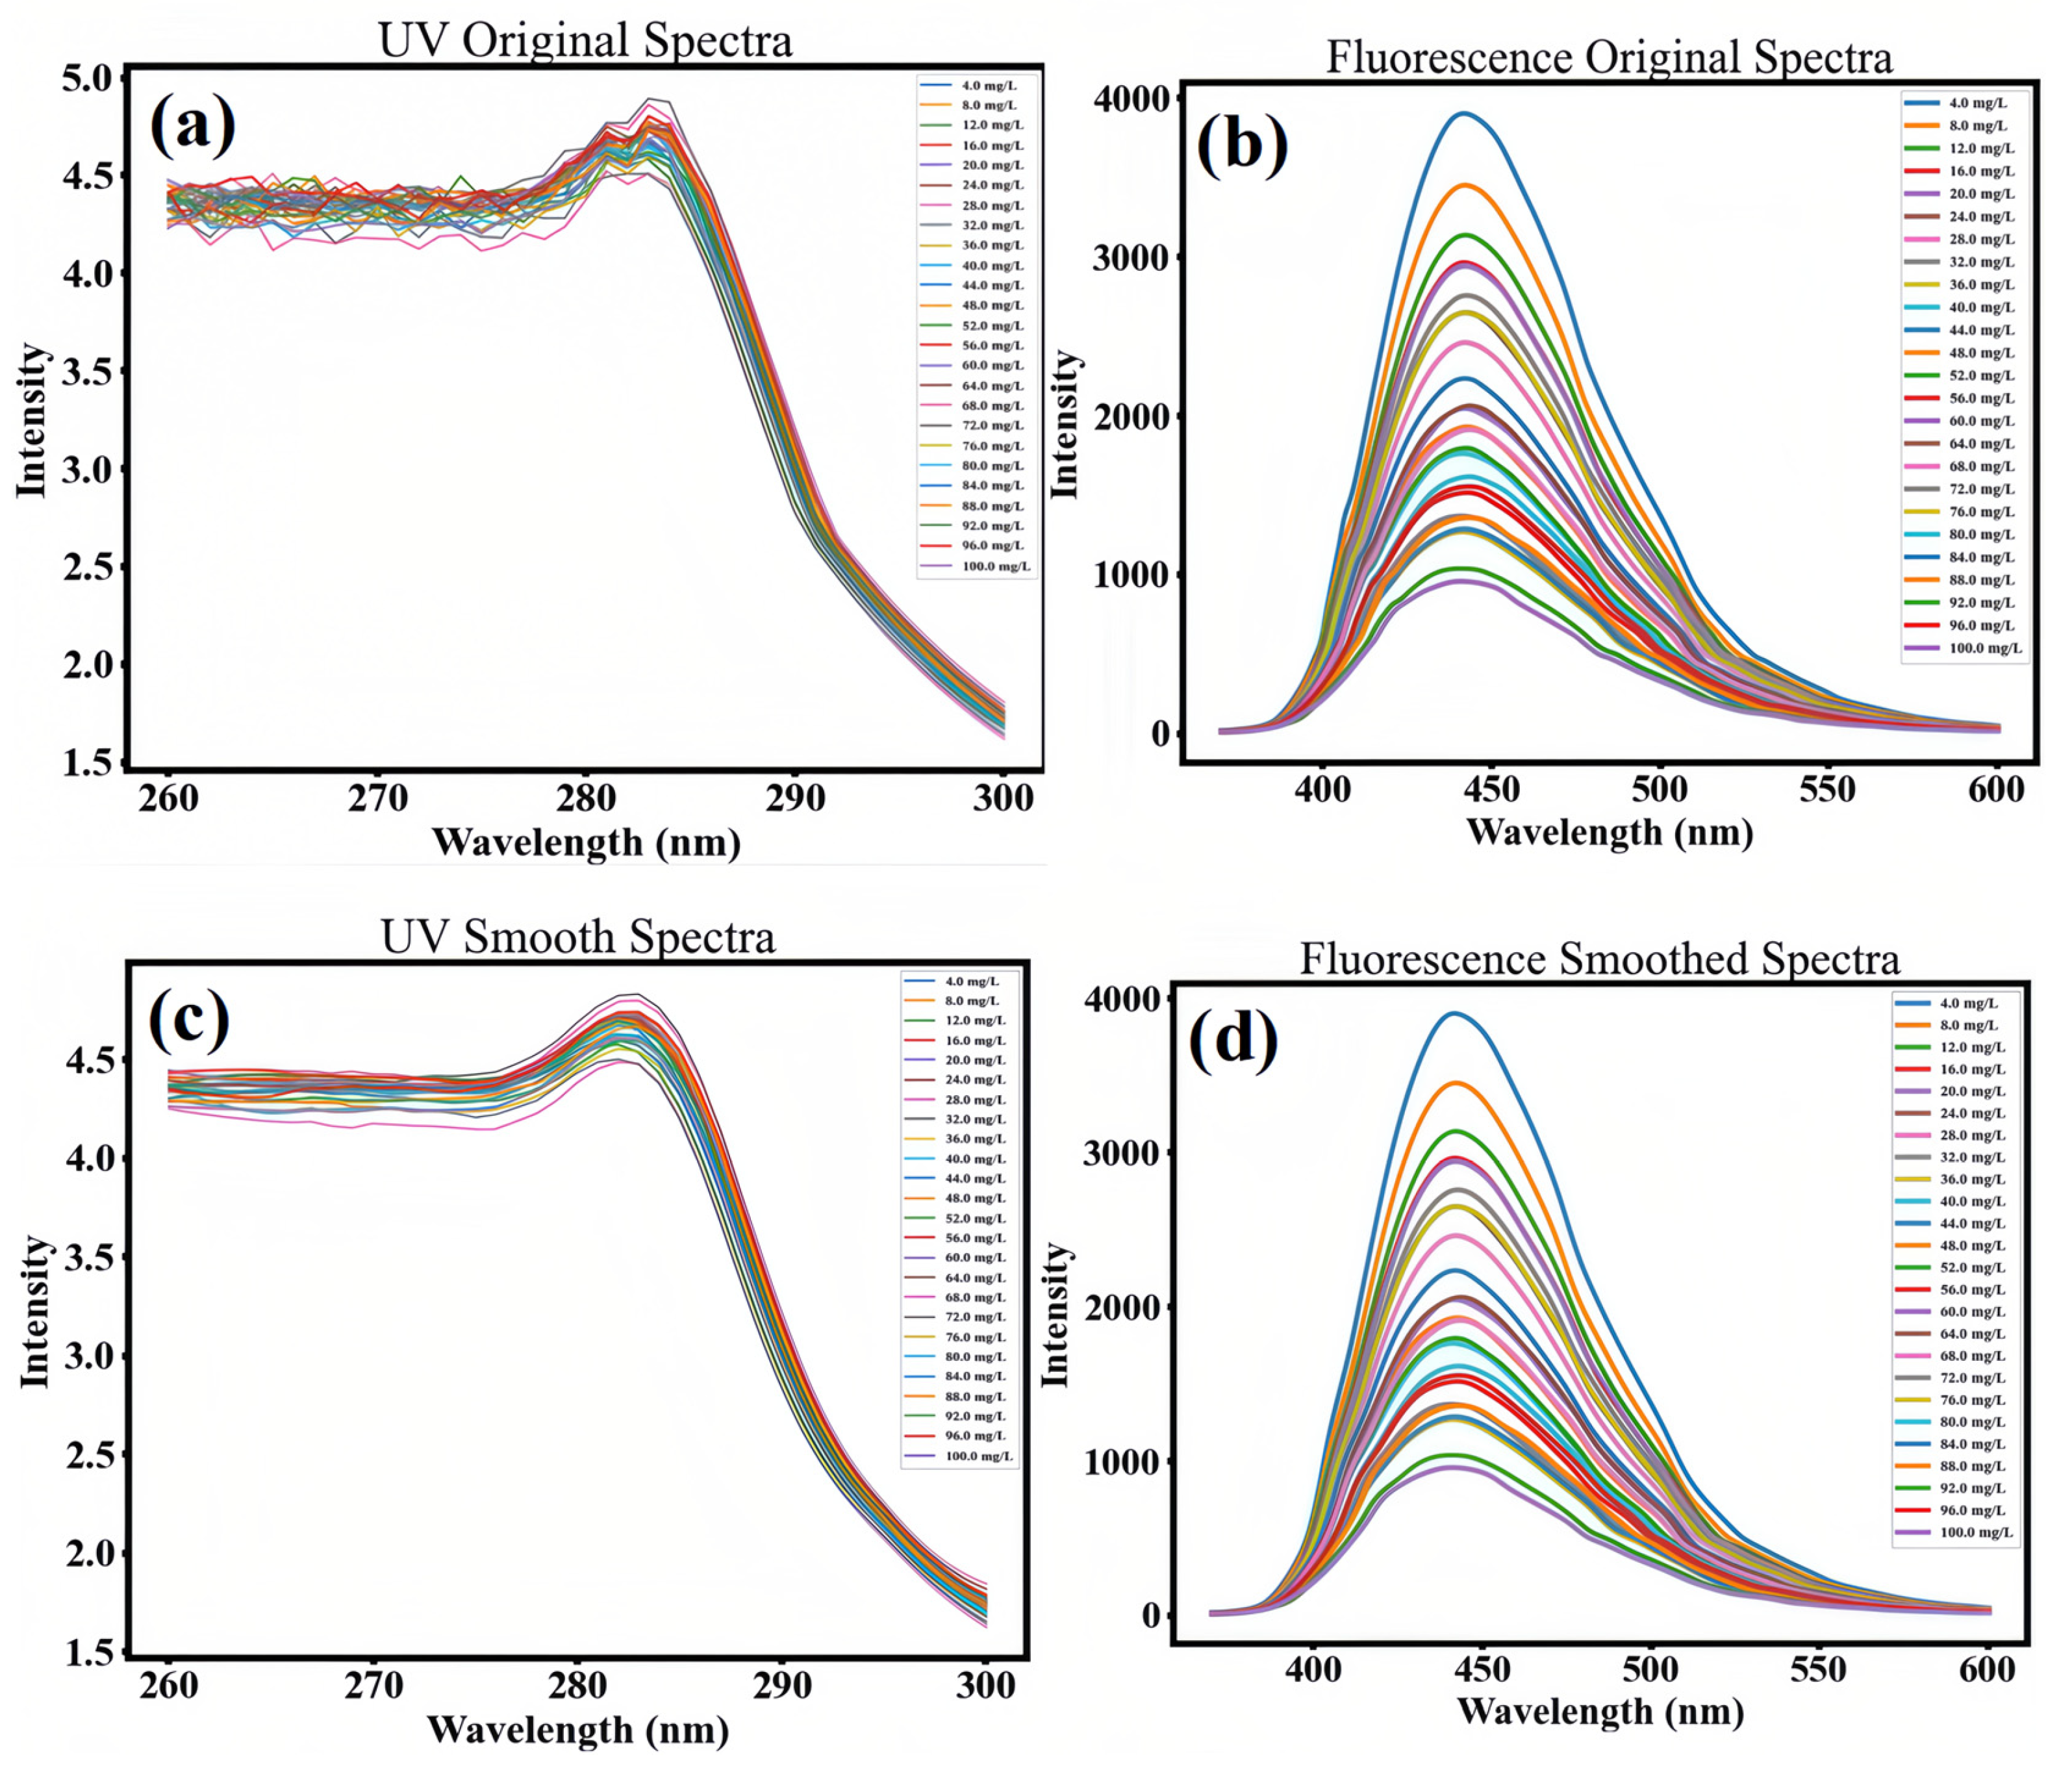
Due to the influence of the experimental environment, the collected UV-Vis absorption spectra and fluorescence emission spectra often contain both target information and random noise. To improve the signal-to-noise ratio of the spectral data and effectively suppress random noise and high-frequency interference, this paper employs the Savitzky–Golay (SG) filtering [34] method for spectral data preprocessing. This method involves selecting a sliding window of a fixed size on the signal and fitting the data within each window using a polynomial. The value of the fitted polynomial at the center point of the window is calculated [35] and serves as the filtering result for that point. By moving the window and repeating the above process, smoothing of the entire signal can be achieved. In this paper, SG filtering parameters with a window size of 11 and a polynomial order of 3 are selected for data processing. This weighted average method can significantly enhance the signal-to-noise ratio of the spectral signal while maintaining the original shape of the spectrum. The UV-Vis and fluorescence spectra after SG smoothing are shown in Figure 7c,d. Due to significant differences in intensity range between ultraviolet absorption spectra and fluorescence emission spectra, to avoid losing effective information contained in low-intensity signals during the spectral data fusion process due to magnitude differences [36], it is necessary to perform standardized preprocessing on the original spectral data (Figure 7a,b) The main purpose of this processing is to eliminate the magnitude differences between different spectral techniques, thereby enabling effective integration and analysis of various spectral data on the same scale. The fluorescence quantum yield of these CDs relative to quinine sulfate is 19.7%.
Figure 7.
(a,b) UV-vis spectra and PL spectra of standard solutions at different Cu2+ ion concentrations; (c,d) UV-vis spectra and PL spectra of standard solutions after SG smoothing at different Cu2+ ion concentrations.
3.6. Selection of Characteristic Wavelengths
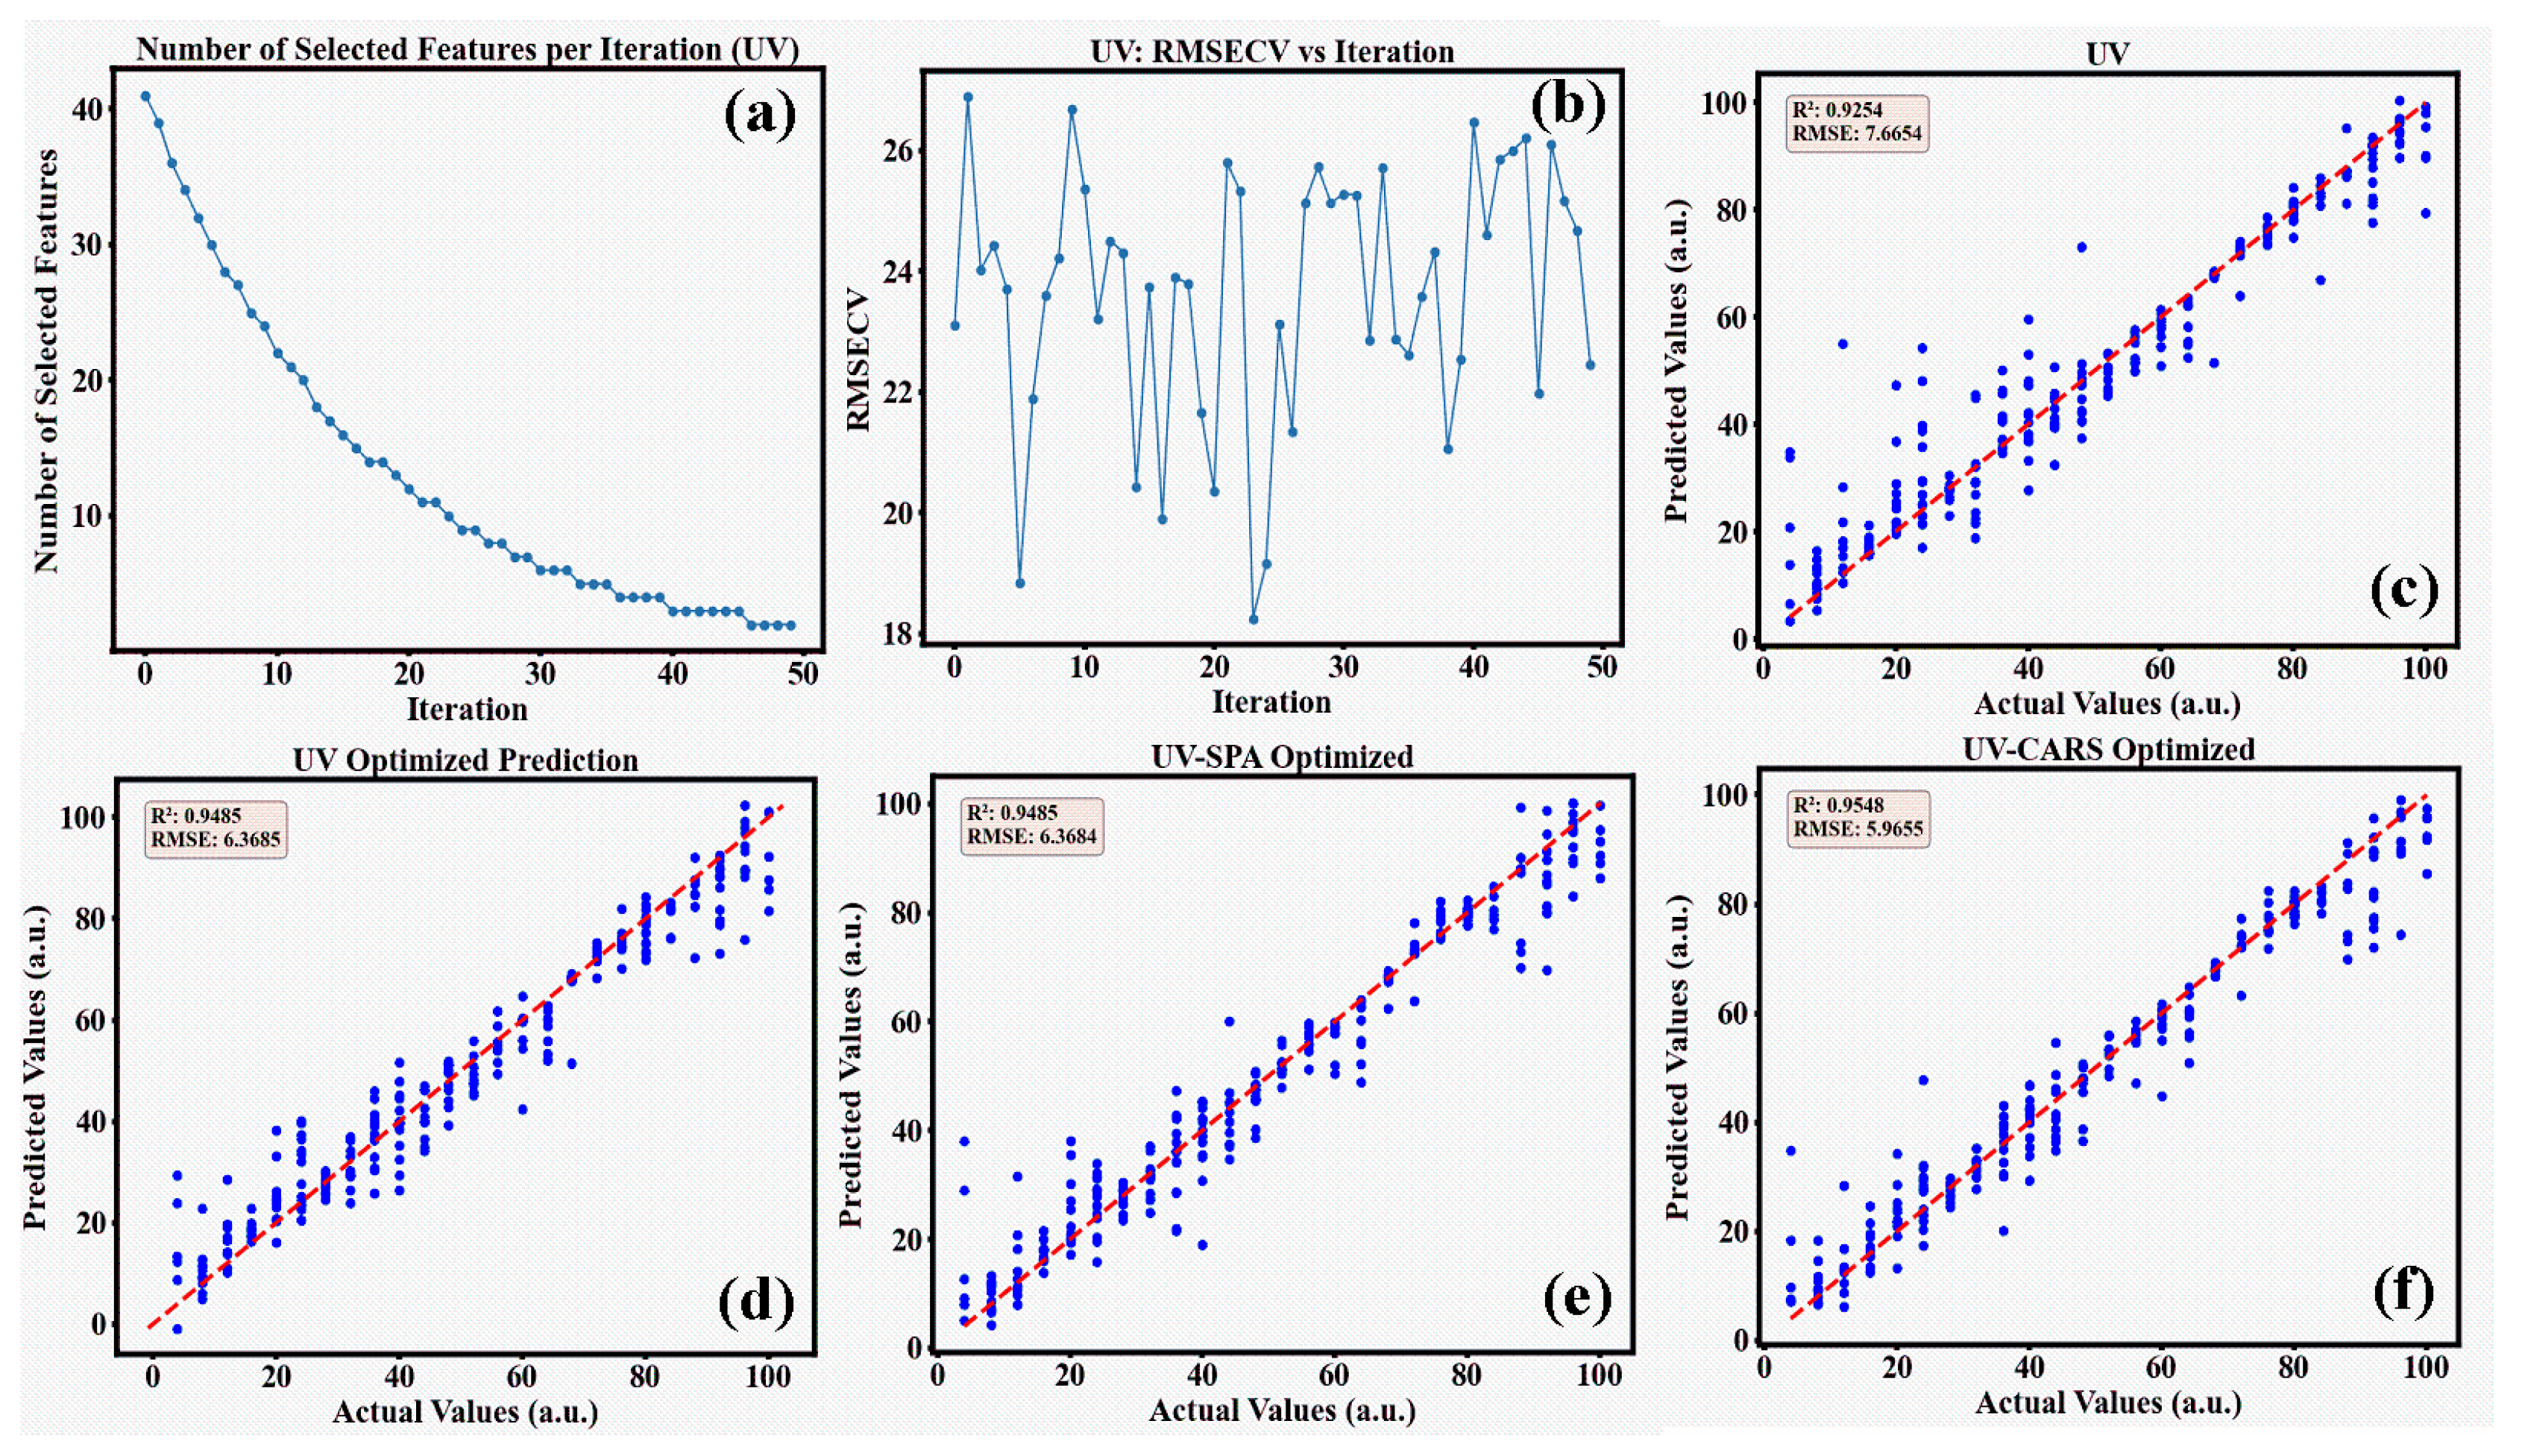
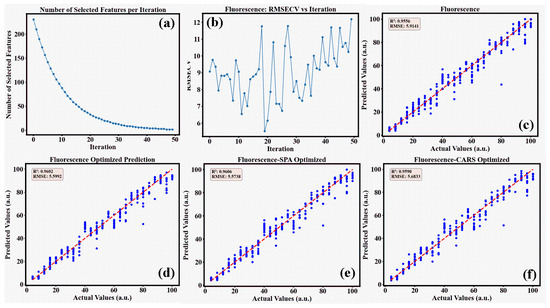
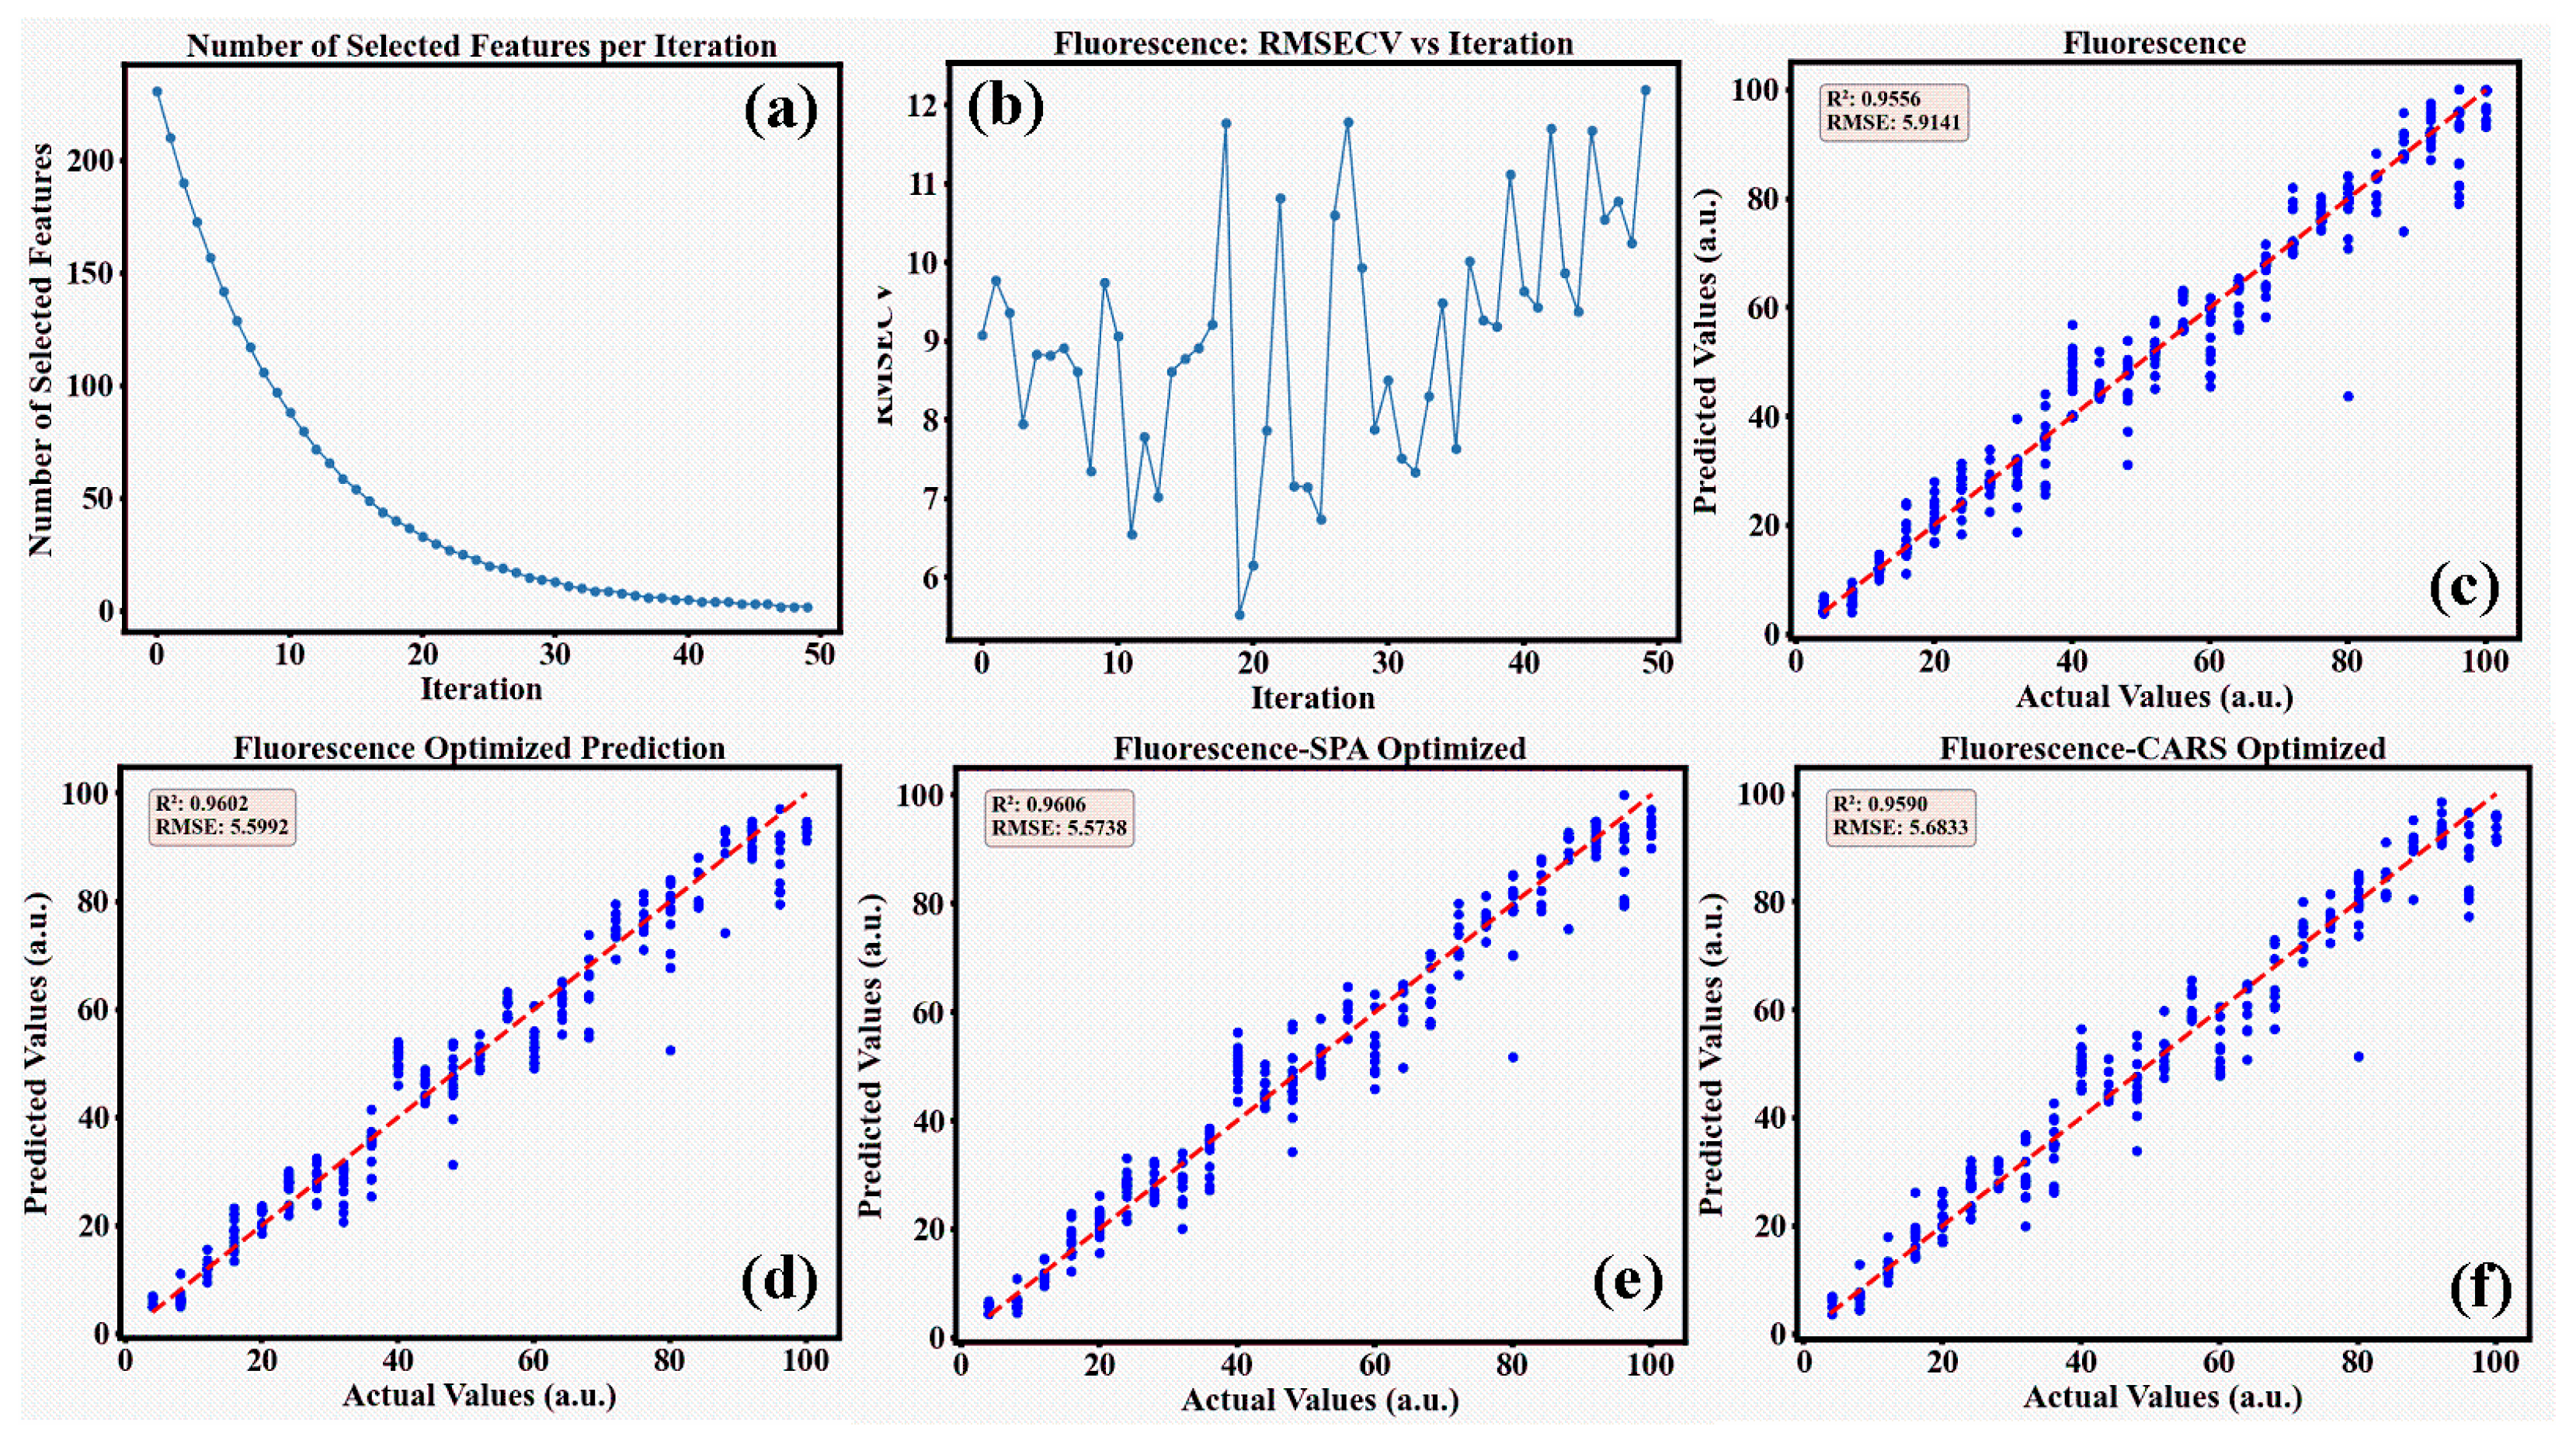
The CARS method was employed to conduct 50 rounds of variable selection optimization for both UV absorption spectra and fluorescence emission spectra. As the number of Monte Carlo iterations increased, the number of selected wavelengths gradually decreased, and the downward trend gradually slowed down. By comparing the RMSECV values at each iteration until finding the optimal variable subset that contains the minimum RMSECV, the wavelengths of the optimal variable subset were determined.
As can be seen from Figure 8a and Figure 9a, the number of selected wavelengths gradually decreases as the algorithm iterates, and the RMSECV value exhibits a fluctuating trend of first decreasing and then increasing. This variation pattern reflects the dynamic process of wavelength selection: the elimination of irrelevant variables in the initial stage effectively reduces the RMSECV value, but as key wavelength information is lost, the RMSECV value increases instead. This phenomenon reveals the balance between information retention and error control in the variable selection process. As shown in Figure 8b, the RMSECV of the CARS algorithm for UV absorption spectra reaches its minimum value at iteration 18. Similarly, as shown in Figure 9b, the RMSECV of the CARS algorithm for fluorescence emission spectra reaches its minimum value at iteration 28.
Figure 8.
(a,b) shows the CARS variable selection results for UV absorption spectra; (c) shows the XGBoost prediction results for unoptimized UV absorption spectra data; (d) shows the optimized XGBoost prediction results; (e) and (f) show the optimized XGBoost modeling prediction results after feature extraction using SPA and CARS, respectively.
Figure 9.
(a,b) presents the CARS variable selection results for the fluorescence spectra; (c) shows the XGBoost prediction results for the unoptimized fluorescence spectra data; (d) displays the optimized XGBoost prediction results; (e) and (f) respectively show the optimized XGBoost modeling and prediction results after feature extraction via SPA and CARS.
3.7. Model Prediction Results and Analysis
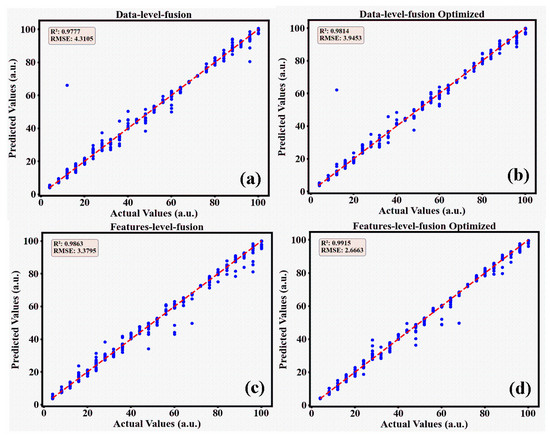
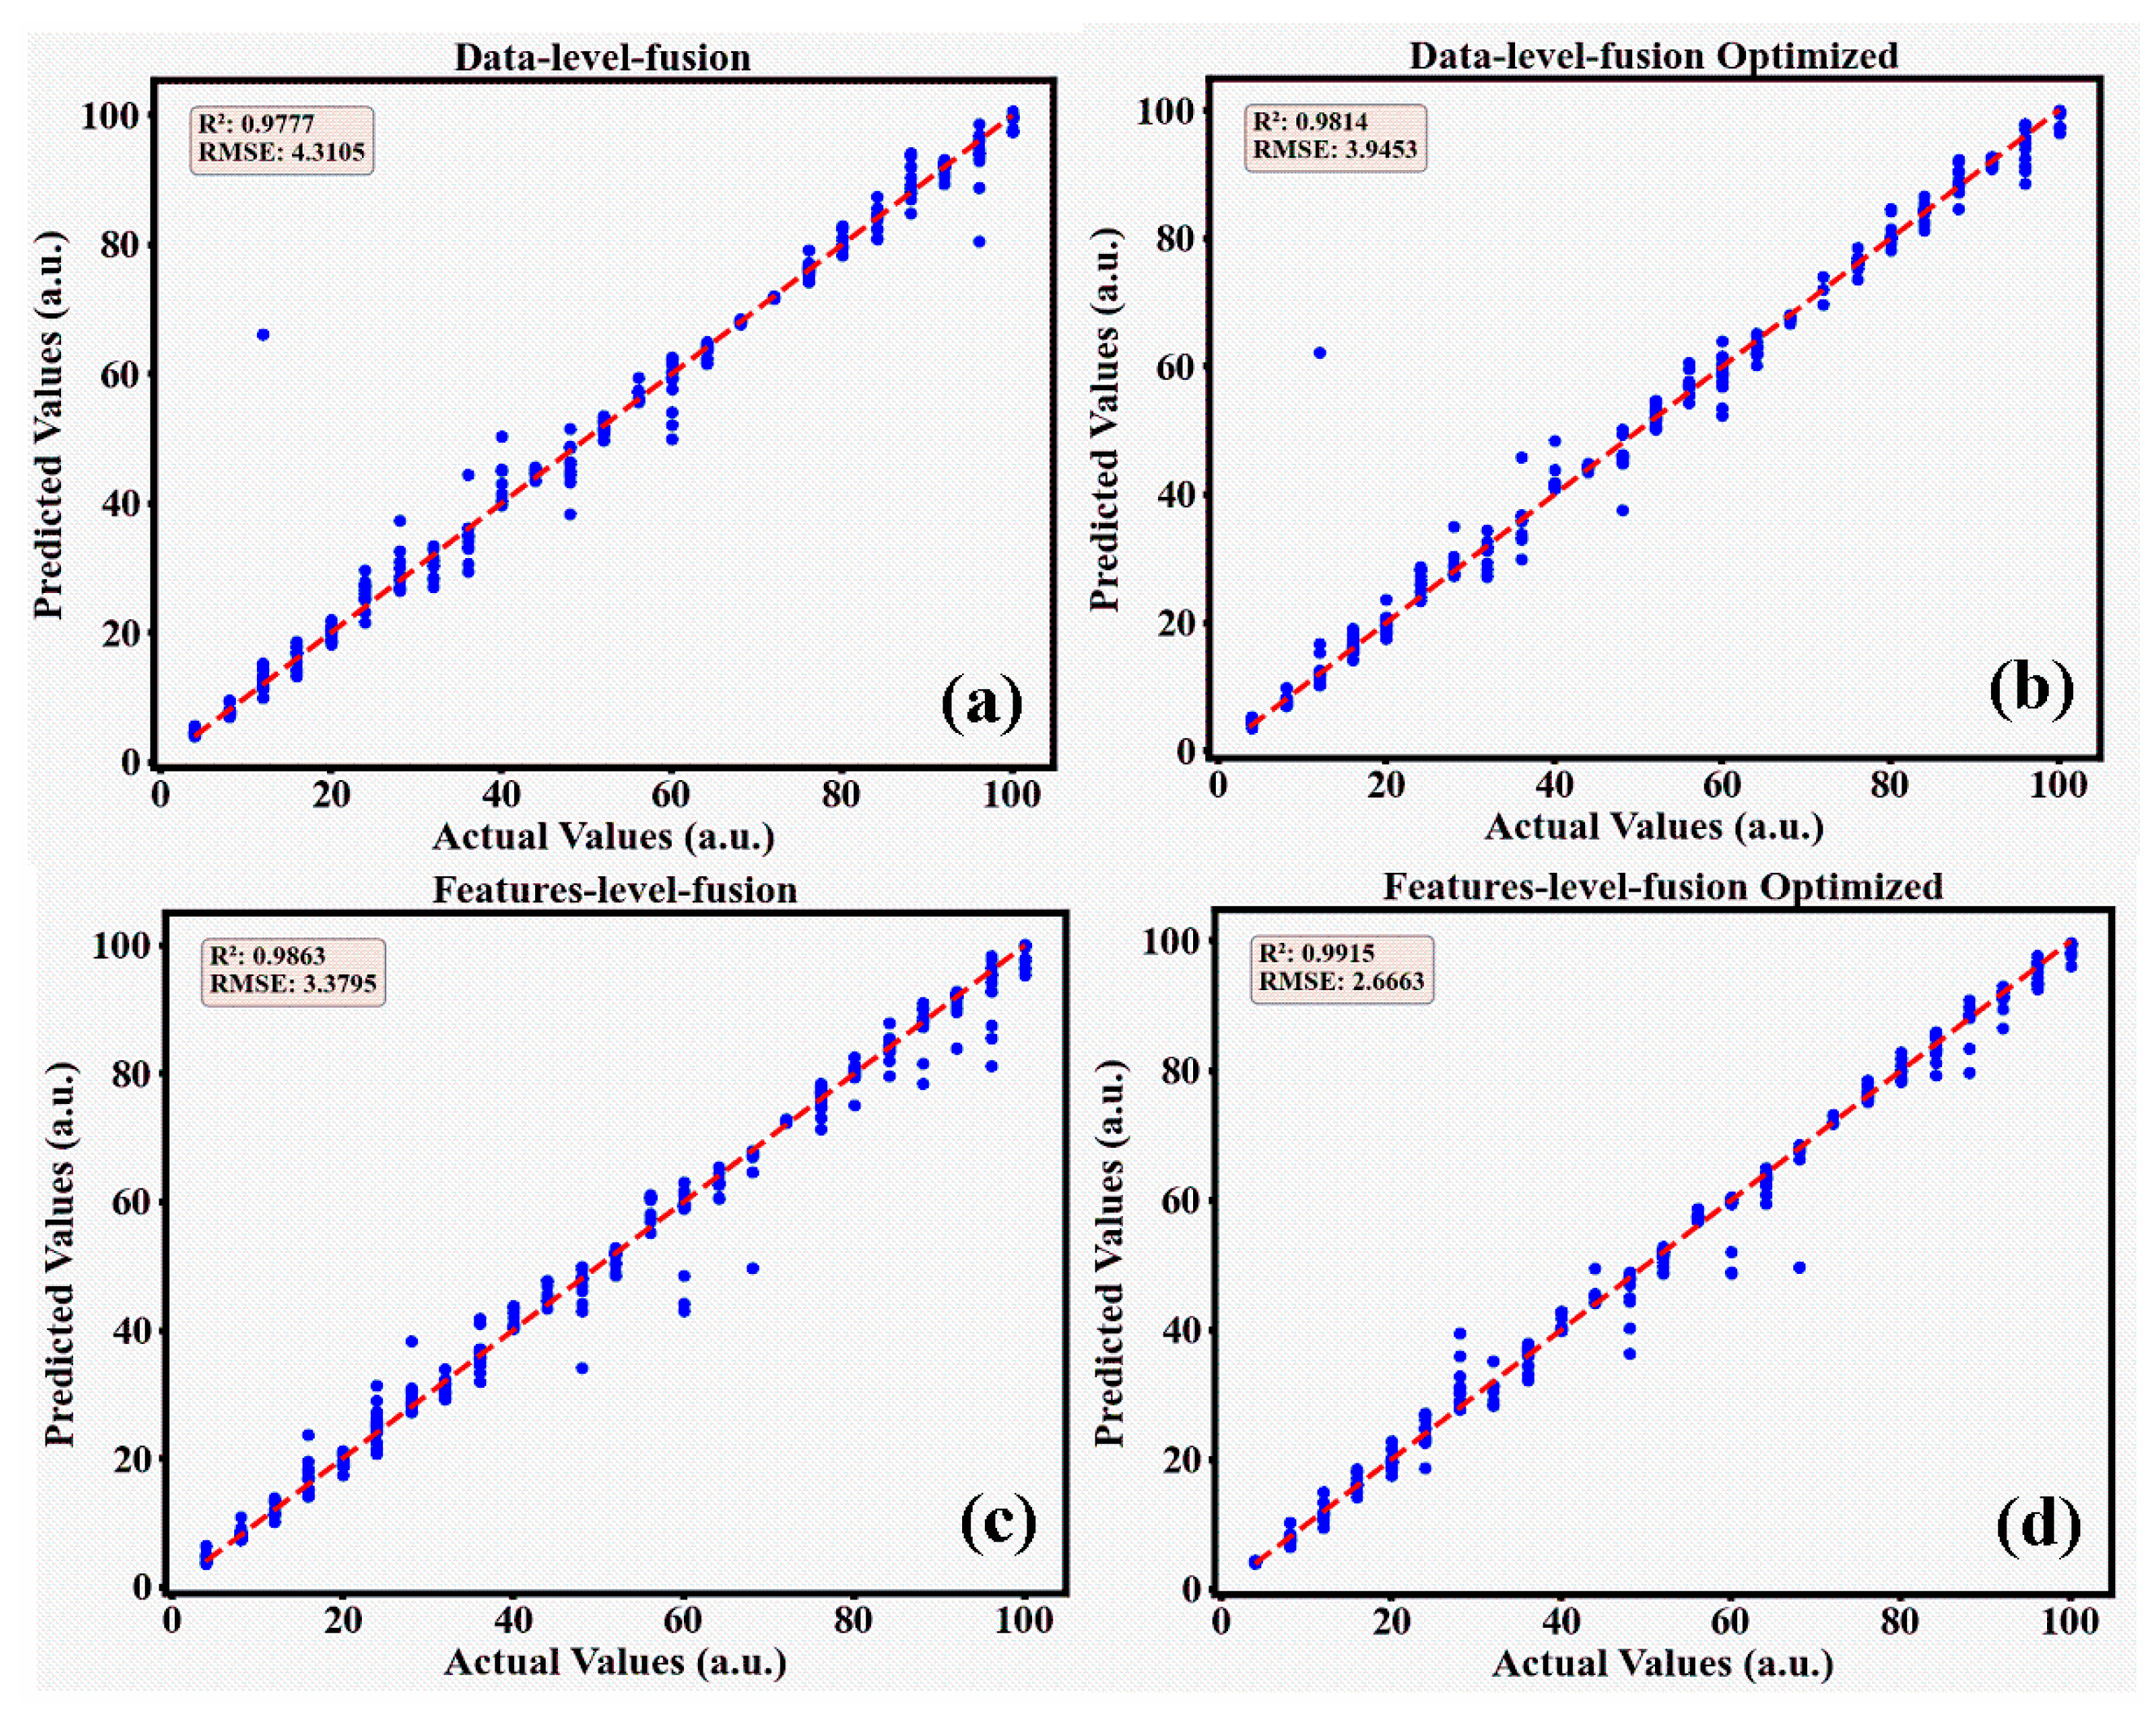
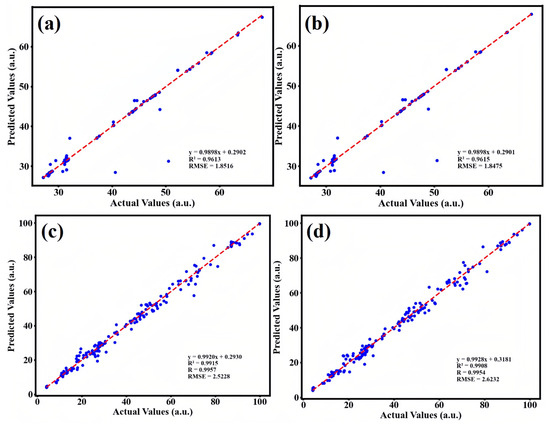
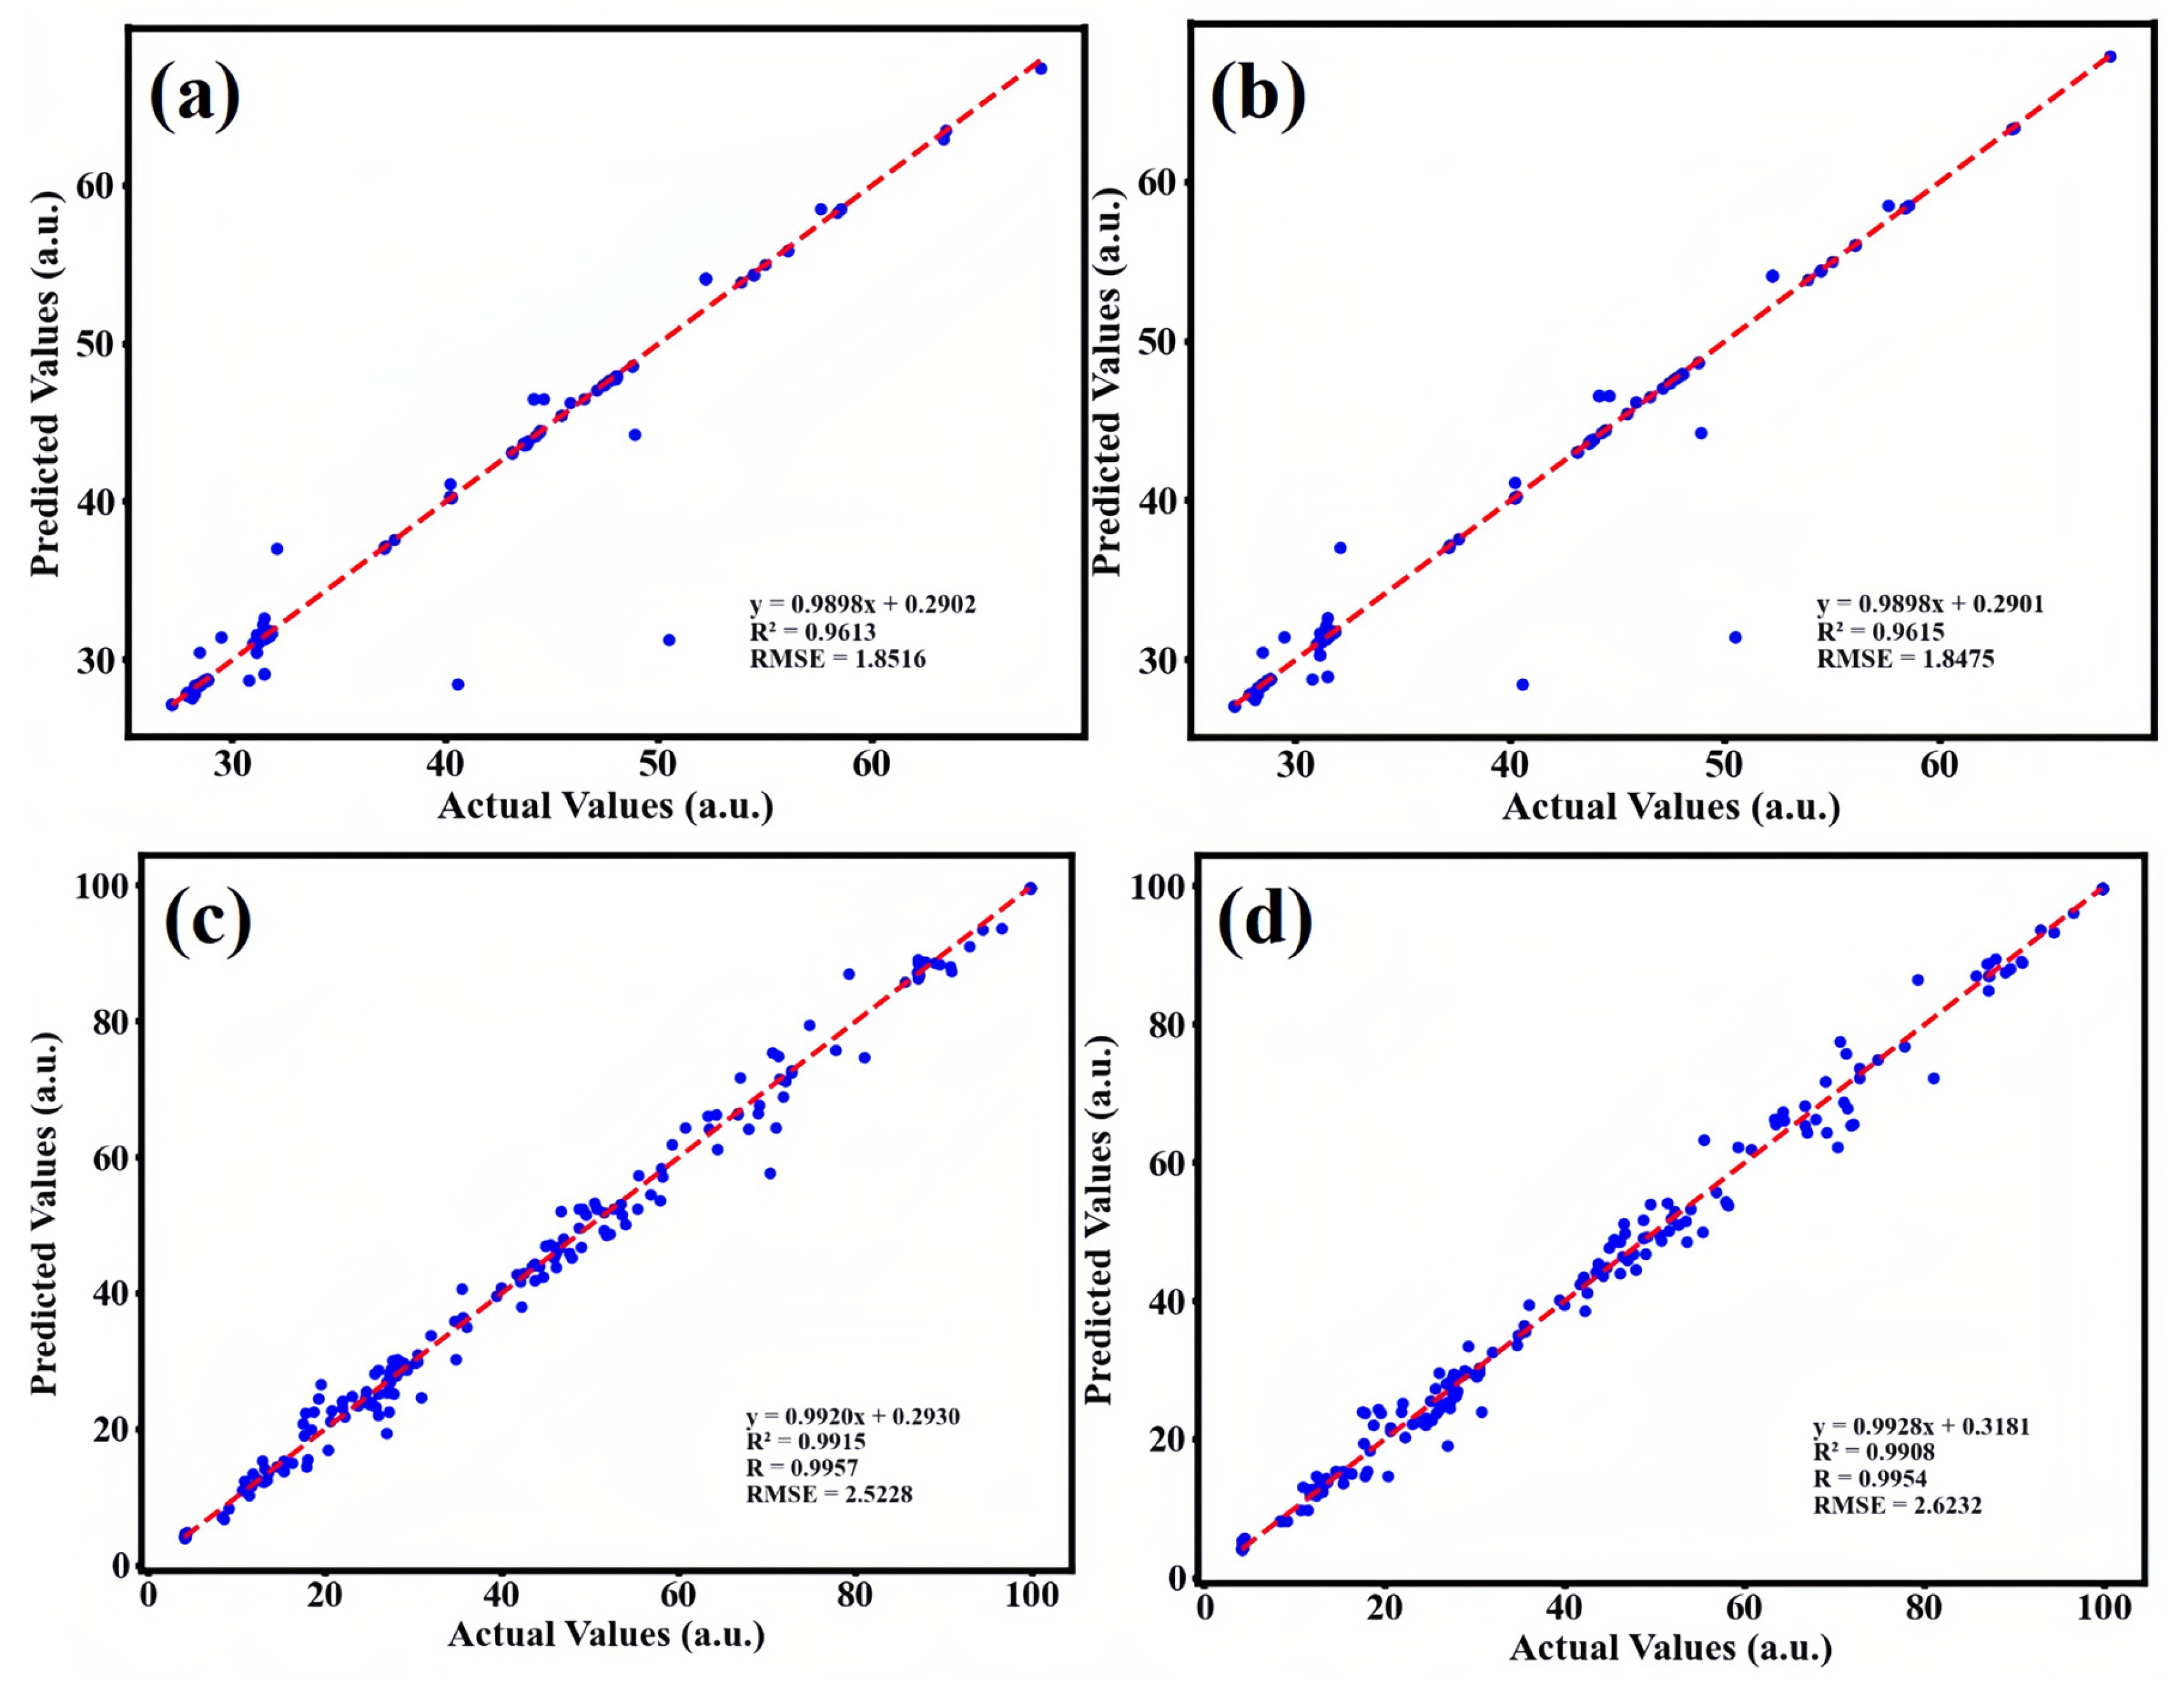
This study employed four methods, UV absorption spectroscopy, fluorescence emission spectroscopy, UV-fluorescence data-level fusion, and UV-fluorescence feature-level fusion, to conduct Bayesian-optimized random forest and optimized XGBoost modeling for prediction. Based on the prediction results of R2 and RMSE in the test set, the XGBoost modeling based on UV-fluorescence feature-level fusion proposed in this paper demonstrated the best performance. The modeling results are shown in the following figures. Specifically, Figure 8c and Figure 9c represent the XGBoost prediction results for the original UV and fluorescence data respectively, while (d) in Figure 8 and Figure 9 shows the optimized XGBoost prediction results after optimization. (e) and (f) in Figure 8 and Figure 9 represent the optimized XGBoost modeling prediction results after feature extraction using SPA and CARS for UV and fluorescence spectra, respectively. Figure 10a shows the XGBoost modeling prediction results for UV-fluorescence data-level fusion, while Figure 10b shows the optimized XGBoost modeling prediction results after UV-fluorescence data-level fusion optimization. Figure 10c shows the XGBoost modeling prediction results for UV-fluorescence feature-level fusion, and Figure 10d shows the optimized XGBoost modeling prediction results after UV-fluorescence feature-level fusion optimization.
Figure 10.
(a,b) presents the modeling results of UV-fluorescence data-level fusion; (c,d) demonstrates the modeling results of UV-fluorescence feature-level fusion.
To clearly compare the prediction results of the aforementioned models, Table 1 presents the performance of four different methods in both the Bayesian-optimized RF model and the optimized XGBoost model. The data in Table 1 reveals that the XGBoost method optimized based on UV-fluorescence feature-level fusion achieves the best results on both the training set and the test set. Specifically, the R2 value on the training set is 0.9999 with an RMSE of 0.0120 mg/L, while on the test set, the R2 value is 0.9915 with an RMSE of 2.6663 mg/L. These experimental data fully demonstrate that using UV-fluorescence feature-level fusion combined with the optimization algorithm XGBoost model can improve the stability and robustness of the model, exhibiting excellent predictive generalization performance.
Table 1.
Comparison of model prediction results for Cu2+ concentration in pure water.
To ensure the robustness of the model evaluation and avoid bias from a single random split, we employed 5-fold cross-validation. The dataset was randomly partitioned into five equal-sized subsamples. A single subsample was retained as the validation data for testing the model, and the remaining four subsamples were used as training data. This process was repeated five times, with each subsample used exactly once as the validation data. The results indicate a mean R2 of 0.9908± 0.0014 and a mean RMSE of 2.7604 ± 0.2995 mg/L across the five folds. The low standard deviation suggests that the XGBoost model is stable and generalizes well across different data subsets, validating the reliability of the reported performance.
It is important to note that the experiments were conducted in purified water to establish a baseline performance without matrix interference. The observed discrepancy between the training and test RMSE is therefore not due to the model failing to generalize against complex environmental noise, but rather reflects the intrinsic limitations of the optical probe in the high-concentration regime. In purified water, the primary source of error is the signal saturation and quenching of the CDs at concentrations approaching 100 mg/L. The XGBoost model achieved a high R2, indicating it has effectively modeled the probe’s behavior up to its physical limits. The residual RMSE of 2.67 mg/L represents the boundary of quantification accuracy for this specific probe-sensor system in an ideal environment.
As shown in Table 2, although ICP-MS and AAS offer higher sensitivity, they are not suitable for rapid, high-throughput screening due to their high operational costs and time-consuming sample preparation. In contrast, while CDs fluorescence sensors are low-cost and fast, their accuracy is often compromised in complex environments due to spectral interference or signal saturation at high concentrations. The method proposed in this paper strikes a balance between these two approaches: it retains the low-cost and rapid advantages of optical sensing while significantly improving accuracy and robustness through the XGBoost fusion algorithm.
Table 2.
Comparison of the proposed method with existing analytical techniques.
3.8. Real Sample Analysis
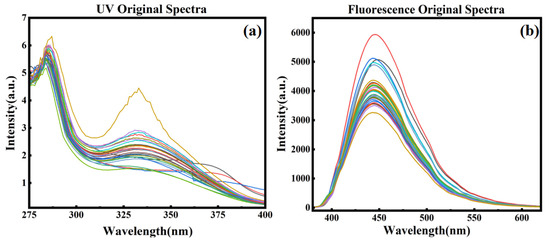
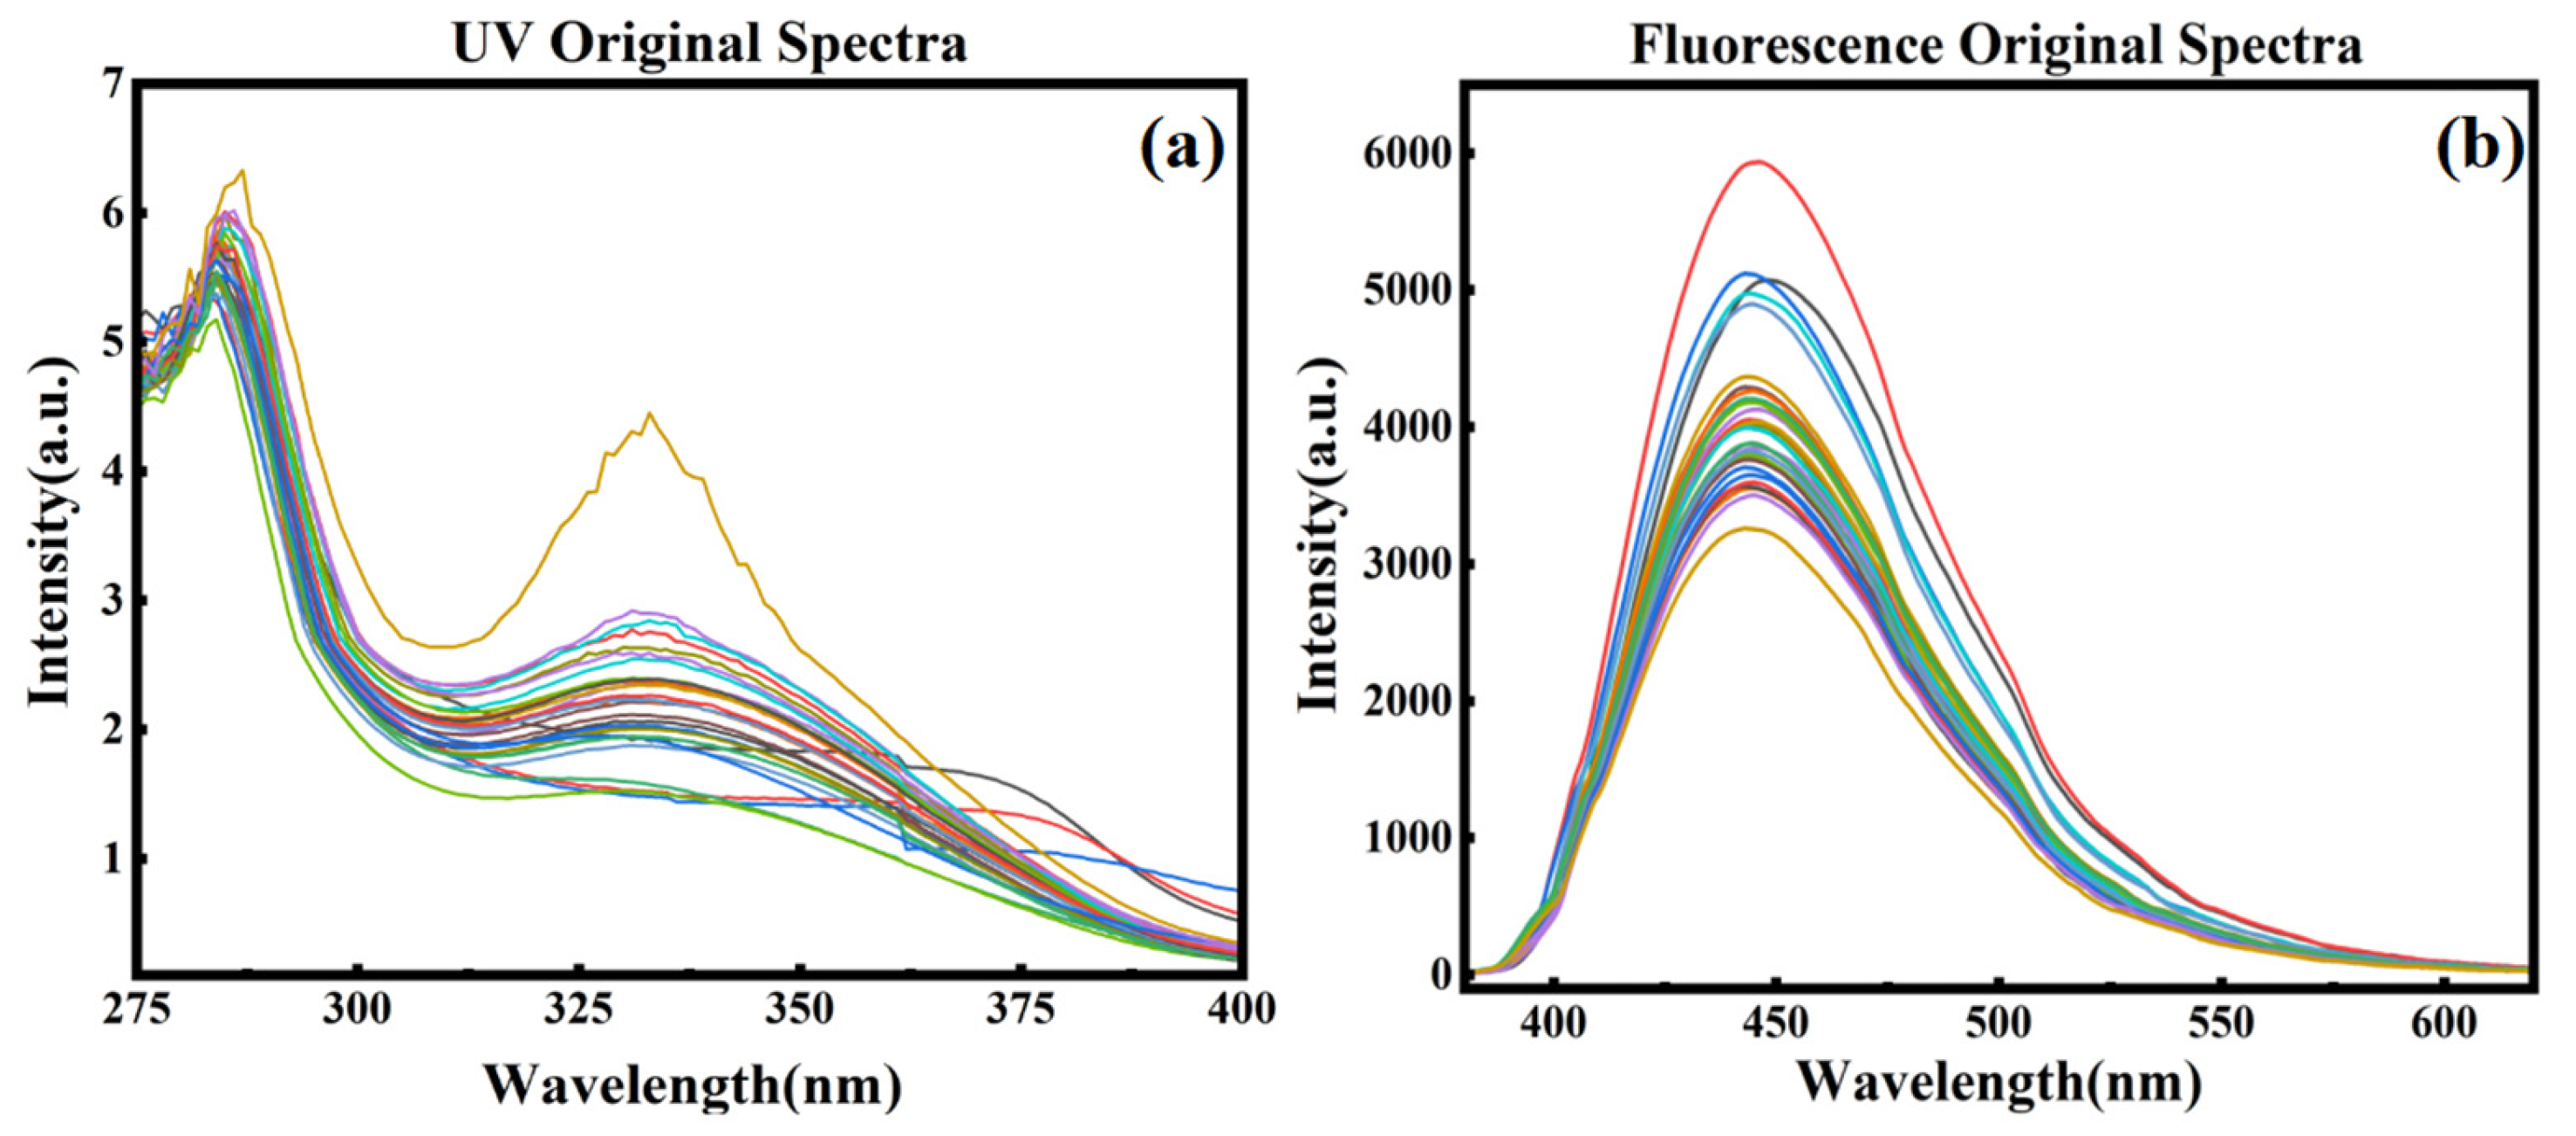
To evaluate the effectiveness of the method in practical applications, a total of 30 water samples were collected from different areas at the Yuhua Lake sampling site at Yunnan Minzu University. After collection, the samples were allowed to stand for one day. Subsequently, UV and fluorescence spectra were recorded for each sample using a spectrophotometer, with 50 measurements taken for each sample. The acquisition parameters for the UV spectra were consistent with those for the standard solutions. The fluorescence spectra were acquired with excitation at 350 nm, an excitation slit width of 5 nm, and an emission slit width of 1 nm. Figure 11 shows the UV absorption spectra and fluorescence emission spectra of the actual water samples, respectively.
Figure 11.
(a) UV spectrum of the actual water sample; (b) fluorescence spectrum of the actual water sample.
Since the optimal model for the standard solutions is the optimized XGBoost model, the actual water samples will be analyzed using the optimized XGBoost model. After pretreating and analyzing the actual water samples, SPA and CARS feature extraction were performed separately. Subsequently, XGBoost modeling was optimized based on UV absorption spectra, fluorescence emission spectra, data-level fusion of UV and fluorescence data, and feature-level fusion of UV and fluorescence data. The modeling results are shown in Figure 12 and Figure 13.
Figure 12.
(a,b) UV spectra of actual water samples following SPA and CARS modeling; (c,d) fluorescence spectra of actual water samples following SPA and CARS modeling.
Figure 13.
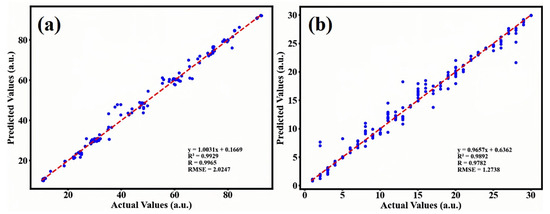
(a) Data-level fusion modeling results for actual water samples; (b) feature-level fusion modeling results for actual water samples.
To facilitate the evaluation of the performance of copper ion detection models in actual water bodies, a comprehensive comparison was conducted of all quantitative analysis models developed in this study. The test set R2 and RMSE were uniformly adopted as evaluation metrics. The closer the RP2 is to 1, the better the model’s fit and predictive capability; conversely, a smaller RMSE is preferable, as it indicates a smaller prediction error. By comprehensively comparing these metrics, one can clearly determine the relative strengths and weaknesses of different modeling methods in predicting copper ion concentrations in actual water bodies. The comparison results are shown in Table 3.
Table 3.
Modeling performance of each optimal model.
The comparison results in the table above clearly show that there are significant differences in the performance of different modeling methods when predicting copper ion concentrations in actual water samples. Compared to the single-fluorescence spectral model, the data-level fusion model reduced the RMSE on the test set by approximately 19.8%, demonstrating the advantages of multispectral information fusion, which can improve the model’s predictive accuracy through complementary information. As for the feature-level fusion model, its test set R2 was 0.9892; although slightly lower than the 0.9929 of the data-level fusion model, its test set RMSE was significantly reduced to 1.2738 mg/L—a decrease of approximately 37.1% compared to the 2.0247 mg/L of the data-level fusion model, approximately 49.5% compared to the single fluorescence spectroscopy model, and approximately 31.1% compared to the single UV spectroscopy model. These results indicate that feature-level fusion, by first performing independent feature extraction on different spectra, can more effectively screen out the key information that contributes most to the prediction of target, eliminating redundancy and interference. Consequently, while maintaining a certain level of training fit, it greatly enhances the model’s predictive accuracy and generalization ability, enabling it to demonstrate the strongest practicality and reliability in complex real water samples matrices.
3.9. Limitations
Although the proposed UV-fluorescence feature-level fusion model combined with XGBoost demonstrated excellent predictive accuracy and robustness in the experimental setup, it still has some shortcomings:
- The diversity and representativeness of the samples need to be further improved. The actual water samples used in this study were primarily collected from different areas of Yuhua Lake on the campus of Yunnan Minzu University, which limits the range of substrate compositions and types of contaminants analyzed.
- Although the model demonstrates high predictive accuracy, the limitations of the sample size (n = 25) must be acknowledged. The model’s generalizability relies on the strong physical correlation between spectral features and target attributes (the Beer-Lambert law), which enables robust learning even with a limited sample size. However, the model’s application is primarily restricted to samples with matrix characteristics similar to those in the training data. For water samples derived from different geological origins or with significantly different physicochemical properties, domain adaptation or local calibration is required to maintain predictive accuracy.
- The performance of this model is ultimately limited by the physical constraints of the optical probe. Within the experimental concentration range, the carbon-dot probe exhibits severe fluorescence quenching and internal filtering effects. Although the XGBoost algorithm successfully modeled this nonlinear behavior, the RMSE of 2.67 mg/L reflects the quantitative accuracy limit of this probe–sensor system.
4. Conclusions
This study utilizes nano-fluorescent carbon dots as the sensing medium and employs ultraviolet and fluorescence spectrophotometers to characterize and collect spectral data from purified water and real water samples containing varying concentrations of Cu2+. An optimized XGBoost prediction model based on UV-fluorescence feature-level fusion was constructed. This study evaluated the performance of four methods in the Bayesian optimization random forest algorithm and the optimized XGBoost prediction model. Experimental results indicate that the UV-fluorescence feature-level fusion combined with the XGBoost prediction model exhibits excellent generalization ability and robustness. Specifically, for purified water, the R2 value for the training set was 0.9999, with a root mean square error of 0.0120 mg/L; while for the test set, the R2 value was 0.9915, with an RMSE of 2.6663 mg/L. For actual water samples, the R2 value for the test set is 0.9892, and the RMSE is 1.2738 mg/L. The primary methodological contribution of this work lies in demonstrating that feature-level fusion can effectively integrate complementary spectral information to mitigate interference, while the optimized XGBoost algorithm successfully overcomes the non-linear limitations inherent in traditional optical sensing. This validates a robust “spectral fusion + machine learning” paradigm for accurate quantification in complex scenarios. Notably, the calculated LOQ is higher than the maximum concentration (100 mg/L) used in this study. This suggests that within the 4–100 mg/L range, the fluorescence response of the CDs probe exhibits non-linearity due to the Inner Filter Effect and dynamic quenching. In traditional spectral fluorimetry, this would render the probe unsuitable for quantitative analysis in this range. However, this study demonstrates that the XGBoost algorithm with feature-level fusion can overcome this limitation by capturing the complex, non-linear relationships between the spectral features and the concentration, thereby enabling accurate quantification even in the presence of severe signal distortion. However, due to the precision requirements of experimental data, computational complexity limitations, and data redundancy issues caused by similarity among samples, verifying the applicability of this model in different actual water environments will be a key focus of future research.
Author Contributions
Writing—original draft preparation, validation, formal analysis, M.Z.; methodology, software, data curation, J.S.; conceptualization, writing—review and editing, funding acquisition, J.T. and F.Z.; investigation, W.X.; resources, T.X.; project administration, supervision, G.C. and C.Z. All authors have read and agreed to the published version of the manuscript.
Funding
This work was supported by the Yunnan Provincial Science and Technology Plan Project (No. 202301AU070127, 202501AT070359), Yunnan Provincial Department of Science and Technology Key R&D Program (No. 202403AA080004), Yunnan Provincial Xingdian Talent Plan Support Project and Innovative Research Team (in Science and Technology) at the University of Yunnan Province.
Institutional Review Board Statement
Not applicable.
Informed Consent Statement
Not applicable.
Data Availability Statement
The data presented in this study are available on request from the corresponding author.
Conflicts of Interest
The authors declare no conflicts of interest.
References
- Oladimeji, T.; Oyedemi, M.; Emetere, M. Review on the impact of heavy metals from industrial wastewater effluent and removal technologies. Heliyon 2024, 10, 40370. [Google Scholar] [CrossRef] [Scilit]
- Javed, A.; Arnillas, C.A.; Saha, R.; Chang, R.; Arhonditsis, G.B. Striking a balance between food security and water quality: A modelling analysis of agricultural management practices in mitigating non-point source phosphorus pollution. Sci. Total Environ. 2025, 974, 179135. [Google Scholar] [CrossRef] [Scilit]
- Kong, Y.; Zhou, Q.; Wang, R.; Li, J.; Shao, J.; Fan, Y.; Chen, Q. Variation characteristics of dissolved organic matter along with functional microbes in a full-scale urban domestic wastewater treatment plant. J. Water Process Eng. 2025, 72, 107626. [Google Scholar] [CrossRef] [Scilit]
- Adnan, M.A.M.; Majnis, M.F.; Adnan, W.N.W.M.; Abdullah, N.H.; Baharom, A.S.; Julkapli, N.M. Deep insights into the integration of Artificial Neural Networks (ANNs) for predicting the photocatalytic activities of metal-based catalysts in water pollutant reduction. J. Environ. Chem. Eng. 2025, 13, 116350. [Google Scholar] [CrossRef] [Scilit]
- Sharkawy, E.M.; Alotaibi, M.O.; Li, J.; Du, D.; Mahmoud, E. Heavy Metal Pollution in Coastal Environments: Ecological Implications and Management Strategies: A Review. Sustainability 2025, 17, 701. [Google Scholar] [CrossRef] [Scilit]
- Harahap, R.I.M.; Kurniati, I.; Suraya, N.; Rostini, T.; Ropii, B.; Bethasari, M. Comparative Analysis of Serum Magnesium Ion Levels Using Three Measurement Methods: Spectrophotometry, Atomic Absorption Spectrophotometry, and Inductively Coupled Plasma with Optical Emission Spectrophotometry. Int. J. Anal. Chem. 2025, 2025, 8853568. [Google Scholar] [CrossRef] [Scilit]
- Huang, P.; Mao, T.; Yu, Q.; Cao, Y.; Yu, J.; Zhang, G.; Hou, D. Classification of water contamination developed by 2-D Gabor wavelet analysis and support vector machine based on fluorescence spectroscopy. Opt. Express 2019, 27, 5461–5477. [Google Scholar] [CrossRef] [Scilit] [PubMed]
- Wang, Y.; Lou, S.; Liu, X.; Zhang, L. Detection of trace metal ions in high-purity boric acid by online two-dimensional valve switching coupled with ion chromatography-inductively coupled plasma mass spectrometry. Microchem. J. 2020, 155, 104661. [Google Scholar] [CrossRef] [Scilit]
- Udhayakumari, D. A Review of Nanotechnology-Enabled Fluorescent Chemosensors for Environmental Toxic Ion Detection. J. Fluoresc. 2024, 34, 2351–2369. [Google Scholar] [CrossRef] [Scilit]
- Yang, L.; Driscol, J.; Sarigai, S.; Wu, Q.; Lippitt, C.D.; Morgan, M. Towards Synoptic Water Monitoring Systems: A Review of AI Methods for Automating Water Body Detection and Water Quality Monitoring Using Remote Sensing. Sensors 2022, 22, 2416. [Google Scholar] [CrossRef] [Scilit]
- Bai, X.; Wang, J.; Chen, R.; Kang, Y.; Ding, Y.; Lv, Z.; Ding, D.; Feng, H. Research progress of inland river water quality monitoring technology based on unmanned aerial vehicle hyperspectral imaging technology. Environ. Res. 2024, 257, 119254. [Google Scholar] [CrossRef] [Scilit] [PubMed]
- Miura, A.; Parra, L.; Lloret, J.; Catalá-Icardo, M. UV Absorption Spectrum for Dissolved Oxygen Monitoring: A Low-Cost Proposal for Water Quality Monitoring. Photonics 2023, 10, 1369. [Google Scholar] [CrossRef] [Scilit]
- Bennun, L.; Parra, M.M.L.; Greaves, D.E. Determination of Arsenic in Water by Total Reflection X-Ray Fluorescence Spectrometry (TXRF) by Capture on a Copper Film. Anal. Lett. 2025, 58, 680–687. [Google Scholar] [CrossRef] [Scilit]
- Chen, W.; Cao, D. Luminescence nanomaterials and applications. Nanomaterials 2023, 13, 1047. [Google Scholar] [CrossRef] [Scilit] [PubMed]
- Kong, J.; Wei, Y.; Zhou, F.; Shi, L.; Zhao, S.; Wan, M.; Zhang, X. Carbon quantum dots: Properties, preparation, and applications. Molecules 2024, 29, 2002. [Google Scholar] [CrossRef] [Scilit]
- Pandiyan, S.; Arumugam, L.; Srirengan, S.P.; Pitchan, R.; Sevugan, P.; Kannan, K.; Pitchan, G.; Hegde, T.A.; Gandhirajan, V. Biocompatible carbon quantum dots derived from sugarcane industrial Wastesfor effective nonlinear optical behavior and antimicrobial activity applications. ACS Omega 2020, 5, 30363–30372. [Google Scholar] [CrossRef] [Scilit]
- Shi, Y.; Wang, F.; Xie, H.; Fan, B.; Kong, Z.; Huang, Y.; Wang, Z.; Lei, D.; Li, M. Model for prediction of pesticide residues in soybean oil using partial least squares regression with molecular descriptors selected by a competitive adaptive reweighted sampling algorithm. Agric. Commun. 2024, 2, 100053. [Google Scholar]
- Souza, D.L.L.; Candeias, D.N.C.; Moreira, E.D.T.; Diniz, P.H.G.D.; Springer, V.H.; de Sousa Fernandes, D.D. UV–Vis spectralprint-based discrimination and quantification of sugar syrup adulteration in honey using the Successive Projections Algorithm (SPA) for variable selection. Chemom. Intell. Lab. Syst. 2025, 257, 105314. [Google Scholar] [CrossRef] [Scilit]
- Zhang, J.; Liu, Y.; Tian, Z. Application of Bayesian Optimized Random Forest Model in Drinking Water Quality Prediction. Int. Core J. Eng. 2025, 11, 142–148. [Google Scholar]
- Baziar, M.; Behnami, A.; Jafari, N.; Mohammadi, A.; Abdolahnejad, A. Machine learning-based Monte Carlo hyperparameter optimization for THMs prediction in urban water distribution networks. Water Process Eng. 2025, 73, 107683. [Google Scholar] [CrossRef] [Scilit]
- Jiang, K.; Zhang, L.; Lu, J.; Xu, C.; Cai, C.; Lin, H. Triple-Mode Emission of Carbon Dots: Applications for Advanced Anti-Counterfeiting. Angew. Chem. Int. Ed. 2016, 55, 7231–7235. [Google Scholar] [CrossRef] [Scilit]
- Soares, S.F.C.; Gomes, A.A.; Araujo, M.C.U.; Galvão Filho, A.R.; Galvão, R.K.H. The successive projections algorithm. TrAC. Trends Anal. Chem. 2013, 42, 84–98. [Google Scholar] [CrossRef] [Scilit]
- Uyanık, G.K.; Güler, N. A study on multiple linear regression analysis. Procedia Soc. Behav. Sci. 2013, 106, 234–240. [Google Scholar] [CrossRef] [Scilit]
- Li, J.; Li, J. Analysis of the Current Situation and Influencing Factors of China’s Carbon Emissions—Based on the Multiple Linear Regression Model. Financ. Eng. Risk Manag. 2023, 6, 48–57. [Google Scholar]
- Li, Y.; Yang, X. Quantitative analysis of near infrared spectroscopic data based on dual-band transformation and competitive adaptive reweighted sampling. Spectrochim. Acta Part A 2023, 285, 121924. [Google Scholar] [CrossRef] [Scilit] [PubMed]
- Choudhury, A.; Mondal, A.; Sarkar, S. Searches for the BSM scenarios at the LHC using decision tree-based machine learning algorithms: A comparative study and review of random forest, AdaBoost, XGBoost and LightGBM frameworks. Eur. Phys. J. Spec. Top. 2024, 233, 3289–3327. [Google Scholar]
- Wang, C.Y.; Shang, S.; Zheng, X.; Lei, P.; Han, J.; Yuan, L.; Li, Z.; Wang, R.; Gong, W.; Tang, J.; et al. Fluorescent Sensors Based on Cu-Doped Carbon Quantum Dots for the Detection of Rutin. J. Braz. Chem. Soc. 2018, 30, 988–996. [Google Scholar] [CrossRef] [Scilit]
- Architha, N.; Ragupathi, M.; Shobana, C.; Selvankumar, T.; Kumar, P.; Lee, Y.S.; Selvan, R.K. Microwave-assisted green synthesis of fluorescent carbon quantum dots from Mexican Mint extract for Fe3+ detection and bio-imaging applications. Environ. Res. 2021, 199, 111263. [Google Scholar] [CrossRef] [Scilit]
- Sial, Q.A.; Singh, R.; Duy, L.T.; Iqbal, S.; Yoo, I.-H.; Kalanur, S.S.; Seo, H. Nitrogen-doped carbon dots anchored 1-D WO3 for enhanced solar water splitting: A nano surface imaging evidence of charge separation and accumulation. Int. J. Hydrogen Energy 2021, 46, 32546–32558. [Google Scholar] [CrossRef] [Scilit]
- Li, Y.; Chen, K.; Yu, H.; Song, Y.; Du, Y. Nitrogen-doped carbon dots@COFBTH-TT composite for high-performance lithium ions battery anode. Ionics 2024, 30, 95–103. [Google Scholar] [CrossRef] [Scilit]
- Kumar, A.; Kumar, A.; Sharma, G.; Naushad, M.; Stadler, F.J.; Ghfar, A.A.; Dhiman, P.; Saini, R.V. Sustainable nano-hybrids of magnetic biochar supported g-C3N4/FeVO4 for solar powered degradation of noxious pollutants-Synergism of adsorption, photocatalysis & photo-ozonation. J. Clean. Prod. 2017, 165, 431–451. [Google Scholar]
- Chen, S.; Ouyang, W.; Zhu, Y.; He, L.; Zou, L.; Ao, X.; Liu, S.; Yang, Y.; Li, J. Facile synthesis of N, S-doped carbon quantum dots from food waste as fluorescent probe for sensitive detection of thiamphenicol and its analogues in real food samples along with an application in bioimaging. Foods 2022, 11, 2414. [Google Scholar] [CrossRef] [Scilit]
- Li, L.S.; Jiao, X.Y.; Zhang, Y.; Cheng, C.; Huang, K.; Xu, L. Green synthesis of fluorescent carbon dots from Hongcaitai for selective detection of hypochlorite and mercuric ions and cell imaging. Sens. Actuators B 2018, 263, 426–435. [Google Scholar] [CrossRef] [Scilit]
- Shang, S.; Shang, S. Estimating Gini Coefficient from Grouped Data Based on Shape-Preserving Cubic Hermite Interpolation of Lorenz Curve. Mathematics 2021, 9, 2551. [Google Scholar] [CrossRef] [Scilit]
- Yuan, P.; Qiao, Z.; Zhu, D.; Zhao, Y.; Zhou, Y.; Xu, H.; Wu, B.; Lin, Q. Noise Processing of Ocean Absolute Gravity Data Based on Savitzky-golay Filtering Algorithm. J. Phys. Conf. Ser. 2023, 2651, 012008. [Google Scholar]
- Wang, R.; Qi, Y.; Zhang, Q.; Wen, F. A multi-step water quality prediction model based on the Savitzky-Golay filter and Transformer optimized network. Environ. Sci. Pollut. Res. 2023, 30, 109299–109314. [Google Scholar] [CrossRef] [Scilit] [PubMed]

Disclaimer/Publisher’s Note: The statements, opinions and data contained in all publications are solely those of the individual author(s) and contributor(s) and not of MDPI and/or the editor(s). MDPI and/or the editor(s) disclaim responsibility for any injury to people or property resulting from any ideas, methods, instructions or products referred to in the content. |
© 2026 by the authors. Licensee MDPI, Basel, Switzerland. This article is an open access article distributed under the terms and conditions of the Creative Commons Attribution (CC BY) license.