Article

Semi-Quantitative Mineralogical Analysis of Ceramic Coatings and Their Raw Materials Using ATR-FTIR Spectroscopy


by
Manuel Miguel Jordán Vidal
* and
María Belén Almendro-Candel
Department of Agrochemistry and Environment, Miguel Hernández University of Elche, 03202 Elche, Spain
*
Author to whom correspondence should be addressed.
Coatings 2026, 16(5), 530; https://doi.org/10.3390/coatings16050530
Submission received: 31 March 2026 / Revised: 24 April 2026 / Accepted: 24 April 2026 / Published: 28 April 2026
(This article belongs to the Special Issue Ceramic and Glass Material Coatings)

Highlights

What are the main findings?
  • A semi-quantitative ATR-FTIR method is developed for mineralogical characterization of ceramic coating materials.
  • Calcite is employed as an internal standard to normalize FTIR spectra and estimate relative molar absorptivity coefficients.
  • Derivative spectroscopy combined with nonlinear optimization (GAMS/CONOPT3 v. 3.17) improves resolution of overlapping spectral bands.
  • A detection limit of ~7 mol% is established, excluding bands with normalized intensities below 0.01.
What are the implications of the main findings?
  • Application to ceramic raw materials from Teruel and Castellón confirms the dominance of aluminosilicates and calcite, supporting the method’s applicability to real ceramic coating systems.

Abstract

Fourier Transform Infrared Spectroscopy (FTIR) is increasingly used for the mineralogical characterization of complex materials such as ceramics, soils and clays. However, its quantitative application remains limited due to spectral overlapping and matrix effects in solid samples. In this study, a semi-quantitative mineralogical analysis method based on Attenuated Total Reflectance FTIR (ATR-FTIR) is proposed. The method uses the principal absorption band of calcite as a normalization reference in order to estimate relative molar absorptivity coefficients according to the Lambert–Beer law. Experimental spectra obtained from pure minerals and laboratory mineral mixtures were analyzed using derivative spectroscopy and numerical optimization. The correlation between experimental and calculated spectra was performed using the GAMS equation modeling environment and the nonlinear programming solver CONOPT. Mineral mixtures were used to determine the minimum detectable band intensity and detection limits. Bands with normalized intensities lower than 0.01 were discarded, corresponding to a detection limit of approximately 7 mol%. Application of the proposed methodology to ceramic coatings samples from Teruel and Castellón demonstrated that the FTIR spectra are dominated by aluminosilicate bands associated with quartz and clay minerals, together with carbonate features attributable to calcite. These results are consistent with the expected mineralogical composition of ceramic raw materials and confirm the suitability of the method for analyzing natural samples. However, the ATR-FTIR method presents several inherent limitations that may affect both the accuracy and reproducibility of spectral data.

1. Introduction

Mineralogical characterization plays a key role in understanding the physical and chemical behavior of ceramic materials. The mineral composition of raw materials strongly influences processing conditions, firing behavior and the final properties of ceramic products such as tiles, bricks and other structural ceramics. In particular, the relative proportions of clay minerals, quartz, feldspars and carbonates determine key technological parameters including plasticity, drying behavior, sintering temperature and mechanical strength of the fired body [1,2].
Therefore, accurate mineralogical analysis is essential for controlling the quality of ceramic raw materials and optimizing industrial ceramic formulations. X-ray diffraction (XRD) has traditionally been the primary technique used to identify crystalline phases in ceramic materials. This technique provides direct information about the crystal structure of minerals and allows qualitative and quantitative phase identification, making it one of the most widely used analytical tools in mineralogy and materials science [3,4]. In the ceramic industry, XRD is routinely applied to determine mineralogical composition, monitor phase transformations during firing, and evaluate the formation of new crystalline phases such as mullite or cristobalite at high temperatures.
However, spectroscopic techniques such as infrared spectroscopy are increasingly explored as complementary analytical tools because they allow rapid analysis with minimal sample preparation and can provide additional information about molecular vibrations and bonding environments within minerals. Infrared spectroscopy is particularly useful for identifying functional groups and structural units present in clay minerals, carbonates and silicates, which are common constituents of ceramic raw materials [5,6]. As a result, FTIR techniques have become valuable for the characterization of both crystalline and amorphous phases, especially when used alongside diffraction methods. Attenuated Total Reflectance Fourier Transform Infrared Spectroscopy (ATR-FTIR) enables direct analysis of powdered solid samples without complex preparation procedures such as pellet pressing with KBr.
Fourier Transform Infrared Spectroscopy (FTIR), particularly in attenuated total reflectance (ATR) mode, has become a widely used technique for the qualitative and semi-quantitative characterization of mineralogical and geochemical materials. Recent reviews have highlighted its versatility for solid-phase analysis, while also pointing to key limitations such as spectral band overlap, matrix effects, and the limited availability of robust mineral spectral libraries, which constrain both identification and quantification accuracy [7]. From a quantitative perspective, ATR-FTIR has shown good potential when combined with appropriate calibration strategies, achieving satisfactory predictive performance in complex mineral systems [8]. More recently, the integration of ATR-FTIR with chemometric tools has improved the interpretation of heterogeneous natural materials, particularly in studies addressing compositional variability and degradation processes [9]. In addition, increasing attention has been given to the influence of spectral pre-processing steps, including baseline correction and normalization, which have been shown to significantly affect model robustness and analytical performance [10]. Overall, these studies confirm that ATR-FTIR is a powerful analytical technique; however, its reliability strongly depends on appropriate methodological design and data treatment.
In ATR analysis, infrared radiation undergoes total internal reflection inside a crystal with a high refractive index (such as diamond, ZnSe or germanium), generating an evanescent wave that penetrates a few micrometers into the sample surface. The interaction between this evanescent wave and the sample produces an absorption spectrum that reflects the vibrational modes of the constituent minerals [8]. Due to its speed, simplicity and reproducibility, ATR-FTIR has become an increasingly useful technique for rapid mineral identification and quality control in ceramic raw materials.
The present study demonstrates the applicability of Attenuated Total Reflectance Fourier Transform Infrared spectroscopy (ATR-FTIR) as an effective tool for the mineralogical characterization of complex mineral mixtures and ceramic raw materials. The method allowed the identification of the principal mineral phases present in both synthetic mixtures and natural ceramic raw materials samples through the analysis of characteristic vibrational bands associated with silicates, carbonates, sulfates and hydroxyl groups.

2. Materials and Methods

2.1. FTIR Analysis

Fourier Transform Infrared (FTIR) spectra were collected using a Bruker IFS 66/S FTIR (Billerica, MA, USA) Spectrometer equipped with an Attenuated Total Reflectance (ATR) accessory. ATR-FTIR spectroscopy was selected because it allows rapid and reproducible analysis of powdered mineral samples without the need for complex sample preparation procedures such as KBr pellet formation. This technique has been widely used for mineralogical characterization due to its ability to detect vibrational modes associated with functional groups in silicates, carbonates and other mineral phases [5,6,7,8].
Finely powdered samples were gently pressed onto the ATR crystal (diamond) to ensure good contact between the sample surface and the internal reflection element. Prior to each measurement, a background spectrum was recorded under identical conditions in order to remove atmospheric contributions such as water vapor and carbon dioxide. All spectra were collected at room temperature under controlled laboratory conditions. For the FTIR analysis, fine powder of different mineral samples was placed with no further treatment on the glass window of the ATR-FTIR instrument spectrometer (BRUKER IFS 66/S). Spectra were recorded between 600 and 4000 cm−1 with an interval of 1.92849 cm−1. The selected interval of 1.92849 cm−1 corresponds to the instrument configuration and represents the native digital resolution of the spectrometer. Spectra were also compared to the RRUFF IR database [11,12].
The spectral acquisition parameters were selected to provide a suitable balance between spectral resolution and signal-to-noise ratio: spectral range: 600–4000 cm−1, spectral resolution: 2 cm−1 and number of scans: 64. The selected spectral range includes the most relevant vibrational regions for mineral identification, including the stretching and bending vibrations of Si–O bonds in silicates, CO32− vibrations in carbonates, and OH stretching modes in clay minerals. Increasing the number of scans improves the signal-to-noise ratio through signal averaging, which is particularly important for the identification of weak absorption bands [8]. All spectra were automatically corrected for background and normalized prior to further analysis.
Normalization refers to scaling spectra relative to the intensity of the main calcite band (~1400 cm−1), used as an internal reference (Figure 1). This step was necessary to compensate for variations in contact pressure and effective path length inherent to ATR measurements. The band around ~1400 cm−1 in calcite corresponds to the strong ν3 asymmetric stretching mode of the carbonate ion (CO32−). This region is typically chosen because (i) it is one of the most intense and well-defined peaks in calcite, (ii) it is relatively isolated, with minimal overlap from other phases in many mixtures, (iii) its intensity is proportional to the amount of calcite, making it a reliable internal reference and (iv) it is less sensitive to minor structural variations compared to weaker bands. By normalizing spectra to this peak, differences in overall absorbance are minimized, allowing meaningful comparison of other bands—especially those related to secondary phases like gypsum.

2.2. Mineral Samples and Standard Mixtures

To evaluate the applicability of FTIR spectroscopy for quantitative mineralogical analysis, three artificial mineral mixtures with known molar compositions were prepared using analytical-grade mineral standards. The selected minerals represent typical phases commonly found in ceramic raw materials and sedimentary environments, including silicates, carbonates, sulfates and iron oxide [11,12]. The compositions of the prepared mixtures are shown in Table 1. Although hematite exhibits its strongest absorption bands below 600 cm−1, weak Fe–O related features may still appear near the lower of the measured spectral range. Hematite was included as a representative iron oxide commonly present in ceramic raw materials, allowing evaluation of the method’s sensitivity to phases with low absorptivity. The total molar percentage of minerals in Mixture 3 (Quartz: 31.5 + Calcite: 16.2 + Sepiolite: 51.1 = 98.8 mol%) sums to 98.8% instead of 100%, leaving a 1.2 mol% deficit. The apparent deficit of 1.2 mol% in mineral mixture 3 is due to rounding of the individual component proportions during sample preparation and reporting. The original weighed molar fractions were normalized to 100%, but the values presented in Table 1 were rounded to one decimal place, leading to this minor discrepancy.
Each component mineral was individually ground and homogenized before being weighed according to the required molar proportions. The powders were subsequently mixed thoroughly in an agate mortar to obtain homogeneous mixtures suitable for spectroscopic analysis [13]. In addition to the synthetic mixtures, ceramic coatings bodies from two ceramic clays deposits located in Teruel (TE) and Castellon (CS) provinces (Spain) were analyzed in order to evaluate the applicability of the method to real ceramic materials [14]. The mineralogical composition of these samples is expected to include typical clay minerals, quartz, carbonates and accessory phases [15]. These raw materials and ceramic coatings bodies were also analyzed by FTIR. Replicate analyses were performed under identical conditions, and the variability in normalized band intensities was found to be within acceptable limits (relative standard deviation below 5%). This demonstrates the robustness of the ATR-FTIR measurements.

2.3. Estimation of Molar Absorptivity

The quantitative interpretation of FTIR spectra was based on the Lambert–Beer law, which describes the proportional relationship between absorbance and the concentration of absorbing species in a mixture. In a mineral mixture, the total absorbance measured at a given wavenumber can be expressed as the sum of the absorbance contributions from each individual mineral component (Figure 2). Because the ATR configuration does not provide a strictly constant optical path length across all samples, relative rather than absolute absorptivity values were estimated. In this study, calcite (CaCO3) was selected as a reference mineral due to the presence of a strong and well-defined absorption band associated with the asymmetric stretching vibration of the carbonate group near 1400 cm−1 [15].
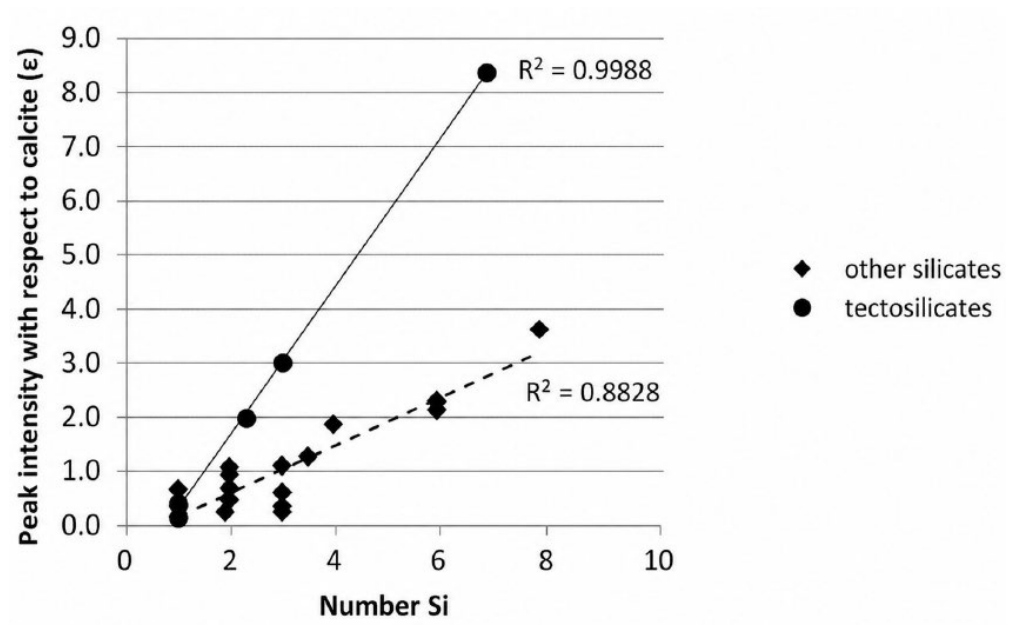
The main band intensities of several silicates with respect to calcite are a function of the number of Si atoms in the formula (Figure 2). The study shows that infrared (IR) absorption intensity in silicates is not determined solely by the number of silicon atoms, but is strongly influenced by their crystal structure. In particular, tectosilicates, which have a three-dimensional framework of interconnected SiO4 tetrahedra, exhibit significantly higher IR signal intensities than other silicate types with less polymerized structures. Quantitatively, each Si atom contributes approximately 1.3 intensity units in tectosilicates, whereas in other silicates the contribution is about 0.4 units per Si atom, representing up to a threefold difference.
This variation is attributed to structural factors such as vibrational coupling, crystal symmetry, and changes in dipole moment during vibrational modes. In conclusion, the IR intensity of silicates is strongly controlled by crystal structure, demonstrating that chemical composition alone is not sufficient to predict their spectroscopic behavior [15].

2.4. Spectral Processing and Optimization

Spectral preprocessing was performed to improve the identification and quantification of overlapping absorption bands. First- and second-order derivative spectra were calculated using numerical differentiation algorithms in order to enhance spectral resolution and reveal hidden features within complex spectral regions. Derivative spectroscopy is particularly useful when dealing with mineral mixtures in which multiple vibrational bands overlap significantly [6].
After preprocessing, parameter estimation was performed using the GAMS modeling environment with the nonlinear optimization solver CONOPT optimization solver [14,15]. The optimization procedure consisted of minimizing the difference between the experimental spectrum and a calculated spectrum obtained as a linear combination of the individual mineral spectra weighted by their estimated concentrations. GAMS equation modeling environment [14,15] and the NLP solver CONOPT (©ARKI Consulting and Development) were used to correlate the experimental data in the samples considered. The correlation procedure determines the parameters of:
I =   j = 1 a i j
where I is the signal intensity at a wave number (λ); i, the signal of each component at that λ and a, the number of components in the sample, providing the minimum of a selected objective function (O.F.):
O . F . = k = 1 3 i = 1 N d a t a Ω k , i , exp . Ω k , i , c a l c . 2 · w k
Here, Ndata denotes the total number of experimental points (1469). The term Ωk,i,exp corresponds to the experimental absorption values obtained from the IR instrument, or alternatively to their first or second derivatives with respect to frequency or time, depending on the value of k (1, 2, or 3, respectively). Ωk,i,cal refers to the value calculated from the proposed Equation (1). The parameter wk indicates the weighting assigned to each magnitude Ωk (i.e., IR data, first derivative, or second derivative) within the objective function (Equation (2)). The correlation procedure is carried out in two successive stages. In the first stage, the full set of NB standards is used to fit the experimental data. Subsequently, a second correlation is performed considering only those standards that, in the initial iteration, meet the following condition:
A m , j ( s t e p 1 ) > τ N a B , j · C e B , j
In this expression, NaB,j denotes the number of atoms and CeB,j the extinction coefficient corresponding to standard j, while B represents the tolerance parameter adopted in this study, set to 0.01. The total computational time required to complete the correlation procedure is approximately 3 s per analyzed sample.
This nonlinear least-squares approach allows simultaneous estimation of mineral contributions and relative absorptivity parameters, providing an optimized fit between measured and modeled spectral data [16]. Such optimization techniques have been increasingly applied in spectroscopic mixture analysis because they allow extraction of quantitative information even in the presence of overlapping spectral features [9].

2.5. Gypsum in Clay-Based Mixtures

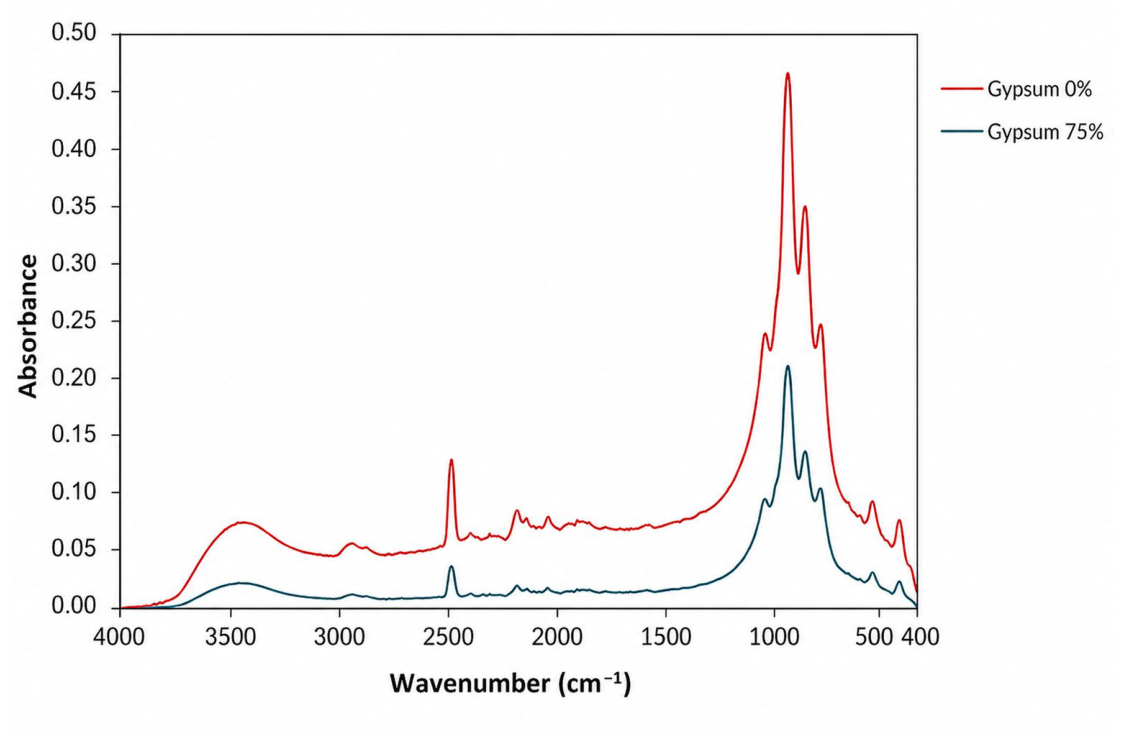
The detection limits of the FTIR method were evaluated using gypsum as a test mineral (Figure 3). Gypsum was selected because its main sulfate vibration band near 1100 cm−1 partially overlaps with silicate absorption bands commonly present in clay minerals and quartz. This spectral overlap represents a challenging scenario for mineral identification and therefore provides a suitable case for evaluating detection sensitivity.
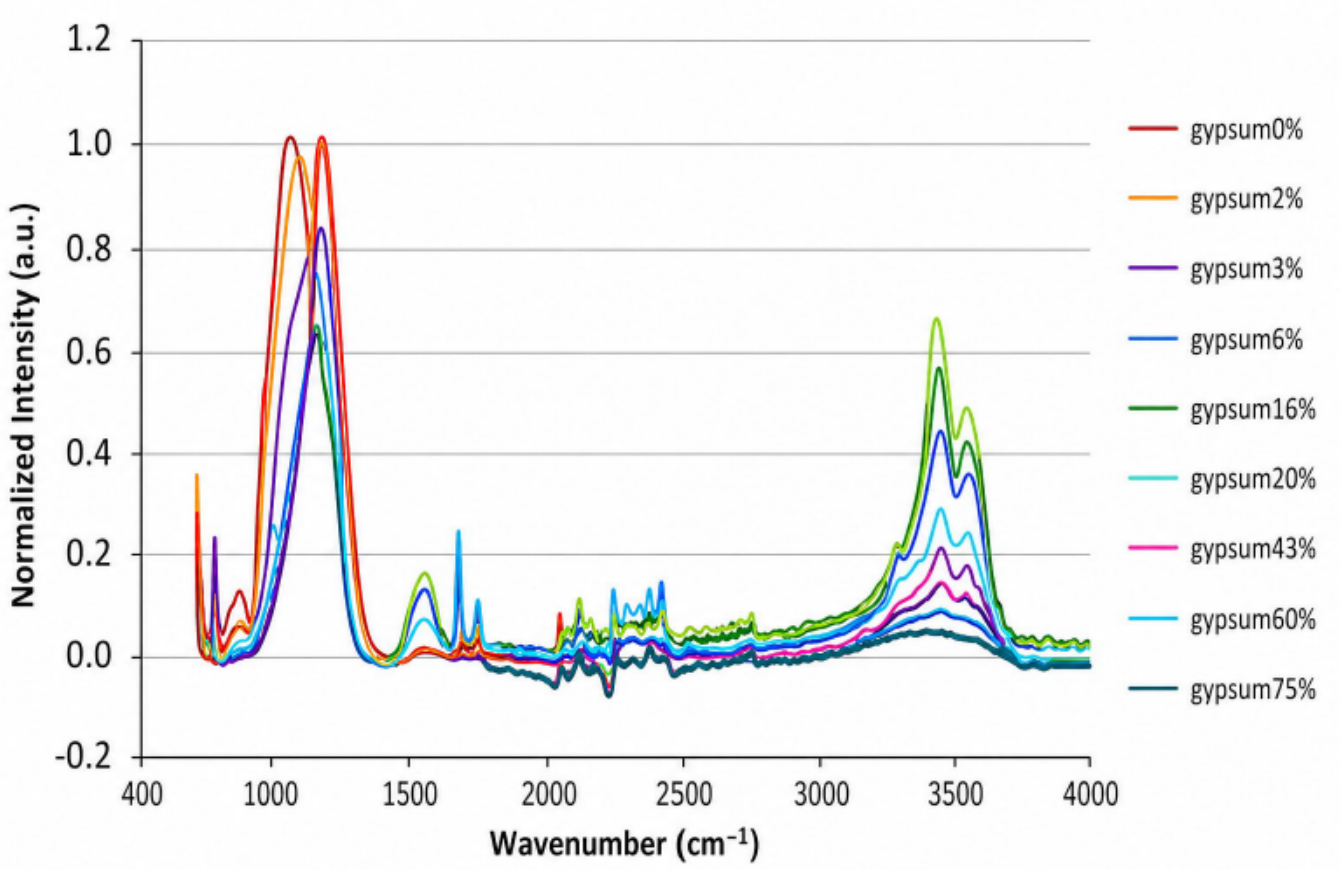
Normalization reduces absolute intensity information, it was necessary to minimize variability associated with ATR measurement conditions [14]. Normalized band intensities were calculated for gypsum at progressively lower concentrations within the mineral mixtures. Bands with normalized intensities below 0.01 were considered indistinguishable from spectral noise and therefore classified as undetectable (Figure 4).
This criterion allowed estimation of the practical detection limit for gypsum within complex mineral mixtures. Establishing such limits is essential when applying FTIR spectroscopy to natural samples, where minor mineral phases may be present at very low concentrations and may not produce clearly identifiable spectral features. In FTIR spectroscopy, the OH stretching region (≈3200–3700 cm−1) should show a signal in clays, since they contain water and hydroxyl groups. However, the low intensity observed in 100% clay samples (such as Vermiculite and Sepiolite) can be justified by several factors:
(i) Water loss (dehydration): These clays contain adsorbed and/or interlayer water, which is relatively weakly retained. During preparation (drying, vacuum, grinding) or even during the FTIR measurement, they may lose some of that water. As a result, the typical broad OH band (~3200–3500 cm−1) decreases noticeably [14,15].
(ii) Low relative intensity of structural OH groups: The structural OH groups (especially in sepiolite) generate weaker and narrower bands (≈3600–3700 cm−1) [14,15].
(iii) Dominance of Si–O bands: Clay minerals exhibit very intense bands in the ~1000 cm−1 region (Si–O stretches). This causes the spectrum, without normalization, to be “dominated” by that region, and the OH bands appear insignificant in comparison.

2.6. Relative Molar Absorptivities of the Studied Minerals

Using the quantitative model described in this paper, relative molar absorptivities were estimated for the principal diagnostic bands of each mineral phase present in the synthetic mixtures [17,18]. Calcite was used as the reference mineral and its carbonate stretching band near 1400 cm−1 was assigned a normalized absorptivity value of 1.00 (Table 2). The absorptivity coefficients were obtained by fitting the measured spectra of the mineral mixtures to the spectral model through nonlinear optimization. The results provide relative absorptivity values that allow comparison between minerals and facilitate semi-quantitative estimation of mineral proportions in unknown samples.
The calculated absorptivity values indicate that carbonate groups produce the strongest infrared absorption in the studied mixtures, whereas oxide lattice vibrations (e.g., hematite) show significantly lower intensity within the measured spectral region. Absorptivity values for hematite were derived from reference spectra and literature data [12,15,19], not solely from the measured spectral range (600–4000 cm−1).
These relative coefficients (Table 3) were subsequently used in the optimization model to estimate mineral proportions in both synthetic mixtures and natural ceramic samples [21].

3. Results and Discussion

3.1. Spectral Characteristics of Synthetic Mineral Mixtures

The FTIR spectra of the synthetic mixtures exhibit complex absorption patterns resulting from the superposition of the characteristic vibrational bands of the constituent minerals. Despite the spectral overlap, several diagnostic features allow reliable identification of the mineral phases [21].
In mixture 1, the dominant spectral contributions arise from vermiculite and calcite. A strong absorption band around 1430–1470 cm−1 corresponds to the asymmetric stretching vibration of the carbonate group in calcite. Additional calcite bands at 875 cm−1 and 713 cm−1 confirm the presence of this mineral.
Silicate vibrations from vermiculite and quartz produce broad bands near 1000–1080 cm−1, associated with Si–O stretching modes. Vermiculite also contributes OH stretching bands in the region 3620–3650 cm−1 [14], which are typical of hydrated phyllosilicates.
The presence of gypsum is indicated by sulfate stretching vibrations near 1100 cm−1, although these partially overlap with silicate bands. Weak absorption features below 600 cm−1 correspond to Fe–O lattice vibrations of hematite [15].

3.2. Spectral Interpretation of Mineral Mixtures

The spectrum of mineral mixture 2 is dominated by contributions from quartz and calcite (Table 4). Quartz generates characteristic Si–O stretching bands near 1080 cm−1, together with secondary bands around 800 cm−1 and 695 cm−1. Calcite bands at 1430 cm−1 and 875 cm−1 remain clearly identifiable, providing a reliable reference for normalization of spectral intensities [14,15].
The discrepancy between actual and estimated compositions in synthetic mixtures (e.g., Mixture 1 hematite: 12.6% actual vs. 7.9% estimated) arise primarily from two factors: (i) spectral overlap among mineral phases, particularly in the silicate region (1000–1100 cm−1), and (ii) differences in relative molar absorptivities of the minerals. In particular, minerals such as hematite exhibit weak Fe–O lattice vibration bands (low absorptivity), which reduces their contribution to the overall spectrum and makes their quantification more sensitive to noise and overlapping signals [8,12,15,19]. Additionally, the nonlinear optimization process may preferentially fit dominant spectral features, potentially underestimating components with weaker or less distinct bands. The underestimation of hematite in Mixture 1 is mainly attributed to its low relative absorptivity (ε = 0.15), as indicated in Table 3. The Fe–O vibrational bands occur in the low wavenumber region (below 600 cm−1), where signal intensity is weaker and more susceptible to noise. Moreover, these bands may overlap with contributions from other minerals or fall near the lower of the spectral range, further complicating accurate quantification. As a result, the optimization procedure tends to underestimate hematite relative to minerals with stronger and more distinct absorption features [8,12,14,15,19].

3.3. Application to Ceramic Coatings Samples

The FTIR spectra obtained from the ceramic coating bodies from Teruel (TE) and Castellón (CS) exhibit spectral features typical of clay-based ceramic materials. In both samples, the spectral region 1000–1100 cm−1 is dominated by strong Si–O retching vibrations associated with quartz and clay minerals.
These bands are typical of aluminosilicate frameworks commonly present in ceramic raw materials (Table 4).
Carbonate bands near 1430 cm−1 and 875 cm−1 indicate the presence of calcite, which may originate from carbonate impurities in the clay deposits or from added fluxing materials used during ceramic processing. Weak OH stretching bands in the region 3600–3700 cm−1 suggest the presence of residual clay minerals such as smectite or vermiculite. In fired ceramic products these bands typically decrease in intensity due to dehydroxylation during firing [14,15].
Minor absorption features in the 500–600 cm−1 region may be attributed to iron oxide phases such as hematite, which are responsible for the reddish coloration commonly observed in ceramic materials (Table 5).

3.4. Detection Limits and Method Sensitivity

The detection limit study conducted using gypsum demonstrates the influence of spectral overlap on the identification of minor mineral phases. Because the sulfate stretching band near 1100 cm−1 overlaps with silicate bands, the effective detection threshold is higher than for minerals with isolated spectral features. Using the normalized intensity criterion (Inorm < 0.01) gypsum bands below this value were considered indistinguishable from spectral noise. The results indicate that gypsum can be reliably detected in mineral mixtures at concentrations of approximately 1–2 mol% under the experimental conditions used in this study. This detection limit is comparable to values reported in previous FTIR mineralogical studies and confirms the potential of ATR-FTIR spectroscopy as a rapid tool for semi-quantitative mineral analysis.

3.5. Implications for Ceramic Coatings Raw Material Characterization

The results demonstrate that ATR-FTIR spectroscopy, combined with spectral modeling and optimization techniques, provides a useful approach for the mineralogical characterization of ceramic raw materials. Although spectral overlap between silicate, carbonate and sulfate bands can complicate interpretation, the use of derivative spectroscopy and nonlinear fitting allows extraction of meaningful quantitative information. Compared with traditional diffraction techniques, FTIR analysis offers several advantages, including rapid measurement, minimal sample preparation and sensitivity to both crystalline and amorphous phases. Consequently, FTIR spectroscopy can serve as a complementary technique to X-ray diffraction for the routine analysis of mineral mixtures in ceramic materials [21,22]. However, the natural samples analyzed are limited to ceramic materials from the Teruel and Castellón regions (Spain), and therefore the conclusions should not be generalized to all ceramic raw materials without further validation [22,23,24,25,26].

4. Conclusions

The quantitative approach based on the Beer–Lambert law enabled the development of a spectral model in which the total absorbance of a mixture was expressed as the linear combination of the contributions of each mineral component. By using calcite as a reference mineral and normalizing the intensity of its carbonate band near 1400 cm−1, relative molar absorptivities were estimated for the main diagnostic bands of the studied minerals. This normalization procedure allowed comparison among spectra and facilitated semi-quantitative estimation of mineral proportions. The analysis of the synthetic mixtures confirmed that ATR-FTIR spectroscopy is capable of resolving complex mineral assemblages despite the presence of overlapping bands. The use of derivative spectroscopy significantly improved spectral resolution, allowing the identification of subtle features that would otherwise remain hidden in the original spectra. In addition, nonlinear optimization implemented through the GAMS modeling environment and the CONOPT optimization solver provided a reliable approach for fitting experimental spectra and estimating mineral contributions in multicomponent systems.
The detection limit analysis using gypsum indicated that mineral phases can be reliably detected at concentrations of approximately 1–2 mol%, depending on the degree of spectral overlap with other components. This sensitivity is adequate for routine mineralogical screening of ceramic raw materials. Overall, the results show that ATR-FTIR spectroscopy, combined with spectral preprocessing and nonlinear optimization techniques, constitutes a rapid and reliable complementary method for mineralogical analysis. While techniques such as X-ray diffraction remain the standard for crystallographic identification [24,25], FTIR provides additional information on molecular vibrations and functional groups and can be applied with minimal sample preparation. Consequently, the integration of FTIR spectroscopy with conventional mineralogical methods represents a promising approach for improving the characterization and quality control of ceramic materials [26,27]. However, the ATR-FTIR method presents several inherent limitations that may affect both the accuracy and reproducibility of spectral data. One important factor is the influence of grain size, as variations in particle dimensions can alter the effective contact area with the ATR crystal, leading to changes in measured absorbance intensity. Additionally, variability in contact pressure between the sample and the ATR crystal can introduce significant inconsistencies, since insufficient or uneven pressure reduces effective evanescent wave interaction and thereby affects signal strength [28,29]. Another limitation arises from spectral overlap, particularly in complex mineral mixtures where multiple vibrational bands may coincide, complicating peak assignment and quantitative interpretation [30]. Furthermore, phases with low IR absorptivity may produce weak signals that are difficult to distinguish from background noise, limiting detection sensitivity. Collectively, these factors highlight that ATR-FTIR results are strongly dependent on experimental conditions and sample properties, requiring careful standardization and interpretation.

Author Contributions

Conceptualization, M.M.J.V.; methodology, M.B.A.-C. and M.M.J.V.; investigation, M.M.J.V. and M.B.A.-C.; writing—original draft preparation, M.M.J.V.; writing—review and editing, M.B.A.-C. and M.M.J.V.; supervision, M.M.J.V. All authors have read and agreed to the published version of the manuscript.

Funding

This research received no external funding.

Institutional Review Board Statement

Not applicable.

Informed Consent Statement

Not applicable.

Data Availability Statement

Data available upon justified request and subject to permission constraints.

Acknowledgments

The authors would particularly like to thank Juana Jordá from University of Alicante, for her help in the mineralogical characterization of complex materials using ATR-FTIR spectroscopy.

Conflicts of Interest

The authors declare no conflicts of interest.

Abbreviations

The following abbreviations are used in this manuscript:
FTIRFourier Transform Infrared Spectroscopy
ATR-FTIRAttenuated Total Reflectance Fourier Transform Infrared Spectroscopy
XRDX-Ray Diffraction

References

  1. Dondi, M.; Raimondo, M.; Zanelli, C. Clays and bodies for ceramic tiles: Reappraisal and technological classification. Appl. Clay Sci. 2014, 96, 91–109. [Google Scholar] [CrossRef]
  2. Murray, H.H. Applied Clay Mineralogy; Elsevier: Amsterdam, The Netherlands, 2007. [Google Scholar]
  3. Cullity, B.D.; Stock, S.R. Elements of X-Ray Diffraction; Pearson: London, UK, 2014. [Google Scholar]
  4. Moore, D.M.; Reynolds, R.C. X-Ray Diffraction and the Identification and Analysis of Clay Minerals, 2nd ed.; Oxford University Press: New York, NY, USA, 1997. [Google Scholar]
  5. Farmer, V.C. The Infrared Spectra of Minerals; Mineralogical Society: London, UK, 1974. [Google Scholar]
  6. Madejová, J. FTIR techniques in clay mineral studies. Vib. Spectrosc. 2003, 31, 1–10. [Google Scholar] [CrossRef]
  7. Tkachenko, Y.; Niedzielski, P. FTIR as a Method for Qualitative Assessment of Solid Samples in Geochemical Research: A Review. Molecules 2022, 27, 8846. [Google Scholar] [CrossRef] [PubMed]
  8. Henry, D.G.; Watson, J.S.; John, C.M. Assessing and calibrating the ATR-FTIR approach as a carbonate rock characterization tool. Sediment. Geol. 2017, 347, 36–52. [Google Scholar] [CrossRef]
  9. Li, R.; Zhang, Z.; Jiao, L.; Yin, Y.; Tie, F.; Sun, M. Combining microscale ATR-FTIR and chemometrics to interpret degradation characteristics of earlywood, latewood, and compression wood in waterlogged archaeological pine wood. Herit. Sci. 2024, 12, 387. [Google Scholar] [CrossRef]
  10. Lamas, S.; Rodrigues, N.; Santamaria-Echart, A.; Palu, I.; Manhique, J.R.; Herrero, B.; López-Cortés, I.; Pereira, J.A.; Peres, A. Potential use of the ATR-FTIR spectroscopy as an almond cultivarrecognition tool: Impact of sample and spectral pre-treatments. J. Food Meas. Charact. 2025, 19, 2595–2610. [Google Scholar] [CrossRef]
  11. Griffiths, P.R.; de Haseth, J.A. Fourier Transform Infrared Spectrometry, 2nd ed.; Wiley: Hoboken, NJ, USA, 2007. [Google Scholar]
  12. Downs, R.T. The RRUFF Project: An integrated study of the chemistry, crystallography, Raman and infrared spectroscopy of minerals. In Proceedings of the 19th General Meeting of the International Mineralogical Association, Kobe, Japan, 23–28 July 2006. [Google Scholar]
  13. Jordán, M.M.; Jordá, J.D.; Pardo, F.; Montero, M.A. Mineralogical analysis of historical mortars by FTIR. Materials 2018, 12, 55. [Google Scholar] [CrossRef] [PubMed]
  14. Jordá, J.D.; Jordán, M.M.; Ibanco-Cañete, R.; Montero, M.A.; Reyes-Labarta, J.A.; Sánchez, A.; Cerdán, M. Mineralogical analysis of ceramic tiles by FTIR: A quantitative attempt. Appl. Clay Sci. 2015, 115, 1–8. [Google Scholar] [CrossRef]
  15. Sánchez-Sánchez, A.; Cerdán, M.; Jordá, J.D.; Amat, B.; Cortina, J. Characterization of soil mineralogy by FTIR: Application to the analysis of mineralogical changes in soils affected by vegetation patches. Plant Soil 2019, 439, 447–458. [Google Scholar] [CrossRef]
  16. Jordán, M.M.; Boix, A.; Sanfeliu, T.; de la Fuente, C. Firing transformations of cretaceous clays used in the manufacturing of ceramic tiles. Appl. Clay Sci. 1999, 14, 225–234. [Google Scholar] [CrossRef]
  17. Jordán, M.M.; Montero, M.A.; García-Sánchez, E.; Martínez-Poveda, A. Firing behaviour of Tertiary, Cretaceous and Permo-Triassic clays from Castellon ceramic cluster (Spain). Appl. Clay Sci. 2020, 198, 105804. [Google Scholar] [CrossRef]
  18. Brooke, T.; Kendrick, D.; Meerhaus, T.; Raman, R. General Algebraic Modeling System (GAMS). Language Guide; Gams Development Corporation: Washington, DC, USA, 2012. [Google Scholar]
  19. Klein, C.; Hurlbut, C.S. Manual of Mineralogy: After James D. Dana; John Wiley & Sons: Hoboken, NJ, USA, 1993. [Google Scholar]
  20. De Benedetto, G.E.; Laviano, R.; Sabbatini, L.; Zambonin, P.G. Infrared spectroscopy in the mineralogical characterization of ancient pottery. J. Cult. Herit. 2002, 3, 177–186. [Google Scholar] [CrossRef]
  21. Adler, H.H.; Kerr, P.F. Infrared spectra of carbonate minerals. Am. Mineral. 1965, 50, 132–147. [Google Scholar]
  22. Khoshmanesh, A.; Cook, P.L.M.; Wood, B.R. Quantitative determination of polyphosphate in sediments using Attenuated Total Reflectance-Fourier Transform Infrared (ATR-FTIR) spectroscopy and partial least squares regression. Analyst 2012, 137, 3704–3709. [Google Scholar] [CrossRef] [PubMed]
  23. Linker, R. Waveband selection for determination of nitrate in soil using mid-IR/ATR spectroscopy. Appl. Spectrosc. 2004, 58, 1277–1281. [Google Scholar] [CrossRef] [PubMed]
  24. Matteson, A.; Herron, M.M. Quantitative Mineral Analysis by Fourier Transform Infrared Spectroscopy; SCA Conference Paper Number 9308; Society of Core Analysts (SCA): Houston, TX, USA, 1993. [Google Scholar]
  25. Moore, D.M.; Reynolds, R.C. X-Ray Diffraction and the Identification and Analysis of Clay Minerals; Oxford University Press: New York, NY, USA, 1989. [Google Scholar]
  26. Meseguer, S.; Pardo, F.; Jordán, M.M.; Sanfeliu, T.; González, I. Ceramic behaviour of five Chilean clays which can be used in the manufacture of ceramic tile bodies. Appl. Clay Sci. 2010, 47, 372–377. [Google Scholar] [CrossRef]
  27. Pardo, F.; Meseguer, S.; Jordán, M.M.; Sanfeliu, T.; González, I. Firing transformations of Chilean clays for the manufacture of ceramic tile bodies. Appl. Clay Sci. 2011, 51, 147–150. [Google Scholar] [CrossRef]
  28. Xu, Z.; Cornilsen, B.C.; Popko, D.C.; Pennington, W.D.; Wood, J.R.; Wang, J.-Y. Quantitative Mineral Analysis by FTIR Spectroscopy. Int. J. Vib. Spect. 2001, 5, 1,4. [Google Scholar]
  29. Jordán, M.M.; Pardo, F.; Álvarez, C. Quantitative determination of the mineral content of settleable particulate matter samples. Sci. Rep. 2025, 15, 14369. [Google Scholar] [CrossRef] [PubMed]
  30. Sathya, P.; Velraj, G. FTIR spectroscopic and X-ray diffraction analysis of archaeological grey potteries excavated in Alagankulam, Tamil nadu, India. J. Exp. Sci. 2011, 2, 4–6. [Google Scholar]
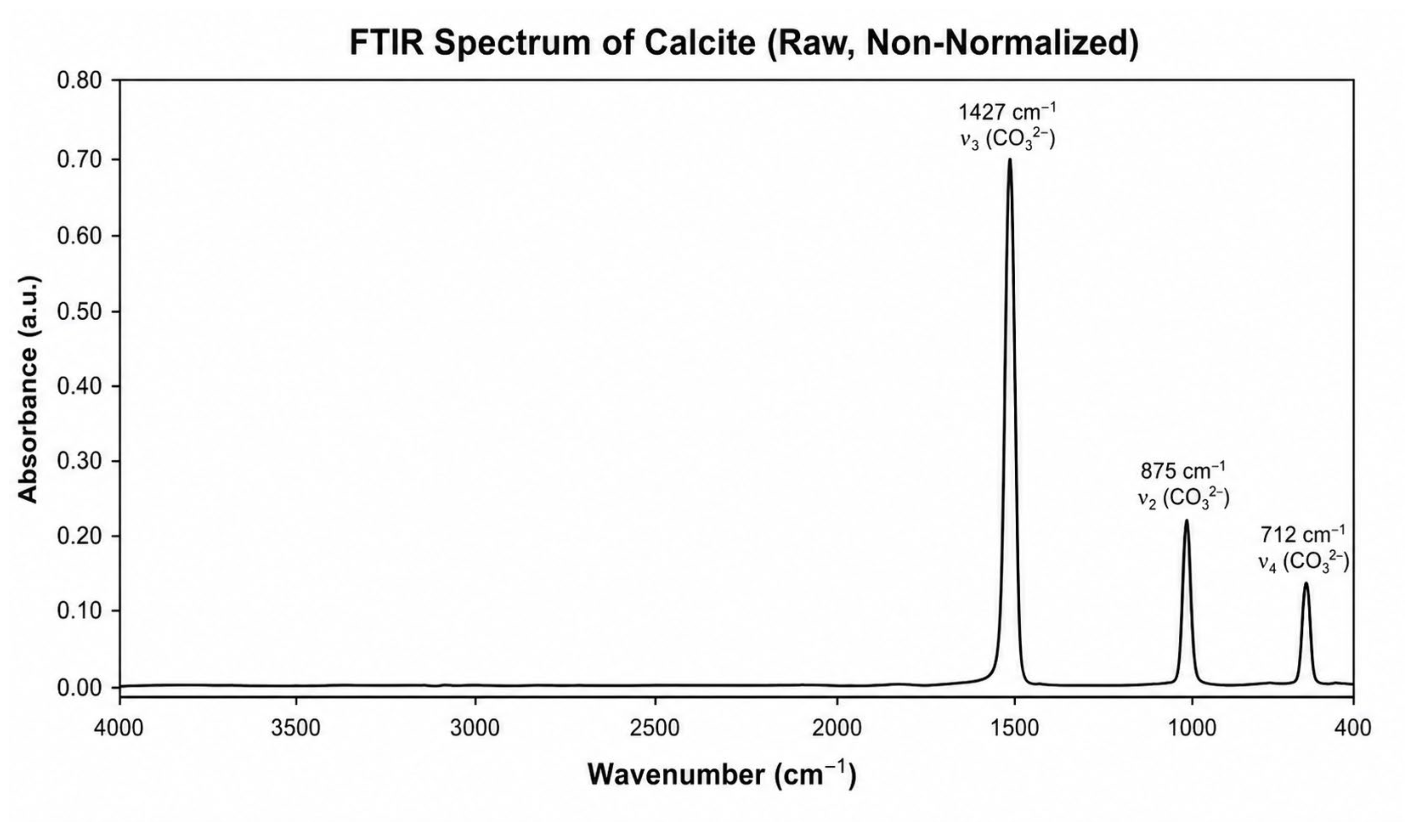
Figure 1. FTIR Spectrum of standard calcite (CaCO3) used in this experiment.
Coatings 16 00530 g001
Figure 2. Maximum peak intensity within the 600–4000 cm−1 infrared range, referenced to the principal calcite peak, for various silicates depending on the number of silicon atoms in their chemical formula.
Coatings 16 00530 g002
Figure 3. Absorbance of clay (sepiolite: Mg4Si6O15(OH)2·6H2O + vermiculite: (Mg,Fe,Al)3(Al,Si)4O10(OH)2·4H2O) without gypsum and with 75% of gypsum.
Coatings 16 00530 g003
Figure 4. FTIR characterization of clay (sepiolite: Mg4Si6O15(OH)2·6H2O + vermiculite: (Mg,Fe,Al)3(Al,Si)4O10(OH)2·4H2O)/gypsum mixtures at different wt.% compositions.
Coatings 16 00530 g004
Table 1. Composition of mineral standards (% mol).
MineralMineral Mixture 1Mineral Mixture 2Mineral Mixture 3
Quartz17.745.431.5
Gypsum5.910.7-
Calcite23.531.416.2
Hematite12.612.5-
Vermiculite40.2--
Sepiolite--51.1
Table 2. Values of the main peak intensity of several mineral samples with respect to the calcite mean peak (1400 cm−1). Table modified from Klein and Hurlbut [19,20,21].
Mineral NameεDetection Limit
Augite0.323
Jadeite17
Diopside0.514
Actinolite3.62
Kyanite0.235
Olivine0.418
Spurrite1.16
Almandine0.612
Muscovite1.16
Biotite0.418
Lepidolite1.16
Vermiculite1.35
Talc1.94
Sepiolite2.13
Labradorite24
Sodalite32
Meionite8.41
Quartz0.418
Opal0.170
Gypsum0.98
Boric acid0.710
Fluorapatite24
Calcium nitrate1.84
Aluminum hydroxide0.235
Manganese oxide0.235
Hematite0.323
Goethite0.170
Calcite17
Table 3. Relative absorptivities of characteristics FTIR bands taken from [8,12,15,19] and raw materials industries.
MineralBand Position (cm−1)Vibrational AssignmentRelative Absorptivity
Quartz1080Si–O asymmetric stretching0.42
800Si–O symmetric stretching0.31
695Si–O bending0.18
Calcite1430–1470CO3 asymmetric stretching1.00
875CO3 out-of-plane bending0.63
713CO3 in-plane bending0.52
Vermiculite1000–1030Si–O stretching0.55
3620–3650OH stretching0.21
Sepiolite1010–1020Si–O stretching0.48
3680–3720Structural OH stretching0.25
Gypsum1100–1140SO4 asymmetric stretching0.67
600–670SO4 bending0.29
Hematite470–550Fe–O lattice vibration0.15
Table 4. Actual and estimated composition of mineral standards.
% MolMixture 1Mixture 2Mixture 3
ActualEstimatedActualEstimatedActualEstimated
Quartz17.717.945.444.732.030.2
Gypsum 5.97.910.710.6--
Calcite 23.525.131.432.316.217.3
Hematite12.67.912.512.4--
Vermiculite40.241.2----
Sepiolite----51.952.5
Table 5. Data obtained by FTIR from two ceramic coatings (fired at 1150 °C, 1050 °C, 950 °C and 850 °C) for ceramic coatings TE and CS.
Ceramic Coating (TE)FTIR Results
Mineral (% Mol)Formula1150 °C1050 °C950 °C850 °C
AmorphousSiO218.623.926.118.6
QuartzSiO242.044.246.139.3
OrthoclaseKAlSi3O83.58.512.97.4
LabradoriteNa0.5–0.3 Ca0.5–0.7 Al1.5–1.7Si2.5–2.3O8---3.2
AlbiteNaAlSi3O8-7.54.55.4
MicaKAl2(AlSi3O10)(F,OH)25.1---
KaoliniteAl2Si2O5(OH)4---7.5
Ceramic coating (CS)FTIR results
AmorphousSiO216.828.147.335.6
QuartzSiO259.453.844.246.6
SanidineKAlSi3O81.0-1.4-
MicroclineKAlSi3O81.53.36.15.5
OrthoclaseKAlSi3O8---3.4
Disclaimer/Publisher’s Note: The statements, opinions and data contained in all publications are solely those of the individual author(s) and contributor(s) and not of MDPI and/or the editor(s). MDPI and/or the editor(s) disclaim responsibility for any injury to people or property resulting from any ideas, methods, instructions or products referred to in the content.