


Abstract
Corrosion of steel pipe specimens in marine environments plays a critical role in the durability and service-life design of coastal and offshore structures. In Vietnam, the scarcity of long-term field corrosion data necessitates the application of accelerated testing and statistical modeling to characterize corrosion degradation. In this study, a two-parameter Weibull model is employed to describe the time-dependent corrosion mass loss of steel pipe specimens under simulated Vietnamese marine conditions. Accelerated corrosion tests are conducted using an impressed current technique in artificial seawater, and equivalent exposure durations ranging from 4.5 to 100 years are determined based on Faraday’s law. This conversion is based on the assumption of uniform corrosion and constant electrochemical conditions, which may not fully represent real marine environments. The Weibull parameters are calibrated using early-stage corrosion data, yielding a shape parameter k = 1.226 and a scale parameter η = 70.761 years. Comparison with experimental results indicates that the model captures the monotonic increase in cumulative corrosion mass loss, although it overestimates the measurements at intermediate exposure durations. The validation results show prediction errors of MAE = 13.06% and RMSE = 14.13%, while sensitivity analysis reveals that long-term predictions are more sensitive to the shape parameter than to the scale parameter. This study also discusses the limitations of using accelerated corrosion testing and Faraday’s law for scaling to long-term predictions, particularly regarding differences in corrosion product morphology and the impact of real-world environmental variability. The calibrated Weibull model provides a statistical approximation for durability assessment of steel pipe structures under Vietnamese marine conditions, particularly in cases where long-term field corrosion data are unavailable.
1. Introduction
Steel pipe piles are widely used in coastal and offshore structures due to their high load-bearing capacity and construction efficiency [1]. However, prolonged exposure to marine environments leads to corrosion, resulting in material loss and reduction in effective cross-sectional area, which affects structural durability and service-life performance [2].
Marine corrosion of steel is a time-dependent process influenced by environmental factors, including chloride concentration, oxygen availability, temperature, and biological activity. Experimental studies have shown that corrosion rates evolve over time as corrosion products accumulate and modify electrochemical conditions at the steel surface [3,4,5]. Therefore, reliable assessment of long-term corrosion damage requires both experimental data and mathematical models capable of describing nonlinear degradation behavior.
Field exposure tests and accelerated corrosion experiments are commonly used to study long-term corrosion behavior. While field tests provide representative data, they require extended durations. Accelerated corrosion testing offers a practical alternative by reproducing corrosion processes within shortened laboratory timescales [6,7]. Equivalent exposure durations are often estimated using Faraday’s law, which relates applied electric charge to theoretical mass loss under natural corrosion conditions [8]. However, this approach is based on simplified assumptions, such as uniform corrosion and constant electrochemical conditions, which may not fully represent real marine environments.
Among available modeling approaches, the Weibull distribution has been widely applied due to its flexibility in representing time-dependent degradation processes [8]. Previous studies have demonstrated its applicability in modeling corrosion evolution and supporting reliability assessments of marine structures [9,10,11,12]. However, most existing models rely on long-term field data, which are often limited in developing coastal regions such as Vietnam. In particular, the lack of long-term corrosion monitoring data specific to Vietnamese marine environments, where factors such as high chloride ion concentrations, temperature fluctuations, and high humidity are prevalent, complicates the accurate prediction of corrosion behavior. In such cases, combining accelerated corrosion testing with statistical modeling provides a practical alternative [6,13].
In Vietnam, steel pipe piles are increasingly used in coastal infrastructure, yet experimental data on corrosion behavior under local marine conditions remain scarce. The tropical climate in Vietnam, combined with high chloride concentrations from coastal waters, creates a harsh environment that significantly accelerates corrosion. To address this limitation, this study develops a Weibull-based corrosion model calibrated using accelerated corrosion data obtained under simulated Vietnamese seawater conditions [14,15]. The model incorporates Faraday-based scaling and is validated against independent experimental results corresponding to equivalent exposure durations of up to 100 years [16]. The proposed model is intended to represent the average statistical trend of corrosion mass loss rather than detailed corrosion mechanisms or localized degradation processes.
The main objectives of this study are:
- To define a corrosion mass loss index suitable for accelerated marine corrosion testing;
- To identify Weibull model parameters using early-stage accelerated corrosion data;
- To validate the proposed model against independent long-term experimental results corresponding to equivalent exposure durations of up to 100 years;
- To evaluate the applicability of the model for characterizing corrosion mass loss trends under Vietnamese marine environmental conditions.
The results of this study provide a quantitative time-dependent corrosion mass loss model that may support comparative corrosion assessment, inspection-based prediction, and preliminary service-life evaluation of steel pipe pile foundations in marine environments. The proposed approach may also provide a reference framework for durability-oriented investigations of marine steel structures in regions where long-term corrosion monitoring data remain limited.
2. Materials and Methods
2.1. Accelerated Corrosion Testing
Accelerated corrosion tests were conducted on steel pipe specimens under simulated Vietnamese seawater conditions. The specimens were fabricated from SKK490 bare steel, sourced from a commercial supplier in Vietnam, in accordance with JIS A5525:2019 [17], a steel grade commonly used in construction, particularly for marine structures [14]. The tests were conducted in the laboratory of Hanoi University of Civil Engineering (Hanoi, Vietnam) using standard electrochemical equipment. The specimens were used in the as-received condition without additional coating or surface treatment, which may affect the initial corrosion response. The chemical composition and mechanical properties of SKK490 steel are summarized in Table 1 and Table 2, respectively [14].
Table 1.
SKK490 bare steel sample composition [14].
Table 2.
Mechanical properties of SKK490 bare steel sample [14].
The testing solution was prepared to represent the marine environment of Nha Trang, Vietnam, and its composition is presented in Table 3 [14]. The chloride concentration and solution chemistry were selected to represent typical Vietnamese coastal conditions, characterized by high chloride content, high humidity, and tropical climate effects that may accelerate the corrosion process.
Table 3.
Composition of the testing solution [14].
Prior to testing, the specimens were surface-cleaned and weighed, and mass measurements were repeated after each exposure stage. Corrosion products were removed in accordance with ASTM procedures before the final weighing; however, slight variations in cleaning efficiency may influence the measured mass loss. The tests were carried out following ASTM G31 [18] and ASTM G5 standards [19].
To accelerate corrosion under controlled electrochemical conditions, an impressed current technique was applied [6]. The applied current was determined according to ASTM G102 based on the estimated average corrosion rate of steel in the Nha Trang marine environment, which is 0.0523 mm/year [14,18,19,20]. The conversion between laboratory exposure time and equivalent field exposure was established using Faraday’s law, by relating the total electric charge to the theoretical mass loss of iron [8]. Using this approach, laboratory durations ranging from 72 h to 1600 h correspond to approximately 4.5 to 100 years of natural marine exposure
Based on this conversion, equivalent exposure durations of 4.5, 7.5, 15, 20, 30, 50, 75, and 100 years were defined. This approach assumes uniform corrosion and constant electrochemical conditions, which may not fully represent the complexity of corrosion mechanisms in real marine environments. In addition, variations in temperature, pH, and electrochemical configuration may introduce uncertainty when extrapolating laboratory results to field conditions.
For each exposure duration, three identical specimens were tested, and the reported values represent the arithmetic mean. The coefficient of variation remained below 5%, indicating good repeatability of the experimental results.
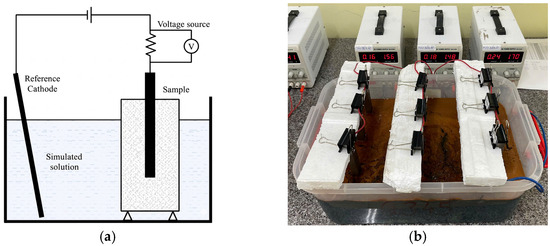
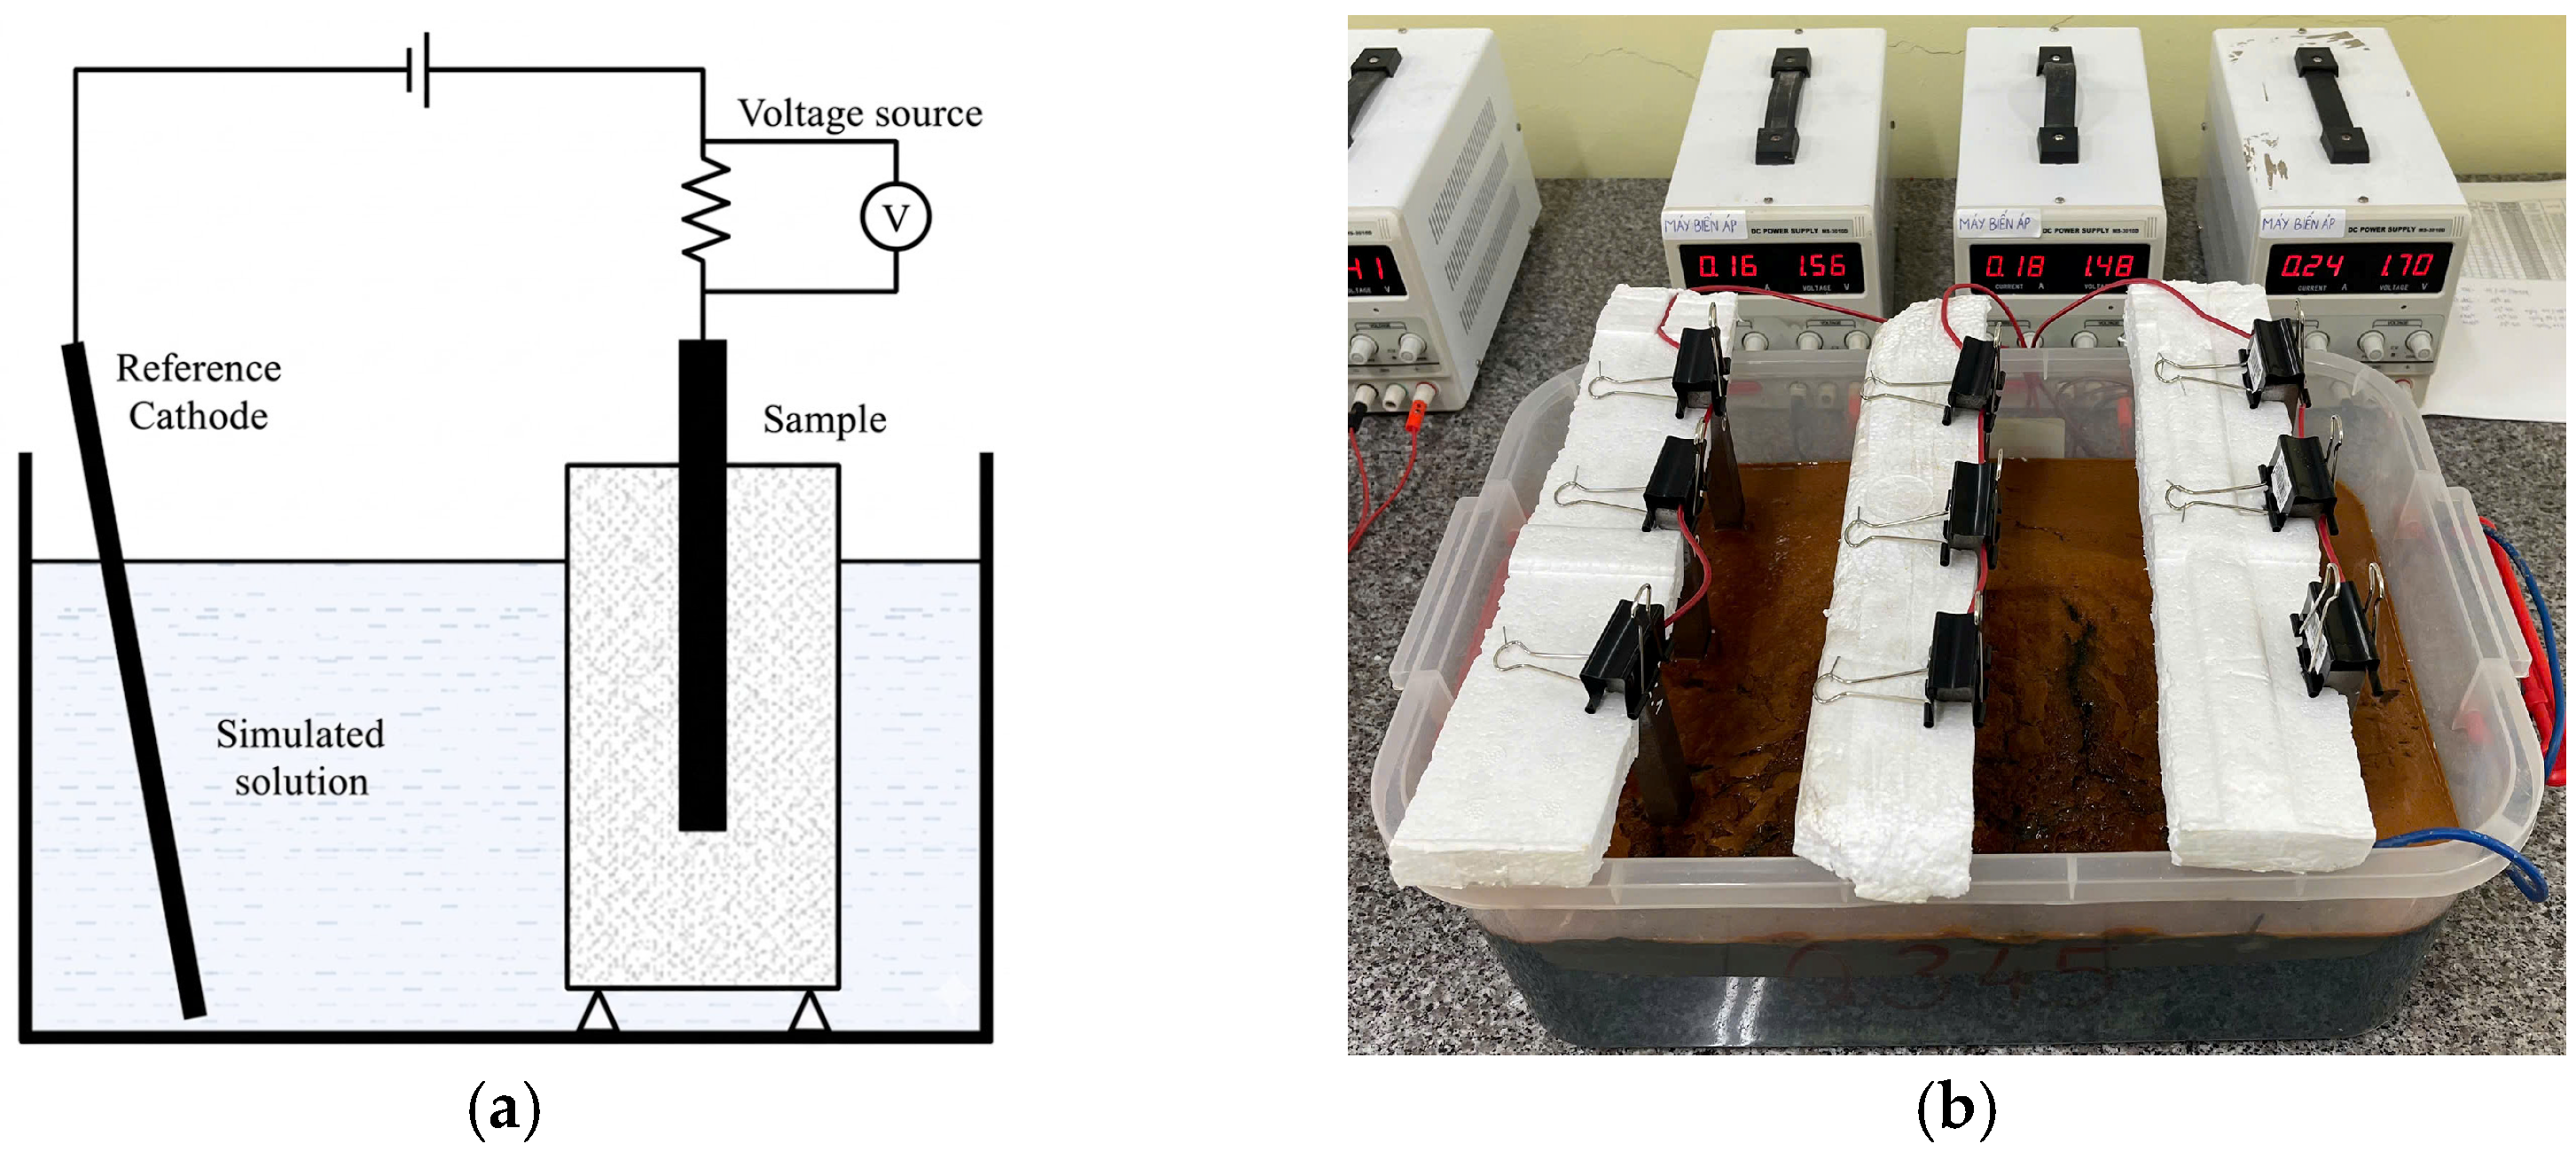
Figure 1 illustrates the accelerated corrosion experimental setup used in this study.
Figure 1.
Accelerated corrosion testing system used in this study: (a) schematic diagram; (b) photograph of the experimental setup.
2.2. Definition of Corrosion Mass Loss Ratio
To characterize the corrosion degradation of steel specimens, the experimental results are expressed in terms of a corrosion mass loss ratio, denoted as . This parameter represents the relative mass loss of the steel specimen after a given equivalent exposure time .
The corrosion mass loss ratio is defined as:
where:
- -
- is the initial mass of the steel specimen before corrosion exposure,
- -
- is the measured mass of the specimen after corrosion testing at exposure time .
The parameter therefore represents the normalized corrosion mass loss obtained directly from the accelerated corrosion experiments described in Section 2.1. Using a normalized mass loss ratio allows consistent comparison between different exposure durations and provides a dimensionless degradation variable suitable for statistical modeling.
In this study, the corrosion mass loss ratio is used as the primary experimental degradation indicator for subsequent modeling and analysis of corrosion progression under simulated Vietnamese seawater conditions, where chloride concentration and humidity are high and may accelerate corrosion degradation.
2.3. Experimental Corrosion Dataset
The experimental corrosion dataset was obtained from the accelerated corrosion testing program described in Section 2.1. For each equivalent exposure duration, the corrosion mass loss ratio was determined from the measured mass loss of the steel specimens according to the definition given in Section 2.2.
The dataset consists of the equivalent exposure time , the corresponding average corrosion mass loss ratio , and the corrosion rate calculated from the measured mass loss over time. For each exposure duration, three identical specimens were tested and the reported values correspond to the arithmetic mean of the measurements.
The experimental results are summarized in Table 4, which provides the fundamental dataset used for calibration and verification of the corrosion degradation model developed in this study.
Table 4.
Experimental corrosion mass loss ratio and corrosion rate.
In this study, the early-stage corrosion data corresponding to 4.5, 7.5, and 15 years were used for parameter identification of the Weibull degradation model. The remaining data at 20, 30, 50, 75, and 100 years were reserved for independent verification of the model predictions.
While the use of only three data points for parameter identification may introduce uncertainty in the calibration of a nonlinear model, this approach reflects practical conditions in accelerated corrosion testing, where early-stage data are often used to estimate long-term behavior.
This separation between calibration data and verification data enables an objective evaluation of the predictive capability of the proposed corrosion model, particularly under the challenging environmental conditions in Vietnam, where factors such as high chloride ion concentrations and tropical humidity accelerate the corrosion process.
This strategy also helps to avoid overfitting and provides a clearer assessment of the model’s generalization capability, although the limited size of the calibration dataset should be considered when interpreting long-term predictions.
2.4. Weibull Degradation Model
The time-dependent evolution of corrosion mass loss is modeled using a two-parameter Weibull function, which has been widely applied to describe cumulative degradation processes in engineering systems due to its flexibility in representing different deterioration patterns [21].
In this study, the corrosion mass loss ratio as a function of equivalent exposure time is expressed as:
where:
- -
- is the predicted corrosion mass loss ratio at exposure time ;
- -
- is the shape parameter, which governs the evolution pattern of corrosion degradation;
- -
- is the scale parameter representing the characteristic time of the degradation process.
The Weibull function is capable of representing different corrosion evolution trends depending on the value of the shape parameter . When , the degradation rate tends to decrease with time, whereas indicates an accelerating degradation process. When , the degradation trend becomes approximately exponential.
In this study, the notation denotes the experimentally measured corrosion mass loss ratio obtained from the accelerated corrosion tests described in Section 2.1, while represents the corresponding prediction provided by the Weibull model. The model parameters are determined through regression analysis based on the experimental corrosion dataset described in Section 2.3. Because only limited short-term experimental data are available for Vietnamese marine conditions, the Weibull formulation is adopted here as a practical statistical approach for representing long-term corrosion mass loss trends.
2.5. Parameter Identification
The parameters of the Weibull degradation model were determined using nonlinear regression analysis based on the experimental corrosion dataset described in Section 2.3. The objective of the regression procedure was to minimize the difference between the experimentally measured corrosion mass loss ratio and the corresponding model prediction [21].
In this study, parameter identification was performed using early-stage corrosion data corresponding to equivalent exposure durations of 4.5, 7.5, and 15 years. The use of early-stage data was intentionally adopted to represent practical engineering situations in which only limited short-term inspection data or early laboratory test results are available for predicting long-term corrosion behavior. Although the calibration dataset is limited, this approach reflects typical conditions encountered in durability assessment when long-term corrosion monitoring data are not yet available. Similar approaches have been applied in corrosion degradation modeling using Weibull-based formulations [9,16]. The regression analysis was conducted by minimizing the sum of squared differences between the experimental values and the Weibull model predictions .
The regression analysis was conducted by minimizing the sum of squared differences between the experimental values and the Weibull model predictions . The objective function can be expressed as:
where represents the number of experimental data points used in the calibration process.
Through this procedure, the optimal Weibull parameters and were obtained, providing the best fit between the experimental corrosion mass loss data and the corresponding model predictions.
2.6. Identified Weibull Parameters
The nonlinear regression procedure described in Section 2.5 yielded the Weibull parameters characterizing the corrosion mass loss evolution of steel pipe specimens under simulated Vietnamese marine conditions. The identified parameters are summarized in Table 5.
Table 5.
Identified Weibull model parameters for corrosion mass loss prediction.
The shape parameter controls the evolution pattern of the corrosion degradation process in the Weibull model. The identified value > 1 indicates that the corrosion mass loss tends to increase at an accelerating rate as exposure time progresses. This trend is consistent with the general characteristics of cumulative corrosion damage observed in marine environments, where the corrosion process may intensify over time due to the progressive deterioration of the steel surface and changes in the electrochemical environment. Such behavior is also compatible with severe marine exposure conditions in Vietnam, including high chloride concentrations, high humidity, and tropical temperatures.
The scale parameter represents the characteristic exposure time associated with the corrosion degradation process. In the context of the present study, this parameter reflects the time scale governing the evolution of corrosion mass loss under the simulated marine conditions used in the accelerated corrosion testing program. This value is particularly relevant for long-term corrosion modeling in environments similar to those along the Vietnamese coastline.
These identified parameters form the basis for subsequent prediction of corrosion mass loss using the Weibull degradation model and for comparison with the experimental corrosion dataset presented in Section 2.3.
2.7. Dataset Used for Model Verification
To evaluate the predictive capability of the proposed Weibull degradation model, an independent verification procedure was performed using experimental corrosion data that were not included in the parameter identification stage.
Specifically, the corrosion mass loss ratios corresponding to equivalent exposure durations of 20, 30, 50, 75, and 100 years were reserved for model verification. These data points were excluded from the calibration process described in Section 2.5 in order to provide an independent dataset for assessing the model’s predictive performance.
The verification was conducted by comparing the Weibull-predicted corrosion mass loss ratio with the experimentally measured values obtained from the accelerated corrosion tests. This comparison enables an objective evaluation of the model’s ability to reproduce the long-term corrosion evolution observed in the experimental dataset.
The experimental data were used directly without smoothing or artificial modification. This approach ensures transparency of the verification process and allows the predictive capability of the Weibull model to be evaluated based solely on the measured corrosion data. By excluding these long-term data points from the parameter identification stage, the verification procedure ensures an unbiased evaluation of the model’s performance.
3. Results and Discussion
3.1. Weibull Parameter Calibration
The parameters of the Weibull degradation model were calibrated using nonlinear regression based on the early-stage experimental corrosion data described in Section 2.3. Specifically, the corrosion mass loss ratios measured at equivalent exposure durations of 4.5, 7.5, and 15 years were used for parameter identification. The calibration procedure minimized the discrepancy between the experimentally measured corrosion mass loss ratio and the corresponding Weibull model prediction , following the regression formulation presented in Section 2.5.
The resulting Weibull parameters for the investigated steel pipe specimens exposed to simulated Vietnamese seawater conditions are and years, as summarized in Table 2 (Section 2.6).
In the Weibull degradation formulation, the shape parameter governs the evolution pattern of the degradation process, while the scale parameter represents the characteristic time scale associated with corrosion development [8]. The obtained value > 1 indicates that corrosion mass loss tends to increase at an accelerating rate as exposure time progresses. This behavior aligns with the accelerated corrosion observed in environments such as Vietnamese coastal areas, where high chloride concentrations and humidity play significant roles in intensifying corrosion over time. This behavior is consistent with the cumulative nature of corrosion degradation observed in marine environments, where progressive surface deterioration and evolving electrochemical conditions influence long-term corrosion development [3,4,22].
Weibull-based formulations have been widely applied in modeling time-dependent corrosion degradation of steel structures exposed to marine environments [9,10,11,12,15]. The calibrated parameters obtained in this study therefore provide a statistical description of corrosion mass loss evolution for steel pipe specimens subjected to simulated Vietnamese marine conditions.
Once determined, the Weibull parameters were kept constant throughout the subsequent prediction and model verification stages, and no further parameter adjustment was performed. Because the calibration was performed solely using early-stage corrosion data, the predictive capability of the Weibull model can be independently evaluated using long-term experimental observations.
3.2. Weibull-Predicted Corrosion Mass Loss
Using the calibrated Weibull parameters and years obtained in Section 3.1, corrosion mass loss ratios were predicted for extended equivalent exposure durations of 30, 50, 75, and 100 years. These time horizons were selected to represent typical service-life periods commonly considered in durability assessments of marine steel structures.
The predicted corrosion mass loss ratios and the corresponding corrosion rates derived from the Weibull formulation are summarized in Table 6.
Table 6.
Weibull-predicted corrosion rate and mass loss ratios.
The predicted corrosion mass loss increases progressively with exposure time, reflecting the cumulative nature of corrosion degradation in marine environments. According to the Weibull model, the corrosion mass loss ratio reaches 78.30% at an equivalent exposure duration of 100 years. This predicted increase is consistent with the accelerated corrosion behavior observed in environments such as Vietnamese coastal areas, where factors like high chloride concentrations and humidity significantly accelerate the degradation process.
The corrosion rate derived from the Weibull formulation exhibits a gradually decreasing trend with increasing exposure time. This behavior results from the mathematical form of the Weibull degradation function, in which cumulative degradation increases continuously while the incremental rate of change tends to decrease with time.
Weibull-based degradation models have been widely applied to represent long-term deterioration processes in engineering materials exposed to aggressive environments [8,9,10,14]. Therefore, the predicted corrosion mass loss values presented in Table 3 provide a useful basis for evaluating long-term corrosion development and for subsequent comparison with experimental observations. These predicted values are subsequently compared with the experimental observations in order to evaluate the predictive capability of the Weibull-based corrosion model.
3.3. Comparison with Experimental Results
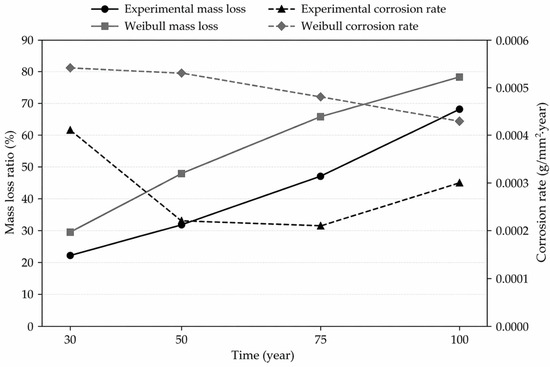
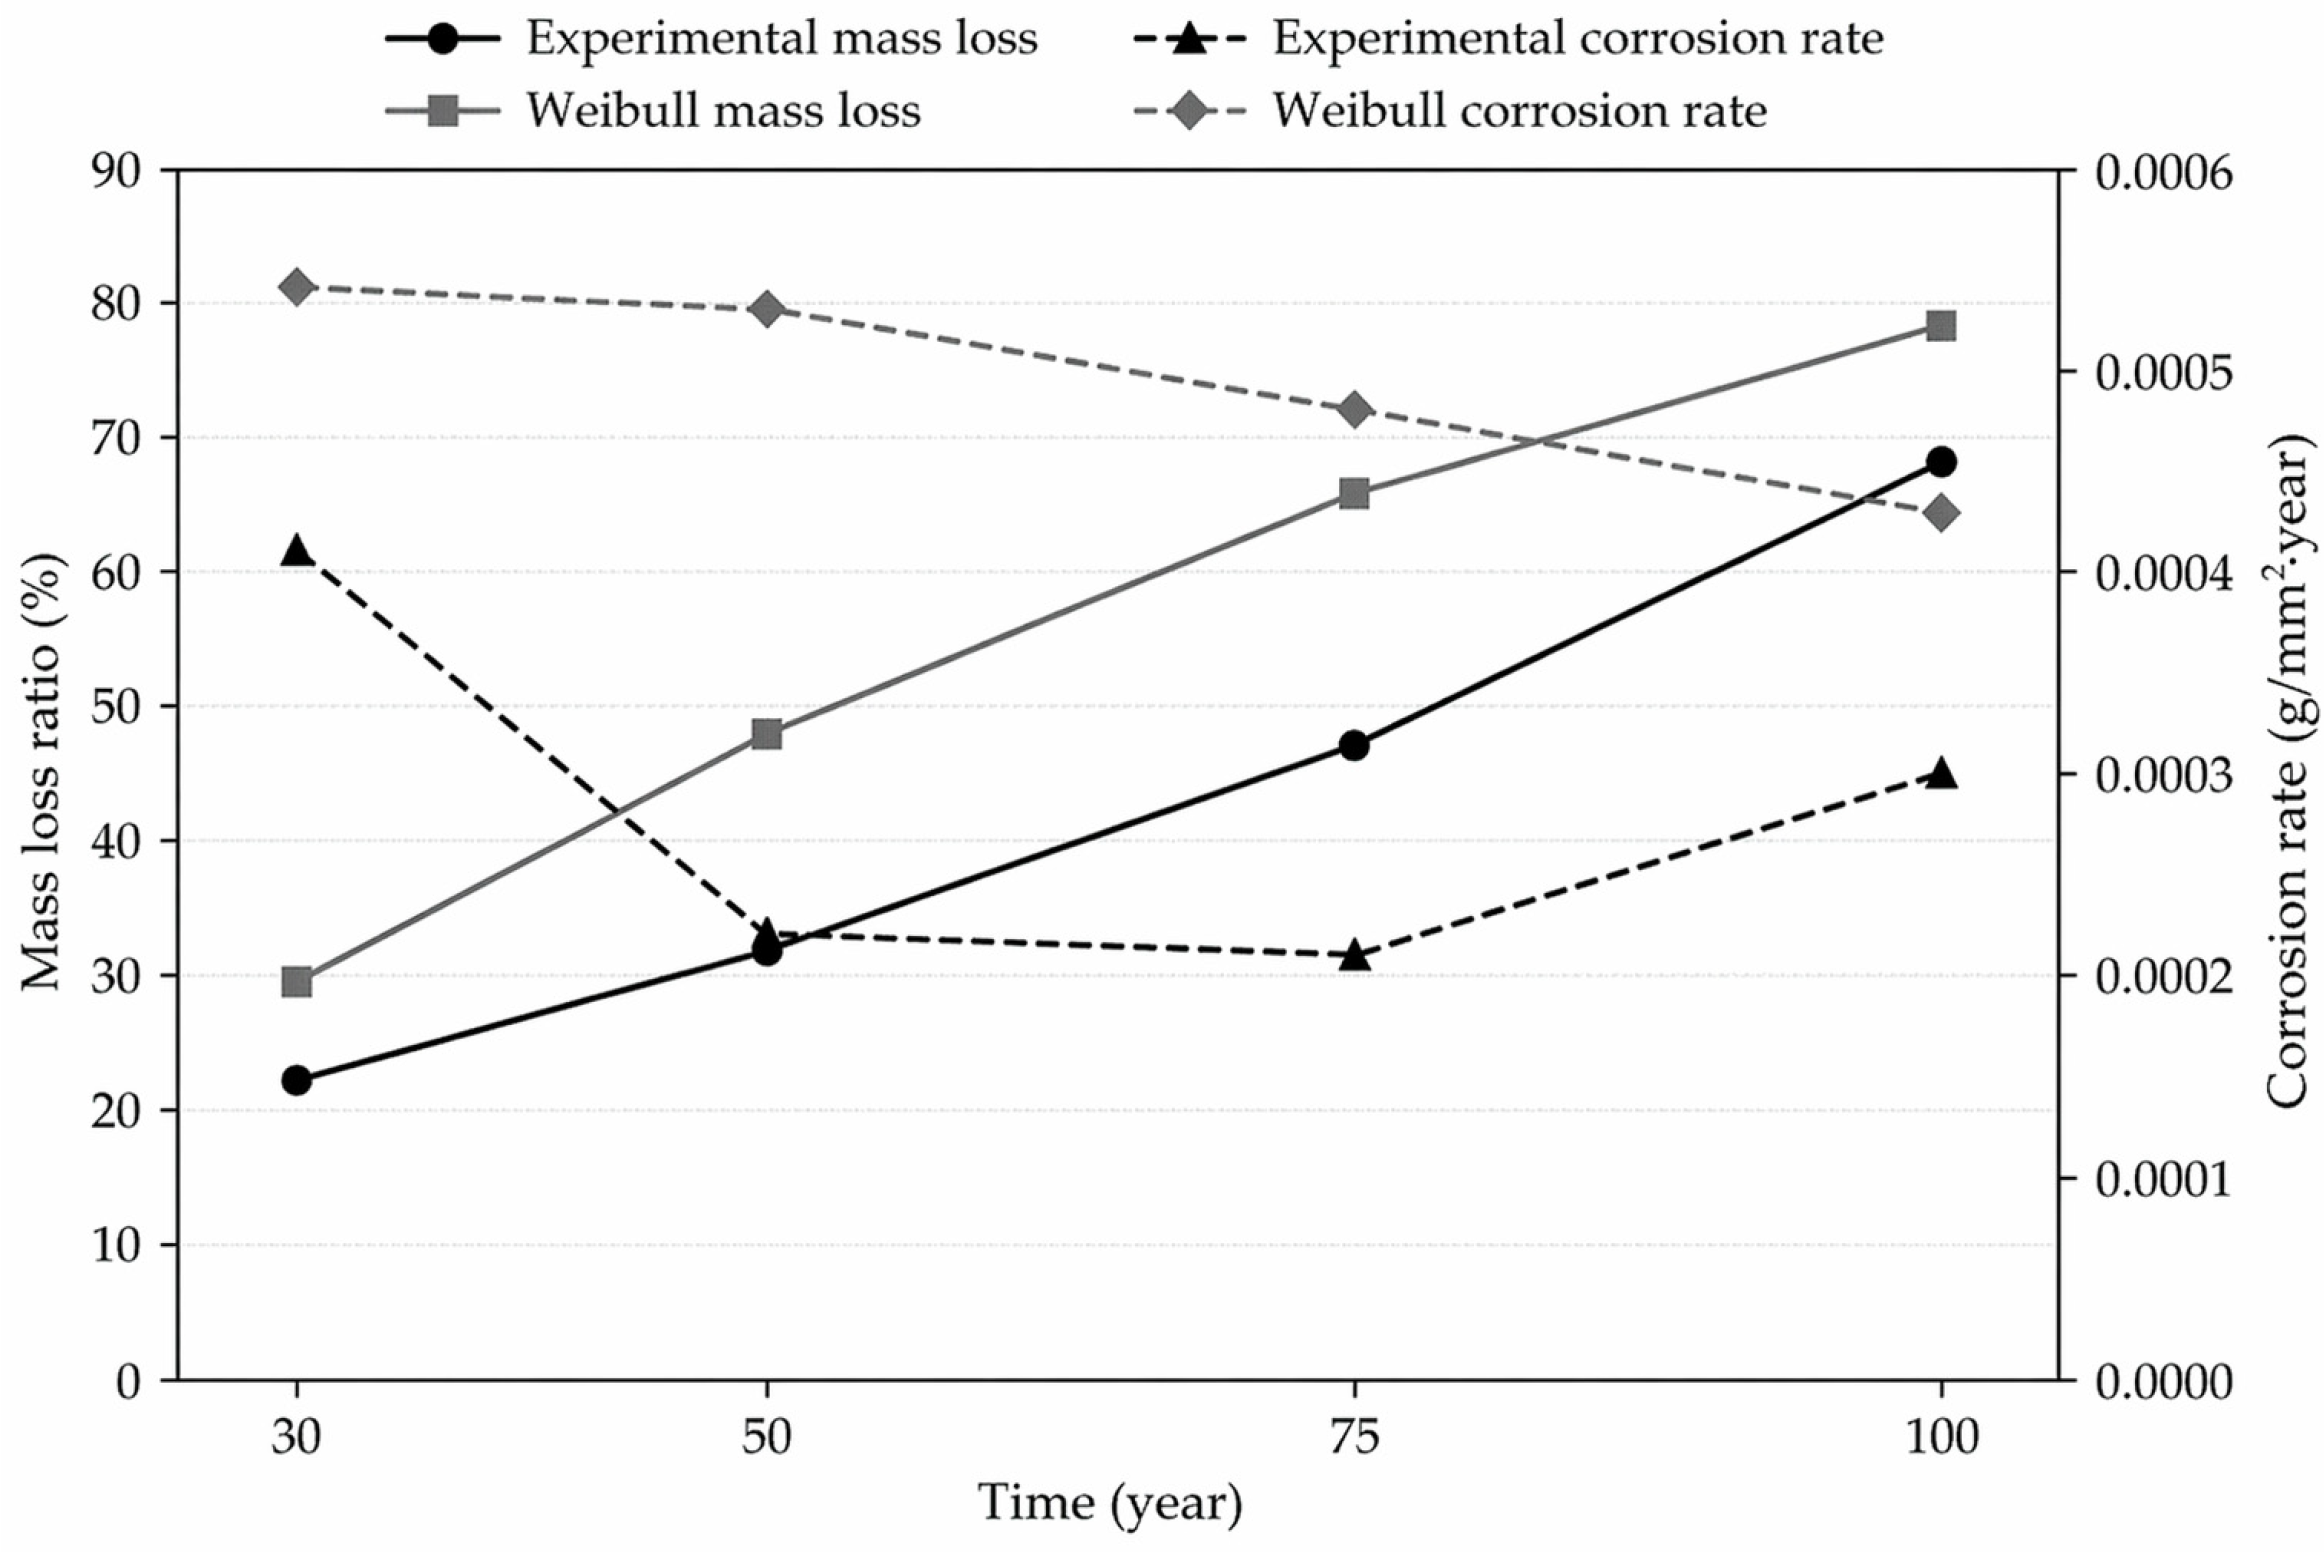
A comparison between the experimentally observed corrosion behavior and the Weibull model predictions is presented in Table 7 and Figure 2.
Table 7.
Comparison between experimental and Weibull-predicted corrosion mass loss ratio.
Figure 2.
Comparison between experimental data and Weibull model predictions for corrosion mass loss ratio and corrosion rate.
The comparison indicates that both the experimental observations and the Weibull model predictions exhibit a monotonic increase in corrosion mass loss with exposure time. This trend reflects the cumulative and irreversible nature of corrosion degradation processes in marine environments.
At the early comparison stage (30 years), the Weibull model slightly overestimates the experimentally measured mass loss ratio. The predicted value is 29.48%, whereas the experimental result is 22.21%, corresponding to a difference of 7.27%. The discrepancy becomes more pronounced at intermediate exposure durations (50–75 years), where the Weibull model predicts higher corrosion mass loss than observed experimentally.
At 100 years of equivalent exposure, the Weibull model predicts a corrosion mass loss ratio of 78.30%, compared with an experimental value of 68.16%, resulting in a difference of 10.14%. Despite this discrepancy, the model consistently overpredicted the measured mass loss and therefore yielded a conservative estimate over the investigated range. The accelerated corrosion test represents aggressive exposure conditions, and therefore may correspond to an upper-bound corrosion scenario in harsh marine environments like those found in Vietnam.
The observed overestimation may be associated with differences in corrosion product evolution between accelerated and natural conditions, particularly in terms of porosity, adhesion, and protective behavior of corrosion layers. These factors influence ion transport and surface protection mechanisms, which are not explicitly captured in the Weibull formulation.
The comparison of corrosion rates further illustrates the differences between experimental observations and Weibull predictions. The experimentally measured corrosion rate does not exhibit a monotonic trend. A relatively high corrosion rate is observed during the early exposure stage due to the direct interaction between fresh steel surfaces and the aggressive marine environment. As exposure progresses, the corrosion rate decreases during intermediate stages, which can be attributed to the formation and densification of corrosion product layers that partially hinder the transport of oxygen and chloride ions to the steel surface.
At longer exposure durations, a slight increase in corrosion rate is observed. This phenomenon may be associated with the partial breakdown or detachment of corrosion products, which exposes fresh steel surfaces to the surrounding electrolyte and allows corrosion to accelerate again. Similar stage-dependent corrosion behavior has been observed in the Vietnamese coastal environment, where chloride concentrations and temperature fluctuations can periodically expose new steel surfaces to corrosion. This behavior has been reported in previous studies on marine corrosion of steel structures [3,4,22].
In contrast, the corrosion rate derived from the Weibull model shows a smooth and gradually decreasing trend with time. This difference arises from the inherent characteristics of the Weibull formulation, which describes cumulative degradation behavior rather than instantaneous corrosion kinetics. In this study, the corrosion rate derived from the Weibull model corresponds to the time derivative of the cumulative Weibull mass loss function and therefore represents an equivalent averaged corrosion behavior.
It is important to distinguish between cumulative corrosion mass loss and corrosion rate. The mass loss represents an integrated measure of degradation over time, whereas the corrosion rate reflects instantaneous corrosion kinetics. As a result, short-term fluctuations observed in the experimental corrosion rate cannot be fully reproduced by the Weibull model.
Consequently, short-term fluctuations and stage-dependent variations in corrosion rate observed in the experimental results cannot be fully reproduced by the two-parameter Weibull model. Similar limitations have been reported in previous applications of cumulative degradation models used for corrosion prediction [9,10,11,12,15].
Nevertheless, the Weibull model reproduced the overall long-term trend of cumulative corrosion mass loss. This capability makes the model particularly useful for engineering applications where the cumulative loss of structural material and the associated reduction in cross-sectional capacity are of primary concern in durability assessment.
3.4. Quantitative Error Assessment
To further evaluate the predictive capability of the Weibull model, a quantitative analysis of the differences between the experimental observations and the model predictions was conducted using the corrosion mass loss ratios presented in Table 4.
The deviations between the experimentally measured values and the Weibull predictions range from 7.27% to 18.70% over the investigated exposure durations. The smallest deviation occurs at 30 years, while the largest difference is observed at 75 years. At the longest considered exposure duration of 100 years, the deviation decreases to 10.14%.
To provide a more comprehensive assessment of model accuracy, three commonly used statistical indicators were calculated: the mean absolute error (MAE), the root mean square error (RMSE), and the coefficient of determination (R2). These indicators are frequently applied in model validation studies to quantify the discrepancy between predicted and measured values and to evaluate the reliability of predictive models [13,23,24].
Based on the dataset presented in Table 4, the calculated error indicators are as follows:
Mean absolute error (MAE): 13.06%
Root mean square error (RMSE): 14.13%
Coefficient of determination (R2): 0.665
These statistical results indicate a moderate level of predictive accuracy for cumulative corrosion mass loss over the investigated time range. The Weibull model captures the overall long-term trend reasonably well, although some discrepancies remain between the predicted and measured values, particularly at intermediate and extended exposure durations. The model tends to slightly overestimate corrosion mass loss in several cases; however, this conservative tendency may be advantageous in durability-oriented engineering applications, where underestimation of corrosion damage could lead to unsafe structural assessments.
It should also be noted that the Weibull model parameters were calibrated using early-stage corrosion data (4.5–15 years), whereas the comparison in Table 4 involves significantly longer equivalent exposure durations. The ability of the model to reproduce long-term corrosion trends under these conditions further supports the applicability of the Weibull formulation for durability analysis of steel structures exposed to marine environments.
Similar levels of prediction uncertainty have been reported in previous studies on corrosion modeling of steel structures, where statistical degradation models are used to represent long-term material loss in aggressive environments [9,10,11,12,25]. Overall, the results indicate that the Weibull model provides a reasonable approximation of the long-term corrosion mass loss trend observed in the experimental dataset.
3.5. Parameter Sensitivity Analysis
To evaluate the robustness of the Weibull degradation model, a sensitivity analysis was conducted to examine the influence of the model parameters on the predicted corrosion mass loss. In Weibull-based degradation models, the predicted evolution of corrosion damage is governed primarily by two parameters: the shape parameter and the scale parameter .
The shape parameter controls the curvature of the degradation trajectory, whereas the scale parameter determines the characteristic time scale associated with corrosion development [8]. Small variations in these parameters may therefore influence long-term corrosion predictions, particularly when extrapolating beyond the calibration dataset.
The sensitivity analysis indicates that the predicted corrosion mass loss is more sensitive to variations in the shape parameter than to changes in the scale parameter . An increase in results in a stronger acceleration of corrosion mass loss at extended exposure durations, while a decrease in leads to a more gradual degradation trend. This behavior reflects the role of the shape parameter in controlling the time-dependent evolution of cumulative degradation.
In contrast, variations in the scale parameter primarily shift the time scale of the degradation process without significantly altering the overall shape of the corrosion progression curve. Consequently, moderate changes in tend to produce smaller variations in predicted corrosion mass loss compared with equivalent changes in .
These observations highlight the importance of accurate calibration of the shape parameter when applying Weibull-based corrosion models for long-term durability assessment. Similar sensitivity characteristics have been reported in previous studies applying Weibull functions to degradation processes in engineering materials and structural systems [9,10,11,12].
Overall, the sensitivity analysis showed that the calibrated parameters reproduced the observed corrosion mass-loss trend with greater sensitivity to k than to η. The results also indicate that the Weibull formulation remains reasonably robust when applied to long-term corrosion prediction under marine exposure conditions.
3.6. Applicability and Uncertainty Discussion
The Weibull model developed in this study provides a statistical representation of cumulative corrosion mass loss for steel pipe specimens exposed to simulated Vietnamese seawater conditions. As demonstrated in Section 3.3 and Section 3.4, the model is capable of reproducing the overall long-term trend of corrosion mass loss within a reasonable range of prediction error.
However, several sources of uncertainty should be considered when applying the model to long-term durability assessment of steel structures in marine environments. First, the model parameters were calibrated using accelerated corrosion data corresponding to relatively short equivalent exposure durations (4.5–15 years). Although the calibrated model provides reasonable predictions for longer exposure durations, extrapolation over extended time periods inevitably introduces uncertainty due to potential changes in corrosion mechanisms and environmental conditions. These uncertainties are particularly relevant in regions such as Vietnam, where environmental factors, including high chloride concentrations, temperature fluctuations, and humidity, can significantly influence corrosion behavior over time.
In addition, the conversion of laboratory exposure time to equivalent field exposure based on Faraday’s law assumes uniform corrosion and constant electrochemical conditions, which may not fully represent real marine environments.
Second, the Weibull formulation employed in this study describes cumulative degradation behavior rather than instantaneous corrosion kinetics. Consequently, the model cannot fully reproduce stage-dependent variations in corrosion rate that may occur during long-term exposure. It should be noted that the proposed model represents an average statistical trend and does not capture localized corrosion mechanisms such as pitting or microstructural heterogeneity. As discussed in Section 3.3, experimentally observed corrosion rates may fluctuate due to the formation, densification, cracking, or detachment of corrosion products, as well as variations in oxygen availability, chloride transport, and local electrochemical conditions [3,4,22].
Third, the experimental results used for calibration and validation were obtained under controlled laboratory conditions designed to simulate Vietnamese seawater environments. Although accelerated corrosion testing is widely used to investigate long-term corrosion behavior within a reasonable experimental time frame, laboratory conditions cannot fully replicate the complex environmental variability encountered in real marine exposure conditions [1,2]. The model, while useful, is based on controlled lab conditions, and real-world marine environments often introduce further complexities, such as fluctuating sea levels, organic biofilms, and varying salinity, which are difficult to replicate in the lab.
Despite these limitations, the Weibull-based corrosion model provides a practical framework for representing long-term corrosion mass loss trends. In many engineering applications, the cumulative reduction in structural cross-sectional area caused by corrosion is more relevant for durability assessment than short-term fluctuations in corrosion rate. Therefore, statistical degradation models such as the Weibull formulation have been widely adopted for reliability assessment and service-life prediction of engineering structures subjected to environmental deterioration [9,10,11,12,25].
Within this context, the calibrated Weibull model can be considered a practical tool for long-term durability evaluation of steel pipe foundations and similar steel structures exposed to marine environments, particularly in regions where long-term field corrosion data are unavailable. It provides a statistical basis for estimating corrosion behavior in the absence of long-term exposure data, especially in coastal regions like Vietnam.
4. Conclusions
This study presents an experimentally calibrated Weibull-based model for describing corrosion mass loss of steel pipe specimens under simulated Vietnamese marine conditions. The proposed approach integrates accelerated corrosion testing with statistical modeling, enabling long-term corrosion prediction based on limited early-stage data [20]. This framework enables representation of corrosion development corresponding to approximately 100 years of service exposure [1,2].
The Weibull model parameters were calibrated using early-stage corrosion data, resulting in a shape parameter k = 1.226 and a scale parameter years. The model reproduces the monotonic increase in corrosion mass loss, consistent with the cumulative nature of corrosion degradation in marine environments [9,10,21]. However, comparison with experimental results indicates that the model overestimates corrosion mass loss at intermediate and long-term exposure durations. At 100 years, the predicted mass loss (78.30%) exceeds the experimental value (68.16%), indicating a conservative prediction trend.
Sensitivity analysis shows that the predicted corrosion behavior is more strongly influenced by the shape parameter k than by the scale parameter η, highlighting the importance of accurate parameter calibration. Although the Weibull formulation does not capture short-term variations in corrosion rate due to evolving corrosion products and environmental effects [3,4,21], it provides a practical statistical representation of cumulative corrosion mass loss.
This limitation is related to the simplified statistical nature of the model, which does not explicitly account for detailed corrosion mechanisms such as corrosion product evolution, ion transport, and localized degradation processes.
In the absence of long-term field data under Vietnamese marine conditions, the proposed model provides a practical framework for preliminary durability assessment and service-life estimation of steel pipe structures in marine environments where long-term field data are limited. Given the harsh environmental conditions in Vietnam, including high chloride concentrations and humidity, this model can be considered a useful tool for predicting corrosion behavior when real-world corrosion data are unavailable.
Author Contributions
Conceptualization, T.T.T.N. and T.H.L.; methodology, T.T.T.N.; software, T.H.L.; validation, T.H.L. and T.T.T.N.; formal analysis, T.H.L.; investigation, T.H.L.; resources, T.T.T.N. and Q.T.N.; data curation, T.H.L.; writing—original draft preparation, T.H.L.; writing—review and editing, T.T.T.N.; visualization, T.H.L. and Q.T.N.; supervision, T.T.T.N.; project administration, T.T.T.N. All authors have read and agreed to the published version of the manuscript.
Funding
This research received no external funding.
Data Availability Statement
Data will be made available upon request.
Conflicts of Interest
We declare that there are no conflicts of interest that could have influenced the research findings presented in this paper.
References
- Chen, J.; Zhang, R.; Li, Q.; Wang, H.; Ma, Q.; Fan, Q.; Fan, L.; Lin, Z. Non-Uniform Corrosion Monitoring of Steel Pipes Using Distributed Optical Fiber Sensors in the Fluctuation Zone of a Coastal Wharf. Sensors 2025, 25, 3194. [Google Scholar] [CrossRef] [Scilit] [PubMed]
- Dalmora, G.P.V.; Filho, E.P.B.; Conterato, A.A.M.; Roso, W.S.; Pereira, C.E.; Dettmer, A. Methods of corrosion prevention for steel in marine environments: A review. Results Surf. Interfaces 2025, 18, 100430. [Google Scholar] [CrossRef] [Scilit]
- Melchers, R.E. Modeling of Marine Immersion Corrosion for Mild and Low-Alloy Steels—Part 1: Phenomenological Model | CORROSION | Association for Materials Protection and Performance. Corrosion 2003, 59, 319–334. [Google Scholar] [CrossRef] [Scilit]
- Melchers, R.E. Long-term corrosion of steels exposed to marine environments. Eur. J. Environ. Civ. Eng. 2009, 13, 527–546. [Google Scholar] [CrossRef] [Scilit]
- Zhang, W.; Yu, H.; Wang, Y.; Yang, Y.; Zhang, B.; Wang, X.; Wang, F. Research on the evolution of corrosion products of 17-4 PH martensitic stainless steel in the tropical marine environment. J. Mater. Res. Technol. 2024, 29, 3849–3865. [Google Scholar] [CrossRef] [Scilit]
- Wei, M.; Yao, J.; Chen, Y.; Yang, B.; Chen, D.; Cai, Y. Optimization and Evaluation of Accelerated Corrosion Tests Based on Mechanism Equivalence Principles. Materials 2024, 17, 4042. [Google Scholar] [CrossRef] [Scilit] [PubMed]
- Park, D.; Lee, Y.; Ham, J.; Yoo, S.C.; Kim, K.; Lee, D.; Kim, Y.; Kim, J.H. Long-term corrosion behavior of borated stainless steel in a simulated spent fuel pool environment. J. Mater. Res. Technol. 2026, 41, 344–362. [Google Scholar] [CrossRef] [Scilit]
- Faraday, M.V. Experimental researches in electricity. Philos. Trans. R. Soc. Lond. 1832, 122, 125–162. [Google Scholar] [CrossRef] [Scilit]
- Noor, N.M.; Yahaya, N.; Smith, G.H.; Nor, S.H.M. A Probabilistic Time-Variant Corrosion Wastage Model for Seawater Ballast Tank. Arab. J. Sci. Eng. 2013, 38, 1333–1346. [Google Scholar] [CrossRef] [Scilit]
- Qin, S.; Cui, W. Effect of corrosion models on the time-dependent reliability of steel plated elements. Mar. Struct. 2003, 16, 15–34. [Google Scholar] [CrossRef] [Scilit]
- Zhongyuan, F.; Xin, S.; Qi, Z.; Lei, H.; Yi, H. Probabilistic time-dependent corrosion wastage model for offshore platforms using stepwise Bayesian inference. Ocean Eng. 2025, 327, 121014. [Google Scholar] [CrossRef] [Scilit]
- Hajinezhadian, M.; Behnam, B. A Corrosion- and Repair-Based Reliability Framework for Offshore Platforms. J. Mar. Sci. Eng. 2024, 12, 504. [Google Scholar] [CrossRef] [Scilit]
- Kassinis, C.; Aresti, L.; Koronides, M.; Christodoulides, P.; Michailides, C.; Onoufriou, T. A review on the environment’s influence on coastal marine steel corrosion and in-situ monitoring. J. Mater. Sci. Mater. Eng. 2025, 20, 1–38. [Google Scholar] [CrossRef] [Scilit]
- Tuyet, T.N.T.; Le Trung, H. Accelerated corrosion effects on steel pipe pile materials in simulated Nhatrang seawater, Vietnam. Transp. Commun. Sci. J. 2025, 76, 89–101. [Google Scholar] [CrossRef] [Scilit]
- Feng, Z.; Zhang, Q.; Huang, L.; Su, X.; Huang, Y. A probabilistic time-dependent corrosion wastage model for offshore platforms based on reverse diffusion model. Ocean Eng. 2024, 313, 119428. [Google Scholar] [CrossRef] [Scilit]
- Noor, N.M.; Smith, G.H.; Yahaya, N. The Weibull time-dependent growth model of marine corrosion in seawater ballast tank. Malays. J. Civ. Eng. 2007, 19. [Google Scholar] [CrossRef] [Scilit]
- JIS A 5525:2019; Steel Pipe Pile. Japanese Standards Association: Tokyo, Japan, 2019.
- ASTM G31-21; Standard Guide for Laboratory Immersion Corrosion Testing of Metals. ASTM International: West Conshohocken, PA, USA, 2025. [CrossRef] [Scilit]
- ASTM G5-14(2021); Standard Reference Test Method for Making Potentiodynamic Anodic Polarization Measurements. ASTM International: West Conshohocken, PA, USA, 2021. [CrossRef] [Scilit]
- ASTM G102-89(2015)e1; Standard Practice for Calculation of Corrosion Rates and Related Information from Electrochemical Measurements. ASTM International: West Conshohocken, PA, USA, 2023. [CrossRef] [Scilit]
- Weibull, W. A Statistical Distribution Function of Wide Applicability. J. Appl. Mech. 1951, 18, 293–297. [Google Scholar] [CrossRef] [Scilit]
- Melchers, R.; Jeffrey, R. The critical involvement of anaerobic bacterial activity in modelling the corrosion behaviour of mild steel in marine environments. Electrochim. Acta 2008, 54, 80–85. [Google Scholar] [CrossRef] [Scilit]
- Liang, H.; Shi, X.; Li, Y. Technologies in marine antifouling and anti-corrosion coatings: A comprehensive review. Coatings 2024, 14, 1487. [Google Scholar] [CrossRef] [Scilit]
- Yang, J.; Zou, D.; Zhang, M.; Que, Z.; Liu, T.; Zhou, A.; Li, Y. Marine steel corrosion prediction and zonation using feature extraction and machine learning in the seas around China. Ocean Eng. 2024, 314, 119649. [Google Scholar] [CrossRef] [Scilit]
- Sabet-Bokati, K.; Plucknett, K.P. Application of AC-DC-AC Accelerated Aging to Assess the Galvanic Corrosion Risk of Mild Steel Coated with Graphene-Embedded Epoxy Coatings. Coatings 2025, 15, 501. [Google Scholar] [CrossRef] [Scilit]

Disclaimer/Publisher’s Note: The statements, opinions and data contained in all publications are solely those of the individual author(s) and contributor(s) and not of MDPI and/or the editor(s). MDPI and/or the editor(s) disclaim responsibility for any injury to people or property resulting from any ideas, methods, instructions or products referred to in the content. |
© 2026 by the authors. Licensee MDPI, Basel, Switzerland. This article is an open access article distributed under the terms and conditions of the Creative Commons Attribution (CC BY) license.