


Abstract
In the present study, the electrodeposition of thin Ni–Fe films obtained from aqueous electrolytes containing nickel (II) and iron (II) sulfates and chlorides is investigated. The study particularly emphasizes the influence of electrolyte additives—boric acid, chloride ions, and Na2EDTA—on the electrochemical behavior, microstructure, and magnetic properties of the deposited layers. Cyclic voltammetry revealed a partial alignment of the reduction potentials of nickel and iron and the suppression of the hydrogen evolution side reaction up to −1 V. Electrodeposition in galvanostatic mode in the range of 0.5 to 1.0 A/dm2 allows the formation of layers with iron contents between 20.5 wt. % to 41.4 wt. % and coating thickness from 1.3 to 3.0 µm. SEM and AFM observations demonstrated a pronounced dependence of the surface morphology on the current density, with higher current densities promoting the formation of dendritic structures. X-ray diffraction confirmed the dominance of a face-centered cubic (FCC) Ni-based solid solution, accompanied by minor contributions from non-stoichiometric Fe1−xO. All the obtained Fe-Ni films have soft magnetic properties. Increasing the current density and the boric acid concentration causes the coercive force and isotropy of the layers to improve. The results demonstrate that thin Ni-Fe films with controlled structure and morphology, with favorable soft ferromagnetic properties suitable for functional applications, could be electrodeposited from complex chloride–sulfate electrolytes by adjusting the current density.
1. Introduction
Nickel–iron (Ni–Fe) alloys are among the most extensively investigated functional materials, owing to their excellent soft magnetic properties, including low coercivity (Hc) and high magnetic permeability (μ), combined with good mechanical stability and corrosion resistance [1,2,3,4]. These characteristics make Ni–Fe alloys highly attractive for applications in electronics and microelectronics, magnetic sensors, inductive components, magnetic recording heads, and functional protective coatings [3,4]. The smoothness of the Ni-Fe layers and their magnetic properties for shielding low-frequency magnetic fields are key to their application [5]. In recent years, the interest in electrodeposited Ni-Fe coatings increased and they were investigated for current applications in the field of sustainable energy sources as electrocatalysts for the hydrogen and oxygen evolution reaction [6,7], microbial fuel cells [8], and advanced electrochemical and photocatalytic applications [9]. In this case, the hierarchical structure is an advantage.
Electrodeposition is widely recognized as one of the most effective techniques for the fabrication of thin and uniform Ni–Fe films, as it provides precise control over chemical composition, coating thickness, and surface morphology [1,2,10,11]. However, the codeposition of nickel and iron is governed by the phenomenon of anomalous codeposition, in which iron is preferentially deposited and the alloy composition does not vary linearly with the electrolyte composition [12]. This intrinsic behavior significantly complicates the preparation of films with tailored properties and requires careful optimization of deposition parameters such as current density, electrolyte composition, pH, temperature, and additive chemistry [2,5,12]. Yin and Lin found that a common buffering component such as boric acid has a strong influence on the nickel and iron codeposition process, contributing to an increase in the iron content in the layer in a limited potential region [13]. Indeed, there are extensive studies in the literature on the influence of various additives to electrolytes for the codeposition of Ni-Fe alloys. Typically, nickel and iron ions are added to the electrolyte either in the form of sulfates [11,13,14,15,16], nitrates [12] or chlorides [9,17,18,19]. Chloride ions as a structural additive and anode activator are added in the form of sodium chloride [14,20]. Only in isolated cases are chlorides and sulfates of nickel ions used, but not of iron ions [5,21,22,23,24].
However, we did not find a systematic study of sulfate–chloride electrolytes in which chloride ions were added via nickel and ferric chloride.
Numerous studies have demonstrated that the microstructure, internal stresses, and surface morphology of electrodeposited Ni–Fe layers strongly influence their magnetic properties, including saturation magnetization (Ms), coercivity (Hc), and magnetic anisotropy [14,20], as well as their corrosion resistance and long-term stability [21,25,26,27]. The formation of dense, low-stress films with fine-grained and homogeneous microstructures is essential for minimizing porosity, preventing crack formation, and ensuring reliable performance, particularly in micro- and nanoscale devices [15,25]. In addition, smooth surface morphology and uniform thickness are critical requirements for successful integration of Ni–Fe films into microelectronic and magnetoelectronic architectures [25,26].
The aim of the present work is to develop and optimize an electrodeposition process for Ni–Fe alloys from acidic electrolytes containing both nickel and iron sulfates and chlorides in order to obtain dense and homogeneous thin films with improved soft magnetic properties and well-controlled surface morphology. To achieve this objective, the influence of key electrodeposition parameters—including electrolyte composition, additive system, and current density—on the elemental composition, crystal structure, surface morphology, and magnetic behavior of the deposited layers is systematically investigated. This integrated experimental approach provides a reliable basis for the fabrication and optimization of Ni–Fe thin films exhibiting high density, uniform morphology, and excellent soft magnetic performance, meeting the requirements of modern microelectronic and magnetoelectronic devices.
2. Materials and Methods
2.1. Preparation of Electrolytes
Thin Ni–Fe films were electrodeposited from two different acidic electrolytes, designated as E1 and E2, whose compositions are summarized in Table 1. All solutions were prepared using analytical-grade reagents and monodistilled water to ensure high purity, reproducibility, and stability of the electrodeposition process.
Table 1.
Composition of electrolytes used for the electrochemical deposition of Ni–Fe films.
The compositions of the two electrolytes were selected according to what the literature described as optimal concentrations of nickel (0.10–0.12 M [9,11,15]) and iron (0.02 M [5,9,11]) ions and boric acid ([13]). In our case, however, the concentrations of nickel and iron ions were obtained from the joint contribution of sulfates and chlorides and the molar ratio Ni:Fe was selected to be 0.2 [17]. Unlike other research teams that use mostly NaCl added as an anode activator, here the chloride ions are introduced only in the form of chloride salts of the deposited metals. The amount of boric acid E1 is tendentially negligible, so that the influence of this component can stand out.
Prior to use, the electrolytes were stirred thoroughly to achieve complete dissolution of all components and to prevent local concentration gradients during deposition. No additional filtration was applied, as no visible precipitates or colloidal particles were detected in the solutions.
2.2. Electrochemical Investigations and Electrodeposition
The electrochemical behavior of the Ni–Fe system and the relevant electrode processes were investigated by cyclic voltammetry (CV) using a platinum working electrode with an exposed area of 1 × 1 cm. Measurements were performed at a scan rate of 20 mV/s at room temperature, with potentials referenced to the Ag/AgCl electrode.
Electrodeposition of Ni–Fe coatings was performed under galvanostatic conditions at current densities in the range of 0.5–1.0 A/dm2. The electrolyte temperature was maintained at 50 ± 2 °C, and the deposition time was fixed at 30 min for all experiments and at a constant pH of 2.0. The coatings were deposited onto pre-cleaned copper substrates with dimensions of 2 × 1 cm. Prior to deposition, the substrates were sequentially degreased in acetone, rinsed with distilled water, chemically etched, and finally rinsed again to remove surface contaminants and native oxides. For brevity, the resulting alloy coatings are designated by the type of electrolyte (E1 or E2), followed by a number corresponding to the cathodic current density at which they were deposited (0.5, 0.7 or 1.0).
Electrochemical measurements were carried out using a Metrohm Autolab PGSTAT302N potentiostat–galvanostat equipped with an FRA32M module and controlled by NOVA 2.1.4 software (Metrohm, Herisau, Switzerland). A conventional three-electrode electrochemical cell (K0235 Flat Cell Kit). A conventional three-electrode electrochemical cell (K0235 Flat Cell Kit) was utilized, consisting of a platinum working electrode (1 cm2 exposed area), platinum mesh counter electrode and silver/silver chloride (Ag/AgCl) reference electrode.
This configuration ensured stable potential control and reliable electrochemical characterization of the deposition process.
2.3. Characterization of Films
The chemical composition and thickness of the electrodeposited Ni–Fe films were determined by X-ray fluorescence (XRF) using a Fischerscope X-RAY XDAL instrument (Fischerscope X-RAY XDAL, HELMUT FISCHER GMBH, Institut fur Elektronik und Messtechnik, Sindelfingen, Germany). Measurements were performed at three different locations on each sample to assess coating uniformity, and the reported values represent the average results.
The phase composition and crystalline structure of the films were analyzed by X-ray diffraction (XRD) with a vertical diffractometer Philips PW 1050 (Philips Sourced, Almelo, The Netherlands) and a secondary monochromator, working with Cu Kα radiation (λ = 1.5406 Å).
Surface morphology and topography were examined using scanning electron microscopy (SEM) Tescan LYRA (TESCAN, Brno, Czech Republic) equipped with an energy-dispersive X-ray (EDX) analyzer Bruker (Bruker AXS GmbH, Karlsruhe, Germany), and atomic force microscopy (AFM) Dimension 3100 (Veeco Instruments Inc., Plainview, NY, USA) with BudgetSensors Tap300Al-G cantilevers (Innovative Solutions Ltd., Sofia, Bulgaria). These techniques provided complementary information on grain size, surface roughness, and microstructural features, enabling a direct correlation between processing conditions and morphological characteristics.
A Magnetic Properties Measurement System (MPMS 3) SQUID magnetometer (Quantum Design, San Diego, CA, USA) was used to study magnetic properties with ≤10−8 emu sensitivity and a field changing resolution of 0.33 Oe. Magnetization was measured at a fixed temperature of 300 K and with magnetic fields ranging from −6 to 6 T. Two samples of E1-0.5, E1-1.0, E2-0.5 and E2-1.0 were prepared under identical conditions and were measured with a measurement error of about 1%.
3. Results
3.1. Influence of Additives on Individual and Codeposition of Iron and Nickel
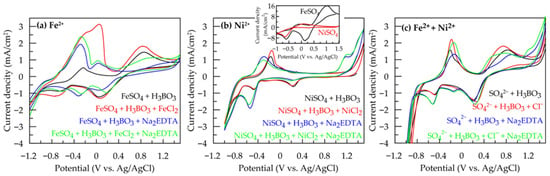
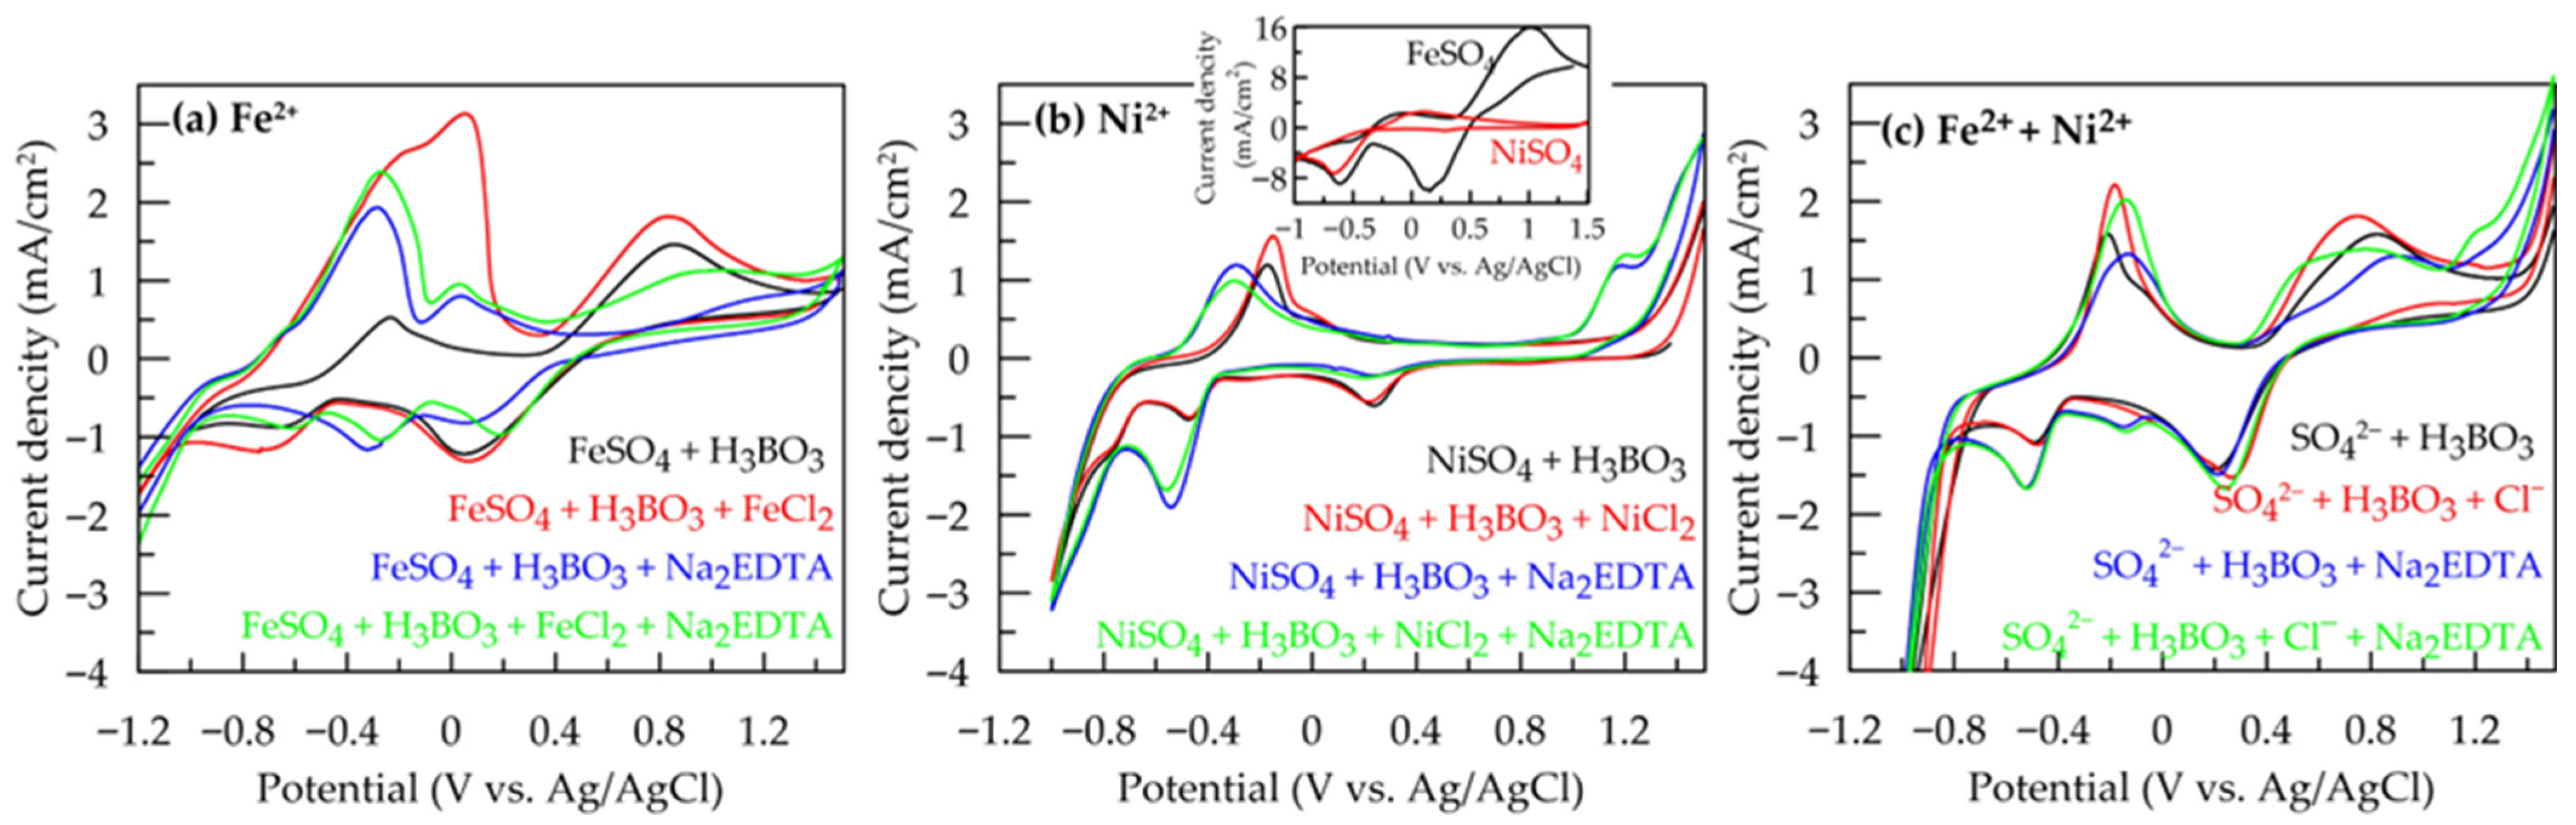
The CV dependencies were obtained from electrolytes containing both individual components as well as their combinations, with concentrations analogous to those in electrolyte 1. The tests were performed on a platinum substrate in order to clarify the individual influences of electrolyte composition and additives on reaction kinetics. The recorded voltammograms were analyzed to determine suitable potential and current ranges for alloy codeposition.
The cyclic voltammograms recorded in electrolytes containing only Fe2+ (Figure 1a, black curve) or Ni2+ (Figure 1b, black curve) ions and boric acid exhibit well-defined cathodic and anodic features characteristic of the multistep redox transformations of iron and nickel, respectively. For example, the reduction of Fe2+ to metal iron is recorded at the cathodic peak at a potential of −0.6 V, while for nickel this half-reaction is at −0.5 V. In the electrolyte containing both types of metal ions (Figure 1c), a single peak is observed located at −0.55 V, i.e., between those in the individual solutions. This supports the observations of other authors, according to whom in the presence of nickel ions, the electrodeposition of iron is catalyzed at a more positive potential, and vice versa—the nickel reaction is inhibited by iron ions [13,15].
Figure 1.
Cyclic voltammograms recorded on a Pt electrode in electrolytes containing: (a) Fe2+ ions; (b) Ni2+ ions; (c) Fe2+ and Ni2+ ions.
The hydrogen evolution reaction is favored by the nickel electrode, where it starts at a potential of about 0.65 V, while in the all-iron electrolyte a potential shift to −1 V is required. It is important to note that in the complex electrolyte, the hydrogen evolution potential remains close to −1 V. It is expected that boric acid will have a pH-buffering effect and increase the hydrogen overpotential during the electrodeposition process [12,13,28]. In addition, boric acid could adsorb on the cathode surface and exhibit surfactant behavior, which contributes to shifting the reduction potential of nickel to more negative values [13,28]. However, in our case, these effects described in the literature are not strongly pronounced, probably due to the low concentration of boric acid of 0.32 g/L.
The addition of Cl− ions (Figure 1a, red curves) to the iron electrolyte increases the current density of iron electrodeposition (in the potential range of 0.7 to 1.1 V). In nickel-containing electrolytes (Figure 1b,c, red curves), chloride ions do not directly affect the nickel ion reduction process under the present experimental conditions.
The presence of Na2EDTA (Figure 1a, blue and green curves) leads to a complication of the mechanisms of iron ion reduction, manifested in an increase in the number of cathodic peaks in the presence of chloride. Nickel electrodeposition in the presence of Na2EDTA (Figure 1b, green and blue curves) represents a typical case of complex-mediated metal deposition, where Ni2+ ions form stable chelate complexes with EDTA ligands [29]. Complexation reduces the concentration of free Ni2+ ions in the solution, limiting their direct electroreduction at the electrode surface [10,20,29]. As a result of the Ni–EDTA complex formation, the nickel electrodeposition occurs at more negative values (around –0.60 V). This potential shift is accompanied by an approximately twofold increase in current density. This behavior can be explained by enhanced electron-transfer kinetics at more negative potentials, together with the gradual dissociation of the Ni–EDTA complex in the near-electrode region, which continuously supplies free Ni2+ ions to the electrode surface [29]. In the mixed Ni–Fe electrolytes, these effects manifest as synergistic behavior characterized by a partial equalization of the cathodic potentials and the appearance of an intensified cathodic peak. Although the reduction maximum of Ni in the individual electrolyte occurs at a more negative potential, the presence of nickel in the alloy system facilitates iron reduction through surface-mediated interactions and a reduction in the effective cathodic overpotential. This behavior promotes anomalous codeposition and enhances the incorporation of iron into the deposited layer [25].
3.2. Composition and Growth Rate of the Electrodeposited Ni-Fe Alloy Films
The elemental composition of the electrodeposited alloy layers at different current densities was determined by EDS area analysis. The results show a dominant presence of nickel and iron, as well as small amounts of oxygen and carbon (Table S1). The element copper from the substrate was not detected, which is indirect evidence that the layers are around and above 1 μm. Table 2 presents the weight percentages of nickel and iron, normalized to the metal content of the layers. In addition to the higher ionic content, the most significant differences between E1 and E2 are the boric acid content in E2, which is more than 10 times higher, and also the EDTA concentration, which is around 20% lower. As a result, a higher Fe content is recorded in the layers deposited by E2. At the lowest current density of 0.5 A/dm2, this effect is the strongest and the increase in Fe exceeds 12% when replacing E1 with E2. The highest content of 41.1% of Fe in the Ni-Fe alloy is obtained in the electrolyte E2 with a higher ionic concentration and at the highest applied current density.
Table 2.
Elemental composition (from EDX) and thickness (from XRF and SEM) of Ni-Fe films obtained at different current densities.
It is known that higher concentrations of boric acid suppress the reduction of both iron and nickel ions by stabilizing the local pH in the cathodic diffusion layer and increasing the effective cathodic overpotential required for electrodeposition. However, this effect is more pronounced in nickel electrodeposition, leading to an anomalously high deposition of iron, whose potential is more negative in the absence of additives. Moreover, high current densities further kinetically favored iron deposition. This behavior suggests that mass-transport limitations and surface-mediated reduction processes play an increasingly significant role at elevated current densities.
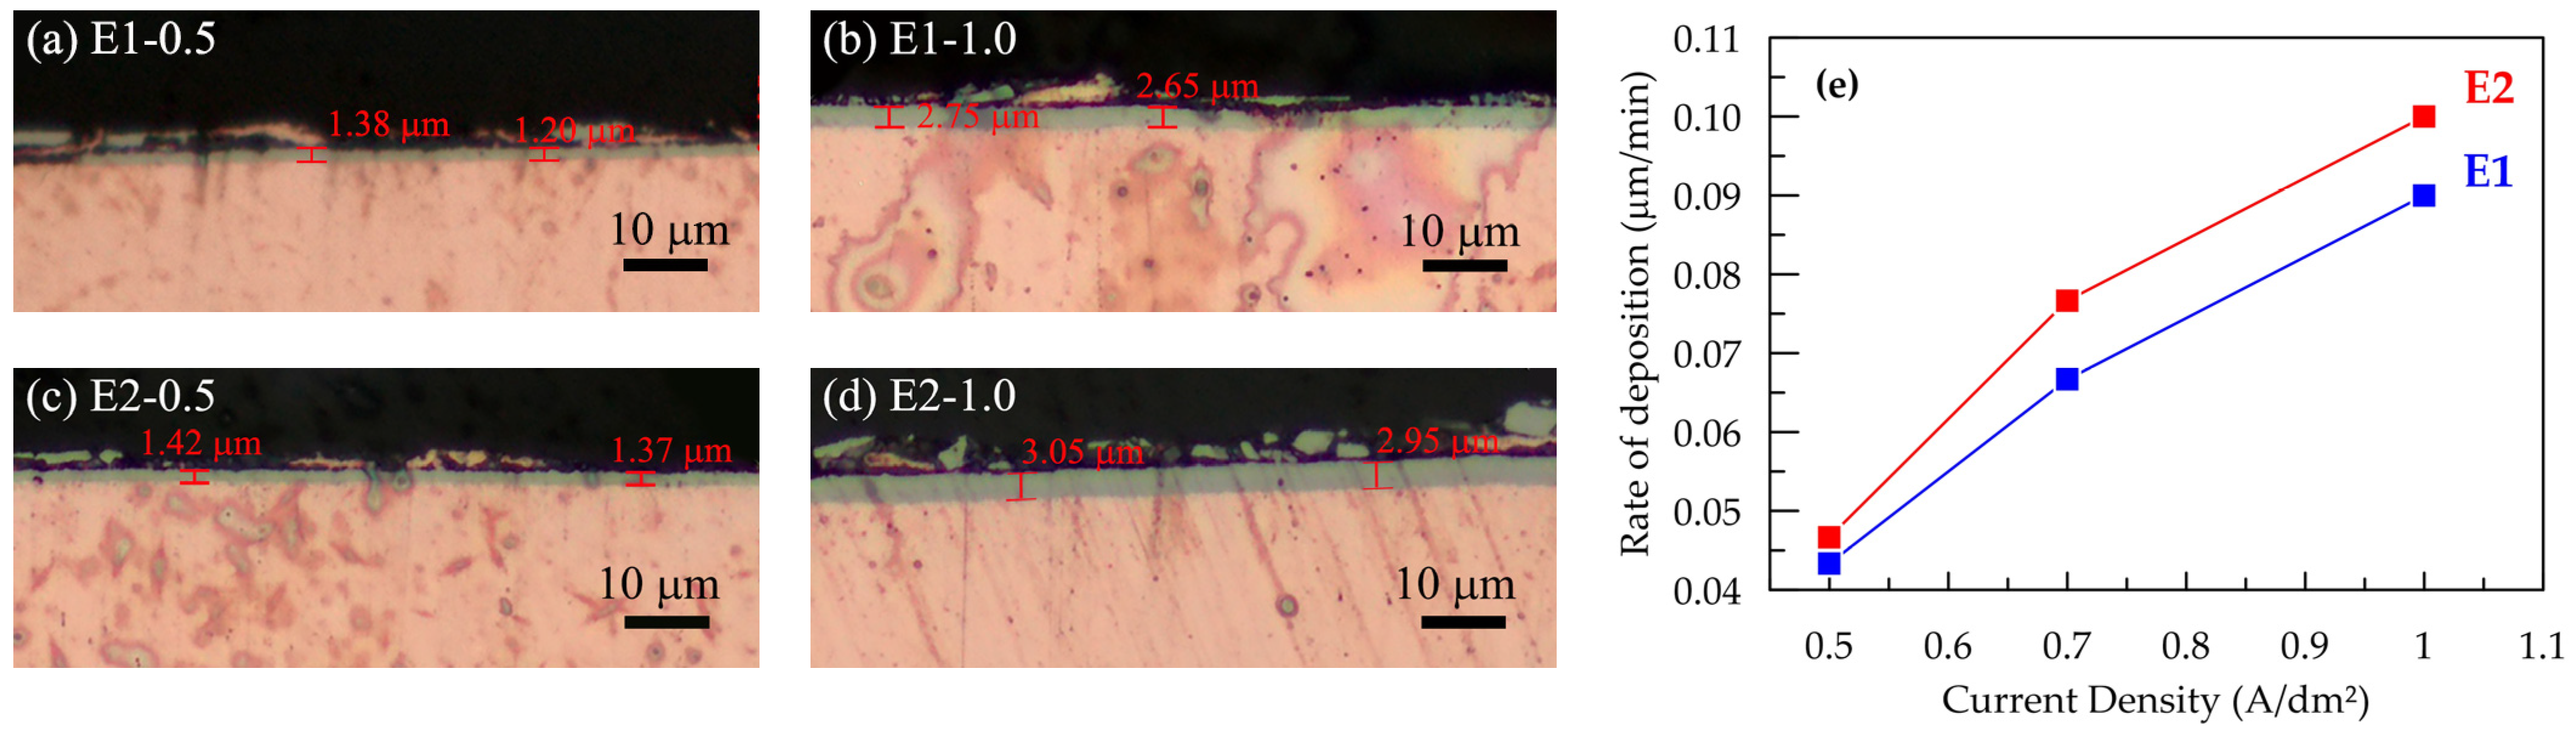
The thicknesses presented in Table 2 are the average values measured by XRD and SEM observations of cross-sections of the layers (Figure 2). When determined by each independent method, they still give the same average values. All investigated electrodeposited films exhibit thicknesses in the range of 1.3–3.0 µm, with a systematic increase in thickness with increasing current density for both electrolytes E1 and E2.
Figure 2.
Optical images of cross-section of Ni-Fe alloy layer on copper substrate for E1 at 0.5 A/dm2 (a) or at 1.0 A/dm2 (b), electrolyte E2 at 0.5 A/dm2 (c) or at 1.0 A/dm2 (d), and influence of current density of electrodeposition from electrolytes E1 and E2 on deposition rate (e).
Figure 2e presents the variation in deposition rate and the iron content in Ni–Fe alloy films as a function of applied current density for electrolytes E1 and E2. The deposition rate is a key parameter in electrodeposition processes, as it directly influences the kinetics of film growth as well as the microstructure and composition of the deposited layers.
For electrolyte 1, which has a lower ionic content, an almost linear increase in the deposition rate is observed with increasing current density. This behavior indicates that within the applied current density, the electrodeposition process is not limited by mass transfer. The highest deposition rate of 0.1 µm/min was achieved at a current density of 1.0 A/dm2. The increase in the electrodeposition rate from electrolyte 2 is not linear. While at 0.5 A/dm2 the two electrolytes deposit at similar rates, at 0.7 A/dm2 and 1 A/dm2, E2 is about 15% higher. Given the same duration of electrodeposition, the same valence and the similar atomic radius of iron (II) and nickel (II) ions, one would expect the same thicknesses and rate of deposition at the same current density. The results presented in Table 2 and Figure 2, however, reveal the strong influence of the electrolyte composition. The obtaining of thicker films under identical conditions from the electrolyte E2 with a higher ionic content may be the result of both a higher efficiency of the process and the formation of layers with a more pronounced dendritic structure.
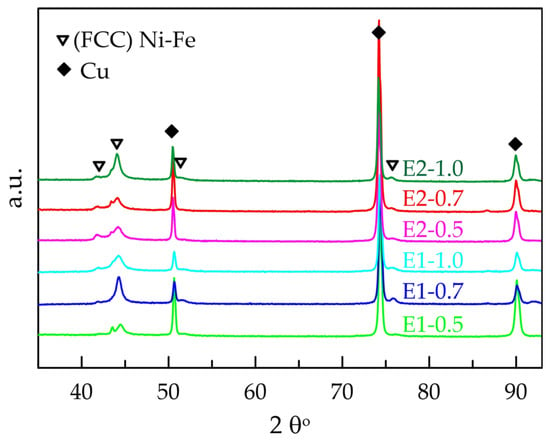
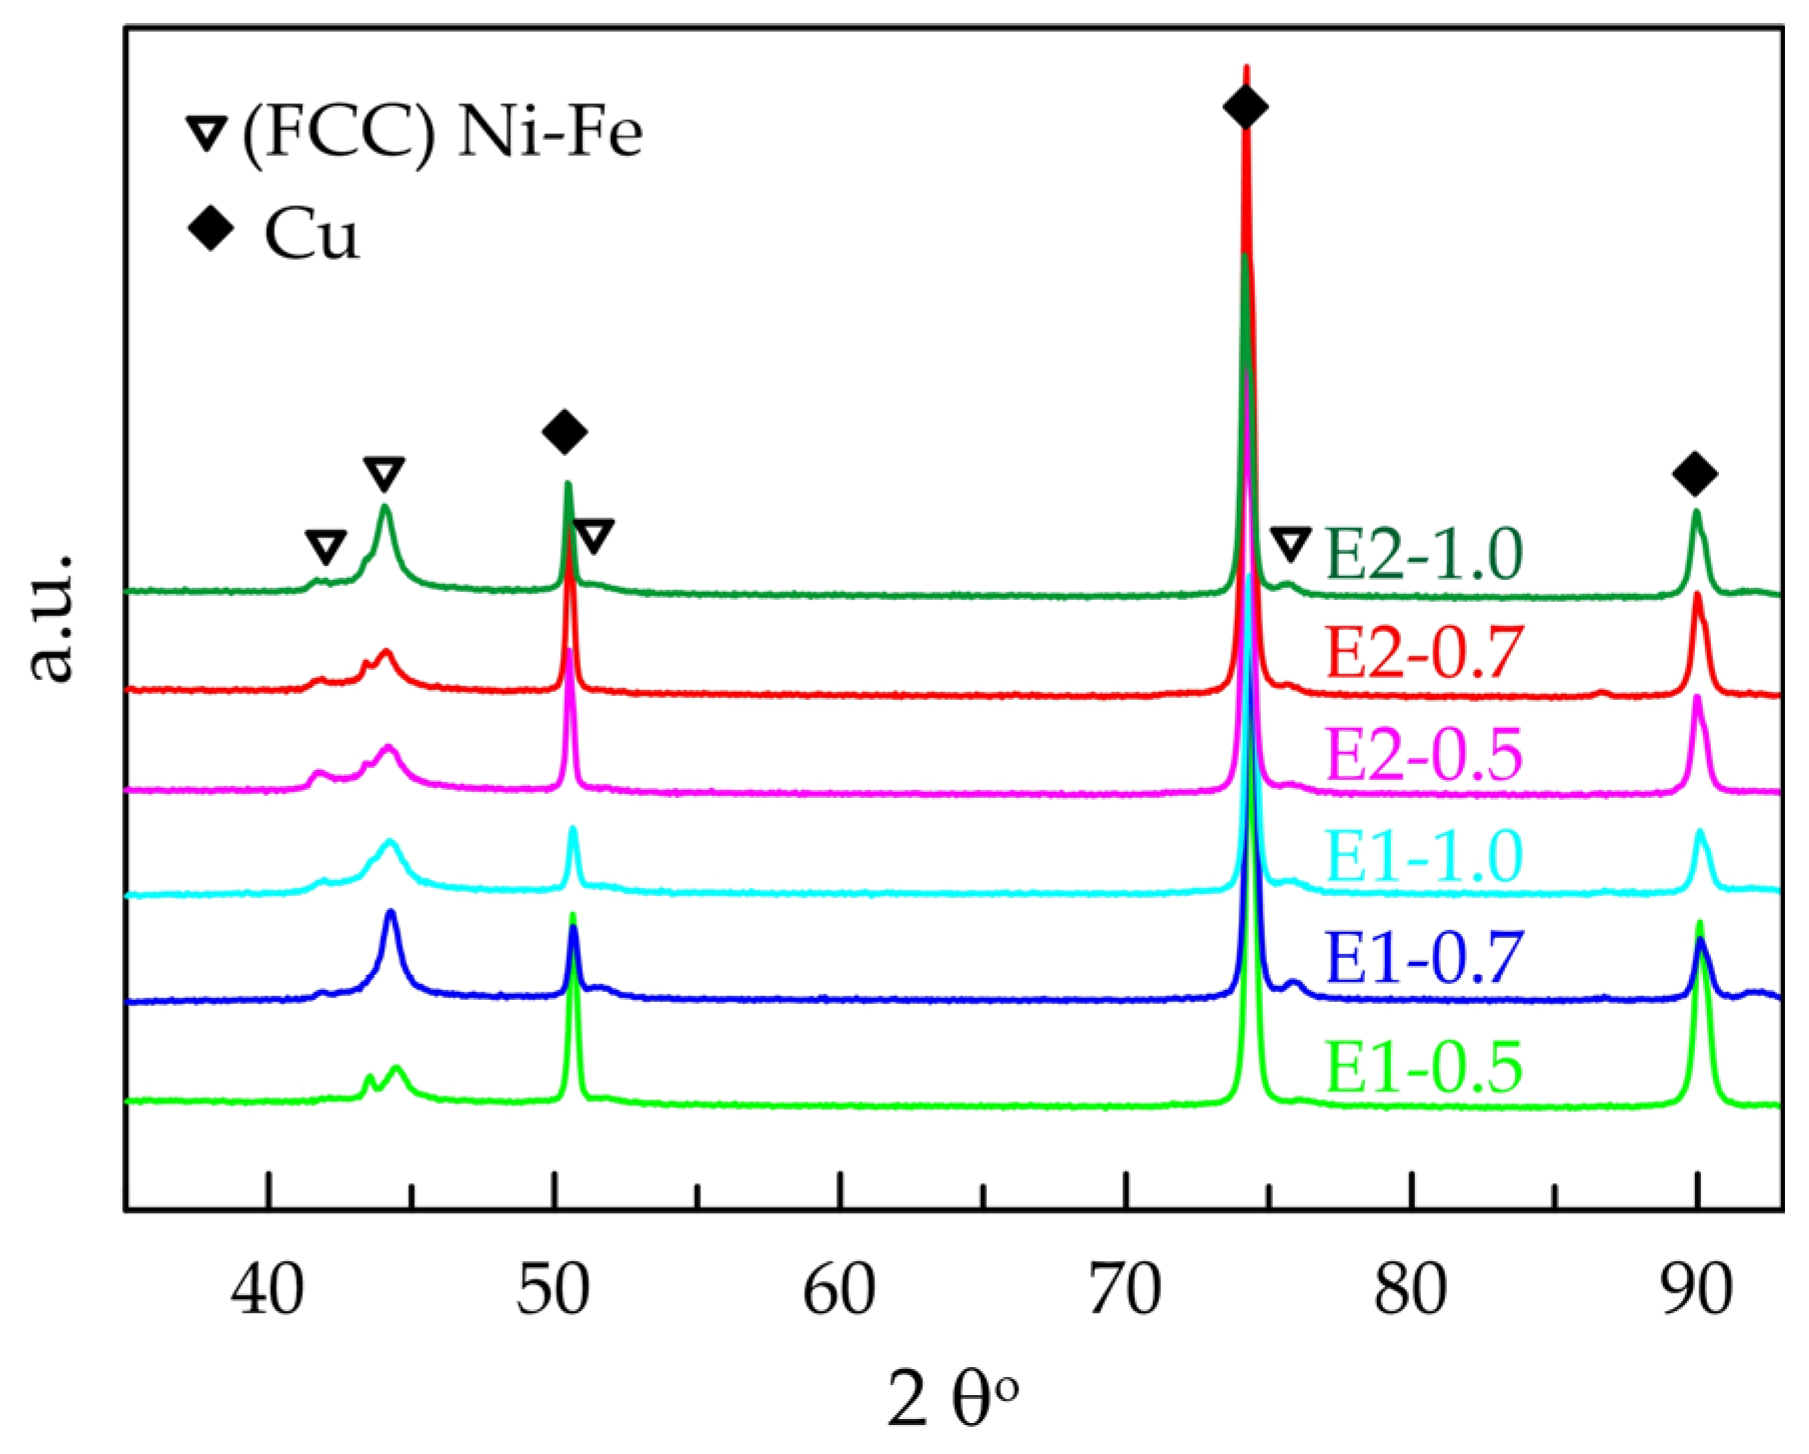
XRD analysis was used to determine the structure of the deposited layers. The X-ray diffraction patterns of samples (Figure 3) reveal a clear predominance of the face-centered cubic (FCC) nickel–iron phase, characterized by intense reflections at approximately 2θ ≈ 44.2°, 51.8°, and 76.0°, corresponding to the (111), (200), and (220) crystallographic planes of the FCC structure, respectively [5,14,30]. These results indicate that the electrodeposited films are mainly composed of a nickel-rich Ni–Fe solid-solution phase with a well-developed crystalline matrix [6,27].
Figure 3.
X-ray diffraction patterns (XRD) of electrodeposited Ni–Fe alloy films obtained at current densities of 0.5 A/dm2 (samples 1 and 4), 0.7 A/dm2 (samples 2 and 5), and 1.0 A/dm2 (samples 3 and 6) from electrolytes E1 (samples 1, 2, 3) and E2 (samples 4, 5, 6).
The variations in peak intensity and full width at half maximum (FWHM) observed among samples 1–6 do not indicate phase transformations but rather reflect microstructural differences related to crystallite size and lattice defect density. These observations are consistent with the SEM morphological features and the magnetic behavior of the films [11,27]. Consequently, increasing the current density primarily affects the microstructural evolution of the Ni–Fe layers rather than inducing the formation of new crystalline phases [14,27].
The XRD data were further analyzed and the crystallite size or microstrain was determined (Table 3). After the calculations, the obtained values show a smooth increase in the size of the crystallites of the iron phase with increasing iron content. For samples E1-0.5 and E2-0.5 the size starts at 7–8 nm and reaches 10–11 nm for those with numbers E1-1.0 and E2-1.0. These data correspond well with the calculations made for microstresses. The larger the size of the crystallites, the smaller the stresses, starting from 1.265% and ending at 0.902% in the case of E1, and from 1.141% to 0.799% in the case of E2. It becomes clear that with increasing the consecutive Fe content, the size of the crystallites increases, and the stresses in the layer decrease.
Table 3.
Values of crystallite size, microstrain, average roughness (Ra) and root mean square of the surface roughness (Rq) of Ni-Fe films.
3.3. Surface Characterization of Ni–Fe Films
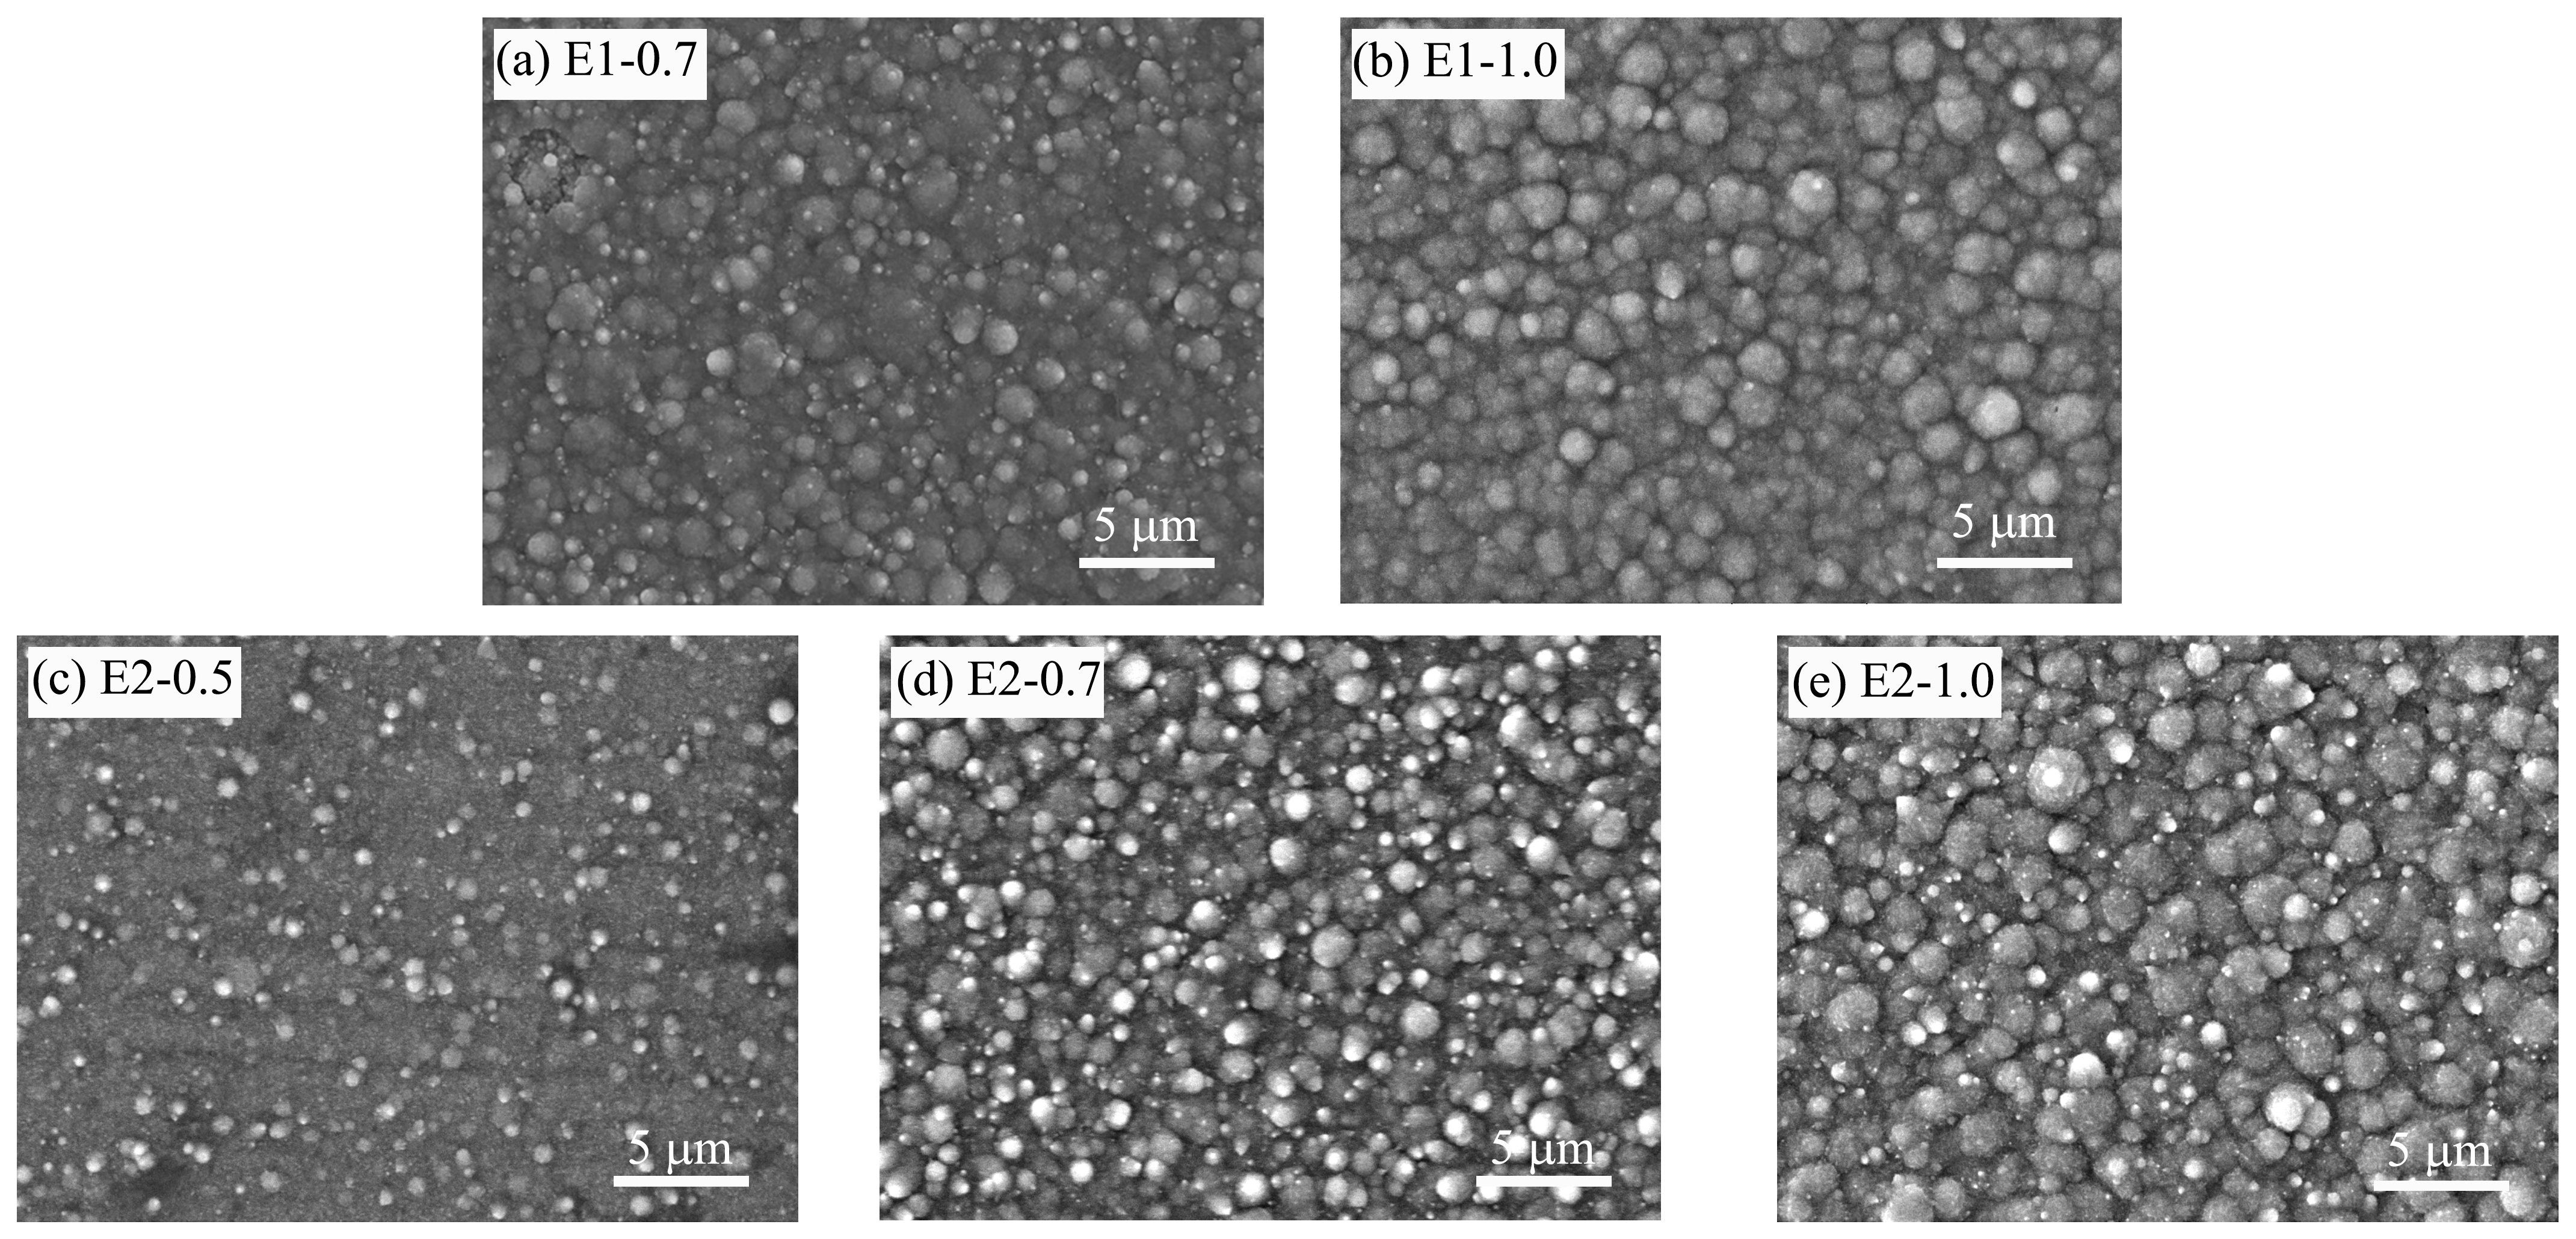
The relatively narrow and comparable thickness range ensures a reliable and meaningful comparison of the morphological, structural, and magnetic characteristics of the obtained Ni–Fe films. SEM observations of the electrodeposited films obtained from electrolytes E1 and E2 reveal similar overall morphological features (Figure 4).
Figure 4.
SEM images of the surface morphology of electrodeposited Ni–Fe thin films from electrolytes E1 (a,b) and E2 (c–e) at different current densities (magnification ×10,000). (a) E1, 0.7 A/dm2; (b) E1, 1.0 A/dm2; (c) E2, 0.5 A/dm2; (d) E2, 0.7 A/dm2; (e) E2, 1.0 A/dm2.
At current densities of 0.5–0.7 A/dm2 (Figure 4a,c,d), the films display a fine, uniform, and compact microstructure composed of homogeneously distributed spherical grains of relatively small size. The surface is dense and free from visible morphological defects such as pores, cracks, or local inhomogeneities, which indicates a stable electrodeposition regime dominated by nucleation rather than grain growth.
When the current density is increased to 1.0 A/dm2 (Figure 4b,e), a clear transition toward a coarser-grained structure is observed. Under these conditions, individual grains grow in size and form more-pronounced spherical agglomerates [11]. Although the surface maintains good overall homogeneity, an increase in surface roughness becomes evident, suggesting that grain growth becomes the dominant mechanism over nucleation at higher current densities [28]. Despite these morphological changes, no significant variation in the metal ratio of the deposited layers is detected, indicating that the chemical composition remains only weakly dependent on current density within the investigated range [25,26].
The evolution of surface morphology and topography with increasing current density correlates well with the increase in coating thickness determined by XRF analysis. Thicker films obtained at higher current densities exhibit a more developed grain structure, which is characteristic of electrodeposited Ni–Fe layers during the transition from kinetically controlled to diffusion-influenced growth regimes [10,11,14].
Overall, the results clearly demonstrate that current density is the key parameter governing the microstructural characteristics of electrodeposited Ni–Fe films. This behavior is consistent with established trends reported for galvanostatic deposition of Ni–Fe alloys, where lower current densities favor nucleation and fine-grained structures, whereas higher current densities promote grain growth and increased surface roughness [14,25,28].
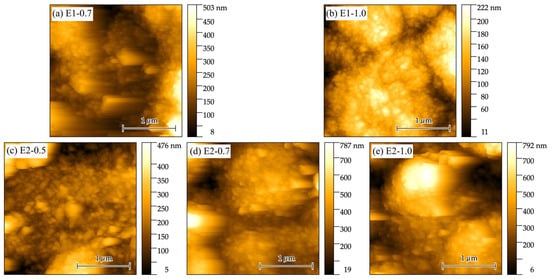
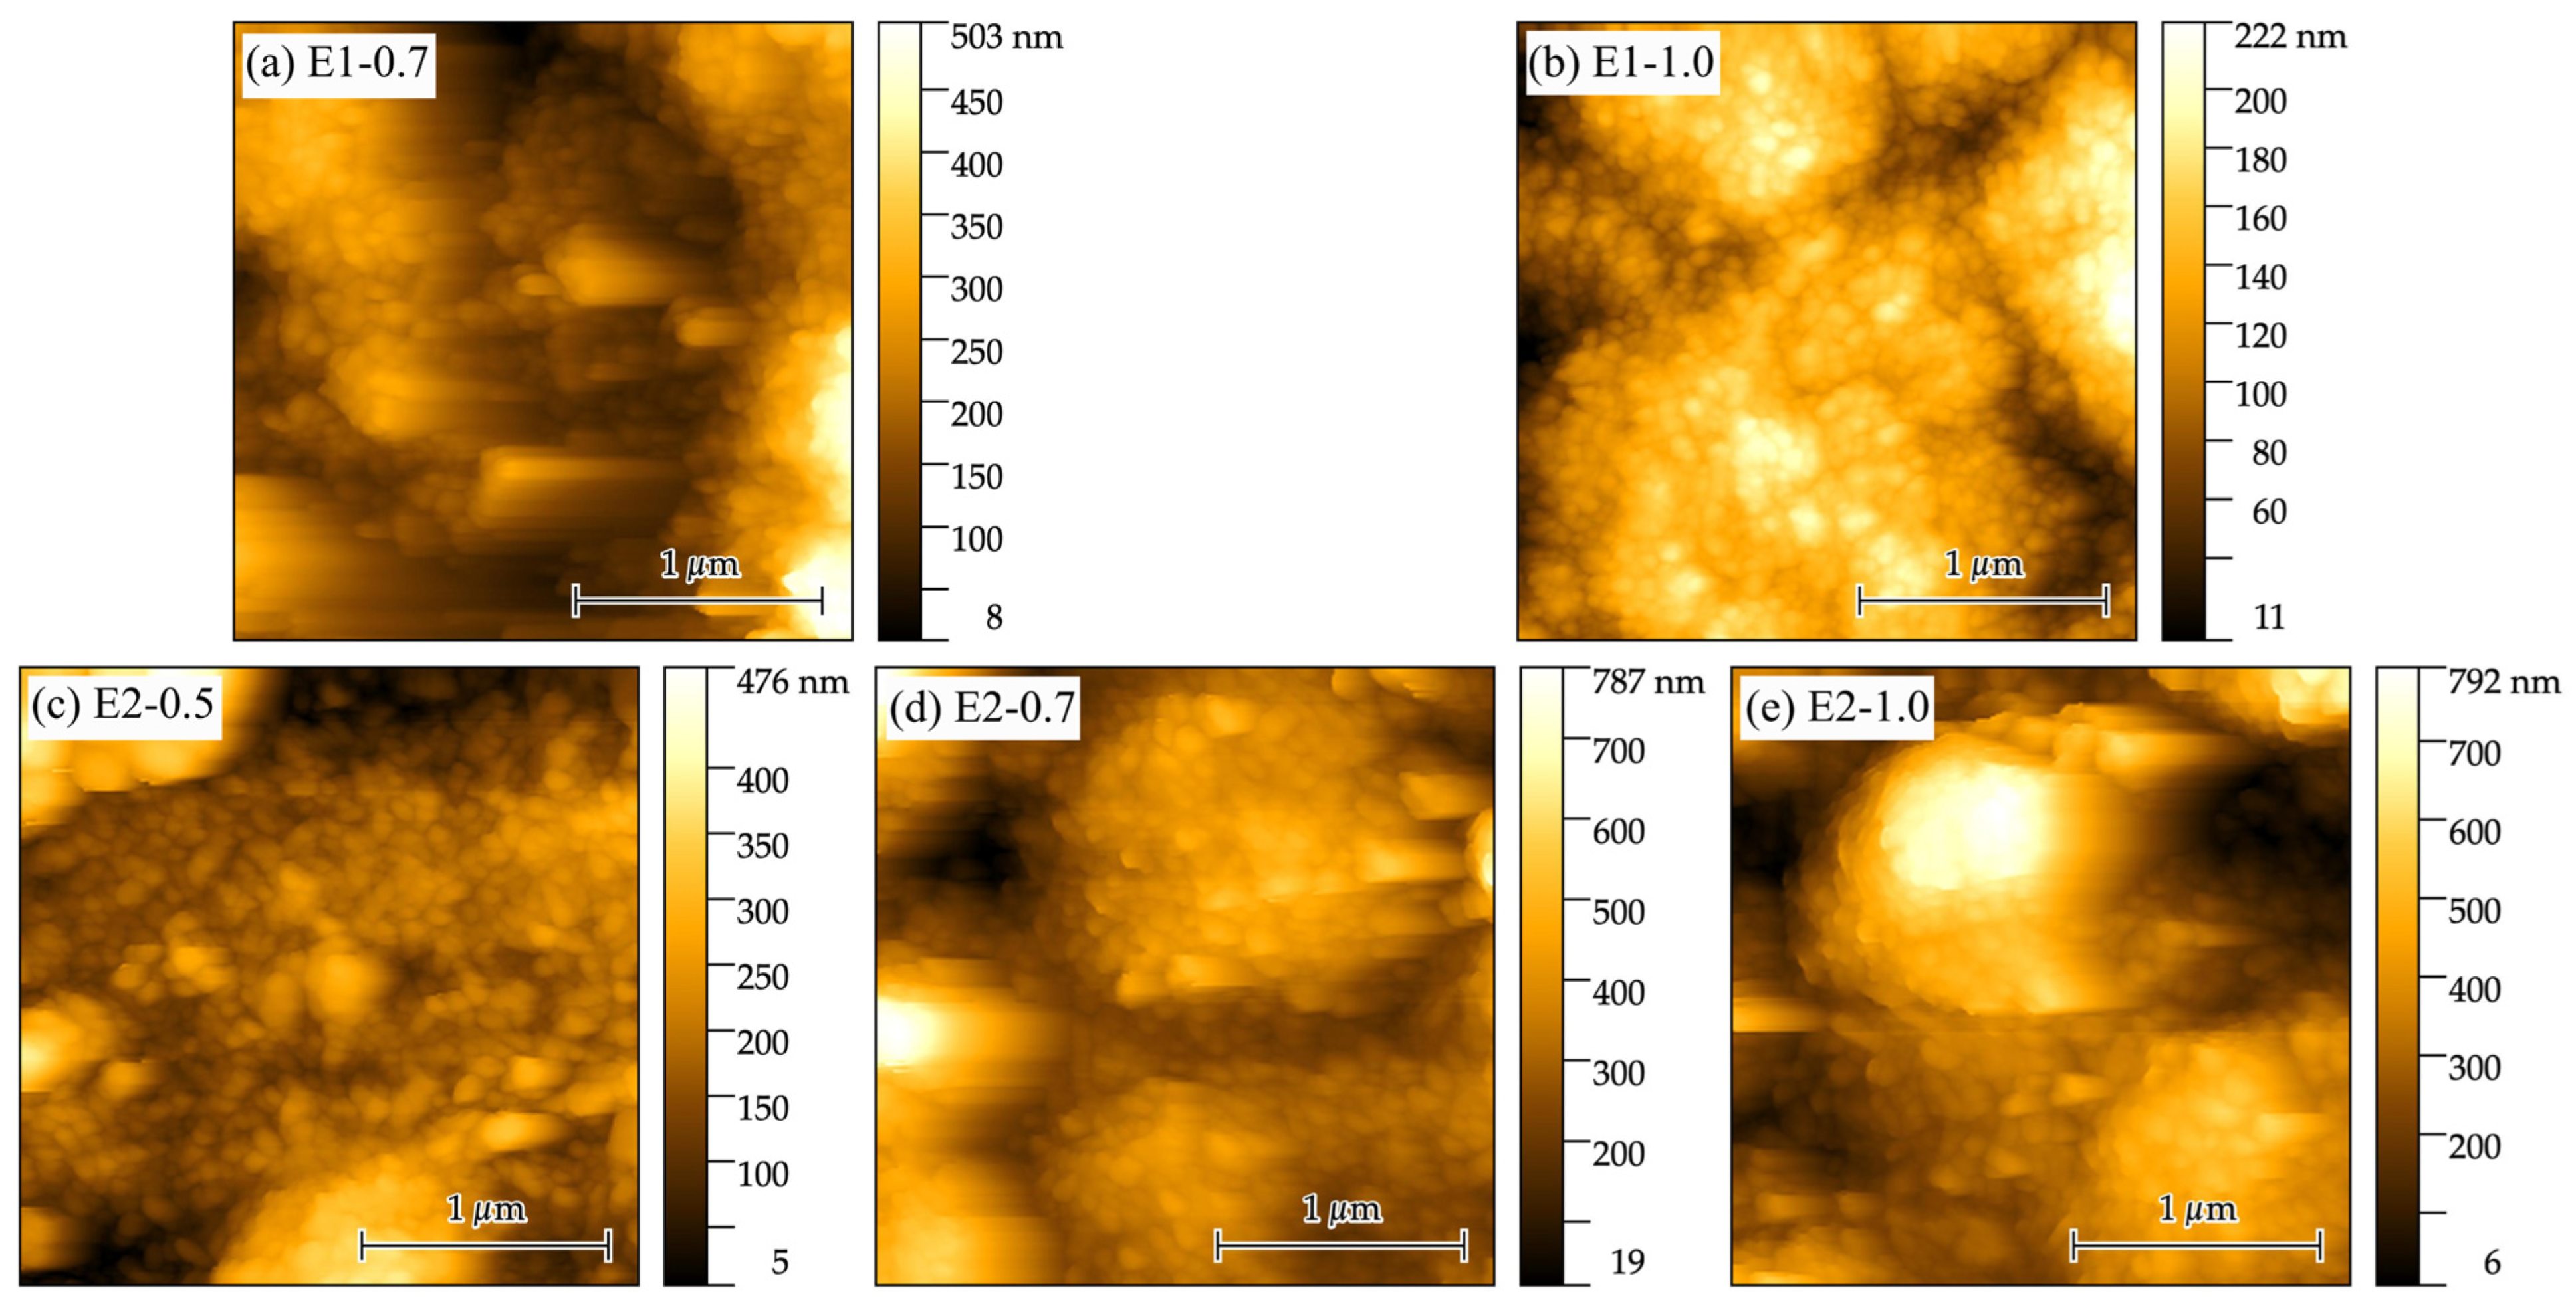
Figure 5 presents AFM images of Ni–Fe films electrodeposited from electrolytes E1 and E2 at different current densities (0.5–1.0 A/dm2). Regardless of the electrolyte composition, the AFM analysis reveals similar trends in surface morphology evolution, confirming that current density is the dominant parameter governing the nanostructure of the deposited layers [11,14]. The average roughness (Ra) and root mean square of the surface roughness (Rq) of Ni-Fe films determined by AFM are presented in Table 2.
Figure 5.
Atomic force microscopy (AFM) images of electrodeposited Ni–Fe thin films from electrolytes E1 and E2 at different current densities. (a) E1, 0.7 A/dm2; (b) E1, 1.0 A/dm2; (c) E2, 0.5 A/dm2; (d) E2, 0.7 A/dm2; (e) E2, 1.0 A/dm2.
At lower current densities (0.5–0.7 A/dm2), the surface is characterized by relatively coarse agglomerated features and a pronounced surface relief, including terrace-like structures. This morphological behavior is typical of an electrodeposition regime in which the growth of pre-existing nuclei predominates, while the nucleation rate remains limited [10].
With increasing current density up to 1.0 A/dm2, a clear refinement and homogenization of the surface morphology is observed. This change is associated with a transition toward an intensive nucleation regime accompanied by restricted growth of individual crystallites [11,14]. As a result, a more compact nanostructure with a more uniform distribution of surface irregularities and reduced local roughness is formed [10].
The observed morphological evolution is in good agreement with the SEM and XRD analyses, which demonstrate preservation of the phase composition—namely, a dominant FCC Ni-based solid-solution phase with a contribution from non-stoichiometric Fe1−xO—and confirm that the detected changes are predominantly microstructural in nature [27].
Surface morphology also exerts a direct influence on the magnetic properties of the films. Rougher and structurally heterogeneous surfaces formed at lower current densities lead to enhanced demagnetizing effects and local magnetic inhomogeneities [27,31]. In contrast, the more homogeneous nanostructure obtained at 1.0 A/dm2 promotes more efficient magnetic domain alignment and a more pronounced magnetic anisotropy, as evidenced by the hysteresis measurements [27,30,31].
In summary, the AFM analysis demonstrates that current density represents a key technological parameter controlling the morphology and nanostructure of electrodeposited Ni–Fe layers, irrespective of the electrolyte composition (E1 or E2). Through its regulation, the surface topology—and consequently the magnetic performance of the films—can be effectively tailored [11,14].
3.4. Magnetic Properties of Thin Ni–Fe Films
The magnetic properties of the electrodeposited Ni–Fe thin films were investigated using a SQUID magnetometer in both parallel (in-plane) and perpendicular (out-of-plane) directions relative to the film surface, with a measurement error of about 1%. The perpendicular hysteresis loops were corrected to eliminate the paramagnetic contribution from the substrate and possible impurities, enabling reliable analysis of the intrinsic magnetic behavior of the deposited layers [30].
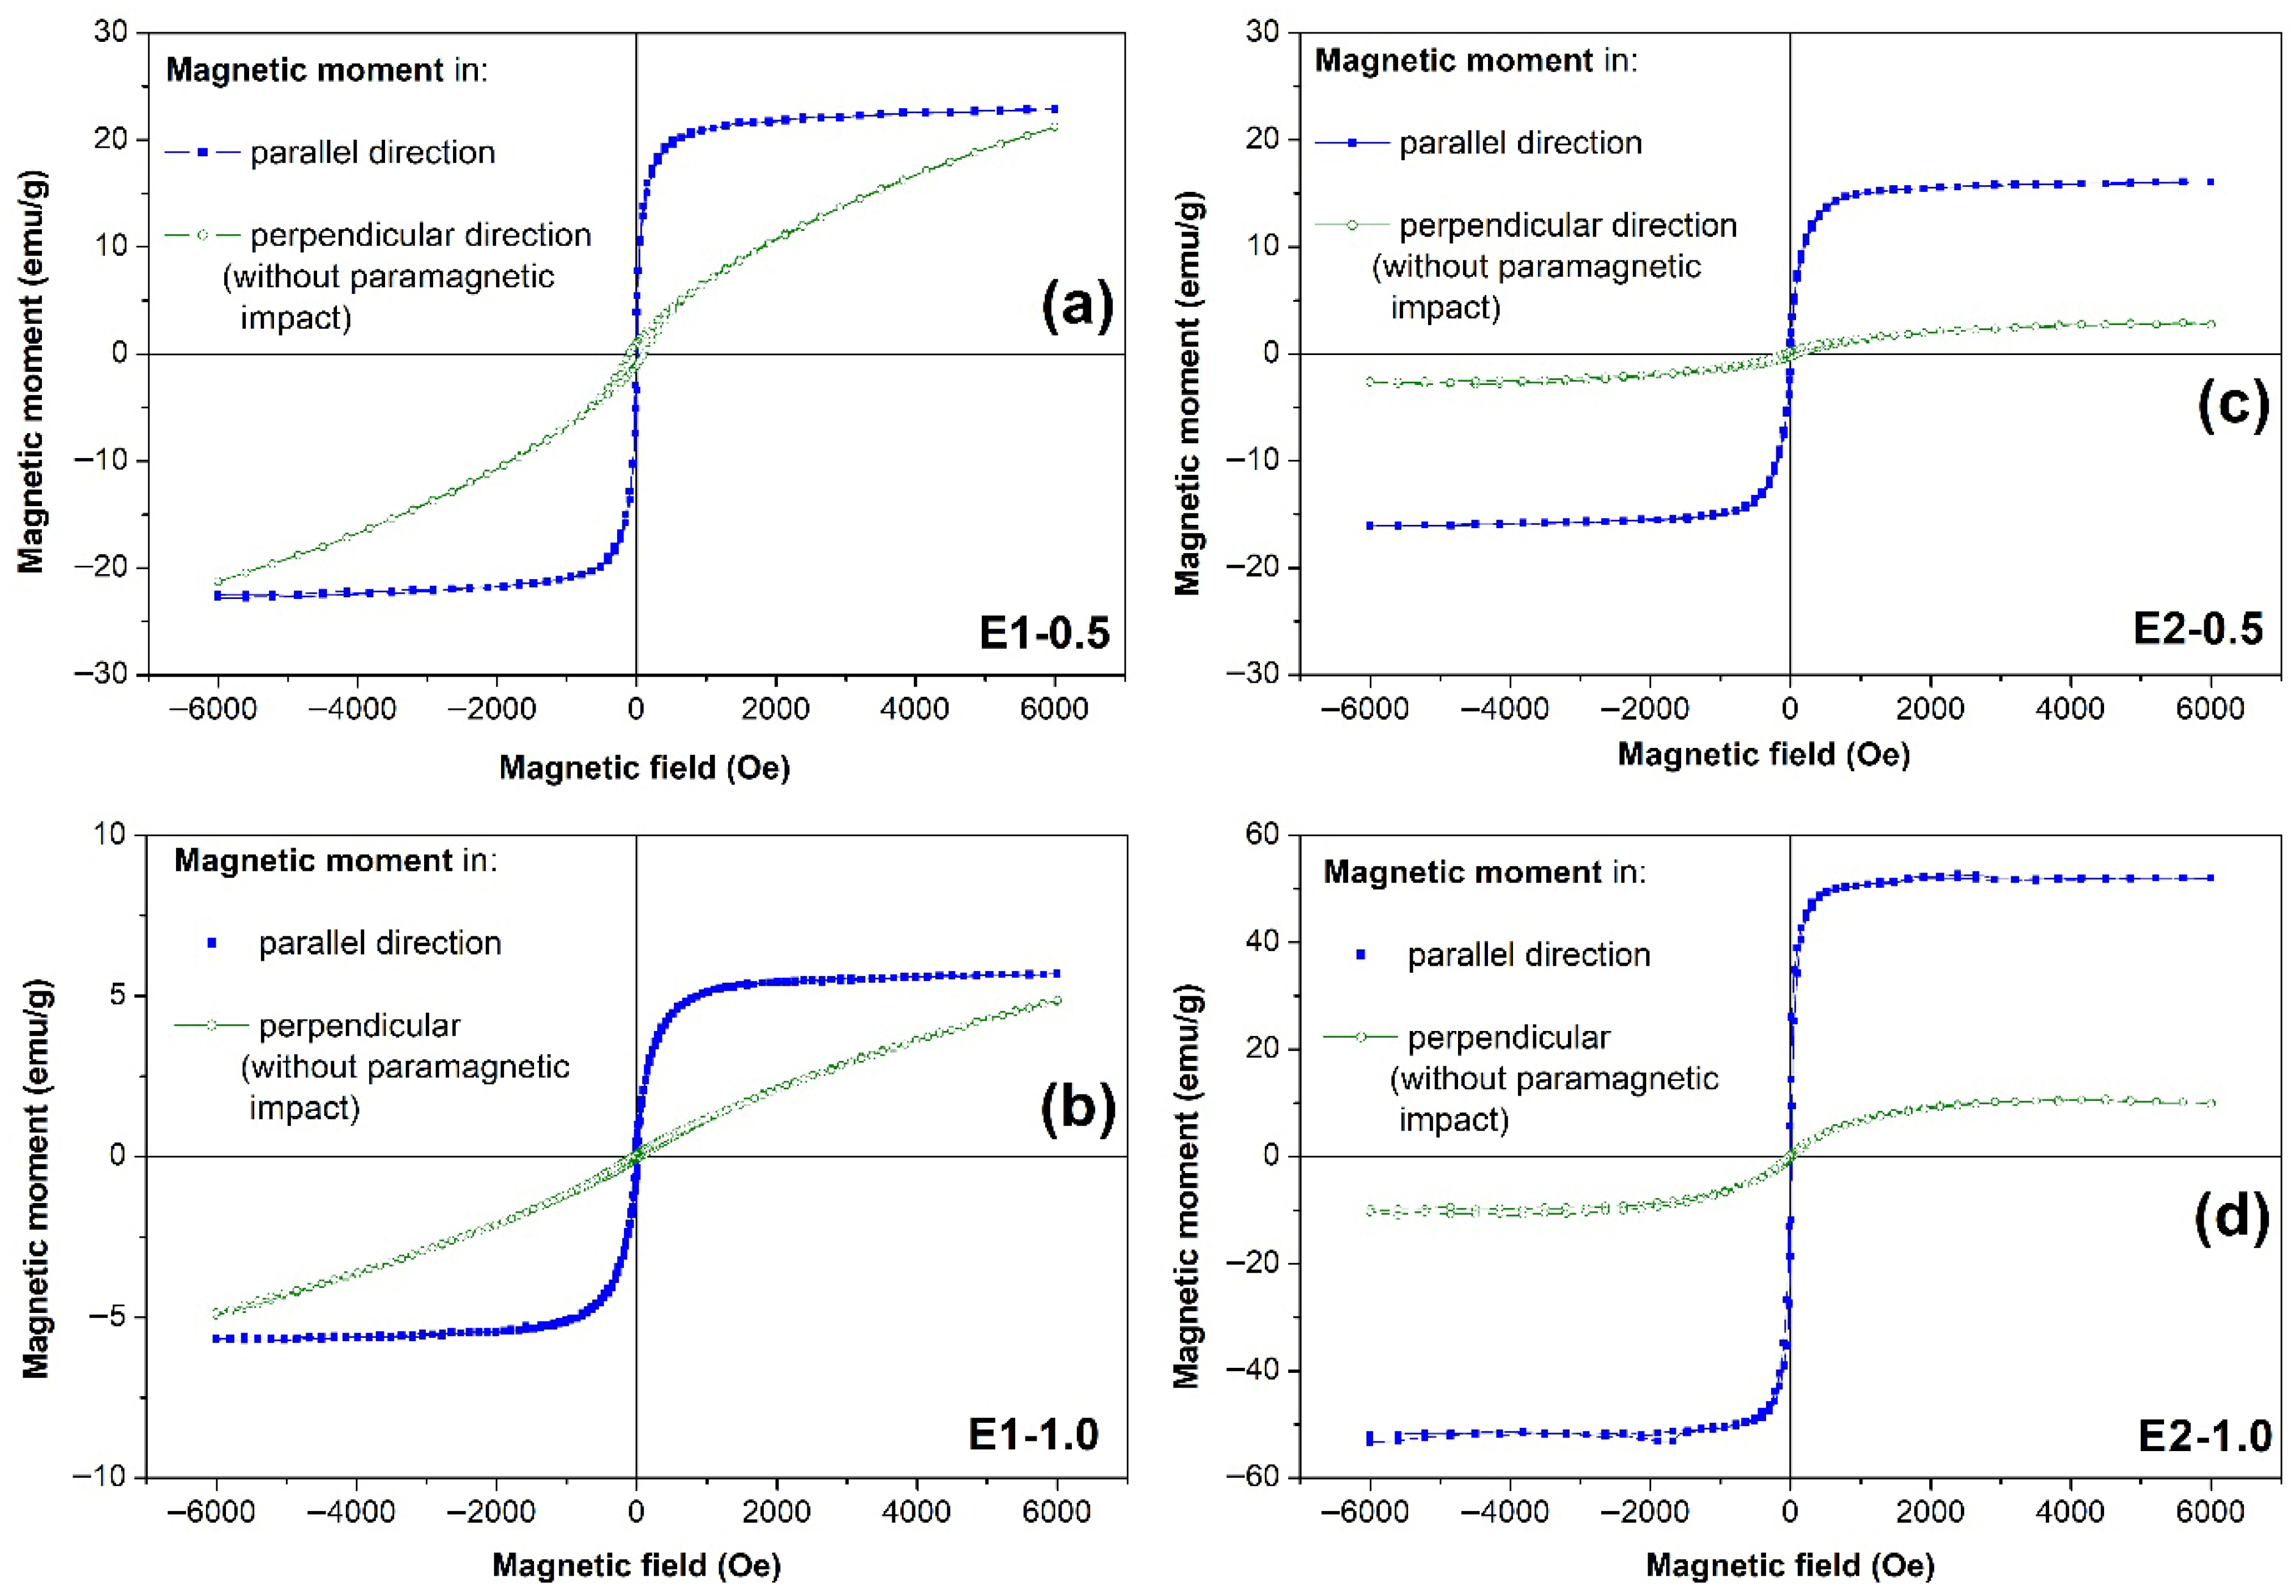
The magnetic signals from samples electrodeposited with electrolytes E1 and E2 at current densities of 0.5 A/dm2 and 1.0 A/dm2 were detected and presented in Figure 6a–d as hysteresis loops of magnetic moment per weight of measured material.
The magnetic moment of all studied Fe-Ni films, independent of the type of electrolyte or the applied current density, presented clear ferromagnetic behavior in the parallel direction of the measurements, as can be seen in Figure 6, Figure 7 and Figure 8.
Fe-Ni film deposited with electrolyte E1 at a low current density of 0.5 A/dm2 has a magnetic moment up to 23 emu/g at 6000 Oe (Figure 6a), which is higher than the 16 emu/g (Figure 6c) obtained for the film prepared at a similar 0.5 A/dm2 but in electrolyte E2.
However, an increase in applied current density during the deposition of Fe-Ni films from 0.5 to 1.0 A/dm2 results in completely different magnetic responses: a significant decrease in the case of electrolyte E1 (only 6 emu/g obtained for sample E1-1.0, Figure 6b) and a significant increase in the case of electrolyte E2 (up to 53 emu/g obtained for sample E2-1.0, Figure 6d).
The sample deposited in E2 at 1.0 A/dm2 (Figure 6d) demonstrates the most favorable magnetic performance among all investigated films. The in-plane hysteresis loop is clearly square-shaped, with low coercivity and rapid magnetic saturation. The behavior of the perpendicular hysteresis curve could indicate a low concentration of defects and oxide inclusions.
Figure 6.
Hysteresis loops of magnetic moment per gram versus applied magnetic field for Ni–Fe thin films electrodeposited from electrolyte E1 at 0.5 A/dm2 (a) or at 1.0 A/dm2 (b) and electrolyte E2 at 0.5 A/dm2 (c) or at 1.0 A/dm2 (d).
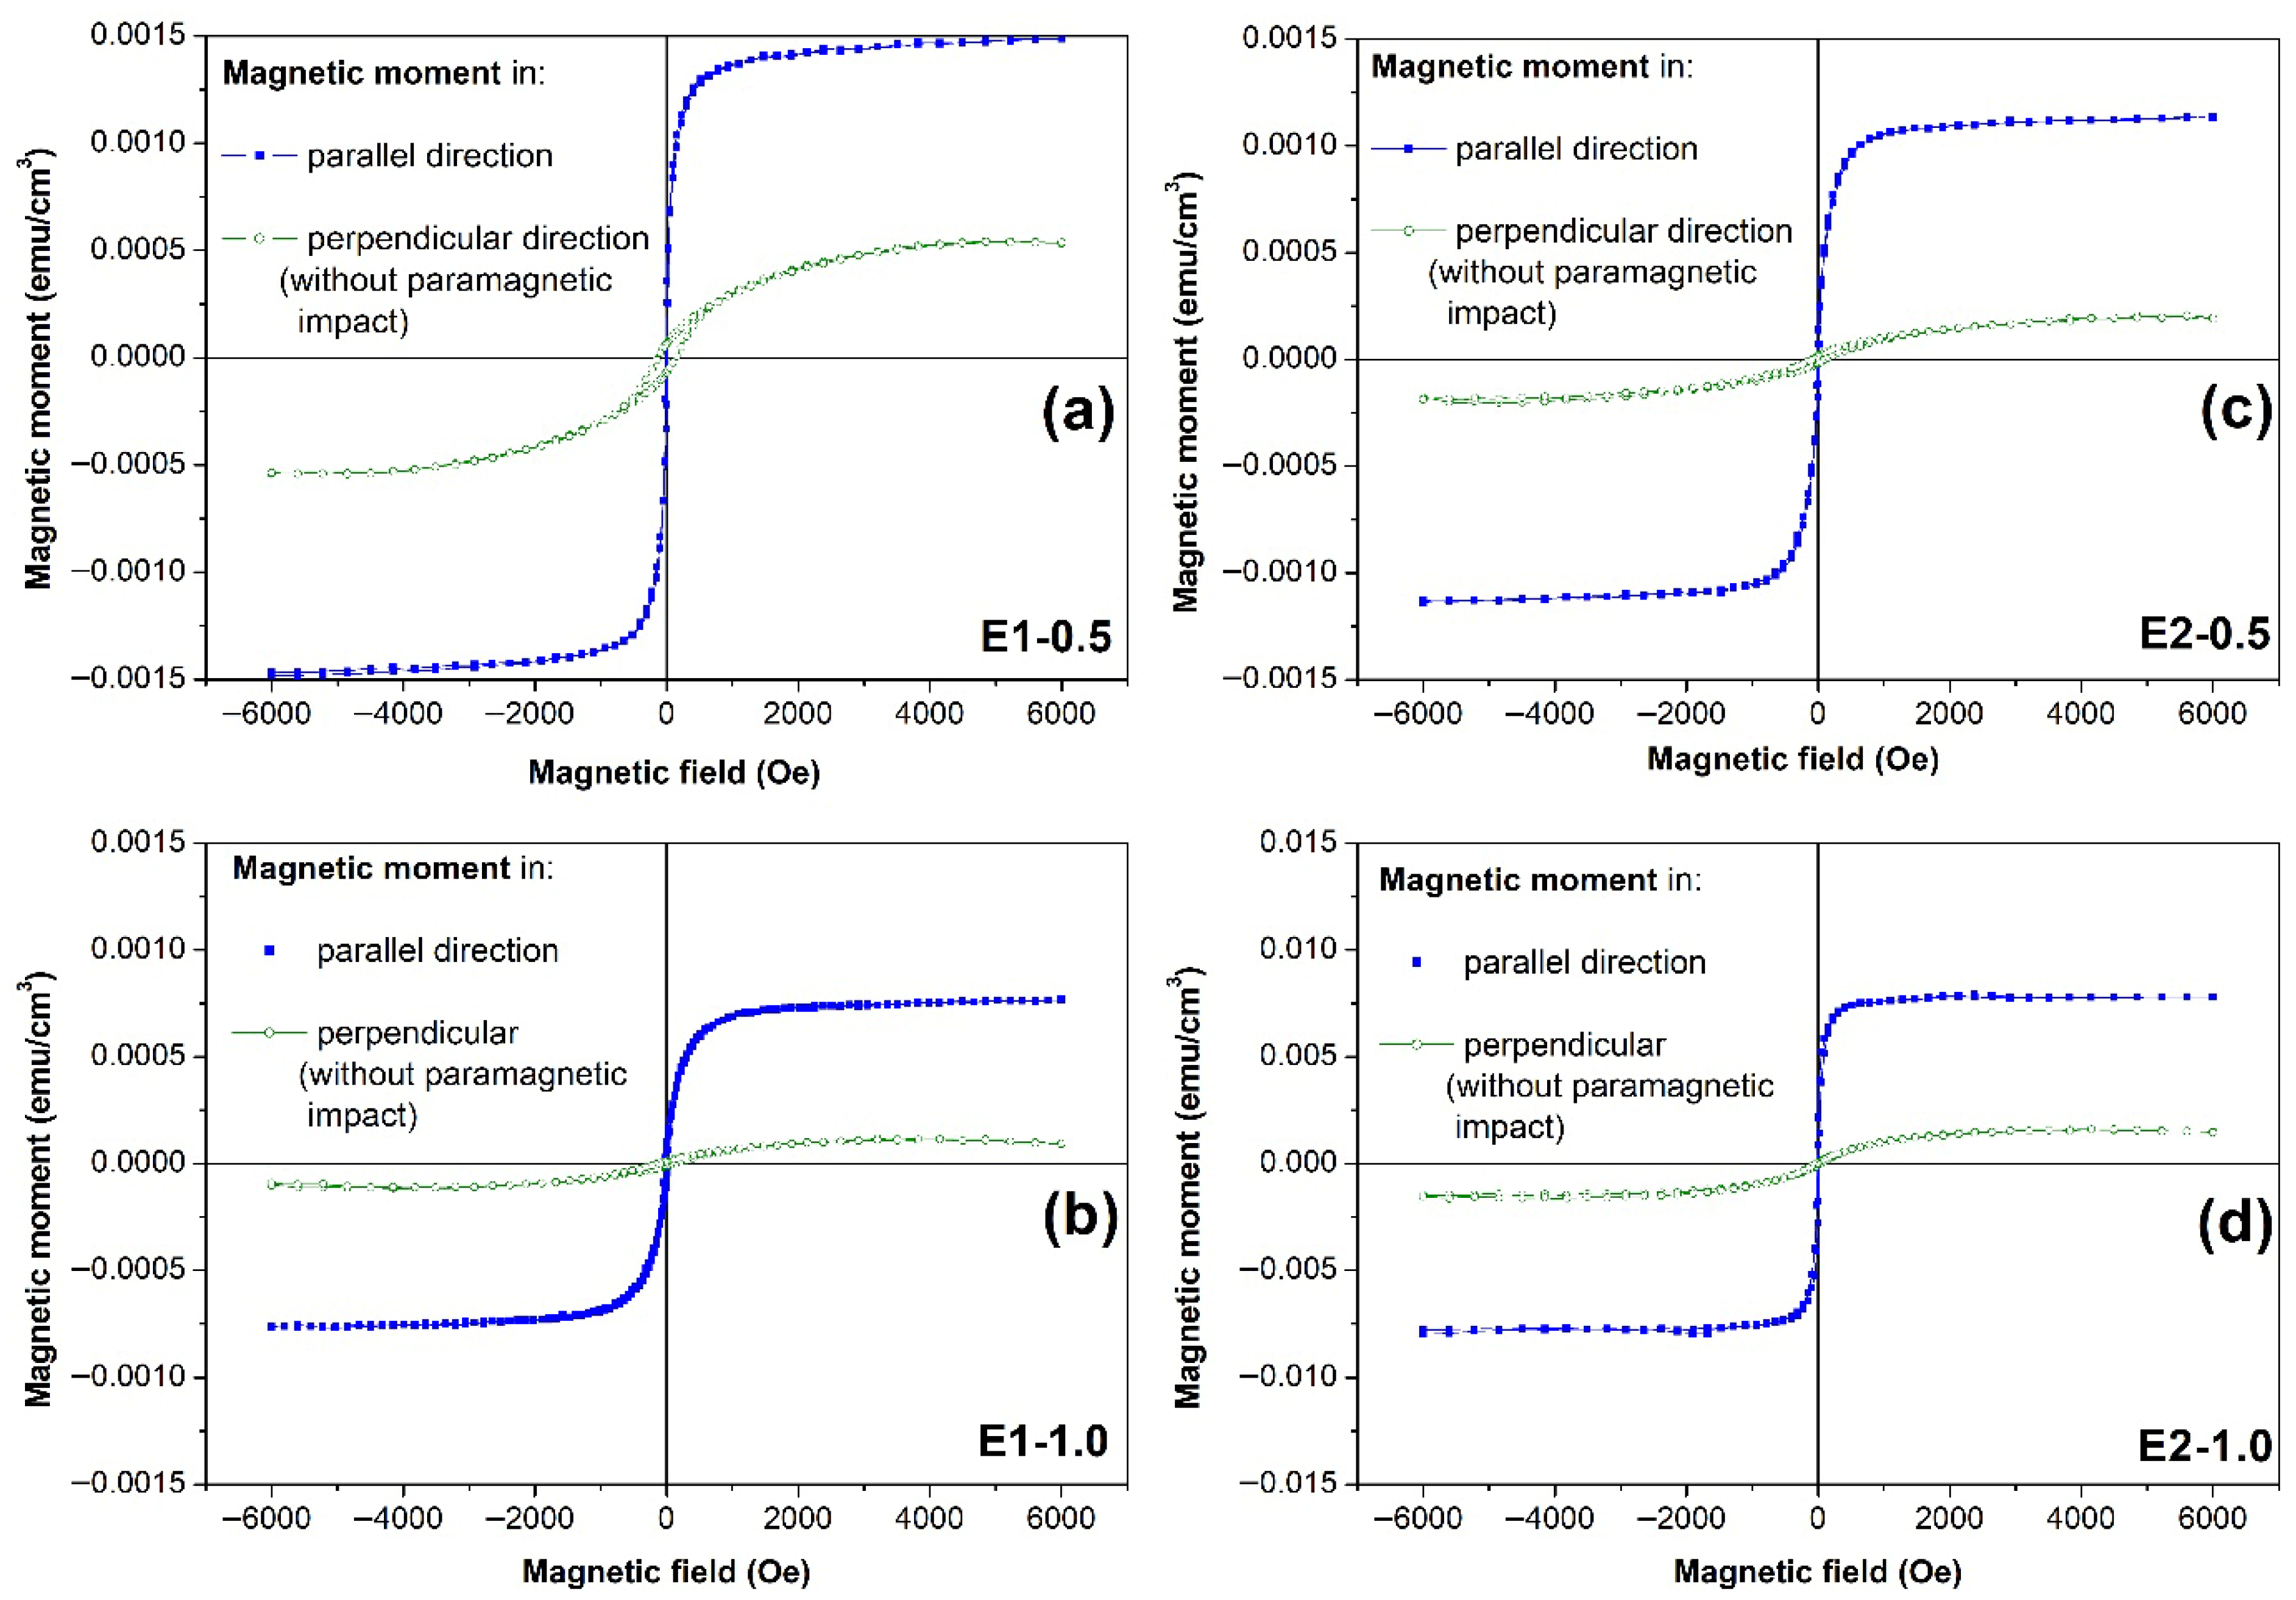
To better understand the effect of the density of magnetic material in the obtained structures, the magnetic moments per volume of the measured material were calculated and are presented in Figure 7a–d.
As can be observed, the magnetic signal for Fe-Ni films deposited with the same electrolyte E1 decreased from 0.0015 emu/cm3 (Figure 7a) to 0.0008 emu/cm3 (Figure 7b) for films made at 0.5 and 1.0 A/dm2. At the same time, an increase of almost four times can be measured for the films deposited in electrolyte E2: from 0.002 emu/cm3 for the films deposited at 0.5 A/dm2 (Figure 7c) to 0.008 emu/cm3 for the films at 1.0 A/dm2 (Figure 7d).
The hysteresis in the parallel direction for all studied films represented ferromagnetic behavior. Moreover, as was already mentioned before, high iron content (~30 wt.%) was detected on the surface of these samples (E1-1.0, E2-0.5 and E2-1.0), which could promote the formation of the ferromagnetic FCC FeNi3 phase, characteristic of permalloy-type alloys [20,27].
The much higher magnetic response obtained from the films prepared in electrolyte E2 and especially from the films deposited at 1.0 A/dm2, in contrast to that from the films made in E1, can be attributed to the higher boric acid concentration in electrolyte E2, which influences Fe reduction and regulates Ni content in the deposit.
Figure 7.
Hysteresis loops of magnetic moment per volume versus applied magnetic field for Ni–Fe thin films electrodeposited from electrolyte E1 at 0.5 A/dm2 (a) or at 1.0 A/dm2 (b) and electrolyte E2 at 0.5 A/dm2 (c) or at 1.0 A/dm2 (d).
Thus, all investigated samples exhibit typical soft ferromagnetic behavior. The out-of-plane hysteresis loops show almost linear magnetization curves with very low magnetic moment, indicating that the easy axis of magnetization lies predominantly in the film plane. This behavior is characteristic of thin Ni–Fe films with thicknesses in the micrometer range [1,2,30]. The optimized Fe/Ni ratio promotes the dominance of the ferromagnetic FCC phase and excellent soft magnetic behavior [20,27]. To illustrate this relationship, Table 4 summarizes the correlation between current density, thicknesses and volumetric densities of the studied samples, and their coercivity (Hc). It should be noted that the increasing thickness of the deposited films (~1–5 μm) also contributes to the observed variations in magnetic anisotropy and saturation behavior due to changes in demagnetizing factors and the domain structure of the films [27,30,31].
Table 4.
Type of electrolyte and current density of corresponding samples, and their volumetric densities and coercivity.
The increase in magnetic response observed for the Fe-Ni films prepared in electrolyte E2 with an increase in current density from 0.5 to 1.0 A/dm2 could be due to the creation of greater amounts of magnetic material because of the increase in layer thickness: 3 μm for films at 1.0 A/dm2, in contrast to ~1.4 μm for films deposited at 0.5 A/dm2. However, a similar increase in thickness for the films deposited with electrolyte E1 (from ~1.3 μm to 2.7 μm for the films deposited at 0.5 or 1.0 A/dm2, respectively) did not lead to a similar increase in magnetic response, which can be explained by the creation of a large amount of non-magnetic material in the deposited films (Ni > Fe).
Moreover, as can be seen from Table 4, the total weight of samples prepared with electrolyte E1 increased by ~5.2 times with the increase in current density from 0.5 A/dm2 to 1.0 A/dm2. At the same time, with a similar increase in current density (and thickness), the total weight of the samples deposited with electrolyte E2 increased by only ~2.4 times.
Furthermore, as indicated in Table 4, the volumetric (bulk) density value also increased with increasing current density for both electrolytes, but it increased by about 2.5 times for electrolyte E1 and only by about 1.1 times for electrolyte E2. Thus, the films deposited from electrolyte E2 grew with a denser structure compared to the films prepared in electrolyte E1.
The normalized saturation magnetizations of the prepared samples were determined as Mnormalized = M/Msaturated and presented in Figure 8.
Figure 8.
Normalized hysteresis loops of magnetic moment versus applied magnetic field for electrodeposited Ni–Fe thin films from electrolyte E1 at 0.5 A/dm2 (a) or at 1.0 A/dm2 (b) and electrolyte E2 at 0.5 A/dm2 (c) or at 1.0 A/dm2 (d).
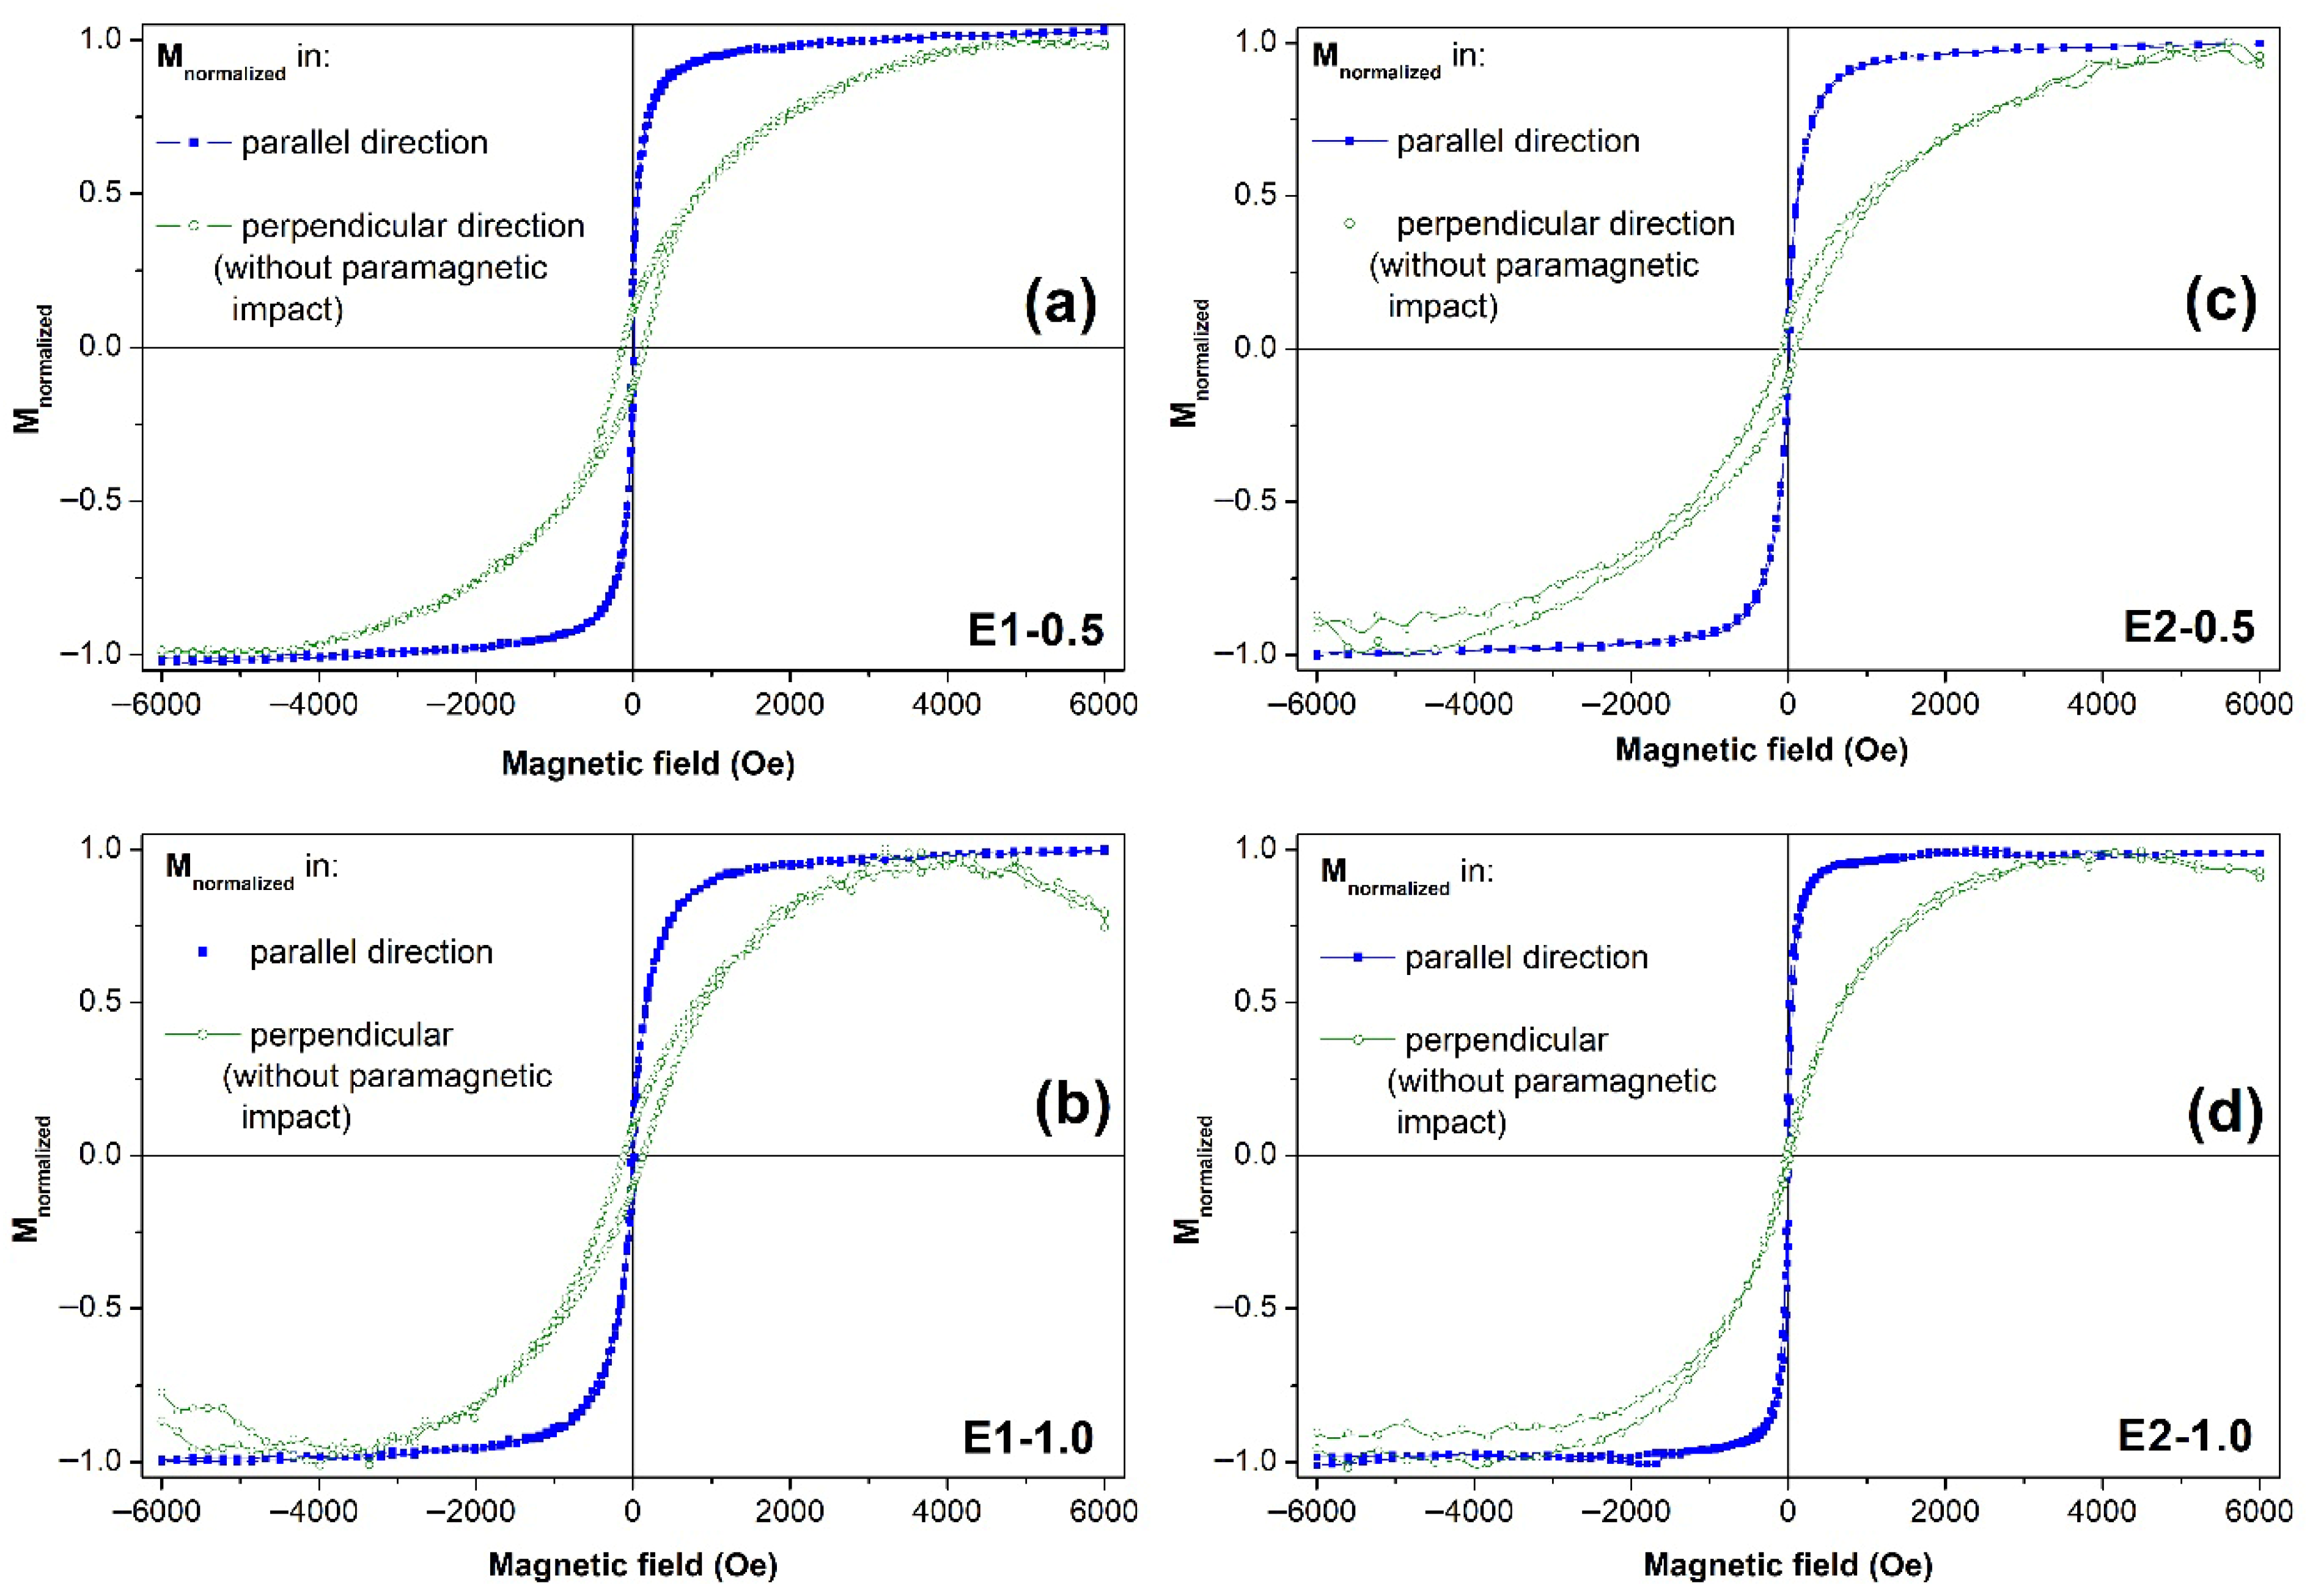
The hysteresis loop of the Fe-Ni film deposited in electrolyte E1 at 0.5 A/dm2 (sample E1-0.5 in Figure 8a) exhibits low in-plane coercivity (~14 Oe) but high out-of-plane coercivity (~140 Oe). The relatively low iron content mentioned before for this film (~15–20 wt.%) favors a dominant FCC Ni-rich phase, resulting in a reduced overall ferromagnetic response [14,27].
A film deposited with the same electrolyte E1 but with increasing current density at 1.0 A/dm2 presents a less square-shaped in-plane hysteresis loop, with similar in-plane coercivity (~14 Oe) and a bit lower out-of-plane coercivity (~120 Oe) (Figure 8b). The perpendicular loop displays a weak slope with minor fluctuations, suggesting a stronger influence of structural defects and the presence of non-stoichiometric FeO.
In contrast to the described samples deposited in electrolyte E1 with high out-of-plane coercivity (~120–140 Oe), Fe- Ni films prepared with electrolyte E2 presented significantly lower out-of-plane coercivity: ~90 Oe (samples deposited at 0.5 A/dm2 in Figure 8c) and ~25 Oe (samples deposited at 1.0 A/dm2 in Figure 8d). This behavior can be attributed to the higher boric acid concentration in electrolyte E2, which blocks nickel reduction but allows iron reduction [12,13].
It should also be noted that, as can be seen in Figure 8, the magnetic moment in the in-plane direction is not the same as in the out-of-plane direction, implying only partial isotropy in these films. The perpendicular loops display a weak slope with minor fluctuations, suggesting a stronger influence of structural defects and the presence of non-stoichiometric FeO.
The optimized Fe/Ni ratio and reduced oxide contribution lead to improved magnetic uniformity and suppressed perpendicular anisotropy [20,27].
The evolution of the out-of-plane hysteresis loops with increasing current density correlates well with the changes in chemical composition, coating thickness, and microstructure revealed by XRF, SEM, and XRD analyses, confirming that the magnetic behavior of the Ni–Fe layers is strongly governed by the deposition conditions [27,30,32].
The obtained trends are in good agreement with literature data, where improved soft magnetic properties at Fe contents of approximately 20–30 wt.% (permalloy-type composition) have been reported for electrodeposited Ni–Fe alloys, typically exhibiting coercivities below 100 Oe under optimized current densities in the range of 0.5–2 A/dm2 [13,20].
Furthermore, the presence of EDTA in the electrolyte, which suppresses the formation of iron oxide phases such as FeO, contributes to enhanced saturation magnetization and improved magnetic anisotropy for both electrolyte systems E1 and E2 [29].
In thin films with thicknesses below approximately 5 μm, shape anisotropy dominates the magnetic behavior, favoring in-plane magnetization. As a result, saturation magnetization values on the order of ~0.1 emu/g in the in-plane direction are typically observed, in agreement with previously reported data for comparable Ni–Fe thin-film systems [20,30,31,32].
4. Conclusions
The present study demonstrates the successful development and optimization of an electrochemical process for the deposition of Ni–Fe thin films from acidic electrolytes in which both nickel and iron ions are introduced in both their sulfate and chloride salts. The proposed approach enables the fabrication of dense and homogeneous films with controllable composition and favorable soft ferromagnetic properties.
The main conclusions of this work could be summarized as the following:
- •
- At low current densities of 0.5–0.7 A/dm2, the films exhibit a fine-grained, compact, and defect-free structure, indicating a nucleation-dominated growth regime. At 1.0 A/dm2, a transition toward a dendrite morphology with increased surface roughness and enhanced grain growth is observed, and the iron content in the film increases.
- •
- The composition of the electrolyte (E1 vs. E2) significantly influences the deposition process and the resulting coating properties. The high boric acid concentration of 10 g/L in electrolyte E2, as well as the presence of chloride ions and Na2EDTA, stimulates the electrodeposition of Fe to a greater extent than that of nickel and reduces the formation of antiferromagnetic FeO phases. Thus, in E2 with an increase in current density from 0.5 to 1.0 A/dm2, the iron content increases from 32.8 to 41.4 wt.
- •
- Higher current densities result in rougher surfaces, but with a more homogeneous microstructure, improved alignment of magnetic domains, and improved in-plane magnetic anisotropy.
- •
- XRD analysis confirms that the films are primarily composed of a ferromagnetic FCC Ni-rich solid solution with minor contributions from non-stoichiometric Fe1−xO (wüstite).
- •
- The magnetic properties of the films are strongly dependent on Fe content and microstructure. At 10–20 wt.% Fe (low current density), the films exhibit higher coercivity (~150–200 Oe), lower saturation magnetization, and weaker ferromagnetic behavior due to the dominance of the FCC Ni phase and the presence of FeO-related defects. At approximately 30 wt.% Fe (1.0 A/dm2), an optimal combination of low coercivity (~50–100 Oe), high saturation magnetization, square in-plane hysteresis loops, and pronounced magnetic anisotropy is achieved, corresponding to a permalloy-like composition. Electrolyte E2 provides the most favorable magnetic characteristics due to reduced oxide formation and improved compositional control.
In summary, the optimization of the current density (1.0 A/dm2), electrolyte composition (E2), and additives (H3BO3 and Na2EDTA) enables the fabrication of Ni–Fe thin films with controlled composition (~30 wt.% Fe), uniform morphology, minimal oxide inclusions, and excellent soft magnetic properties. These films are characterized by low coercivity, high saturation magnetization, and strong in-plane anisotropy, making them suitable for applications in microelectronics, magnetic sensors, and functional magnetic devices. The results provide a solid basis for further technological development and integration of electrodeposited Ni–Fe magnetic films.
Supplementary Materials
The following supporting information can be downloaded at https://www.mdpi.com/article/10.3390/coatings16030365/s1: Table S1: EDX elemental composition of Ni-Fe coatings obtained at different current density.
Author Contributions
Conceptualization, V.K., B.T. and M.G.; Resources, V.K.; Investigation, V.K. and B.T.; Methodology, V.K., M.G. and B.T.; Writing—original draft, V.K., M.G. and B.T.; Writing—review & editing, B.T. and V.K.; Project administration, M.G.; Formal analysis, G.A.; Software, G.A.; Data curation, O.O.; Visualization, V.K. and B.T. All authors have read and agreed to the published version of the manuscript.
Funding
This research has been supported by the European Union—NextGenerationEU, through the National Recovery and Resilience Plan of the Republic of Bulgaria, project number BG-RRP-2.004-0005 and by Project KP-06-H 97/6 ‘Development and Investigation of Innovative Methods for Obtaining Functional Composite Materials of the Dielectric/Metal Type’, funded by the National Science Fund (Bulgaria).
Institutional Review Board Statement
Not applicable.
Informed Consent Statement
Not applicable.
Data Availability Statement
The original contributions presented in this study are included in the article/Supplementary Materials. Further inquiries can be directed to the corresponding authors.
Acknowledgments
The electrochemical equipment and experimental units used in this work were supported by European Regional Development Fund under “Research Innovation and Digitization for Smart Transformation” program 2021–2027 under the Project BG16RFPR002-1.014-0006 “National Centre of Excellence Mechatronics and Clean Technologies” and by Distributed Research Infrastructure INFRAMAT, part of the Bulgarian National Roadmap for Research Infrastructures, supported by the Bulgarian Ministry of Education and Science.
Conflicts of Interest
The authors declare no conflict of interest.
References
- Brenner, A. Electrodeposition of Alloys: Principles and Practice; Academic Press: Cambridge, MA, USA; Elsevier: New York, NY, USA, 1963. [Google Scholar] [CrossRef] [Scilit]
- Yang, R.; Xie, H.; Sun, Y.; Huang, W.; Fang, Y.; Liu, J. Codeposition behavior of Fe-Ni alloys: A review in mechanisms, preparation and effects on composition. Mater. Sci. Eng. B 2024, 310, 117723. [Google Scholar] [CrossRef] [Scilit]
- Schwarzacher, W.; Lashmore, D.S. Giant magnetoresistance in electrodeposited films. IEEE Trans. Magn. 1996, 32, 3133–3153. [Google Scholar] [CrossRef]
- Gamburg, Y.D.; Zangari, G. Theory and Practice of Metal Electrodeposition; Springer: New York, NY, USA, 2011. [Google Scholar] [CrossRef] [Scilit]
- Yang, R.; Guan, W.; Sun, Y.; Cheng, J.; Peng, X.; Liu, J. Effects of pH on the electrodeposited nanocrystalline Fe-Ni films and their magnetic shielding properties. J. Alloys Compd. 2025, 1014, 178662. [Google Scholar] [CrossRef] [Scilit]
- Elsharkawy, S.; Żabiński, P. Effect of Fe/Ni ratio on electrodeposition of Ni-Fe alloys and their bifunctional catalytic performance in hydrogen and oxygen evolution reactions. J. Power Sources 2025, 660, 238516. [Google Scholar] [CrossRef] [Scilit]
- Li, M.; Yang, Y.; Zhang, Y.; Liu, X.Z.; Li, Y.; Niu, X. Interfacial electronic modulation and coupling of NiFe LDH via α-Co(OH)2 for enhanced oxygen evolution. Appl. Surf. Sci. 2026, 721, 165365. [Google Scholar] [CrossRef] [Scilit]
- Liu, D.; Guo, L.; Duan, R.; Zhang, S.; Li, M. Composition optimization and intrinsic electrochemical screening of porous Fe–Ni alloys as potential anodes for microbial fuel cells. Ionics 2025, 31, 13149. [Google Scholar] [CrossRef] [Scilit]
- Kholidy, I.; Bin Sabt, M.H.; El-Salam, H.M.A.; Shaban, M.; Rabia, M. Enhanced electrochemical synthesis of Ni–Fe/brass foil alloy with subsequent combustion for high-performance photoelectrode and hydrogen production applications. Green Process. Synth. 2025, 14, 20250061. [Google Scholar] [CrossRef] [Scilit]
- Paunovic, M.; Schlesinger, M. Fundamentals of Electrochemical Deposition, 2nd ed.; Wiley: Hoboken, NJ, USA, 2006. [Google Scholar] [CrossRef] [Scilit]
- Saraç, U.; Kaya, M.; Baykul, M.C. Synthesis of Ni-Fe thin films by electrochemical deposition technique and characterization of their microstructures and surface morphologies. Turk. J. Phys. 2017, 41, 536–544. [Google Scholar] [CrossRef] [Scilit]
- Dev, K.; Shweta; Annapoorni, S. Minimizing Anomalous Electrodeposition of Fe20Ni80 Alloy Thin Films: Effect on Structural and Magnetic Properties. Integr. Ferroelectr. 2025, 241, 92–100. [Google Scholar] [CrossRef] [Scilit]
- Yin, K.M.; Lin, B.T. Effects of boric acid on the electrodeposition of iron, nickel and iron-nickel. Surf. Coat. Technol. 1996, 78, 205–210. [Google Scholar] [CrossRef] [Scilit]
- Yanai, T.; Shimokawa, T.; Watanabe, Y.; Ohgai, T.; Nakano, M.; Suzuki, K.; Fukunaga, H. Effect of current density on magnetic properties of electrodeposited Fe-Ni films prepared in a citric-acid-based-bath. J. Appl. Phys. 2014, 115, 17A325. [Google Scholar] [CrossRef] [Scilit]
- Wu, Y.; Ji, B.; Wang, W. Reducing the Internal Stress of Fe-Ni Magnetic Film Using the Electrochemical Method. Processes 2021, 9, 1883. [Google Scholar] [CrossRef] [Scilit]
- Khosravi, P.; Ebrahimi, S.A.S.; Lalegani, Z.; Hamawandi, B. Anisotropic magnetoresistance evaluation of electrodeposited Ni80Fe20 thin film on silicon. Micromachines 2022, 13, 1804. [Google Scholar] [CrossRef] [Scilit] [PubMed]
- Tabakovic, I.; Inturi, V.; Thurn, J.; Kief, M. Properties of Ni1−xFex (0.1 < x <0.9) and Invar (x = 0.64) alloys obtained by electrodeposition. Electrochim. Acta 2010, 55, 6749–6754. [Google Scholar] [CrossRef] [Scilit]
- Su, C.; Zhao, L.; Tian, L.; Wen, B.; Xiang, M.; Bai, W.; Guo, J. Rapid Electrodeposition of Fe–Ni Alloy Foils from Chloride Baths Containing Trivalent Iron Ions. Coatings 2019, 9, 56. [Google Scholar] [CrossRef] [Scilit]
- Abdollahi, A.; Ghaffarinejad, A.; Arabi, M. Electrodeposition of Ni-Fe on graphite rod as an efficient and binder-free electrocatalyst for oxygen and hydrogen evolution reactions. J. Alloys Compd. 2023, 937, 168400. [Google Scholar] [CrossRef] [Scilit]
- Shimokawa, T.; Yanai, T.; Takahashi, K.; Nakano, M.; Suzuki, K.; Fukunaga, H. Soft magnetic properties of electrodeposited Fe–Ni films prepared in citric acid based bath. IEEE Trans. Magn. 2012, 48, 2907–2909. [Google Scholar] [CrossRef] [Scilit]
- Torabinejad, V.; Rouhaghdam, A.S.; Aliofkhazraei, M.; Allahyarzadeh, M.H. Electrodeposition of Ni–Fe and Ni–Fe-(nano Al2O3) multilayer coatings. J. Alloys Compd. 2016, 657, 526–536. [Google Scholar] [CrossRef] [Scilit]
- Zubar, T.; Grabchikov, S.; Kotelnikova, A.; Kaniukov, E.; Kutuzau, M.; Leistner, K.; Nielsch, K.; Vershinina, T.; Tishkevich, D.; Kanafyev, O.; et al. Efficiency of magnetostatic protection using nanostructured permalloy shielding coatings depending on their microstructure. Nanomaterials 2021, 11, 634. [Google Scholar] [CrossRef] [Scilit]
- Zubar, T.I.; Usovich, T.I.; Tishkevich, D.I.; Kanafyev, O.D.; Fedkin, V.A.; Kotelnikova, A.N.; Panasyuk, M.I.; Kurochka, A.S.; Nuriev, A.V.; Idris, A.M.; et al. Features of Galvanostatic Electrodeposition of NiFe Films with Composition Gradient: Influence of Substrate Characteristics. Nanomaterials 2022, 12, 2926. [Google Scholar] [CrossRef] [Scilit]
- Zhang, Z.; Wu, Y.; Wang, A.; Xu, K.; Dai, X.; Zhu, H.; Yang, S. A Study on Laser Enhanced Electrodeposition for Preparation Fe-Ni Alloy. Materials 2020, 13, 3560. [Google Scholar] [CrossRef] [Scilit]
- Torabinejad, V.; Aliofkhazraei, M.; Assareh, S.; Allahyarzadeh, M.H.; Rouhaghdam, A.S. Electrodeposition of Ni–Fe alloys, composites, and nano coatings—A review. J. Alloys Compd. 2017, 691, 841–859. [Google Scholar] [CrossRef] [Scilit]
- Rai, T.Y.; Hegde, A.C. Development of high corrosion resistant (Ni-Fe) alloy coatings from a low concentration bath through multilayer approach. Mater. Sci. Technol. 2025, 41, 77–89. [Google Scholar] [CrossRef] [Scilit]
- Manimaran, E.I.; Antonyraj, K.; Navaneetha, E.R.; Kumar, V.S.; Rajesh, P. Influence of different conducting substrates on magnetic properties of electrodeposited Ni-Fe thin films. J. Mater. Sci. Mater. Electron. 2018, 29, 3715–3721. [Google Scholar] [CrossRef] [Scilit]
- Wu, Y.; Chang, D.; Kim, D.; Kwon, S.-C. Influence of boric acid on the electrodepositing process and structures of Ni–W alloy coating. Surf. Coat. Technol. 2003, 173, 259–264. [Google Scholar] [CrossRef] [Scilit]
- Yu, X.; Yang, J.; Ren, X.; Sui, Z. Influences of pH and EDTA Additive on the Structure of Ni Films Electrodeposited by Using Bubble Templates as Electrocatalysts for Hydrogen Evolution Reaction. Membranes 2021, 11, 165. [Google Scholar] [CrossRef] [Scilit]
- Cullity, B.D.; Graham, C.D. Introduction to Magnetic Materials, 2nd ed.; Wiley-IEEE Press: Hoboken, NJ, USA, 2009. [Google Scholar] [CrossRef] [Scilit]
- Palasantzas, G.; Zhao, Y.-P.; De Hosson, J.T.M.; Wang, G.-C. Roughness effects on magnetic properties of thin films. Phys. B 2000, 283, 199–202. [Google Scholar] [CrossRef] [Scilit]
- Cao, D.; Wang, Z.; Feng, E.; Wei, J.; Wang, J.; Liu, Q. Magnetic properties and microstructure investigation of electrodeposited FeNi/ITO films with different thickness. J. Alloys Compd. 2013, 581, 66–70. [Google Scholar] [CrossRef] [Scilit]

Disclaimer/Publisher’s Note: The statements, opinions and data contained in all publications are solely those of the individual author(s) and contributor(s) and not of MDPI and/or the editor(s). MDPI and/or the editor(s) disclaim responsibility for any injury to people or property resulting from any ideas, methods, instructions or products referred to in the content. |
© 2026 by the authors. Licensee MDPI, Basel, Switzerland. This article is an open access article distributed under the terms and conditions of the Creative Commons Attribution (CC BY) license.