


Abstract
Climate warming can alter asphalt pavement design requirements and durability. WorldClim 2.1 and eight CMIP6 models provided common climate inputs for comparing representative semi-rigid and flexible base pavements across China. Three future periods under SSP2-4.5 and SSP5-8.5 were evaluated against the 1970–2000 baseline. JTG D50-2017 relationships combined climatic inputs with equivalent layer thicknesses and moduli to calculate temperature adjustment factors and equivalent temperatures. With other design inputs fixed for each structure, temperature-dependent performance relationships quantified relative changes in allowable load repetitions, allowable subgrade strain, and asphalt-layer permanent deformation separately for each climate model. National area-weighted and nine-city results were summarized using ensemble medians and interquartile ranges. For 2021–2040, the ensemble medians of national warming were 1.64 °C and 1.85 °C under SSP2-4.5 and SSP5-8.5, respectively. Under SSP5-8.5, the ensemble medians of national mean reductions in asphalt-layer allowable load repetitions increased from 4.10% and 6.86% in 2021–2040 to 11.84% and 19.25% in 2081–2100 for semi-rigid and flexible base pavements, respectively. Late-century national warming under this scenario ranged from 4.23 to 8.20 °C across models. The ratio of flexible to semi-rigid asphalt-layer temperature factor increments was 2.35, based on ensemble medians of national means, with larger increments for flexible pavements in all eight models. These findings support updating local temperature inputs and comparing candidate structures through fatigue, subgrade strain, and rutting checks matched to project design periods.
1. Introduction
Climatic conditions inform asphalt pavement material selection and structural design. China’s diverse climate and topography lead to regional differences in pavement climate zoning and temperature design [1]. Because asphalt materials are temperature-sensitive, air temperature can affect their response through the pavement temperature field, while sustained warming can alter thermal aging [2]. Environmental exposure can alter structural performance [3], and future climate change should be considered in parameter selection and performance assessment for pavements with long design lives. Nationwide assessments have combined historical meteorological data with performance relationships to analyze the effects of temperature rise on fatigue, permanent deformation, allowable strain in the subgrade, and low-temperature cracking [4]. Studies on rutting development and pavement resilience in different climate zones further indicate that the extent of climate change impacts varies by region [5,6]. Therefore, regional warming and its corresponding engineering responses must be evaluated in conjunction with local climatic conditions and pavement structures. Wang et al. [7] analyzed temperature design parameters in representative regions under different emission scenarios, compared permanent deformation and fatigue responses across pavement structures, and reported the corresponding material and structural parameters. The temperature and strain distributions, varying with depth, affect the critical location of fatigue damage within the asphalt layer [8]. Aging and temperature- and frequency-dependent material properties also influence top-down cracking [9]. Comparisons of mechanistic–empirical methods have shown that climatic conditions and design methods affect performance assessments [10], while research on climate-adaptive design has proposed incorporating future scenarios into structural design and rehabilitation planning [11]. These findings demonstrate that temperature design parameters serve as a critical link between climatic inputs and structural performance; comparisons should therefore account for layer thickness, material moduli, and response type.
Advances in climate projections have expanded the data available for these analyses. Phase 6 of the Coupled Model Intercomparison Project (CMIP6) and its Scenario Model Intercomparison Project (ScenarioMIP) provide a unified experimental framework for analyses across models and scenarios [12,13]. Regional assessments in China indicate differences in temperature simulation performance and future warming distributions among different models [14]. Available climate products differ in temporal resolution, reference data, and bias-correction strategy. NEX-GDDP-CMIP6 provides daily projections using bias correction and spatial disaggregation [15], while ERA5-Land-based projections and HiCPC use different reference datasets and processing configurations [16,17]. These choices can affect local projections [18]. For example, in a Canadian evaluation, Li and Li [19] found that quantile delta mapping more closely reproduced observations, whereas scaled distribution mapping better retained the original projected changes. Thus, agreement with reference conditions and preservation of the climate-change signal are distinct criteria for selecting climate inputs. WorldClim interpolates monthly GCM temperature changes and applies them to its historical climatology [20,21]. Daily series support analyses of short-term variability and extremes; monthly climatologies provide the inputs for calculating the annual mean temperature and annual range of monthly means used in the design relationships. WorldClim was therefore selected to provide consistent climate inputs across models, scenarios, and periods for the structural comparison.
The processing of climate data and their conversion into pavement design parameters also influence assessment results. The choice of ensemble averaging method may alter estimated future pavement temperatures [22], while different downscaling methods can yield different subsurface temperature distributions [23]. A comparison of meteorological data sources indicates that differences in input data can propagate to pavement performance predictions [24]. In engineering applications, joint climate and traffic regionalization studies emphasize that design zones must account for both environmental and load conditions [25]. Research from China, Canada, and Estonia shows that future climate conditions and the methods used to convert air temperatures to pavement temperatures influence the selection of binder grades [26,27,28]. Adaptation measures have been further extended to include adjustments to structural thickness and material properties [29] as well as the optimization of maintenance strategies [30]. Life-cycle studies in China and the United States indicate that climate change also affects pavement environmental performance and economic costs [31,32]. Therefore, clarifying regional temperature changes and their structural responses helps provide a consistent engineering basis for adjustments to materials, design, and maintenance.
Previous studies have quantified national pavement responses using station-based climate statistics and relationships with global mean surface temperature [4], and compared semi-rigid and flexible base pavements in nine cities under common CMIP5 climate inputs [7]. These studies establish the relevance of regional climate and pavement structure. Building on this evidence, an integrated comparison is needed to characterize structural contrasts across space and assessment periods under common scenario pathways. It should also establish whether structural rankings persist across individual climate models. Relating these contrasts to local climatic baselines can also explain why absolute parameter increments and relative performance changes lead to different regional design priorities.
This study combines historical WorldClim 2.1 data with projections from eight CMIP6 models to evaluate representative semi-rigid and flexible base pavements across China. SSP2-4.5 and SSP5-8.5 are assessed for 2021–2040, 2041–2060, and 2081–2100 relative to the common 1970–2000 baseline. Two hypotheses concerning structural contrasts and city-level response rankings were evaluated. H1 predicts that, under identical climate inputs, the flexible base pavement exhibits larger absolute increases in the asphalt-layer temperature adjustment factor. It also predicts larger relative reductions in asphalt-layer allowable load repetitions, with both comparisons made against the semi-rigid base pavement. H2 predicts that city rankings differ among asphalt-layer fatigue, allowable subgrade strain, and permanent deformation for a given scenario and assessment period. Established mechanistic–empirical design relationships [33] translate climatic inputs into temperature design parameters and performance responses. Calculations are performed separately for each climate model over 34,412 land grid cells before area-weighted national statistics and ensemble summaries are formed. Structural comparisons at national and city scales evaluate H1, while rankings among the nine cities across the three performance indicators evaluate H2. These analyses aim to inform the selection of local temperature design inputs and the comparison of candidate materials, layer thicknesses, and base structures through fatigue, subgrade strain, and rutting checks. The 2021–2040 results address near-term construction and rehabilitation, with later periods providing additional climate cases for longer-term planning.
2. Data and Methods
2.1. Data and Research Design
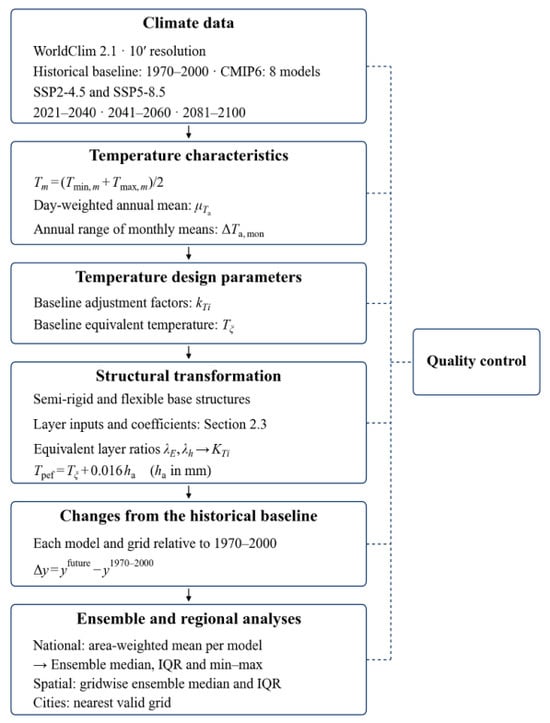
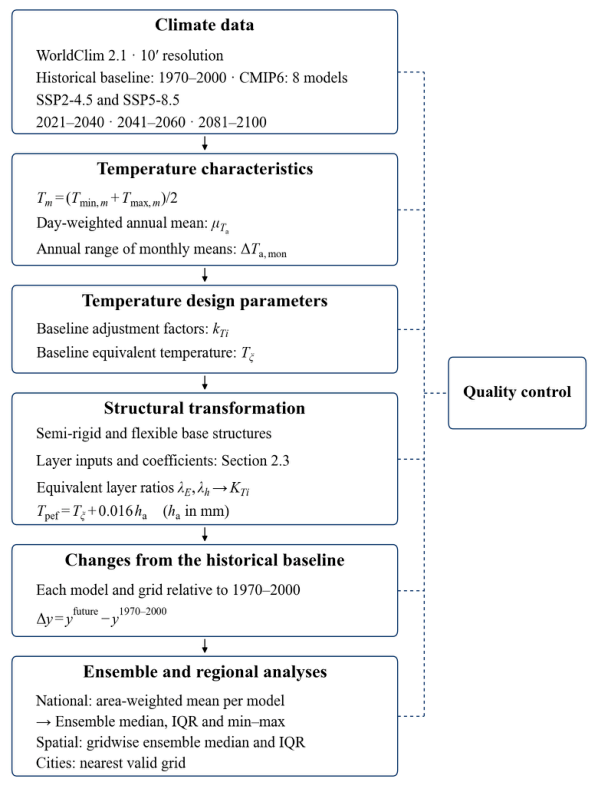
The computational domain consists of a 10-arc-minute grid covering the area between 73° E and 135° E and 18° N and 54° N in China. Historical climate data were obtained from WorldClim 2.1, while future climate data were obtained from the bias-corrected and downscaled CMIP6 data released by WorldClim. The historical reference period is 1970–2000; future data cover the two scenarios SSP2–4.5 and SSP5–8.5, as well as three 20-year windows: 2021–2040, 2041–2060, and 2081–2100. The 1970–2000 period was retained because it is the historical climatology represented by WorldClim 2.1 and the baseline used for downscaling and bias correction of the CMIP6 projections [20,21]. This common reference enables consistent comparisons of temperature effects across pavement structures, climate models, and future periods. The selected WorldClim CMIP6 product provides future climatologies beginning in 2021–2040. This window was therefore used for the near-term assessment, while 2001–2020 was not included as a separate retrospective assessment period. The 2021–2040 results are used to assess near-term design and rehabilitation needs, while 2041–2060 extends the comparison to subsequent planning periods. The 2081–2100 window serves as a long-term climate benchmark for examining how sustained warming changes the magnitude and structural contrast of pavement responses. Eight models with complete data for both temperature variables, both scenarios, and all three periods were selected: ACCESS-CM2, BCC-CSM2-MR, CNRM-CM6-1, INM-CM5-0, IPSL-CM6A-LR, MIROC6, MPI-ESM1-2-HR, and MRI-ESM2-0. The computational workflow is shown in Figure 1. Data processing and analyses used Python 3.12.10 with NumPy 2.5.2, Rasterio 1.4.3, and Shapely 2.1.1. Figures were prepared using Matplotlib 3.10.5 and 3.11.2, with pyproj 3.8.0 for coordinate transformations.
Figure 1.
Workflow for calculating pavement temperature design parameters.
2.2. Temperature Characterization and Design Parameter Calculations
For each climatic period, the monthly mean temperature was approximated by the arithmetic midpoint of the multiyear monthly means of daily minimum and maximum temperatures:
where is the monthly mean temperature proxy for month m, and and are the long-term monthly means of daily minimum and maximum temperatures for that month, respectively.
The annual mean temperature was calculated from the monthly mean temperature proxies, weighted by the number of days in each month of a non-leap year:
where is the annual mean temperature weighted by the number of days in each month, and is the number of days in the mth month.
The annual range of monthly mean temperatures was calculated as the difference between the means for the warmest and coldest months:
where is the annual range of monthly mean temperatures.
The baseline temperature adjustment factors for each response type are calculated from the annual mean temperature and the annual range of monthly mean temperatures [33]. For response type i, the climate coordinate is defined as:
where is the climate coordinate for response type , is the response weight for the annual range of monthly mean temperatures, and i is the response type index. The values i = 1, 2, and 3 denote fatigue of the asphalt layer, fatigue of the inorganic binder-stabilized layer, and vertical compressive strain at the top of the subgrade, respectively.
The baseline temperature adjustment factor is expressed as:
where is the baseline temperature adjustment factor for response type i, , , and are the quadratic coefficient, linear coefficient, and constant term, respectively, and is the climate coordinate. For i = 1, 2, = (0.0006, 0.027, 0.71, 0.05). For i = 3, = (0.0013, 0.003, 0.73, 0.08).
The baseline equivalent design temperature is calculated as follows:
where represents the baseline equivalent design temperature.
Meteorological statistics for Beijing, Jinan, Rizhao, and Taiyuan from the design parameter reference table in JTG D50-2017 [33] were substituted into Equations (4)–(6), and the calculated values were compared with the corresponding tabulated temperature parameters. For the temperature parameter y, the difference between the calculated value and the table value is defined as:
where is the residual between the calculated and tabulated values, is the calculated value, and is the corresponding tabulated value. Across the four cities, the maximum absolute differences were 0.00162 for the baseline fatigue temperature adjustment factor, 0.00498 for the baseline subgrade temperature adjustment factor, and 0.036 °C for the baseline equivalent design temperature. The four-city comparison assesses consistency between the numerical implementation of the temperature-parameter relationships and the reference table, using the published coefficients without refitting. The climate inputs for the national and nine-city analyses are obtained directly from the WorldClim grids.
ry = yrec − ytab
2.3. Structural Temperature Adjustment Factors and Ensemble Statistics
The baseline temperature adjustment factor and baseline equivalent design temperature obtained from Equations (5) and (6) depend only on climatic conditions and do not account for differences in pavement layer thicknesses and moduli. To account for pavement structure, the asphalt layers and the combined base and subbase were each represented by an equivalent layer, and the equivalent parameters were used in the structural correction relationship. The equivalent modulus and thickness ratios between the asphalt layers and the combined base and subbase are defined as:
where and are the equivalent moduli of the asphalt layers and the combined base and subbase, respectively, and and are the corresponding equivalent thicknesses.
The structural temperature adjustment factor is calculated as follows:
where is the temperature adjustment factor that accounts for the influence of the pavement structure, and are the thickness-ratio correction factors, and and are the modulus-ratio correction factors.
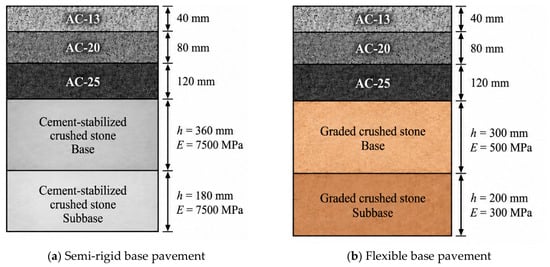
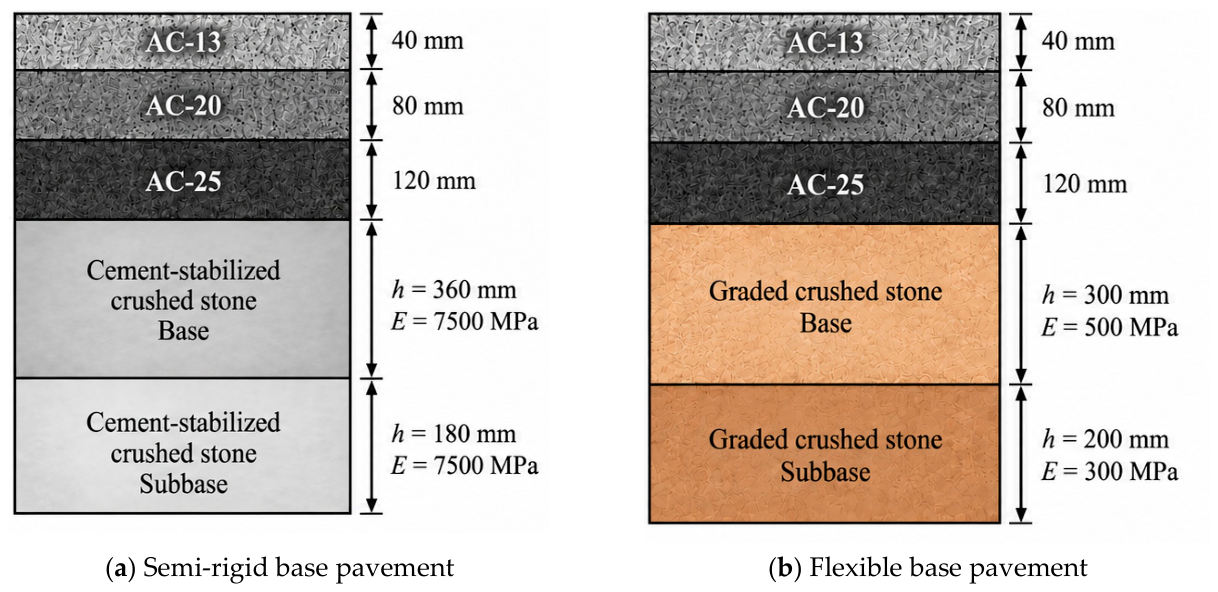
The correction coefficients follow appendix G of JTG D50-2017 [33]. For asphalt-layer fatigue (i = 1), , and . For stabilized-layer fatigue (i = 2), , and . For allowable subgrade strain (i = 3), , and . All logarithms are natural logarithms. Together with the layer inputs and equivalent-layer relationships below, these expressions allow the reported structural temperature adjustments to be reproduced without additional coefficient lookup. The layer configurations, thicknesses, and material moduli of the representative semi-rigid and flexible base pavements were adopted from Wang et al. [7] (Figure 2). Both structures have the same three asphalt mixture layers: AC-13 (40 mm, 11,000 MPa), AC-20 (80 mm, 10,000 MPa), and AC-25 (120 mm, 10,000 MPa). Equivalent layer parameters were calculated using the two-layer combination relationship in appendix G of JTG D50-2017 [33]:
where and are the moduli of the two layers, and are their thicknesses, and Eeq and H are the resulting equivalent modulus and thickness. The asphalt layers were combined from top to bottom: AC-13 and AC-20 were first combined, and the resulting equivalent layer was then combined with AC-25. This gives Ea = 10,229.57 MPa and ha = 240 mm.
Figure 2.
Representative pavement structures.
In the semi-rigid pavement, the cement-stabilized crushed stone base directly beneath the asphalt layers is 360 mm thick, and the underlying cement-stabilized crushed stone subbase is 180 mm thick. Both layers are assigned a modulus of 7500 MPa; their distinction in the adopted structural representation is their position and thickness. In the flexible pavement, the 300 mm graded crushed stone base directly beneath the asphalt layers has an assigned modulus of 500 MPa. The underlying 200 mm graded crushed stone subbase has an assigned modulus of 300 MPa. The two graded crushed stone layers therefore differ in position, thickness, and assigned modulus. For the structural temperature adjustment calculations, the base and subbase are represented by a combined equivalent layer. The resulting equivalent thickness and modulus are hb = 540 mm and Eb = 7500 MPa for the semi-rigid pavement, and hb = 500 mm and Eb = 384.34 MPa for the flexible pavement. These parameters describe the combined base–subbase system, whereas the thicknesses and moduli indicated in Figure 2 refer to the individual base and subbase layers. The equivalent structural parameters are summarized in Table 1. The two configurations serve as reference designs for the climate comparison. For the main scenario comparisons, layer thicknesses and design moduli within each configuration were held constant across climate cases so that historical-to-future changes quantify its temperature-related response. The equivalent-layer and temperature-adjustment relationships can also be applied to other candidate configurations using their layer thicknesses and design moduli.
Table 1.
Equivalent layer parameters for pavement structures.
According to Equation (9), the equivalent modulus and thickness ratios affect both the multiplicative term and the exponent, resulting in different changes in between the two structures under the same climate change. For the calculation of permanent deformation in the asphalt mixture layers, a thickness correction based on the baseline equivalent design temperature is applied:
where is the equivalent temperature used in the calculation of permanent deformation.
For each model, changes in the climate indicators and pavement temperature design parameters were calculated relative to the WorldClim 1970–2000 baseline for the same grid cell. The change at each grid cell is defined as:
where represents the change in the grid cell g for the model r, scenario s, and period p, represents the grid value for the corresponding future scenario and period, and represents the value of the same grid cell during the historical reference period.
Because grid cell area varies with latitude, national statistics were calculated using cosine-latitude weights. The relative area weight of grid cell g is defined as:
where is the relative area weight of grid cell g, and is the latitude of its center.
Quality control was applied throughout the computational workflow shown in Figure 1. First, input checks covered 24 historical single-month rasters and 96 future 12-band rasters. File completeness, coordinate reference systems, grid alignment, monthly band completeness and ordering, and raster scale and offset metadata were checked. A computational land mask was then created from the geoBoundaries China ADM0 boundary using grid-cell centre coordinates. NoData and non-finite values were excluded. The common analysis mask retained 34,412 land grid cells with valid and values for all 12 months in the historical baseline and all 48 future model–scenario–period combinations. This mask was used for all main comparisons to maintain a consistent spatial domain.
Screening identified 179 monthly cell records with Tmax < Tmin, all from IPSL-CM6A-LR for 2081–2100: 26 under SSP2-4.5 and 153 under SSP5-8.5. These records involved 103 distinct grid cells across the two scenarios, with a maximum inversion magnitude of 3.0 °C. The records were flagged and retained without swapping, clipping, or imputation. The annual mean temperature and annual range were calculated from monthly midpoint temperatures, which are invariant to exchanging Tmin and Tmax. For each affected model–scenario–period combination, a sensitivity check excluded any grid cell with at least one inverted month and recalculated the area-weighted national changes over the remaining cells. Historical and future values were paired on this reduced mask, and the area weights were renormalized. The maximum absolute differences from the main calculations were 0.0155 °C for annual mean temperature, 0.0161 °C for baseline equivalent design temperature, and less than 4.70 × 10⁻⁴ for the asphalt-fatigue and subgrade-strain temperature-factor increments. None of the nine sampled city cells contained an inversion.
For the national results, area-weighted means across valid grid cells were calculated separately for each climate model, followed by the median, interquartile range, minimum, and maximum across the eight models. For the spatial analysis, the ensemble median and interquartile range were calculated across models at each valid grid cell. The IQR was defined as the difference between the 75th and 25th percentiles. These statistics describe intermodel dispersion for each specified scenario and period under the common WorldClim processing framework.
A one-at-a-time sensitivity analysis was conducted to assess how changes in structural parameters affect the temperature adjustment factor increments. Each of the four equivalent parameters, Ea, Eb, ha, and hb, was increased and decreased by 10% around its reference value while the other three parameters were held constant. Perturbations of ±20% were also examined to assess dependence on the perturbation magnitude. These changes correspond to uniformly scaling the moduli or thicknesses of the constituent layers within the relevant layer group. For each perturbed design, historical and future temperature adjustment factors were recalculated using the same climate fields as in the main analysis. The response Yi was defined as the national area-weighted mean increment , with i = 1, 3. The normalized sensitivity coefficient was calculated using a central-difference expression:
where is the reference value of the perturbed parameter and is 0.10 for the main analysis and 0.20 for the additional check.
3. Climate Change and Pavement Design Responses
3.1. Changes in National Climate Parameters
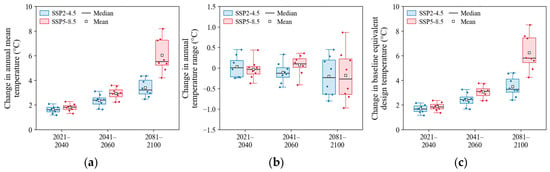
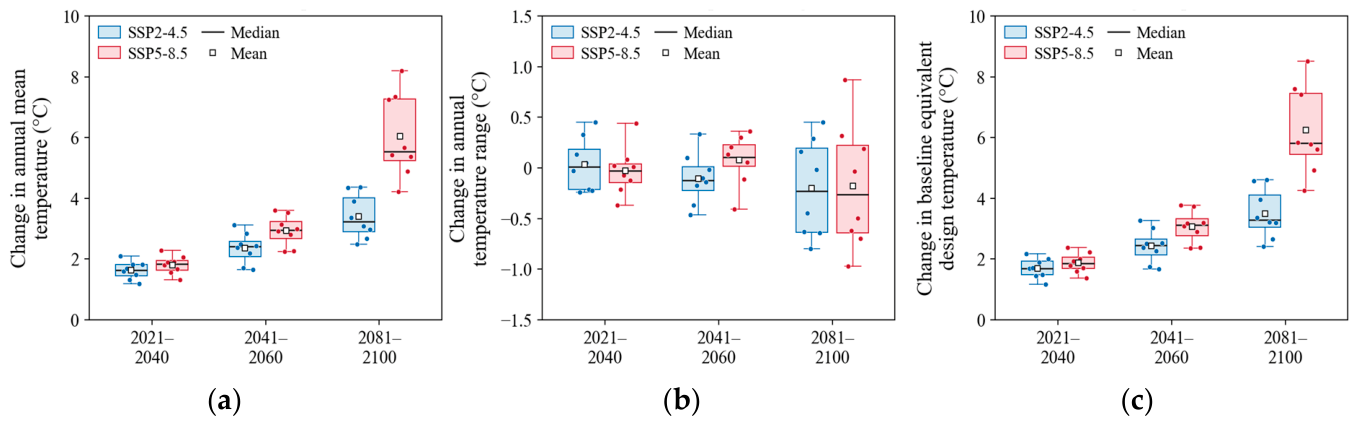
China’s annual mean temperature is projected to rise, with larger differences in warming between the two scenarios in later periods. Figure 3 reports ensemble medians of national area-weighted annual mean temperature increases relative to 1970–2000. For 2021–2040, warming was 1.64 °C under SSP2-4.5 and 1.85 °C under SSP5-8.5. The corresponding values were 2.41 °C and 2.95 °C for 2041–2060, and 3.22 °C and 5.55 °C for 2081–2100. The difference between the ensemble medians for the two scenarios widened from 0.21 °C in the near term to 2.32 °C in the late century. The range of model results for the SSP5-8.5 late-century scenario was 4.23–8.20 °C, indicating substantial intermodel variability in the magnitude of long-term warming. The annual range of monthly mean temperatures did not show a consistent trend of increase. For 2081–2100, median changes were −0.23 °C under SSP2-4.5 and −0.26 °C under SSP5-8.5. Their 25th–75th percentile intervals were [−0.63, 0.20] °C and [−0.64, 0.22] °C, respectively. Both intervals spanned zero, indicating disagreement among models on the direction of change. During the same period, the median increments in the baseline equivalent design temperature were 3.28 °C and 5.81 °C, respectively. Together with Equation (6), these results indicate that the increase in baseline equivalent design temperature is driven mainly by rising annual mean temperature, with a smaller contribution from changes in the annual range of monthly mean temperatures.
Figure 3.
National changes in temperature indicators. (a) Annual mean temperature. (b) Annual range of monthly means. (c) Baseline equivalent design temperature.
3.2. Differences in the Responses of Structure-Related Design Factors
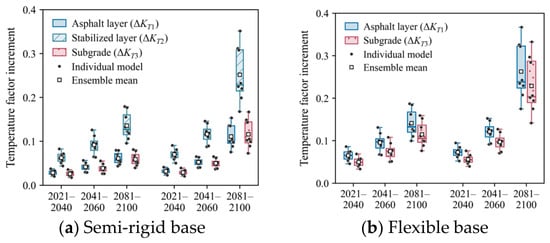
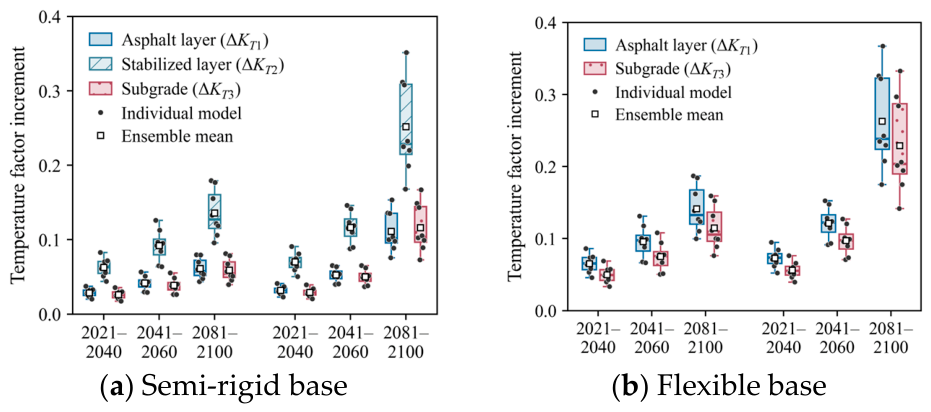
Figure 4 shows that temperature adjustment factor increments generally increased over time for both structures. Flexible base pavements had larger asphalt-layer and subgrade increments than semi-rigid base pavements. Under SSP5-8.5 in 2081–2100, median values were 0.239 and 0.102 for flexible and semi-rigid base pavements, respectively. The flexible-to-semi-rigid ratio of these medians was 2.35. The corresponding ΔKT3 medians were 0.204 and 0.104 for the two structures, respectively. For semi-rigid base pavements, the median was 0.229, exceeding the and medians. The 25th–75th percentile ranges of were 0.224–0.323 for flexible base pavements and 0.096–0.135 for semi-rigid base pavements. The corresponding IQRs were 0.099 and 0.040, indicating greater intermodel variability for the flexible structure.
Figure 4.
Changes in temperature adjustment factors.
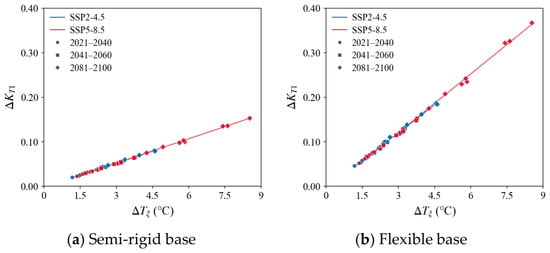
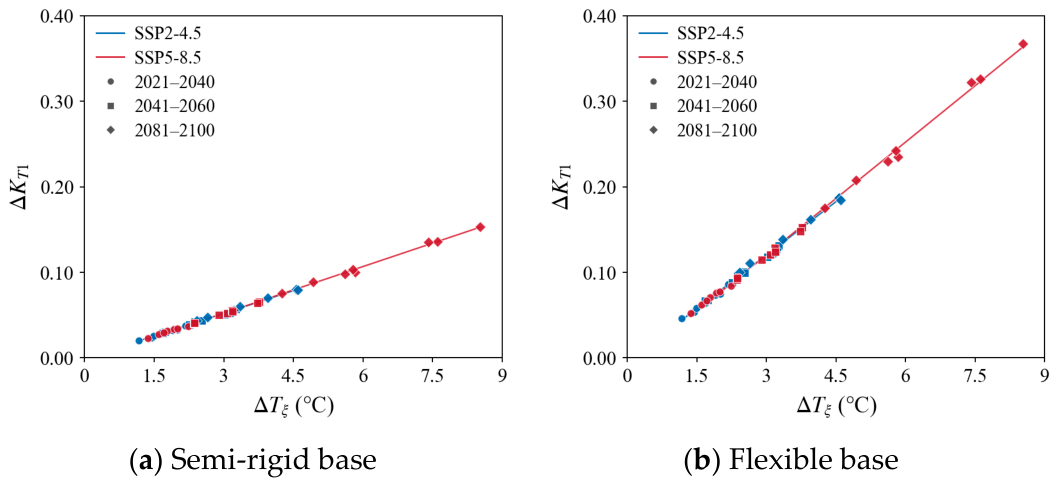
Increases in the baseline equivalent design temperature and the asphalt layer temperature adjustment factor exhibit consistent trends. Figure 5 shows a positive relationship between and , with larger values for flexible base pavements than for semi-rigid base pavements. For 2081–2100, the ensemble medians of under SSP2-4.5 and SSP5-8.5 were 3.28 °C and 5.81 °C, respectively. The corresponding values were 0.058 and 0.102 for semi-rigid base pavements and 0.133 and 0.239 for flexible base pavements.
Figure 5.
Relationship between and .
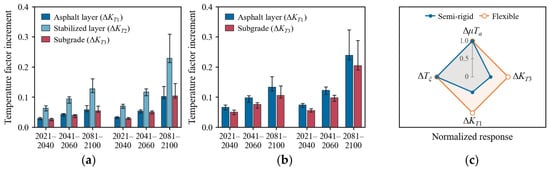
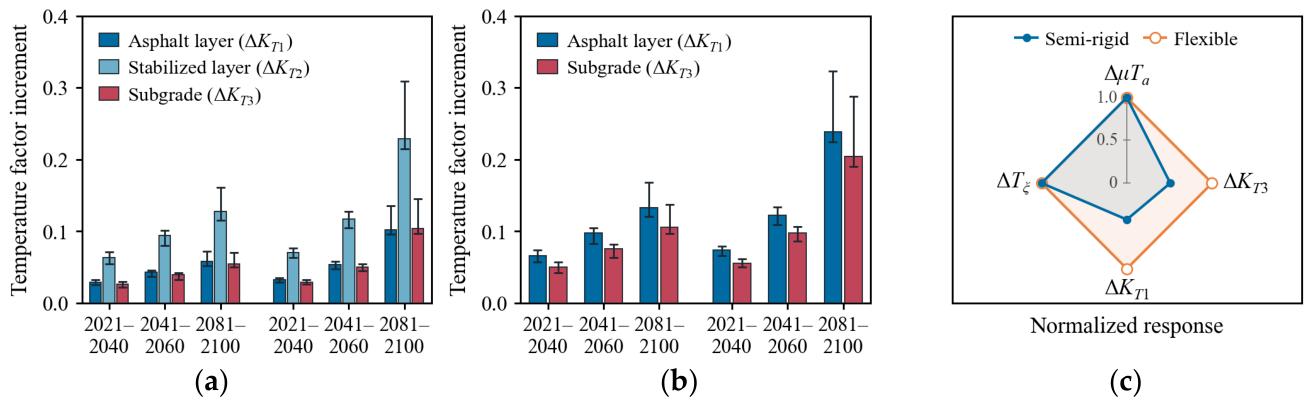
There are differences in the increments of the temperature adjustment factors across different layers (Figure 6). For semi-rigid base pavements, the ensemble median exceeded those of and in every scenario and assessment period. For 2081–2100, the -to- median ratio was 2.21 under SSP2-4.5 and 2.25 under SSP5-8.5. Figure 6c shows a normalized comparison of the structures under SSP5-8.5 for the period 2081–2100. Each indicator was normalized by the larger of the two ensemble medians for the pavement structures. Both pavement types used the same climate inputs and therefore had identical increments in annual mean temperature and baseline equivalent design temperature, with normalized values of 1. The normalized values of and were 0.426 and 0.510 for semi-rigid base pavements, respectively, compared with 1 for both indicators in flexible base pavements. Thus, the same climate inputs produced different temperature adjustment factor increments after structural correction.
Figure 6.
Temperature factor changes and normalized responses. (a) Semi-rigid base pavement. (b) Flexible base pavement. (c) Normalized response.
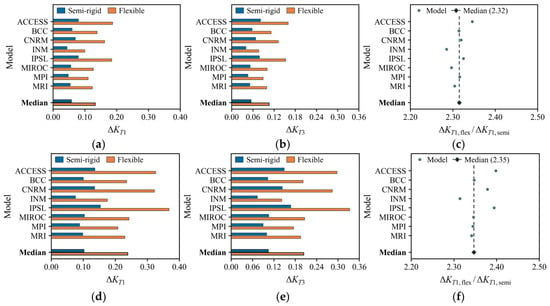
Figure 7 further compares the structural differences across models for the late century. From 2081 to 2100, and for flexible structures in all eight models under both scenarios were higher than those of the semi-rigid structures. For 2081–2100, model-specific flexible-to-semi-rigid ΔKT1 ratios ranged from 2.29 to 2.35 under SSP2-4.5 and from 2.31 to 2.40 under SSP5-8.5. The corresponding medians of these model-specific ratios were 2.32 and 2.35, respectively. The ΔKT3 ratios ranged from 1.92 to 1.96 and from 1.94 to 2.00, respectively. The flexible to semi-rigid increment ratios remained within narrow ranges across models, and flexible base pavements had larger factor increments under both scenarios in all eight models.
Figure 7.
Multimodel comparison of late-century temperature factor changes. (a) SSP2-4.5: asphalt layer; (b) SSP2-4.5: subgrade; (c) SSP2-4.5: flexible/semi-rigid ratio; (d) SSP5-8.5: asphalt layer; (e) SSP5-8.5: subgrade; (f) SSP5-8.5: flexible/semi-rigid ratio.
These structural contrasts arise from the modulus- and thickness-ratio corrections applied to the common climate inputs. For the asphalt-layer temperature factor, the adopted flexible structure has larger equivalent modulus and thickness ratios, which produce a larger exponent in the structural correction relationship. For each fixed configuration, the multiplicative term cancels in the future-to-historical ratio of the temperature adjustment factor, leaving the corresponding climate-factor ratio raised to this structure-dependent exponent. The larger exponent for the flexible structure therefore produces a greater proportional increase in KT1 under the same climate inputs and, through the fatigue relationship, a larger reduction in allowable load repetitions. Absolute factor increments additionally depend on the multiplicative term and the historical climate-factor level.
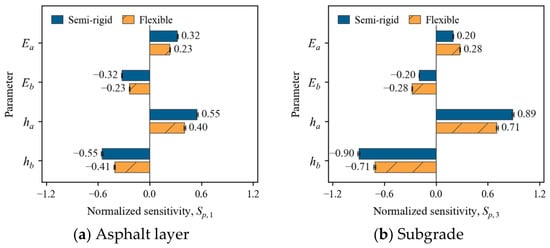
The local sensitivity analysis (Figure 8) showed that, for equal percentage perturbations, thickness parameters had greater absolute normalized sensitivities than modulus parameters for both and . In Figure 8, bars show the median of the six scenario–period ensemble medians obtained with ±10% perturbations, and whiskers span the minimum–maximum range of these six values. Each scenario–period median is calculated across the eight climate models. Across the six scenario–period combinations, the absolute eight-model median sensitivities of for Ea and Eb ranged from 0.32 to 0.33 in the semi-rigid structure and from 0.23 to 0.24 in the flexible structure. The corresponding ranges for ha and hb were 0.54–0.56 and 0.40–0.42, respectively. For , the absolute median sensitivities for the thickness parameters were 0.88–0.91 in the semi-rigid structure and 0.70–0.73 in the flexible structure, compared with 0.19–0.20 and 0.27–0.28 for the modulus parameters. Increasing Ea or ha increased the national temperature-factor increments, whereas increasing Eb or hb decreased them. Across all 48 climate combinations and the tested ±10% single-parameter perturbations, the national mean increment in differed from the corresponding unperturbed-design result by −5.91% to +6.12% for the semi-rigid structure and by −4.41% to +4.57% for the flexible structure. The corresponding ranges for the increment in were −9.27% to +10.09% and −7.41% to +8.12%, respectively. The structural ordering persisted under both ±10% and ±20% perturbations. At ±20%, within every climate combination, the smallest flexible-pavement increment among the tested one-at-a-time configurations exceeded the largest semi-rigid-pavement increment. The minimum ratios across the 48 climate combinations were 1.84 for and 1.35 for . Thus, the larger warming-driven temperature-factor increments of the flexible structure persisted under the tested variations in modulus and thickness.
Figure 8.
Structural parameter sensitivity.
3.3. Spatial Patterns and Model Differences in Climate and Pavement Design Responses
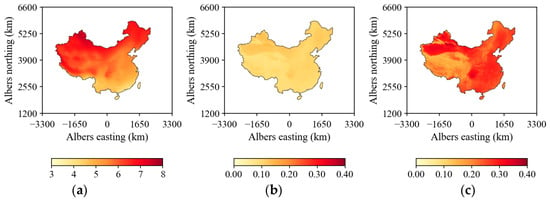
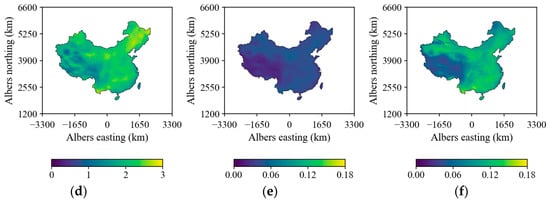
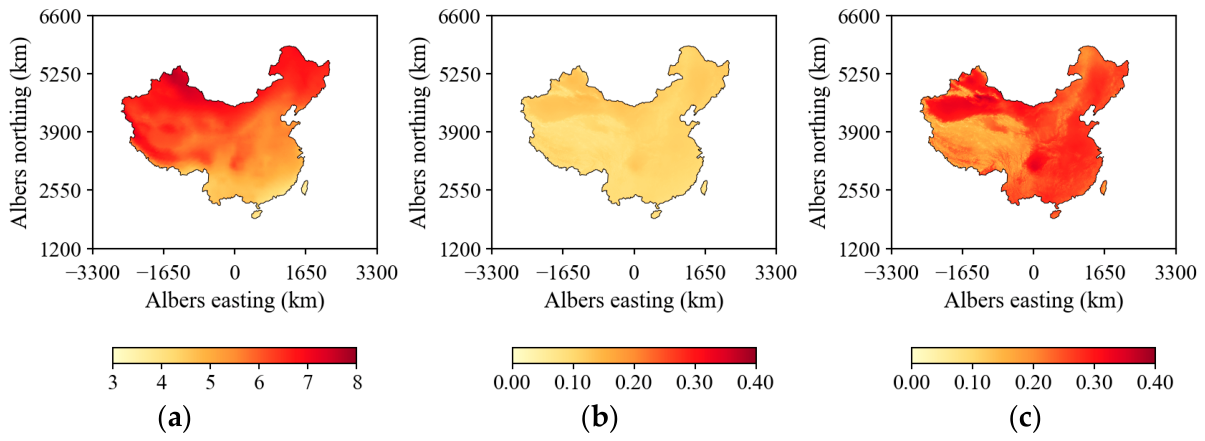
Climate change and the corresponding responses in pavement design exhibit spatial variations. Figure 9 shows that under SSP5-8.5, the gridwise ensemble medians of for 2081–2100 range from 3.32 to 7.67 °C across the study area, with a difference of 4.35 °C between the spatial maximum and minimum. Increases were larger in northern and parts of northwestern China, while they were relatively smaller in southern China and parts of the southeast. The gridwise ensemble medians of ranged from 0.051 to 0.141 for semi-rigid base pavements and from 0.083 to 0.383 for flexible base pavements. The corresponding differences between the spatial maxima and minima were 0.091 and 0.300. Flexible base pavements had larger increments than semi-rigid base pavements at every grid cell. The regions with the largest and do not fully coincide because temperature adjustment factor increments depend on local warming, historical climate, and structural parameters.
Figure 9.
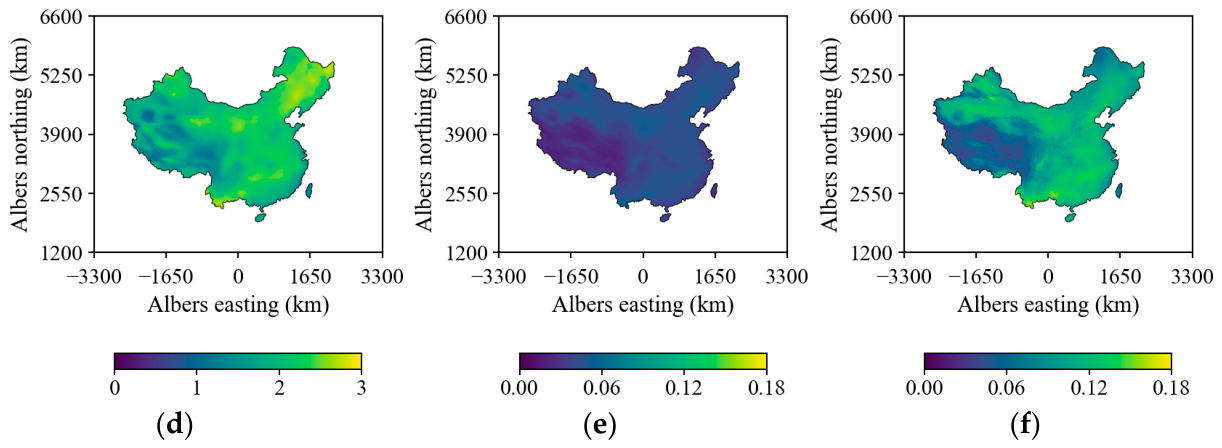
Spatial patterns and model spread of temperature parameter changes. (a) Median ΔTξ. (b) Semi-rigid base: median ΔKT1. (c) Flexible base: median ΔKT1. (d) IQR of ΔTξ. (e) Semi-rigid base: IQR of ΔKT1. (f) Flexible base: IQR of ΔKT1.
The inter-model variability also exhibits spatial differences. The interquartile range (IQR) of , calculated across models at each grid cell, ranges from 0.93 to 2.76 °C across the study area, while the corresponding IQRs of ΔKT1 range from 0.016 to 0.057 for semi-rigid base pavements and from 0.029 to 0.165 for flexible base pavements.
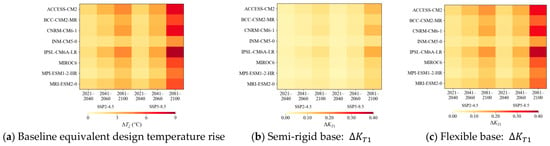
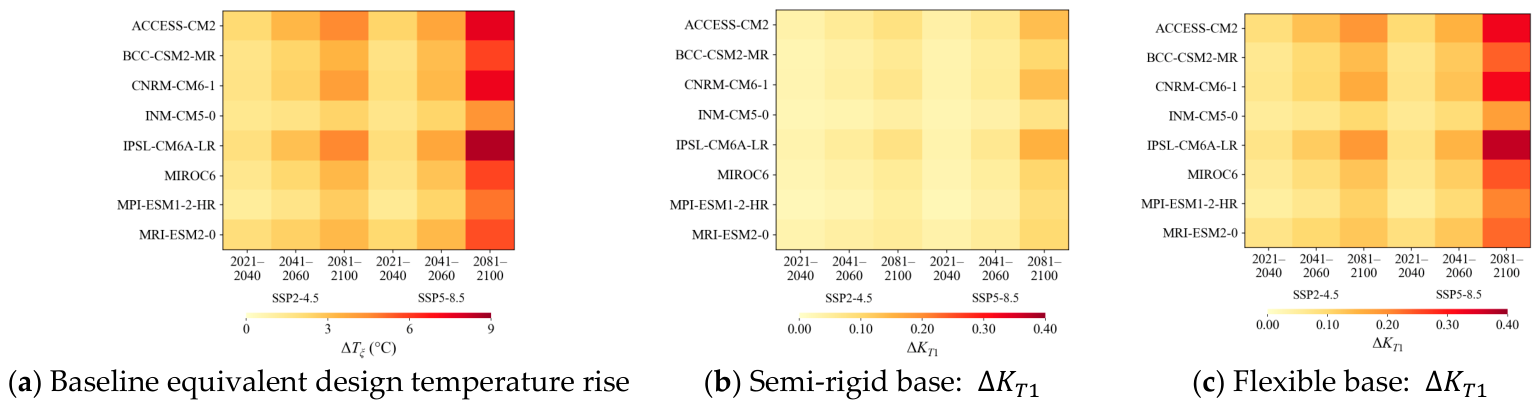
At each grid cell, the intermodel IQR of ΔKT1 is larger for flexible base pavements than for semi-rigid base pavements, consistent with their larger increments. Therefore, regional responses can be characterized by combining the ensemble median with the IQR, where the former reflects the typical level of increments and the latter reflects the degree of dispersion among models. Figure 10 further compares the nationwide area-weighted average increments of the eight models under different scenarios and time periods. All models yield positive ΔTξ and ΔKT1 for both structural types, and all three increments reach their respective peak levels during 2081–2100 under the SSP5-8.5 scenario. Under this scenario and time period, the model range for ΔTξ was 4.26–8.52 °C, while ΔKT1 for semi-rigid and flexible structures ranged from 0.076 to 0.153 and from 0.175 to 0.367, respectively. All three indicators were highest in the IPSL-CM6A-LR model and lowest in the INM-CM5-0 model, with the maximum values being 2.00, 2.03, and 2.10 times the minimum values, respectively. The above results indicate that different models agree on the direction of change, with differences primarily reflected in the magnitude of the increments. As shown in Figure 7, differences among climate models affect the magnitude of the temperature adjustment factor increments, while the ranking of increments for the two types of structures remains consistent across all models.
Figure 10.
National temperature parameter changes across climate models.
4. Regional Responses of Pavement Temperature Design Parameters Under Climate Change
Nine cities, including Harbin, Beijing, and Xi’an, were selected. Results were extracted from the valid grid cell nearest to the representative coordinates of each city. Using 1970–2000 as the historical baseline, the city-level comparisons of temperature design parameters in this section emphasize 2041–2060 and 2081–2100 under SSP2-4.5 and SSP5-8.5. Results for the period 2021–2040 were also included for Beijing to illustrate the change processes across the three time periods. The structural composition and materials of the two pavement types are shown in Figure 2 and Table 1. For each climate model, the absolute change in design parameters relative to the historical baseline was calculated as follows:
For the temperature adjustment factors and , the relative increase from the historical baseline is defined as:
where is the value of parameter P for city c, model r, scenario s, and period p, and is its historical baseline value. is the absolute change, and is the relative increase expressed as a percentage.
4.1. Climate Change in Typical Cities and Corresponding Design Parameters
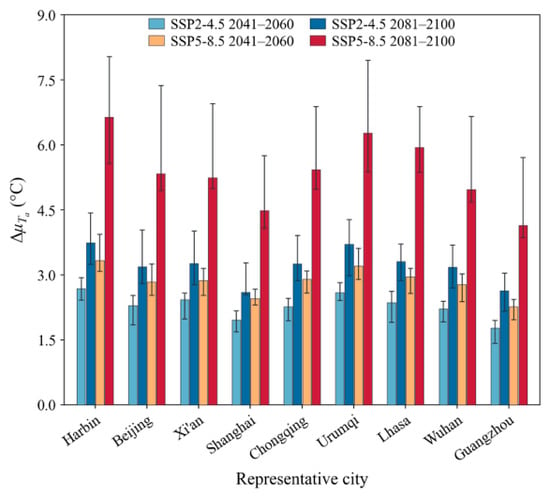
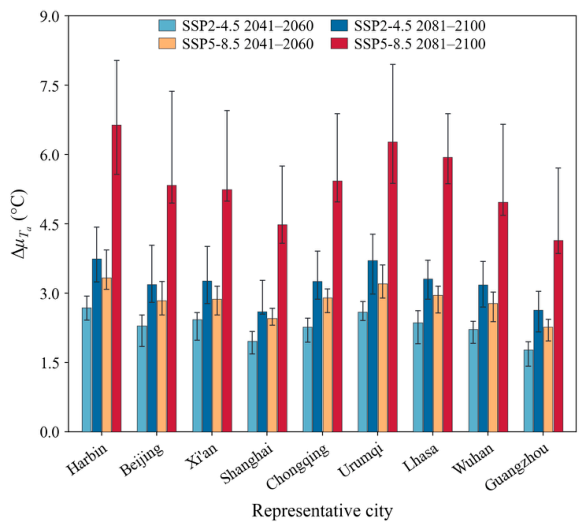
The annual mean temperature increase in typical cities varies by scenario and region (Figure 11). For each city, median warming was first calculated across the eight climate models. The median of the nine city-specific medians was then calculated. The resulting values under SSP2-4.5 and SSP5-8.5 were 2.29 and 2.87 °C for 2041–2060 and 3.26 and 5.34 °C for 2081–2100, respectively. Under the SSP5-8.5 scenario, the temperature increases for Harbin and Guangzhou in 2081–2100 were 6.64 and 4.14 °C, respectively, reflecting regional differences in the magnitude of warming.
Figure 11.
Annual mean warming across cities.
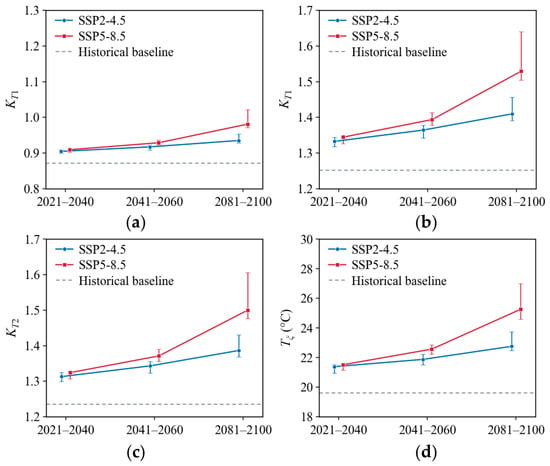
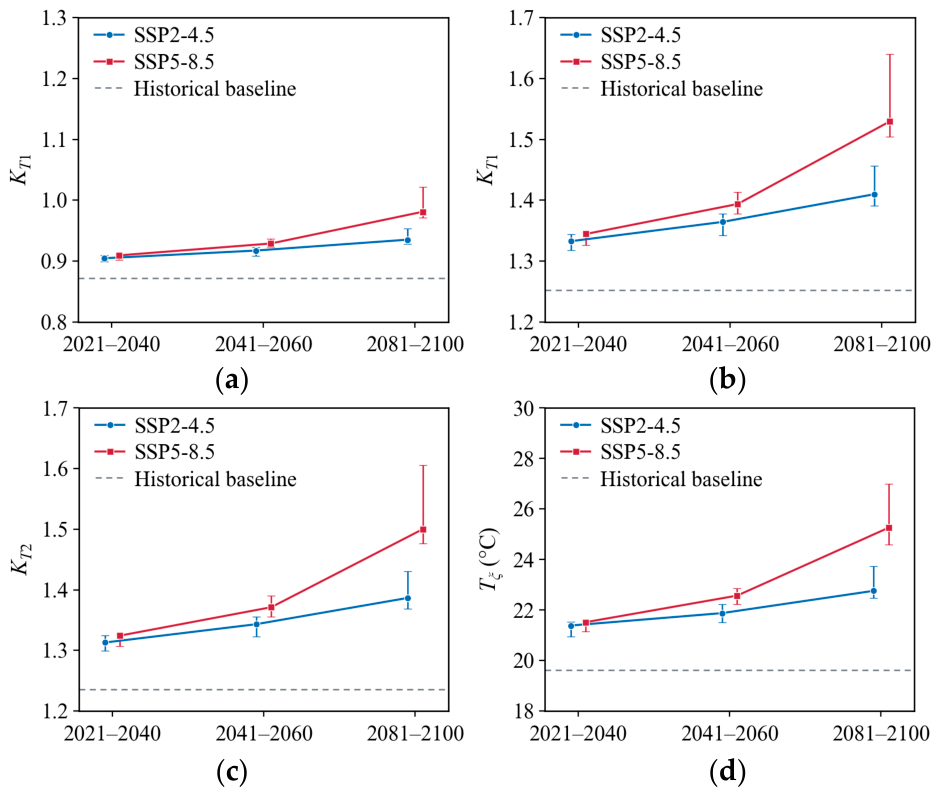
For both pavement types in Beijing, the asphalt layer temperature adjustment factors increased over time, and the gap between SSP5-8.5 and SSP2-4.5 gradually widened (Figure 12a,b). For 2081–2100, the projected ensemble medians of under SSP2-4.5 and SSP5-8.5 were 0.935 and 0.981 for semi-rigid base pavements, compared with a historical baseline of 0.872. The corresponding values for flexible base pavements were 1.410 and 1.529, compared with a baseline of 1.252. For 2081–2100, the ratio of the ensemble median for flexible base pavements to that for semi-rigid base pavements was 2.50 under SSP2-4.5 and 2.54 under SSP5-8.5. The corresponding relative increases were 12.62% and 22.15% for flexible base pavements, compared with 7.25% and 12.50% for semi-rigid base pavements. This indicates that, under the same climate inputs, the absolute and relative increases in the asphalt layer temperature adjustment factor for flexible-base pavements are greater; differences in base structure alter the extent to which climate change is transmitted to design parameters.
Figure 12.
Pavement temperature parameters in Beijing. (a) Semi-rigid base: . (b) Flexible base:. (c) Stabilized layer: . (d) Baseline equivalent design temperature: Tξ.
Within semi-rigid base pavements, the temperature adjustment factors at different layer levels also exhibit varying degrees of change (Figure 12c). For 2081–2100, the increases in for the stabilized layer under SSP2-4.5 and SSP5-8.5 were 0.151 and 0.264, respectively. The corresponding relative increases were 12.19% and 21.38%, both higher than those in for the asphalt layer of the same pavement structure. Changes in the baseline equivalent design temperature further reflect the rise in Beijing’s design temperature level (Figure 12d). Tξ increased from 19.63 °C in the historical baseline to 22.76 and 25.26 °C in the SSP2-4.5 and SSP5-8.5 scenarios for the period 2081–2100, with the difference between the two scenarios widening from 0.13 °C in 2021–2040 to 2.50 °C in 2081–2100, consistent with the widening scenario differences in temperature adjustment factors. In Figure 12, the intermodel interquartile ranges for all indicators widened over time. Specifically, the intermodel interquartile ranges for Tξ under the two late-century scenarios were 1.27 and 2.39 °C, respectively, indicating greater intermodel variability in late-century design temperature projections under SSP5-8.5 than under SSP2-4.5.
4.2. Regional Variations in Temperature Design Parameters
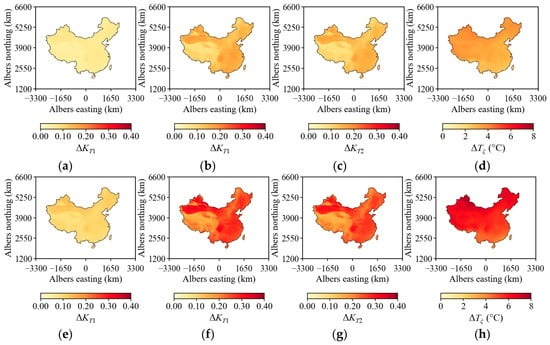
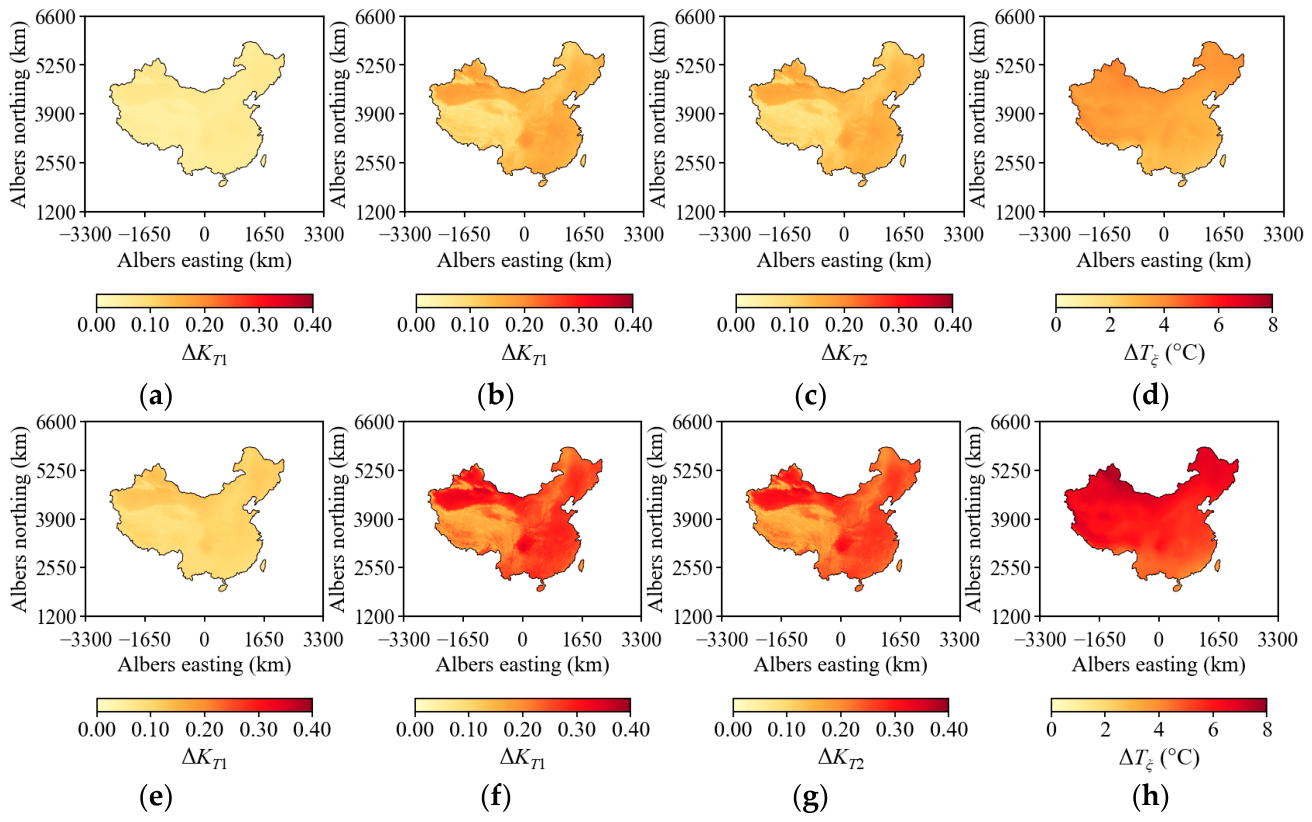
Figure 13a–h correspond to the SSP2-4.5 and SSP5-8.5 scenarios, respectively, showing changes from the historical baseline for the period 2081–2100. For the semi-rigid base pavement, the spatial range of the gridwise ensemble medians of the asphalt-layer temperature-factor increment was 0.027–0.079 under SSP2-4.5 and 0.051–0.141 under SSP5-8.5. The corresponding ranges for the flexible base pavement were 0.044–0.209 and 0.083–0.383, respectively. The spatial maximum for the semi-rigid base pavement was approximately 79% higher under SSP5-8.5 than under SSP2-4.5. In both scenarios, the values for flexible-base pavements were higher than those for semi-rigid-base pavements across all valid grid cells, indicating that the differences in response between the two pavement types remained consistent in their spatial distribution. The spatial range of the stabilized layer for semi-rigid-base pavements increased from 0.043–0.198 to 0.082–0.363, with its spatial maximum increasing by approximately 83%. The baseline equivalent design temperature increments also exhibited regional variations. Under the SSP2-4.5 and SSP5-8.5 scenarios, the spatial ranges of the gridwise ensemble medians of across the grid set were 1.90–4.35 °C and 3.32–7.67 °C, respectively, and the difference between the spatial maximum and minimum values widened from 2.45 °C to 4.35 °C. High-emission scenarios not only increased the design temperature increments across all regions but also widened their spatial variations.
Figure 13.
Spatial patterns of pavement temperature parameter changes. (a) Semi-rigid base: ΔKT1. (b) Flexible base: ΔKT1. (c) Stabilized layer: ΔKT2. (d) . (e) Semi-rigid base: ΔKT1. (f) Flexible base: ΔKT1. (g) Stabilized layer: ΔKT2. (h) .
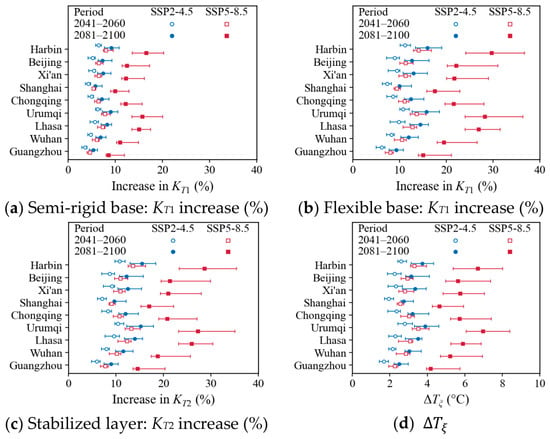
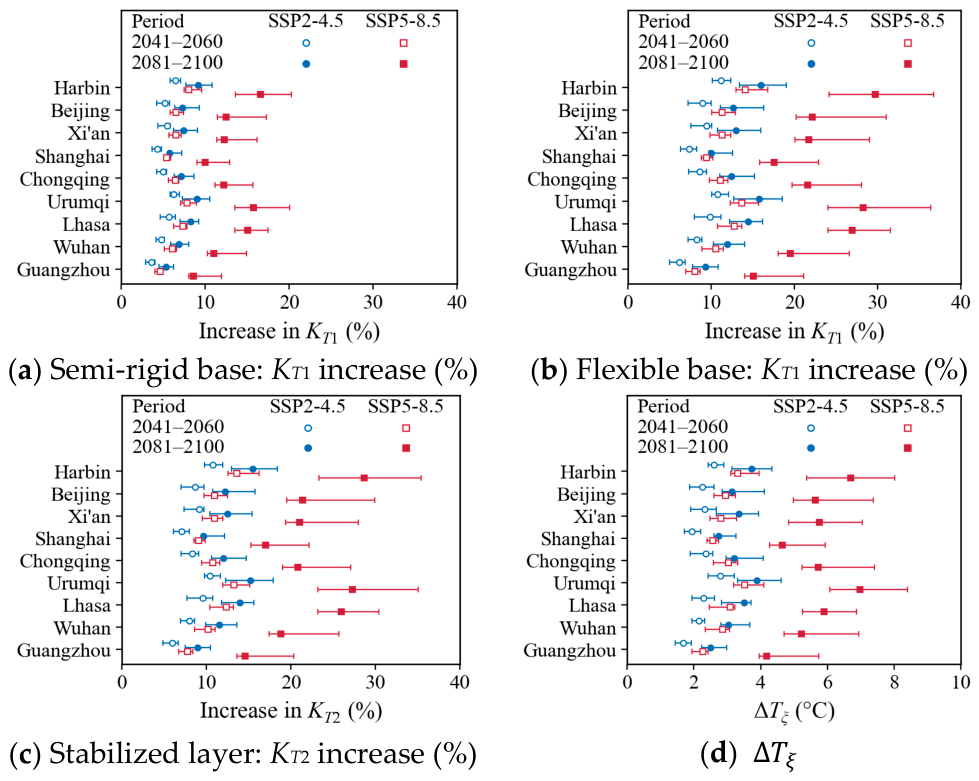
Figure 14a–c show the relative increases, expressed as percentages, in the temperature adjustment factors for the asphalt layers of semi-rigid and flexible base pavements and the stabilized layer of semi-rigid base pavements, respectively. Figure 14d shows the absolute increase in baseline equivalent design temperature in degrees Celsius. All indicators increased from 2041–2060 to 2081–2100, and the gap between the two scenarios was even greater by the end of the century. Under SSP5-8.5 in 2081–2100, the relative increases in the asphalt-layer and stabilized-layer temperature adjustment factors for semi-rigid base pavements were 16.55% and 28.64% in Harbin, respectively. The corresponding values for Guangzhou were 8.61% and 14.54%. For flexible base pavements, the relative increases in the asphalt-layer temperature adjustment factor were 29.71% in Harbin and 15.05% in Guangzhou. Across both periods and scenarios, the ensemble median relative increases in all three temperature adjustment factors were highest in Harbin and lowest in Guangzhou. However, discrepancies exist between the city rankings derived from absolute increments and those derived from relative increases. Under the SSP5-8.5 scenario, for the stabilized layer in Chongqing for 2081–2100 was 0.296, higher than Harbin’s 0.270; however, its relative increase of 20.83% was lower than Harbin’s, reflecting the influence of historical baseline values on relative increases. In terms of baseline equivalent design temperature, Urumqi and Harbin had values of 6.97 and 6.69 °C, respectively, while Lhasa and Guangzhou had values of 5.90 and 4.19 °C, respectively (Figure 14d). Urumqi has a larger than Harbin, whereas Harbin has larger relative increases in all three temperature adjustment factors. These differences reflect the combined effects of warming, historical baselines, and structural correction relationships.
Figure 14.
Pavement temperature parameter changes across cities.
5. Regional Variations in Pavement Durability Response
5.1. Design-Based Performance Assessment
Changes in pavement durability were evaluated using temperature-dependent performance relationships from mechanistic–empirical pavement design [33]. The performance relationships were applied with their published coefficients, without local recalibration or external validation against independent pavement observations in this study. The temperature adjustment factors and equivalent temperatures serve as climatic inputs to the corresponding design checks. Comparing their effects across pavement structures helps identify where future climate conditions may alter the assessment of fatigue, subgrade strain, and rutting. Reductions in allowable load repetitions and allowable vertical compressive strain at the subgrade surface were calculated. The relative increase in permanent deformation of the asphalt mixture layer was also calculated. To quantify the contribution of changing climate conditions, materials, layer thicknesses, traffic loads, mechanical responses, and other design inputs were held constant between the historical and future cases for each pavement structure. The temperature adjustment factors and equivalent temperatures were updated for each climate window. This controlled comparison identifies the temperature-related changes in allowable load repetitions, allowable subgrade strain, and permanent deformation for the two pavement structures. Changes were evaluated for the three future periods under both scenarios relative to the 1970–2000 baseline. The percentage reduction in allowable load repetitions is defined as:
where represents the reduction in the allowable number of load repetitions, and represent the allowable number of load repetitions under the future and historical reference conditions, respectively, and and are the corresponding temperature adjustment factors.
The relative increase in permanent deformation of the asphalt mixture layer is expressed as:
where is the relative increase in permanent deformation, and are the permanent deformations of the asphalt mixture layer under future and historical baseline conditions, respectively, and and are the corresponding equivalent temperatures.
The reduction in allowable vertical compressive strain at the top of the subgrade is:
where is the reduction in allowable vertical compressive strain at the subgrade surface, and are the allowable vertical compressive strains under future and historical reference conditions, respectively, and and are the corresponding temperature adjustment factors.
5.2. Pavement Durability Responses to Climate Change
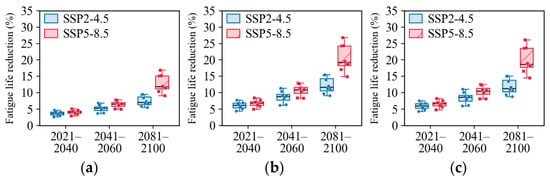
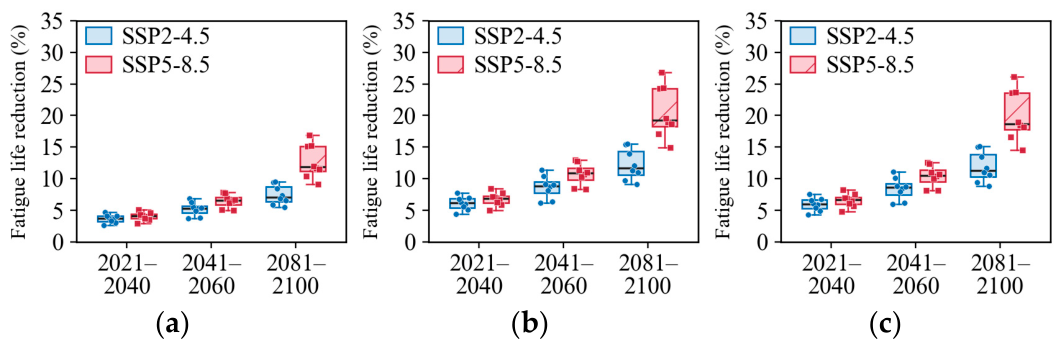
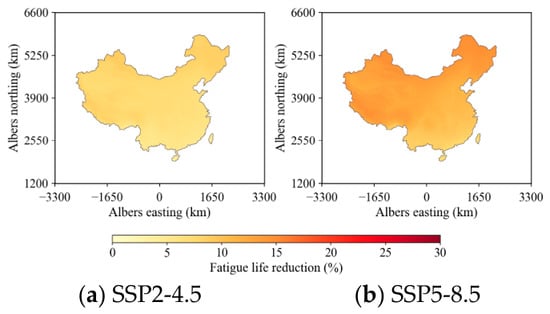
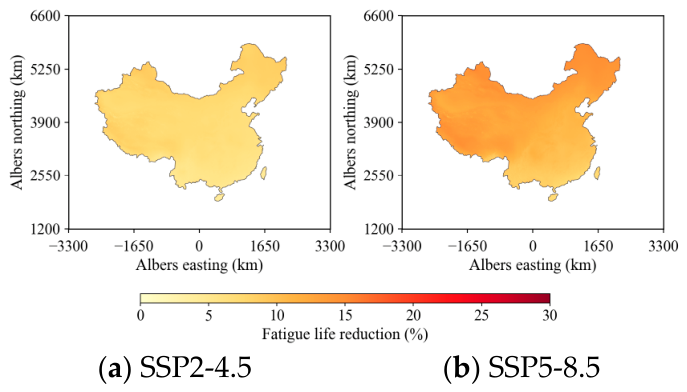
Figure 15 shows differences in fatigue response between the two pavement structures in the near term, followed by larger reductions in later periods. For 2021–2040 under SSP2-4.5, the ensemble medians of national mean reductions in asphalt-layer allowable load repetitions relative to 1970–2000 were 3.67% and 6.16% for semi-rigid and flexible base pavements, respectively. Under SSP5-8.5, the ensemble medians of the national mean reductions for the asphalt layers of semi-rigid and flexible base pavements increased from 4.10% and 6.86% in 2021–2040 to 11.84% and 19.25% in 2081–2100, respectively. The difference between the two pavement types widened from 2.76 to 7.40 percentage points. The corresponding values for the late century under SSP2-4.5 are 7.06% and 11.68%. Using four CMIP5 models and HPDS2017 with JTG D50-2017 temperature inputs, Wang et al. [7] summarized fatigue-life reductions of approximately 5% under RCP4.5 and 10% under RCP8.5 across the nine-city cases for 2055–2064 and 2090–2099 relative to 2020–2029. Both assessments indicate declining fatigue capacity with stronger warming, with the numerical magnitudes evaluated against their respective reference periods and spatial summaries. The present calculations further quantify the national contrast between the two structures while retaining the results of individual climate models. Across all scenarios and periods, reductions in allowable load repetitions were greater for the asphalt layer of flexible base pavements than for that of semi-rigid base pavements. The reduction for the stabilized layer of semi-rigid base pavements lay between these two values and reached 18.70% under SSP5-8.5 in 2081–2100.
Figure 15.
Reduction in allowable fatigue load repetitions. (a) Semi-rigid base: asphalt. (b) Flexible base: asphalt. (c) Stabilized layer.
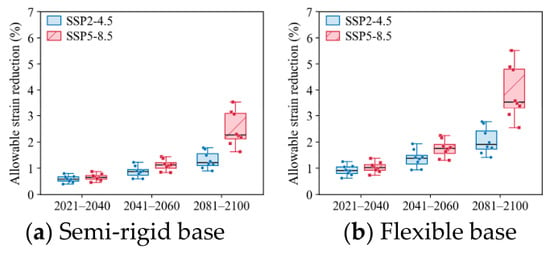
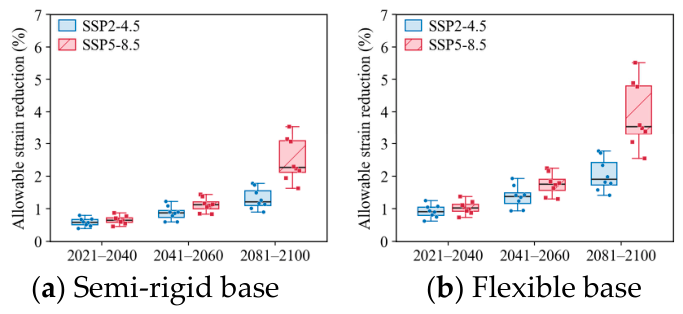
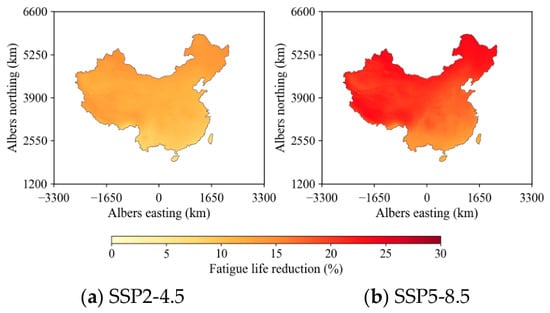
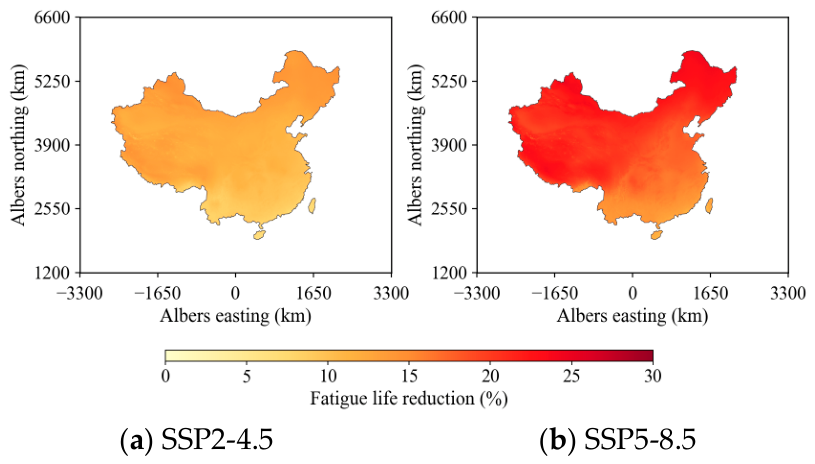
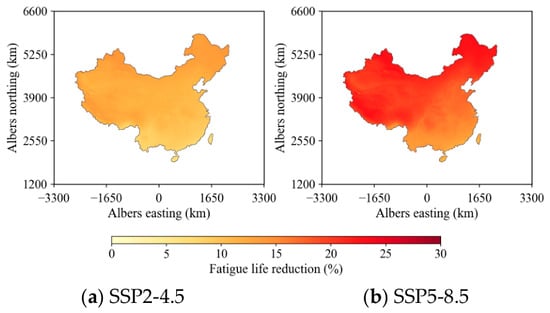
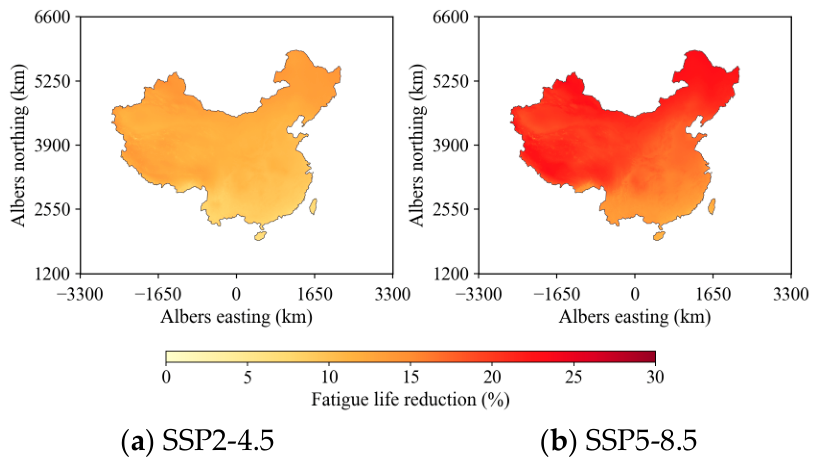
The reduction in allowable vertical compressive strain at the subgrade surface exhibits a similar trend (Figure 16). Under SSP2-4.5, the ensemble medians of national mean reductions in allowable subgrade strain for 2021–2040 were 0.59% and 0.92% for semi-rigid and flexible base pavements, respectively. Under SSP5-8.5, the ensemble medians of the national mean reductions for semi-rigid and flexible base pavements increased from 0.65% and 1.03% in 2021–2040 to 2.27% and 3.54% in 2081–2100, respectively. Under SSP2-4.5, the corresponding values for 2081–2100 were 1.22% and 1.91%. A similar pattern was reported by Miao et al. [4] using JTG D50-2017 relationships. At global warming levels of 1.5 °C and 2.0 °C above 1850–1900, Miao et al. estimated reductions in asphalt-layer allowable load repetitions of 2.52% and 4.51%, compared with reductions in allowable subgrade strain of 0.46% and 0.85%, respectively, relative to the 2019 reference conditions. The present results show the same ordering of proportional changes across both base structures and extend the comparison to explicit future periods and emission pathways. This ordering is consistent with the adopted performance relationships: allowable fatigue load repetitions vary inversely with the corresponding temperature adjustment factor, whereas allowable subgrade strain varies with to the power of −0.21. The weaker exponent moderates the strain-limit response to a given proportional factor increase, alongside the differences in the climate and structural corrections for the two indicators. Figure 17, Figure 18 and Figure 19 show the spatial patterns of late-century reductions in allowable fatigue load repetitions for the asphalt layers of semi-rigid and flexible base pavements and the stabilized layer of semi-rigid base pavements, respectively. Across grid cells, the ensemble median reduction in allowable load repetitions for the asphalt layer of flexible base pavements ranged from 6.12% to 15.18% under SSP2-4.5 and from 10.32% to 24.55% under SSP5-8.5. Under SSP5-8.5, the corresponding ranges were 6.21–15.30% for the asphalt layer of semi-rigid base pavements and 10.01–23.87% for the stabilized layer. At every valid grid cell under both scenarios, the reduction in allowable load repetitions for the asphalt layer of flexible base pavements exceeded that for the asphalt layer of semi-rigid base pavements. Together with the temperature adjustment factor comparisons, this spatial consistency supports H1 for the two representative structures.
Figure 16.
Reduction in allowable subgrade strain.
Figure 17.
Allowable load repetition reductions: semi-rigid base.
Figure 18.
Allowable load repetition reductions: flexible base.
Figure 19.
Allowable load repetition reductions in stabilized layers.
5.3. Regional Responses and Pavement Design
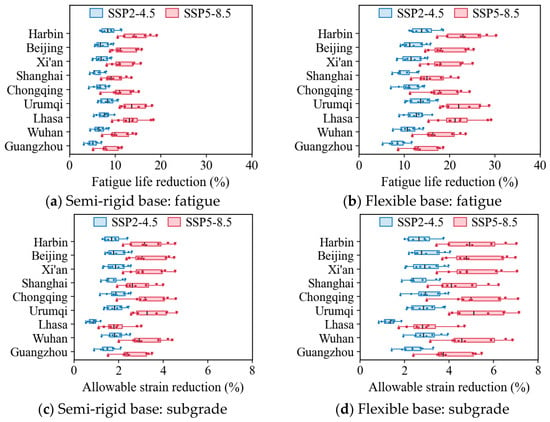
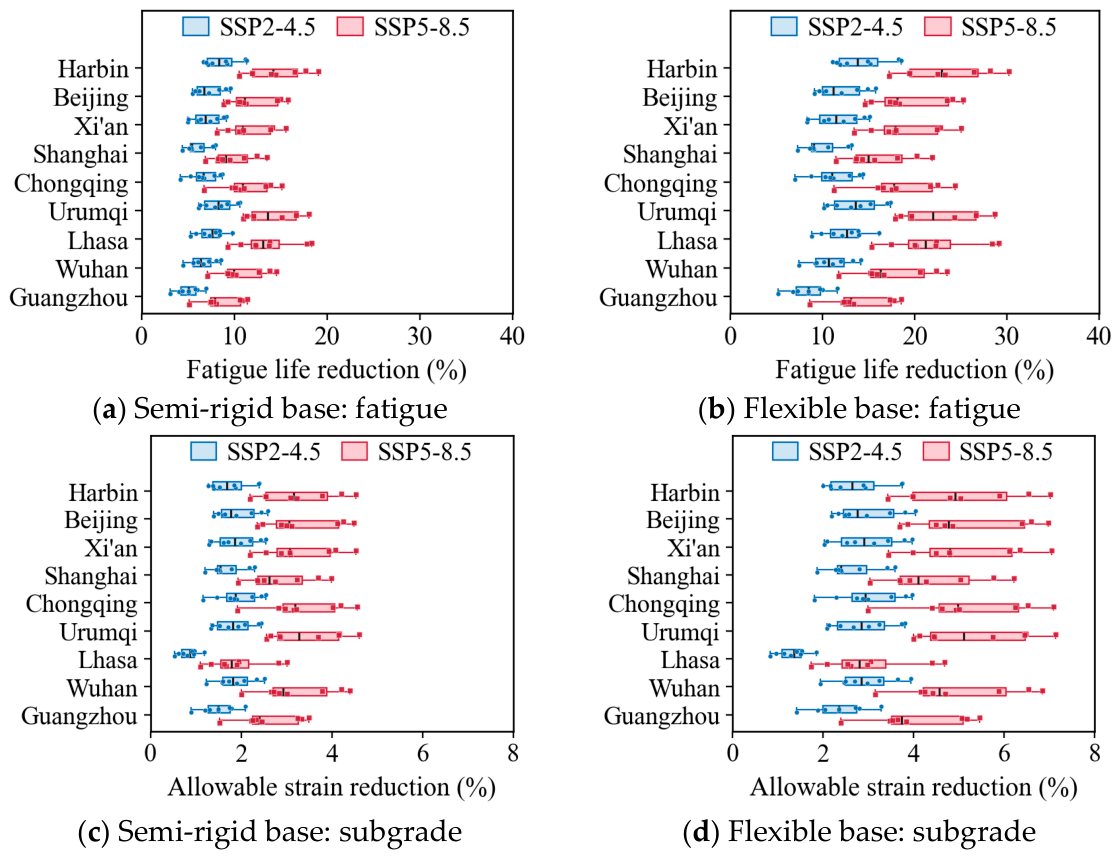
Fatigue responses in typical cities exhibit substantial regional variations (Figure 20). In the late century, the decline in the allowable number of load repetitions for the asphalt layer on flexible-base pavements in Harbin increased from 13.77% under SSP2-4.5 to 22.90% under SSP5-8.5, while in Guangzhou, it rose from 8.48% to 13.08%. In the late century under SSP5-8.5, the reduction in allowable load repetitions for the asphalt layer of semi-rigid base pavements in Harbin was 14.20%, lower than that of the city’s flexible base pavements, reflecting the combined influence of regional climate and structural type. For the asphalt layers of both pavement structures, the reduction in allowable load repetitions was greatest in Harbin and smallest in Guangzhou. The city rankings for the reduction in allowable subgrade strain differed from those for fatigue response. Under SSP5-8.5 in 2081–2100, the reductions in allowable subgrade strain for semi-rigid and flexible base pavements in Urumqi were 3.28% and 5.12%, respectively, the highest values among the nine cities. In Lhasa, the corresponding reductions were 1.79% and 2.80%, the lowest values. However, the reduction in allowable load repetitions for the asphalt layer of flexible base pavements in Lhasa reached 21.19%, showing that city rankings depend on the performance measure considered.
Figure 20.
Fatigue and subgrade responses across cities.
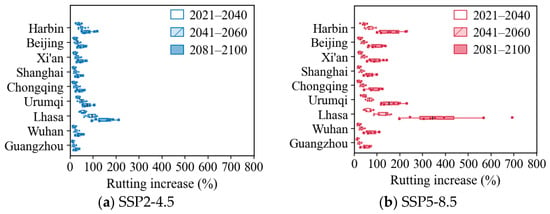
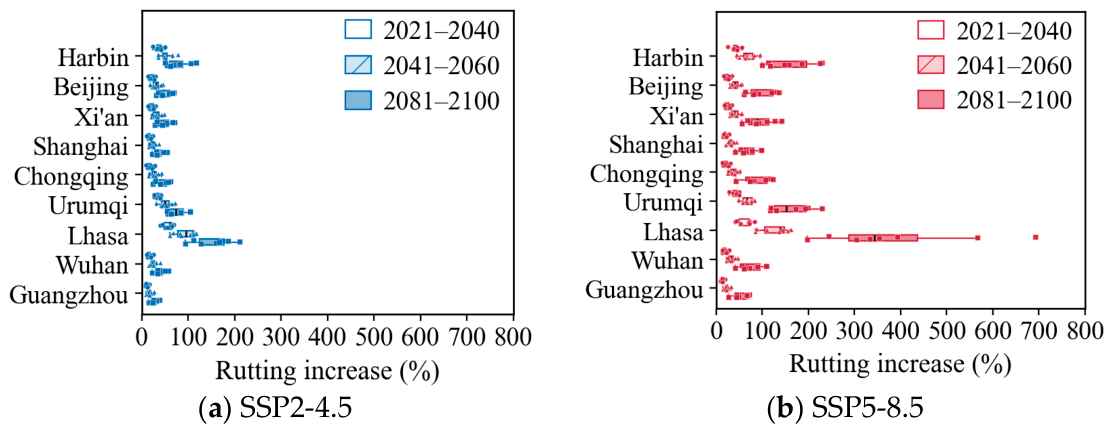
Figure 21 shows that the ensemble median relative increases in permanent deformation were greater in later periods for all nine cities. Under SSP5-8.5 in 2081–2100, the relative increases for Harbin, Urumqi, and Guangzhou were 153.12%, 152.43%, and 45.86%, respectively, while that for Lhasa reached 342.55%. Wang et al. [7] also reported increasing permanent deformation, summarizing typical increases of approximately 10–30% under RCP4.5 and 40–50% under RCP8.5 across the assessed city and period cases, with substantially larger relative increases in Lhasa. Using a different performance model, Gudipudi et al. [34] projected an approximately 8–20% increase in asphalt-layer rutting for an Arizona interstate pavement evaluated with AASHTOWare Pavement ME over a 20-year analysis period, using RCP8.5 climate projections for 2040–2060 relative to historical climate inputs. These findings support the common tendency toward increased permanent deformation under warmer conditions. Within the present city comparison, the contrast between Lhasa and Guangzhou is explained by considering both warming magnitude and historical equivalent temperature. The equivalent temperature Tpef in Lhasa increased from 8.93 °C during the historical reference period to 14.83 °C, whereas in Guangzhou it increased from 30.46 °C to 34.64 °C. Lhasa therefore exhibits a much larger relative response from a lower initial temperature, while Guangzhou retains the higher future equivalent temperature. These results support considering relative deformation changes together with future temperature levels when assessing regional rutting demand. For SSP5-8.5 in 2081–2100, the contrasting city rankings across fatigue, allowable subgrade strain, and permanent deformation responses support H2.
Figure 21.
Rutting increase across cities.
Building on the national temperature-impact assessment of Miao et al. [4] and the nine-city structural comparison of Wang et al. [7], this study links nationwide structural contrasts with performance-dependent city rankings under a common CMIP6 ensemble. The larger flexible-pavement temperature-factor increments persist across the evaluated climate cases and the tested structural perturbations, while the city results identify different response rankings for fatigue, allowable subgrade strain, and permanent deformation. These findings support combining structural comparisons with local checks of individual performance criteria. For the stabilized layer of the semi-rigid pavement, the ensemble median of the national mean reduction in allowable load repetitions reached 18.70% under SSP5-8.5 in 2081–2100 (Figure 15). Under SSP5-8.5 in 2021–2040, the ensemble medians of national mean reductions in asphalt-layer allowable load repetitions relative to 1970–2000 are 4.10% and 6.86% for semi-rigid and flexible base pavements, respectively (Figure 15). This near-term contrast supports considering climate effects when comparing structures for new construction and rehabilitation. Fatigue assessment should include both the asphalt and stabilized layers.
The model comparisons and parameter perturbations provide complementary evidence for interpreting the structural contrast. Although national warming under SSP5-8.5 for 2081–2100 ranged from 4.23 to 8.20 °C across models, the flexible structure retained larger and across the evaluated climate cases and the tested structural perturbations. These results support comparing candidate designs across climate models and plausible variations in their structural inputs. Downscaling and bias-correction choices can also affect local projection spread [18]. Their contributions were not separately quantified here because all climate inputs used the WorldClim processing framework. A paired comparison of alternative processing methods, using matched parent-model realizations, scenarios, reference data and periods, and consistent spatial and temporal aggregation, would enable their effects on pavement temperature design parameters to be assessed.
For projects whose planned service periods fall within 2021–2040, the corresponding local climate projections can be used to update temperature design inputs. For service periods extending into 2041–2060, that window provides an additional climatic case for assessment. These temperature inputs should be combined with project-specific traffic forecasts and structural parameters to evaluate the relevant performance criteria. Updated and values enter the fatigue calculations for the asphalt and stabilized layers, respectively. The resulting allowable load repetitions are compared with the corresponding cumulative equivalent axle-load demand. The allowable strain updated using is checked against the calculated strain at the subgrade surface. Updated Tpef values are combined with traffic and mixture rutting-test parameters to assess asphalt-layer permanent deformation against the applicable design limit. For project applications, compliance with each design criterion should be evaluated separately for the individual climate models and scenarios, alongside the ensemble summary. Where the compliance outcome changes across climate models, that criterion and the candidate configuration warrant closer assessment. For the late-century cases, the city results indicate different priorities for these checks, including fatigue in Harbin and subgrade strain in Urumqi. In Lhasa, the large relative rutting increase should be assessed together with future equivalent temperature and absolute deformation estimates.
For in-service pavements, these checks can support rehabilitation assessments using the existing layer configuration, assessed material properties, and traffic demand over the intended remaining design period. The performance comparisons isolate temperature effects under fixed traffic, material properties, and mechanical responses; coupled changes involving moisture, freeze–thaw damage, material aging, and traffic evolution were not explicitly simulated. Monthly climatologies also leave short-duration thermal extremes unresolved, so detailed project assessments should account for these processes where relevant. Local calibration using observed pavement distress and corresponding traffic, material, structural, and temperature records would strengthen project-specific estimates of fatigue performance and permanent deformation. Future external validation should use road sections or monitoring periods excluded from calibration, with model inputs matched to recorded traffic and temperature histories. Calculated structural strains should be compared with measured strains, and performance predictions assessed using consistent fatigue criteria and measurements of asphalt-layer permanent deformation. If a design criterion is not met, candidate changes in material properties, layer thickness, or base structure can be evaluated using the same climate cases. For each candidate, the equivalent layer parameters, modulus and thickness ratios, and structural temperature adjustment factors should be recalculated from its layer properties. Changes in asphalt thickness also require updating the thickness correction to Tpef. Temperature-related changes should be evaluated relative to that candidate’s own historical-climate baseline. Its mechanical responses and performance measures should then be recalculated using the project-specific traffic demand and checked against the applicable design criteria. This procedure enables consistent comparison of candidate configurations across climate models and scenarios.
6. Conclusions
This study evaluated how climate change affects pavement temperature design parameters and durability responses at the national scale and in nine representative cities. The main conclusions are as follows:
- (1)
- Rising annual mean temperature was the main driver of increases in pavement design temperatures, with larger differences between SSP2-4.5 and SSP5-8.5 in later periods. Relative to 1970–2000, the ensemble medians of national area-weighted warming for 2021–2040 were 1.64 °C under SSP2-4.5 and 1.85 °C under SSP5-8.5. For 2081–2100, the ensemble medians of the national area-weighted mean temperature increases were 3.22 °C and 5.55 °C under SSP2-4.5 and SSP5-8.5, respectively. The corresponding increases in baseline equivalent design temperature were 3.28 °C and 5.81 °C. Changes in the annual range of monthly mean temperatures were relatively small and differed in direction among models.
- (2)
- The two representative base structures exhibit different temperature parameter responses to the same climate input. Under SSP5-8.5 in 2081–2100, the ensemble medians of the national area-weighted mean increases in the asphalt layer temperature adjustment factor were 0.102 for semi-rigid base pavements and 0.239 for flexible base pavements. The increment for flexible structures was 2.35 times that of semi-rigid structures, and this ranking of increments was consistent across all eight models in both scenarios. The flexible structure also retained larger asphalt-layer and subgrade temperature-factor increments in all tested ±10% and ±20% single-parameter perturbations of equivalent modulus and thickness. Within semi-rigid base pavements, the factor increment for the stabilized layer exceeded those for the asphalt layer and subgrade, indicating that both equivalent structural parameters and response type affect the conversion from climate inputs to pavement temperature design parameters.
- (3)
- Temperature-related changes in pavement performance are already evident in the 2021–2040 projections. Relative to 1970–2000, the ensemble medians of national mean reductions in asphalt-layer allowable load repetitions under SSP5-8.5 were 4.10% and 6.86% for semi-rigid and flexible base pavements, respectively; the corresponding reductions in allowable subgrade strain were 0.65% and 1.03%. By 2081–2100, these reductions increased to 11.84% and 19.25% for asphalt-layer allowable load repetitions and to 2.27% and 3.54% for allowable subgrade strain. The reduction in stabilized-layer allowable load repetitions reached 18.70% in the same late-century scenario. These results support updating local temperature inputs for near-term design and rehabilitation, with fatigue checks covering both asphalt and stabilized layers and subgrade checks matched to the planned service period.
- (4)
- Among the nine cities under SSP5-8.5 in 2081–2100, Harbin had the largest projected reduction in allowable load repetitions for asphalt layer fatigue, Urumqi had the largest reduction in allowable vertical compressive strain at the subgrade surface, and Lhasa had the largest relative increase in permanent deformation. The ensemble median relative increases in permanent deformation in Lhasa and Guangzhou were 342.55% and 45.86%, respectively, reflecting the combined influence of warming magnitude and historical equivalent temperature on relative increases. Future pavement design should incorporate projected temperature conditions into fatigue, subgrade strain, and rutting checks for candidate structures. These checks can guide the reassessment of material properties and layer thicknesses, with structural responses recalculated whenever a design alternative is revised.
- (5)
- The performance estimates isolate temperature effects for two reference structures under fixed traffic, material, and mechanical-response inputs. Uncertainty from alternative downscaling and bias-correction methods was not separately quantified. Project-specific application should include calibration and independent validation using local pavement observations.
Author Contributions
Conceptualization, X.X. and F.F.; methodology, X.X.; validation, S.W., X.Y. and Y.M.; formal analysis, F.F. and X.Y.; investigation, E.D. and Y.M.; data curation, S.W. and E.D.; writing—original draft preparation, F.F.; writing—review and editing, X.X.; visualization, Y.M. All authors have read and agreed to the published version of the manuscript.
Funding
This research was funded by the Science and Technology Program of Department of Transportation of Shandong Province, grant number 2024B87. The APC was funded separately.
Institutional Review Board Statement
Not applicable.
Informed Consent Statement
Not applicable.
Data Availability Statement
The historical and future climate inputs are publicly available from WorldClim (https://www.worldclim.org/data/worldclim21.html (accessed on 18 October 2026) and https://www.worldclim.org/data/cmip6/cmip6climate.html (accessed on 18 October 2026)). The China administrative boundary used for the computational mask was obtained from geoBoundaries (https://www.geoboundaries.org/ (accessed on 18 October 2026)).
Conflicts of Interest
Authors Feifei Fan and Shuai Wang are employed by Shandong Hi-Speed Gaoshang Highway Co., Ltd. and Shandong Hi-Speed Construction Management Group Co., Ltd. Ya Ma is employed by Shandong Hi-Speed Construction Management Group Co., Ltd. The remaining authors declare that the research was conducted in the absence of any commercial or financial relationships that could be construed as a potential conflict of interest.
References
- Chang, H.; Wang, X.; Fang, N. Development and application of climate zoning for asphalt pavements in China: A review and perspective. Atmosphere 2025, 16, 953. [Google Scholar] [CrossRef] [Scilit]
- Zhang, K.; Mortenson, D.; Mehl, S. Asphalt pavement temperature modelling: Reduction of input complexity and prediction of asphalt ageing under climate change. Int. J. Pavement Eng. 2025, 26, 2571854. [Google Scholar] [CrossRef] [Scilit]
- Su, T.; Wu, J.; Yang, G.X.; Jing, X.H.; Mueller, A. Shear behavior of recycled coarse aggregate concrete beams after freezing-and-thawing cycles. ACI Struct. J. 2019, 116, 67–76. [Google Scholar] [CrossRef] [Scilit]
- Miao, Y.; Sheng, J.; Ye, J. An assessment of the impact of temperature rise due to climate change on asphalt pavement in China. Sustainability 2022, 14, 9044. [Google Scholar] [CrossRef] [Scilit]
- Liu, T.; Yang, S.; Yao, L.; Jiang, J. The impact of climate change on variations in rutting resilience of asphalt pavement across the climate zones in China. J. Clean. Prod. 2024, 479, 144016. [Google Scholar] [CrossRef] [Scilit]
- Zhang, Q.; Yang, S.; Chen, G. Regional variations of climate change impacts on asphalt pavement rutting distress. Transp. Res. Part D Transp. Environ. 2024, 126, 103968. [Google Scholar] [CrossRef] [Scilit]
- Wang, C.; Gong, G.Y.; Chen, Y.F. Long-term durability performance assessment of asphalt pavement with the consideration of climate change impact. China Civ. Eng. J. 2023, 56, 110–120. (In Chinese) [Google Scholar] [CrossRef]
- Cheng, H.; Liu, J.; Sun, L.; Liu, L. Critical position of fatigue damage within asphalt pavement considering temperature and strain distribution. Int. J. Pavement Eng. 2021, 22, 1773–1784. [Google Scholar] [CrossRef] [Scilit]
- Alae, M.; Zhao, Y.; Leng, Z. Effects of ageing, temperature and frequency-dependent properties of asphalt concrete on top-down cracking. Road Mater. Pavement Des. 2021, 22, 2289–2309. [Google Scholar] [CrossRef] [Scilit]
- Ktari, R.; Saint-laurent, D.; Hornych, P.; Hammoum, F.; Marsac, P.; Nguyen, M.L. Effect of climate on asphalt pavement performance using two mechanistic-empirical methods. Int. J. Pavement Eng. 2022, 23, 1433–1458. [Google Scholar] [CrossRef] [Scilit]
- Haslett, K.E.; Knott, J.F.; Stoner, A.M.K.; Sias, J.E.; Dave, E.V.; Jacobs, J.M.; Mo, W.; Hayhoe, K. Climate change impacts on flexible pavement design and rehabilitation practices. Road Mater. Pavement Des. 2021, 22, 2098–2112. [Google Scholar] [CrossRef] [Scilit]
- Eyring, V.; Bony, S.; Meehl, G.A.; Senior, C.A.; Stevens, B.; Stouffer, R.J.; Taylor, K.E. Overview of the Coupled Model Intercomparison Project Phase 6 (CMIP6) experimental design and organization. Geosci. Model Dev. 2016, 9, 1937–1958. [Google Scholar] [CrossRef] [Scilit]
- O’neill, B.C.; Tebaldi, C.; van Vuuren, D.P.; Eyring, V.; Friedlingstein, P.; Hurtt, G.; Knutti, R.; Kriegler, E.; Lamarque, J.-F.; Lowe, J.; et al. The Scenario Model Intercomparison Project (ScenarioMIP) for CMIP6. Geosci. Model Dev. 2016, 9, 3461–3482. [Google Scholar] [CrossRef] [Scilit]
- You, Q.; Cai, Z.; Wu, F.; Jiang, Z.; Pepin, N.; Shen, S.S.P. Temperature dataset of CMIP6 models over China: Evaluation, trend and uncertainty. Clim. Dyn. 2021, 57, 17–35. [Google Scholar] [CrossRef] [Scilit]
- Thrasher, B.; Wang, W.; Michaelis, A.; Melton, F.; Lee, T.; Nemani, R. NASA Global Daily Downscaled Projections, CMIP6. Sci. Data 2022, 9, 262. [Google Scholar] [CrossRef] [Scilit] [PubMed]
- Noël, T.; Loukos, H.; Defrance, D.; Vrac, M.; Levavasseur, G. Extending the global high-resolution downscaled projections dataset to include CMIP6 projections at increased resolution coherent with the ERA5-Land reanalysis. Data Brief. 2022, 45, 108669. [Google Scholar] [CrossRef] [Scilit] [PubMed]
- Yuan, H.; Ning, L.; Zhou, J.; Shi, W.; Huang, J.; Luo, Y. HiCPC: A new 10-km CMIP6 downscaled daily climate projections over China. Sci. Data 2024, 11, 1167. [Google Scholar] [CrossRef] [Scilit] [PubMed]
- Lafferty, D.C.; Sriver, R.L. Downscaling and bias-correction contribute considerable uncertainty to local climate projections in CMIP6. npj Clim. Atmos. Sci. 2023, 6, 158. [Google Scholar] [CrossRef] [Scilit]
- Li, X.; Li, Z. Evaluation of bias correction techniques for generating high-resolution daily temperature projections from CMIP6 models. Clim. Dyn. 2023, 61, 3893–3910. [Google Scholar] [CrossRef] [Scilit]
- Fick, S.E.; Hijmans, R.J. WorldClim 2: New 1-km spatial resolution climate surfaces for global land areas. Int. J. Climatol. 2017, 37, 4302–4315. [Google Scholar] [CrossRef] [Scilit]
- WORLDCLIM. Future Climate Data [EB/OL]. Available online: https://www.worldclim.org/data/cmip6/cmip6climate.html (accessed on 7 September 2026).
- Jarrell, A.; Bryce, J.; Samrat, M.R. Effects of model averaging for estimating future pavement temperatures under climate change. Int. J. Pavement Eng. 2025, 26, 2573769. [Google Scholar] [CrossRef] [Scilit]
- Jarrell, A.; Bryce, J. Average ensemble approach and implications for modeling future climate projections of flexible pavement subsurface temperature. J. Infrastruct. Syst. 2025, 31, 04025032. [Google Scholar] [CrossRef] [Scilit]
- Gopisetti, P.; Ceylan, H.; Cetin, B.; Kim, S. Assessment of satellite-based MERRA climate data in AASHTOWare pavement mechanistic-empirical design. Road Mater. Pavement Des. 2022, 23, 2876–2885. [Google Scholar] [CrossRef] [Scilit]
- Cao, R.; Yao, L.; Leng, Z. Synthesising climate and traffic factors for pavement regionalisation in China. Int. J. Pavement Eng. 2025, 26, 2450098. [Google Scholar] [CrossRef] [Scilit]
- Liu, T.; Yang, S.; Zhu, L.; Liao, B.; Zhang, Q. Influence of climate change on asphalt binder selection in China. Int. J. Pavement Eng. 2023, 24, 2252145. [Google Scholar] [CrossRef] [Scilit]
- Swarna, S.T.; Hossain, K. Asphalt binder selection for future Canadian climatic conditions using various pavement temperature prediction models. Road Mater. Pavement Des. 2023, 24, 447–461. [Google Scholar] [CrossRef] [Scilit]
- Kontson, K.; Lill, K.; Ellmann, A.; Aavik, A. The impact of climate change on pavement temperatures and asphalt binder grade selection in Estonia based on different climate change scenarios. Balt. J. Road Bridge Eng. 2025, 20, 94–113. [Google Scholar] [CrossRef] [Scilit]
- Liu, T.; Yang, S.; Jiang, X.; Liao, B.; Castillo-Camarena, E.A. Adaptation measures for asphalt pavements to climate change in China. J. Clean. Prod. 2023, 415, 137861. [Google Scholar] [CrossRef] [Scilit]
- Yao, L.; Leng, Z.; Ni, F.; Lu, G.; Jiang, J. Adaptive maintenance strategies to mitigate climate change impacts on asphalt pavements. Transp. Res. Part D Transp. Environ. 2024, 126, 104026. [Google Scholar] [CrossRef] [Scilit]
- Yang, Q.; Cao, Z.; Shen, L.; Gu, F.; Santos, J.; Qiao, Y.; Wang, H.; Li, J.; Zhang, Y.; Chu, C. Impacts of climate change on environmental and economic sustainability of flexible pavements across China. Resour. Conserv. Recycl. 2024, 206, 107589. [Google Scholar] [CrossRef] [Scilit]
- Qiao, Y.; Guo, Y.; Stoner, A.M.K.; Santos, J. Impacts of future climate change on flexible road pavement economics: A life cycle costs analysis of 24 case studies across the United States. Sustain. Cities Soc. 2022, 80, 103773. [Google Scholar] [CrossRef] [Scilit]
- JTG D50-2017; Specifications for Design of Highway Asphalt Pavement. China Communications Press: Beijing, China, 2017. (In Chinese)
- Gudipudi, P.P.; Underwood, B.S.; Zalghout, A. Impact of climate change on pavement structural performance in the United States. Transp. Res. Part D Transp. Environ. 2017, 57, 172–184. [Google Scholar] [CrossRef] [Scilit]

Disclaimer/Publisher’s Note: The statements, opinions and data contained in all publications are solely those of the individual author(s) and contributor(s) and not of MDPI and/or the editor(s). MDPI and/or the editor(s) disclaim responsibility for any injury to people or property resulting from any ideas, methods, instructions or products referred to in the content. |
© 2026 by the authors. Licensee MDPI, Basel, Switzerland. This article is an open access article distributed under the terms and conditions of the Creative Commons Attribution (CC BY) license.