


Abstract
Uniform deposition of nanoparticle suspensions over large-area substrates remains challenging because coating formation is strongly influenced by suspension properties and spraying conditions. Therefore, this study employed computational fluid dynamics (CFD) to simulate the air-assisted spray deposition of nano-Al2O3 suspensions, with method validation. The effects of nanoparticle volume fraction, feed rate, and air pressure on deposition morphology and coating thickness distribution were investigated. Increasing the nanoparticle volume fraction from 1% to 4% improved thickness uniformity, reducing the normalized root-mean-square error and coefficient of variation (CV) to 5.52% and 38.90%, respectively, while a further increase to 5% provided no additional improvement. Increasing the feed rate from 1 g/s to 5 g/s increased the mean coating thickness from 3.09 μm to 10.97 μm and the effective coverage area from 2.5 × 104 mm2 to 4 × 104 mm2, but intensified local thickness accumulation. Increasing the air pressure from 0.1 MPa to 0.3 MPa enhanced droplet dispersion, increasing the effective coverage area from 2.45 × 104 mm2 to 3.57 × 104 mm2 while decreasing the mean coating thickness from 10.25 μm to 6.99 μm. These findings provide a reference for process selection in large-area nanoparticle suspension deposition.
1. Introduction
Nano-alumina (Al2O3) has attracted considerable attention as an inorganic reinforcing filler for polymer composite coatings because of its favorable mechanical properties, thermal stability, and electrical insulation [1,2]. The incorporation of nano-Al2O3 can improve the mechanical and protective performance of polymer coatings; however, the extent of these improvements strongly depends on the nanoparticle content, dispersion state, and interfacial compatibility with the matrix. Huang et al. [3] incorporated silane-modified nano-Al2O3 into waterborne epoxy coatings and reported improvements in hardness, wear resistance, and corrosion resistance at an appropriate nanoparticle content, whereas excessive addition resulted in performance deterioration. Liang et al. [4] enhanced the dispersion of nano-Al2O3 in an epoxy matrix through polyethyleneimine surface modification, thereby improving the barrier properties of the resulting coating. Hydrophobically modified Al2O3 nanoparticles have also been used to produce epoxy coatings with superhydrophobic, self-cleaning, and anticorrosive properties [5]. Similar improvements in mechanical and corrosion-protection performance have been reported for micro/nano-Al2O3-filled epoxy coatings [6] and chemically modified Al2O3-containing UV-curable coatings [7]. More recently, Huynh et al. [8] improved the compatibility between γ-Al2O3 and an epoxy matrix using a titanate coupling agent, resulting in enhanced mechanical, thermal, and corrosion-resistant properties. These studies demonstrate the potential of nano-Al2O3 for high-performance composite coatings while also highlighting the importance of achieving controlled and uniform nanoparticle incorporation.
Air-assisted atomization spraying provides a simple and flexible route for depositing nanoparticle suspensions over relatively large surfaces. In this process, compressed air interacts with the liquid delivered from the nozzle, breaking the suspension into droplets that are transported toward the substrate and subsequently form a deposited layer through impingement, spreading, and accumulation. The final deposition characteristics are governed by the coupled effects of atomization, droplet transport, and wall interaction. Consequently, changes in operating parameters can alter droplet size, momentum, spatial dispersion, and deposition flux, ultimately affecting both the coating profile and thickness distribution. This sensitivity becomes particularly important for large-area planar substrates, where excessive central accumulation or insufficient lateral spreading can lead to substantial spatial non-uniformity.
Numerical simulation provides an effective approach for resolving complex gas–droplet interactions involved in spray processes and for predicting droplet transport and deposition behavior. Recent studies have demonstrated the capability of CFD-based approaches in spray coating applications. Matsushita et al. [9] developed numerical models for spray painting and analyzed the influence of turbulence modeling on droplet dispersion and coating deposition. Han et al. [10] investigated dynamic air spray painting and showed that operating parameters such as spraying distance, angle, and velocity significantly affect film formation and thickness distribution. Other multiphase CFD studies have further examined droplet breakup, transport, and deposition characteristics under air-assisted spraying conditions [11,12]. Experimental investigations of nanocomposite spray deposition have also highlighted the importance of suspension properties and operating parameters on coating characteristics [13]. However, the coupled effects of nanoparticle concentration-dependent suspension and spraying parameters on large-area coating thickness uniformity remain insufficiently understood.
Therefore, this study extends the analysis from spray behavior to the deposition of nanoparticle suspensions on large-area planar substrates. In particular, the volume-fraction-dependent properties of the nano-Al2O3 suspension were incorporated into the CFD model, enabling the effects of suspension composition on droplet transport and the resulting coating thickness distribution to be evaluated. CFD was employed to simulate the air-assisted spray deposition of nano-Al2O3 suspensions, with method validation specifically conducted for the predicted spray cone angles using infrared thermographic measurements. The effects of nanoparticle volume fraction, feed rate, and air pressure on deposition morphology, coating thickness distribution, effective coverage area, and coating uniformity were then systematically investigated. Through this approach, the present study links suspension composition and spraying conditions to substrate-scale coating formation, providing a numerical basis for process-parameter selection in large-area spray deposition of nanoparticle suspensions.
2. Methodology
2.1. Numerical Setup
2.1.1. Physical Model and Boundary Conditions
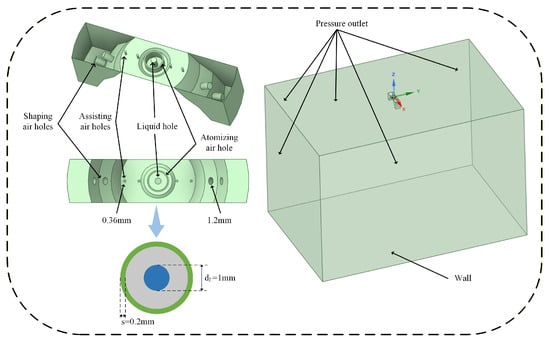
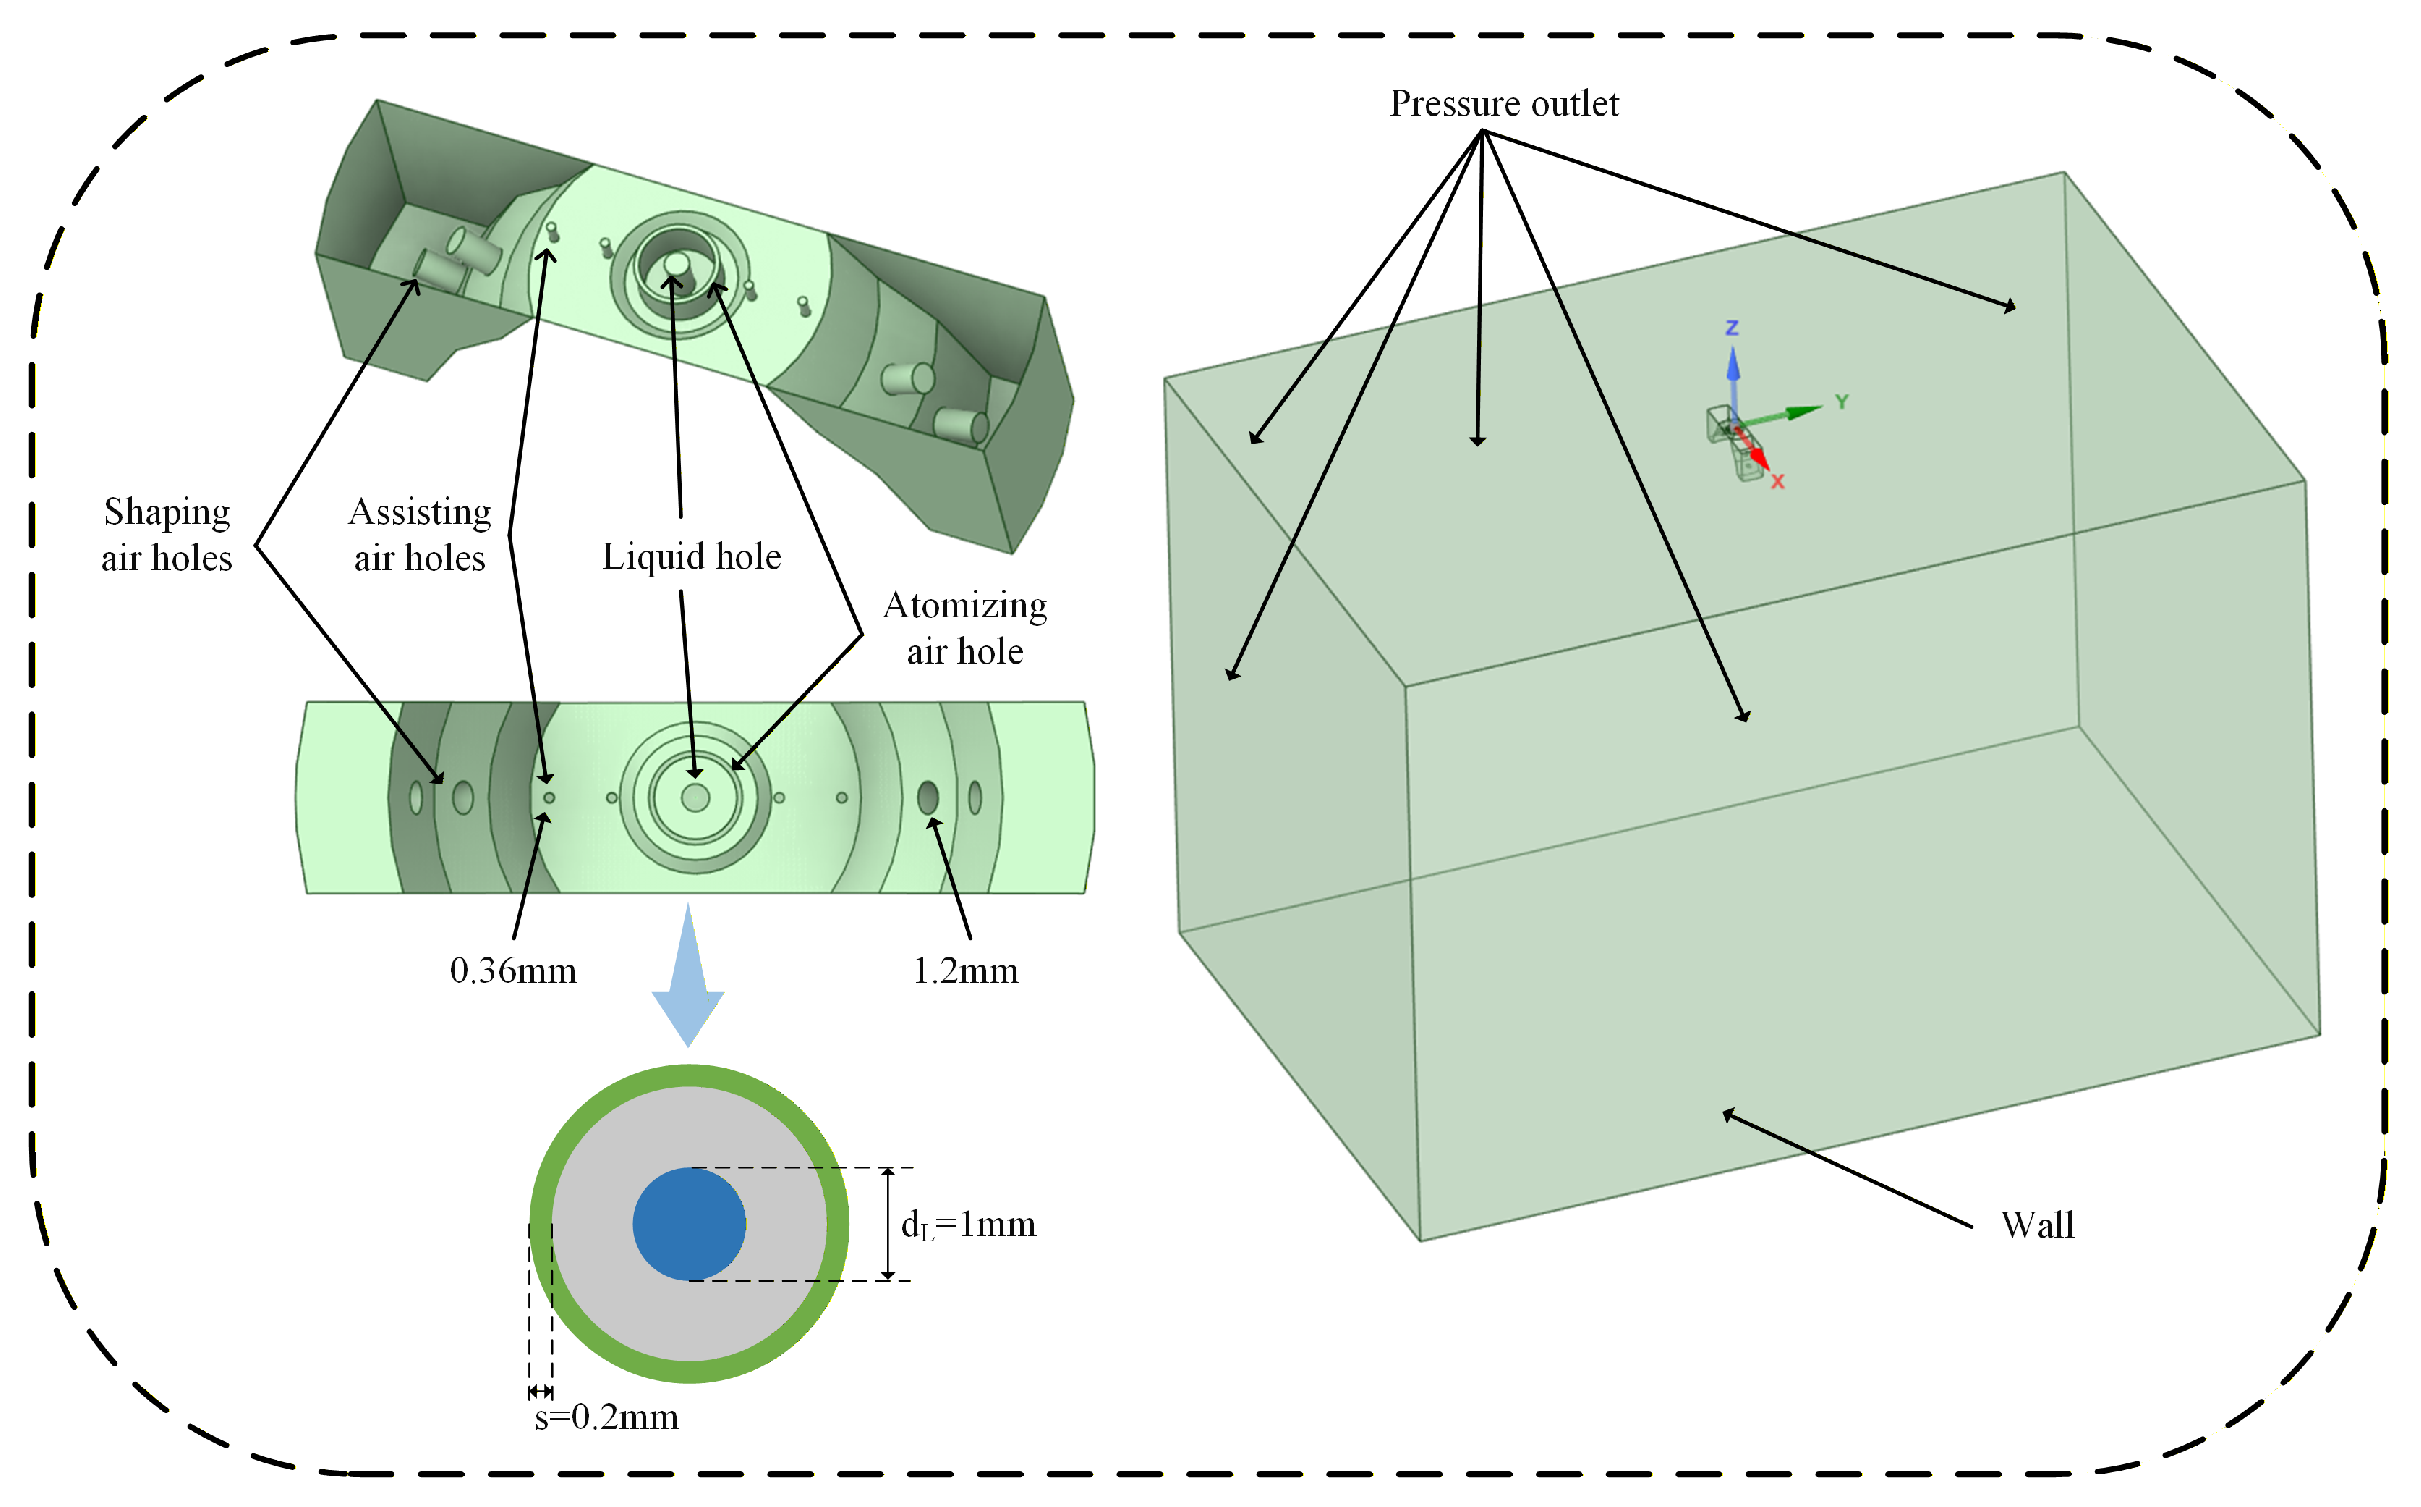
The geometric model of the air spray gun was simplified in this study, retaining only the gas and liquid inlets and their interaction region, as shown in Figure 1. The origin of the computational domain was located at the center of the nozzle inlet, and the domain dimensions in the x-, y-, and z-directions were [−100, 100] × [−150, 150] × [−202, 0] mm, respectively. The distance between the nozzle outlet and the bottom surface was 200 mm. A mass-flow inlet boundary condition was applied to the liquid inlet, while pressure-inlet boundary conditions were imposed at the gas inlets. The inlet pressures of the atomizing air holes, auxiliary air holes, and fan air holes were set to the same value. The specified gas-inlet pressures were gauge pressures, and the operating pressure in the solver was set to 101,325 Pa. The open boundaries on the sides and top of the computational domain were defined as pressure outlets with a pressure of 101,325 Pa. All remaining surfaces were treated as adiabatic no-slip walls, and the discrete-phase boundary condition at the bottom surface was specified as a wall film boundary. The physical properties of nano-Al2O3 and anhydrous ethanol are listed in Table 1.
Figure 1.
Schematic of the simplified air spray gun model and computational domain.
Table 1.
Physical parameters of nanoparticle and anhydrous ethanol [14,15].
2.1.2. Numerical Method
Numerical simulations were performed using ANSYS Fluent 2024 R1. The discrete phase model (DPM) coupled with the Lagrangian wall film model was employed to investigate the evolution of the deposition profile and film-thickness distribution of the nanocomposite coating. A pressure-based solver was used to solve the continuity and momentum equations for the continuous phase, and the Realizable k-ε model was adopted to describe turbulence. Pressure–velocity coupling was achieved using the SIMPLE algorithm, and a second-order upwind scheme was employed for spatial discretization. The time step was set to 1 × 10⁻⁴ s. The convergence criteria for the continuity and momentum equations were set to 1 × 10⁻³ and 1 × 10⁻⁵, respectively. For the discrete phase, the initial droplets were introduced using a group injection with 200 particle streams. The computational domain was discretized using a Poly-Hexcore hybrid mesh. Hexahedral cells were predominantly employed in the primary atomization region, while polyhedral cells were used for mesh transition near complex wall geometries. The governing conservation equations for mass and momentum are expressed as follows [16,17]:
Here, denotes the drag force acting on the dispersed phase, which depends on the velocity difference between the dispersed and continuous phases. The virtual mass force accounts for the additional inertial effect associated with the acceleration of the surrounding fluid as the dispersed phase accelerates. represents the lift force acting on the dispersed phase, which arises primarily from velocity gradients in the continuous-phase flow field.
The DPM is based on the Eulerian–Lagrangian framework, in which the gas phase is treated as a continuous medium, while the trajectories of discrete droplets are tracked using a Lagrangian approach. Without explicitly resolving the gas–liquid interface of each individual droplet, the model can predict droplet velocity, size, trajectory, and wall deposition behavior at a relatively low computational cost, making it particularly suitable for spray processes with a low discrete-phase volume fraction [18]. In addition, the DPM accounts for momentum exchange between the gas and liquid phases and, when coupled with the wall film model, can effectively predict droplet impingement, deposition, and the resulting film-thickness distribution. The governing equations of the DPM can be expressed as follows [19,20]:
Here, and represent the velocity of the discrete and continuous phases, respectively, while and denote the density of the discrete and continuous phases. The drag force is calculated using the following expression [21]:
where , , and denote the particle diameter, particle Reynolds number, and drag coefficient, respectively.
The WAVE breakup model is based on the Kelvin–Helmholtz instability theory and predicts the droplet breakup time and child-droplet size using the wavelength and growth rate of the fastest-growing surface disturbance. The model can capture aerodynamic breakup induced by the relative motion between the gas and liquid phases while accounting for the effects of liquid viscosity and surface tension on the breakup process. When coupled with the DPM, it enables the simulation of droplet breakup and size evolution without explicitly resolving the deformation of the droplet interface. In this model, the radius of the child droplets is determined by the fastest-growing unstable wave on the surface of the parent droplet and is assumed to be proportional to the corresponding wavelength. It can therefore be expressed as follows [22]:
The evolution of the parent-droplet radius during the breakup process is governed by the difference in size between the parent and child droplets, together with the characteristic breakup time, and can be expressed as follows:
The characteristic breakup time is calculated based on the wavelength and growth rate of the unstable wave as follows:
Here, and denote the radii of the parent and child droplets, respectively. The wavelength and growth rate of the fastest-growing unstable surface wave are represented by and , respectively. The characteristic breakup time is denoted by , while and are the model constants governing the child-droplet size and breakup timescale, respectively. In this study, and are taken as 0.61 and 1.73, respectively.
The deposition and spreading of spray droplets were simulated using the Lagrangian wall film model. In practical nanoparticle suspension spraying, a bonding layer is typically applied to the substrate prior to suspension deposition. Accordingly, the wall in the present model was treated as a substrate covered with a pre-deposited bonding layer, and a surface roughness of 1.6 μm was specified to characterize the bonding-layer surface. The predicted wall-film thickness represents the wet nano-Al2O3 suspension film deposited on the bonding layer, rather than the solid deposit remaining after ethanol evaporation, which was not considered under the isothermal assumption. The pre-deposited bonding layer and the subsequently deposited nanoparticle-containing layer together constitute the composite coating considered in this study. Upon impact, droplets may adhere to the surface, spread, or undergo splashing. Under the isothermal assumption adopted in this study, these impact outcomes were classified using the dimensionless impact-energy parameter, expressed as:
where and denote the wall-normal impact velocity and diameter of the droplet, respectively. The liquid density and surface tension are represented by and , while denotes the liquid film thickness. The boundary-layer thickness is estimated from the following relation:
To further characterize the atomization behavior of nano-Al2O3 suspensions under different spraying conditions, three dimensionless numbers, namely the Ohnesorge number (), Reynolds number (), and Weber number (), were introduced to evaluate the relative effects of viscous, inertial, and surface tension forces during the atomization process. These dimensionless numbers are defined as follows:
where , , and are the dynamic viscosity, surface tension, and density of the nano-Al2O3 suspension, respectively; is the nozzle diameter; and is the liquid average velocity at the nozzle exit, calculated from the suspension mass flow rate as:
The same reference position was used for all operating conditions to ensure consistency in the dimensionless analysis.
2.2. Physical Properties of Nanoparticle Suspensions
A widely used formulation for estimating the physical properties of nanoparticle suspensions was adopted [15,23,24]:
where is the volume fraction of nanoparticles, and , , and are the densities of the nanoparticle suspensions, nanoparticles, and base fluid, respectively. is the dynamic viscosity of the suspensions. is the surface tension of the suspensions, R is the universal gas constant, and T is the absolute temperature. is the surface-equivalent bulk concentration coefficient. is the ratio of the projected molar areas of nanoparticles and base-fluid molecules. is the dimensionless adsorption equilibrium constant, and is the ratio of the maximum nanoparticle surface concentration to , , , , and . The calculations were performed at and .
In the present model, the nanoparticle suspension was treated as a homogeneous effective fluid. Therefore, nanoparticle agglomeration and aggregate-size evolution were not explicitly considered, and no additional agglomeration term was included. The effect of nanoparticle concentration was incorporated through the concentration-dependent density, viscosity, and surface tension described by Equations (14)–(16).
2.3. Numerical Verification
2.3.1. Grid Independence Verification and Sensitivity Analysis of Particle Number
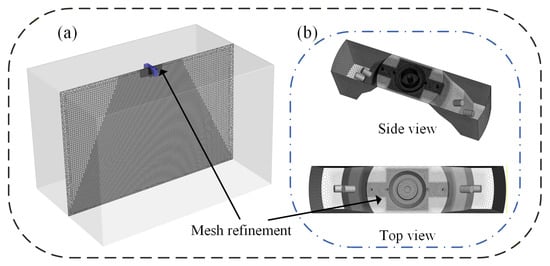
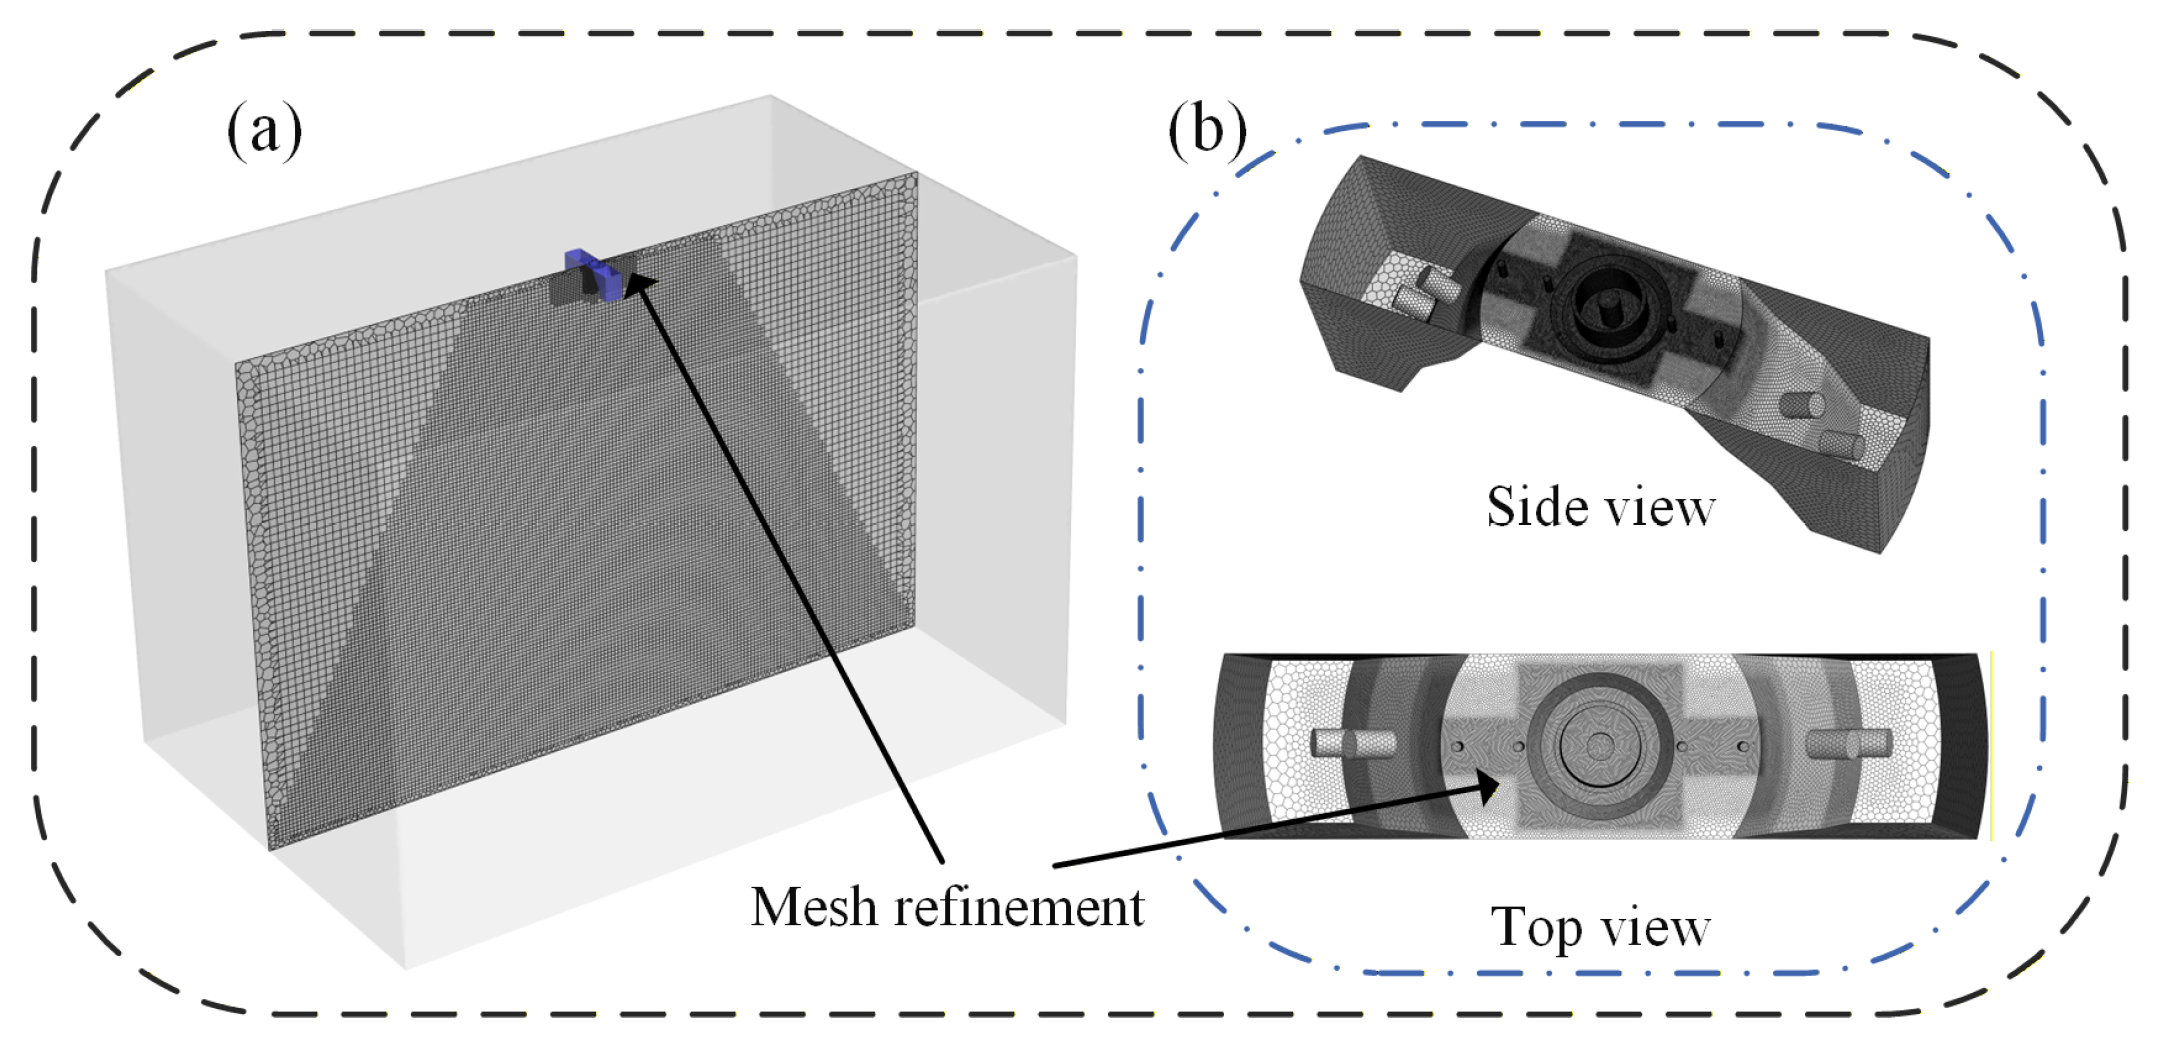
Figure 2 presents the computational domain together with the mesh arrangement adopted in the numerical model. A predominantly hexahedral mesh was generated throughout the domain, with nonuniform spatial resolution used to balance numerical accuracy and computational cost. Finer cells were concentrated around the automatic air spray gun and in the downstream region where the spray develops. In particular, the nozzle exit, nearby geometric transitions, and the central spray zone were assigned a higher mesh density to provide sufficient resolution for the rapidly varying flow and droplet transport characteristics. As illustrated in Figure 2a, this refinement extends from the nozzle into the near-field region of the jet, whereas the cell size is gradually enlarged toward the outer boundaries, where the influence of atomization becomes relatively weak. Such a mesh configuration allows the important flow structures in the spray region to be adequately resolved without an excessive increase in the total cell count. Detailed views of the mesh around the spray gun are provided in Figure 2b. The cells closely follow the geometric features of the nozzle body, inlet passage, and structural transition sections, ensuring an appropriate representation of the complex boundaries involved in the simulation. The resulting mesh achieved an average orthogonal quality of 0.978, confirming that the computational grid satisfies the quality requirements for the subsequent numerical calculations. In addition, geometric and statistical criteria were introduced to quantitatively characterize the deposited nano-Al2O3 composite coating. For each coating thickness distribution, the region with a local thickness satisfying , where denotes the maximum coating thickness, was defined as the effective coating region, . The effective coating region was subsequently fitted with an equivalent ellipse to characterize its geometric features. The agreement between the effective coating region and the fitted ellipse was quantified using the Dice similarity coefficient (DSC), while the major-axis length , minor-axis length , elliptical area , and eccentricity were used to characterize the size and shape of the coating region. Moreover, the mean coating thickness was calculated using the thickness data within the effective coating region. The thickness data within the same effective region were fitted using a rotated two-dimensional Gaussian function to characterize the spatial thickness distribution, and the fitting deviation was quantified using the normalized root mean square error (NRMSE). The coating thickness profiles along the x- and y-direction centerlines were extracted, and the corresponding root mean square errors (RMSEX, RMSEY) were calculated to quantitatively evaluate the thickness distributions along the two principal directions. The corresponding definitions are given as follows:
where is the fitted equivalent elliptical region; and are the actual and fitted coating thicknesses at the th data point, respectively; is the number of data points used for the NRMSE calculation; and are the actual coating thicknesses at the th sampling point along the x- and y-direction centerlines, respectively; and are the corresponding fitted coating thicknesses along the x- and y-direction centerlines, respectively; and and are the numbers of sampling points along the x- and y-direction centerlines, respectively.
Figure 2.
(a) Computational mesh of the entire domain; (b) detailed view of the locally refined mesh near the nozzle wall and within the inlet channel.
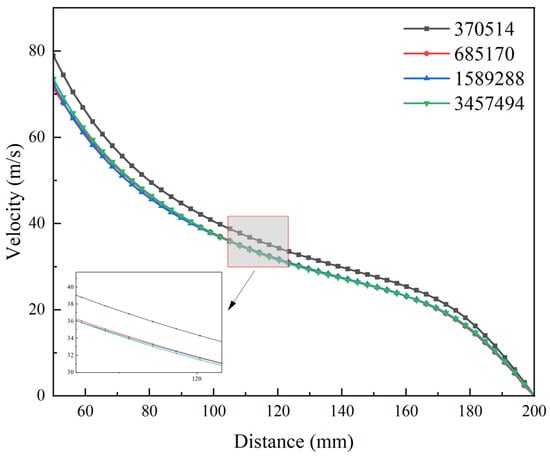
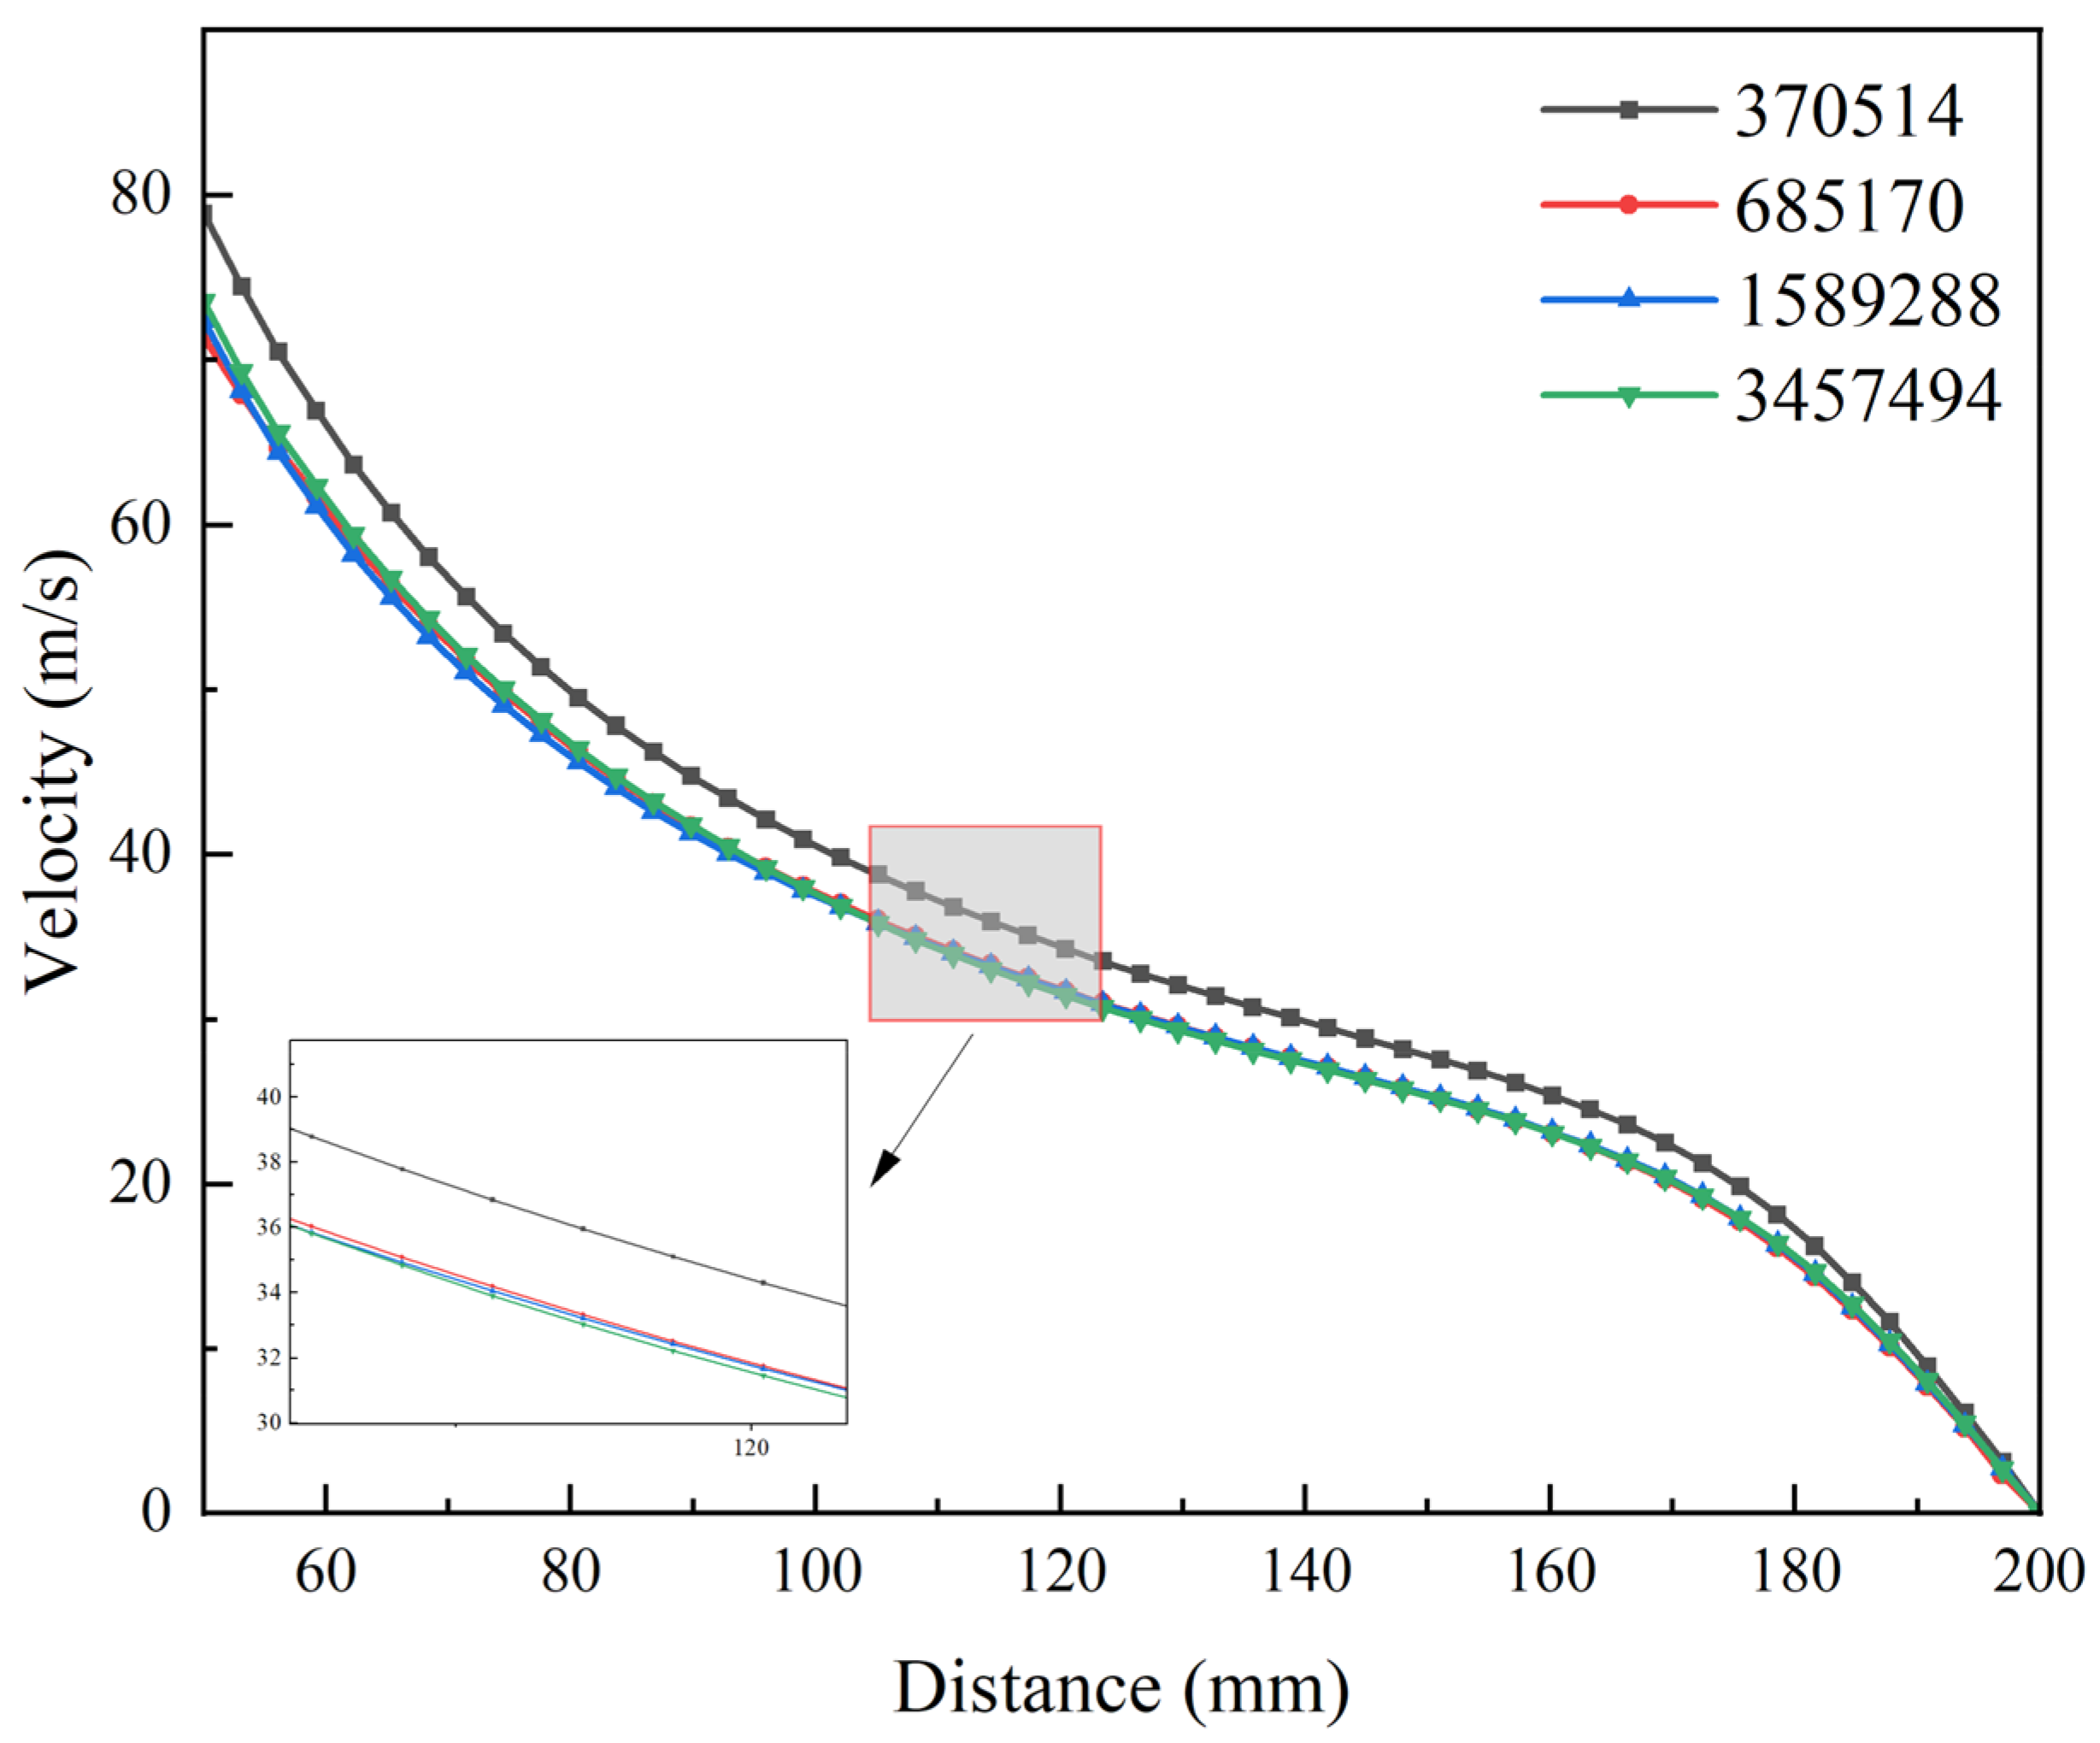
The influence of mesh resolution on the numerical results was examined by comparing the centerline velocities obtained using four meshes containing 370,514, 685,170, 1,589,288, and 3,457,494 elements, as presented in Figure 3. The velocity was sampled along the nozzle centerline over an axial range of 50–200 mm. Although all four cases exhibit a similar decay in velocity with increasing downstream distance, noticeable discrepancies can be observed for the mesh with 370,514 elements. These discrepancies gradually diminish as the mesh is refined. In particular, the velocity curves corresponding to 1,589,288 and 3,457,494 elements nearly overlap throughout the investigated range. The magnified view in Figure 3 also confirms that only a minor difference exists between these two cases. This suggests that increasing the mesh resolution beyond 1,589,288 elements produces no appreciable improvement in the predicted centerline velocity. Accordingly, the mesh with 1,589,288 elements was considered sufficiently independent of mesh resolution and was selected for the subsequent simulations.
Figure 3.
Centerline velocity distributions in the nozzle over the range of 50–200 mm for four different mesh resolutions.
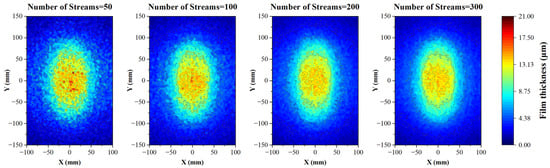
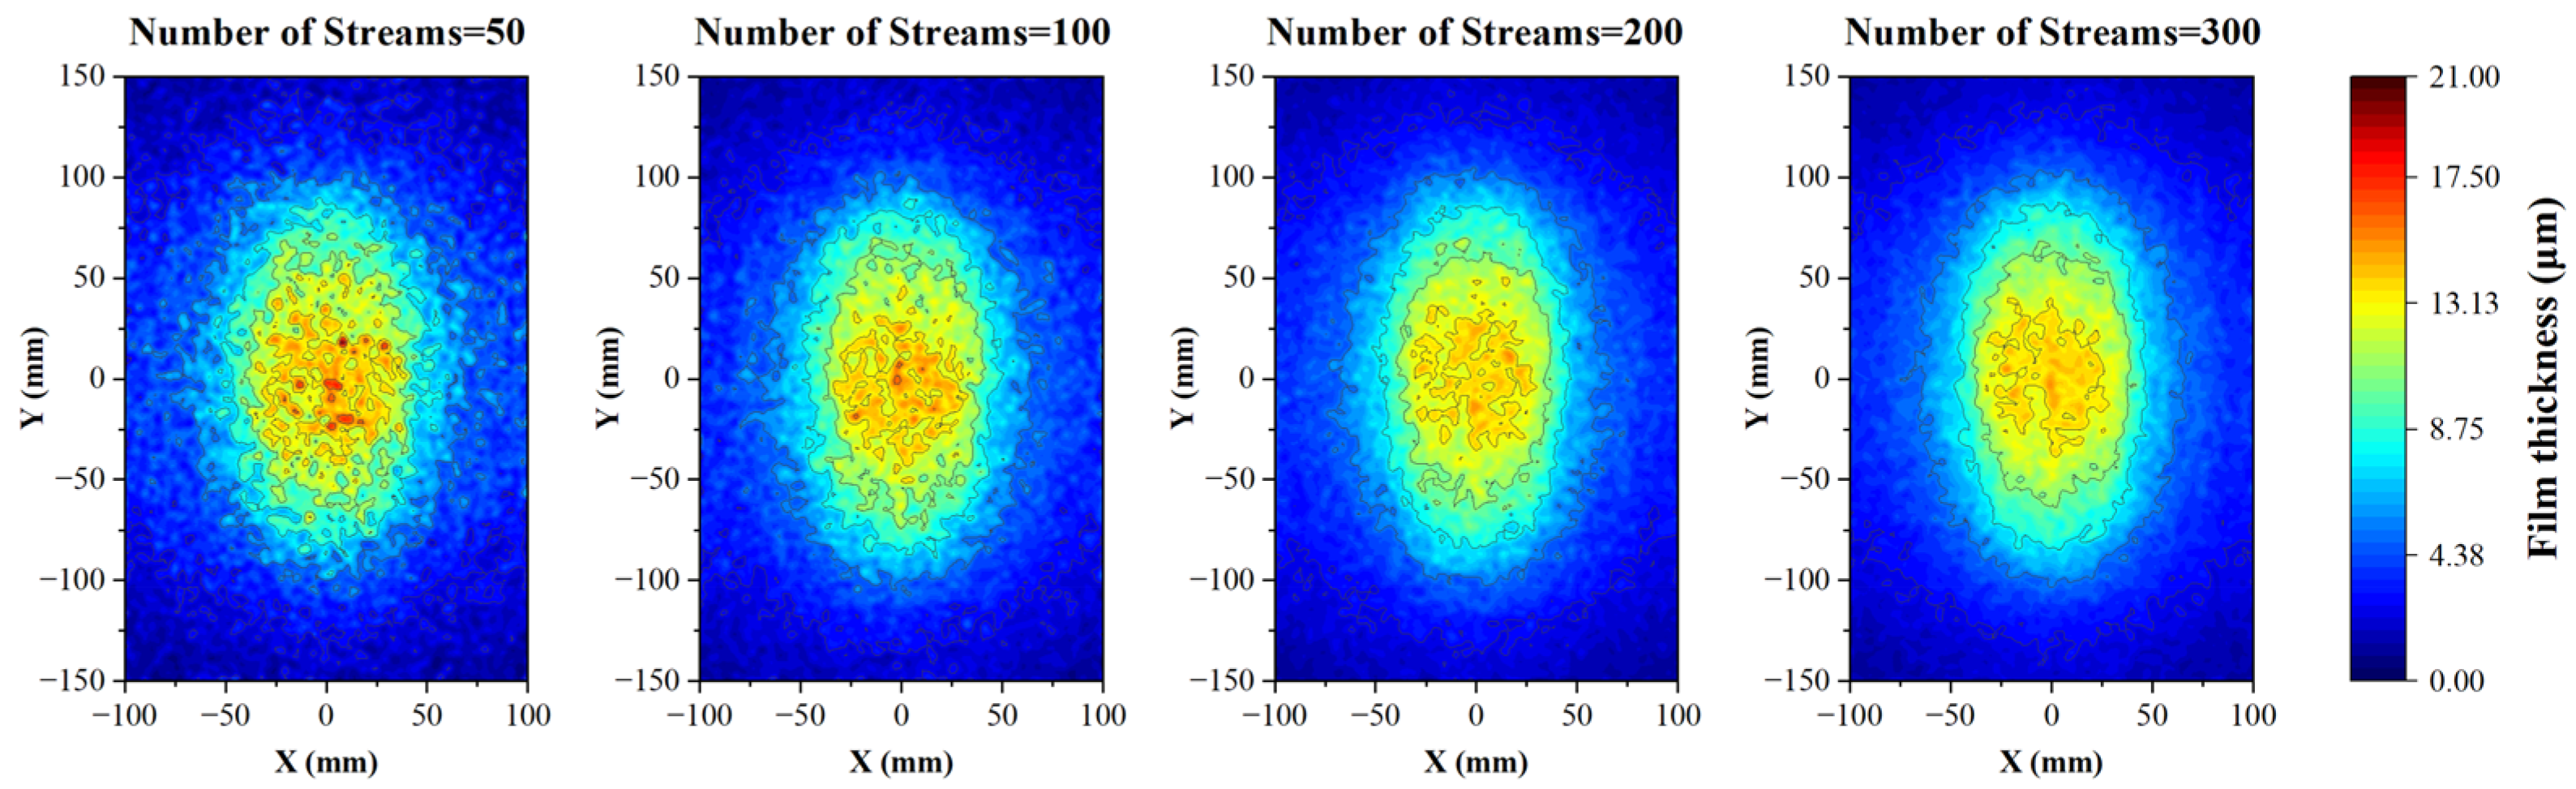
The sensitivity of the predicted nano-Al2O3 composite coating to the number of discrete-phase streams was also investigated. Four stream numbers, namely 50, 100, 200, and 300, were examined by comparing the corresponding coating-thickness contours in Figure 4. At relatively low stream numbers, particle deposition on the bonding-layer surface is sparse and uneven, resulting in an irregular coating shape, considerable local variations in thickness, and discontinuous deposition zones. Increasing the number of streams leads to a denser particle distribution and a more clearly defined coating profile, accompanied by improved continuity and uniformity of the deposited layer. Once the stream number reaches 200, no substantial variation in either the overall coating morphology or the thickness distribution can be observed. Increasing the stream number further to 300 produces only slight changes in the predicted deposition characteristics. Therefore, 200 streams were considered adequate to obtain stable numerical predictions while avoiding unnecessary computational expense. Based on the above sensitivity analyses, a mesh containing 1,589,288 elements and 200 discrete-phase streams was adopted for all subsequent calculations.
Figure 4.
Sensitivity analysis of the particle number.
2.3.2. Model Validation
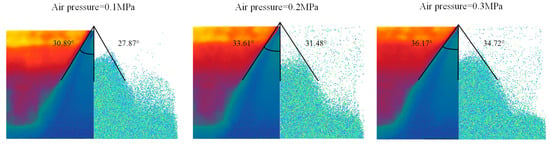
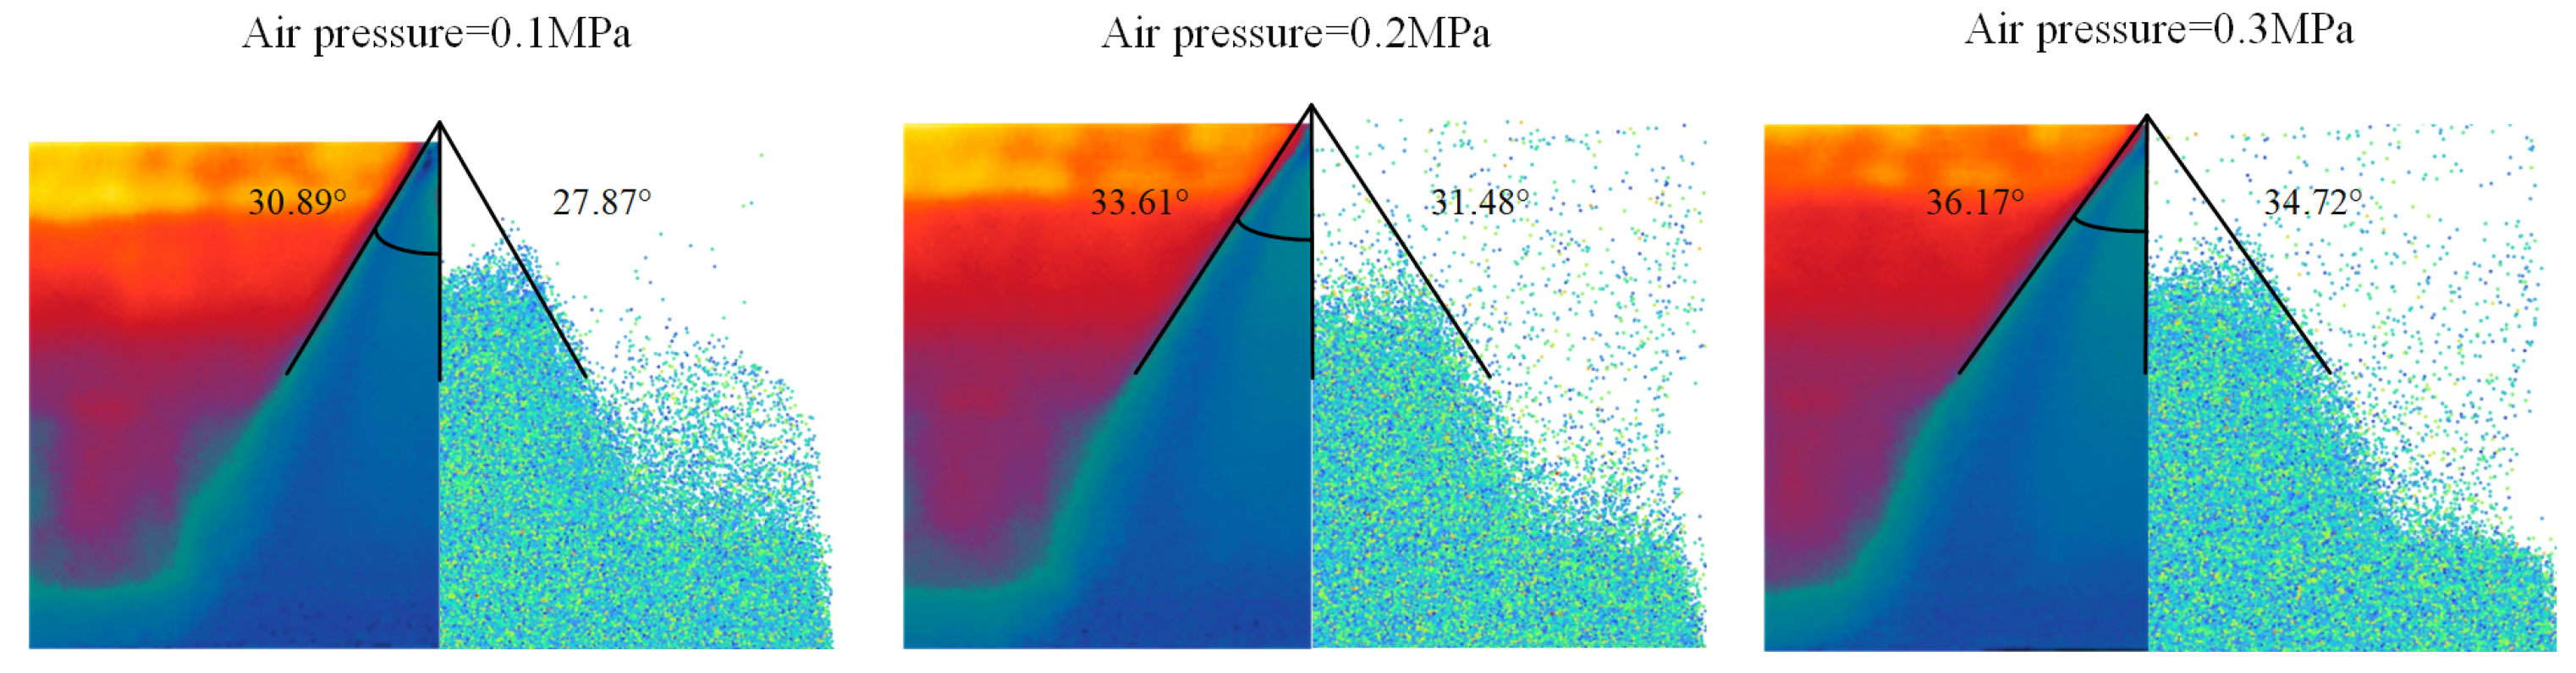
The spray cone angle was selected as the characteristic parameter for evaluating the numerical model. Figure 5 compares the experimentally observed and numerically predicted spray patterns under different air pressures. For the experiments, a suspension containing 3% nano-Al2O3 in anhydrous ethanol was prepared by mechanical stirring at 500 rpm for 2 h. Partial evaporation of ethanol resulted in evaporative cooling of the suspension, producing a pronounced thermal contrast between the spray plume and the surrounding environment. This thermal contrast enabled the spray plume to be clearly captured using an infrared thermal imager (A655sc, FLIR Systems, Inc., Wilsonville, OR, USA). The spraying distance, defined as the vertical distance from the nozzle outlet to the substrate surface, was fixed at 200 mm. The spray boundaries in the thermal images were identified using ImageJ 1.54 based on the thermal contrast between the spray plume and the surrounding environment, and the corresponding spray angle was measured once for each air-pressure condition.
Figure 5.
Comparison of experimental and numerical spray cone angle.
Figure 5 presents the half-angles of the spray plume, whereas the corresponding full cone angles obtained experimentally and numerically are summarized in Table 2. The relative deviations range from 4.01% to 9.91%, with the numerical predictions consistently lower than the experimental measurements, indicating a systematic underprediction of the spray cone angle. This discrepancy may partly arise from the different definitions of the spray boundary in the experiment and numerical simulation. In the infrared images, the experimentally identified boundary is determined by the detectable thermal contrast associated with the cooled spray plume, which may extend beyond the droplet-dominated region represented by the numerical spray boundary. In addition, the isothermal assumption neglects evaporation-induced changes in droplet temperature and size, as well as temperature-dependent liquid properties such as viscosity and surface tension. These effects may influence droplet breakup, aerodynamic response, and dispersion and thereby contribute to the observed underprediction. Nevertheless, the numerical results reproduce the experimentally observed variation in spray cone angle with air pressure, with relative deviations remaining below 10%.
Table 2.
Comparison of experimental and numerical spray cone angle.
It should be noted that the quantitative validation based on infrared thermography in this study focuses on the prediction of the spray cone angle, which evaluates the capability of the numerical model to reproduce the spray expansion behavior. Since direct measurements of the deposited dry-film thickness distribution were not performed, the infrared thermographic comparison does not represent direct experimental validation of the coating thickness distribution on the substrate. The simulation conditions used for the parametric analyses are summarized in Table 3. All quantitative coating metrics were evaluated at 0.6 s. In addition, the operating conditions investigated in the numerical simulations were defined with reference to the laboratory-scale air-assisted spraying configuration used in the present study. In particular, the nozzle-to-substrate distance was fixed at 200 mm, and the air-pressure range of 0.1–0.3 MPa was also examined experimentally in the spray-cone-angle measurements. The nanoparticle volume fraction and liquid feed rate were varied parametrically to investigate the effects of suspension composition and liquid loading, respectively. Thus, the investigated conditions are relevant to the laboratory-scale spray system considered in this study, while the parametric variations are intended to examine the model response over a broader range of operating conditions.
Table 3.
Simulation conditions for the parametric studies.
3. Results and Discussion
3.1. Impact of Nanoparticle Volume Fraction on Surface Quality of Coatings
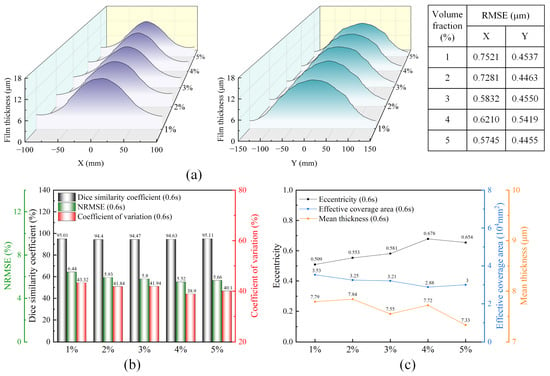
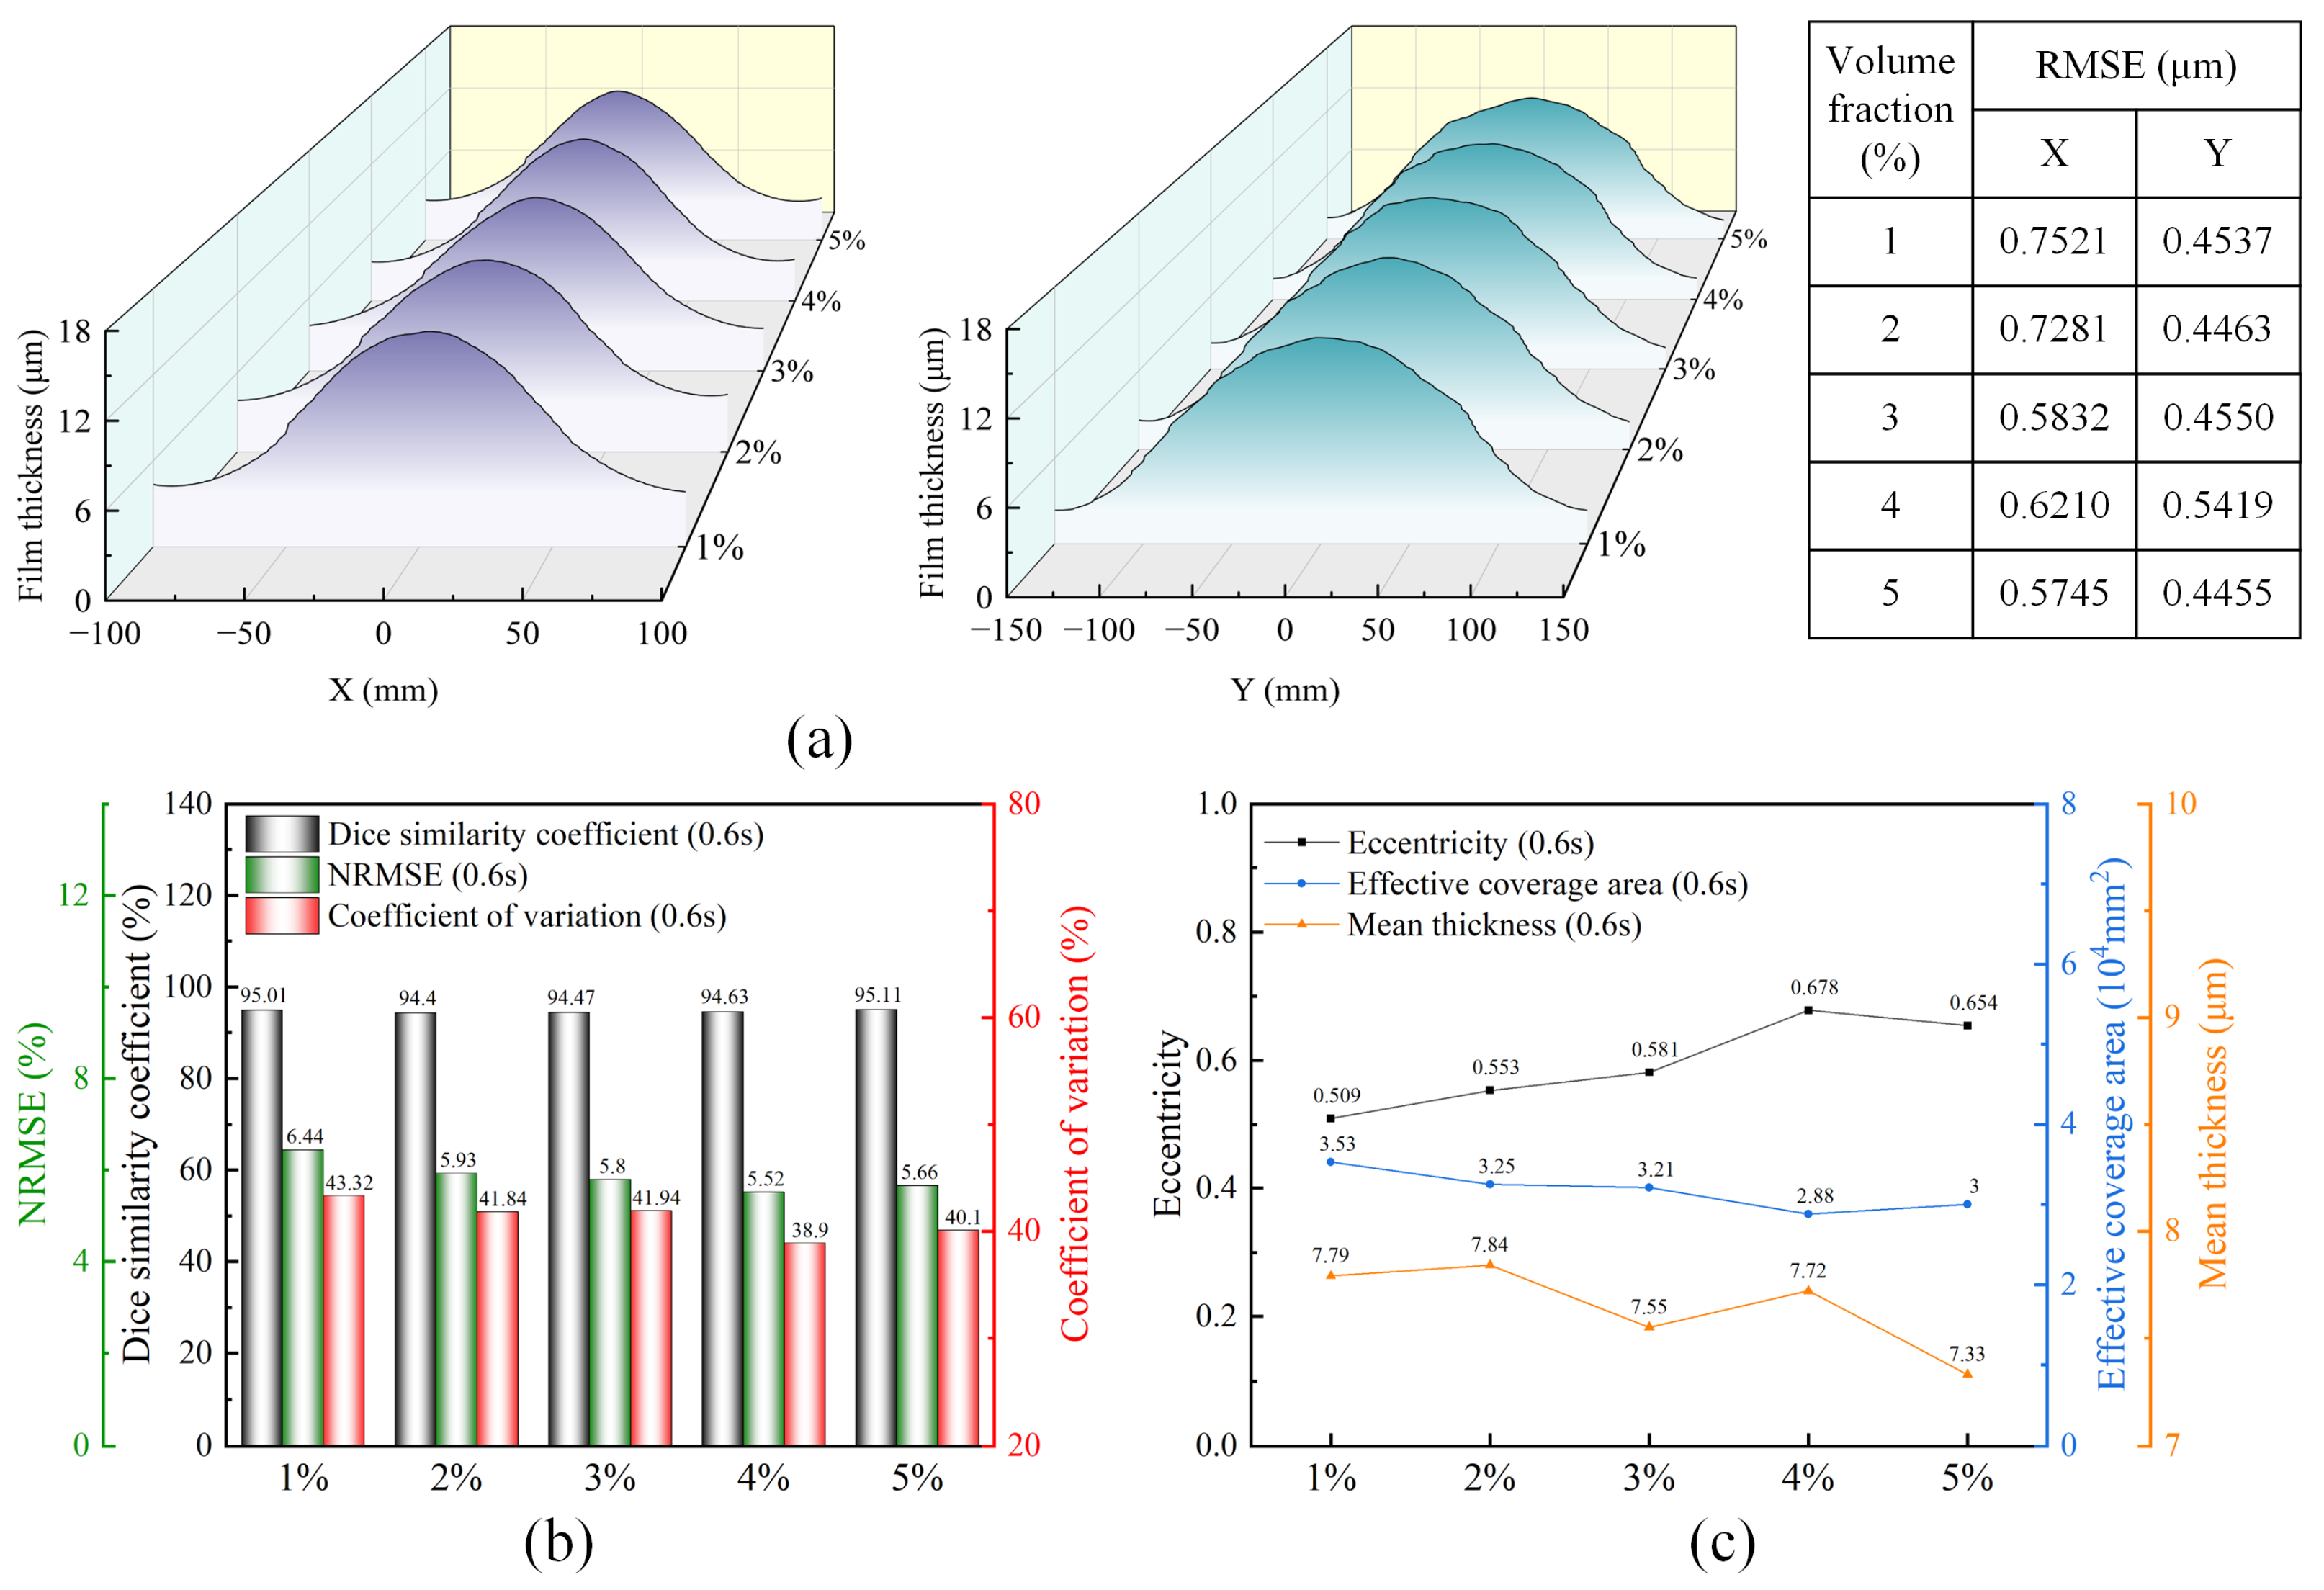
Figure 6 shows the effects of different nano-Al2O3 volume fractions on the deposition characteristics of the composite coating. As shown in Figure 6a, the coating thickness along both the x- and y-directions gradually decreases from the center toward both sides at different volume fractions, indicating that variations in nanoparticle content do not significantly alter the overall deposition profile of the coating but have a certain influence on the local thickness distribution. As shown in Figure 6b, the Dice similarity coefficient (DSC) remains above 94% under all conditions, further indicating a high degree of consistency in the overall contour of the deposition region. As the nano-Al2O3 volume fraction increases from 1% to 4%, the NRMSE decreases from 6.44% to 5.52%, while the CV decreases from 43.32% to 38.90%, indicating a gradual improvement in coating thickness uniformity. When the volume fraction is further increased to 5%, both indicators increase slightly, suggesting that a further increase in nanoparticle content does not further improve coating uniformity. Figure 6c shows that, with increasing volume fraction, the eccentricity of the deposition contour exhibits an overall increasing trend, while the effective coverage area generally decreases. The mean coating thickness fluctuates to some extent and reaches its lowest value of 7.33 μm at 5%. Overall, the nano-Al2O3 volume fraction has a relatively limited effect on the overall deposition profile of the coating but has a more pronounced influence on thickness uniformity and the geometric characteristics of the deposition region. Among the investigated conditions, a volume fraction of 4% results in relatively better coating thickness uniformity.
Figure 6.
Characterization of nano-Al2O3 composite coatings with different nanoparticle volume fractions (feed rate = 3 g/s; air pressure = 0.2 MPa): (a) thickness variations along the x- and y-directions; (b) geometric similarity and coating uniformity; (c) geometric parameters of the deposition profiles.
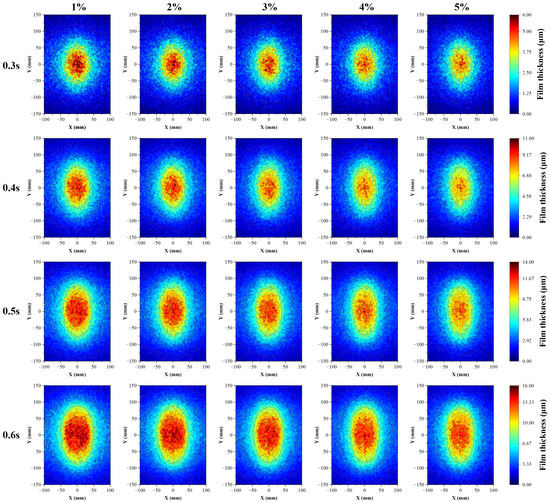
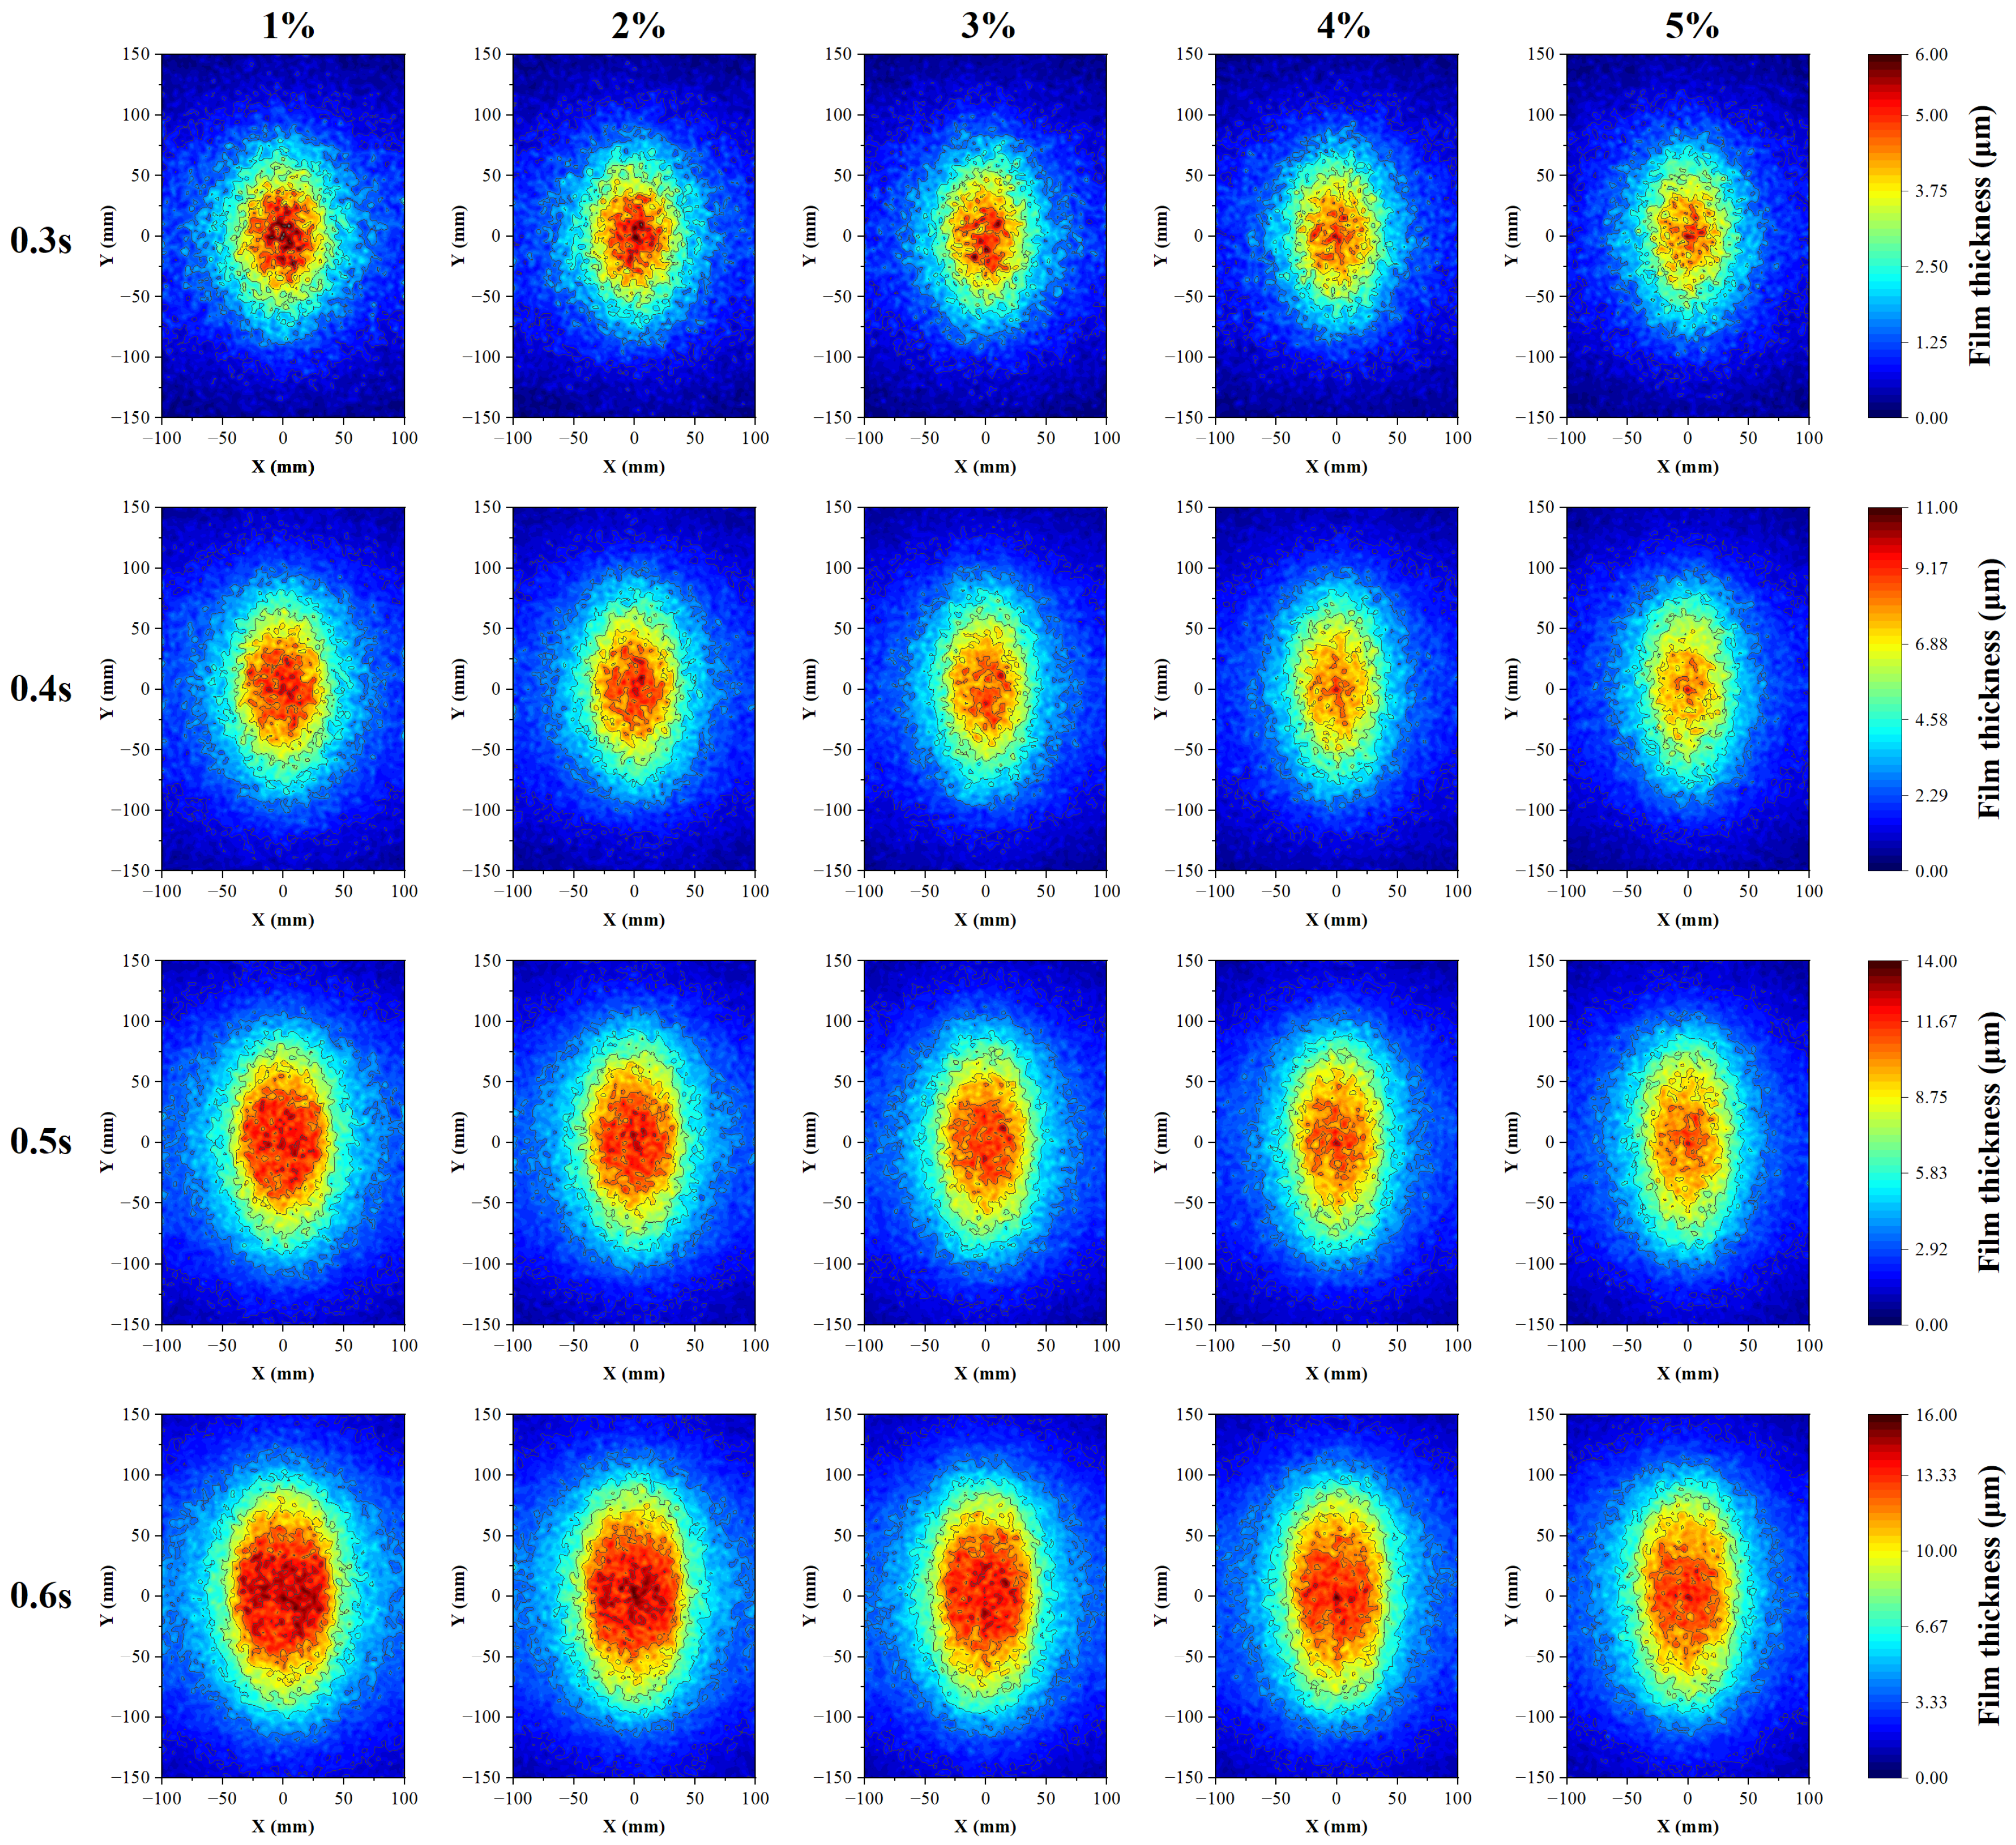
Figure 7 shows the evolution of coating thickness with spraying time at different nano-Al2O3 volume fractions. At different nano-Al2O3 volume fractions, the coatings exhibit an obvious central accumulation characteristic, with the thickness gradually decreasing from the deposition center toward the periphery and forming a nearly elliptical deposition region elongated along the y-direction. As the spraying time increases from 0.3 s to 0.6 s, the high-thickness region continuously expands outward, and the maximum coating thickness gradually increases, indicating that the continuous deposition of droplets on the substrate causes the coating to evolve from preferential accumulation in the central region to radial expansion. Notably, at the same spraying time, as the nanoparticle volume fraction increases, the central high-thickness region generally tends to shrink, the deposition contour gradually becomes more elongated, and the thickness transition between the center and the periphery becomes smoother. This indicates that increasing the nanoparticle content can, to some extent, reduce the excessive concentration of droplets in the central region and promote droplet spreading, thereby improving coating thickness uniformity. This is consistent with the lower NRMSE and coefficient of variation observed at a volume fraction of 4%. However, when the volume fraction is further increased to 5%, the thickness distribution does not continue to improve, and the non-uniformity of local deposition increases, indicating that the improvement in deposition uniformity tends to saturate at an excessively high nanoparticle content. Therefore, the nanoparticle volume fraction mainly affects the final coating morphology by altering droplet spreading between the central and peripheral regions, with 4% exhibiting better deposition uniformity and spatial distribution characteristics.
Figure 7.
Comparison of thickness contour maps of coatings with different Al2O3 nanoparticle volume fractions.
3.2. Impact of Feed Rate on Surface Quality of Coatings
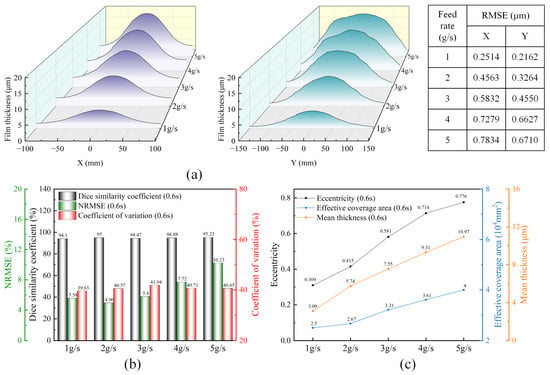
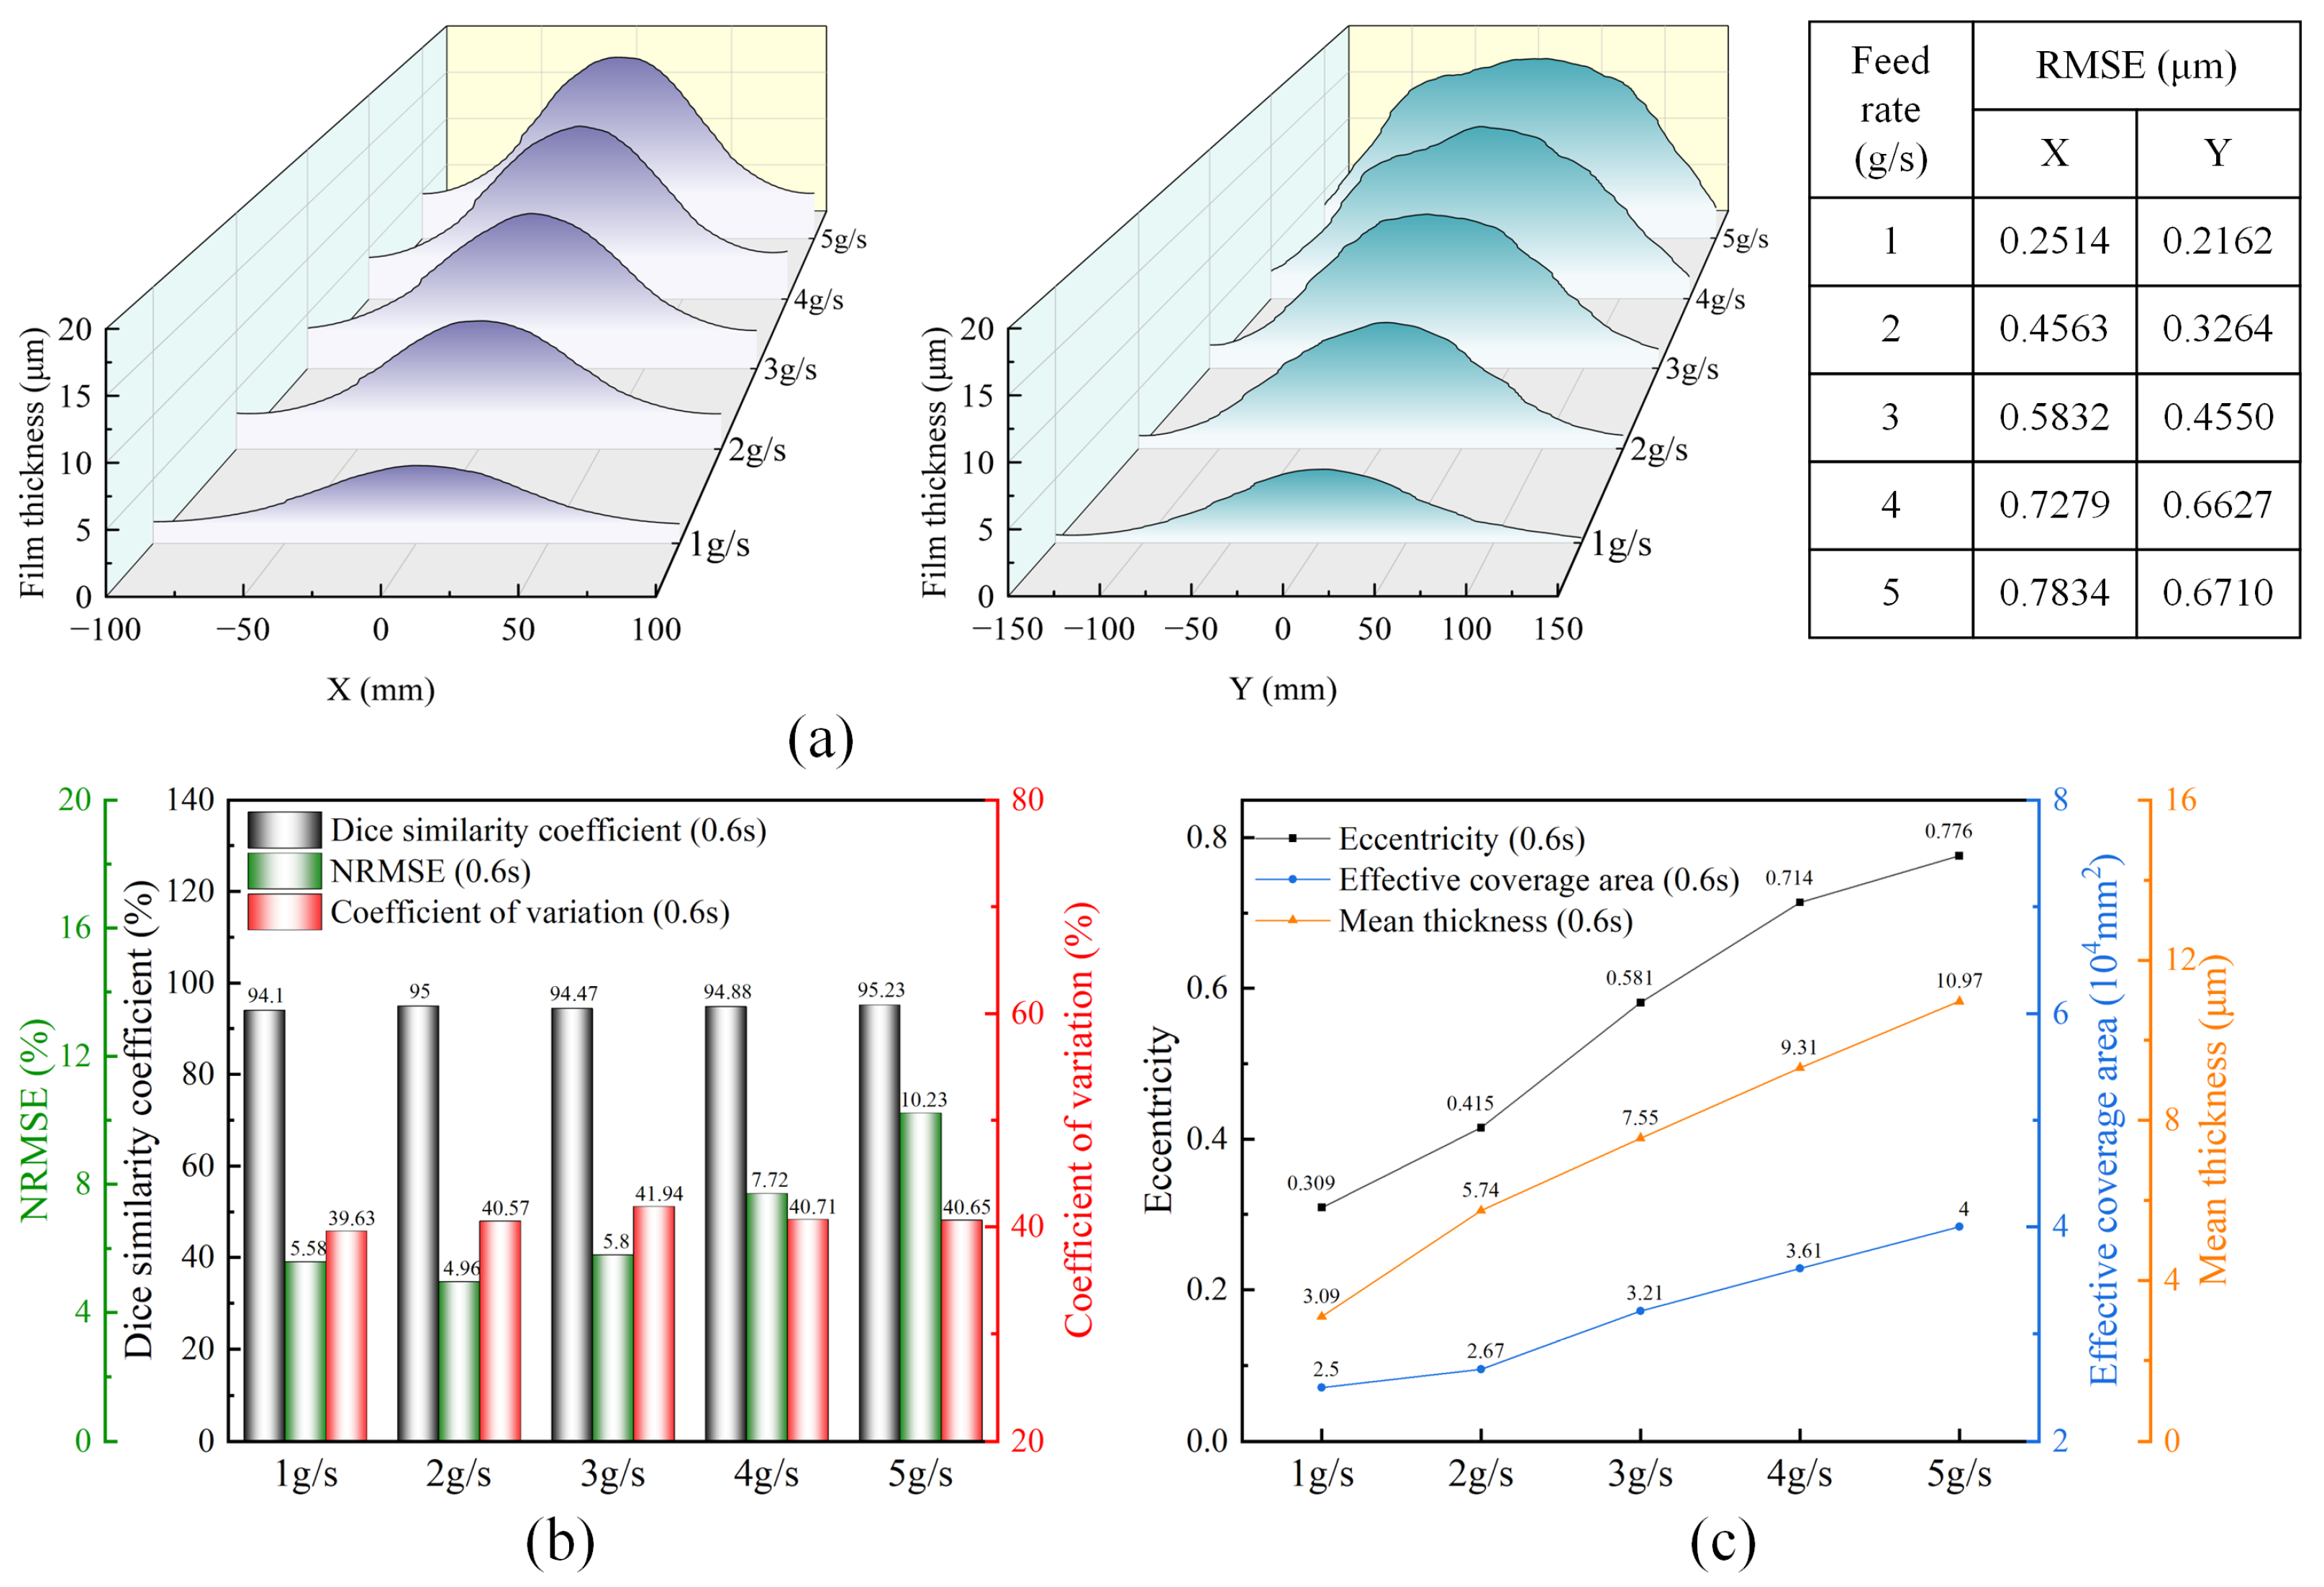
Figure 8 further analyzes the effect of feed rate on the coating deposition characteristics. As the feed rate increases from 1 g/s to 5 g/s, the thickness distributions along the x- and y-directions generally maintain similar profiles, while the RMSE values gradually increase, indicating an increase in the deviation of the local thickness distribution at higher feed rates. Meanwhile, the CV fluctuates only within the range of 39.63%–41.94%, indicating that the relative dispersion of coating thickness changes only slightly over the investigated feed-rate range. In contrast, the mean thickness continuously increases from 3.09 μm to 10.97 μm, the effective coverage area expands from 2.5 × 104 mm2 to 4 × 104 mm2, and the eccentricity increases from 0.309 to 0.776, indicating that increasing the feed rate not only promotes coating thickness accumulation and expansion of the deposition region, but also causes the deposition contour to extend further along the preferential direction. This is mainly because an increase in feed rate increases the deposition mass flux reaching the substrate surface per unit time, thereby accelerating coating deposition. However, at higher feed rates, the rate of thickness accumulation is faster than the lateral spreading of droplets, resulting in a marked increase in NRMSE and reflecting a certain trade-off between coating thickness growth and distribution uniformity.
Figure 8.
Characterization of nano-Al2O3 composite coatings at various feed rates (nanoparticle volume fraction = 3%; air pressure = 0.2 MPa): (a) thickness variations along the x- and y-directions; (b) geometric similarity and coating uniformity; (c) geometric parameters of the deposition profiles.
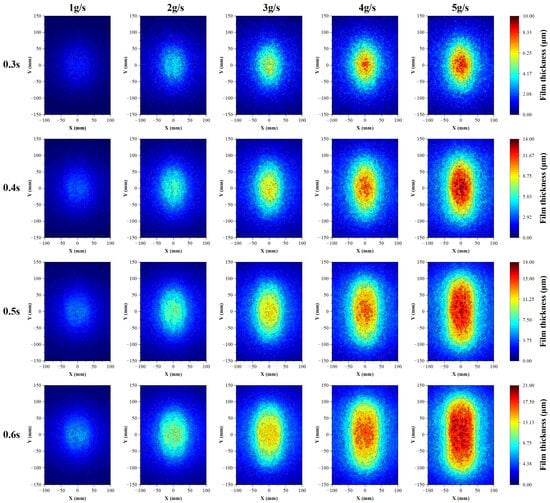
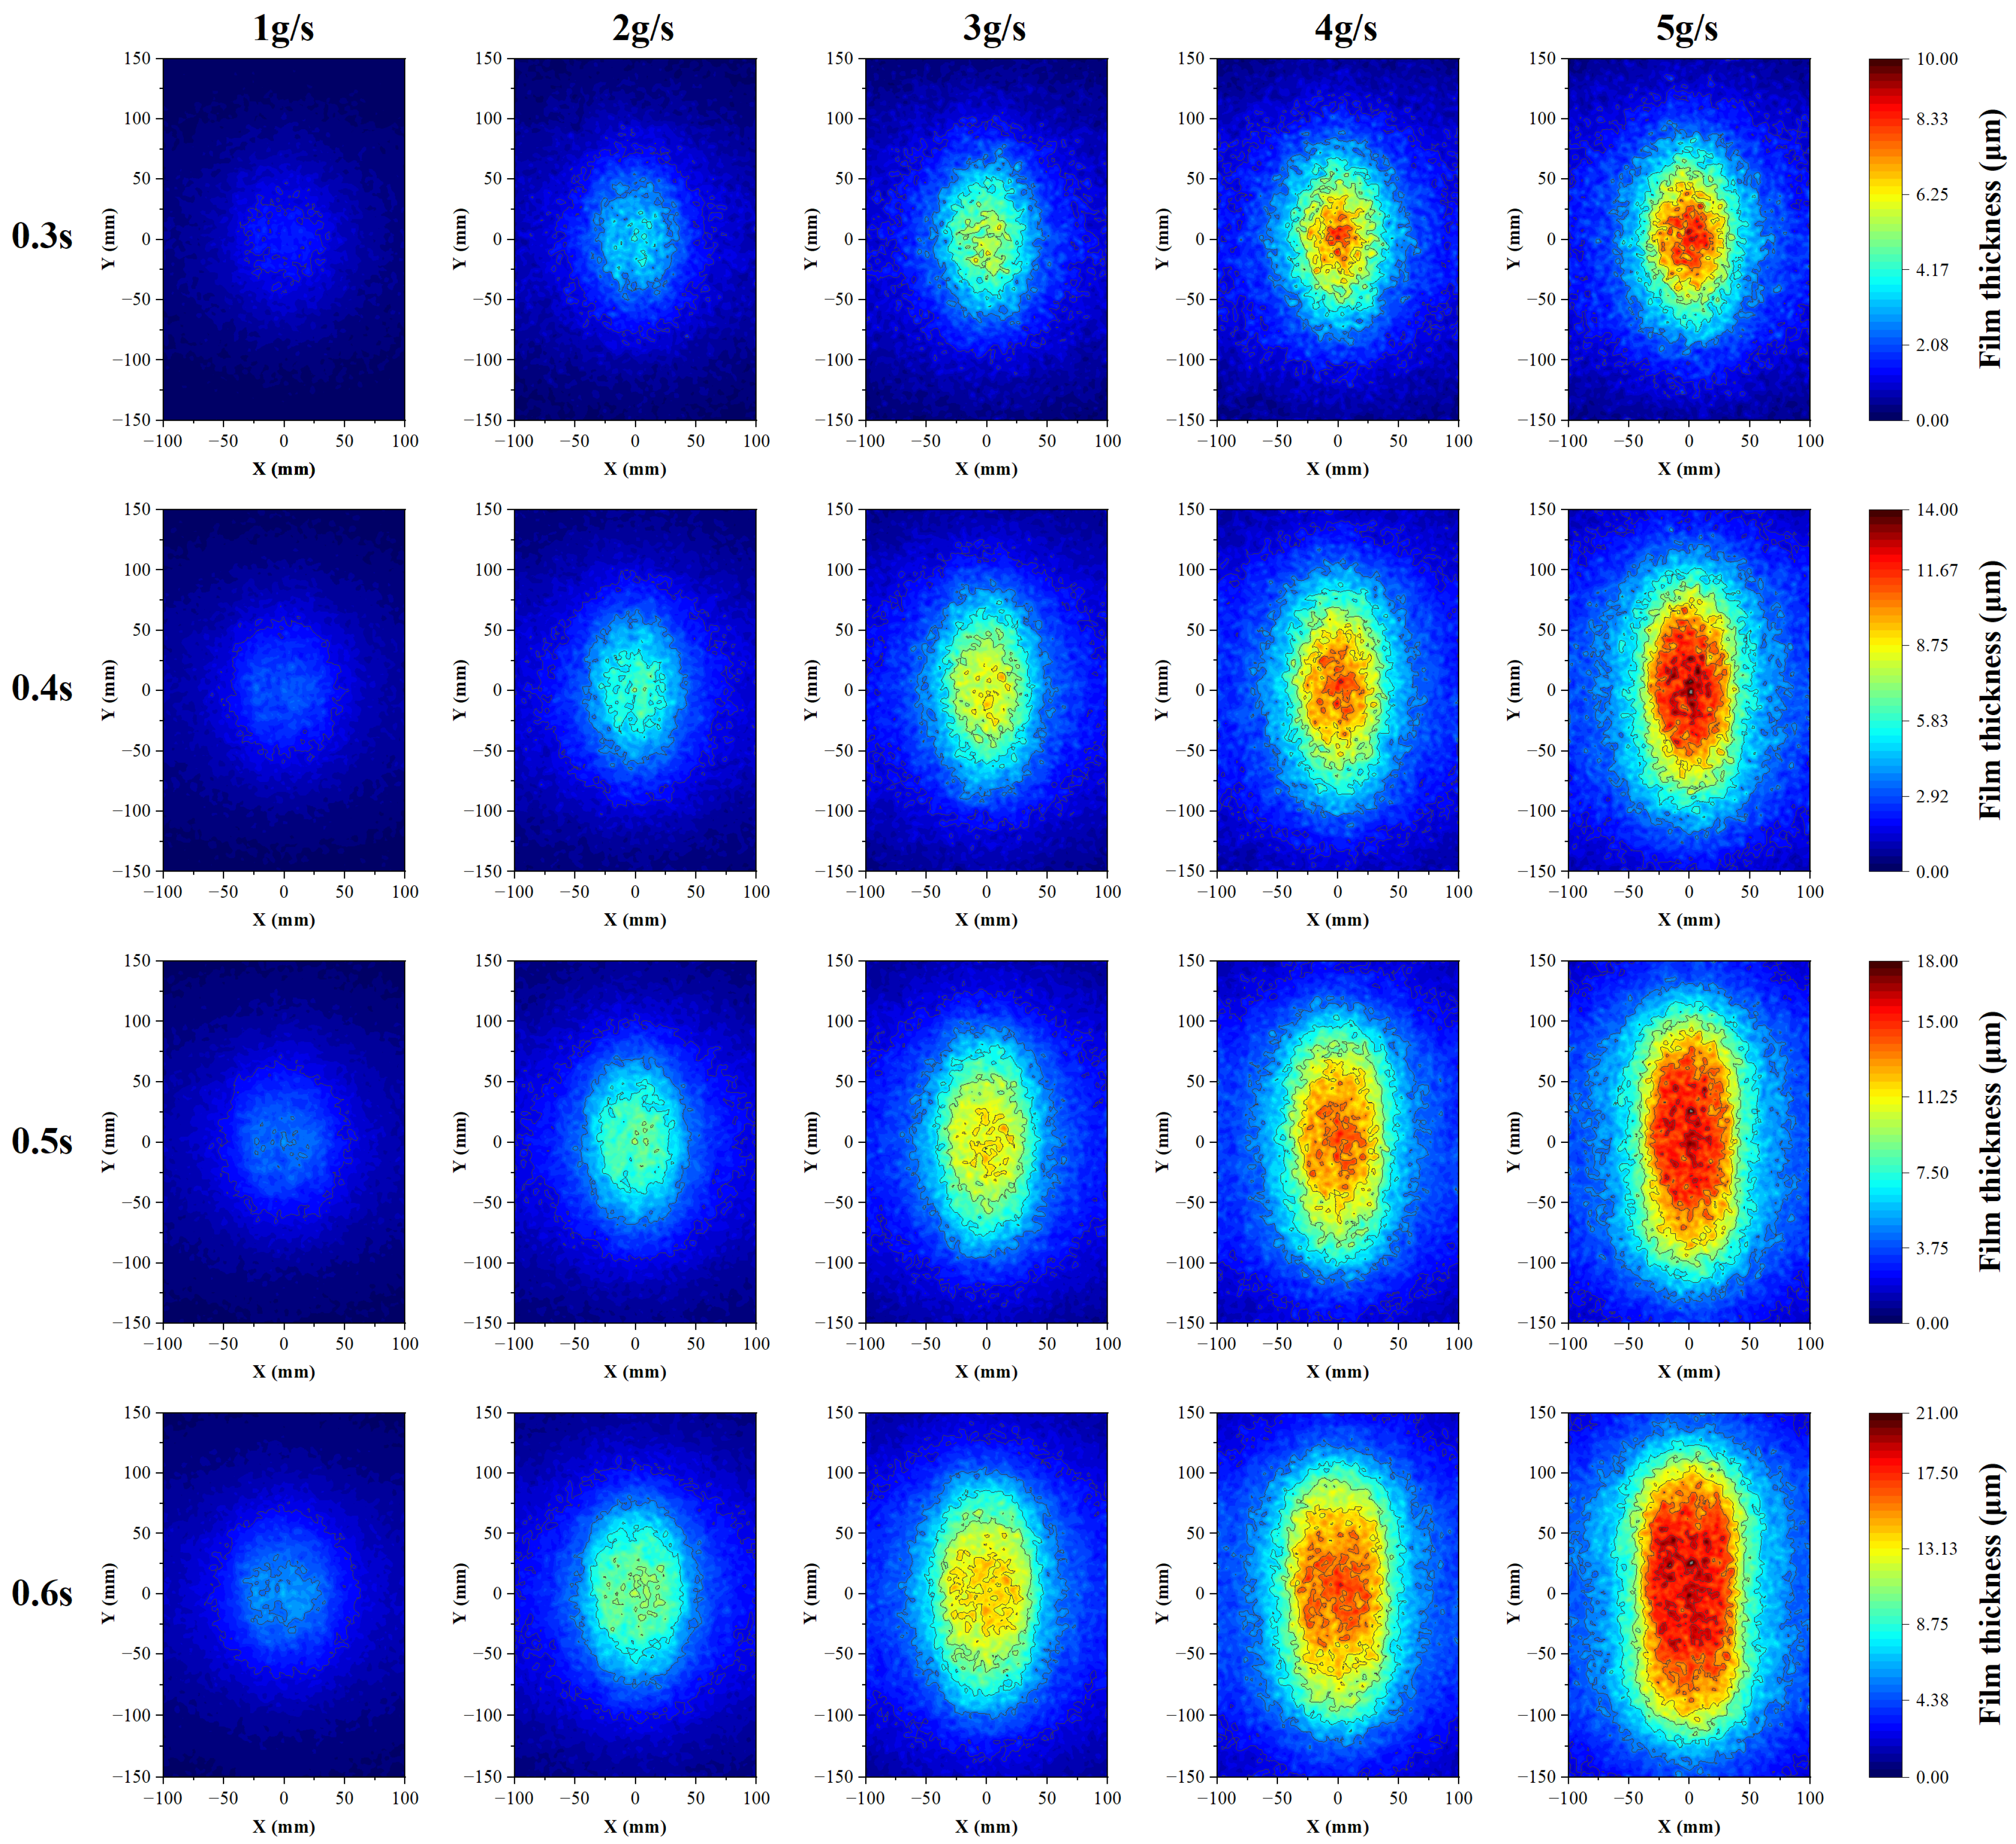
Figure 9 visually shows the evolution of coating thickness with spraying time at different feed rates. At the same feed rate, as the spraying time increases from 0.3 s to 0.6 s, the central high-thickness region gradually becomes more pronounced and expands toward the periphery, indicating that continuous droplet deposition leads to the progressive accumulation and growth of the coating. At the same spraying time, increasing the feed rate significantly enlarges the effective deposition region and enhances thickness accumulation in the central region. In particular, at 4 g/s–5 g/s, the high-thickness region becomes more pronounced and exhibits a stronger extension along the y-direction, which is consistent with the increases in effective coverage area and eccentricity with increasing feed rate shown in Figure 8. This is because, as the feed rate increases, the number of droplets entering the atomization flow field and reaching the substrate surface per unit time increases, resulting in a higher droplet deposition flux and thereby promoting both the thickness growth and lateral expansion of the coating. However, a higher droplet deposition flux also enhances local accumulation in the central region, making the thickness difference between the center and the edge more pronounced, which is consistent with the increase in NRMSE at higher feed rates. Therefore, increasing the feed rate can effectively increase the coating thickness and coverage area, but an excessively high feed rate intensifies local deposition and is unfavorable for further improvement in coating thickness uniformity.
Figure 9.
Comparison of thickness contour maps of nano-Al2O3 composite coatings under different feed rates.
3.3. Impact of Air Pressure on Surface Quality of Coatings
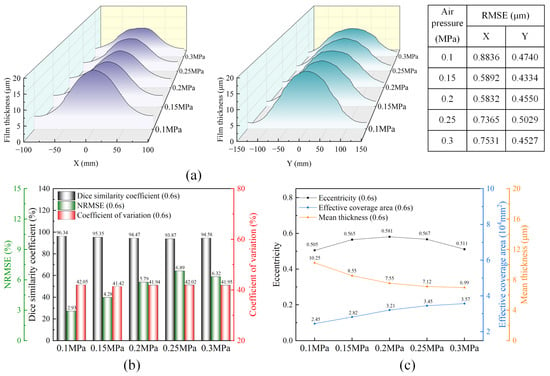
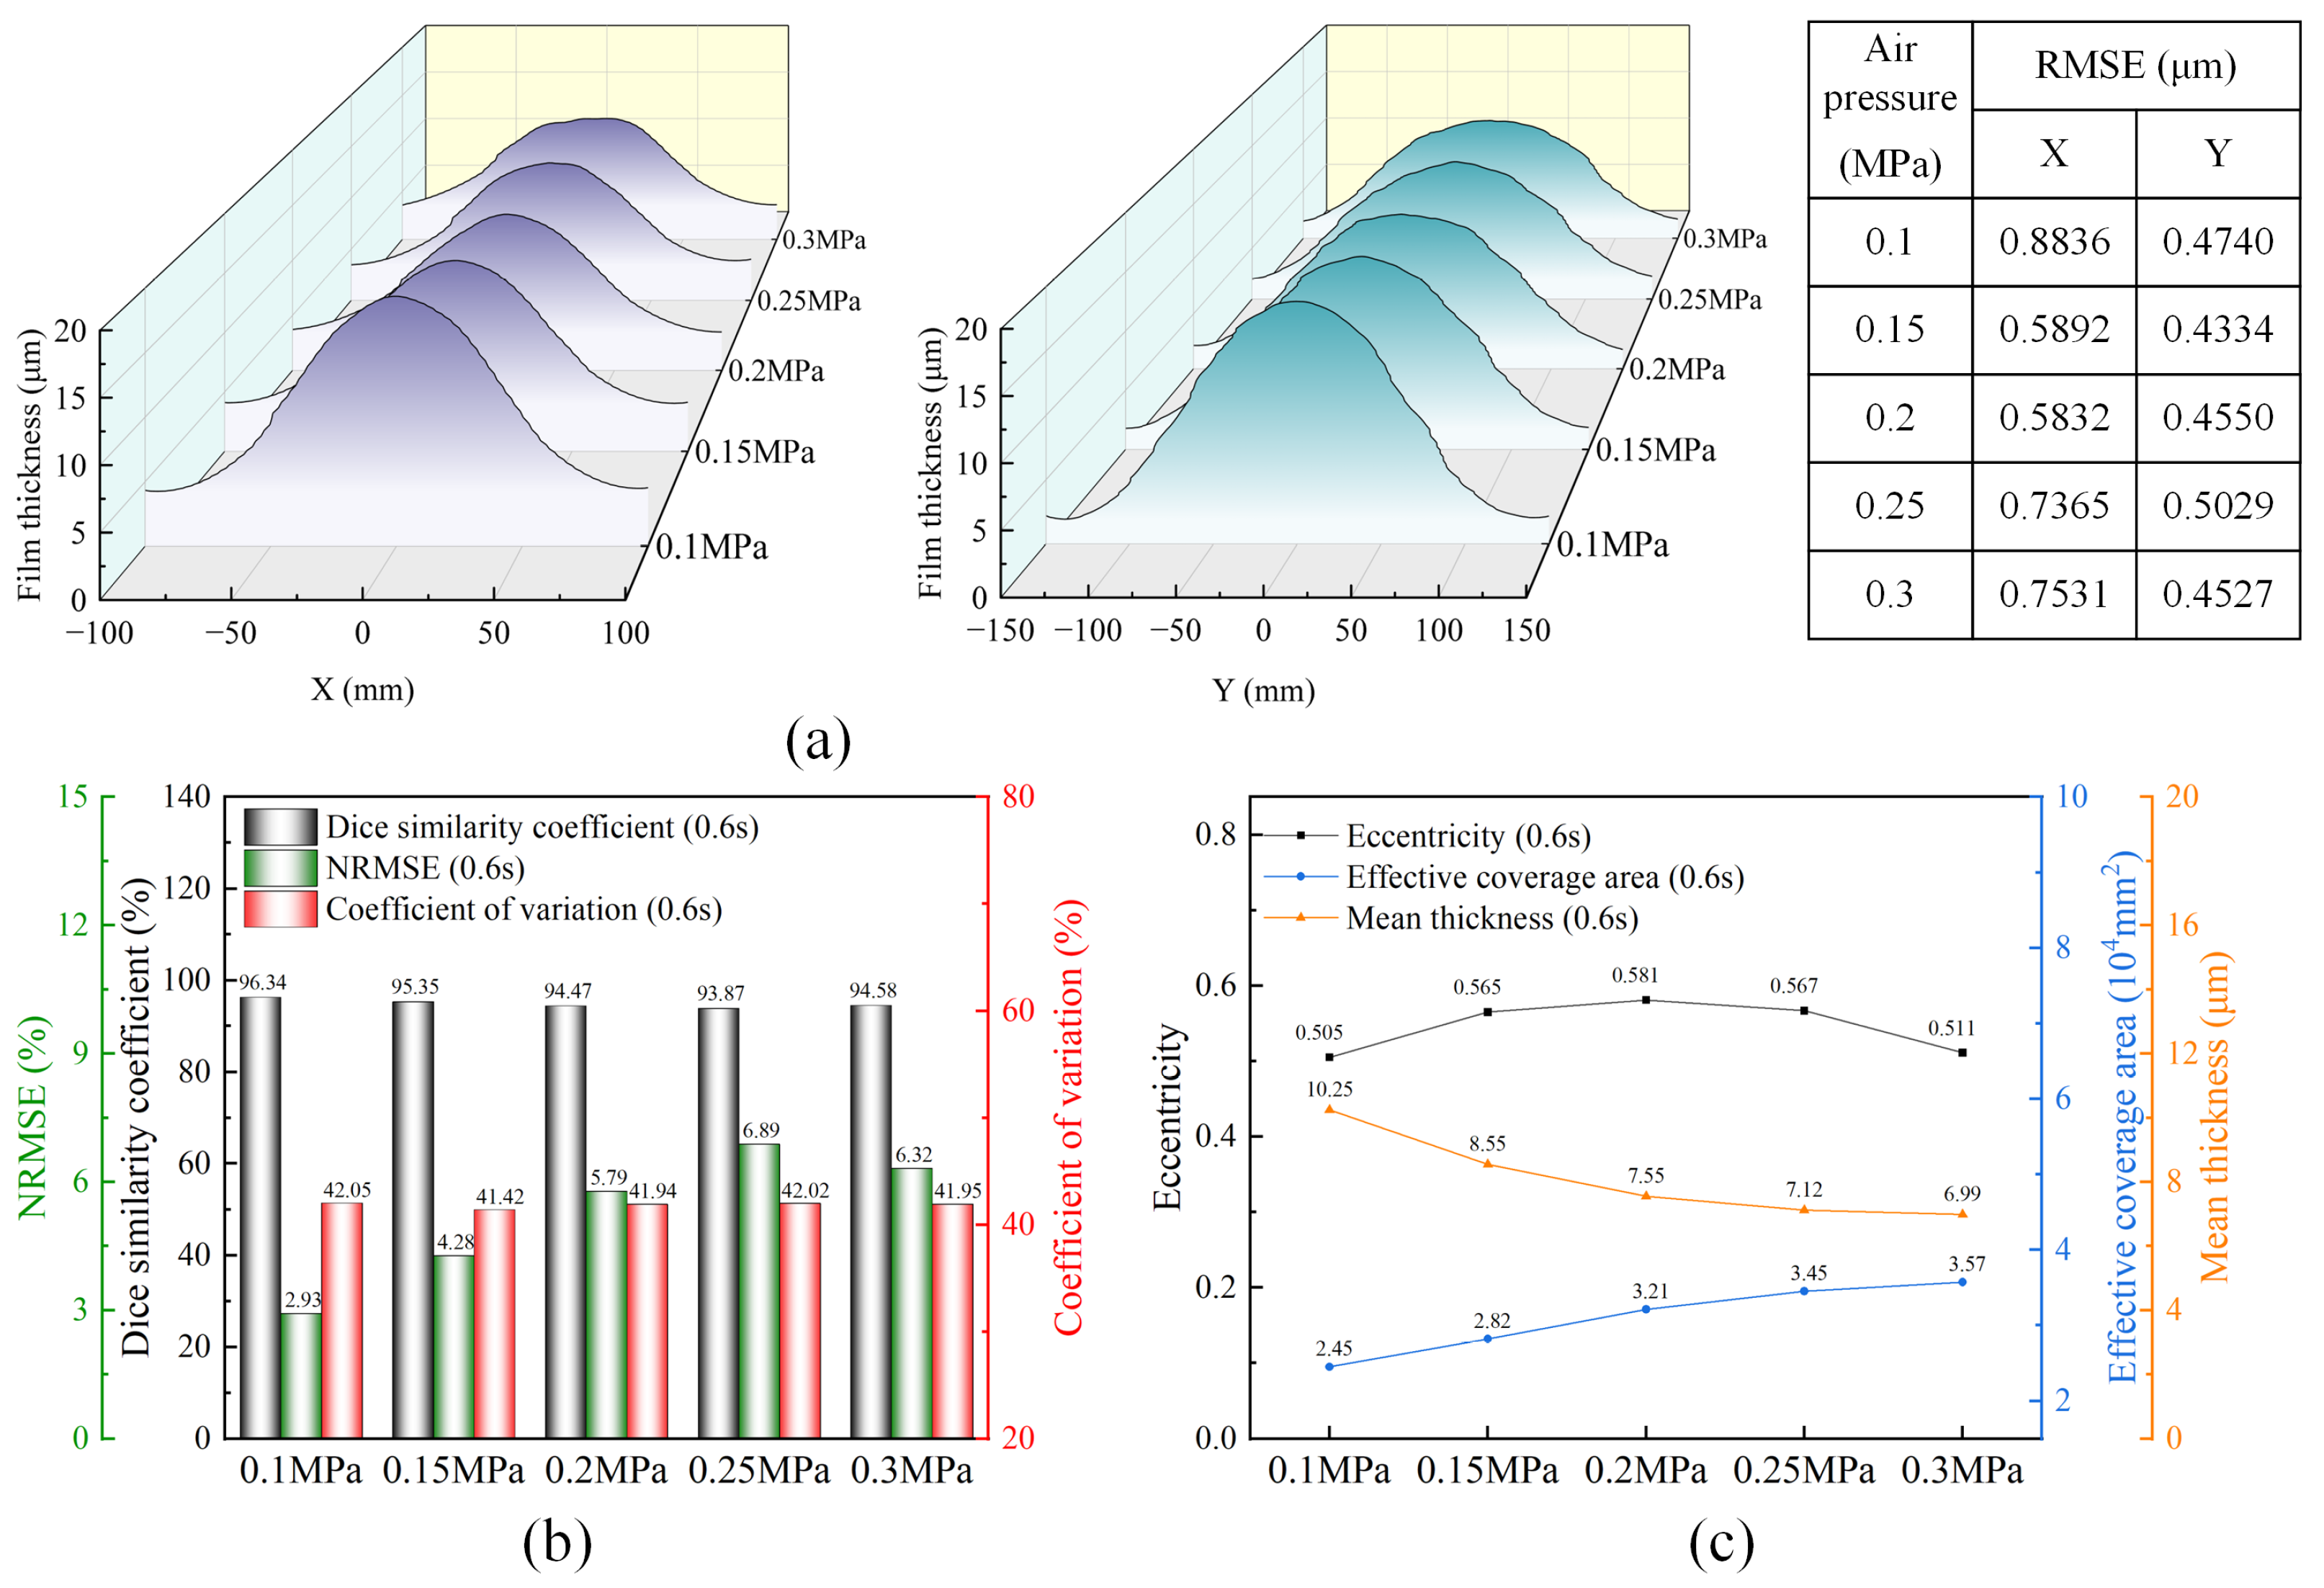
Figure 10 shows the effect of air pressure on the coating deposition characteristics. As shown in Figure 10a, under different air pressures, the coating thickness along both the x- and y-directions maintains the basic distribution characteristic of being thicker at the center and gradually flattening toward both sides. However, as the air pressure increases, the thickness distribution curves gradually broaden while the peak values decrease, indicating that the deposited droplets gradually spread from the central region over a larger area. The RMSE values in both the x- and y-directions fluctuate with air pressure. The x-direction RMSE reaches a relatively low value at 0.2 MPa, while the y-direction RMSE is relatively low near 0.15 MPa, indicating that moderate air pressure is beneficial for maintaining a relatively stable directional thickness distribution. As shown in Figure 10b, the CV remains stable at approximately 41%–42%, indicating that although air pressure changes the coating thickness and coverage area, the effect of air pressure on the relative dispersion of coating thickness is relatively limited. In contrast, the NRMSE generally increases from 2.93% at 0.1 MPa and reaches 6.89% at 0.25 MPa, indicating that as the deposition region expands, the deviation of the thickness distribution relative to the reference characteristics increases. Figure 10c further shows that when the air pressure increases from 0.1 MPa to 0.3 MPa, the effective coverage area increases from 2.45 × 104 mm2 to 3.57 × 104 mm2, while the mean thickness continuously decreases from 10.25 μm to 6.99 μm. This indicates that as the air pressure increases, the coating coverage area gradually expands, while the mean thickness gradually decreases. The eccentricity increases from 0.505 to 0.581 at 0.2 MPa and then decreases to 0.511, indicating that the directional expansion of the deposition region is more pronounced at moderate air pressure. With a further increase in air pressure, droplet dispersion in different directions is enhanced, resulting in a more balanced deposition contour.
Figure 10.
Characterization of nano-Al2O3 composite coatings at various air pressures (nanoparticle volume fraction = 3%; feed rate = 3 g/s): (a) thickness variations along the x- and y-directions; (b) geometric similarity and coating uniformity; (c) geometric parameters of the deposition profiles.
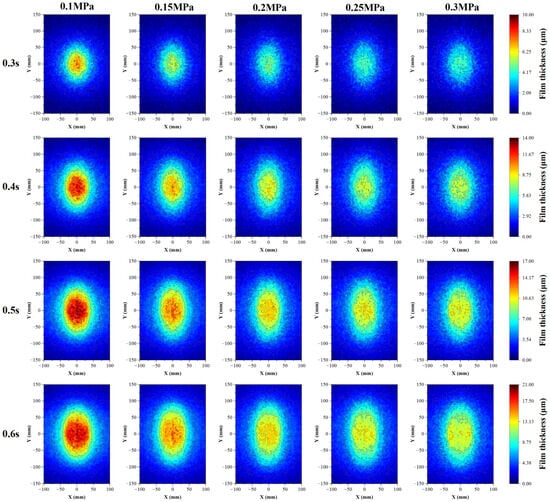
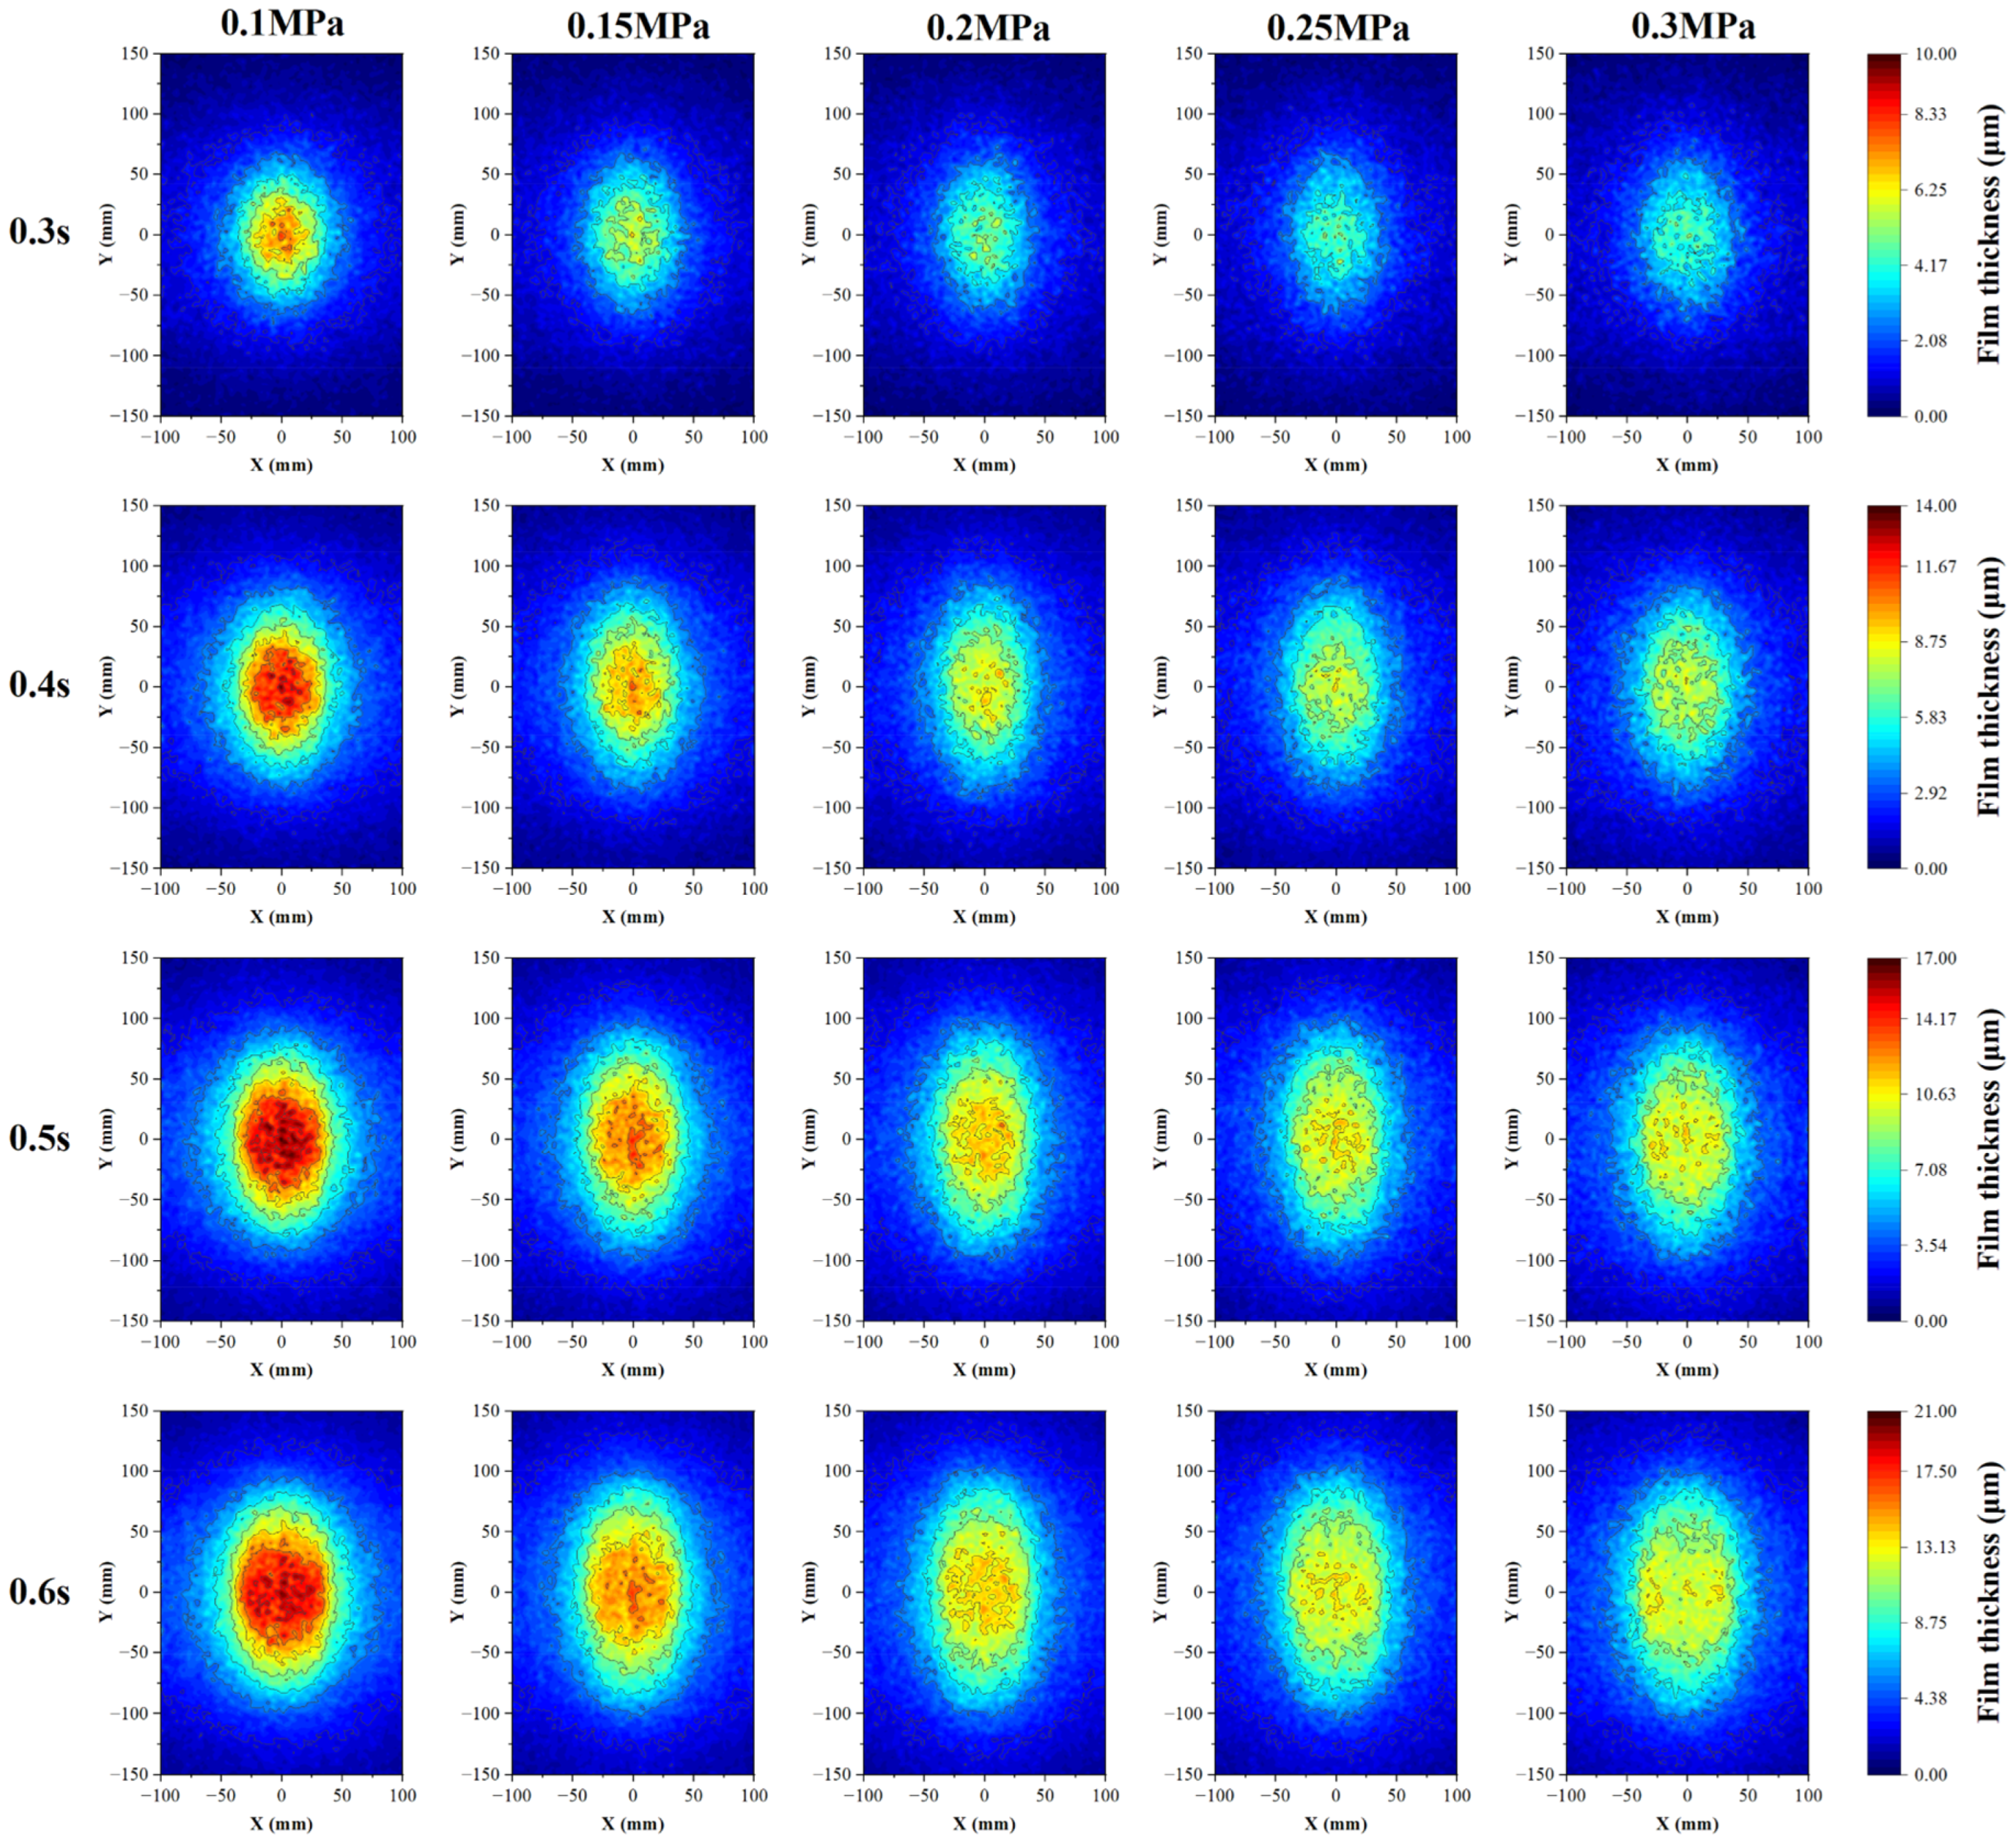
Figure 11 further illustrates the spatial evolution of coating thickness with spraying time under different air pressures. Under all air-pressure conditions, as the spraying time increases from 0.3 s to 0.6 s, the coating thickness continuously increases and the deposition region gradually expands toward the periphery, indicating that coating thickness growth is still dominated by the continuous impingement, spreading, and accumulation of droplets. However, at the same spraying time, distinct differences in deposition morphology are observed at different air pressures. At 0.1 MPa, the droplets are mainly concentrated in the central region, resulting in a relatively small but thick deposition region. As the air pressure increases, the central high-thickness region gradually diminishes, while the medium- and low-thickness regions expand noticeably toward the periphery. This trend becomes particularly pronounced at 0.25 MPa–0.3 MPa, which is consistent with the decrease in mean thickness and the increase in effective coverage area shown in Figure 10. This behavior may be attributed to the enhanced momentum exchange between the airflow and droplets at higher air pressures. On the one hand, the increased air pressure promotes droplet breakup and atomization into finer droplets; on the other hand, it enhances the lateral dispersion of droplets within the atomization flow field, allowing them to cover a larger substrate area. As the deposited droplets are distributed over a larger area, the amount of droplet accumulation per unit area decreases accordingly, thereby suppressing thickness growth in the central region and reducing the mean coating thickness. Therefore, air pressure primarily regulates the spatial dispersion of droplet deposition: lower air pressures tend to produce a more concentrated and thicker coating, whereas higher air pressures favor a larger effective coverage area at the expense of the deposited thickness per unit area.
Figure 11.
Comparison of thickness contour maps of nano-Al2O3 composite coatings under different air pressures.
3.4. Dimensionless Analysis and Comparison of Parametric Trends
The calculated dimensionless numbers under different operating conditions are summarized in Table 4. As the nanoparticle volume fraction increases, both and gradually decrease, reflecting the changes in suspension properties and the corresponding reduction in nozzle-exit velocity. In contrast, increasing the liquid feed rate substantially increases and We because of the higher nozzle-exit velocity, indicating enhanced inertial effects during atomization. Meanwhile, remains constant for the feed-rate series because the suspension properties are unchanged. For different air-pressure conditions, the liquid-side dimensionless numbers remain unchanged because , , and are determined by the suspension properties and liquid velocity at the nozzle exit. Therefore, the effect of atomizing air pressure is primarily associated with gas–liquid aerodynamic interactions rather than changes in the liquid-side dimensionless parameters. To further place the model-predicted parametric trends in the context of previous studies, the present results were compared with those reported by Li et al. (2025) [13], as summarized in Table 5.
Table 4.
Calculated dimensionless numbers under different spraying conditions.
Table 5.
Comparison of parametric analysis and model-predicted trends with Li et al. (2025) [13].
4. Conclusions
In this study, CFD was employed to simulate the air-assisted spray deposition of nano-Al2O3 suspensions, with method validation conducted by comparing the predicted spray cone angles with infrared thermographic measurements. The effects of nanoparticle volume fraction, feed rate, and air pressure on the deposition morphology and coating thickness distribution were systematically investigated. The main conclusions are as follows:
- (1)
- Nanoparticle volume fraction mainly affects coating thickness uniformity, while the overall deposition profile remains relatively unchanged. Increasing the volume fraction from 1% to 4% reduced the NRMSE from 6.44% to 5.52% and the CV from 43.32% to 38.90%. Among the investigated volume fractions, 4% yields the lowest NRMSE and CV values, indicating relatively improved coating thickness uniformity within the parameter range considered.
- (2)
- Increasing the feed rate from 1 g/s to 5 g/s increased the mean coating thickness from 3.09 μm to 10.97 μm and the effective coverage area from 2.5 × 104 mm2 to 4 × 104 mm2. However, higher feed rates also intensified central accumulation and local thickness deviations, indicating a trade-off between deposition efficiency and thickness uniformity.
- (3)
- Increasing the air pressure from 0.1 MPa to 0.3 MPa enhanced droplet dispersion, increasing the effective coverage area from 2.45 × 104 mm2 to 3.57 × 104 mm2 while decreasing the mean coating thickness from 10.25 μm to 6.99 μm. Thus, higher air pressure promotes broader deposition coverage but reduces coating thickness.
Although the present numerical study provides insights into the effects of nanoparticle volume fraction and spraying parameters on coating deposition characteristics, several limitations remain. The nanoparticle suspension was treated as a homogeneous effective fluid, without explicitly considering nanoparticle agglomeration and sedimentation during spraying. Furthermore, partial solvent evaporation during droplet flight was not explicitly considered in the present isothermal model. The evaporation-induced changes in droplet temperature and local solvent concentration may modify the effective viscosity and surface tension of the suspension, thereby affecting droplet breakup and transport behavior. These effects may contribute to the slight discrepancy between the numerical and experimental spray cone angles. In addition, the present work mainly focused on stationary spraying conditions, whereas practical coating processes may involve additional factors such as spray gun movement, trajectory, spray overlap, and complex substrate geometries. Future work will incorporate improved suspension models and experimental measurements to further investigate particle aggregation effects and coating thickness uniformity under dynamic spraying and complex surface conditions.
Author Contributions
Writing—review & editing, validation, supervision, methodology, funding acquisition, Z.L.; writing—original draft, methodology, software, investigation, formal analysis, data curation, conceptualization, T.Z.; visualization, methodology, funding acquisition, project administration, M.W.; project administration, funding acquisition, H.L.; project administration, funding acquisition, D.S.; visualization, funding acquisition, J.X.; methodology, funding acquisition, project administration, writing—review & editing, S.Z. All authors have read and agreed to the published version of the manuscript.
Funding
This work has been funded by the Foundation for Fundamental Research of China (grant number JCKY2023603A002), Doctoral Start-up Foundation of Liaoning Province (grant number 2025-BS-0318), Doctoral Start-up Foundation of Liaoning Province (grant number 2025-BSLH-333), and Basic scientific research expenses of Liaoning Provincial Department of Education (grant number LJ212610143049).
Institutional Review Board Statement
Not applicable.
Informed Consent Statement
Not applicable.
Data Availability Statement
Data will be made available on request.
Conflicts of Interest
The authors declare no conflicts of interest.
References
- Dai, C.; Ding, M.; Zhu, G.; Chen, X.; Paramane, A. Enhanced Interface Effect on Charge Dynamics and Thermal Properties of Epoxy Nanocomposites with Plasma-Treated Nano-Alumina at High Temperature. Surf. Interfaces 2023, 42, 103322. [Google Scholar] [CrossRef] [Scilit]
- Dhanapal, D.; Srinivasan, A.; Rajarathinam, M.; Muthukaruppan, A. Evaluation of Augmented Thermal, Thermo-Mechanical, Mechanical Properties of Nano Alumina Reinforced TGDDM Epoxy Nanocomposites. High Perform. Polym. 2023, 35, 313–323. [Google Scholar] [CrossRef] [Scilit]
- Huang, J.; Liu, K.; Song, X.; Zheng, G.; Chen, Q.; Sun, J.; Jin, H.; Jiang, L.; Jiang, Y.; Zhang, Y.; et al. Incorporation of Al2O3, GO, and Al2O3@GO Nanoparticles into Water-Borne Epoxy Coatings: Abrasion and Corrosion Resistance. RSC Adv. 2022, 12, 24804–24820. [Google Scholar] [CrossRef] [Scilit]
- Liang, X.; Hua, C.; Zhang, M.; Zheng, Y.; Song, S.; Cai, M.; Huang, Y.; He, C.; Fan, X. Preparation of Anticorrosive Epoxy Nanocomposite Coating Modified by Polyethyleneimine Nano-Alumina. Coatings 2023, 13, 561. [Google Scholar] [CrossRef] [Scilit]
- Dandan Doganci, M.; Sevinç, H. Investigation of Superhydrophobic and Anticorrosive Epoxy Films with Al2O3 Nanoparticles on Different Surfaces. ACS Omega 2023, 8, 21559–21570. [Google Scholar] [CrossRef] [Scilit]
- Abd El-Aziz, K.; Megahed, M.; Saber, D. Mechanical Properties and Corrosion Protection Performance of Micro/Nano Alumina Fillers Coated Steel. Polym. Compos. 2024, 45, 989–998. [Google Scholar] [CrossRef] [Scilit]
- Attia, M.; Mohamed, M.B.I.; Hegazy, M.A.; Ghobashy, M.M.; El-Wahab, H.A.; Abdelhai, F. Enhancing Corrosion Resistance with Chemically Modified Aluminum Oxide in UV-Curable Coatings Applied to Steel Surfaces. Sci. Rep. 2025, 15, 16720. [Google Scholar] [CrossRef] [Scilit]
- Huynh, M.D.; Chinh, N.T.; Nguyen, A.S.; Duong, N.T.; Thai, N.X.; Giang, N.V.; Hoang, T. Mechanical, Thermal and Corrosion-Resistant Properties of Epoxy Coatings Reinforced with γ-Al2O3 Modified with Titanate Coupling Agent. Surf. Coat. Technol. 2026, 531, 133600. [Google Scholar] [CrossRef] [Scilit]
- Matsushita, Y.; Katayama, T.; Saito, Y.; Matsukawa, Y.; Okabe, T.; Shirota, M.; Inamura, T.; Daikoku, M.; Fukuno, J.; Aoki, H. A Spray Painting Simulation Using High-Speed Rotary Atomizer—Model Development and Comparison of LES and RANS—. Results Eng. 2024, 21, 101697. [Google Scholar] [CrossRef] [Scilit]
- Han, D.; Zeng, Y.; Gu, J.; Yan, B. Investigation of the Film Formation in Dynamic Air Spray Painting. Fluid Dyn. Mater. Process. 2024, 20, 2393–2415. [Google Scholar] [CrossRef] [Scilit]
- Zhao, J.; Fu, L.; Ding, H.; Bai, B.; Zhang, D.; Liu, J.; He, X. Numerical Simulation of Working Process and Gas-Liquid Interaction Mechanism of Air Assisted Nozzle. Int. J. Multiph. Flow 2023, 164, 104453. [Google Scholar] [CrossRef] [Scilit]
- Liu, Z.; Chen, J.; Guo, J.; Qiu, B. Numerical Simulation and Validation of Droplet Deposition on Tomato Leaf Surface under Air-Assisted Spraying. Agronomy 2024, 14, 1661. [Google Scholar] [CrossRef] [Scilit]
- Li, P.; Jiang, D.; Xu, C.; Su, Z. The Influence of Process Parameters on Flow-Field Characteristics and Coating Properties in Nanocomposite Spray Deposition. J. Manuf. Process. 2025, 141, 1716–1728. [Google Scholar] [CrossRef] [Scilit]
- Gonçalves, F.A.M.M.; Trindade, A.R.; Costa, C.S.M.F.; Bernardo, J.C.S.; Johnson, I.; Fonseca, I.M.A.; Ferreira, A.G.M. PVT, Viscosity, and Surface Tension of Ethanol: New Measurements and Literature Data Evaluation. J. Chem. Thermodyn. 2010, 42, 1039–1049. [Google Scholar] [CrossRef] [Scilit]
- Liao, G.; Wang, W.; Zhang, F.; Chen, J.; Leng, E. Thermal Performance of Lithium-Ion Battery Thermal Management System Based on Nanofluid. Appl. Therm. Eng. 2022, 216, 118997. [Google Scholar] [CrossRef] [Scilit]
- Zhang, Q.; Fan, L.; Wang, H.; Han, H.; Zhu, Z.; Zhao, X.; Wang, Y. A Review of Physical and Chemical Methods to Improve the Performance of Water for Dust Reduction. Process Saf. Environ. Prot. 2022, 166, 86–98. [Google Scholar] [CrossRef] [Scilit]
- Zhu, H.; Pan, G.; Zhu, W.; Jiang, B.; Wu, N.; Yuan, L. Study on Competitive Adhesion of Coal Dust on Water Droplet. Fuel 2023, 331, 125928. [Google Scholar] [CrossRef] [Scilit]
- Stone, L.; Hastie, D.; Zigan, S. Using a Coupled CFD-DPM Approach to Predict Particle Settling in a Horizontal Air Stream. Adv. Powder Technol. 2019, 30, 869–878. [Google Scholar] [CrossRef] [Scilit]
- Peng, H.; Peng, Y.; Nie, W.; Liu, F.; Xu, C. Atomization Law and Dust Reduction Effect of Air-Atomizing Nozzles Determined by CFD and Experiments. Energy 2025, 318, 134822. [Google Scholar] [CrossRef] [Scilit]
- Seidel, T.; Krishnamoorthy, G.; Seames, W.S. Characterizing Flame Stability and Radiative Heat Transfer in Non-Swirling Oxy-Coal Flames Using Different Multiphase Modeling Frameworks. Fuel 2019, 256, 115948. [Google Scholar] [CrossRef] [Scilit]
- Hou, J.; Li, S.; Hu, S.; Cheng, H.; Han, M.; Gui, C.; Guo, Q.; Yuan, L.; Zhou, F. Research and Application of Self-Powered Induction Spray Dust Removal System for Long-Distance Belt Conveying in Underground Coal Mines. Process Saf. Environ. Prot. 2023, 176, 131–139. [Google Scholar] [CrossRef] [Scilit]
- Chen, B.; Lu, Y.; Li, W.; Dai, X.; Hua, X.; Xu, J.; Wang, Z.; Zhang, C.; Gao, D.; Li, Y.; et al. DPM-LES Investigation on Flow Field Dynamic and Acoustic Characteristics of a Twin-Fluid Nozzle by Multi-Field Coupling Method. Int. J. Heat Mass Transf. 2022, 192, 122927. [Google Scholar] [CrossRef] [Scilit]
- Brinkman, H.C. The Viscosity of Concentrated Suspensions and Solutions. J. Chem. Phys. 1952, 20, 571. [Google Scholar] [CrossRef] [Scilit]
- Machrafi, H. Surface Tension of Nanoparticle Dispersions Unravelled by Size-Dependent Non-Occupied Sites Free Energy versus Adsorption Kinetics. npj Microgravity 2022, 8, 47. [Google Scholar] [CrossRef] [Scilit]

Disclaimer/Publisher’s Note: The statements, opinions and data contained in all publications are solely those of the individual author(s) and contributor(s) and not of MDPI and/or the editor(s). MDPI and/or the editor(s) disclaim responsibility for any injury to people or property resulting from any ideas, methods, instructions or products referred to in the content. |
© 2026 by the authors. Licensee MDPI, Basel, Switzerland. This article is an open access article distributed under the terms and conditions of the Creative Commons Attribution (CC BY) license.