


Abstract
Detecting airborne viruses is important for preventing infectious disease outbreaks, but conventional workflows require aerosol collection and downstream processing. Here, we developed a proof-of-concept spiral microchannel chip integrating aerosol capture and on-chip nucleic acid amplification for localized virus detection. Peripheral microwells along the outer turns served as capture sites and reaction reservoirs, while an upstream humidification pool reduced evaporation under airflow. During aspiration, curvature-induced centrifugal bias and Dean-vortex secondary flow promoted aerosol transport toward the wells. Numerical simulations and fluorescent bead experiments provided complementary evidence of particle transport and deposition near the peripheral wells. At an airflow rate of 50 mL/min, the humidification pool extended the approximate drying time from 10 to 30 min. Amplification-accessible virus-derived DNA was detected directly in the wells using recombinase polymerase amplification (RPA) with an exonuclease-cleavable fluorescent probe. End-to-end operation was demonstrated using nebulized bacteriophage T2 aerosols, with localized fluorescence observed in multiple wells after incubation at 40 °C for 30 min, without intermediate sample transfer or nucleic acid extraction. By integrating capture, humidification, and amplification on a single chip, this approach reduces operational complexity and reagent handling. These findings demonstrate the feasibility of compact, extraction-free aerosol detection and support further development toward source-proximal and distributed airborne-virus monitoring.
1. Introduction
Public health crises underscore the vital role of virus sensors in controlling and mitigating infectious disease outbreaks [1,2,3]. By detecting pathogens at an early stage, these systems guide interventions to reduce community transmission. Virus sensors use molecular recognition of viral proteins or nucleic acids from patient-derived samples [4,5]. Antibody-based immunoassays are fundamental for their selectivity and flexibility, as evidenced by their applications in lateral flow devices [6], electrochemical platforms [7], and resonant LC biosensors [8]. Aptamer-based sensors harness specificity through single-stranded DNA or RNA, offering not only high sensitivity, but also the advantages of chemical synthesis and thermal stability [9,10]. Meanwhile, techniques such as polymerase chain reaction (PCR) and isothermal amplification set benchmarks for accuracy and ultra-low detection limits in clinical specimens, including blood, saliva, and nasopharyngeal swabs [11,12,13,14,15,16,17].
For nucleic acid biosensing, sequence-specific recognition of viral DNA, or DNA generated by reverse transcription of viral RNA, is coupled to a measurable signal. PCR amplifies the target through repeated cycles of DNA denaturation, primer annealing, and extension, whereas recombinase polymerase amplification (RPA) uses recombinase-assisted primer targeting, single-stranded DNA-binding proteins, and a strand-displacing polymerase to amplify DNA at a constant temperature [18]. RPA is commonly operated at 37–42 °C, reducing the need for thermal cycling and facilitating integration into compact devices [19]. In fluorescence-based RPA, target-dependent cleavage of a fluorophore–quencher probe converts amplification into an optical readout. Combining these recognition, amplification, and readout functions with microfluidic sample handling provides a basis for integrated nucleic acid biosensors [20]. Recent reviews have highlighted the advantages of microfluidic nucleic acid biosensors, including reduced reagent consumption, simplified sample handling, and integration of amplification and detection within compact devices [21].
In addition to conventional biological samples, direct monitoring of viruses in the air enables early detection and helps prevent viral spread by proactively identifying environmental reservoirs of infection before the manifestation of symptoms [22]. For instance, air sampling in hospital patient rooms revealed the presence of severe acute respiratory syndrome coronavirus 2 (SARS-CoV-2). Reverse transcriptase quantitative PCR (RT-qPCR)-positive aerosols were detected, and their genomes matched the patient isolate, demonstrating the presence of virus-containing particles in the room air [23]. Similarly, multifloor monitoring of college dormitories showed that air samples were PCR-positive for SARS-CoV-2 when an infected student lived on the same floor, and airborne viral RNA trends mirrored subsequent spikes in clinically confirmed cases [24]. Importantly, airborne virus is not necessarily distributed uniformly within a room. Hospital measurements showed different positivity rates among sampling locations, with virus-laden aerosols concentrated near and downstream of patients [25]. This spatial heterogeneity motivates source-proximal monitoring, in which compact samplers are positioned near likely emission or interaction zones rather than relying solely on high-volume measurements of room-averaged aerosol concentrations. Such devices could also be distributed across multiple locations to capture spatially heterogeneous viral signals. Various methods have been developed to trap aerosols in real-world settings, including filter-based, impingement-based, and microfluidic-based collection systems. Filters efficiently capture particles, and impingement setups can preserve viral infectivity by minimizing mechanical stress [20,26,27], particularly when aerosol growth tube collectors are employed [28]. Microfluidic platforms integrate sampling and sensing, offering a continuous workflow [29,30,31,32,33,34]. However, most aerosol detection systems require multistep workflows (e.g., collection, extraction, and purification), which extend turnaround times and introduce the risk of sample degradation or loss. From an analytical perspective, infectious titer and amplifiable nucleic acid abundance are not equivalent. PFU quantifies infectious viral particles, whereas nucleic acid amplification can also detect genomes from non-infectious or damaged viral particles and extracellular/free nucleic acids; consequently, amplifiable genome copy numbers can exceed PFU by several orders of magnitude [35]. This distinction creates an opportunity for extraction-free detection by directly targeting the fraction of viral nucleic acids that is already accessible to amplification. Such accessible nucleic acids may originate from damaged or non-infectious viral particles or exist as extracellular/free genomes within the viral sample. Accordingly, the present approach focuses on amplification-accessible viral DNA rather than requiring complete lysis of intact infectious virions. In addition, some continuous or semi-continuous platforms rely on a constant supply of reagents or wash solutions, increasing costs, complexity, and maintenance demands.
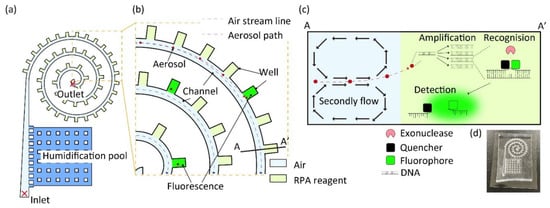
In this study, we evaluate a proof-of-concept spiral microchannel that combines aerosol deposition with on-chip DNA amplification. The spiral geometry provides a long, continuously curved flow path within a compact footprint, thereby maximizing the effective channel length per unit device area. This microchannel integrates reagent wells situated externally along its perimeter (Figure 1a). Air drawn from the inlet was humidified by the humidification pool, helping to reduce evaporation from the liquid-filled wells before exiting through the outlet. The evaporation-suppression effect was evaluated using an aqueous model, supporting the integration of humidified aerosol sampling with on-chip molecular detection without additional fluid perfusion. As aerosols pass through the spiral channel, they are subjected to centrifugal forces and vortex flow dynamics within the spiral channel, promoting their transport toward the outer wall and facilitating deposition near the peripheral wells (Figure 1b–d). Amplification-accessible virus-derived DNA delivered to the wells by sampled aerosols is amplified by RPA at 40 °C for 30 min. During amplification, target-dependent exonuclease cleavage of fluorescent probes separates fluorophores from their quenchers, generating a fluorescence signal. Compared with traditional aerosol detection techniques, this integrated approach minimizes manual handling, conserves reagents, and supports the development of compact monitoring devices. Its compact footprint may also facilitate distributed deployment for source-proximal monitoring at multiple locations.
Figure 1.
Concept of the virus sensor using spiral microchannels. (a) Schematic of the chip with a pump connected to the outlet to draw aerosol from the inlet. (b) Enlarged view of the chip. Red particles indicate aerosols, blue dotted lines indicate airstream lines, and red dotted lines reveal aerosol paths. Fluorescent signals arise from aerosols captured in the wells. (c) Cross-sectional view along line AA′ in (b), illustrating aerosol transport into the wells by secondary flow and centrifugal force. Within the wells, DNA is amplified via RPA, binds to a probe, and is recognized by exonuclease, which cleaves the fluorophore and quencher, resulting in fluorescence emission. (d) Photograph of the PDMS-based spiral microchannel chip.
2. Materials and Methods
2.1. Simulation of Aerosol Movement in a Flow Channel
All simulations were performed in COMSOL Multiphysics® v.5.0 using the Laminar Flow physics interface. Air was selected as the working fluid for the model. Geometry and boundary conditions were as follows: a single-start spiral microchannel was constructed, designating the outermost end of the spiral as the inlet and the innermost (central) end as the outlet. The channel walls were assigned a no-slip boundary condition. At the inlet, a normal inflow velocity (un) was prescribed, varying between 2 m/s and 10 m/s. The outlet was defined by a static pressure of 0 Pa, representing ambient pressure discharge. To confirm the formation of Dean vortices, velocity components parallel to planes normal to the channel axis were extracted and visualized for each inlet velocity setting. A time-dependent particle-tracing study was executed on the converged flow field. For every combination of flow-rate case and particle diameter (1, 2, 3, 4, and 5 µm), 500 spherical particles were uniformly released at the inlet cross-section. Particle material properties were assigned a density of 1000 kg/m3 (equivalent to water). Hydrodynamic drag was calculated using the Stokes’ drag law, and particles were set to become stationary upon contact with a channel wall and to remain at the contact position for the remainder of the simulation. Simulations were repeated for a series of particle diameters to quantify how particle size influences the simulated wall-contact fraction.
2.2. Experimental Setup for Aerosol Spray Testing
A vacuum desiccator (VL, AS ONE, Osaka, Japan) with a nominal internal volume of 12 L was modified to serve as the aerosol test chamber (Figure S1). A through-hole was drilled into the vacuum desiccator to allow tube passage, and a valve seat (3309, AS ONE) was fixed with screws, connected to a silicone tube. The desiccator was equipped with through-holes for the nebulizer (NE-C803, Omron, Kyoto, Japan) to facilitate diffusion, tip intake, and internal pressure adjustment. Aerosols were generated at a nominal liquid-output rate of 0.2 mL/min. The manufacturer-reported representative mass median aerodynamic diameter (MMAD) of the nebulizer aerosol is approximately 3 μm. The aerosol was captured using a microfluidic chip. A high-efficiency particulate air (HEPA) filter (Vacuum Guard, Whatman, Cytiva, Marlborough, MA, USA), mass flow controller (1SLM-Air, FCON, Nankoku, Japan), and vacuum pump (GM-20D, AS ONE) were connected to the chip; the mass flow controller controlled the intake volume to enable a constant flow rate of air to be drawn from the chip. Aerosols that could not be captured by the chip were removed using the HEPA filter, and moisture that would adversely affect the pump was removed using dry beads. Given the possibility of airflow and suction imbalance, the HEPA filter was installed in the upper through-hole to adjust the internal pressure, bringing in air from the outside during negative pressure and removing air from the inside during positive pressure.
2.3. Fluorescent Beads
Carboxylated fluorescent beads of 1 μm diameter (Sicastar Carboxylate-Modified, Micromod, Rostock, Germany) were diluted with distilled water and sprayed using a nebulizer. Aspiration with a tip was performed simultaneously with spraying, and after 1 min, the beads were observed under a fluorescence microscope (EVOS M7000, Thermo Fisher Scientific, Waltham, MA, USA).
2.4. Humidification Test
To evaluate the effect of the humidification pool on evaporation from liquid-filled wells, the wells of the spiral microchannel were filled with water colored with blue ink. Air was drawn through the device at a flow rate of 50 mL/min, either with or without water in the upstream humidification pool. Images of the wells were acquired at 1 min intervals during airflow. The blue-colored liquid area in each well was quantified by image analysis, and the areas of eight wells located along the inner and outer sides of the spiral channel were summed at each time point. The total liquid area at each time point was normalized to the initial area before airflow (t = 0 min), which was defined as 1. The resulting dimensionless metric is referred to as the normalized liquid area, A(t)/A(0). Measurements were performed on three independent chips (n = 3). The normalized liquid area was calculated for each chip, and data are presented as the mean ± 1 standard deviation (SD) across the three chips.
2.5. RPA Reaction
An oligonucleotide primer set targeting bacteriophage T2 was designed using Primer 3 [36]. The reagent contains an exonuclease; a fluorescent substance and a quencher were attached on either side of the cleavage site so that, upon amplification by RPA, cleavage of the probe would produce a fluorescence signal. The forward primer sequence was 5′-CGTGTTACTATGATTATTCTTACGGGAAAT-3′. The reverse primer sequence was 5′-ATAAAATTCTCGAGTCATTTGGAATAGGAG-3′. The probe sequence was 5′-TATGGTGTTGAAGTGAAAACCCCAGCTAGGFSQCTATCAGCAATGGCTGC-3′. F, S, and Q indicate fluorescein isothiocyanate, C3 spacer, and Black Hole Quencher, respectively. All oligonucleotides were purchased from Fasmac Co., Ltd. (Atsugi, Japan).
2.6. Virus, Host Strain, and Media
Bacteriophage T2 (NBRC 20002, Kisarazu, Japan) was used as the model virus, with Escherichia coli (BL21, COSMO BIO, Tokyo, Japan) as its host strain. The bacteriophage was propagated by infecting E. coli cultures incubated at 37 °C with shaking (200 rpm) until the logarithmic growth phase. Luria–Bertani medium (Formedium, Norfolk, UK) was used for the growth of bacteriophage-infected host cells. The bacteriophage and host bacteria were obtained from NITE Biological Resource Center and COSMO BIO.
Viral infectivity was determined using a plaque assay. The virus solution was diluted with peptone-containing saline (Merck, Darmstadt, Germany), and a 10 μL aliquot of the diluted sample was added to 100 μL of the host culture medium in the log growth phase. After bacteriophage infection, the mixture was incubated for approximately 5 min at 37 °C. The mixture was then combined with molten LB soft agar (0.6% w/v agar) and overlaid onto LB bottom agar plates (1.5% w/v agar). The number of plaques appearing after culturing was counted using a colony counter (Scan 500, Interscience, Saint Nom la Bretêche, France).
2.7. RPA Reaction Setup and Real-Time Fluorescence Monitoring
To streamline the reaction setup, a primer–probe master mix was prepared in advance by combining the forward primer (10 μM), reverse primer (10 μM), exo probe (10 μM), and ultrapure water at a volume ratio of 21:21:6:52. This formulation ensured that the addition of 1 μL per reaction supplied the required primer and probe concentrations. The remaining components (TwistAmp exo kit, TwistDx, Maidenhead, UK), including the 2× buffer, were prepared, transferred to a lyophilized RPA pellet tube, mixed thoroughly to dissolve the pellet, and briefly centrifuged to collect the solution. Magnesium acetate was then added to activate the reaction mixture, which was immediately dispensed into reaction vessels at 14 μL per vessel. Finally, 1 μL of the sample (template) was added to each vessel to initiate the reaction, yielding a final volume of 15 μL. Real-time fluorescence was monitored using a real-time PCR instrument (QuantStudio™ 3, Applied Biosystems, Foster City, CA, USA) during isothermal incubation at 40 °C for 90 min, with fluorescence recorded at 60 s intervals.
2.8. Virus Detection by Microchannel
To fill the well portion of the spiral microfluidic chip with RPA solution, the chip was placed in a vacuum desiccator and degassed using a vacuum pump. A 15 min vacuum was sufficient to remove the air from the PDMS. The spiral microfluidic chip was then filled with the RPA solution. The air in the wells was sucked into the PDMS, and the solution in the channel was allowed to fill the wells. After confirming complete filling, the excess solution remaining in the channel was collected using a micropipette, ensuring that the RPA solution remained only in the well portion.
The virus-containing solution (1.0 × 10⁸ PFU/mL) was nebulized into the 12 L chamber at a nominal liquid-output rate of 0.2 mL/min for a total of 3 min. Nebulization proceeded for 2 min before air aspiration began. During the final 1 min, nebulization and aspiration were performed simultaneously. Air was drawn from the chamber through the spiral microchannel chip at 50 mL/min using a pump regulated by a mass-flow controller, yielding a total sampled air volume of 50 mL. Following aspiration, the chip was heated on a hot plate maintained at 40 °C to allow the RPA reaction to proceed, and fluorescence was observed under a microscope after 30 min. For the negative control, aerosols were generated from a virus-free solution and aspirated through an RPA-loaded chip, followed by the same incubation at 40 °C for 30 min and fluorescence imaging.
3. Results and Discussion
3.1. Simulation of Aerosol Behavior in Spiral Channels
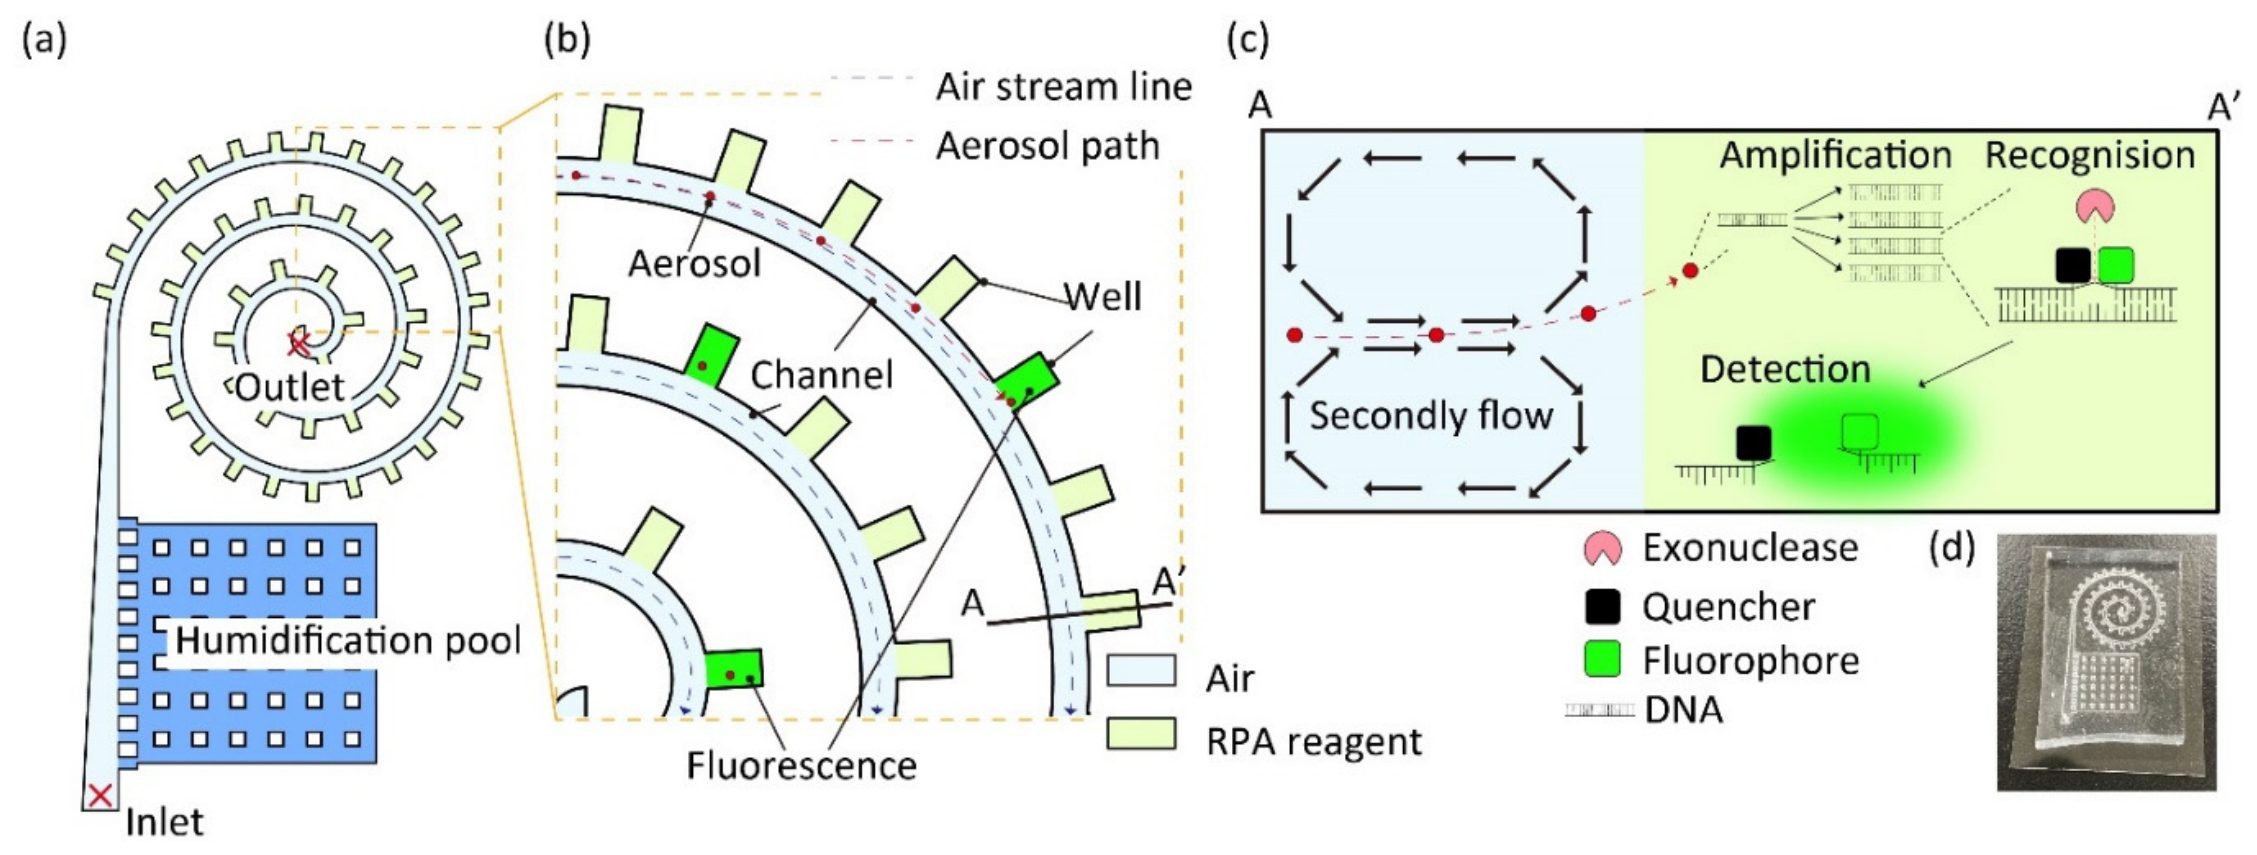
Aerosol transport and wall contact in the spiral microfluidic channels were evaluated using simulations. First, the model was imported into COMSOL Multiphysics to analyze flow velocities, revealing a velocity distribution similar to that of the Hagen–Poiseuille flow with higher velocities at the center (Figure 2a). Next, we extracted and confirmed the vertical velocity component of the channel and identified a secondary flow called the Dean vortex, which directed fluid from the center toward the outer wall of the channel (Figure 2b). Using this streamline, 500 aerosol particles were released from the channel entrance to assess wall trapping. Most particles with a diameter of 1 μm passed through the center of the channel without impacting the wall surface (Figure 2c), whereas 3 μm particles contacted the walls and came to rest at positions distributed throughout the channel (Figure 2d), and 5 μm particles primarily contacted the walls and came to rest at the first bend of the channel (Figure 2e). The simulated wall-contact fraction was subsequently evaluated by varying particle size and inlet velocity (Figure 2f); it increased with particle diameter and inlet velocity. The simulated wall-contact fraction was defined as the number of particles that contacted a channel wall and became stationary, divided by the total number released at the inlet (500). This numerical metric represents wall contact under the imposed boundary condition and does not measure experimental collection efficiency or recovery into the microwells.
Figure 2.
Simulation of aerosol trapping by spiral channels. (a) Velocity distribution in the spiral channel. (b) Visualization of Dean vortex created in the channel. The red arrows indicate the flow direction, and their size represents the flow velocity magnitude. (c–e) Distribution map of trapped particles: (c) 1, (d) 3, and (e) 5 μm, respectively. (f) wall-contact fraction as a function of inlet velocity and particle diameter.
Previous studies indicate that viral nucleic acid abundance and infectivity are not necessarily distributed identically across aerosol sizes. SARS-CoV-2 RNA was detected across a broad size range from 0.34 to >8.1 µm, with the highest concentrations observed in the 0.94–2.8 µm fractions [37], whereas the strongest evidence of replication-competent virus was obtained from submicron aerosols [38]. Although the approximately 3 µm condition does not represent the full size distribution of virus-containing aerosols, it provides a relevant proof-of-concept condition for the present platform, which detects amplification-accessible nucleic acid rather than viral infectivity. High viral nucleic acid concentrations have been reported in nearby size fractions, and the selected condition corresponded to the nominal wet-droplet diameter of the nebulizer used in this study. Thus, the 3 µm condition provided a defined micron-scale challenge for evaluating particle transport and subsequent on-chip nucleic acid detection. Although higher flow velocity increases the simulated wall-contact fraction, it may also accelerate liquid evaporation in the microwells. Simulation results predicted frequent wall contact for 3 μm particles at inlet velocities of approximately 2–4 m/s. In preliminary experiments, bead capture was successfully achieved at a flow rate of 50 mL/min (corresponding to approximately 3.3 m/s). Therefore, this condition was adopted for subsequent experiments as a practical operating parameter.
3.2. Experimental Validation with Fluorescent Beads
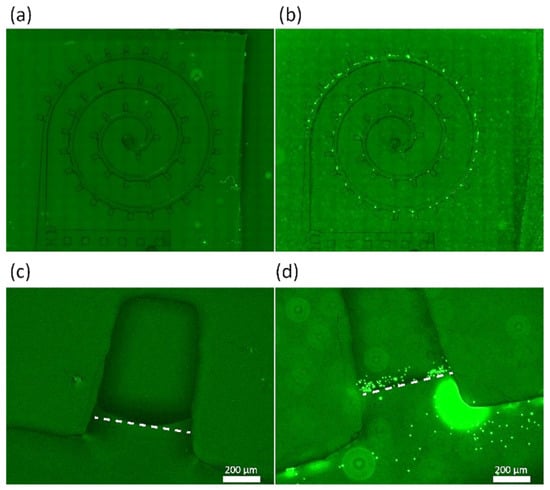
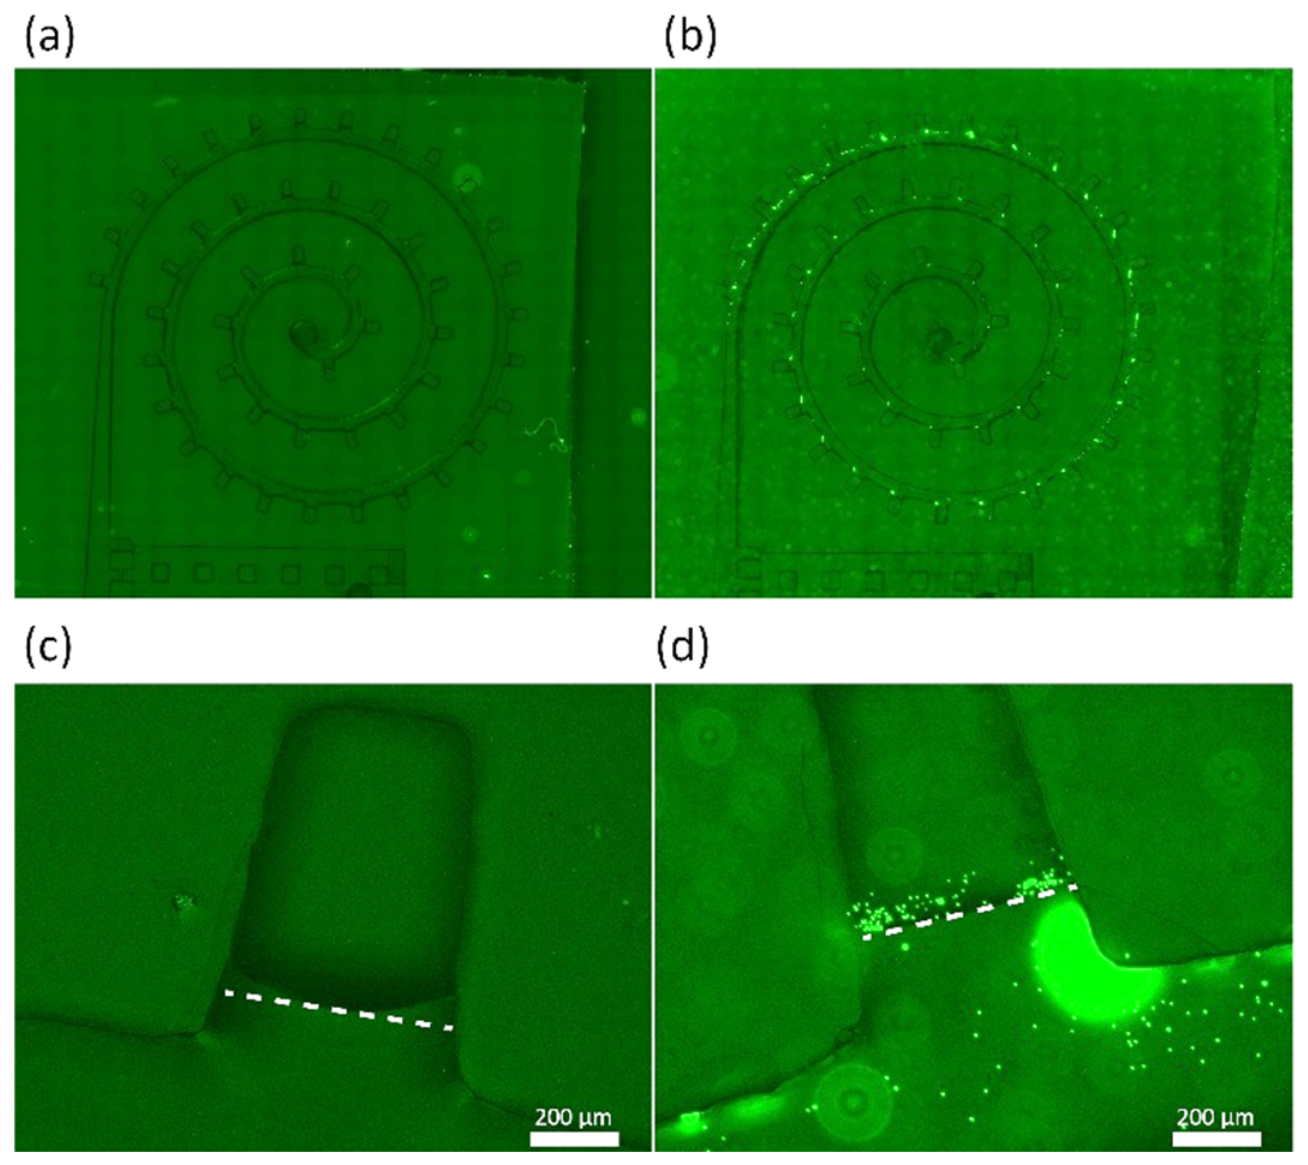
Aerosol deposition and transfer into peripheral wells were visualized qualitatively using fluorescent bead-containing droplets. Carboxylated polystyrene beads (1 μm) were used for the fluorescent beads. The presence of carboxyl groups increases hydrophilicity and promotes uniform dispersion in water. The beads were nebulized to generate aerosol droplets with a nominal diameter of 3 μm, introduced into the spiral device at 50 mL/min. A bead-free control (nebulized ultrapure water only) exhibited a weak background signal and no discrete deposits (Figure 3a). Fluorescence microscopy revealed numerous punctate signals distributed along the spiral channel, with pronounced enrichment near the outer wall and bends (Figure 3b). Consistent with the simulations, bead deposition was maximal at the first bend downstream of the inlet and declined progressively along successive turns toward the outlet. A close-up of the collection well in the bead-free control showed only weak background fluorescence (Figure 3c). In the well filled with Milli-Q water, bright fluorescence and freely diffusing puncta were observed (Figure 3d), and Brownian motion was evident in the liquid, indicating successful transfer of the captured aerosols into the well. The 1 μm beads served as fluorescent tracers within nominally 3 μm aerosol droplets; the bead diameter and the nominal droplet diameter therefore describe different components of the test aerosol.
Figure 3.
Deposition of nominally 3 μm aerosol droplets containing 1 μm fluorescent beads in spiral microchannels. (a) Spiral channel after sampling bead-free aerosols generated from ultrapure water. (b) Spiral channel after sampling nominally 3 μm aerosol droplets containing 1 μm fluorescent beads. (c) Close-up of a peripheral microwell in the bead-free control. (d) Fluorescent beads within a water-filled peripheral microwell after sampling bead-containing aerosol droplets. White dotted lines indicate the well boundaries. Scale bars in (c,d), 200 μm.
The introduced aerosol concentration and the amounts retained in the wells, deposited elsewhere in the channel, and leaving the outlet were not independently quantified. A conditional estimate of nominal droplet loading for the virus-aerosol challenge is provided in Section 3.5. This estimate supplies a quantitative loading context, while an experimental well-retention fraction would additionally require measured inlet and recovered-particle counts. The simulated wall-contact fraction and the observed bead deposition therefore describe complementary aspects of transport, rather than experimentally measured recovery of the same particle population. Consistent with the simulation results, the observed outer-wall enrichment and the presence of fluorescent beads within a peripheral well qualitatively support the predicted particle-transport mechanism and show that nebulized bead-containing material can reach the well region. These findings qualitatively support deposition of material from nominally 3 μm droplets containing 1 μm fluorescent beads and its transfer into peripheral wells. Size-resolved capture of isolated 1 μm particles remains to be evaluated separately.
3.3. Humidification of Spiral Channels
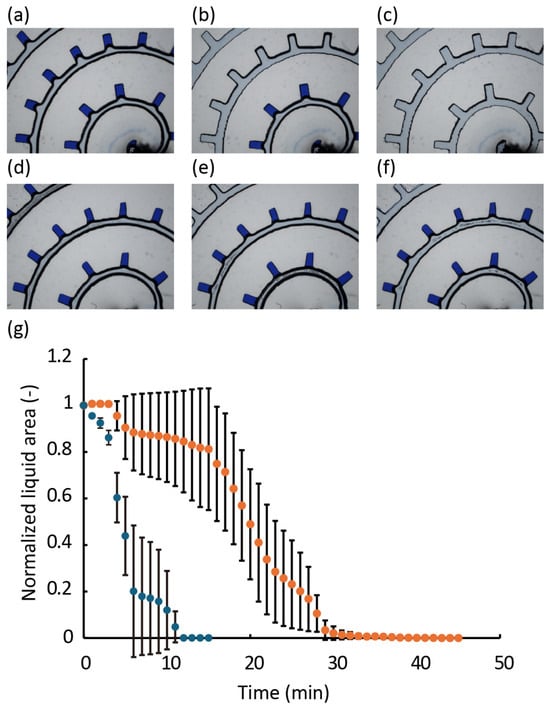
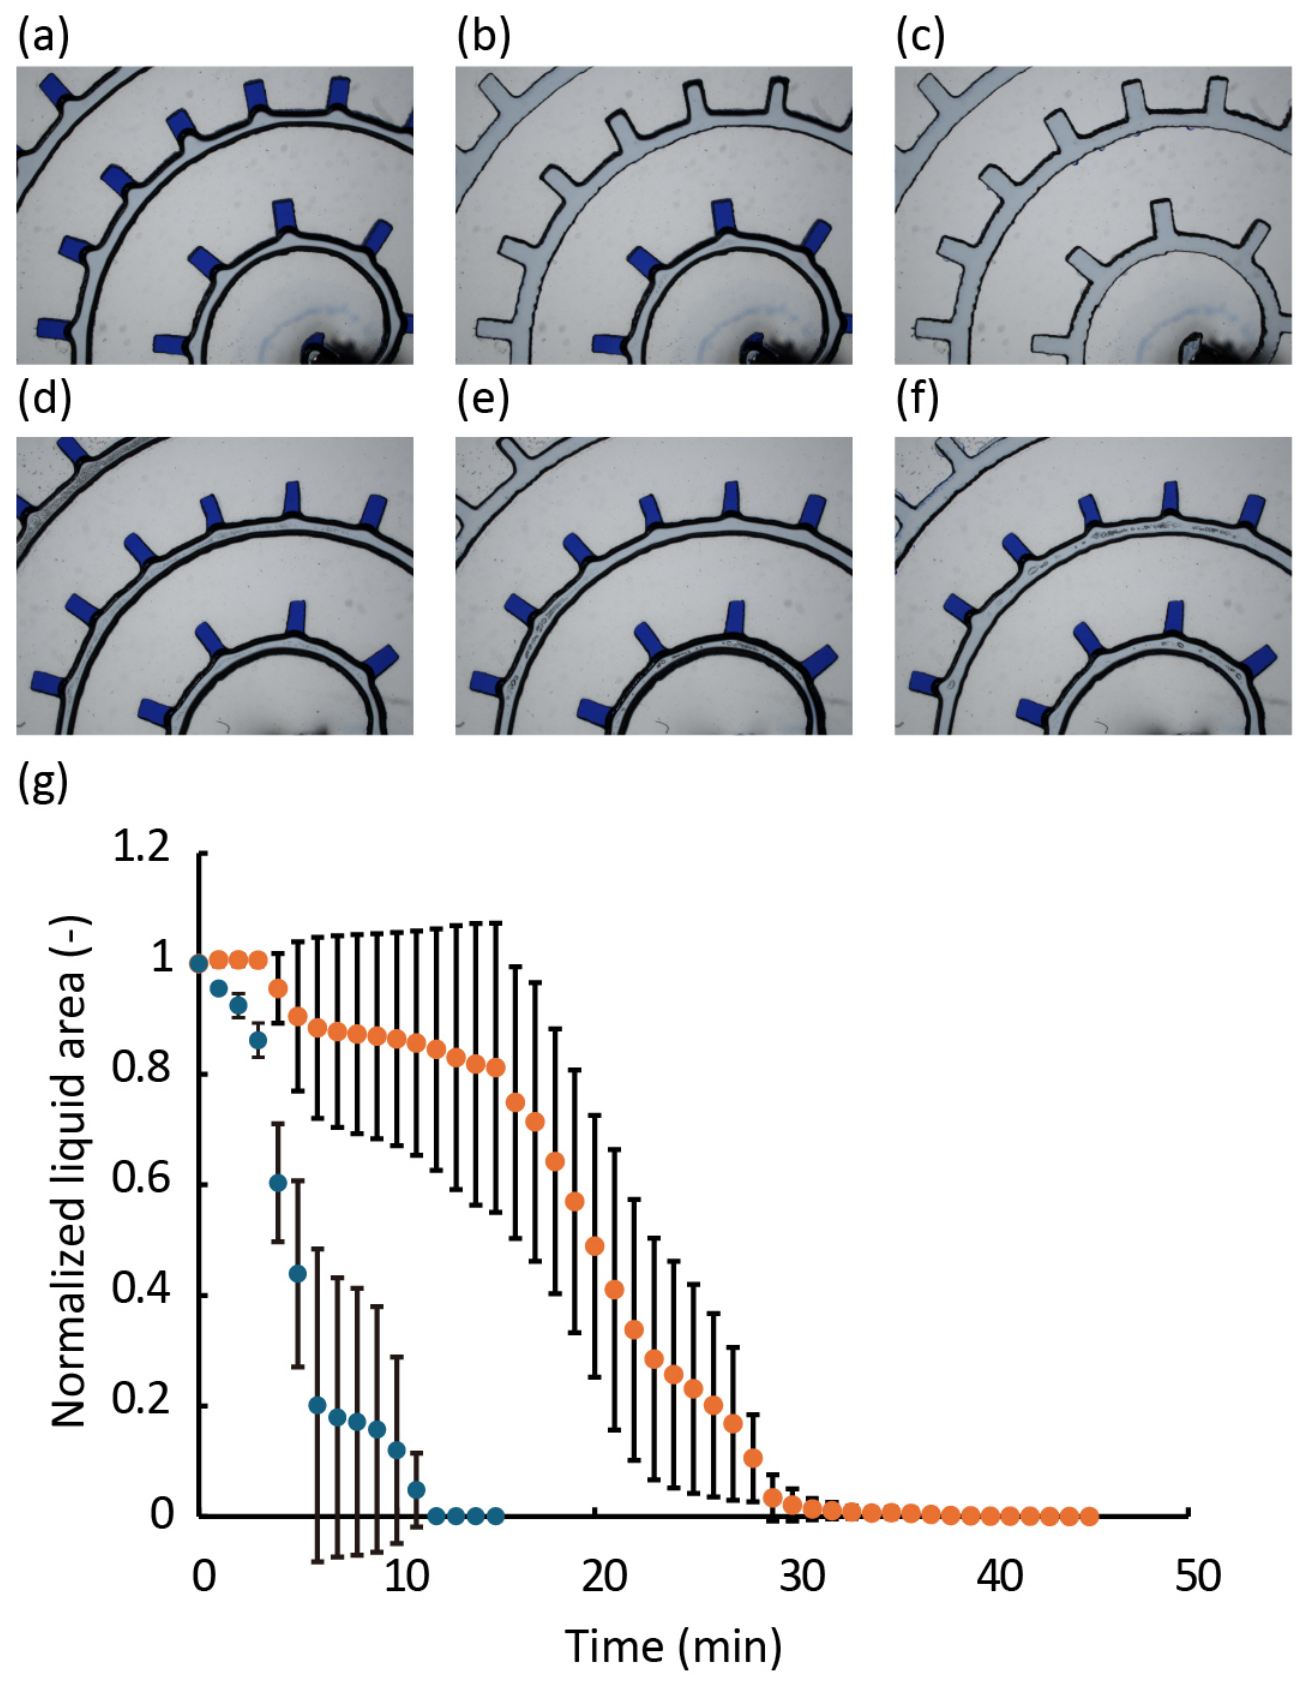
To reduce evaporation of liquid reagents from the wells, a humidification pool was created upstream of the spiral channel. Pillars were installed in the pool to prevent PDMS deformation under negative pressure and to avoid water leakage into the channel. The wells were filled with blue-ink-colored water instead of the reagent, and the normalized liquid area under airflow was compared between conditions with and without water in the pool. Without water in the pool, the wells dried within approximately 10 min (Figure 4a–c), whereas the presence of water extended the drying time to approximately 30 min (Figure 4d–f). Consistently, at 5 min, the normalized liquid area with the humidification pool was approximately twice that observed without the pool (Figure 4g), confirming that humidification suppressed evaporation during airflow. Time-lapse images (Figure 4a–f) revealed that drying progressed from the outer edge toward the center, suggesting that the operating time of the spiral tip could be further extended by enlarging the pool section.
Figure 4.
Temporal changes in normalized liquid area in the wells. (a–c) Bright field images of wells exposed to airflow in the absence of a water pool at (a) 0, (b) 7, and (c) 15 min. (d–f) Bright field images of wells exposed to airflow in the presence of a water pool at (d) 0, (e) 7, and (f) 15 min. (g) Normalized liquid area, A(t)/A(0), measured at an airflow rate of 50 mL/min. A(t) is the summed projected liquid area of the eight analyzed wells at time t, and A(0) is the initial summed area before airflow. Blue and orange symbols indicate conditions without and with water in the upstream humidification pool, respectively. Symbols show the mean normalized liquid area from three independent chips (n = 3); error bars indicate ±1 standard deviation (SD) across chips.
These results demonstrate evaporation suppression by the upstream humidification pool in the aqueous model under airflow. The water-model measurements therefore provide a physical assessment of the humidification design. Although changes in reagent concentrations and enzymatic activity associated with evaporation and humidification may influence RPA performance, these effects have not been directly evaluated. Further evaluation using the actual RPA mixture may help clarify the effects of humidification on reagent evaporation and amplification performance.
3.4. Detection of Purified Viral DNA and Cultured Phage Particles Using the T2 Primer Set
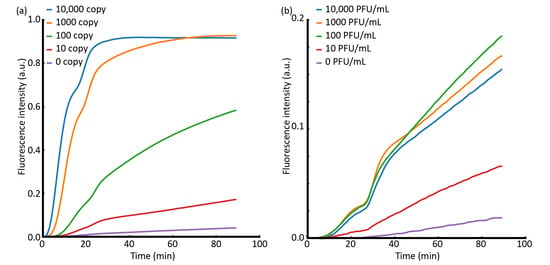
As an initial validation of the DNA-detection concept, bacteriophage T2, a double-stranded DNA virus that infects Escherichia coli rather than humans, was selected as the model virus, allowing controlled evaluation without using a human-pathogenic virus. To evaluate the analytical sensitivity of the newly designed T2 RPA primer set, reactions were first performed using purified viral DNA (Figure 5a). Four template levels ranging from 10 to 10,000 copies per reaction were tested alongside a no-template control. At higher template concentrations (10,000 and 1000 copies), fluorescence increased within approximately 3 min, whereas even low-copy templates produced detectable amplification within 10 min, indicating a rapid signal onset across the tested range. Statistical analysis of fluorescence at 30 min using Tukey’s multiple comparison test (α = 0.05) showed a significant difference from the negative control at ≥100 copies. Although an increase in fluorescence was observed at 10 copies, inter-sample variability was high, and the difference was not statistically significant. These findings are consistent with previous reports describing RPA detection limits ranging from a few to several hundred copies [19], supporting the suitability of the T2 primer set for RPA-based detection. Next, the ability of the primer set to directly detect cultured bacteriophage T2 was assessed (Figure 5b).
Figure 5.
Real-time RPA of bacteriophage T2 targets using purified DNA and crude lysate. (a) Real-time fluorescence intensity of RPA reactions performed with purified T2 phage genomic DNA at 10, 100, 1000, and 10,000 copies per reaction, and a no-template control (0 copies). (b) Real-time fluorescence intensity of RPA reactions performed with crude T2 phage preparation (lysate) corresponding to 10, 100, 1000, and 10,000 PFU/mL, and a no-template control (0 PFU/mL).
Compared with purified DNA, amplification kinetics were slower and more gradual: fluorescence increases started after approximately 10 min for all concentrations and did not attain a clear plateau even after 1 h. A plausible explanation is the partial inhibition of the RPA reaction by coexisting viral components, such as proteins in the phage preparation, which reduces amplification efficiency and slows reaction progression relative to purified DNA templates. More complex environmental samples may contain variable mixtures of dust, salts, proteins, pollen, and other bioaerosols, and their combined effects on amplification and fluorescence development remain unknown. Further studies using representative mixed matrices and spike-and-recovery experiments are therefore needed to determine these effects and establish the robustness of the assay under realistic sampling conditions. Notably, at a viral concentration of 10 plaque-forming units (PFUs)/mL, only 1 µL of sample was added per reaction, corresponding to <1 PFU per reaction on average. Amplification-like responses were observed. This observation can be explained by the fact that PFU quantifies infectious viral particles, whereas RPA detects viral DNA irrespective of infectivity. PFU does not necessarily correlate with DNA copy number, given that non-infectious particles, damaged virions, and extracellular/free DNA contribute to detectable nucleic acids [35]. Therefore, in practical scenarios such as environmental or spatial sampling, similar amplification curves may occur even when infectivity-based titers are extremely low, and results should be interpreted to account for the inherent discrepancy between infective units and nucleic acid abundance. Importantly, this crude-phage experiment demonstrated that T2-derived DNA could be amplified without a separate nucleic acid extraction or intentional lysis step. Although the contributions of pre-existing amplification-accessible DNA and DNA released during the RPA reaction were not distinguished, these results support the feasibility of direct RPA detection from cultured phage preparations.
3.5. Virus Capture Using Spiral Channels
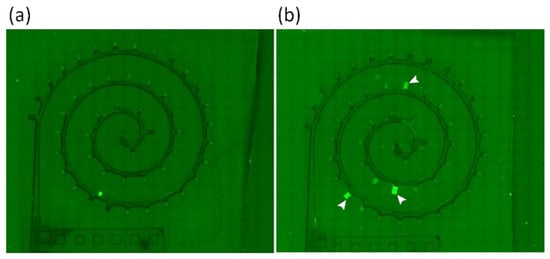
Airborne virus collection and on-chip molecular detection were evaluated using a humidified spiral microchannel. Peripheral microwells along the outer turns served as reaction chambers and were preloaded with an RPA mixture containing an exonuclease-cleavable fluorescence reporter. The assembled device was tested using a 12 L chamber in which the viral suspension was nebulized for 3 min. During the final 1 min of nebulization, air was simultaneously aspirated through the chip at 50 mL/min, corresponding to a sampled air volume of 50 mL. Immediately after sampling, the chip was incubated isothermally at 40 °C for 30 min and subsequently imaged to assess fluorescence for on-well amplification. The negative control underwent the same sampling, incubation, and imaging workflow using aerosols generated from a virus-free solution (Figure 6a).
Figure 6.
Fluorescence images of virus detection using spiral microchannel. (a) Negative control after aspiration of aerosols generated from a virus-free solution, followed by incubation at 40 °C for 30 min and fluorescence imaging. (b) Microchannel after sampling T2-containing aerosols generated by 3 min of nebulization in a 12 L chamber. Aspiration at 50 mL/min was performed during the final 1 min of nebulization (50 mL sampled air), followed by incubation at 40 °C for 30 min. White arrowheads indicate wells with particularly bright fluorescence.
To provide a quantitative context for the aerosol loading in the 3 min virus-aerosol challenge, we estimated the nominal number of aerosol droplets based on the nebulizer output. Assuming spherical droplets with an equivalent diameter of 3 μm, the volume of each droplet was calculated as 1.41 × 10⁻¹¹ mL. At a nominal liquid-output rate of 0.2 mL/min, the total liquid output over 3 min was 0.6 mL, corresponding to approximately 4.24 × 10¹⁰ equivalent droplets. Assuming complete aerosolization, instantaneous uniform mixing within the 12 L chamber, and negligible particle losses, the mean droplet concentration during the sampling interval (2–3 min) was estimated to be 2.95 × 10⁹ droplets/L. At a sampling flow rate of 50 mL/min, approximately 1.47 × 10⁸ equivalent droplets were estimated to enter the chip during this interval. Based on the initial phage concentration of 1.0 × 10⁸ PFU/mL, this corresponds to a nominal loading of approximately 2.1 × 10⁵ PFU equivalents. The manufacturer-reported 3 μm value represents the mass median aerodynamic diameter (MMAD), and the calculation assumes monodisperse droplets without accounting for aerosol losses or nonuniform mixing. Therefore, these values represent idealized loading estimates rather than measured aerosol concentrations, infectious phage recovery, or microwell retention efficiencies.
Under these nominal aerosol-loading conditions, several wells exhibited visibly increased fluorescence relative to the control (Figure 6), indicating the delivery of amplification-accessible T2-derived DNA from the aerosol challenge to the wells and its subsequent on-chip amplification and reporter cleavage. The detected DNA may have been present in the original phage suspension or become accessible during nebulization, capture, or incubation, but these possible contributions were not distinguished. Because the aerosol experiment was conducted at a single challenge concentration without a predefined well-positivity criterion or sufficient chip-level replication, neither the system-level airborne detection limit nor the fraction of positive wells across replicate chips could be reliably determined. Accordingly, the experiment should be interpreted as an end-to-end proof-of-concept demonstration under a controlled, high-concentration aerosol challenge rather than as validation for room-scale surveillance. Within this scope, fluorescence generation in multiple wells supports the feasibility of integrating localized aerosol sampling and nucleic acid detection on a compact chip without intermediate liquid handling. Fluorescence signals were spatially heterogeneous rather than forming a continuous bright ring along the outer turns, potentially reflecting several factors. The ultra-low reaction volume is susceptible to surface adsorption and minor evaporation that alter effective magnesium (Mg2+) or salt concentrations and enzyme activity. Nebulization may also introduce aggregates or co-deposited matrix components that locally inhibit amplification. These effects may contribute to the observed well-to-well variability. Based on the simulations and bead distribution, a stronger fluorescence was anticipated near the outer spiral perimeter; however, the observed fluorescence pattern was more random. One possible contributor is the known sensitivity of RPA to the initial mixing conditions. Given that the reaction mixture is more viscous and mixing is limited compared with PCR, spatial variability may have been amplified, resulting in well-to-well differences [39]. The current fluorescence readout does not distinguish insufficient target for detectable amplification from reaction failure, including inhibition, in nonfluorescent wells. Accordingly, a nonfluorescent well should not be interpreted as confirming the absence of captured virus-derived DNA. Because reaction competence was not independently verified in each aerosol-exposed well, these possibilities cannot be resolved from Figure 6 alone. For practical virus monitoring, this limitation is particularly important because false-negative interpretations could lead to missed detection of viral material, highlighting the need for well-by-well reaction validation in future applications.
Detection of virus-derived DNA provides molecular evidence of viral material, although it does not establish infectivity. In a preventive monitoring framework, a positive signal could motivate follow-up sampling and confirmatory assessment of a potential emission source. This screening role could support precautionary source investigation, provided that assay performance under realistic environmental conditions is established.
Recent integrated systems illustrate different architectures for connecting aerosol sampling to molecular analysis. Li et al. combined a high-flow cyclone aerosol sampler with a microfluidic cartridge for in situ PCR, including automated sample delivery in their continuous-monitoring configurations [40]. Fu et al. coupled composite bioaerosol collection and three-stage enrichment to RPA–CRISPR/Cas12a detection [41]. The present chip focuses on using preloaded peripheral wells as both aerosol collection sites and amplification chambers, with passive upstream humidification during air sampling. This arrangement connects aerosol deposition directly to localized RPA in the same wells without intermediate sample transfer or continuous liquid perfusion, providing a compact architecture for distributed sampling.
The model virus used in this study was a DNA virus; therefore, the present workflow is not directly applicable to RNA viruses such as coronaviruses in the current system. Nevertheless, one-pot RPA formats incorporating reverse transcription (RT)-RPA have been actively investigated [42], and integrating RT into the current on-chip assay could extend the platform’s applicability to a broader range of RNA virus species. Beyond this analytical extension, the low-flow spiral format offers a complementary use case to previously reported automated, continuous, and microfluidic bioaerosol platforms. Its compact footprint, small reagent volumes, passive humidification, and no-transfer fluorescence readout could support distributed placement near likely emission or interaction zones, where multiple devices could provide spatially localized molecular information that complements room-average air sampling. The simple chip architecture may therefore offer a low-complexity and potentially low-cost route to source-proximal distributed monitoring after quantitative performance and cost validation.
4. Conclusions
We developed a spiral microchannel chip that combines deposition of nebulized aerosol material, passive humidification, and on-chip RPA fluorescence readout. Numerical simulations predicted size-dependent wall contact, and fluorescent-bead experiments qualitatively supported outer-wall deposition and transfer into peripheral wells. Under a high-concentration, nominally 3 µm liquid-droplet challenge, amplifiable DNA from the model virus bacteriophage T2 produced fluorescence in a subset of wells after sampling 50 mL of chamber air. The demonstration used no separate extraction or liquid-transfer step, but it did not include or quantify viral lysis. Quantitative aerosol collection efficiency, enrichment, environmental matrix tolerance, and a system-level airborne limit of detection were also not established. The device should therefore be regarded as an integration proof of concept rather than a validated room-scale environmental monitor. The low-flow microchannel format may provide a potential approach for distributed, source-proximal sensing of local emission events: multiple compact chips could be placed near conversation or interaction zones to complement room-average monitoring with spatially localized molecular measurements.
Supplementary Materials
The following supporting information can be downloaded at https://www.mdpi.com/article/10.3390/bios16110644/s1, Figure S1: Schematic of the desiccator system for aerosol generation and capture.
Author Contributions
Conceptualization, Y.H., J.M., N.M. and N.I.; methodology, Y.H., K.S., R.H. and T.O.; formal analysis, Y.H. and K.S.; investigation, Y.H., K.S., R.H., T.O. and J.M.; writing—original draft preparation, Y.H.; writing—review and editing, Y.H., K.S., R.H., T.O., J.M., N.M. and N.I.; visualization, Y.H.; supervision, N.M. and N.I.; project administration, N.M. and N.I. All authors have read and agreed to the published version of the manuscript.
Funding
This research received no external funding.
Institutional Review Board Statement
Not applicable.
Informed Consent Statement
Not applicable.
Data Availability Statement
Data will be made available on request.
Acknowledgments
The authors appreciate Takashi Ozaki for his valuable advice on fabricating the acrylic molds and Akihiro Ishihara for machining the desiccator. We also acknowledge the use of ChatGPT 6.1 to improve the English readability of the manuscript.
Conflicts of Interest
All authors are employees of Toyota Central R&D Labs., Inc. and are inventors on patent applications related to the technology described in this study.
Abbreviations
The following abbreviations are used in this manuscript:
| Abbreviation | Full Term |
| DNA | Deoxyribonucleic acid |
| HEPA | High-efficiency particulate air |
| LB | Luria–Bertani |
| MMAD | Mass median aerodynamic diameter |
| NBRC | NITE Biological Resource Center |
| NITE | National Institute of Technology and Evaluation |
| PCR | Polymerase chain reaction |
| PDMS | Polydimethylsiloxane |
| PFU | Plaque-forming unit |
| RNA | Ribonucleic acid |
| RPA | Recombinase polymerase amplification |
| RT | Reverse transcription |
| RT-qPCR | Reverse transcription quantitative polymerase chain reaction |
| RT-RPA | Reverse transcription recombinase polymerase amplification |
| SARS-CoV-2 | Severe acute respiratory syndrome coronavirus 2 |
| SD | Standard deviation |
References
- Msemburi, W.; Karlinsky, A.; Knutson, V.; Aleshin-Guendel, S.; Chatterji, S.; Wakefield, J. The WHO Estimates of Excess Mortality Associated with the COVID-19 Pandemic. Nature 2023, 613, 130–137. [Google Scholar] [CrossRef] [Scilit] [PubMed]
- Wang, C.C.; Prather, K.A.; Sznitman, J.; Jimenez, J.L.; Lakdawala, S.S.; Tufekci, Z.; Marr, L.C. Airborne Transmission of Respiratory Viruses. Science 2021, 373, eabd9149. [Google Scholar] [CrossRef] [Scilit] [PubMed]
- Guo, Z.; Chen, Y.; Xiao, G.; Jiang, H.; Yang, Z.; Li, J.; Gong, L.; Jin, M.; Wang, F. Evaluating the Impact of Large-Scale Nucleic Acid Testing and Home Quarantine on a Novel Emerging Infectious Disease Prevention and Control: A Dynamic Modeling Approach. Front. Public Health 2025, 13, 1447738. [Google Scholar] [CrossRef] [Scilit] [PubMed]
- Rastmanesh, A.; Boruah, J.S.; Lee, M.-S.; Park, S. On-Site Bioaerosol Sampling and Airborne Microorganism Detection Technologies. Biosensors 2024, 14, 122. [Google Scholar] [CrossRef] [Scilit] [PubMed]
- Böger, B.; Fachi, M.M.; Vilhena, R.O.; Cobre, A.F.; Tonin, F.S.; Pontarolo, R. Systematic Review with Meta-Analysis of the Accuracy of Diagnostic Tests for COVID-19. Am. J. Infect. Control 2021, 49, 21–29. [Google Scholar] [CrossRef] [Scilit] [PubMed]
- Rong, Z.; Wang, Q.; Sun, N.; Jia, X.; Wang, K.; Xiao, R.; Wang, S. Smartphone-Based Fluorescent Lateral Flow Immunoassay Platform for Highly Sensitive Point-of-Care Detection of Zika Virus Nonstructural Protein 1. Anal. Chim. Acta 2019, 1055, 140–147. [Google Scholar] [CrossRef] [Scilit] [PubMed]
- Seo, G.; Lee, G.; Kim, M.J.; Baek, S.-H.; Choi, M.; Ku, K.B.; Lee, C.-S.; Jun, S.; Park, D.; Kim, H.G.; et al. Rapid Detection of COVID-19 Causative Virus (SARS-CoV-2) in Human Nasopharyngeal Swab Specimens Using Field-Effect Transistor-Based Biosensor. ACS Nano 2020, 14, 5135–5142. [Google Scholar] [CrossRef] [Scilit] [PubMed]
- Noguera, P.; Pastor-Navarro, N.; Bernardos, A.; Medaglia, S.; Alcañiz-Fillol, M.; Masot-Peris, R.; Giménez-Romero, D. LC Biosensors (Bio-LC): New Resonant Sensors for Direct Detection of Airborne Viruses. Talanta 2025, 294, 128192. [Google Scholar] [CrossRef] [Scilit] [PubMed]
- Nukazuka, A.; Asai, S.; Hayakawa, K.; Nakagawa, K.; Kanazashi, M.; Kakizoe, H.; Hayashi, K.; Kawahara, T.; Sawada, K.; Kuno, H.; et al. Electrical Biosensing System Utilizing Ion-Producing Enzymes Conjugated with Aptamers for the Sensing of Severe Acute Respiratory Syndrome Coronavirus 2. Sens. Bio-Sensing Res. 2023, 39, 100549. [Google Scholar] [CrossRef] [Scilit] [PubMed]
- Chen, H.; Park, S.G.; Choi, N.; Moon, J.I.; Dang, H.; Das, A.; Lee, S.; Kim, D.G.; Chen, L.; Choo, J. SERS Imaging-Based Aptasensor for Ultrasensitive and Reproducible Detection of Influenza Virus A. Biosens. Bioelectron. 2020, 167, 112496. [Google Scholar] [CrossRef] [Scilit] [PubMed]
- Trinh, K.T.L.; Lee, N.Y. Fabrication of Wearable PDMS Device for Rapid Detection of Nucleic Acids via Recombinase Polymerase Amplification Operated by Human Body Heat. Biosensors 2022, 12, 72. [Google Scholar] [CrossRef] [Scilit] [PubMed]
- Prakash, R.; Pabbaraju, K.; Wong, S.; Wong, A.; Tellier, R.; Kaler, K.V.I.S. Multiplex, Quantitative, Reverse Transcription PCR Detection of Influenza Viruses Using Droplet Microfluidic Technology. Micromachines 2015, 6, 63–79. [Google Scholar] [CrossRef] [Scilit]
- Park, G.S.; Ku, K.; Baek, S.H.; Kim, S.J.; Kim, S.I.; Kim, B.T.; Maeng, J.S. Development of Reverse Transcription Loop-Mediated Isothermal Amplification Assays Targeting Severe Acute Respiratory Syndrome Coronavirus 2 (SARS-CoV-2). J. Mol. Diagn. 2020, 22, 729–735. [Google Scholar] [CrossRef] [Scilit] [PubMed]
- Janíková, M.; Hodosy, J.; Boor, P.; Klempa, B.; Celec, P. Loop-mediated Isothermal Amplification for the Detection of SARS-CoV-2 in Saliva. Microb. Biotechnol. 2021, 14, 307–316. [Google Scholar] [CrossRef] [Scilit] [PubMed]
- Davidson, J.L.; Wang, J.; Maruthamuthu, M.K.; Dextre, A.; Pascual-Garrigos, A.; Mohan, S.; Putikam, S.V.S.; Osman, F.O.I.; McChesney, D.; Seville, J.; et al. A Paper-Based Colorimetric Molecular Test for SARS-CoV-2 in Saliva. Biosens. Bioelectron. X 2021, 9, 100076. [Google Scholar] [CrossRef] [Scilit] [PubMed]
- Liu, D.; Shen, H.; Zhang, Y.; Shen, D.; Zhu, M.; Song, Y.; Zhu, Z.; Yang, C. A Microfluidic-Integrated Lateral Flow Recombinase Polymerase Amplification (MI-IF-RPA) Assay for Rapid COVID-19 Detection. Lab A Chip 2021, 21, 2019–2026. [Google Scholar] [CrossRef] [Scilit] [PubMed]
- Euler, M.; Wang, Y.; Nentwich, O.; Piepenburg, O.; Hufert, F.T.; Weidmann, M. Recombinase Polymerase Amplification Assay for Rapid Detection of Rift Valley Fever Virus. J. Clin. Virol. 2012, 54, 308–312. [Google Scholar] [CrossRef] [Scilit] [PubMed]
- Piepenburg, O.; Williams, C.H.; Stemple, D.L.; Armes, N.A. DNA Detection Using Recombination Proteins. PLoS Biol. 2006, 4, e204. [Google Scholar] [CrossRef] [Scilit] [PubMed]
- Lobato, I.M.; O’Sullivan, C.K. Recombinase Polymerase Amplification: Basics, Applications and Recent Advances. TrAC Trends Anal. Chem. 2018, 98, 19–35. [Google Scholar] [CrossRef] [Scilit] [PubMed]
- Kim, J.; Jin, J.-H.; Kim, H.S.; Song, W.; Shin, S.-K.; Yi, H.; Jang, D.-H.; Shin, S.; Lee, B.Y. Fully Automated Field-Deployable Bioaerosol Monitoring System Using Carbon Nanotube-Based Biosensors. Environ. Sci. Technol. 2016, 50, 5163–5171. [Google Scholar] [CrossRef] [Scilit] [PubMed]
- Kulkarni, M.B.; Vineela; Mandal, N.; N, Y.; Chetankumar, P.F.; Martínez-Chapa, S.O.; Izquierdo, R. Recent Advances in Microfluidic-Based Biosensors for Nucleic Acid Detection: From Amplification Strategies to Point-of-Care Diagnostic Devices. SLAS Technol. 2026, 42, 100470. [Google Scholar] [CrossRef] [Scilit] [PubMed]
- Rahmani, A.R.; Leili, M.; Azarian, G.; Poormohammadi, A. Sampling and Detection of Corona Viruses in Air: A Mini Review. Sci. Total Environ. 2020, 740, 140207. [Google Scholar] [CrossRef] [Scilit] [PubMed]
- Lednicky, J.A.; Lauzardo, M.; Fan, Z.H.; Jutla, A.; Tilly, T.B.; Gangwar, M.; Usmani, M.; Shankar, S.N.; Mohamed, K.; Eiguren-Fernandez, A.; et al. Viable SARS-CoV-2 in the Air of a Hospital Room with COVID-19 Patients. Int. J. Infect. Dis. 2020, 100, 476–482. [Google Scholar] [CrossRef] [Scilit] [PubMed]
- Sousan, S.; Fan, M.; Outlaw, K.; Williams, S.; Roper, R.L. SARS-CoV-2 Detection in Air Samples from inside Heating, Ventilation, and Air Conditioning (HVAC) Systems- COVID Surveillance in Student Dorms. Am. J. Infect. Control 2022, 50, 330–335. [Google Scholar] [CrossRef] [Scilit] [PubMed]
- Guo, Z.-D.; Wang, Z.-Y.; Zhang, S.-F.; Li, X.; Li, L.; Li, C.; Cui, Y.; Fu, R.-B.; Dong, Y.-Z.; Chi, X.-Y.; et al. Aerosol and Surface Distribution of Severe Acute Respiratory Syndrome Coronavirus 2 in Hospital Wards, Wuhan, China, 2020. Emerg. Infect. Dis. 2020, 26, 1583–1591. [Google Scholar] [CrossRef] [Scilit] [PubMed]
- Kralik, P.; Dziedzinska, R.; Cap, M.; Szabo, Z.; Šerý, O.; Pavlis, O.; Fiala, P. Development and Testing of a Sampling Device for the Detection of Aerosolized Pathogens in Indoor Environments. Talanta 2026, 300, 129145. [Google Scholar] [CrossRef] [Scilit] [PubMed]
- Li, J.; Leavey, A.; Wang, Y.; O’Neil, C.; Wallace, M.A.; Burnham, C.-A.D.; Boon, A.C.; Babcock, H.; Biswas, P. Comparing the Performance of 3 Bioaerosol Samplers for Influenza Virus. J. Aerosol Sci. 2018, 115, 133–145. [Google Scholar] [CrossRef] [Scilit] [PubMed]
- Pan, M.; Eiguren-Fernandez, A.; Hsieh, H.; Afshar-Mohajer, N.; Hering, S.V.; Lednicky, J.; Hugh Fan, Z.; Wu, C.-Y. Efficient Collection of Viable Virus Aerosol through Laminar-flow, Water-based Condensational Particle Growth. J. Appl. Microbiol. 2016, 120, 805–815. [Google Scholar] [CrossRef] [Scilit] [PubMed]
- Hong, S.C.; Kang, J.S.; Lee, J.E.; Kim, S.S.; Jung, J.H. Continuous Aerosol Size Separator Using Inertial Microfluidics and Its Application to Airborne Bacteria and Viruses. Lab A Chip 2015, 15, 1889–1897. [Google Scholar] [CrossRef] [Scilit] [PubMed]
- Shen, F.; Tan, M.; Wang, Z.; Yao, M.; Xu, Z.; Wu, Y.; Wang, J.; Guo, X.; Zhu, T. Integrating Silicon Nanowire Field Effect Transistor, Microfluidics and Air Sampling Techniques For Real-Time Monitoring Biological Aerosols. Environ. Sci. Technol. 2011, 45, 7473–7480. [Google Scholar] [CrossRef] [Scilit] [PubMed]
- Damit, B. Droplet-Based Microfluidics Detector for Bioaerosol Detection. Aerosol Sci. Technol. 2017, 51, 488–500. [Google Scholar] [CrossRef] [Scilit]
- Choi, J.; Hong, S.C.; Kim, W.; Jung, J.H. Highly Enriched, Controllable, Continuous Aerosol Sampling Using Inertial Microfluidics and Its Application to Real-Time Detection of Airborne Bacteria. ACS Sens. 2017, 2, 513–521. [Google Scholar] [CrossRef] [Scilit] [PubMed]
- Pardon, G.; Ladhani, L.; Sandström, N.; Ettori, M.; Lobov, G.; van der Wijngaart, W. Aerosol Sampling Using an Electrostatic Precipitator Integrated with a Microfluidic Interface. Sens. Actuators B Chem. 2015, 212, 344–352. [Google Scholar] [CrossRef] [Scilit]
- Wang, J.; Yang, L.; Wang, H.; Wang, L. Application of Microfluidic Chips in the Detection of Airborne Microorganisms. Micromachines 2022, 13, 1576. [Google Scholar] [CrossRef] [Scilit] [PubMed]
- Zapata-Cardona, M.I.; Flórez-Álvarez, L.; Gómez-Gallego, D.M.; Moncada-Díaz, M.J.; Hernandez, J.C.; Díaz, F.; Rugeles, M.T.; Aguilar-Jiménez, W.; Zapata, W. Comparison among Plaque Assay, Tissue Culture Infectious Dose (TCID) and Real-Time RT-PCR for SARS-CoV-2 Variants Quantification. Iran. J. Microbiol. 2022, 14, 291–299. [Google Scholar] [CrossRef] [Scilit] [PubMed]
- Untergasser, A.; Cutcutache, I.; Koressaar, T.; Ye, J.; Faircloth, B.C.; Remm, M.; Rozen, S.G. Primer3—New Capabilities and Interfaces. Nucleic Acids Res. 2012, 40, e115. [Google Scholar] [CrossRef] [Scilit] [PubMed]
- Alsved, M.; Nygren, D.; Thuresson, S.; Fraenkel, C.-J.; Medstrand, P.; Löndahl, J. Size Distribution of Exhaled Aerosol Particles Containing SARS-CoV-2 RNA. Infect. Dis. 2023, 55, 158–163. [Google Scholar] [CrossRef] [Scilit] [PubMed]
- Santarpia, J.L.; Herrera, V.L.; Rivera, D.N.; Ratnesar-Shumate, S.; Reid, S.P.; Ackerman, D.N.; Denton, P.W.; Martens, J.W.S.; Fang, Y.; Conoan, N.; et al. The Size and Culturability of Patient-Generated SARS-CoV-2 Aerosol. J. Expo. Sci. Environ. Epidemiol. 2022, 32, 706–711. [Google Scholar] [CrossRef] [Scilit] [PubMed]
- Zhou, M.; Fan, C.; Wang, L.; Xu, T.; Zhang, X. Enhanced Isothermal Amplification for Ultrafast Sensing of SARS-CoV-2 in Microdroplets. Anal. Chem. 2022, 94, 4135–4140. [Google Scholar] [CrossRef] [Scilit] [PubMed]
- Li, B.; Lin, B.; Wang, Y.; Shi, Y.; Zeng, W.; Zhao, Y.; Gu, Y.; Liu, C.; Gao, H.; Cheng, H.; et al. Multi-Scenario Surveillance of Respiratory Viruses in Aerosols with Sub-Single-Copy Spatial Resolution. Nat. Commun. 2024, 15, 8770. [Google Scholar] [CrossRef] [Scilit] [PubMed]
- Fu, H.; Wang, Z.; Guo, J.; Wang, T.; Li, X.; Su, Y.; Chen, Z.; Yang, H.; Xie, Z.; Li, D. High-Sensitivity Molecular Detection of Viral Bioaerosols Using a Composite Collection System and Optimized RPA–CRISPR/Cas12a. Anal. Chem. 2026, 98, 24876–24887. [Google Scholar] [CrossRef] [Scilit] [PubMed]
- Feng, W.; Peng, H.; Xu, J.; Liu, Y.; Pabbaraju, K.; Tipples, G.; Joyce, M.A.; Saffran, H.A.; Tyrrell, D.L.; Babiuk, S.; et al. Integrating Reverse Transcription Recombinase Polymerase Amplification with CRISPR Technology for the One-Tube Assay of RNA. Anal. Chem. 2021, 93, 12808–12816. [Google Scholar] [CrossRef] [Scilit] [PubMed]
Disclaimer/Publisher’s Note: The statements, opinions and data contained in all publications are solely those of the individual author(s) and contributor(s) and not of MDPI and/or the editor(s). MDPI and/or the editor(s) disclaim responsibility for any injury to people or property resulting from any ideas, methods, instructions or products referred to in the content. |
© 2026 by the authors. Licensee MDPI, Basel, Switzerland. This article is an open access article distributed under the terms and conditions of the Creative Commons Attribution (CC BY) license.