


Abstract
Low-intensity pulsed ultrasound (LIPUS) has antitumor potential, but its effects on tumor cell mechanics remain poorly understood. In this study, photonic crystal cellular force microscopy (PCCFM) enabled time-resolved mechanical measurements of colorectal cancer cells after LIPUS treatment. Serial PCCFM structural-color and corresponding bright-field images were acquired to reconstruct the vertical stress and substrate deformation in cell-associated regions; integration of the reconstructed stress over defined regions yielded quantitative collective and single-cell vertical force measurements LIPUS altered the time course of collective cellular force after seeding exhibiting distinct collective response patterns. Single-cell analysis further showed marked intercellular heterogeneity in force magnitude and temporal profiles. These mechanical changes were accompanied by altered F-actin organization, fewer peripheral protrusions, and reduced migration and invasion indices, indicating concordant changes in cellular force and motility-related structural and functional phenotypes. In vivo, xenografts derived from LIPUS-pretreated cells had reduced final xenograft volume and tumor weight. Piezo1 immunofluorescence and Ca2+ imaging suggested an association between mechanosensitive-channel signaling and the observed mechanical changes. Overall, PCCFM resolved temporal vertical force responses to LIPUS and revealed associations among LIPUS treatment, cellular mechanics, and motility- and growth-related phenotypes. Therefore, PCCFM provides a label-free, visual, and quantitative cellular-force sensing approach for assessing the dynamic responses of tumor cells to external mechanical stimulation.
1. Introduction
Colorectal cancer is a common malignancy of the digestive system, and its poor prognosis is closely associated with sustained tumor-cell proliferation, local invasion, and distant metastasis [1]. In addition to molecular regulation, mechanical interactions between tumor cells and the extracellular matrix contribute to these malignant behaviors [2,3]. Cells generate and transmit forces to the matrix through actomyosin contractility and adhesion structures, and this mechanical output reflects cytoskeletal tension, cell–matrix coupling, and cell motility [4,5,6]. Aberrant force generation and transmission can affect cell polarity, adhesion turnover, and invasive motility and are associated with malignant phenotypes in colorectal cancer [2,3,4,5,7]. Cellular force is therefore not merely a physical consequence of cellular contractility but also an important quantitative parameter linking intracellular mechanical regulation to functional phenotypes such as migration and invasion. Recent biomechanical phenotyping has also shown that colorectal cancer cell migration and EMT are accompanied by dynamic changes in cell stiffness and membrane microviscosity [8].
Cellular force can also serve as a mechanical readout of how tumor cells respond to external physical stimulation. One such stimulus, low-intensity pulsed ultrasound (LIPUS), delivers energy to cells in the form of pulsed mechanical waves and can affect tumor-cell migration [9,10,11] and growth [12,13]. These processes involve cytoskeletal tension and cell–matrix mechanical coupling, providing a rationale for examining cellular force following LIPUS treatment. Mechanosensitive pathways may link this external stimulus to intracellular responses. Stretch activation has also been described for other mechanosensitive channels, including TRPC6 [14]. Piezo1 responds to membrane tension and regulates Ca2+ influx, thereby influencing cytoskeletal organization and motility-related processes [15,16,17,18,19], and is therefore a candidate signal to examine alongside the force response. Recent studies have further linked low-intensity ultrasound to cytoskeletal and junctional remodeling, cytoskeleton-associated nuclear-envelope damage, and tumor-cell responses that vary with acoustic parameters and cellular context [20,21,22]. However, previous studies of LIPUS-induced responses in tumor cells have predominantly focused on endpoint measurements of cell viability, morphology, cytoskeletal organization, and migration, leaving the temporal evolution of cellular force largely unexplored. How cellular force evolves following LIPUS treatment, whether individual cells exhibit different response patterns, and whether these changes accompany tumor-related phenotypes and Piezo1-associated signaling remain unclear.
Atomic force microscopy, traction force microscopy [23,24], and micropillar arrays [25] have been used to investigate cellular mechanics, but these methods differ in their capacity for wide-field continuous imaging, high-throughput measurement, and long-term cell tracking [26,27,28,29,30]. Because cellular force varies over time and among individual cells, population-level endpoint measurements may obscure differences in response magnitude and temporal progression, creating a need for longitudinal measurements at both collective and single-cell levels. Photonic crystal cellular force microscopy (PCCFM) employs a periodic array of SiO2 microspheres immobilized within a hydrogel as a photonic crystal substrate (PCS). Cell-generated forces alter the local microsphere spacing and shift the reflection peak. By converting structural color changes into reflection wavelength shifts, substrate deformation, and stress, PCCFM enables the reconstruction of spatial stress distributions and the calculation of integrated force within cell-associated regions [31]. PCCFM has previously been used to characterize mechanical changes during cell adhesion [31,32], migration [33], and cell-state transitions [34,35]. Its wide-field, label-free, and time-resolved imaging capabilities therefore support the analysis of collective force dynamics and intercellular heterogeneity in single-cell force responses.
In this study, PCCFM was used to measure the time-dependent cellular force responses of LIPUS-treated colorectal cancer cells over 0.25–48 h at both collective and single-cell levels. The cellular response to LIPUS was examined at three interconnected levels: dynamic cellular force, tumor-related structural and functional phenotypes, and Piezo1-related Ca2+ signaling. Cellular force measurements were therefore integrated with analyses of cytoskeletal organization, migration, invasion, proliferation, and subsequent xenograft formation, while Piezo1 immunofluorescence and Ca2+ imaging were used to explore the accompanying mechanosensitive signaling. This integrated analysis aimed to establish the relationship between LIPUS-associated mechanical responses and antitumor phenotypes, thereby providing a biomechanical perspective on the cellular effects of LIPUS.
2. Materials and Methods
2.1. Cell Culture and LIPUS Treatment
2.1.1. Cell Culture
Human colorectal cancer cell lines SW480 (CTCC-001-0017) and SW620 (CTCC-001-0353) were purchased from Zhejiang Meisen Cell Technology Co., Ltd., Hangzhou, Zhejiang, China. Cells were cultured in Dulbecco’s modified Eagle’s medium (DMEM; KGL1002-500, Jiangsu KeyGEN BioTECH Co., Ltd., Nanjing, Jiangsu, China) supplemented with 10% fetal bovine serum (10099141C, Thermo Fisher Scientific, Waltham, MA, USA) and 1% penicillin–streptomycin solution (15140122, Thermo Fisher Scientific, Waltham, MA, USA). Cells were maintained in a humidified incubator at 37 °C with 5% CO2, and the culture medium was replaced every 2–3 days. When the cells reached approximately 80% confluence, they were washed with phosphate-buffered saline (PBS) and digested with trypsin containing 0.25% EDTA for 2–3 min. After cell detachment, complete culture medium was added to terminate digestion. The cells were centrifuged at 1000–1200 rpm for 5 min, resuspended in fresh medium, and used for experiments during the logarithmic growth phase.
2.1.2. LIPUS System and Cell Treatment
In vitro LIPUS stimulation was performed using a Chattanooga 4776 portable therapeutic ultrasound device equipped with a transducer with an effective radiating area of 5 cm2. The system consisted of the ultrasound device, an ultrasound transducer, a steel support frame, and a water tank containing degassed water maintained at 37 °C. The transducer was completely immersed in the degassed water, and the cell culture dish was positioned on the support frame above the transducer, with a distance of approximately 5 cm between the bottom of the dish and the transducer surface. All experiments were performed in pulsed mode at a frequency of 1 MHz.
Before ultrasound treatment, the cells were detached and resuspended in serum-free medium. A total of 2 mL of the cell suspension was added to a 35 mm culture dish and allowed to rest on the support frame for 5 min. Cells in the treatment groups were exposed to LIPUS using the specified parameters, whereas cells in the control group were placed under the same conditions without ultrasound activation. After treatment, the cells were collected, centrifuged, resuspended in complete culture medium, counted, and seeded according to the requirements of the subsequent experiments. Unless otherwise specified, the principal treatment conditions were 1 MHz, a 20% duty cycle, and an exposure duration of 5 min, with acoustic pressures of either 0.25 or 0.54 MPa.
2.1.3. Exploratory Assessment of LIPUS Parameters and Cell Viability
A Cell Counting Kit-8 (CCK-8) assay was used to compare the effects of different LIPUS parameters on the viability of SW480 and SW620 cells. For the acoustic-pressure assessment, cells were exposed to 0, 0.25, 0.54, or 1.09 MPa at a fixed duty cycle of 20% and an exposure duration of 5 min. For the exposure-duration assessment, cells were treated for 5, 10, or 20 min at a fixed acoustic pressure of 0.25 MPa and a 20% duty cycle. For the duty-cycle assessment, duty cycles of 20% and 50% were evaluated at a fixed acoustic pressure of 0.25 MPa and an exposure duration of 5 min. Acoustic pressures of 0.25, 0.54, and 1.09 MPa corresponded to hydrophone measurements obtained at the nominal device intensities of 0.1, 0.5, and 1.5 W/cm2, respectively.
Following treatment, the cell concentration was adjusted to 4 × 10⁵ cells/mL, and the cells were seeded into 96-well plates at 100 µL per well. Six replicate wells were included for each condition, and the cells were cultured for 24 h. A working solution was prepared by mixing the CCK-8 reagent with culture medium at a ratio of 1:10. Each well received 100 µL of the working solution and was incubated at 37 °C in the dark for 1 h, after which the absorbance at 450 nm was measured. Blank wells containing only culture medium and CCK-8 reagent were included.
2.2. PCS Fabrication and Characterization
2.2.1. Preparation of the Photonic Crystal Hydrogel
The PCS prepolymer solution consisted of 4.8% acrylamide (79-06-1, Shanghai Macklin Biochemical Co., Ltd., Shanghai, China), 0.264% N,N′-methylenebisacrylamide (146072, Sigma-Aldrich, St. Louis, MO, USA), a suspension of 145 nm SiO2 nanospheres at a concentration of 0.75 g/mL (Nanjing Caina Biotechnology Co., Ltd., Nanjing, Jiangsu, China), 2% Irgacure 2959 (410896, Thermo Fisher Scientific, Waltham, MA, USA), 5% (v/v) glycerol, and deionized water. Irgacure 2959 was dissolved in dimethyl sulfoxide and then mixed with the SiO2 suspension and the acrylamide/crosslinker stock solution to prepare the prepolymer solution.
A 2.4 µL aliquot of the prepolymer solution was deposited onto the surface of a hydrophobic tempered glass plate. A vinyl-modified 1 × 1 cm2 glass coverslip was placed over the solution and gently pressed to form a layer approximately 24 µm thick. The PCS was polymerized by irradiation with 365 nm ultraviolet light at an intensity of 500 mW/cm2 for 15 s. After polymerization, the PCS was detached from the glass surface in warm water at 40 °C, transferred to PBS for storage, and screened using reflection microscopy and a fiber-optic spectrometer. Substrates with uniform structural color and reflection peak distributions were selected for subsequent experiments.
2.2.2. PCS Surface Functionalization
Before use, the PCS was gently washed three times with PBS. Sulfo-SANPAH (A35395, Thermo Scientific, Waltham, MA, USA) was resuspended in 1.5 mL of PBS and applied to the PCS surface. The substrate was then irradiated with a 170 W ultraviolet light source for 10 min until the solution changed from pale red to dark red. After the reaction, residual crosslinker was removed by washing with PBS. The PCS surface was subsequently covered with a type I rat-tail collagen working solution at a final concentration of 0.2 mg/mL (A1048301, Gibco, Thermo Fisher Scientific, Waltham, MA, USA) and incubated overnight at 4 °C in a humidified chamber. Before cell seeding, the PCS was immersed in 40% (v/v) ethanol for 20 min for disinfection and then washed at least three times with culture medium to remove residual ethanol.
Before cell experiments, each PCS was equilibrated in the corresponding culture medium for 72 h to allow swelling and initial optical changes to stabilize. Substrates with uniform structural color and reflection peaks were then selected. All groups underwent the same preparation and pre-equilibration procedure.
2.2.3. SEM and Optical Characterization
Three PCS samples with uniform structural color were selected and immersed in sterile water for 3 days to allow complete swelling. The samples were then freeze-dried, sputter-coated with an approximately 30 nm gold layer, and examined using a field-emission scanning electron microscope (Ultra Plus, Carl Zeiss Microscopy GmbH, Oberkochen, Germany) to visualize the periodic arrangement of the nanospheres and the gaps between adjacent nanospheres.
PCS reflection spectra were measured using an optical microscopy system equipped with a spectrometer. A tungsten–halogen lamp was used as the illumination source, and reflected signals were collected through a liquid crystal tunable filter and a beam-splitting filter. White-balance calibration was performed before image acquisition, and all images were obtained using identical settings for ISO, gain, exposure time, illumination intensity, and objective magnification.
To minimize the effects of inter-batch and inter-substrate optical variation on force reconstruction, the initial reflection spectrum of each PCS was measured under identical illumination and acquisition conditions before the experiment. PCS samples exhibiting uniform structural color and reflection peaks within the predefined range were selected for cell experiments. PCS samples prepared using the same formulation were used in all treatment groups, and images were acquired using identical microscope, illumination, objective, exposure-time, gain, and white-balance settings. For each PCS, the reflection peak from a cell-free region within the imaging field was used as the local reference to reduce the influence of differences in the initial structural color among PCS samples on force calculations.
A fully swollen PCS Young’s modulus of 20 kPa was used. Colorectal tumors have spatially heterogeneous stiffness [36]; local ECM-rich structures can reach approximately 10–20 kPa, although this does not represent bulk tumor stiffness [37]. Hydrogels including a 20 kPa condition have also been used to study colon cancer mechanophenotypes [38]. The PCS formulation was retained from the established PCCFM platform to standardize structural color, deformation conversion, and force measurements [31].
2.3. PCCFM Imaging and Cellular Force Reconstruction
2.3.1. Time-Resolved PCCFM Imaging
A 1 × 1 cm2 PCS was placed in each well of a 24-well plate. Following LIPUS treatment, SW480 or SW620 cells were seeded onto the PCS at a density of 6 × 10⁴ cells/mL in a total volume of 500 µL per well. The cells were cultured at 37 °C with 5% CO2. PCCFM reflection images and corresponding bright-field images were acquired at 0.25, 0.5, 1, 2, 4, 8, 16, 24, and 48 h after cell seeding. Bright-field images were obtained by activating the upper illumination source and deactivating the reflection-filter module, whereas PCCFM images were acquired in reflection mode. All images were acquired at 37 °C using identical imaging parameters.
2.3.2. Image Conversion and Vertical Force Calculation
PCCFM images were processed using MATLAB R2025b. Image reconstruction followed the previously established PCCFM analysis workflow and the hue–reflection peak wavelength calibration relationship [31,32]. Briefly, the RGB signal of each pixel in the dynamic PCCFM images was converted into the HSV color space to extract the hue value. The hue value was subsequently mapped to the corresponding reflection peak wavelength using the established calibration curve. The same calibration relationship, image-processing procedure, and analysis parameters were applied to all experimental groups. The local reflection peak shift induced by cellular forces was used to calculate the vertical strain εz of the PCS:
where D and λ represent the initial thickness and reflection peak wavelength of the PCS, respectively, and ΔD and Δλ represent the corresponding changes in thickness and reflection peak wavelength. The vertical strain was converted into an estimate of local vertical stress () using the simplified PCCFM relationship reported in Equation (3) of Li et al. [31]. That calculation framework was developed from isotropic linear elasticity using the nearly incompressible hydrogel approximation. That calculation framework was developed from isotropic linear elasticity using the nearly incompressible hydrogel approximation. The general three-dimensional isotropic linear elastic constitutive equation is given by:
where and are the stress and strain tensors, respectively, is the volumetric strain, and δij is the Kronecker delta. For incompressible materials (= 0), this equation simplifies to:
Focusing on the vertical direction, this yields the simplified relationship:
where E is the Young’s modulus of the fully swollen PCS (20 kPa), and is the assumed Poisson’s ratio (0.49), following the established PCCFM model [31]. The resulting absolute stress and force estimates depend on this calculation model and its material parameters. The force exerted by an individual cell or a cell population within a defined region of interest was estimated by integrating the local vertical stress over that region:
where denotes the local vertical stress and Spixel represents the actual area of a single pixel.
The optical conversion and vertical force calculation follow the previously characterized PCCFM platform [31,32]. Previous platform studies compared PCCFM with TFM [31] and with FluidFM measurements of single-cell adhesion during regulated cell death [34]. The latter comparison supported overall consistency in normalized force trends, while the methods measured different physical quantities [34]. No additional TFM or AFM experiment was performed in the present LIPUS study.
Collective cellular force was defined as the integrated vertical force within a fixed 2.78 mm2 field. Initial fields were selected to have approximately similar cell numbers and densities, relatively even cell distributions, and no pronounced aggregates or large cell-free regions. The same field was followed over time, using identical seeding density, imaging settings, analysis area, and integration procedures across groups.
For cross-sectional single-cell analysis, 30 adherent cells with intact, clearly distinguishable boundaries were randomly sampled from one PCS per condition at each analyzed time point. Detached or visibly disintegrated cells were excluded. Separately, five cells randomly selected at 0.25 h and successfully followed through 4 h were used for exploratory longitudinal analysis. Tracking required clear boundaries, reliable spatial identification, and continued presence within the field. Their extracted force values and trajectories were presented descriptively, without inferential statistics or estimation of population frequencies.
2.4. Immunofluorescence Analysis of the Cytoskeleton and EMT-Related Markers
Following LIPUS treatment, SW480 or SW620 cells were seeded onto collagen-coated chamber slides and cultured for 24 h. The cells were fixed with 4% paraformaldehyde for 15 min, washed with PBS, permeabilized with 0.5% Triton X-100 for 5 min, and blocked with 5% bovine serum albumin (BSA) for 1 h at room temperature. F-actin was stained using an Actin-Tracker Green-488 fluorescent probe (C2201S, Beyotime, Shanghai, China), and the nuclei were counterstained with DAPI.
For the detection of epithelial–mesenchymal transition (EMT)-related markers, cells were incubated overnight at 4 °C with antibodies against E-cadherin (AF6759), N-cadherin (AG1554), or vimentin (AF0318; all from Beyotime, Shanghai, China). After washing with PBS, the cells were incubated with fluorescence-conjugated secondary antibodies matched to the host species of the primary antibodies for 1 h at room temperature in the dark. The nuclei were subsequently counterstained with DAPI. Fluorescence images were acquired using an ECLIPSE Ti2 inverted fluorescence microscope (Nikon Corporation, Tokyo, Japan) or a laser-scanning confocal microscope (Olympus, Tokyo, Japan). Identical microscope settings and image-acquisition parameters were used for all groups. Peripheral cellular protrusions were counted, and the mean fluorescence intensities of the EMT-related markers were measured using ImageJ v1.54r.
2.5. Cell Migration and Invasion Assays
2.5.1. Wound-Healing Assay
Following LIPUS treatment, the cell concentration was adjusted to 1 × 10⁶ cells/mL. Cells were seeded into 24-well plates at 500 µL per well and cultured for 24 h to form a confluent monolayer. The cells were then serum-starved for 24 h, and a linear wound was generated through the center of the monolayer using a sterile 20 µL pipette tip. Detached cells were removed by washing twice with PBS, after which serum-free medium was added. Bright-field images of the same fields were acquired at 0, 24, and 48 h after scratching. The wound area was measured using ImageJ, and the wound-closure rate was calculated relative to the wound area at 0 h.
2.5.2. Transwell Migration and Invasion Assays
Following LIPUS treatment, SW480 cells were resuspended in serum-free DMEM at 2 × 10⁶ cells/mL. A 100 µL aliquot of the cell suspension was added to the upper chamber of a 24-well Transwell insert with an 8.0 µm pore size, while complete medium containing 10% FBS was added to the lower chamber.
For the migration assay, the cells were incubated for 24 h. Non-migrated cells on the upper surface of the membrane were removed, and the membranes were washed with PBS, fixed with 4% paraformaldehyde for 15 min, and stained with 0.1% crystal violet for 15 min. Multiple fields were randomly selected for imaging, and cells on the lower surface of the membrane were counted.
For the invasion assay, the upper surface of the membrane was precoated with 1 mg/mL Matrigel (356234, Corning, NY, USA), incubated at 37 °C for 2 h, and hydrated for 30 min. Following cell seeding, the inserts were incubated for 48 h. All subsequent fixation, staining, imaging, and quantification procedures were identical to those used in the migration assay.
2.6. Cell Proliferation Assays
2.6.1. EdU Incorporation Assay
SW480 and SW620 cells were treated with LIPUS at 0, 0.25, or 0.54 MPa and then seeded into 96-well plates at 4 × 10⁵ cells/mL in a volume of 100 µL per well. After overnight culture, cell proliferation was evaluated using an EdU Cell Proliferation Assay Kit (C0071L, Beyotime, Shanghai, China). EdU working solution was added to a final concentration of 10 µM, and the cells were incubated at 37 °C for 2 h. The cells were subsequently fixed with 4% paraformaldehyde for 15 min, permeabilized with 0.5% Triton X-100 for 15 min, and incubated with the click-reaction solution for 30 min at room temperature in the dark. After nuclear counterstaining with DAPI for 5 min, fluorescence images were acquired. The percentage of EdU-positive cells was calculated as the number of EdU-positive cells divided by the total number of DAPI-positive cells.
2.6.2. Colony-Formation Assay
SW480 and SW620 cells were treated with LIPUS at 0, 0.25, 0.54, or 1.09 MPa, diluted to 500 cells/mL, and seeded into 6-well plates at 2 mL per well. Three replicate wells were included for each condition. Cells were cultured for 14 days, and the culture medium was replaced every 3 days. When individual colonies contained more than 50 cells, the cells were fixed with 4% paraformaldehyde for 10 min and stained with 0.5% (w/v) crystal violet solution (C0121-100 mL, Beyotime, Shanghai, China) for 15 min. After washing, air-drying, and imaging, the colonies were counted using ImageJ. Colony-formation results for each treatment group were normalized to those of the corresponding control group.
2.7. Piezo1 Immunofluorescence and Ca2+ Imaging
2.7.1. Analysis of PIEZO1 Expression Using Public Colorectal Cancer Data
PIEZO1 transcript levels were compared between colorectal tumor and normal intestinal tissues using Gene Expression Profiling Interactive Analysis (GEPIA; http://gepia.cancer-pku.cn/index.html (accessed on 15 July 2025)), a public web resource based on The Cancer Genome Atlas (TCGA) data. The analysis included 275 tumor samples and 41 normal samples. Furthermore, tumors with higher PIEZO1 expression were evaluated using an “expression box plot” module and normal colorectal tissue data were used as the reference group. The cut-off of |Log2FC| (fold change) and p-value were 1 and 0.05, respectively.
2.7.2. Piezo1 Immunofluorescence
Following LIPUS treatment, SW480 and SW620 cells were seeded onto collagen-coated four-well chamber slides at 1 × 10⁵ cells/mL in a volume of 500 µL per well and cultured for 24 h. The cells were fixed with 4% paraformaldehyde for 15 min, washed with PBS, and blocked with 5% BSA for 1 h at room temperature. The cells were then incubated overnight at 4 °C with a rabbit anti-Piezo1 primary antibody (1:200; 28511-1-AP, Proteintech, Wuhan, China). After washing with PBS, the cells were incubated with an Alexa Fluor 488-conjugated anti-rabbit secondary antibody (1:1000; A-11008) for 1 h at room temperature in the dark. The nuclei were counterstained with DAPI for 5 min, and the samples were mounted and imaged using a confocal microscope. The mean intracellular fluorescence intensity of Piezo1 was measured using ImageJ. Nuclear and cytoplasmic regions were delineated separately, and the nuclear-to-cytoplasmic fluorescence intensity ratio was calculated.
2.7.3. Fluo-4 Ca2+ Imaging
On day 0, SW480 and SW620 cell suspensions were treated with LIPUS at 0, 0.25, or 0.54 MPa and then seeded into 96-well plates at 5 × 10⁴ cells per well. After 24 h of culture, the cells were washed twice with PBS. Each well then received 100 µL of 2 µM Fluo-4 working solution (S1061S, Beyotime, Shanghai, China) prepared in basal DMEM, and the cells were incubated at 37 °C for 15 min in the dark. After two additional washes with PBS, fluorescence images were acquired under 488 nm excitation at 0, 1, 3, 5, 8, and 10 min. In the positive-control group without prior LIPUS treatment, the Piezo1 agonist Yoda1 (HY-18723, MedChemExpress, USA) was added at 3 min to a final concentration of 10 µM and washed out at 5 min. In the LIPUS-treated groups, the mechanosensitive ion-channel inhibitor GsMTx4 (HY-P1410, MedChemExpress, Monmouth Junction, NJ, USA) was added at 3 min to a final concentration of 5 µM. Time-dependent changes in Fluo-4 fluorescence were quantified using ImageJ.
2.8. Combined Treatment with 5-Fluorouracil
SW480 cells were initially treated with 100, 200, 400, 600, or 800 µM 5-fluorouracil (5-FU), and a concentration–response curve was fitted using the cell-viability data. For the combined-treatment experiments, cells were exposed to LIPUS at 0, 0.25, or 0.54 MPa on day 0. After 24 h of culture, 60 µM 5-FU was added, and the cells were cultured for an additional 24 h before cell viability was measured using the CCK-8 assay. SW480 and SW620 cells were evaluated using the same treatment schedule.
2.9. Xenograft Formation Following LIPUS Pretreatment of Cells
2.9.1. Subcutaneous Xenograft Model
Female athymic BALB/c nude mice aged 4–6 weeks were maintained under specific pathogen-free conditions with a 12 h light/dark cycle and free access to food and water. After acclimatization, mice were randomly allocated to the control, 0.25 MPa, and 0.54 MPa groups (n = 5 mice per group; 15 mice in total). SW480 cells were left untreated or pretreated with LIPUS at the corresponding acoustic pressure using the same protocol as that used in the in vitro experiments. Immediately after exposure, viable cells were counted by 0.4% trypan blue exclusion, and each suspension was adjusted so that each mouse received 1 × 10⁶ trypan-blue-negative viable cells by subcutaneous flank injection. Thus, viable cell input was matched across groups. All experimental protocols were approved by the Institutional Animal Care and Use Committee (IACUC) of Southeast University (Approval No.: SEU-IACUC-20260918-001). Upon termination, mice were euthanized, and tumor tissues were harvested, photo-graphed, measured and weighed for further histological and molecular detection. Tumor size was measured weekly using a vernier caliper. Tumor volume was calculated using the formula: V = 0.5 × L × W2, where L indicates the maximum tumor length and W indicates the maximum tumor width perpendicular to the long axis.
2.9.2. Ki-67 Immunohistochemistry and Quantitative Analysis
Tumor tissues were embedded in optimal cutting temperature (OCT) compound and frozen. Frozen sections were air-dried and fixed in 4% paraformaldehyde. Endogenous peroxidase activity was quenched and non-specific protein binding was blocked. Tissue sections were incubated with primary Ki-67 antibody (Abcam, ab16667, 1:200) overnight at 4 °C, followed by incubation with HRP-conjugated secondary antibody. Immunoreactive signals were visualized with DAB chromogen, and cell nuclei were counterstained with hematoxylin. Quantitative analysis of Ki-67 staining was performed and three random 40× microscopic fields were captured, while necrotic, folded, and poorly stained areas were excluded. Cell nuclei were classified into high positive, positive, low positive, and negative groups according to the staining intensity. The Ki-67 proliferation index was defined as the percentage of total positive nuclei (high positive + positive + low positive) relative to the total number of nuclei in each field. The average value of multiple fields from each tumor section was calculated and used for statistical comparison.
2.10. Statistical Analysis
Statistical analyses were performed using GraphPad Prism 9.5.0; figures were prepared using GraphPad Prism 9.5.0. Continuous variables are presented as the mean ± standard deviation (SD). Comparisons between two independent groups were performed using an independent-samples Student’s t-test, whereas comparisons among multiple groups were conducted using one-way analysis of variance (ANOVA). Collective force trajectories were evaluated using two-way repeated-measures ANOVA on log10-transformed force values, with the Geisser–Greenhouse correction and Šídák-adjusted comparisons between treatment groups at each time point. SW480 and SW620 single-cell values were summarized on the original nN scale. The 30-cell cross-sectional samples and five longitudinal trajectories were analyzed descriptively; cells sharing a PCS were not treated as independent biological replicates, and no inferential test was applied to the five tracked cells. Unless otherwise specified, other experiments were independently repeated three times (n = 3 independent biological replicates). The xenograft experiments used five mice per group. A two-sided p < 0.05 was considered statistically significant. Statistical significance is indicated in the figures as follows: * p < 0.05, ** p < 0.01, and *** p < 0.001.
3. Results
3.1. A PCCFM-Based Framework for Time-Resolved Cellular Force Analysis Following LIPUS Treatment
The structural-color sensing principle, vertical force reconstruction method, and wide-field imaging capability of PCCFM have been established in previous studies. Here, PCCFM was applied to characterize the time-dependent and heterogeneous responses of colorectal cancer cells to LIPUS. A workflow integrating mechanical stimulation, longitudinal force imaging, collective and single-cell force analysis, and association with biological phenotypes was established (Figure 1a).
Figure 1.
PCCFM workflow and force reconstruction for LIPUS response analysis. (a) Conceptual framework integrating LIPUS stimulation, time-resolved PCCFM imaging, collective and single-cell force analysis, and biological phenotype analysis. (b) Macroscopic appearance and microstructure of the photonic crystal substrate (PCS). The PCS exhibited a uniform green structural color; scale bar, 2 mm. The scanning electron microscopy image shows the periodic hexagonal arrangement of SiO2 nanospheres within the hydrogel, with gaps retained between adjacent nanospheres; scale bar, 200 nm. (c) PCCFM image-processing and vertical-force reconstruction workflow used in this study. Based on the previously established method, the workflow comprised color-signal conversion, reflection peak wavelength extraction, substrate deformation calculation, stress reconstruction, and vertical-force calculation and was applied to the time-resolved analysis of cellular forces following LIPUS treatment. (d) Representative raw PCCFM color image, reconstructed stress map, and three-dimensional deformation map. Local structural-color changes within cell-associated regions were converted into spatial stress and substrate deformation distributions based on reflection peak shifts; scale bar, 250 µm.
The photonic crystal substrate (PCS) used in this study consisted of a periodic nanosphere array immobilized within a hydrogel. The photograph shows the macroscopic appearance of the PCS, whereas scanning electron microscopy revealed the periodic arrangement of the nanospheres within the hydrogel matrix (Figure 1b). To convert structural-color signals into quantitative mechanical measurements, we used the previously established image-reconstruction workflow. Pixel-level hue values were extracted from the original PCCFM images and converted into reflection wavelengths and local deformations. Vertical stress was then calculated using the mechanical properties of the PCS, and cellular force was obtained by integrating the stress over the defined region of interest (Figure 1c).
To establish the correspondence between the optical signals and spatial mechanical information, raw PCCFM color images were acquired from cell-associated regions, followed by the reconstruction of stress distributions and three-dimensional substrate deformation based on reflection peak shifts. Representative images showed that cell adhesion induced localized optical changes that spatially corresponded to the reconstructed stress and substrate deformation regions (Figure 1d). These results support the use of this imaging and reconstruction workflow to characterize the spatial mechanical responses of LIPUS-treated cells.
3.2. PCCFM Reveals Dynamic Vertical Force Responses, Single-Cell Variation, and Cytoskeletal Changes Following LIPUS Treatment
3.2.1. Dynamic Changes in Collective Cellular Force
Before PCCFM measurements and phenotypic assays, the effects of different LIPUS parameters on the viability-associated CCK-8 signal were evaluated using the CCK-8 assay (Figure S1). Under the corresponding fixed conditions, the CCK-8 signal generally decreased with increasing acoustic pressure, exposure duration, and duty cycle, with SW480 and SW620 cells showing similar trends. Considering both the observed changes in the CCK-8 signal and the requirements of the subsequent experiments, a frequency of 1 MHz, a duty cycle of 20%, and an exposure duration of 5 min were selected. Acoustic pressures of 0.25 and 0.54 MPa were used to examine cellular responses under relatively low- and high-pressure conditions, respectively.
After defining the LIPUS treatment conditions, we examined whether LIPUS altered the temporal dynamics of collective cellular force in colorectal cancer cells. As illustrated in Figure 2A, control and 0.54 MPa LIPUS-treated cells were seeded onto the photonic crystal substrate, and PCCFM images were acquired at predefined time points. Stress distributions within a fixed field of view were reconstructed and integrated to calculate the collective cellular force. Here, “collective cellular force” refers to the PCCFM-estimated integrated vertical force within the fixed field of view, without cell-number or coverage-area normalization, rather than the mean force of individual cells.
Figure 2.
Dynamic cellular force and cytoskeletal responses of SW480 cells following LIPUS treatment. (A) Experimental workflow. Control and 0.54 MPa LIPUS-treated cells were seeded onto the PCS and subjected to PCCFM and bright-field imaging at the indicated time points. (B) Representative reconstructed stress maps of control and 0.54 MPa LIPUS-treated SW480 cells at 2, 8, 24, and 48 h after seeding, together with the corresponding temporal profiles of collective cellular force. Colors indicate the magnitude and direction of vertical stress; scale bar, 250 µm. Data are presented as the mean ± SD from three independent experiments. Force values were log10-transformed and analyzed using two-way repeated-measures ANOVA with the Geisser–Greenhouse correction, followed by Šídák’s multiple-comparisons test. The time-by-treatment interaction was significant (p = 0.0003). ns, not significant. * p < 0.005. (C) Representative PCCFM-derived stress maps of individual SW480 cells in the control and 0.54 MPa groups at different time points. At each time point, 30 cells were sampled from one PCS per condition for descriptive cross-sectional analysis; these cell observations were not independent biological replicates. Representative cells are shown. Scale bar, 100 µm. (D) PCCFM-derived stress maps of five SW480 cells randomly selected at the initial time point and continuously tracked at subsequent time points. Each column represents the same cell over time. Scale bar, 100 µm. (E) Corresponding force–time curves for the five cells shown in panel (D). Each curve represents the longitudinal mechanical response of one cell during the observation period. Panels (D,E) are exploratory examples; no inferential statistics or population-frequency estimates were derived from the five cells. (F) Representative morphological and F-actin fluorescence images of SW480 cells in the control, 0.25 MPa, and 0.54 MPa groups. Purple markings in the grayscale images indicate peripheral protrusions, and green fluorescence represents phalloidin-labeled F-actin. Regions enclosed by dashed boxes are shown at higher magnification on the right. Identical image-acquisition and display settings were used for all groups. Scale bars, 5 and 1 µm, respectively. (G) Quantification of peripheral protrusions in SW480 cells subjected to the indicated treatments. Statistical comparisons were performed using one-way ANOVA. *** p < 0.001.
In control SW480 cells, the collective cellular force showed an overall sustained increase from 384.99 ± 44.30 µN at 15 min after seeding to 3060.84 ± 367.10 µN at 48 h. By contrast, the collective force in the 0.54 MPa group reached 865.46 ± 121.73 µN at 15 min, subsequently decreased rapidly, and remained relatively low during the intermediate phase. Although a partial recovery was observed at later time points, the force remained lower than that in the control group at 48 h (1133.04 ± 43.80 vs. 3060.84 ± 367.10 µN; Figure 2B). A significant interaction between time and LIPUS treatment was detected (p = 0.0003). Subsequent comparisons showed that the collective force was higher in the 0.54 MPa group than in the control group at 15 min but lower at 4, 16, and 48 h (all p < 0.05). These findings indicate that LIPUS did not simply induce a uniform reduction in the collective force of SW480 cells. Instead, it shifted the force trajectory from a sustained increase to a dynamic pattern characterized by an early elevation, a subsequent decline, and a partial late recovery.
SW620 cells exhibited a temporal response pattern distinct from that of SW480 cells. In both groups, the collective cellular force was initially low, subsequently increased to relatively high levels at 60–120 min, and declined again at 240 min (Figure S2a,b). Two-way repeated-measures analysis of variance performed on log10-transformed data showed significant effects of time (p = 0.0005) and LIPUS treatment (p = 0.0019), whereas the time-by-treatment interaction was not significant (p = 0.4219). Moreover, none of the between-group differences at individual time points remained significant after Šídák correction. Thus, 0.54 MPa LIPUS treatment was associated with a lower overall level of collective cellular force in SW620 cells during the observation period but did not significantly alter the characteristic rise-and-fall temporal pattern.
3.2.2. Single-Cell Force Changes and Intercellular Heterogeneity
To determine whether the changes in collective cellular force were accompanied by similar trends at the single-cell level, we summarized the mean and dispersion of the force values obtained from 30 cells sampled from one PCS per condition at each time point (Figure 2C and Figure S2c). In the control group, these values increased over time, from 1.920 ± 0.130 at the initial time point to 2.885 ± 0.045 at the final analyzed time point. The 0.54 MPa group also exhibited an increase, from 0.815 ± 0.349 to 2.458 ± 0.096; however, its mean value remained lower than that of the corresponding control group at every time point.
The mean single-cell force of SW620 cells initially increased and subsequently declined. At 60 min, the values reached 4.086 ± 0.992 nN in the control group and 3.552 ± 0.816 nN in the 0.54 MPa group, after which both groups showed a decrease (Figure S2e). The mean force in the 0.54 MPa group was lower than that in the corresponding control group at all measured time points, although the two groups exhibited similar temporal patterns. Thus, the single-cell means and collective force measurements showed broadly consistent trends, with generally lower measured force values in both cell lines following LIPUS treatment. The distinct temporal patterns of SW480 and SW620 cells further suggest cell-line-dependent mechanical responses. Because the 30 cells analyzed at each time point constituted cross-sectional samples, these descriptive data summarize force values among the sampled cells but do not capture continuous changes in the same cells over time.
For exploratory visualization of individual response trajectories, five additional cells were randomly selected and continuously tracked from 0.25 to 4 h (Figure 2D,E). The five cells exhibited distinct force–time patterns during the observation period. The force values of cells 1 and 5 remained at approximately 0.11 nN, whereas those of cells 2 and 3 remained relatively stable at approximately 1.00 nN. In contrast, the force of cell 4 progressively increased between 2 and 4 h and reached 7.52 nN (Figure 2D,E). These trajectories revealed sustained low-force, relatively stable, and late-increasing response patterns under the same treatment condition.
Together, the collective force curves, force measurements from 30 individual cells, and longitudinal trajectories of five cells illustrate the ability of PCCFM to capture both overall LIPUS-associated force changes and cell-to-cell differences in temporal responses that are not apparent from population-level averages alone. Among the tracked cells, some maintained relatively high or progressively increasing force, illustrating the diversity of individual mechanical responses. These single-cell observations are exploratory, however, and do not establish the prevalence of particular response patterns or quantify mechanical heterogeneity across the wider cell population.
3.2.3. Peripheral Protrusions and the F-Actin Cytoskeleton
To investigate whether the force changes in SW480 cells were accompanied by alterations in force-generating structures, F-actin was labeled with phalloidin, and cellular morphology and peripheral protrusions were examined using enlarged local views (Figure 2F). Control SW480 cells were extensively spread and contained relatively continuous F-actin fibers arranged predominantly along the longitudinal cell axis and cell periphery. Numerous outward-extending protrusions were visible around the cell margins. Following treatment at 0.25 MPa, the cells largely retained their spread morphology, but F-actin organization was altered, and both the number and extension of peripheral protrusions were reduced. No pronounced overall cell contraction or rounding was observed in the 0.54 MPa group; however, continuous F-actin fibers were less abundant, with localized thick bundles or aggregates, and peripheral protrusions were further reduced.
Quantitative analysis showed a reduction in peripheral protrusions after treatment at 0.25 MPa. This reduction was more pronounced in the 0.54 MPa group, in which protrusion formation decreased to 10.79% of the control level (Figure 2G). Thus, although the overall spreading morphology of SW480 cells changed only modestly, their F-actin organization and peripheral protrusions showed marked responses to LIPUS treatment.
SW620 cells exhibited a similar direction of change. The number of filopodial protrusions at the leading edge decreased with increasing acoustic pressure, reaching 62.27% and 32.84% of the control level in the 0.25 and 0.54 MPa groups, respectively (Figure S3). Together, these results show that LIPUS-associated changes in cellular force occurred alongside F-actin reorganization and a reduction in peripheral protrusions.
3.3. Motility, Growth, and Xenograft Phenotypes Following LIPUS Pretreatment
3.3.1. Migration- and Invasion-Related Phenotypes
To evaluate motility-related phenotypes in colorectal cancer cells following LIPUS treatment, we first used a wound-healing assay to examine collective two-dimensional wound closure (Figure 3a). At 24 h after scratching, the wound-closure rates of SW480 cells were 49.23%, 34.37%, and 19.34% in the control, 0.25 MPa, and 0.54 MPa groups, respectively. The corresponding values for SW620 cells were 26.19%, 13.42%, and 2.26% (Figure 3b and Figure S3). At 48 h, the SW480 wound-closure rates in the control, 0.25 MPa, and 0.54 MPa groups were 77.19 ± 3.15%, 54.53 ± 3.03%, and 43.26 ± 5.66%, respectively (Figure 3c), whereas those of SW620 cells were 57.54% and 11.62%, respectively (Figure S3). Both cell lines exhibited lower wound-closure rates following LIPUS treatment, with a greater reduction at 0.54 MPa than at 0.25 MPa. The relative change was more pronounced in SW620 cells, suggesting that the magnitude of the response to LIPUS may differ between cell lines.
Figure 3.
Effects of LIPUS treatment on the migration, invasion, and tumor-forming phenotypes of SW480 cells. (a) Schematic illustration of the wound-healing assay performed after LIPUS treatment. (b) Representative bright-field images of SW480 cells in the control, 0.25 MPa, and 0.54 MPa groups at 0, 24, and 48 h after scratching. Scale bar, 500 µm. (c) Wound-closure rates of SW480 cells at 24 and 48 h after scratching. (d) Representative images from the Transwell migration and Matrigel invasion assays of SW480 cells in the control, 0.25 MPa, and 0.54 MPa groups. Scale bar, 100 µm. (e) Quantification of migrated and invaded cells. (f) Schematic illustration of the xenograft experiment using LIPUS-pretreated cells. (g) Representative xenografts derived from control and LIPUS-pretreated SW480 cells. (h) Terminal volumes of subcutaneous xenografts in nude mice. (i) Tumor weights measured at the experimental endpoint. (j) Representative Ki-67 immunohistochemical images of subcutaneous xenograft tissues. Scale bar, 100 µm. (k) Quantification of Ki-67-positive cells in the xenograft tissues. Panels (g–k): n = 5 mice per group; each mouse was an independent experimental unit. Green, blue, and orange bars represent the control, 0.25 MPa, and 0.54 MPa groups, respectively. Statistical comparisons were performed using one-way ANOVA followed by Tukey’s multiple-comparisons test. ns, not significant, * p < 0.05, ** p < 0.01, *** p < 0.001, and **** p <0.0001.
Transwell assays were subsequently used to evaluate transmigration and Matrigel invasion-related phenotypes in SW480 cells. Approximately 643 cells per field migrated to the lower surface of the membrane in the control group, compared with approximately 25 and 7 cells per field in the 0.25 and 0.54 MPa groups, respectively (Figure 3d). In the Matrigel invasion assay, approximately 575 invading cells per field were observed in the control group, whereas approximately 22 and 11 cells per field were detected in the 0.25 and 0.54 MPa groups, respectively (Figure 3e). The wound-closure rates and numbers of cells crossing the membrane showed concordant decreases, indicating that LIPUS treatment was accompanied by reductions in migration- and invasion-related endpoints.
3.3.2. EMT-Related Markers
To determine whether the observed changes in the cytoskeleton and peripheral protrusions were accompanied by alterations in motility-related phenotypes, we examined the immunofluorescence signals of E-cadherin, N-cadherin, and vimentin (Figure S4). Following LIPUS treatment, the relative E-cadherin fluorescence intensity increased to 1.43-fold that of the control in both SW480 and SW620 cells. In parallel, the N-cadherin and vimentin signals decreased to 57.89% and 67.31% of the respective control levels in SW480 cells and to 83.12% and 44.93% in SW620 cells, respectively. These findings show that LIPUS treatment was accompanied by an overall shift in EMT-related markers toward a more epithelial-like profile.
3.3.3. Effects of LIPUS on Colorectal Cancer Cell Proliferation and Cell Viability Following Combined Treatment with 5-FU
To determine whether LIPUS affected cell growth, EdU incorporation and colony-formation assays were used to evaluate DNA synthesis and long-term clonogenic capacity, respectively (Figure S5). The percentages of EdU-positive SW480 cells were 38.26%, 16.17%, and 8.43% in the control, 0.25 MPa, and 0.54 MPa groups, respectively. The corresponding percentages in SW620 cells were 41.54%, 23.52%, and 7.19%. In the colony-formation assay, the relative colony-formation rates of SW480 cells treated at 0.25, 0.54, and 1.09 MPa were 0.92, 0.41, and 0.01, respectively. SW620 cells exhibited a similar pressure-dependent downward trend. We next examined cell viability following combined treatment with LIPUS and 5-fluorouracil (5-FU). Cell viability was lower after combined treatment than after 5-FU treatment alone (Figure S6). Together, these results show lower DNA synthesis and long-term clonogenic growth after LIPUS treatment, alongside a lower viability-associated signal after combined treatment with 5-FU.
3.3.4. Tumor Growth and Ki-67 Proliferative Activity Following Implantation of LIPUS-Pretreated Colorectal Cancer Cells
A subcutaneous xenograft model was used to examine subsequent tumor growth following LIPUS pretreatment of SW480 cells before implantation (n = 5 mice per group; Figure 3f). After 5 weeks, the tumors were excised and weighed at the experimental endpoint to evaluate the growth of xenografts derived from control and LIPUS-pretreated cells. Xenografts originating from LIPUS-pretreated cells exhibited smaller final tumor volumes and reduced tumor weights relative to xenografts derived from untreated cells (Figure 3g,i). Notably, this suppressive effect on tumor growth was more pronounced in the group pretreated with higher acoustic pressure. Ki-67 positivity did not show a significant decrease in the 0.25 MPa group, whereas it was significantly lower in the 0.54 MPa group (Figure 3j,k). Thus, smaller final xenografts were observed at both pressures, but a significant reduction in endpoint Ki-67 positivity was detected only at 0.54 MPa. This indicates that the proliferation suppression shown by Ki-67 staining emerged under the higher acoustic pressure, demonstrating the antitumor effects of LIPUS. The weaker intrinsic antitumor activity of 0.25 MPa LIPUS, together with substantial inter-animal variability, likely accounted for the lack of statistically significant Ki-67 changes in this group. Thus, LIPUS pretreatment of colorectal cancer cells before implantation was as-sociated with reduced growth and proliferative activity in the resulting xenografts.
3.4. Piezo1 Immunofluorescence and Ca2+ Responses Following LIPUS Treatment
3.4.1. LIPUS Alters the Piezo1 Immunofluorescence Signal and Its Nucleocytoplasmic Distribution in Colorectal Cancer Cells
The cellular force and cytoskeletal findings suggested that LIPUS might activate mechanosensation-related signaling. To explore the potential involvement of Piezo1, we first examined its expression profile in colorectal cancer using The Cancer Genome Atlas (TCGA) dataset (Figure 4a). PIEZO1 expression was significantly higher in colorectal cancer tissues than in normal intestinal tissues, providing a disease-related context for the subsequent cell-level mechanical stimulation experiments. We then examined Piezo1 immunofluorescence following LIPUS treatment at different acoustic pressures to determine whether its signal changed in association with mechanical stimulation (Figure 4b–d). In SW480 cells, the normalized fluorescence intensities in the 0.25 and 0.54 MPa groups were 1.90- and 2.12-fold that of the control group, respectively. The corresponding values in SW620 cells were 1.78- and 2.25-fold (Figure S7). Thus, both cell lines exhibited progressively higher Piezo1 fluorescence signals across the acoustic pressures examined. To determine whether these changes were accompanied by altered subcellular distribution, the nuclear-to-cytoplasmic Piezo1 fluorescence intensity ratio was calculated (Figure 4d and Figure S7c). In SW480 cells, the ratio decreased from 1.28 in the control group to 0.29 and 0.24 in the 0.25 and 0.54 MPa groups, respectively. The corresponding values in SW620 cells were 1.01, 0.40, and 0.31. Imaging also showed reduced nuclear fluorescence and an apparent accumulation of the signal around the nuclear envelope following LIPUS treatment (Figure 4b and Figure S7a). Together, the changes in fluorescence intensity and nucleocytoplasmic distribution indicate that LIPUS treatment was accompanied by alterations in the Piezo1 immunofluorescence signal and its subcellular localization. Based on these observations, we next examined Piezo1-related Ca2+ dynamics.
Figure 4.
PIEZO1 expression in colorectal cancer tissue and LIPUS-associated Piezo1 and Ca2+ signals in SW480 cells. (a) Comparison of PIEZO1 mRNA levels between colorectal tumor tissues and normal intestinal tissues using the TCGA colorectal cancer dataset. (b) Representative Piezo1 immunofluorescence images of SW480 cells in the control, 0.25 MPa, and 0.54 MPa groups. Green indicates the Piezo1 fluorescence signal, and blue indicates DAPI-stained nuclei. Scale bar, 10 µm. (c) Relative Piezo1 fluorescence intensity in SW480 cells. (d) Ratio of Piezo1 fluorescence intensity in the nuclear and cytoplasmic regions. (e) Schematic illustration of LIPUS treatment, Fluo-4 staining, and time-series Ca2+ fluorescence imaging. Cells were stained with Fluo-4 and subjected to time-series imaging after LIPUS treatment followed by 24 h of culture. (f) Representative Fluo-4 fluorescence images of SW480 cells without LIPUS pretreatment acquired over 0–10 min. In the positive-control group, the Piezo1 agonist Yoda1 was added at 3 min. Scale bar, 50 µm. (g) Time-dependent changes in the Ca2+-positive fluorescent area of SW480 cells before and after Yoda1 addition. (h) Representative Fluo-4 fluorescence images of SW480 cells at imaging minute 1, 24 h after pretreatment with the indicated LIPUS acoustic pressures and after the addition of GsMTx4 at 3 min. Scale bar, 50 µm. (i) Ca2+-positive fluorescent area at 1 min in SW480 cells pretreated with the indicated LIPUS acoustic pressures. (j) Time-dependent changes in the Ca2+-positive fluorescent area of SW480 cells before and after GsMTx4 addition. The non-Piezo1-specific mechanosensitive-channel inhibitor GsMTx4 was added at imaging minute 3. Data are presented as the mean ± SD from three independent wells (n = 3). Statistical comparisons were performed using one-way ANOVA followed by Tukey’s multiple-comparisons test. * p < 0.05, ** p < 0.01, and *** p < 0.001.
3.4.2. Yoda1- and LIPUS-Associated Ca2+ Dynamics and the Effects of GsMTx4
To confirm that the imaging system could detect Ca2+ changes associated with Piezo1 activation, Yoda1 was first used as a positive stimulus (Figure 4e). The fluorescent area gradually decreased from 12.84% at 0 min to 9.51% before stimulation. Following the addition of Yoda1 at 3 min, it increased to 33.18% and then declined to 8.87% at 10 min after washout (Figure 4f,g). These results show that the imaging system could record a reversible agonist-associated Ca2+ signal. We subsequently compared Fluo-4 signals in cells examined 24 h after LIPUS pretreatment at different acoustic pressures (Figure 4h–j). At 1 min of the imaging sequence, the Ca2+-positive fluorescent area in SW480 cells increased from 2.69% in the control group to 9.13% and 16.88% in the 0.25 and 0.54 MPa groups, respectively. In SW620 cells, the corresponding values were 1.26%, 10.84%, and 21.41% (Figure S7d–f). Thus, LIPUS pretreatment was accompanied by a higher Ca2+ signal at the beginning of imaging, with a greater increase in the 0.54 MPa group than in the 0.25 MPa group.
To further investigate whether this Ca2+ response was associated with mechanosensitive ion-channel activity, GsMTx4 was added at 3 min (Figure 4e). In SW480 cells, the fluorescent areas in the control, 0.25 MPa, and 0.54 MPa groups decreased from 3.13%, 10.80%, and 18.31% at 1 min to 0.76%, 1.02%, and 0.93% at 5 min, respectively (Figure 4j). A similar direction of change was observed in SW620 cells (Figure S7e–f). The increase in Ca2+ fluorescence following Yoda1 treatment confirmed that the imaging system could detect Ca2+ changes associated with pharmacological Piezo1 activation. Cells examined 24 h after LIPUS pretreatment exhibited higher Fluo-4 fluorescence, which declined following the addition of GsMTx4. These observations suggest that the altered Ca2+ state following LIPUS pretreatment may be associated with mechanosensitive ion-channel activity. However, these data do not establish Piezo1 as the mediator of the LIPUS-associated Ca2+ response, and Piezo1 should be considered a candidate mechanosensor rather than a confirmed causal component.
4. Discussion
In this study, PCCFM was used to characterize the dynamic mechanical responses of LIPUS-treated colorectal cancer cells at both collective and single-cell levels. LIPUS altered the temporal evolution of cellular force in SW480 and SW620 cells, with the two cell lines exhibiting distinct response patterns and marked cell-to-cell het-erogeneity within each population. The mechanical changes were accompanied by F-actin reorganization, fewer peripheral protrusions, changes in EMT-related markers, and reductions in migration-, invasion-, and proliferation-related endpoints. Cells pretreated with LIPUS also exhibited a reduced capacity to form xenografts in vivo. In addition, Piezo1 immunofluorescence and Ca2+ imaging suggested that mechanosensitive ion-channel signaling may be associated with LIPUS-related mechanosensation. Together, these findings characterize the responses of colorectal cancer cells to LIPUS at three interconnected levels: dynamic cellular force, motility- and growth-related phenotypes, and candidate mechanosensory signaling.
Previous studies of LIPUS in colorectal cancer have mainly evaluated viability, proliferation, cytoskeletal organization, and migration at selected post-treatment time points [9], leaving the temporal evolution of cellular force and intercellular variation less well characterized. The present work extends these observations by resolving the time course of mechanical responses and intercellular heterogeneity. PCCFM converts cell-induced changes in the structural color and reflection peak of a photonic crystal substrate into spatial stress, substrate deformation, and integrated force measurements [31,32], thereby providing a visual approach for longitudinal monitoring of cellular mechanics. Compared with endpoint measurements at a single time point, the time-resolved analysis performed in this study identified early fluctuations, intermediate reductions, and partial late recovery in cellular force. It also revealed individual response patterns that were not evident from population-level measurements. The distinct temporal trajectories observed in SW480 and SW620 cells further indicate that LIPUS-associated mechanical responses are cell-line dependent. Previous comparisons with TFM [31] and FluidFM [34] provide complementary support for the established platform.
Several measurement considerations define the interpretation of these findings. PCCFM measures vertical deformation and estimates the corresponding stress and integrated force [31]. Although substantial normal displacements occur in adherent cells [39], changes in this component do not necessarily represent proportional changes in total traction. Its contribution to total mechanical work would require simultaneous measurement of in-plane traction and displacement. Collective force represents the integrated output within a fixed field and remains sensitive to cell number, coverage, adhesion, and spreading despite selection of fields with approximately similar initial cell numbers. Single-cell measurements complement this overall phenotype. However, the 30 cells sampled from a shared PCS are not independent biological replicates, and the five tracked cells illustrate temporal variation without establishing population frequencies or the extent of mechanical heterogeneity.
Following LIPUS treatment, changes in cellular force occurred concurrently with altered F-actin organization, fewer peripheral protrusions, and reduced migration- and invasion-related endpoints. Cellular force is generated primarily through actomyosin contractility, adhesion structures, and mechanical coupling between cells and the extracellular matrix, whereas protrusion formation, adhesion turnover, and cytoskeletal polarization are essential for migration [40,41,42,43]. The concordant direction of these changes suggests that the altered mechanical state after LIPUS treatment was associated with cytoskeletal remodeling and reduced motility-related phenotypes. At 0.54 MPa, cellular force changes were accompanied by a reduced CCK-8 signal, which may reflect altered cell number, metabolism, or proliferation rather than cell death alone. The force response may therefore involve both mechanical stimulation and secondary changes in cellular state. Cytoskeletal and motility-related changes were also observed at 0.25 MPa, indicating that these phenotypes were not confined to the higher-pressure condition. However, without corresponding time-resolved PCCFM measurements at 0.25 MPa, whether similar force responses occur at lower acoustic pressure remains unclear. Recent studies have likewise reported LIPUS-associated reorganization of cytoskeletal filaments and cell junctions, as well as mechanically coupled disruption of the cytoskeleton and nuclear envelope, although the exposure regimens and cellular models differed from those used here [20,21]. A recent study in hepatocellular carcinoma further reported divergent proliferation and migration outcomes under different LIPUS conditions, reinforcing the need for parameter- and cell-model-specific interpretation [22].
Reduced EdU incorporation and colony formation indicate that the effects of LIPUS pretreatment extended beyond short-term changes in cell viability to longer-term growth-related outcomes. The reduced tumor volumes and weights of xenografts derived from LIPUS-pretreated cells were consistent with the decreased proliferation-related endpoints observed in vitro. Tumor volume reflects cumulative tumor establishment and growth, whereas Ki-67 reflects proliferative activity at the sampling endpoint [44]; these measures therefore need not change in parallel. However, because LIPUS was applied to cells before implantation, these findings reflect a change in their subsequent tumor-forming capacity, not a therapeutic effect on established tumors. Collectively, the parallel changes in cellular force, cytoskeletal organization, motility, proliferation, and xenograft growth support associations among these phenotypes, but they do not establish that reduced cellular force directly mediates the observed effects.
The Piezo1-related findings provide exploratory evidence regarding the mechanosensory response to LIPUS. LIPUS treatment was accompanied by changes in Piezo1 immunofluorescence intensity and subcellular distribution, as well as enhanced Ca2+ fluorescence. The Ca2+ signal declined following the addition of GsMTx4, suggesting that mechanosensitive ion channels may contribute to the LIPUS-associated Ca2+ response. However, GsMTx4 is not a Piezo1-specific inhibitor, and changes in Piezo1 immunofluorescence do not directly indicate channel activity. Moreover, cellular force was not measured following Piezo1 knockdown, knockout, or functional rescue. Piezo1 should therefore be regarded as a candidate component of LIPUS-related mechanosensation rather than a directly established mediator of the observed force changes [15,16,17,18,19]. A recent mechanobiological framework proposes that cytoskeletal organization and membrane–cytoskeleton coupling may shape Piezo1 responses to oscillatory loading, including low-intensity ultrasound [45]. This framework provides a possible context for the present observations but does not establish Piezo1-mediated causality in the current experiments.
The mechanical analysis was limited to two colorectal cancer cell lines cultured in vitro. In vivo, tumor cells interact with the extracellular matrix (ECM), cancer-associated fibro1blasts (CAFs), immune cells, endothelial cells, and pericytes, all of which contribute to tissue mechanics and may respond to mechanical perturbation [2,3,46]. Colorectal tumors also exhibit spatial mechanical heterogeneity [36]. Matrix stiffness and stromal interactions regulate YAP/TAZ signaling [7,47], stemness [48,49], epithelial–mesenchymal plasticity [36,50], immune exclusion [51,52,53], and treatment response [54,55]. The present experiments therefore cannot determine how LIPUS affects these multicellular interactions or whether the observed changes are specific to malignant cells. Future studies should use co-culture systems, organoids, and orthotopic models, together with direct perturbation of Piezo1 and other mechanosensitive pathways, to determine whether the associations reported here are causal.
5. Conclusions
This study characterized the response of colorectal cancer cells to LIPUS across three interconnected levels: dynamic cellular force, tumor-related phenotypes, and Piezo1-related Ca2+ signaling. PCCFM revealed time-dependent vertical force responses at collective and single-cell levels, including cell-line-specific patterns and intercellular heterogeneity. These mechanical changes were accompanied by cytoskeletal remodeling and reductions in motility-, proliferation-, and tumorigenicity-related endpoints. Piezo1 immunofluorescence and Ca2+ imaging further provided exploratory evidence of accompanying mechanosensitive signaling. Together, these findings provide a biomechanical perspective on the antitumor-associated effects of LIPUS, although the underlying causal mechanisms require further investigation.
Supplementary Materials
The following supporting information can be downloaded at: https://www.mdpi.com/article/10.3390/bios16110645/s1, Figure S1. LIPUS treatment conditions and exploratory parameter assessment. (a) Schematic illustration of the in vitro LIPUS stimulation system. The ultrasound signal was generated by an arbitrary waveform generator, amplified by a power amplifier, transmitted to the transducer, and coupled to the cell culture dish through degassed water. (b) LIPUS parameter settings, including an operating frequency of 1.0 MHz, exposure durations of 5–20 min, an acoustic-pressure range of 0–1917 kPa, and duty cycles of 20%–50%. (c) Relative viability of SW480 and SW620 cells under different acoustic pressures, exposure durations, and duty cycles. The acoustic-pressure assessment included the control, 0.25, 0.54, and 1.09 MPa groups; the exposure-duration assessment included the control, 5, 10, and 20 min groups; and the duty-cycle assessment included the control, 20%, and 50% groups. Cell viability was measured using the CCK-8 assay and normalized to the corresponding contemporaneous control group. The three parameter assessments were conducted as separate experimental series, and groups with the same nominal settings in different panels were not pooled or directly compared across panels. Data are presented as the mean ± SD, n = 3 independent experiments. Statistical comparisons within each experimental series were performed using one-way ANOVA followed by Tukey’s multiple-comparisons test. ** p < 0.01 and *** p < 0.001. Figure S2. Collective and single-cell force changes in SW480 and SW620 cells following 0.54 MPa LIPUS treatment. (a) Representative PCCFM-derived stress maps of SW620 cells in the control and 0.54 MPa groups at different time points. The upper and lower rows show the control and 0.54 MPa groups, respectively. The color scale indicates vertical stress; scale bar, 250 µm. (b) Temporal changes in the collective cellular force of SW620 cells within a fixed field of view. Data are presented as the mean ± SD from three independent 2.78 mm² fields of view. Statistical analysis was performed using two-way repeated-measures ANOVA with the Geisser–Greenhouse correction, followed by Šídák’s multiple-comparisons test for between-group comparisons at each time point. The main effect of LIPUS treatment was p = 0.0019, and the time-by-treatment interaction was p = 0.4219; no between-group comparison at an individual time point was statistically significant. (c) Temporal profile of the mean single-cell force calculated from 30 randomly sampled SW480 cells at each time point. (d) Representative single-cell PCCFM-derived stress maps of SW620 cells in the control and 0.54 MPa groups at different time points. The color scale indicates vertical stress; scale bar, 100 µm. (e) Temporal profile of the mean single-cell force calculated from 30 randomly sampled SW620 cells at each time point. The single-cell data were obtained from one PCS and were used descriptively to characterize the distribution and temporal pattern of force values. These cell-level observations were not independent biological replicates; summaries were descriptive and did not track the same 30 cells across time. Green and orange indicate the control and 0.54 MPa groups, respectively. Figure S3. Changes in F-actin organization, peripheral protrusions, and two-dimensional migration of SW620 cells following LIPUS treatment. (a) Representative morphological and F-actin fluorescence images of SW620 cells in the control, 0.25 MPa, and 0.54 MPa groups. Purple markings in the grayscale images indicate peripheral protrusions, green fluorescence represents phalloidin-labeled F-actin, and regions enclosed by dashed boxes are shown at higher magnification on the right. Scale bars for the overview and enlarged images are 5 and 1 µm, respectively. (b) Quantification of peripheral protrusions in SW620 cells subjected to the indicated treatments; 15 cells were analyzed per group. (c) Representative bright-field images of SW620 cells in the control, 0.25 MPa, and 0.54 MPa groups at 0, 24, and 48 h after scratching. Scale bar, 500 µm. (d) Wound-closure rates of SW620 cells at 24 and 48 h after scratching. Green, blue, and orange bars represent the control, 0.25 MPa, and 0.54 MPa groups, respectively. Data are presented as the mean ± SD. Statistical comparisons were performed using one-way ANOVA followed by Tukey’s multiple-comparisons test. * p < 0.05, ** p < 0.01, and *** p < 0.001. Figure S4. Changes in the immunofluorescence signals of EMT-related markers in colorectal cancer cells following LIPUS treatment. (a) Representative immunofluorescence images and relative fluorescence-intensity measurements of E-cadherin, N-cadherin, and vimentin in SW480 cells from the control and 0.54 MPa groups. (b) Representative immunofluorescence images and relative fluorescence-intensity measurements of E-cadherin, N-cadherin, and vimentin in SW620 cells under the same conditions. Green indicates the corresponding target protein, blue indicates DAPI-stained nuclei, and Merge shows the merged channels. Scale bar, 50 µm. Fluorescence intensities were normalized to the corresponding control group. Data are presented as the mean ± SD. Figure S5. Changes in EdU incorporation in SW480 and SW620 cells following LIPUS treatment. Representative EdU fluorescence images (a) and percentages of EdU-positive SW480 cells (b) in the control, 0.25 MPa, and 0.54 MPa groups. Representative EdU fluorescence images (c) and percentages of EdU-positive SW620 cells (d) under the same treatment conditions. Blue indicates DAPI-stained nuclei, green indicates EdU-positive cells, and Merge shows the merged channels. Images are arranged from top to bottom as the control, 0.25 MPa, and 0.54 MPa groups. Scale bar, 50 µm. Green, blue, and orange bars represent the control, 0.25 MPa, and 0.54 MPa groups, respectively. Statistical comparisons were performed using one-way ANOVA followed by Tukey’s post hoc test. * p < 0.05 and ** p < 0.01. Figure S6. Effects of combined LIPUS and 5-FU treatment on colorectal cancer cell viability. (a) Concentration–response curve and fitted IC50 value for SW480 cells treated with different concentrations of 5-FU. (b–c) Relative viability of SW480 and SW620 cells following treatment with 5-FU alone or with 5-FU combined with 0.25 or 0.54 MPa LIPUS. Green, blue, orange, and purple bars represent the control, 5-FU, 5-FU + 0.25 MPa, and 5-FU + 0.54 MPa groups, respectively. Statistical comparisons were performed using one-way ANOVA followed by Tukey’s post hoc test. *** p < 0.001. Figure S7. Piezo1 immunofluorescence and Ca2+ signal changes in SW620 cells following LIPUS treatment. (a) Representative Piezo1 immunofluorescence images of SW620 cells in the control, 0.25 MPa, and 0.54 MPa groups. Green indicates the Piezo1 fluorescence signal, blue indicates DAPI-stained nuclei, and Merge shows the merged channels. Images are arranged from top to bottom as the control, 0.25 MPa, and 0.54 MPa groups. Scale bar, 10 µm. (b) Relative Piezo1 fluorescence intensity in SW620 cells. (c) Ratio of Piezo1 fluorescence intensity in the nuclear and cytoplasmic regions. (d) Representative Fluo-4 Ca2+ fluorescence images of SW620 cells at 1 min after pretreatment with the indicated LIPUS acoustic pressures and after the addition of GsMTx4 at 3 min. Scale bar, 50 µm. (e) Time-dependent changes in the Ca2+-positive fluorescent area of SW620 cells before and after GsMTx4 addition; GsMTx4 was added at 3 min. (f) Ca2+-positive fluorescent area at 1 min in the indicated treatment groups. Green, blue, and orange bars and curves represent the control, 0.25 MPa, and 0.54 MPa groups, respectively. Statistical comparisons were performed using one-way ANOVA followed by Tukey’s post hoc test. ** p < 0.01 and *** p < 0.001.
Author Contributions
Conceptualization: Y.Z., C.L., and Z.G.; investigation: Y.Z., J.Z., C.L., and Z.G.; writing—original draft preparation: Y.Z.; writing—review and editing: Y.Z., C.L., and Z.G.; visualization: Y.Z., J.Z., X.L., J.Y., and C.L.; supervision: Y.Z., C.L., and Z.G.; project administration: Z.G.; funding acquisition: Y.Z., C.L., and Z.G. All authors have read and agreed to the published version of the manuscript.
Funding
This work was financially supported by National Natural Science Foundation of China (52403155, 32427801), National Key R&D Program of China (SQ2024YFA1300048), and The Medical Engineering Translational Fund of Jiangsu Province Hospital (QG202408).
Institutional Review Board Statement
All experimental protocols were approved by the Institutional Animal Care and Use Committee (IACUC) of Southeast University (Approval No.: SEU-IACUC-20260918-001).
Informed Consent Statement
Not applicable.
Data Availability Statement
All data generated or analyzed during this study are included in this manuscript and its supplementary information files.
Acknowledgments
During the preparation of this manuscript, the authors used ChatGPT 5.6 sol light for the purposes of graphics and language polishing. The authors have reviewed and edited the output and take full responsibility for the content of this publication.
Conflicts of Interest
The authors declare no conflicts of interest.
Abbreviations
The following abbreviations are used in this manuscript:
| LIPUS | Low-intensity pulsed ultrasound |
| PCCFM | Photonic crystal cellular force microscopy |
| PCS | Photonic crystal substrate |
| CRC | Colorectal cancer |
| ECM | Extracellular matrix |
| CAFs | Cancer-associated fibroblasts |
| TME | Tumor microenvironment |
| EMT | Epithelial–mesenchymal transition |
| SEM | Scanning electron microscopy |
| DMEM | Dulbecco’s modified Eagle medium |
| EDTA | Ethylenediaminetetraacetic acid |
| OCT | Optimal cutting temperature |
References
- Bray, F.; Laversanne, M.; Sung, H.; Ferlay, J.; Siegel, R.L.; Soerjomataram, I.; Jemal, A. Global cancer statistics 2022: GLOBOCAN estimates of incidence and mortality worldwide for 36 cancers in 185 countries. CA Cancer J. Clin. 2024, 74, 229–263. [Google Scholar] [CrossRef] [Scilit] [PubMed]
- Brás, M.M.; Sousa, S.R.; Carneiro, F.; Radmacher, M.; Granja, P.L. Mechanobiology of colorectal cancer. Cancers 2022, 14, 1945. [Google Scholar] [CrossRef] [Scilit] [PubMed]
- Liu, C.; Pei, H.; Tan, F. Matrix stiffness and colorectal cancer. Onco Targets Ther. 2020, 13, 2747–2755. [Google Scholar] [CrossRef] [Scilit] [PubMed]
- Paszek, M.J.; Zahir, N.; Johnson, K.R.; Lakins, J.N.; Rozenberg, G.I.; Gefen, A.; Reinhart-King, C.A.; Margulies, S.S.; Dembo, M.; Boettiger, D.; et al. Tensional homeostasis and the malignant phenotype. Cancer Cell 2005, 8, 241–254. [Google Scholar] [CrossRef] [Scilit] [PubMed]
- Dupont, S.; Morsut, L.; Aragona, M.; Enzo, E.; Giulitti, S.; Cordenonsi, M.; Zanconato, F.; Le Digabel, J.; Forcato, M.; Bicciato, S.; et al. Role of YAP/TAZ in mechanotransduction. Nature 2011, 474, 179–183. [Google Scholar] [CrossRef] [Scilit] [PubMed]
- Balaban, N.Q.; Schwarz, U.S.; Riveline, D.; Goichberg, P.; Tzur, G.; Sabanay, I.; Mahalu, D.; Safran, S.; Bershadsky, A.; Addadi, L.; et al. Force and focal adhesion assembly: A close relationship studied using elastic micropatterned substrates. Nat. Cell Biol. 2001, 3, 466–472. [Google Scholar] [CrossRef] [Scilit] [PubMed]
- Ma, H.; Wang, J.; Zhao, X.; Wu, T.; Huang, Z.; Chen, D.; Liu, Y.; Ouyang, G. Periostin promotes colorectal tumorigenesis through integrin-FAK-Src pathway-mediated YAP/TAZ activation. Cell Rep. 2020, 30, 793–806.e6. [Google Scholar] [CrossRef] [Scilit] [PubMed]
- Shimolina, L.; Efremov, Y.M.; Khlynova, A.; Ignatova, N.; Kuimova, M.K.; Timashev, P.S.; Shirmanova, M. Dynamic changes in cellular mechanics and membrane microviscosity during migration of colorectal cancer cells. Cell Cycle 2026, 25, 1–19. [Google Scholar] [CrossRef] [Scilit] [PubMed]
- Lucchetti, D.; Ricciardi Tenore, C.; Colella, F.; Sgambato, A. Low-intensity pulsed ultrasound affects growth, differentiation, migration, and epithelial-to-mesenchymal transition of colorectal cancer cells. J. Cell. Physiol. 2020, 235, 5363–5377. [Google Scholar] [CrossRef] [Scilit] [PubMed]
- Atherton, P.; Lausecker, F.; Harrison, A.; Ballestrem, C. Low-intensity pulsed ultrasound promotes cell motility through vinculin-controlled Rac1 GTPase activity. J. Cell Sci. 2017, 130, 2277–2291. [Google Scholar] [CrossRef] [Scilit] [PubMed]
- González, I.; Luzuriaga, J.; Valdivieso, A.; Candil, M.; Frutos, J.; López, J.; Hernández, L.; Rodríguez-Lorenzo, L.; Yagüe, V.; Blanco, J.L.; et al. Low-intensity continuous ultrasound to inhibit cancer cell migration. Front. Cell Dev. Biol. 2022, 10, 842965. [Google Scholar] [CrossRef] [Scilit] [PubMed]
- Feril, L.B., Jr.; Yamaguchi, K.; Ikeda-Dantsuji, Y.; Furusawa, Y.; Tabuchi, Y.; Takasaki, I.; Ogawa, R.; Cui, Z.-G.; Tachibana, K. Low-intensity ultrasound inhibits melanoma cell proliferation in vitro and tumor growth in vivo. J. Med. Ultrason. 2021, 48, 451–461. [Google Scholar] [CrossRef] [Scilit] [PubMed]
- Tardoski, S.; Gineyts, E.; Ngo, J.; Kocot, A.; Clézardin, P.; Melodelima, D. Low-intensity ultrasound promotes clathrin-dependent endocytosis for drug penetration into tumor cells. Ultrasound Med. Biol. 2015, 41, 2740–2754. [Google Scholar] [CrossRef] [Scilit] [PubMed]
- Spassova, M.A.; Hewavitharana, T.; Xu, W.; Soboloff, J.; Gill, D.L. A common mechanism underlies stretch activation and receptor activation of TRPC6 channels. Proc. Natl. Acad. Sci. USA 2006, 103, 16586–16591. [Google Scholar] [CrossRef] [Scilit] [PubMed]
- Coste, B.; Mathur, J.; Schmidt, M.; Earley, T.J.; Ranade, S.; Petrus, M.J.; Dubin, A.E.; Patapoutian, A. Piezo1 and Piezo2 are essential components of distinct mechanically activated cation channels. Science 2010, 330, 55–60. [Google Scholar] [CrossRef] [Scilit] [PubMed]
- Sun, Y.; Li, M.; Liu, G.; Zhang, X.; Zhi, L.; Zhao, J.; Wang, G. The function of Piezo1 in colon cancer metastasis and its potential regulatory mechanism. J. Cancer Res. Clin. Oncol. 2020, 146, 1139–1152. [Google Scholar] [CrossRef] [Scilit] [PubMed]
- Greenlee, J.D.; Liu, K.; Lopez-Cavestany, M.; King, M.R. Piezo1 mechano-activation is augmented by resveratrol and differs between colorectal cancer cells of primary and metastatic origin. Molecules 2022, 27, 5430. [Google Scholar] [CrossRef] [Scilit] [PubMed]
- Syeda, R.; Xu, J.; Dubin, A.E.; Coste, B.; Mathur, J.; Huynh, T.; Matzen, J.; Lao, J.; Tully, D.C.; Engels, I.H.; et al. Chemical activation of the mechanotransduction channel Piezo1. eLife 2015, 4, e07369. [Google Scholar] [CrossRef]
- Bae, C.; Sachs, F.; Gottlieb, P.A. The mechanosensitive ion channel Piezo1 is inhibited by the peptide GsMTx4. Biochemistry 2011, 50, 6295–6300. [Google Scholar] [CrossRef] [Scilit] [PubMed]
- Udroiu, I.; Todaro, F.; Vitaliti, A.; Palmieri, D.; Guida, E.; Perilli, G.; Duranti, L.; D’oTtavi, C.; Mattei, M.; Dolci, S.; et al. Low-intensity pulsed ultrasound induces multifaced alterations in chromosome segregation, cytoskeletal filaments and cell junctions. Sci. Rep. 2025, 15, 4964. [Google Scholar] [CrossRef] [Scilit] [PubMed]
- Federico, G.; Carotenuto, A.R.; Cutolo, A.; Palumbo, S.; Moccia, M.; Paladino, S.; Santoro, M.; Russo, T.; Fraldi, M.; Carlomagno, F. Ultrasound-induced mechanical damage of cancer cell cytoskeleton causes disruption of nuclear envelope and activation of cGAS-STING. Sci. Rep. 2025, 15, 18037. [Google Scholar] [CrossRef] [Scilit] [PubMed]
- Yang, M.; Lu, Z.; Liu, B.; Liu, G.; Shi, M.; Wang, P. Low-intensity pulsed ultrasound affects proliferation and migration of human hepatocellular carcinoma cells. J. Cancer Res. Clin. Oncol. 2025, 151, 136. [Google Scholar] [CrossRef] [Scilit] [PubMed]
- Dembo, M.; Wang, Y.L. Stresses at the cell-to-substrate interface during locomotion of fibroblasts. Biophys. J. 1999, 76, 2307–2316. [Google Scholar] [CrossRef] [Scilit] [PubMed]
- Schwarz, U.S.; Soiné, J.R.D. Traction force microscopy on soft elastic substrates: A guide to recent computational advances. Biochim. Biophys. Acta 2015, 1853, 3095–3104. [Google Scholar] [CrossRef] [Scilit] [PubMed]
- Tan, J.L.; Tien, J.; Pirone, D.M.; Gray, D.S.; Bhadriraju, K.; Chen, C.S. Cells lying on a bed of microneedles: An approach to isolate mechanical force. Proc. Natl. Acad. Sci. USA 2003, 100, 1484–1489. [Google Scholar] [CrossRef] [Scilit] [PubMed]
- Kronenberg, N.M.; Liehm, P.; Steude, A.; Knipper, J.A.; Borger, J.G.; Scarcelli, G.; Franze, K.; Powis, S.J.; Gather, M.C. Long-term imaging of cellular forces with high precision by elastic resonator interference stress microscopy. Nat. Cell Biol. 2017, 19, 864–872. [Google Scholar] [CrossRef] [Scilit]
- Liehm, P.; Kronenberg, N.M.; Gather, M.C. Analysis of the precision, robustness, and speed of elastic resonator interference stress microscopy. Biophys. J. 2018, 114, 2180–2193. [Google Scholar] [CrossRef] [Scilit] [PubMed]
- Zhuo, Y.; Choi, J.S.; Marin, T.; Yu, H.; Harley, B.A.; Cunningham, B.T. Quantitative analysis of focal adhesion dynamics using photonic resonator outcoupler microscopy. Light Sci. Appl. 2018, 7, 9. [Google Scholar] [CrossRef] [Scilit] [PubMed]
- Lidstone, E.A.; Chaudhery, V.; Kohl, A.; Chan, V.; Wolf-Jensen, T.; Schook, L.B.; Bashir, R.; Cunningham, B.T. Label-free imaging of cell attachment with photonic crystal enhanced microscopy. Analyst 2011, 136, 3608–3615. [Google Scholar] [CrossRef] [Scilit] [PubMed]
- Chen, W.; Long, K.D.; Lu, M.; Chaudhery, V.; Yu, H.; Choi, J.S.; Polans, J.; Zhuo, Y.; Harley, B.A.C.; Cunningham, B.T. Photonic crystal enhanced microscopy for imaging of live cell adhesion. Analyst 2013, 138, 5886–5894. [Google Scholar] [CrossRef] [Scilit] [PubMed]
- Li, Q.; Chen, Z.; Zhang, Y.; Ding, S.; Ding, H.; Wang, L.; Xie, Z.; Fu, Y.; Wei, M.; Liu, S.; et al. Imaging cellular forces with photonic crystals. Nat. Commun. 2023, 14, 7369. [Google Scholar] [CrossRef] [Scilit]
- Zhou, J.; Zhang, Y.; Fu, Y.; Li, Q.; Zhang, J.; Liu, X.; Gu, Z. Visualizing and quantifying dynamic cellular forces with photonic crystal hydrogels. Nanoscale 2024, 16, 19074–19085. [Google Scholar] [CrossRef] [Scilit] [PubMed]
- Sun, X.; Zhang, Z.; Xiong, N.; Xu, S.; Zhao, W.; Wang, Y.; Song, B.; Li, Q.; Gu, Z.; Chen, Z. Force sensing of hepatic stellate cell in real-time with photonic crystal cellular force microscopy. EngMedicine 2026, 3, 100137. [Google Scholar] [CrossRef] [Scilit]
- Fu, Y.; Guo, X.; Li, Q.; Zhou, J.; Qiu, M.; Zhang, Y.; Gu, Z. Photonic Crystal Array Enhanced Cellular Force Microscopy for High-Throughput Detection of Regulated Cell Death and Cytopathic Effects. ACS Nano 2025, 19, 22725–22738. [Google Scholar] [CrossRef] [Scilit] [PubMed]
- Zhou, J.; Zhang, Y.; Yu, J.; Fu, Y.; Zhang, J.; Gu, Z. Biomimetic photonic crystal cellular force microscopy resolves spatiotemporal force dynamics and mechanotransduction during epithelial-mesenchymal transition. J. Mater. Chem. B 2026, 14, 11943–11953. [Google Scholar] [CrossRef] [Scilit] [PubMed]
- Lopez-Crapez, E.; Costa, L.; Tosato, G.; Ramos, J.; Mazard, T.; Guiramand, J.; Thierry, A.; Colinge, J.; Milhiet, P.-E.; Bénistant, C. Mechanical signatures of human colon cancers. Sci. Rep. 2022, 12, 12475. [Google Scholar] [CrossRef] [Scilit] [PubMed]
- Huning, N.C.; Buhaya, M.H.; Nguyen, V.V.; Khazi-Syed, A.; Ali, H.A.; Khan, A.; Fan, A.; Fisher, R.C.; Chi, Z.; Raman, I.; et al. Biomechanical Phenotyping Reveals Unique Mechanobiological Signatures of Early-Onset Colorectal Cancer. Adv. Sci. 2026, 13, e14693. [Google Scholar] [CrossRef] [Scilit] [PubMed]
- Xia, K.; Hu, W.; Wang, Y.; Chen, J.; Hu, Z.; An, C.; Xu, P.; Teng, L.; Wu, J.; Liu, L.; et al. Extracellular matrix stiffness modulates the mechanophenotypes and focal adhesions of colon cancer cells leading to their invasions via YAP1. Mechanobiol. Med. 2024, 2, 100062. [Google Scholar] [CrossRef] [Scilit] [PubMed]
- Maskarinec, S.A.; Franck, C.; Tirrell, D.A.; Ravichandran, G. Quantifying cellular traction forces in three dimensions. Proc. Natl. Acad. Sci. USA 2009, 106, 22108–22113. [Google Scholar] [CrossRef] [Scilit] [PubMed]
- Parsons, J.T.; Horwitz, A.R.; Schwartz, M.A. Cell adhesion: Integrating cytoskeletal dynamics and cellular tension. Nat. Rev. Mol. Cell Biol. 2010, 11, 633–643. [Google Scholar] [CrossRef] [Scilit] [PubMed]
- Gardel, M.L.; Schneider, I.C.; Aratyn-Schaus, Y.; Waterman, C.M. Mechanical integration of actin and adhesion dynamics in cell migration. Annu. Rev. Cell Dev. Biol. 2010, 26, 315–333. [Google Scholar] [CrossRef] [Scilit] [PubMed]
- Friedl, P.; Wolf, K. Plasticity of cell migration: A multiscale tuning model. J. Cell Biol. 2010, 188, 11–19. [Google Scholar] [CrossRef] [Scilit] [PubMed]
- Lamouille, S.; Xu, J.; Derynck, R. Molecular mechanisms of epithelial-mesenchymal transition. Nat. Rev. Mol. Cell Biol. 2014, 15, 178–196. [Google Scholar] [CrossRef] [Scilit] [PubMed]
- Gerdes, J.; Lemke, H.; Baisch, H.; Wacker, H.H.; Schwab, U.; Stein, H. Cell cycle analysis of a cell proliferation-associated human nuclear antigen defined by the monoclonal antibody Ki-67. J. Immunol. 1984, 133, 1710–1715. [Google Scholar] [CrossRef] [Scilit]
- Pajic-Lijakovic, I.; Milivojevic, M.; Martinac, B.; McClintock, P.V.E. Ventral cytoskeletal remodeling as a mechanism for oscillatory load-induced Piezo1 overactivation and cancer cell vulnerability. Biophys. Rev. 2026, 18, 817–834. [Google Scholar] [CrossRef] [Scilit] [PubMed]
- Giguelay, A.; Turtoi, E.; Khelaf, L.; Tosato, G.; Dadi, I.; Chastel, T.; Poul, M.-A.; Pratlong, M.; Nicolescu, S.; Severac, D.; et al. The landscape of cancer-associated fibroblasts in colorectal cancer liver metastases. Theranostics 2022, 12, 7624–7639. [Google Scholar] [CrossRef] [Scilit] [PubMed]
- Tan, F.; Huang, Y.; Pei, Q.; Liu, H.; Pei, H.; Zhu, H. Matrix stiffness mediates stemness characteristics via activating the Yes-associated protein in colorectal cancer cells. J. Cell. Biochem. 2019, 120, 2213–2225. [Google Scholar] [CrossRef] [Scilit] [PubMed]
- Ohta, Y.; Fujii, M.; Takahashi, S.; Takano, A.; Nanki, K.; Matano, M.; Hanyu, H.; Saito, M.; Shimokawa, M.; Nishikori, S.; et al. Cell-matrix interface regulates dormancy in human colon cancer stem cells. Nature 2022, 608, 784–794. [Google Scholar] [CrossRef] [Scilit] [PubMed]
- Wu, X.; Cai, J.; Zuo, Z.; Li, J. Collagen facilitates colorectal cancer stemness and metastasis through an integrin/PI3K/AKT/Snail signaling pathway. Biomed. Pharmacother. 2019, 114, 108708. [Google Scholar] [CrossRef] [Scilit] [PubMed]
- van der Net, M.C.; Vliem, M.J.; Kemp, L.J.S.; Perez-Gonzalez, C.; Haddad, T.S.; Strating, E.A.; Krotenberg-Garcia, A.; Houtekamer, R.M.; Pannekoek, W.-J.; Anker, K.B.; et al. Mechanosensitive calcium channels and integrins coordinate the reprogramming of colorectal cancer cells into a fetal-like state. Cell Rep. 2025, 44, 116308. [Google Scholar] [CrossRef] [Scilit] [PubMed]
- Chen, E.; Zeng, Z.; Zhou, W. The key role of matrix stiffness in colorectal cancer immunotherapy: Mechanisms and therapeutic strategies. Biochim. Biophys. Acta Rev. Cancer 2024, 1879, 189198. [Google Scholar] [CrossRef] [Scilit] [PubMed]
- Bai, S.; Chen, M.; Wang, X.; Lan, N.; Meng, R.; Yan, Y.; Liu, W.; Li, W.; Wu, F.; Zhang, X.; et al. GPR4 promotes immune exclusion in colon cancer through LOXL2-mediated extracellular matrix remodeling. Nat. Commun. 2026, 17, 1196. [Google Scholar] [CrossRef] [Scilit] [PubMed]
- Sathe, A.; Mason, K.; Grimes, S.M.; Zhou, Z.; Lau, B.T.; Bai, X.; Su, A.; Tan, X.; Lee, H.; Suarez, C.J.; et al. Colorectal cancer metastases in the liver establish immunosuppressive spatial networking between tumor-associated SPP1+ macrophages and fibroblasts. Clin. Cancer Res. 2023, 29, 244–260. [Google Scholar] [PubMed]
- Shen, Y.; Wang, X.; Lu, J.; Salfenmoser, M.; Wirsik, N.M.; Schleussner, N.; Imle, A.; Valls, A.F.; Radhakrishnan, P.; Liang, J.; et al. Reduction of liver metastasis stiffness improves response to bevacizumab in metastatic colorectal cancer. Cancer Cell 2020, 37, 800–817.e7. [Google Scholar] [CrossRef] [Scilit] [PubMed]
- Li, X.; Pan, J.; Liu, T.; Yin, W.; Miao, Q.; Zhao, Z.; Gao, Y.; Zheng, W.; Li, H.; Deng, R.; et al. Novel TCF21(high) pericyte subpopulation promotes colorectal cancer metastasis by remodelling perivascular matrix. Gut 2023, 72, 710–721. [Google Scholar] [CrossRef] [Scilit] [PubMed]
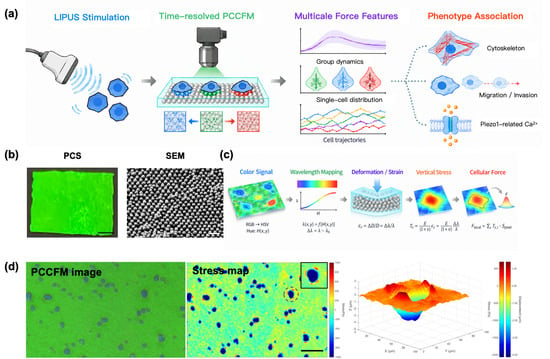
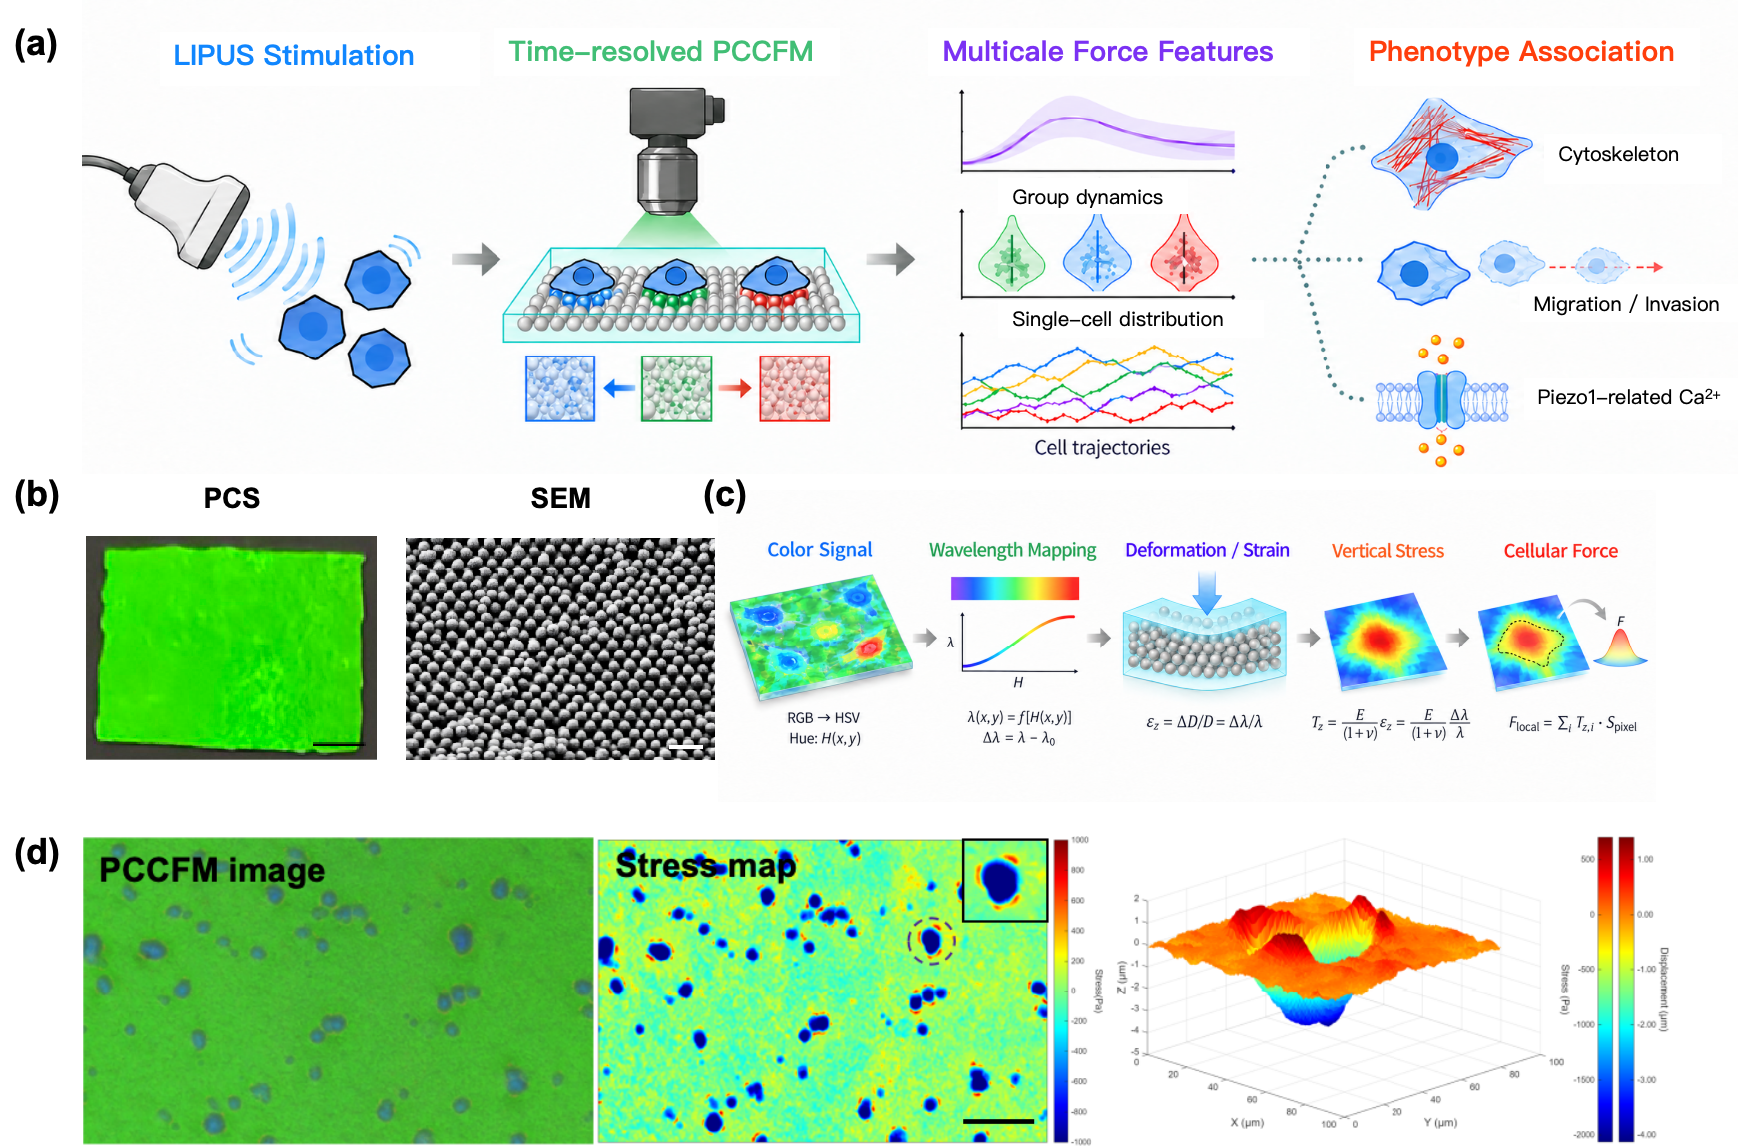
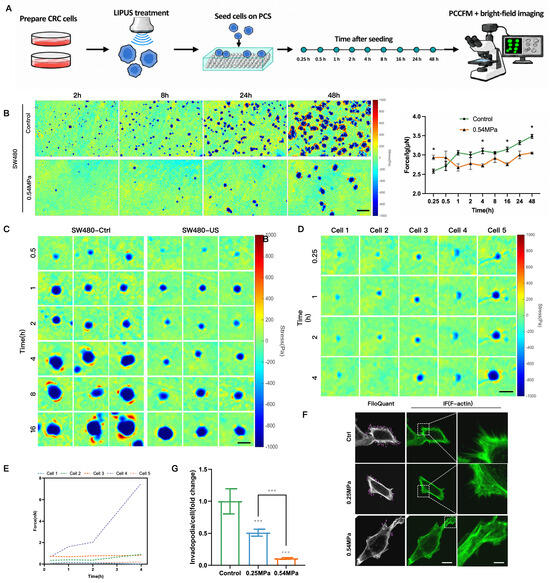
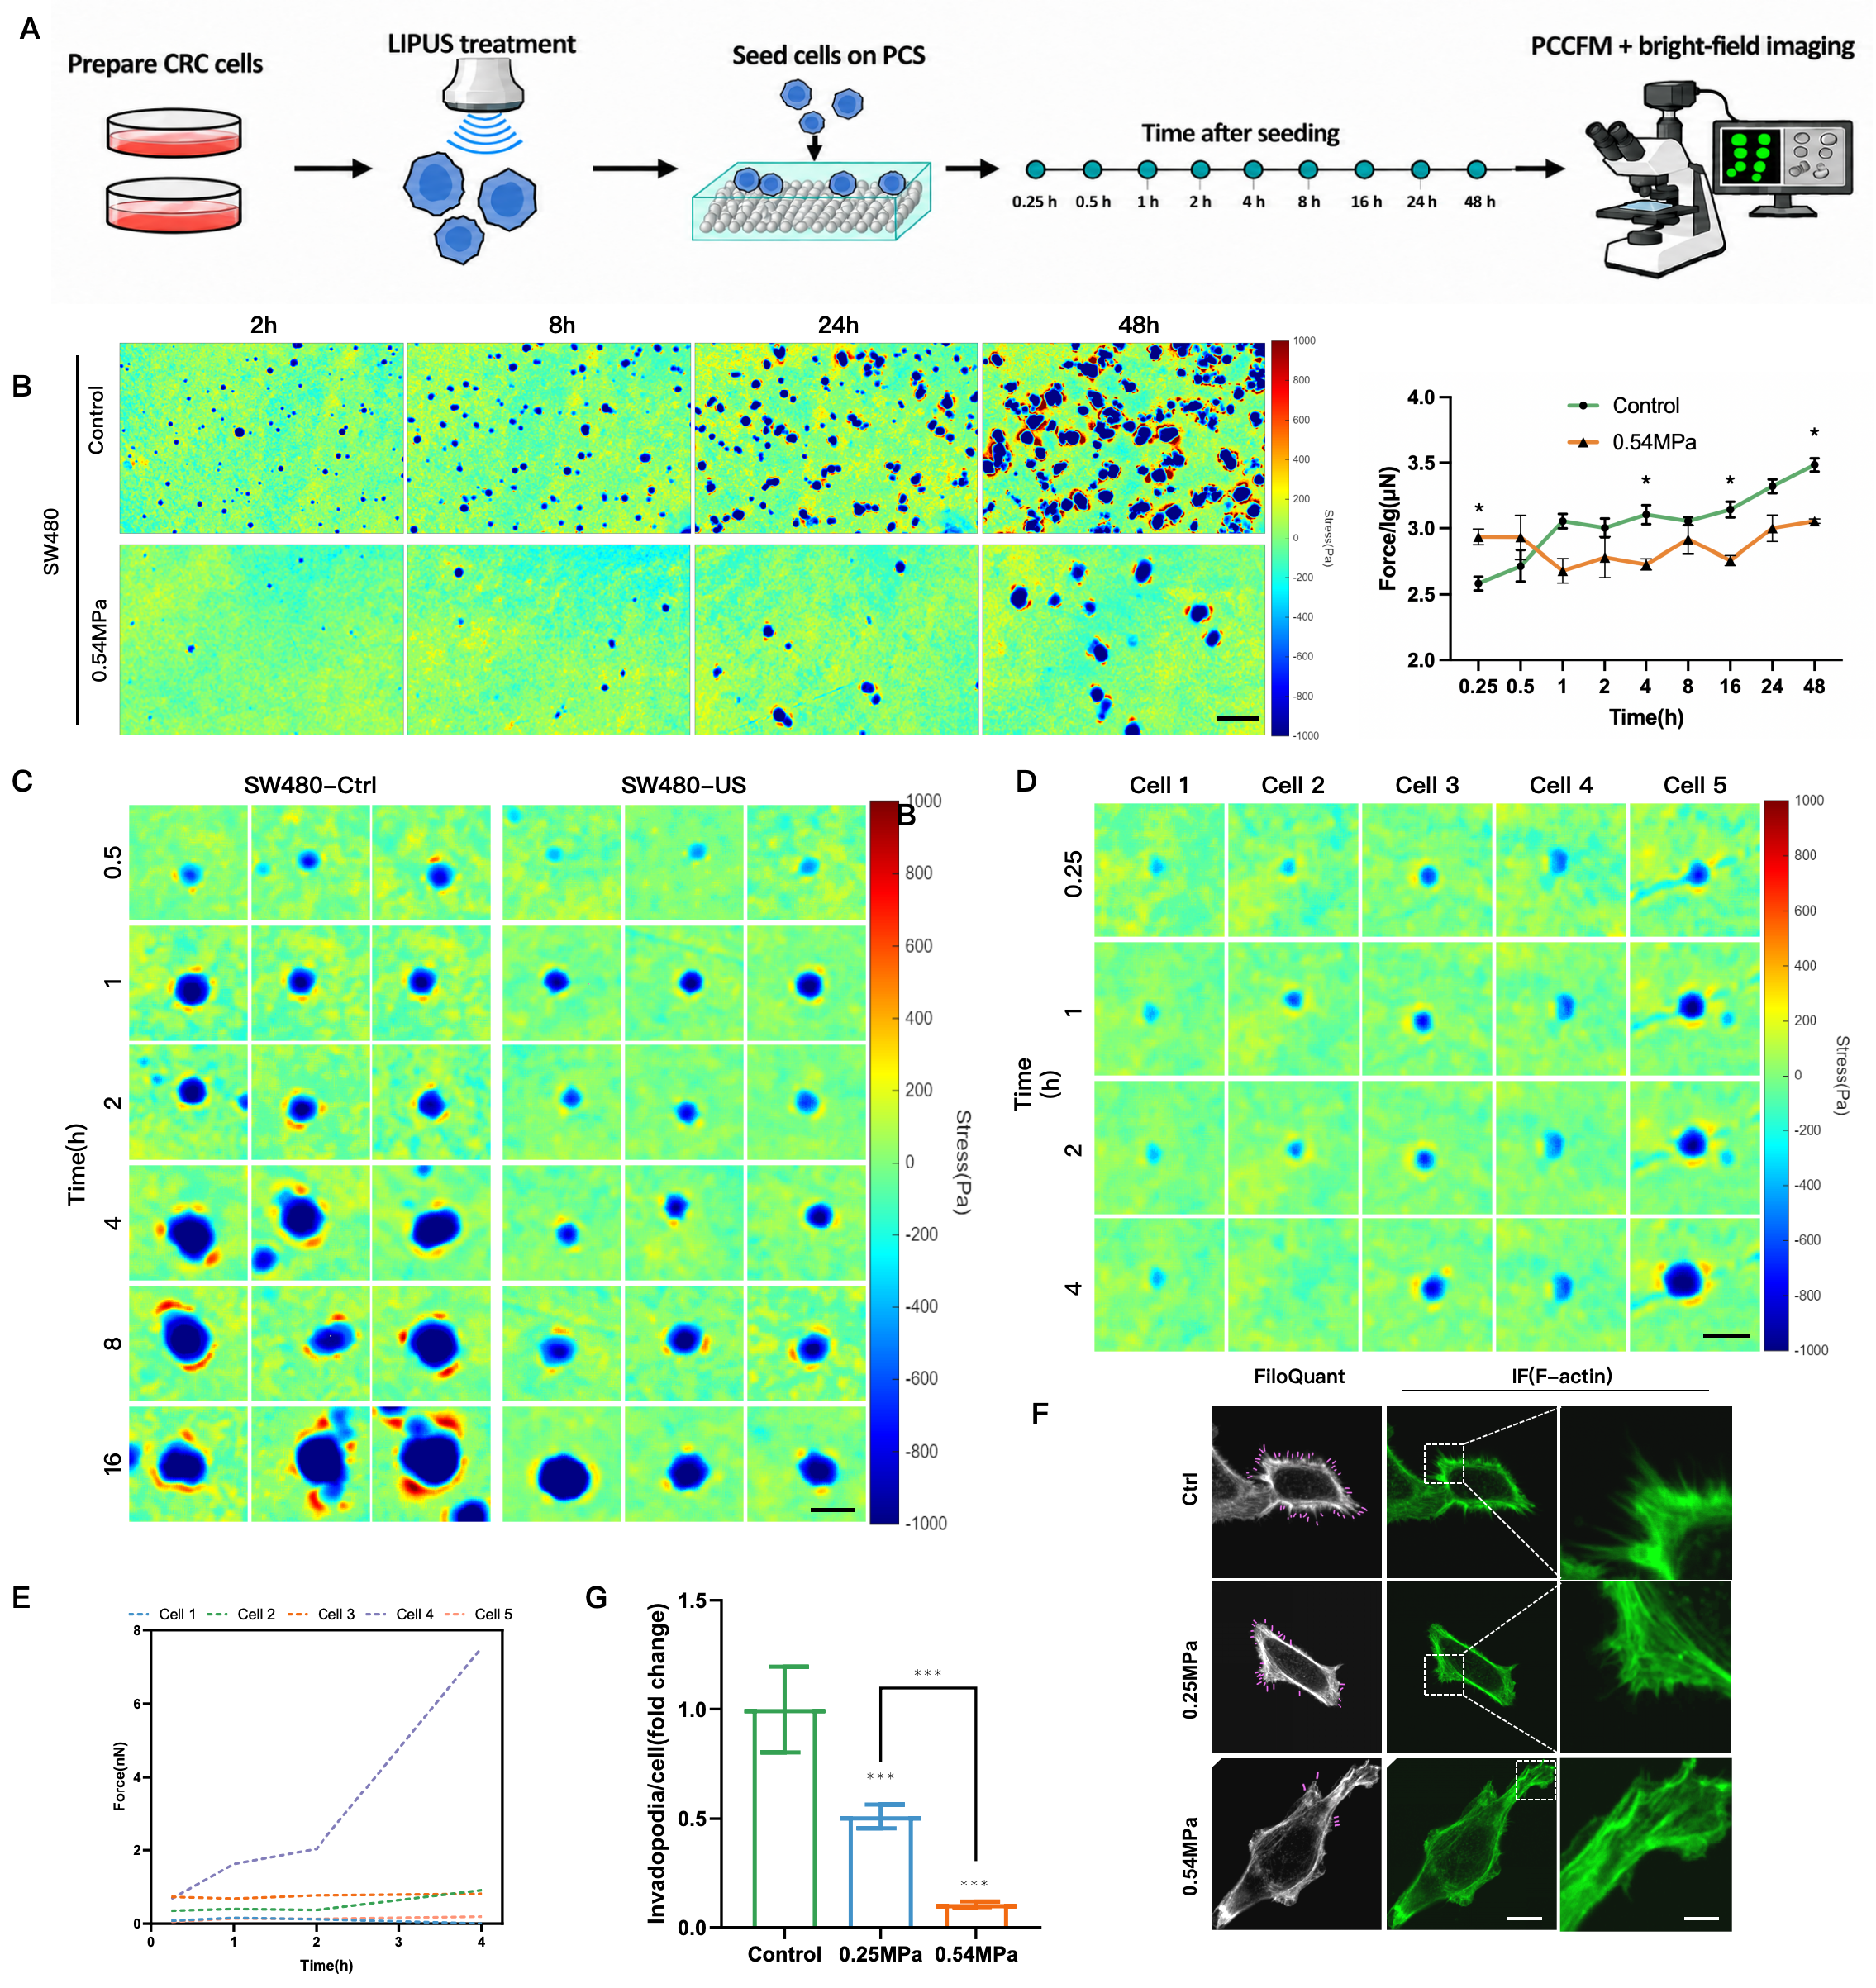
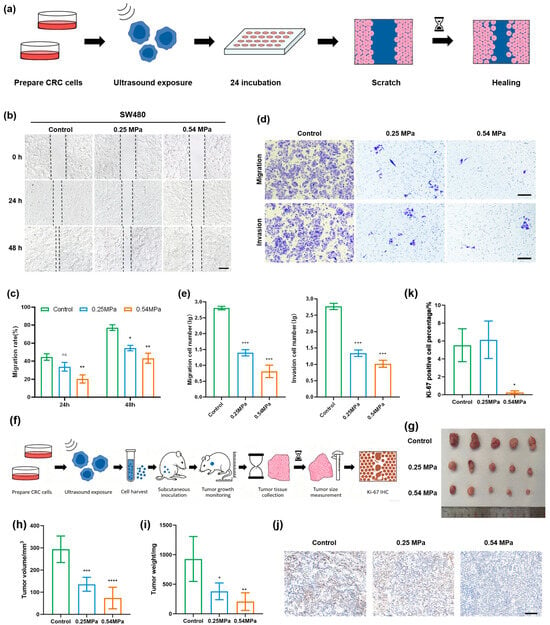
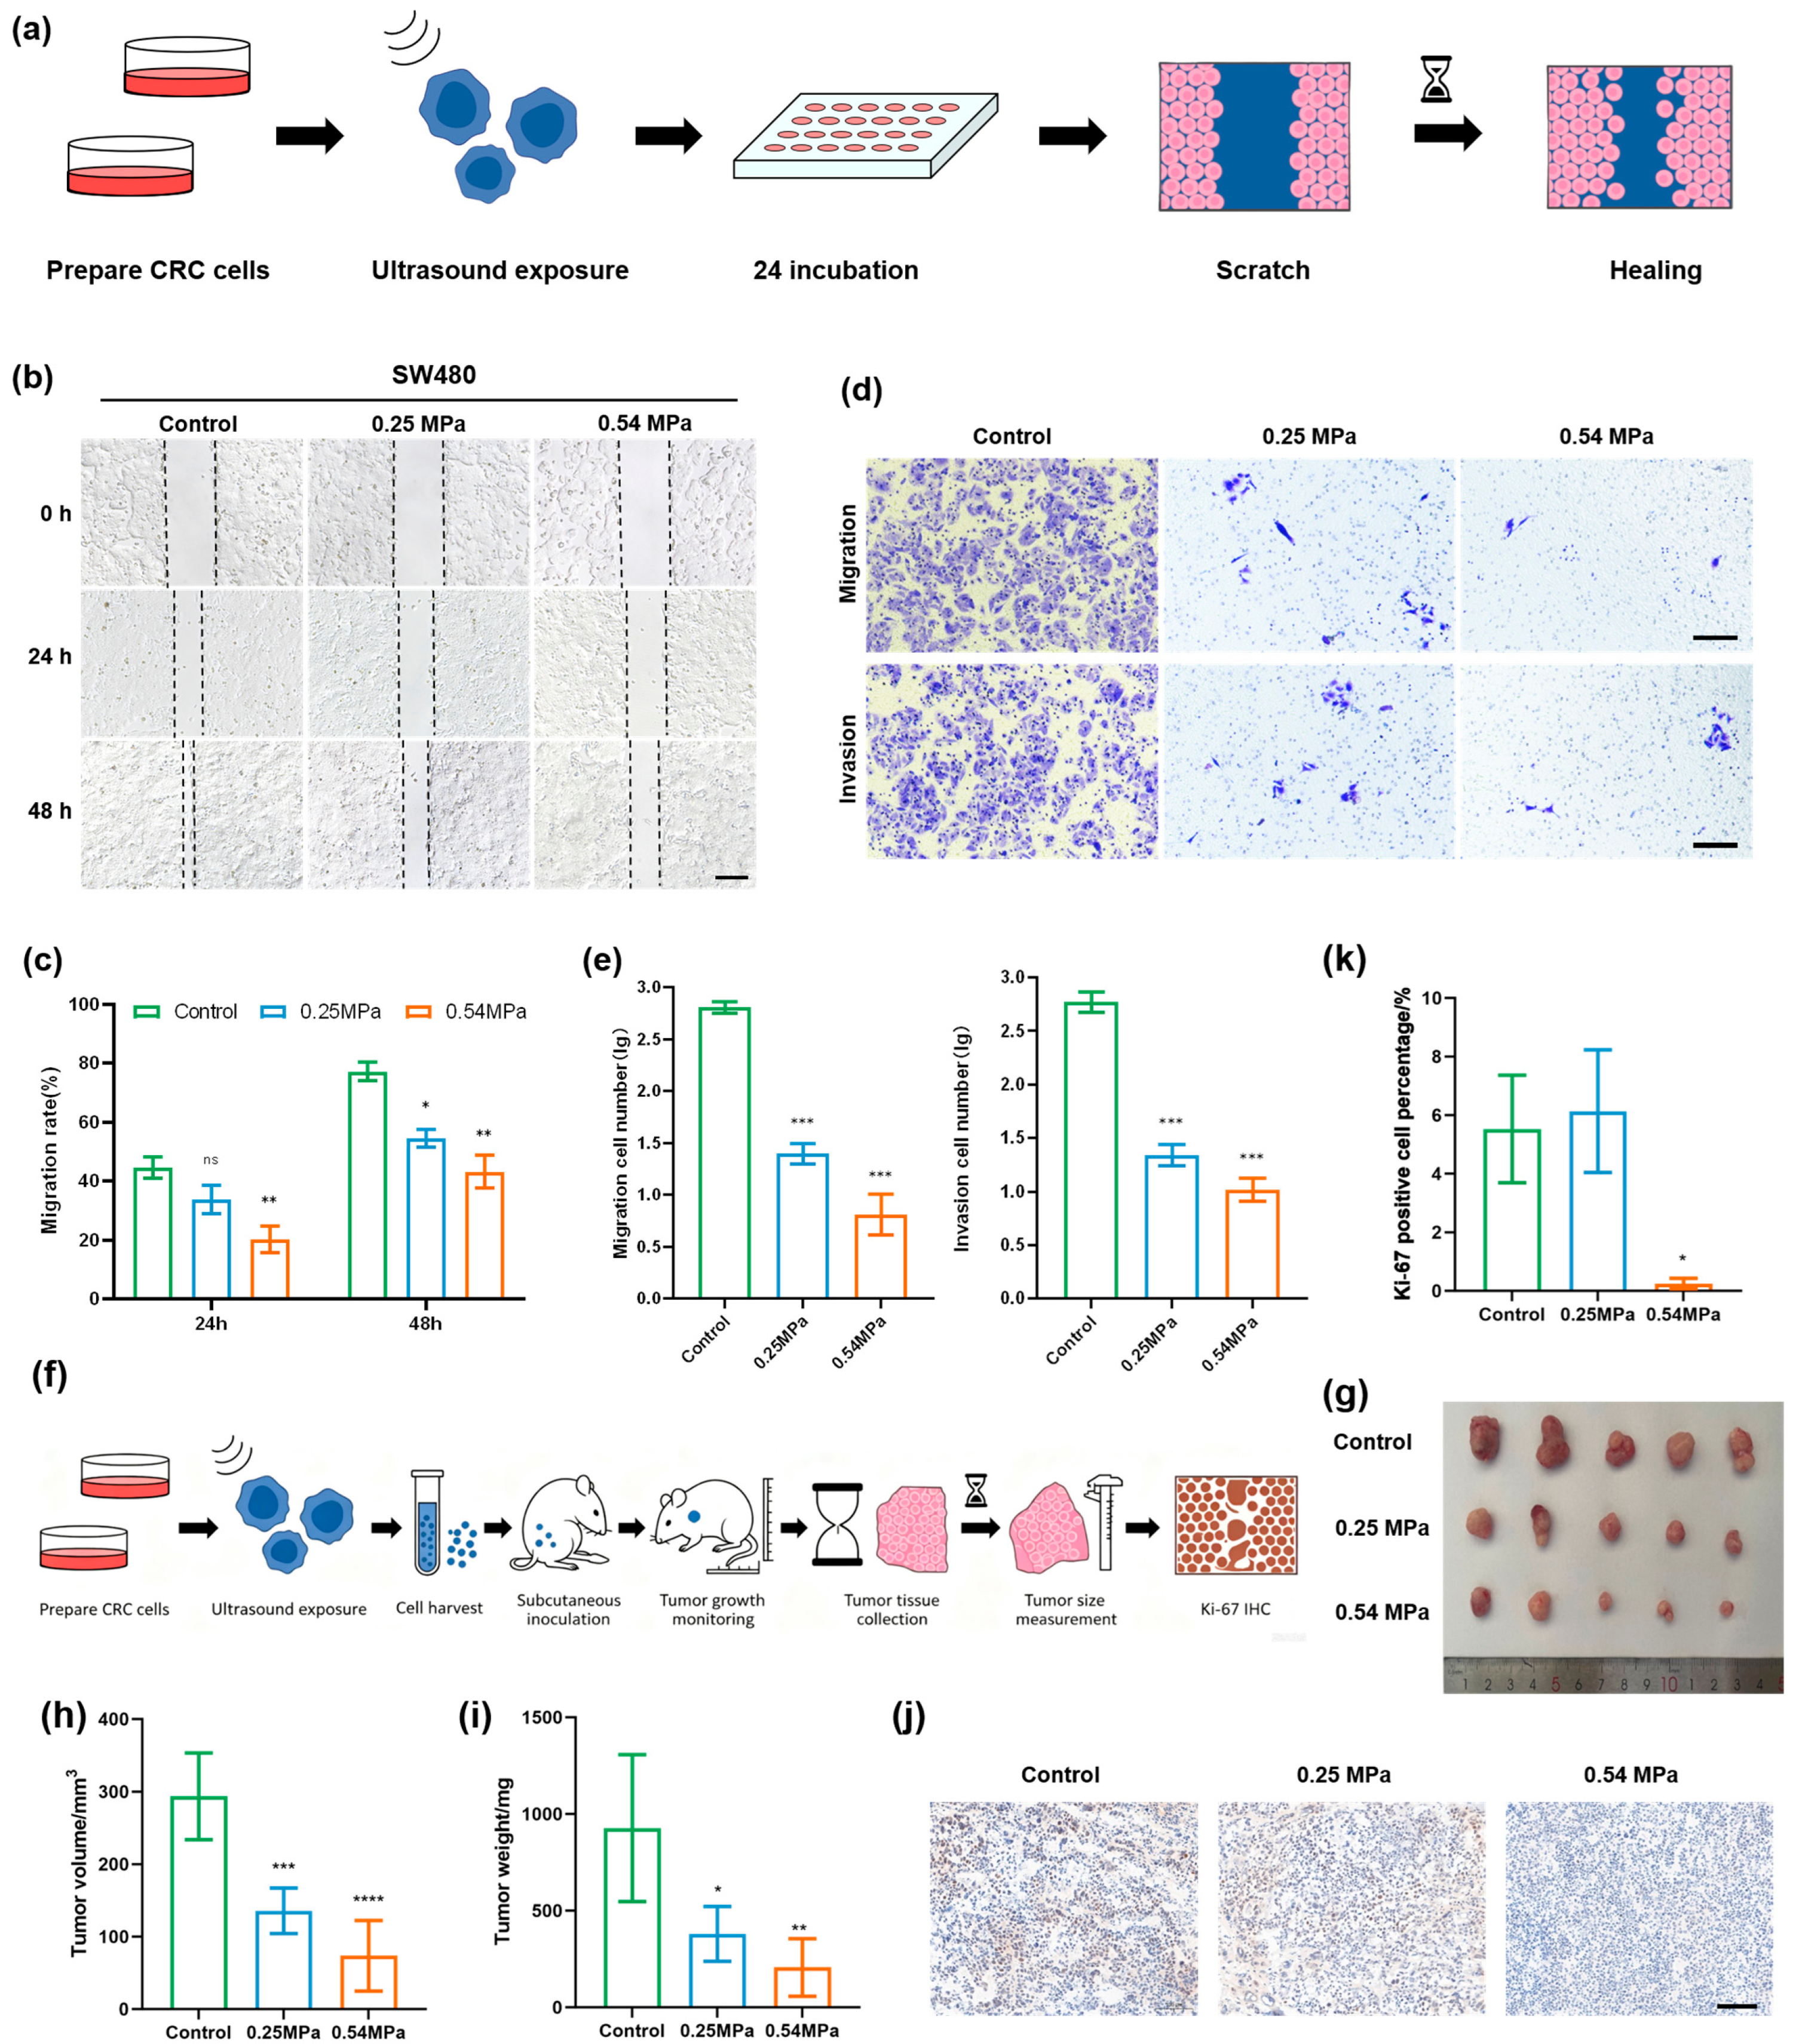
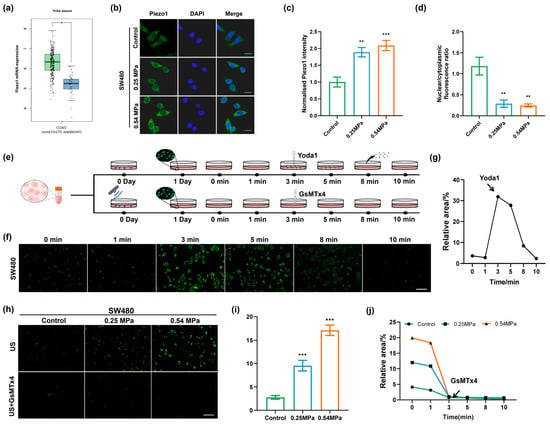
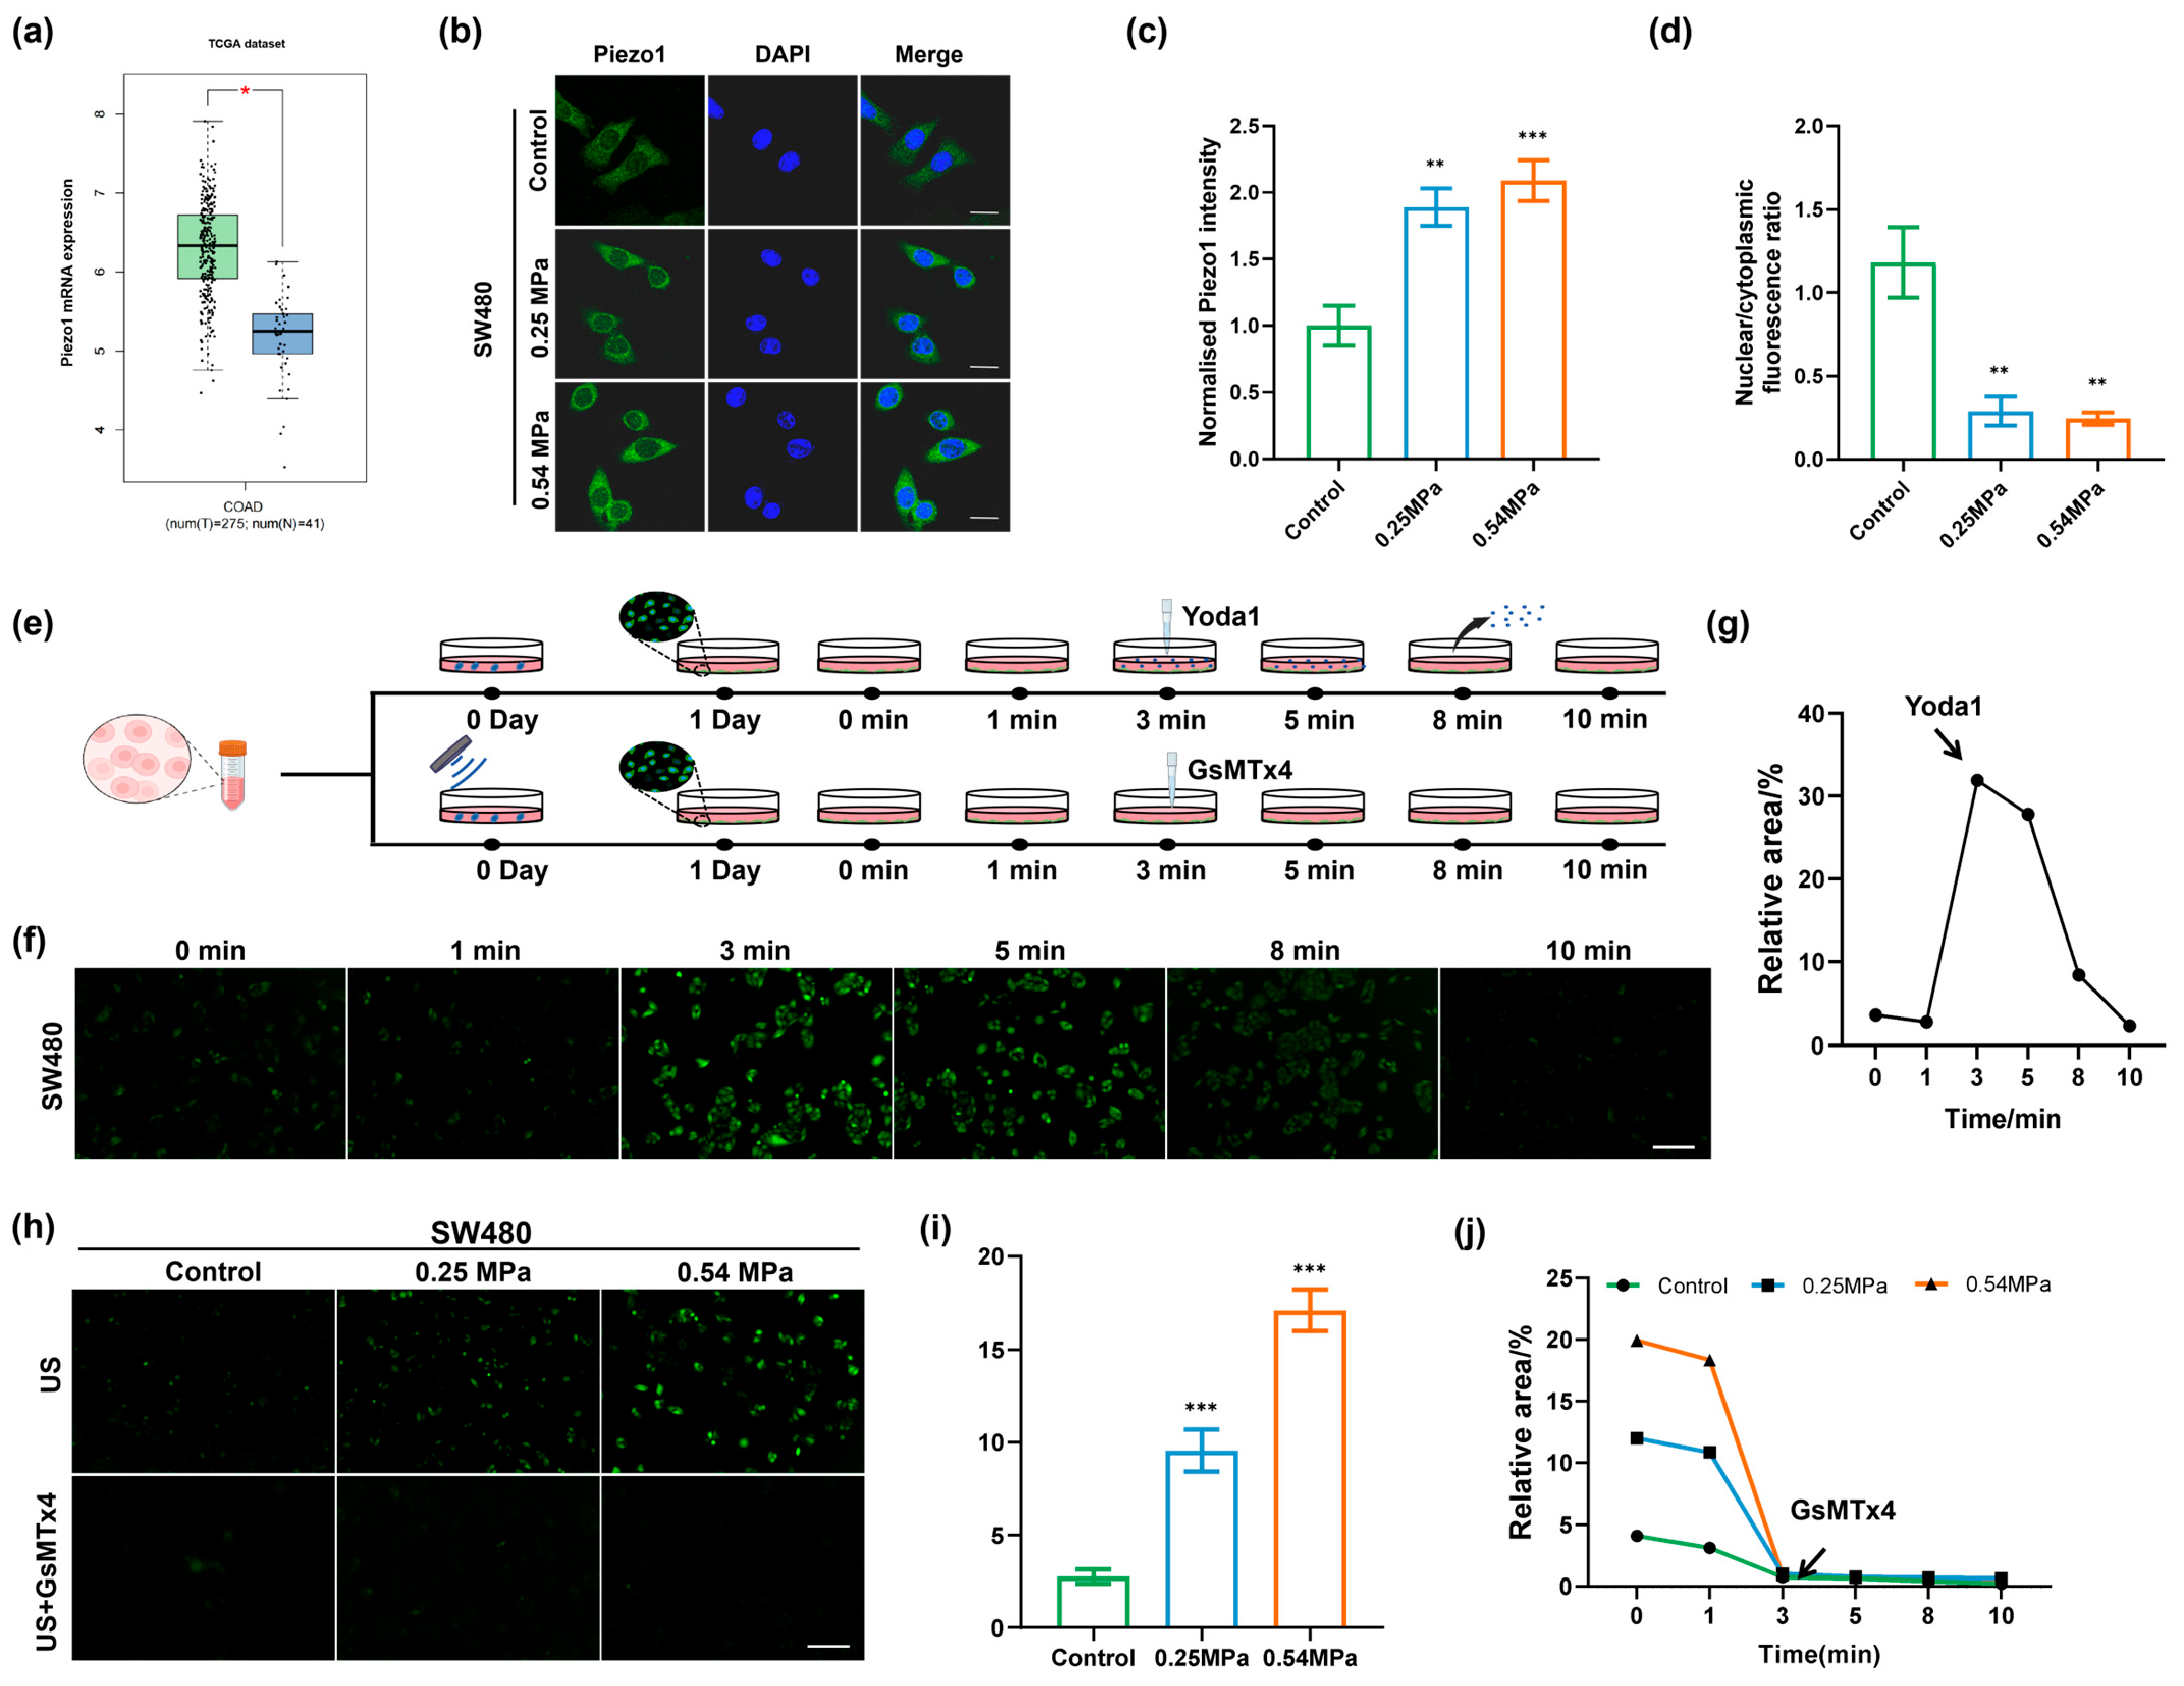
Disclaimer/Publisher’s Note: The statements, opinions and data contained in all publications are solely those of the individual author(s) and contributor(s) and not of MDPI and/or the editor(s). MDPI and/or the editor(s) disclaim responsibility for any injury to people or property resulting from any ideas, methods, instructions or products referred to in the content. |
© 2026 by the authors. Licensee MDPI, Basel, Switzerland. This article is an open access article distributed under the terms and conditions of the Creative Commons Attribution (CC BY) license.