


Abstract
Subcellular fluorescent reporters are used to select compounds and investigate drug mechanisms, but treatment can change reporter delivery, chemistry and biological effects as well as the intended measurand. This critical narrative review examines how those alternatives affect decisions in intracellular biosensing assays. We synthesize representative methodological and pharmacological studies across six cellular compartments and compare the scope of existing reviews of probe design, drug visualization and enzyme-specific validation. Published examples connect oxidation-product identification, calibration-model dependence and state-dependent localization to the conclusions each measurement can support. A decision matrix links competing explanations to informative countertests and specifies when a result supports only an optical phenotype, a compartmental measurement or a functional response. Drug-by-probe-by-illumination comparisons and independent functional endpoints are used to separate apparent optical rescue from biological recovery. Screening applications require an additional test of whether reporter features improve prediction beyond cell-count or viability baselines. The proposed workflow integrates established controls for a defined pharmacological decision; it is not a new validated method or a reporter ranking. Its practical purpose is to make the interpretation of discordant measurements explicit and to identify which additional experiment could change compound prioritization.
1. Introduction
Subcellular fluorescence measurements resolve reporter emission within defined cellular structures, providing information about where and when a drug-associated change occurs. Their interpretation depends on the reporter’s distribution, chemical response and imaging conditions. A compound may enter a cell without reaching its intended compartment, and a local response may precede a change in cell number or distinguish cells with similar viability. Fluorescent reporters can detect these differences through chemical recognition, environment-sensitive emission or selective accumulation. Advances in fluorophore design and organelle targeting have expanded measurements of local polarity, viscosity, ions, reactive species and enzyme activity [1,2,3], including organelle-targeted viscosity sensing [4]. These measurements can guide compound follow-up and mechanistic investigation when they distinguish a local drug response from changes in reporter delivery or behavior; the image alone cannot establish that distinction.
A bright organelle is not a direct measure of drug benefit. Increased emission may reflect analyte conversion, restricted molecular motion, accumulation of the reporter, expansion of the labeled compartment or altered optical collection. Conversely, loss of fluorescence may indicate target inhibition, probe leakage, quenching, photobleaching or disappearance of the cells that initially carried the strongest signal. Environment-sensitive dyes are useful precisely because their emission responds to molecular surroundings; this responsiveness also complicates interpretation in drug-treated cells, where several properties can change simultaneously [5]. Compound-dependent interference can be reproducible and concentration-dependent, so neither a smooth dose–response curve nor repeatability alone establishes biological specificity [6].
The distinction matters most when an optical phenotype is used to infer mechanism. Redox measurements require identification of the particular chemical species or reaction being detected, rather than treating reactive oxygen species (ROS) as a single analyte [7]. Mitochondrial membrane potential is an informative biophysical parameter, but its measurement does not replace assessment of respiration or establish the direction of a therapeutic effect [8]. Morphological profiling can place compounds in a useful phenotypic context, yet the information it captures only partly overlaps with transcriptional responses [9]. These are complementary forms of evidence, not interchangeable readouts.
Existing reviews establish the measurement principles underlying this synthesis [10,11,12]. They address organelle-targeting design and subcellular applications [10], the physiological effects of labeling and limits of ratiometric and lifetime measurements [11], and thioredoxin-system probe selectivity with a proposed validation pipeline [12]. Reviews of drug visualization and diagnostic or delivery systems emphasize imaging technologies, fluorophore design and fluorescent drug conjugates [13,14]. A related primary study uses fluorescent sensor proteins to compare cellular drug uptake [15], addressing exposure rather than whether an organelle response predicts functional benefit. The present review builds on these contributions by examining how a measurement ambiguity changes the interpretation and follow-up of a drug-associated signal.
Table 1 compares the scope of these publications with the present review. Our contribution is to connect established controls to the decision that follows an observed signal: whether to prioritize a compound, assign a mechanism or claim functional rescue. The central message is that optical change, a qualified compartmental measurement and independent functional benefit require different evidence. Small-molecule reporters provide most examples; genetically encoded sensors and label-free measurements are included where they resolve a specified ambiguity. Figure 1 distinguishes the intended biological sequence from alternative routes to fluorescence. This synthesis does not introduce new individual controls, universal thresholds or a validated reporter-ranking method; its practical value remains to be tested prospectively.
Table 1.
Scope of adjacent literature and the decision addressed in this review.
Figure 1.
Biological and measurement pathways linking drug exposure to fluorescence. (A) The intended sequence from exposure through target engagement and an organelle response to an optical signal. This is a schematic pathway, not evidence that each step is established by fluorescence. (B) Probe delivery, local environment and light exposure can independently alter the signal. Solid arrows indicate the conceptual biological sequence; dashed arrows indicate alternative contributions to the measurement. (C) Localization, calibration, perturbation testing and independent function define complementary verification questions. Concepts are synthesized from the methodological literature discussed in Section 1 and Section 3. Green waves represent the fluorescence signal. No experimental data are depicted. Created in BioRender. Wu, B. (2027) https://BioRender.com/z83ei60 (accessed on 7 November 2026).
This is a scope comparison of selected adjacent publications, not an exhaustive novelty search. A narrower decision focus does not imply that the individual controls are new. Access limits are stated to avoid implying full-text assessment where it was not performed.
2. Scope and Literature Selection
This critical narrative review used topic-based PubMed searches completed on 12 September 2026, supplemented by targeted searches for foundational methods and examination of publisher and PubMed Central records. Search concepts combined fluorescent probes or reporters with organelle targeting, viscosity, redox chemistry, lipid peroxidation, calibration, colocalization, phototoxicity, assay interference, morphological profiling and three-dimensional culture. A complementary Crossref discovery query and records identified by digital object identifier supported coverage checks and bibliographic verification.
On 17 September 2026, targeted verification of key experimental cases and a check for overlapping reviews supplemented the original searches; this was not a rerun of the entire search strategy. A further targeted scope update on 26 September 2026 examined four adjacent publications on thioredoxin-system probe validation, drug visualization, diagnostic and delivery probes, and fluorescent protein sensors for drug uptake. This update added scope comparisons and an exposure-versus-response distinction; it was not a new systematic search. Studies were selected for their contribution to an identifiable measurement problem, a pharmacological application or an independent validation strategy. Representative recent applications were considered alongside established methodological studies; environmental and food assays without a relevant cellular interpretation were excluded. The supplementary search records give the queries and retrieval limits; the evidence register identifies the cited studies, their bibliographic records and the evidence available for each interpretation. The searches were not exhaustive, selection was qualitative, and no pooled effect estimate, formal risk-of-bias score or systematic-review claim is made. Where the accessible evidence was limited to an abstract, interpretation was restricted to the reported scope rather than unverified experimental detail.
A targeted check on 29 October 2026 added a study of image-based drug-response profiling in three-dimensional spheroids; the original searches were not rerun.
For the worked examples, we prioritized studies in which a specific source of measurement ambiguity could be traced to an experimental comparison or a reported quantitative result. These examples address chemical product identity, calibration, state-dependent delivery and incremental predictive information. They were selected to expose different failure mechanisms, not to estimate their prevalence. We distinguish controls reported by the original investigators from additional countertests proposed in this review. Where only an abstract was available, the study is used to illustrate its reported application and is not credited with unverified validation experiments.
Codex assisted with manuscript drafting, reference organization and coding. Figure 1, Figure 2 and Figure 3 were reconstructed in BioRender from ChatGPT-generated illustrations and reviewed by the authors. Version numbers were not displayed in the ChatGPT image tool or the BioRender web editor.
Figure 2.
Compartment-specific questions for interpreting fluorescent reporters. (A) Mitochondrial retention must be assessed after depolarization. (B) Lysosomal acidity and cargo turnover are distinct measurements. (C) Endoplasmic-reticulum environmental signals require pathway-appropriate stress measurements. (D) Golgi viscosity is separable from cargo transport. (E) Plasma-membrane polarity and peroxidation report different properties. (F) Lipid-droplet signals require independent evidence of lipid damage where oxidation is claimed; the droplet is shown with a phospholipid monolayer, unlike the bilayer in (E). In (A), purple dots represent the probe and the dashed arrow points to the mitochondrial compartment where retention is assessed. Colors distinguish the structures shown. The drawings are conceptual and are not to scale. No experimental data are depicted. Created in BioRender. Wu, B. (2027) https://BioRender.com/zner0ba (accessed on 7 November 2026).
Figure 3.
Proposed sequence for qualifying a subcellular reporter for pharmacological use. Measurement validation precedes separation of drug, probe and illumination effects, independent functional testing and assessment of transferability. The drug, probe and light icons denote experimental factors; the three dishes are schematic and do not specify a complete control design. The analytical instrument and functional icon represent complementary chemical and biological measurements. The cell, multicellular model and plate illustrate changes in exposure, optical depth and experimental batch. Blue arrowheads show the order of the checks. Black arrows link exposures to samples and samples to readouts. Other colors distinguish the illustrated elements. The claim categories below the workflow are conceptual endpoints, not results of a validated scoring system. No experimental data are depicted. Created in BioRender. Wu, B. (2027) https://BioRender.com/201h41k (accessed on 7 November 2026).
3. Qualifying the Measurement Before Interpreting the Drug Response
3.1. Define the Measurand and the Chemical Event
The measurand is the quantity intended to be measured, such as local pH, apparent microviscosity or the abundance of a defined reaction product. A reporter should first be described in relation to that quantity. A reaction-based probe reports a chemical conversion through a change in fluorescence; a reversible binding sensor reports occupancy within its affinity range; and an environmental sensor responds to local physicochemical properties. These mechanisms impose different temporal meanings. Accumulation of an irreversible product can integrate exposure over time, whereas an equilibrating sensor may follow a changing concentration if its response is sufficiently rapid. Reporting the image as an instantaneous analyte concentration without establishing those kinetics conflates detection with quantification. General design principles for photoinduced electron transfer and Förster resonance energy transfer (FRET) explain how useful responses are constructed, but biological interpretation still requires characterization in the intended sample [1,16].
Hydroethidine illustrates why a red fluorescence increase cannot by itself identify the responsible oxidant [17]. The superoxide-associated product 2-hydroxyethidium and the nonspecific oxidation product ethidium require chemical discrimination. In one liquid chromatography–tandem mass spectrometry study, the corresponding transitions included m/z 330.2 → 301.1 and 314.1 → 284.1, respectively, with retention time and additional transitions supporting product identification [18]. Yet analytical separation did not eliminate preanalytical error: the same study found approximately 150% increases in superoxide-associated marker products during 60 min in Hank’s solution at 25 °C without light.
A practical inference is to pair product-resolved analysis with cell-free incubations matched for medium, time and handling. If the treated-cell difference cannot be distinguished from changes arising during incubation, the result should remain an oxidation-associated signal rather than be reported as a change in cellular superoxide concentration. This example concerns the tested probes and incubation conditions; it does not establish a universal artifact magnitude for all redox assays.
Selectivity testing should therefore reproduce the chemistry relevant to the planned comparison. Showing a response to an analyte in buffer and little response to a list of unrelated compounds is an initial characterization, not complete cellular validation. Drug, reporter, reaction product and medium should be tested together where direct reaction or quenching is plausible. The concentration range, exposure time, pH, protein content and oxygen conditions should be chosen to challenge the proposed interpretation. A labile Fe(II) reporter, for example, can reveal a drug-associated change in an accessible iron pool without measuring total cellular iron or establishing that iron-dependent cell death has occurred [19]. The distinction should remain explicit in the result and figure legend.
Enzyme-activity reporters make this distinction especially important. The thioredoxin-system review identifies unreliable selectivity claims and proposes a validation pipeline [12]. For drug-response work, the practical implication is to qualify the intended enzyme reaction before attributing a treatment-associated signal to inhibition of that enzyme. A downstream viability change cannot retrospectively establish the chemical selectivity of the reporter. Detailed enzyme-specific tests should follow the relevant specialist literature.
3.2. Establish Localization Under the Experimental Perturbation
Organelle targeting is a conditional property of a probe–cell system. Lipophilic cations, protonatable groups, covalent anchors and ligand-based delivery exploit different biological features, each of which can change during treatment. A targeting group that works in untreated cells cannot be assumed to retain its selectivity after membrane depolarization, alkalinization, altered trafficking or cell death. Localization should be assessed at the dose and time used for the pharmacological experiment, including the relevant injured state.
Colocalization supports spatial association at the resolution of the measurement; it does not prove exclusive residence, membrane insertion, luminal localization or molecular binding. Practical microscopy guidance emphasizes background handling and appropriate interpretation of overlap [20]. Correlation of intensity patterns and co-occurrence of labeled structures answer different questions [21]. A high Pearson coefficient can coexist with signal in another compartment, and threshold choices can change overlap estimates. Threshold-overlap analysis offers one way to examine localization across intensity thresholds rather than relying on a single arbitrarily selected value [22].
Interpretation of colocalization depends on spatial resolution and the density of labeled objects. Experiments and simulations have shown that apparent overlap can be inflated at confocal resolution and high labeling density [23]. In studies of neighboring endoplasmic reticulum and mitochondria, organelle movement and the chosen region of interest affected colocalization descriptors [24]. Nanoparticle–lysosome experiments additionally demonstrated sensitivity to medium, optical section thickness, pixel saturation and live versus fixed imaging [25]. These observations argue for reporting acquisition and segmentation settings, including negative compartment markers where possible, and retaining images that reveal off-target signal.
Time-resolved localization is often more informative than an additional endpoint overlay. Receptor-trafficking workflows show how changes in subcellular distribution can be quantified together with endosomal co-occurrence [26]. Statistical comparison must then use an experimental unit appropriate to the design; a large number of correlated pixels cannot substitute for independent biological samples. Methods for testing colocalization measurements explicitly address interpretation beyond the coefficient itself [27]. For drug evaluation, the practical objective is to determine whether a changing signal still arises from the same biological compartment.
3.3. Calibrate the Readout and Report Its Domain of Validity
A simple signal decomposition clarifies what an intensity experiment must identify. In the detector’s linear, unsaturated range, a background-corrected signal can be written conceptually as F − B = G N q, where G collects acquisition-dependent factors, N is the amount of detected reporter and q is its effective fluorescence response in the local environment. This expression is a bookkeeping model, not a complete photophysical description. A drug-associated change in F cannot identify a change in q unless changes in N, G and B have been controlled or measured. Ratiometry can cancel common factors, while lifetime detection avoids some intensity dependencies; neither approach eliminates changes in the environment that modify the reporter’s response through a different mechanism.
Ratiometry reduces some dependencies on loading and illumination when the two signals share those dependencies. It does not automatically remove differential bleaching, unequal background, spectral bleed-through, changes in reaction yield or redistribution of one species relative to another. A ratio should be treated as a calibrated measurement only when the reference and responsive channels remain interpretable across the experiment. Principles developed for chemical calcium indicators and intracellular pH measurements illustrate the need to match sensor affinity, dynamic range and calibration to the compartment of interest [28,29].
Fluorescence lifetime imaging microscopy (FLIM) provides a different route to reducing concentration dependence. Molecular rotors exploit the relationship between intramolecular motion and nonradiative relaxation; restriction of motion can lengthen lifetime as local viscosity increases [30,31]. Calibration permits conversion to an apparent microviscosity within the tested environment, and complementary anisotropy measurements can help assess the physical interpretation [32]. However, lifetime is not intrinsically specific to viscosity. Experiments with related boron-dipyrromethene (BODIPY) rotors showed that structural changes can introduce sensitivity to temperature and polarity [33]. Calibration in a glycerol mixture therefore should not be treated as proof that every lifetime change in a protein-rich membrane reflects viscosity alone.
Within a validated calibration domain, the Förster–Hoffmann relation can be expressed as ln τ = a + x ln η, where τ is lifetime, η is apparent microviscosity, and a and x are fitted, probe- and environment-specific parameters [31]. If the same calibration applies to both states, the implied viscosity ratio is η2/η1 = (τ2/τ1)^(1/x). Thus, a percentage change in lifetime is not the same percentage change in viscosity, and uncertainty in x affects the inferred effect size.
An early BODIPY-rotor study reported an intracellular lifetime of 1.6 ± 0.2 ns, corresponding under its calibration to approximately 140 cP, with time-resolved anisotropy used to examine binding [30]. Those values are an example of calibration-supported interpretation, not default values for mitochondria, membranes or other probes. Raw lifetime distributions, fitting choices and the applicable calibration range should accompany converted measurements.
The same principle applies beyond rotors. A FLIM protocol for nanomolar calcium imaging linked the lifetime response of Oregon Green BAPTA-1 to a defined concentration range and analysis procedure [34]. Calibration-model dependence also occurs in ratiometric measurements. In a yeast-mitochondrial carboxy-SNARF-1 study, a model incorporating a Hill coefficient near 0.5 yielded an inferred pH approximately 0.5 units lower than conventional analysis [35]. This model-specific result should not be applied as a universal correction to mitochondrial pH. Its relevance here is that the conversion model can materially alter the reported quantity without changing the recorded fluorescence. Raw ratios, calibration curves and fit uncertainty should accompany converted measurements. For heterogeneous or changing compartments, an apparent viscosity or reporter ratio may be more defensible than an unqualified absolute concentration.
3.4. Make the Sampling and Image Analysis Part of Assay Qualification
An imaging assay measures the cells and structures that remain detectable under its acquisition and segmentation rules. A treatment can remove highly damaged cells from a field, fragment mitochondria below a size cutoff or change a nucleus enough to fail segmentation. The surviving objects may then appear less perturbed even when total injury increases. Prespecified exclusion rules, inspection of segmentation failures and parallel reporting of object counts and sample viability help distinguish selective loss of detectable objects from a biological response.
Concentration dependence should be examined in both the biological perturbation and the measurement process. A drug dilution series tests pharmacology; a reporter dilution series tests loading, aggregation, quenching and perturbation. Imaging exposure should also be varied sufficiently to identify conditions under which the phenotype is stable. Results that depend strongly on dye concentration or illumination need an explanation before they are used to rank compounds. Table 2 translates these issues into practical analytical questions and corresponding checks.
Table 2.
Sources of assay interference, interpretive consequences and recommended controls.
The checks are proposed analytical priorities, not a universal experimental protocol. Biological and technical replication must be specified for the actual study and justified by its independent unit and precision requirements.
4. Compartment-Specific Opportunities and Interpretive Limits
4.1. Mitochondria: Disentangle State-Dependent Retention from Local Chemistry
Mitochondrial reporters face a recurring circularity: membrane potential can drive their accumulation, while the drug under study changes that potential. The signal may consequently change because less reporter remains in the organelle. Practical guidance on cationic potential dyes emphasizes controls for dye behavior and complementary assays [45]. The problem is especially consequential when a potential-dependent targeting group is attached to a reporter intended to measure another property, such as viscosity or oxidation.
Immobilization addresses retention but introduces a different set of assumptions. Vis-A incorporated a reactive anchor and retained mitochondrial fluorescence after depolarizing treatment, unlike a comparator lacking that anchor [37]. More recent mitochondria-immobilized viscosity probes use reactive groups to support retention during injury [46,47]. These designs can improve reporter retention after mitochondrial injury, while initial delivery may remain state-dependent and reactive anchors may modify local biomolecules.
These results support a useful distinction between delivery and retention. Loading a probe before a depolarizing treatment asks whether previously delivered molecules remain detectable, whereas loading after treatment asks whether the injured compartment can still acquire the probe. A paired comparison of these schedules, with matched exposure, washout and localization measurements, is therefore a proposed countertest for state-dependent delivery. Agreement would reduce this particular ambiguity; disagreement would require separating a delivery-sensitive intensity change from the intended viscosity or redox measurement. Retention after covalent anchoring should also be interpreted alongside independent mitochondrial function, because successful immobilization does not demonstrate that the anchor is biologically inert.
A complementary strategy separates voltage sensing from voltage-dependent accumulation. SPIRIT RhoVR uses intracellular trapping and a voltage-responsive photophysical mechanism to follow reversible mitochondrial potential changes without an extracellular dye reservoir [48]. For mitophagy, an organelle-directed click reaction creates a retained reporter assembly and couples lysosomal acidification to a fluorescence response [49]. Both examples show why the targeting mechanism and the sensing mechanism should be analyzed separately rather than summarized by the single term “mitochondrial probe.”
Dual-response probes offer richer descriptions of mitochondrial stress. DCVP-NO2 reports viscosity and peroxynitrite through distinct fluorescence responses in living cells [50]. Its value for pharmacological work is the ability to ask whether two local changes occur together. The two channels still require independent calibration and tests for cross-sensitivity; their association does not by itself determine which process is upstream. Mito-DDP extended viscosity imaging to cellular dysfunction and inflammatory models, including zebrafish and a Drosophila Alzheimer’s disease model [51]. These applications establish experimental reach, while clinical response prediction remains a separate question.
Matrix viscosity and membrane fluidity are different properties and require distinct measurements. In one molecular-rotor FLIM study, mitochondria-targeted FMR-1 was calibrated in methanol/glycerol mixtures and tested for responses to polarity, ionic strength and temperature. Separate calibration slopes were needed in the low- and high-viscosity regions [52].
In HeLa cells loaded with 1 µM FMR-1 for 30 min, nystatin treatment was associated with higher lifetime-derived matrix viscosity. The investigators examined membrane fluidity separately using FMR-2 in isolated mitochondria; however, some plasma-membrane labeling remained and isolation could introduce other membrane material. These observations support calibration- and preparation-specific interpretations, not interchangeable estimates of matrix and membrane properties. Imaging that combines morphology with several functional reporters can reveal heterogeneity among mitochondria [53], although features that share dye-loading dependencies are not necessarily independent. ROS assays also require their own chemical and preparation-specific controls [54].
4.2. Lysosomes: Separate Acidity, Cargo Delivery and Degradative Flux
Lysosomal fluorescence commonly combines delivery, protonation, compartment size and enzymatic conversion. A pH-sensitive signal can therefore change even when cargo degradation does not. Work with LysoTracker dyes demonstrated that these dyes and microtubule-associated protein 1 light chain 3 beta (LC3B) report different biological events, despite sometimes increasing under the same perturbation [55]. The current autophagy guidelines accordingly recommend multiple approaches and careful distinction between pathway components and pathway activity [41]. A count of acidic puncta is insufficient to establish increased autophagic flux.
Internal references can improve interpretation. GFP-LC3-RFP-LC3ΔG, which contains green fluorescent protein (GFP) and red fluorescent protein (RFP), releases an autophagy-sensitive component and an internal control, allowing their relative behavior to inform flux measurements [56]. Mito-SRAI was developed after investigating reporter behavior inside and outside lysosomes and was applied to mitophagy-focused screening [57]. These approaches illustrate a general requirement: the fate of the reporter must be known along the pathway being measured. Delivery to a lysosome, acidification and proteolytic destruction are related but separable events.
Chemical reporters provide additional measurements. Dual-imaging methods describe calibration and miniaturization of lysosomal pH assays [58], while a cell-penetrating ratiometric construct was used to monitor pH changes across cytosolic and lysosomal regions [59]. IVTI, a lysosomal viscosity probe reported to be pH-insensitive under the tested conditions, reduced one source of cross-sensitivity and enabled low-concentration, wash-free imaging during apoptosis [60]. When the claimed drug effect concerns degradation, these environmental measurements should be paired with cargo turnover or an appropriate enzyme-activity assay.
Substrate-based reporters are particularly relevant to this distinction. Fluorogenic substrates with acidic-organelle targeting were used to examine lysosomal enzyme activity, including in disease-derived cells [61]. Cathepsin activity-based probes demonstrated a tradeoff between biochemical potency and cellular permeability during probe optimization [62]. Strong performance against purified enzyme therefore does not guarantee informative intracellular labeling. Conversely, weak cellular signal may reflect limited access rather than low enzyme activity.
SWJT-6 provides a lysosomal formaldehyde example: its ratiometric response was applied in HeLa cells and zebrafish [63]. It supports measurement of an aldehyde-associated compartmental signal, not an inference about lysosomal repair or drug benefit. Modular formaldehyde probes targeting several intracellular compartments offer a route to comparing spatial patterns, provided that differences in targeting and reaction kinetics are characterized before comparing amplitudes [64].
4.3. Endoplasmic Reticulum: Link an Environmental Response to a Defined Stress Pathway
The endoplasmic reticulum (ER) contains spatially coupled but analytically distinct processes, including calcium storage, protein folding and membrane lipid regulation. Environmental changes can accompany stress without uniquely identifying its cause. The ratiometric probe HM was used to visualize ER polarity changes under tunicamycin, dithiothreitol and hypoxia [65]. An ER-directed fluorescent cage also showed enhanced emission in cellular stress models [66]. These studies support local phenotyping; assignment to a particular unfolded-protein response branch requires measurements directed at that branch.
Calcium reporters illustrate how matching the sensor to the compartment improves specificity. ER-targeted GFP–aequorin indicators were engineered with an affinity appropriate to luminal calcium and can be combined with cytosolic indicators [67]. The resulting measurements address calcium dynamics, while protein-folding stress markers address a different process. A pharmacological experiment can profit from measuring both, provided the temporal comparison is justified and neither measurement is presented as a universal proxy for ER function.
The distinction between reporter and effector becomes explicit with photosensitizing probes. BODIQPy-TPA, predominantly associated with the ER, triggered ferroptotic death after irradiation in the reported cell models; the related lipid-droplet-associated QPy-TPA produced a different death phenotype. Lipidomic analysis distinguished their responses [68]. This is valuable perturbation biology, but the fluorescent compound and light are part of the intervention. In a drug-evaluation experiment using such chemistry, attributing the outcome exclusively to a co-administered drug would be incorrect. The probe’s pharmacology must be incorporated into the experimental question.
4.4. Golgi Apparatus: Relate Environmental Signals to Trafficking
Golgi-directed probes extend environmental imaging into a compartment whose trafficking functions are poorly represented by bulk viability. The probe GV produced viscosity-sensitive signals in A549 cells and lung samples from an acute lung injury model. The full report also described appreciable mitochondrial colocalization, despite stronger Golgi overlap, and the mouse lung imaging used probe-incubated cryosections [69]. These details narrow the conclusion to Golgi-enriched cellular imaging and ex vivo tissue-associated fluorescence. They do not establish exclusively Golgi-localized sensing in intact animals or a clinically validated biomarker.
For pharmacological applications, a change in Golgi-associated viscosity should be paired with an endpoint suited to the claimed function, such as cargo transport, secretion or compartment morphology. The choice depends on whether the drug is intended to alter trafficking or whether Golgi stress is an adverse effect. A panel of organelle-targeted solvatochromic probes, calibrated in model membranes, demonstrated that different compartments can show distinct responses to oxidative and mechanical stress [70]. This supports cross-compartment comparison while underscoring that enrichment, calibration and local membrane composition all influence the interpretation.
4.5. Plasma Membrane: Avoid Assigning a Universal Direction to Viscosity or Polarity
The plasma membrane acts as a drug-access barrier and can also change in response to treatment. A cisplatin study combined BODIPY-rotor FLIM with viability imaging, model lipid vesicles and time-of-flight secondary ion mass spectrometry (ToF-SIMS) [71]. Membrane viscosity increased after prolonged exposure and was also higher in a cisplatin-adapted subline. The viscosity analysis included viable cells: dead cells showed intracellular rotor accumulation and biexponential decay. The finding therefore describes a surviving-cell membrane phenotype associated with lipid remodeling, rather than the average response of all treated cells or a universal measure of efficacy.
Another study associated acquired 5-fluorouracil resistance with persistently increased viscosity and altered lipid composition [72]. By contrast, paclitaxel reduced membrane microviscosity in a different cancer-cell study [73]. Together, these observations show why treatment duration, viability selection and lipid composition matter when interpreting viscosity changes; they do not support a universally favorable direction of change.
Polarity and lipid oxidation also require distinct interpretation. DCVP-BF2 enabled dual-channel imaging of plasma-membrane polarity and near-membrane hypochlorous acid in cisplatin-induced apoptosis and cancer models [74]. The two-analyte approach can reveal coordinated changes that a single channel would miss. Establishing their causal order requires perturbations that distinguish oxidant generation from the consequences of apoptosis. Demonstrating that each channel remains interpretable during membrane injury is particularly important, because reporter partitioning can change as the membrane reorganizes.
Mem-C1C18 used a polarity-sensitive lifetime response to monitor membrane changes in an erastin-treated cell model [75]. LipoxPM instead targeted detection of lipid peroxidation at the plasma membrane [76]. These are complementary reporters of different aspects of a ferroptosis-associated phenotype. Agreement between them would strengthen the description of membrane injury; it would still require cell-death and mechanism-focused evidence to establish ferroptosis.
4.6. Lipid Droplets and Lipid Peroxidation: Identify the Process Being Reported
Lipid droplets can change their size, composition and relationship to other organelles during stress. They can also acquire dyes that originally labeled another compartment. A dual-emission probe was reported to change its localization from mitochondria toward lipid droplets during cell death through a chemical switching process [77]. This behavior is useful when redistribution is the intended readout, but problematic when a fixed compartmental location is assumed. Figure 2 summarizes the different verification questions raised by the major compartments.
Viscosity imaging in lipid droplets has been applied to chemotherapy-associated cell-death models, including work with WD-1 [78]. A droplet viscosity response should be interpreted separately from oxidation of membrane polyunsaturated lipids. The original characterization of C11-BODIPY established its use as an oxidation-sensitive lipid reporter and examined its photophysical and membrane properties [79]. Subsequent protocols describe its use with microscopy and flow cytometry, alongside other lipid-peroxidation measurements [80]. The resulting oxidation readout must be interpreted alongside evidence for the proposed cell-death mechanism.
The original ferroptosis work established an iron-dependent, nonapoptotic process with characteristic pharmacological and biological features [81]. Flow-cytometric methods distinguish assessment of cell death from detection of lipid oxidation [82]. Current cancer-focused synthesis further shows that the consequences of ferroptosis depend on biological context [83]. A convincing drug-evaluation study should therefore connect a time-resolved lipid-oxidation phenotype to actual loss of viability, appropriate pathway interventions and independent lipid chemistry. Normalization of a fluorescent signal alone should not be described as rescue from ferroptosis.
5. When the Reporter Alters the Process Being Measured
5.1. Evaluate the Combination of Probe, Light and Exposure Time
Photostability describes persistence of a signal; photocompatibility describes preservation of the biological system. They are different properties. Phototoxicity can alter physiology before obvious morphological damage occurs [84]. Practical assessment requires observation of biological effects under the actual imaging conditions, because there is no universal illumination setting that is harmless across samples [38]. Long camera integration, repeated focusing and unnecessary illumination between acquisitions can all contribute to the exposure history. Work on illumination overhead demonstrated that light delivered outside camera acquisition can materially increase damage [85].
Reporter chemistry also matters. Photoactivated calcein generated reactive species and affected isolated mitochondrial permeability in an environment-dependent manner [86]. Comparison of mitochondrial dyes under super-resolution imaging linked illumination to changes in mitochondrial shape, cristae and potential [87]. Cyclooctatetraene-conjugated Gentle Rhodamines were evaluated separately for bleaching, singlet-oxygen generation and cellular damage [39]. Under the reported HeLa-cell assay with 561 nm illumination, half-lethal illumination times were approximately 2 min for tetramethylrhodamine methyl ester (TMRM) and 10 min for GR555-mito. Reduced damage did not necessarily track improved bleaching, and these exposure times are assay-specific observations, not transferable safety limits. A related mitochondrial inner-membrane stain enabled extended stimulated emission depletion imaging with reduced phototoxicity [88]. Each dye–sample–illumination combination therefore requires biological qualification under the conditions used.
The practical aim is the lowest perturbation compatible with an interpretable measurement. Improving collection efficiency and signal-to-noise can reduce the required illumination [89]. Probe-concentration and illumination series should first define a usable measurement range. Within that range, the critical question is whether adding the measurement changes the estimated effect of the drug.
Let D, P and L denote drug, probe and imaging illumination, each absent or present, and let Y(D,P,L) be an independent functional endpoint measured by the same method in all conditions. The drug effect is ΔD(P,L) = Y(1,P,L) − Y(0,P,L). Comparing ΔD(1,1) with ΔD(0,0) asks whether the drug effect differs between the complete imaging experiment and matched non-imaged, probe-free cultures. Probe-only and illumination-only conditions help locate that dependence. A nonzero contrast motivates reducing exposure, changing the reporter or interpreting the combination as a joint intervention; a contrast near zero does not prove absence of perturbation, because opposing effects or insufficient precision may obscure it.
Where interactions are central, all eight D × P × L conditions are needed to estimate the three-way contrast ΔD(1,1) − ΔD(1,0) − ΔD(0,1) + ΔD(0,0). This asks whether the drug-by-probe interaction depends on illumination on the chosen endpoint scale. It is an experimental-design proposal, not an effect estimated in this review. The common endpoint must be independent of the primary reporter and applicable in probe-free groups, such as a compatible respiration, turnover, proliferation or survival measurement. Exposure histories and the functional endpoint should be prespecified, with effect estimates and uncertainty reported rather than compatibility inferred from a nonsignificant test alone. These comparisons are motivated by the distinction between optical performance and photodamage [38,39].
Replication should follow treatment allocation and the source of biological variation. Cells and fields within a well are nested observations; wells may be experimental units or technical subsamples depending on preparation and allocation. The model, biological preparations, wells, fields, drug/probe concentrations, illumination and endpoint times must be specified for the intended assay; this review assigns no universal repeat count. Deliverables should include the prespecified functional contrasts, exposure and localization records, reporter measurements where applicable, and counts at each sampling level.
5.2. Treat Binding, Covalent Capture and Sensor Expression as Potential Perturbations
Some reporters alter their targets by design. Photocaged G-quadruplex probes offered light-controlled fluorescence and binding; the activated ligand also increased G-quadruplex thermal stability in the reported characterization [90]. Such a tool can interrogate a target, but binding-induced stabilization is part of its action. Likewise, covalent activity-based labeling occupies or modifies reactive sites. For cathepsin probes, optimization of labeling potency and cell entry was necessary to obtain useful intracellular detection [62]. Reporter signal should therefore be evaluated alongside the possibility of altered target activity.
Genetically encoded reporters can provide molecular specificity and compartmental targeting without small-molecule delivery, but they are not intrinsically neutral. HyPer7 provides a sensitive ratiometric hydrogen-peroxide readout [91], whereas Grx1-roGFP2 couples its response to the glutathione redox system [92]. They measure different aspects of redox biology. Protocols for genetically encoded H2O2 sensors emphasize compartment-resolved dynamics [93], and single-cell redox measurements can reveal heterogeneity hidden by population averages [94]. Expression level, localization and the model’s reducing systems influence the useful measurement range.
In EA.hy926 endothelial cells and primary keratinocytes, stable lentiviral HyPer7 expression was associated with altered TMRM measurements and mitochondrial respiration relative to wild-type cells; proteomics in the endothelial model also identified a stress-associated signature [95]. Antioxidant treatment or culture at 5 kPa oxygen alleviated the potential-associated change. However, these comparisons did not fully separate transduction, integration, selection and heterologous expression from sensing chemistry. They support vector- and expression-matched controls and independent function measurements, rather than a conclusion that HyPer7 is intrinsically toxic in every application. All-optical experiments combining a ROS-generating protein with a sensor deliberately perturb the system to study diffusion [96]; light-driven ROS production is then part of the intended intervention.
6. Connecting Compartmental Signals to Pharmacological Claims
6.1. Separate Intracellular Exposure from Response
Fluorescent sensing can measure drug access when its recognition element and readout are designed for that purpose. Scarabelli and colleagues converted drug targets into sensor proteins and compared binding in living cells with binding in vitro to rank cellular uptake. Their examples covered inhibitors of human carbonic anhydrase II and the p53–HDM2 interaction [15]. This is primary methodological research, and its relevance here is the measured exposure step. Uptake, target engagement, an organelle phenotype and functional benefit each require evidence appropriate to the question. Low response at one extracellular concentration may reflect limited intracellular access; increasing organelle fluorescence does not by itself resolve that explanation.
6.2. Distinguish Engagement, Mechanism and Functional Response
The evidence needed for a claim increases with its biological scope. A reproducible optical change establishes an observed phenotype. A calibrated, localized readout supports a compartmental measurement. A mechanism requires evidence that discriminates among competing causal explanations. Functional efficacy requires a relevant outcome, and prediction in a new population requires validation in that population. Table 3 translates these distinctions into countertests and consequences for compound prioritization. Its decision rules are proposed interpretations, not validated thresholds.
Table 3.
Claim-directed countertests and consequences for compound prioritization.
These are proposed decision rules for assay development, not universal exclusion criteria or regulatory qualification standards. A failed higher-scope claim does not invalidate a supported lower-scope observation. Acceptance criteria, effect scales and precision requirements must be specified for the intended use. Countertests are recommendations of this review unless explicitly attributed to an original study.
Target engagement is especially easy to overstate. A viscosity, pH or redox reporter is usually downstream of many possible targets. The cellular thermal shift assay provides a different form of evidence by examining drug-associated changes in protein thermal stability in cells or tissues [99]. Its protocols also define practical conditions for measuring cellular drug–target interactions [100]. A detectable thermal response can support engagement studies, although absence of a shift does not exclude binding. Conversely, a positive thermal shift can arise indirectly through altered protein interactions or downstream effects, so attribution to direct binding requires a design that distinguishes these alternatives [101]. The purpose of orthogonal testing is to choose a measurement whose assumptions differ from those of the fluorescent phenotype.
Chemical measurements can establish a more precise link between redox state and target chemistry. Ubiquitin-based activity probes designed to trap sulfenylated deubiquitinases enabled enrichment and proteomic identification of oxidized targets [102]. This supplies a type of information that a general oxidation image cannot provide. A ratiometric surface-enhanced Raman scattering nanoprobe for nitric oxide illustrates another detection modality [103]. A different optical modality is not automatically an independent biological validation, however: specificity, delivery and probe reactivity remain relevant. Independence should be judged by which sources of error are shared.
6.3. Design Rescue Experiments to Distinguish Biological Rescue from Optical Rescue
An intervention can reduce fluorescence through direct quenching, altered probe reaction or reduced uptake without restoring function. Cell-free checks for reporter interference and an independent functional endpoint therefore answer complementary questions. For a proposed ferroptosis-directed compound, an oxidation-sensitive lipid signal, independently measured cell death and a pathway-directed rescue intervention should be interpreted jointly [80,81,82]. If the intervention suppresses probe oxidation but leaves death unchanged, it supports modulation of that optical endpoint, not rescue from death. If it restores viability without reversing early oxidation, the recorded change may be upstream, reversible or dispensable at that time. If both change, direct probe interference must still be excluded before assigning mechanism. Time-resolved measurements, a mechanistically distinct intervention where feasible, and chemically independent lipid-oxidation analysis can challenge these alternatives. These interpretive branches are this review’s synthesis, not a validated diagnostic algorithm.
The outcome must fit the biological question. For mitochondrial injury, potential, respiration and cell survival answer different questions. For lysosomal intervention, acidity and cargo degradation are distinct. For a cytostatic anticancer agent, reduced proliferation should not be confused with cell killing. Growth-rate inhibition metrics were developed because conventional drug-sensitivity measures can be confounded by the number of cell divisions during the assay [42]. An imaging endpoint can add information about state, but it does not remove that confounding from the proliferation measurement.
Timing is equally important. Early compartmental changes can suggest an initiating event, but temporal precedence alone does not establish causality. Late imaging may predominantly describe terminal injury or the surviving fraction. A useful sequence records an early measurement window, a later functional outcome and, where relevant, recovery after withdrawal. The reporter must remain qualified at each point. Table 4 compares representative studies according to what they measured, what additional evidence was obtained and which interpretive boundary remains.
Table 4.
Representative applications and the boundary of pharmacological interpretation.
FLIM, fluorescence lifetime imaging microscopy; G4, G-quadruplex; DUB, deubiquitinase. The table distinguishes findings reported in each study from interpretive limits identified in this review. It does not rank probe performance across incompatible experimental conditions.
7. From Informative Images to Screening and Model Transfer
7.1. Screening Needs Interference Controls as Well as Biological Controls
High-throughput applications multiply opportunities for discovery and interference. Fluorescence polarization can support robust homogeneous assays but remains sensitive to interfering compounds [105]. Structure-based tools such as ChemFLuo can flag potentially fluorescent molecules [106], although emission still depends on medium, concentration and instrument settings. A direct pharmacological example is SB216763 at 12 µM in HLE-B3 lens epithelial cells exposed to hypoxia and reoxygenation [36]. Drug fluorescence contaminated the JC-1 readout; reference spectra and spectral deconvolution were used before interpreting the 540/595 nm ratio. The corrected signal supported preservation of a potential-associated readout. Neither treatment group showed apoptosis or necrosis at the assessed time, so the experiment did not establish survival rescue, and JC-1 alone does not identify permeability-transition-pore opening. Drug-only samples acquired in the same detection channels are therefore necessary when a compound could contribute to the signal.
Multiparametric morphology can place targeted reporter changes in a broader cellular context. The Cell Painting protocol labels several cellular components and extracts quantitative features [107]; subsequent optimization evaluated assay performance and simplified aspects of the procedure [40]. Applications have identified a lysosomotropic, iron-sequestering autophagy inhibitor [108] and detected a mitochondrial fragmentation and integrated-stress phenotype shared by compounds acting on different targets [109]. The latter finding is instructive: a recognizable organelle phenotype can report convergent stress rather than a unique molecular target.
Broader screens support the value of morphology without making it a direct efficacy measure. Cell Painting-based models enriched active compounds in follow-up testing [97], and profiling revealed bioactivity within previously inactive chemical collections [110]. Subprofile analysis can help annotate defined modes of action [111]. Integrating morphology with gene-expression and pathway information offers additional context [112]. Each approach depends on the reference perturbations and annotation quality available to it; confidence should fall when a new compound lies outside that domain.
A recent reanalysis showed why a simple baseline is necessary before attributing predictive value to additional imaging features [98]. In a curated benchmark of 24 protein-target assays across 269 compounds, models using complete Cell Painting profiles achieved mean balanced accuracy of 0.67, compared with 0.52 for a cell-count model. The same study identified widely used benchmarks in which cell count already explained substantial performance. The lesson is task-specific: rich images can add information, but that increment must be demonstrated rather than inferred from model complexity. For a proposed organelle reporter, matched comparisons with and without the reporter-derived features, evaluated on the same held-out compounds and with the same outcome definition, would test the added information more directly. These published benchmark results do not establish that any particular reporter improves prospective hit selection.
Data from matched chemical and genetic perturbations showed that identifying equivalent phenotypes remains challenging even when target relationships are known [113]. A recent application in primary human hepatocytes combined morphological profiling with cytotoxicity assays and found that predictive performance depended on the endpoint being considered [114]. These results support a role for targeted fluorescent reporters as interpretable channels within a broader assay, followed by mechanistic confirmation of selected hits. Because conventional Cell Painting includes fixation, live-cell environmental reporters should be recorded before fixation or in matched parallel wells unless their validity after fixation has been established [40,107].
7.2. Preserve Independence Across Cells, Wells and Batches
Thousands of imaged cells can describe one culture in detail, but they do not necessarily represent thousands of independent biological replicates. Imaging observations are nested: organelles occur within cells, cells within fields, fields within wells and wells within preparations or donors. Reports should identify these levels, the treatment-allocation and inference units, and the handling of repeated observations.
To evaluate transfer, the held-out unit should match the intended use, such as a new preparation, donor, acquisition batch or laboratory. Splitting cells from the same preparation between training and test sets does not establish transfer to a new preparation. For prediction on new chemistry, all observations from a compound should remain in one partition; grouping structurally related compounds may also be needed to assess transfer beyond familiar chemical space. Model and hyperparameter selection should use training and validation data, with the test set reserved for final evaluation [97]. Feature selection and fitted preprocessing belong within this design, and any use of new-batch controls should be declared in advance.
Batch correction is useful but cannot replace experimental balance. A benchmark using Cell Painting data evaluated correction across increasingly heterogeneous laboratory and microscope settings and found that difficult scenarios remained unresolved [43]. Normalizing away a treatment-specific shift can remove biology, while preserving a plate-associated artifact can create a spurious phenotype. Reference controls across plates, retained raw features and sensitivity analyses make the interpretation more inspectable. These considerations are particularly relevant when comparing reporter intensities between acquisition days or combining archived datasets.
For an assay intended to transfer between laboratories, a prospective reproducibility study could distribute the same reference specimens, compounds and reporter lots across sites, while recording operator, instrument, illumination, calibration, culture batch and analysis settings. Replicate measurements should be grouped by the unit independently prepared or treated, with within-site and between-site variation reported separately. A second probe lot and independently prepared samples can test robustness, and a laboratory or acquisition batch held out from method development can assess transfer. These are proposed study-design priorities rather than performance thresholds or evidence that this review’s framework has been validated [43].
Label-free prediction of fluorescent channels introduces another evidence boundary. A study predicting Cell Painting channels from brightfield images demonstrated potential for downstream profiling, while feature-level performance varied [115]. Predicted fluorescence is a model output, not a direct measurement of the corresponding analyte or compartment. Such methods may reserve optical channels for targeted reporters, but their outputs should be labeled and independently validated for the decision being made. Mechanistic conclusions should remain linked to experimentally measured endpoints rather than to reconstructed fluorescence alone.
7.3. Three-Dimensional Cultures Add Exposure and Optical Depth to the Problem
Moving from a monolayer to a spheroid or organoid changes both biology and measurement. Drug penetration, reporter penetration, local oxygenation, scattering and segmentation can vary with depth. Molecular-rotor FLIM has been adapted to three-dimensional tumor cultures [116], but an interpretable map still requires adequate photons, controlled acquisition and attention to spatial sampling. A dim core may represent low reporter access, optical attenuation or a genuine biological difference; intensity alone cannot distinguish them.
Live imaging of topotecan in retinoblastoma-derived three-dimensional cultures showed that sphere size affected penetration time and linked penetration to cytotoxicity in that model [44]. Blood–brain barrier organoid methods describe both fluorescence and mass-spectrometric approaches to drug-permeability assessment [117]. These studies illustrate why tissue access should be measured rather than inferred from an extracellular concentration. Organoid type and composition must also be stated: a barrier spheroid, a tumor-derived culture and a stem-cell-derived organoid are not interchangeable models.
High-content imaging of miniaturized hepatocellular carcinoma organoid cultures combined viability, morphology and other cellular features to improve interpretation of drug effects [118]. Label-free metabolic imaging offers a complementary route. Optical metabolic imaging has been proposed for tumor-organoid drug testing [119], and a bladder-cancer organoid study combined Raman spectroscopy with endogenous-fluorophore FLIM to monitor treatment-associated biochemical and metabolic changes [104]. These approaches reduce dependence on an exogenous reporter but introduce their own spectral, metabolic and analysis assumptions. Agreement between different modalities is most informative when their potential errors are understood.
In vivo applications require an additional separation between exposure, signal and outcome. Mito-IQS was used to monitor viscosity and hydrogen peroxide in a cerebral ischemia/reperfusion model, including treatment-associated changes [120]. Such model-specific results can motivate further validation, but they do not establish performance across diseases, dosing regimens or patients. A stronger evaluation would test prediction against a prespecified independent endpoint in a prospectively defined model and dosing setting.
Image analysis can also help interpret drug response when three-dimensional samples do not support reliable single-cell segmentation. Berker and colleagues investigated patient-specific transfer learning for confocal fluorescence images of tumor-cell spheroids, validating the approach in six cell lines and testing it on patient-derived samples [121]. The method illustrates a way to analyze image-based response despite limited patient material; it does not by itself validate a subcellular reporter or demonstrate that predictions transfer to an untested laboratory or patient population.
8. Discussion: Matching Controls to the Intended Biosensing Decision
The sequence in Figure 3 begins by stating the decision for which the assay is being used. For exploratory compound prioritization, a stable optical phenotype may be sufficient to trigger follow-up once assay interference and measurement-induced injury have been assessed. For mechanistic attribution, the phenotype must survive countertests aimed at alternative chemical, delivery and pathway explanations. For response prediction, the relevant question is whether the reporter improves a prespecified outcome prediction in independently evaluated compounds or models. These uses require different evidence and should not share an undifferentiated “validated probe” label.
The decision matrix in Table 3 makes the consequence of a failed check explicit. Some failures require changing the measurement, such as a compound emitting in the detection channel. Others narrow the interpretation, such as a localized signal that has not been calibrated during injury. Others change the priority of follow-up, such as a reporter feature providing no demonstrated gain over cell count. The evidence package should therefore record both the successful checks and the conclusion that each check permits. This approach avoids treating a longer list of assays as validation in itself; the added experiment is useful when it resolves an alternative explanation that could change the decision.
The SB216763–JC-1 example in Section 7 illustrates how this approach changes a decision [36]. A compound-associated fluorescence increase first triggers a spectral-interference check. Subtracting the compound contribution may recover an interpretable reporter measurement, but it does not establish protection: the independent cell-death endpoint still determines whether a functional benefit occurred. An optical correction and a biological rescue therefore resolve different questions. In this example, a corrected optical readout cannot justify promoting the compound as protective without the corresponding functional evidence.
Figure 4 reproduces the published spectra, spectral correction and reported ratio for this example [36], illustrating why compound fluorescence must be separated from the reporter signal.
Figure 4.
Published example of drug-associated spectral interference in a JC-1 assay. HLE-B3 cells received 12 µM SB216763 or 0.05% dimethyl sulfoxide for 90 min before 3 h of hypoxia; JC-1 loading (5 µg/mL, 30 min) and subsequent measurements were performed after reoxygenation. (A) Emission from SB216763-treated cells without JC-1. (B) JC-1 spectra in vehicle-treated cells. (C) Combined JC-1 and SB216763 signal. (D) Signal after deconvolution of the drug contribution. (E) The reported 540/595 nm ratio over time for the corrected drug-treated signal and vehicle control. In the panels, SB denotes SB216763 and A.U. denotes arbitrary units. The original authors reported three independent cell populations and displayed the best of the three experiments, not their pooled mean. Reproduced without modification from Brooks et al. [36], Figure 1, © 2013 Molecular Vision, under the Creative Commons Attribution 3.0 license (https://creativecommons.org/licenses/by/3.0/ (accessed on 7 November 2026)).
A second decision arises when a sensor is proposed as an extra screening channel. The published Cell Painting benchmark discussed in Section 7 demonstrates that the gain over cell count depends on the prediction task [98]. For a new subcellular channel, the relevant comparison is the same held-out compounds and endpoint evaluated with and without that channel. If a gain is not demonstrated, the reporter can remain useful for mechanistic follow-up while its value for prospective compound selection remains unestablished. These examples illustrate the proposed decisions using published evidence; no new screening performance is estimated here.
The proposed framework could be evaluated prospectively using a prespecified compound set and independent functional endpoints. Compound rankings based on reporter signals alone would be compared with rankings after the interference, localization and perturbation checks, while functional outcomes would be assessed without knowledge of either ranking. Prespecified measures should include ranking concordance with the functional outcome, the frequency of unsupported rescue claims, missed active compounds and additional sample use. Repetition across independent preparations and laboratories, with the experimental unit and analysis plan specified in advance, would test whether the checks improve decisions and whether the benefit transfers. This is a proposed evaluation, not evidence that the framework improves screening performance.
Several methodological priorities follow. First, probe studies should make negative and off-target observations accessible, including signal loss during injury, redistribution and failures of calibration. Second, reporter development should evaluate functional perturbation under the imaging conditions used for the intended application, rather than relying only on a short viability test performed without illumination. Third, cross-compartment measurements should compare equivalent physical quantities and report uncertainty introduced by different delivery and sensing chemistries. Fourth, studies intended for screening should provide sufficient raw images, acquisition metadata and analysis settings to reproduce the reported phenotype.
The present synthesis has limitations. It emphasizes representative analytical problems and does not estimate how frequently each failure mode occurs across the literature. The available studies use heterogeneous models, dyes, exposure conditions and endpoints, so their sensitivity, specificity and effect sizes cannot be ranked directly. Some recent applications are accessible principally through bibliographic abstracts, limiting assessment of their detailed controls. The proposed framework has not been tested prospectively as an intervention to improve screening performance. Its value should be evaluated through studies that compare decisions made with and without the additional qualification steps.
9. Conclusions
Subcellular fluorescent reporters can reveal where and when a drug perturbs a biological system, but fluorescence alone rarely identifies a drug mechanism or establishes functional benefit. The interpretation is strongest when chemical specificity, localization, calibration and measurement-induced perturbation are evaluated together and linked to an independent outcome. Priority areas for future work are treatment-dependent probe redistribution, cross-sensitivity of environmental reporters, effects of probe and illumination on the biology being measured, and reproducibility across preparations, instruments and laboratories. Prospective comparisons of decisions made with and without the proposed qualification checks are needed to determine whether they improve compound prioritization. Until such studies are performed, the framework should guide the choice and interpretation of controls rather than be treated as a validated ranking method.
Supplementary Materials
The following supporting information can be downloaded at https://www.mdpi.com/article/10.3390/bios16110643/s1, Supplementary_Evidence_Register.csv: bibliographic records, access limits and citation contexts; Supplementary_Search_Records.csv: search dates, queries and targeted follow-up records.
Author Contributions
B.W.: Conceptualization, Data curation, Writing—original draft, Writing—review and editing. B.-S.H.: Conceptualization, Supervision, Writing—review and editing. All authors have read and agreed to the published version of the manuscript.
Funding
This work was supported by the Natural Science Foundation of Hunan Province (grant number 2026JJ81241 to Ben Wu).
Institutional Review Board Statement
Not applicable. This review reports no new studies involving human participants or animals.
Informed Consent Statement
Not applicable.
Data Availability Statement
No new experimental datasets were generated or analyzed for this review. The bibliographic evidence register and search records supporting the narrative synthesis are provided as Supplementary Files.
Acknowledgments
Codex (initial client version 0.153.4) assisted with reference organization and coding. We reviewed and edited the outputs and take full responsibility for this manuscript.
Conflicts of Interest
The authors declare no conflicts of interest.
References
- Jun, J.V.; Chenoweth, D.M.; Petersson, E.J. Rational design of small molecule fluorescent probes for biological applications. Org. Biomol. Chem. 2020, 18, 5747–5763. [Google Scholar] [CrossRef] [Scilit] [PubMed]
- Choi, N.E.; Lee, J.Y.; Park, E.C.; Lee, J.-H.; Lee, J. Recent Advances in Organelle-Targeted Fluorescent Probes. Molecules 2021, 26, 217. [Google Scholar] [CrossRef] [Scilit] [PubMed]
- Tinker, J.; Anees, P.; Krishnan, Y. Quantitative Chemical Imaging of Organelles. Acc. Chem. Res. 2024, 57, 1906–1917. [Google Scholar] [CrossRef] [Scilit] [PubMed]
- Xiong, J.; Wu, G.L.; Yang, Q.; Chen, G. Recent Advances in Molecular Engineering of Organelle-Targeted Viscosity Probes for Fluorescence and Biological Applications. ACS Sens. 2026, 11, 5225–5246. [Google Scholar] [CrossRef] [Scilit] [PubMed]
- Klymchenko, A.S. Solvatochromic and Fluorogenic Dyes as Environment-Sensitive Probes: Design and Biological Applications. Acc. Chem. Res. 2017, 50, 366–375. [Google Scholar] [CrossRef] [Scilit] [PubMed]
- Thorne, N.; Auld, D.S.; Inglese, J. Apparent activity in high-throughput screening: Origins of compound-dependent assay interference. Curr. Opin. Chem. Biol. 2010, 14, 315–324. [Google Scholar] [CrossRef] [Scilit] [PubMed]
- Murphy, M.P.; Bayir, H.; Belousov, V.; Chang, C.J.; Davies, K.J.A.; Davies, M.J.; Dick, T.P.; Finkel, T.; Forman, H.J.; Janssen-Heininger, Y.; et al. Guidelines for measuring reactive oxygen species and oxidative damage in cells and in vivo. Nat. Metab. 2022, 4, 651–662. [Google Scholar] [CrossRef] [Scilit] [PubMed]
- Kowaltowski, A.J.; Abdulkader, F. How and when to measure mitochondrial inner membrane potentials. Biophys. J. 2024, 123, 4150–4157. [Google Scholar] [CrossRef] [Scilit] [PubMed]
- Way, G.P.; Natoli, T.; Adeboye, A.; Litichevskiy, L.; Yang, A.; Lu, X.; Caicedo, J.C.; Cimini, B.A.; Karhohs, K.; Logan, D.J.; et al. Morphology and gene expression profiling provide complementary information for mapping cell state. Cell Syst. 2022, 13, 911–923.e9. [Google Scholar] [CrossRef] [Scilit] [PubMed]
- Wang, Z.; Liu, Y.; Yuan, L.; Jiang, X.; Wu, C.; Chao, M.; Li, Y.; Zhu, H.-L.; Liu, T. Design strategies and applications of organelle-targeted fluorescent probes for subcellular imaging. TrAC Trends Anal. Chem. 2026, 203, 118987. [Google Scholar] [CrossRef] [Scilit]
- Cuevas-Galindo, M.E.; Jiménez-Sánchez, A. To label or not to label? The paradox of small-molecule probes in biological characterization. Front. Photonics 2026, 7, 1858154. [Google Scholar] [CrossRef] [Scilit]
- Scholzen, K.C.; Zeisel, L.; Arnér, E.S.J. A critical assessment of fluorescent probes as cellular reporters for thioredoxin system enzyme activities. Chem 2026, 12, 102868. [Google Scholar] [CrossRef] [Scilit]
- Sun, T.; Zhao, H.; Hu, L.; Shao, X.; Lu, Z.; Wang, Y.; Ling, P.; Li, Y.; Zeng, K.; Chen, Q. Enhanced optical imaging and fluorescent labeling for visualizing drug molecules within living organisms. Acta Pharm. Sin. B 2024, 14, 2428–2446. [Google Scholar] [CrossRef] [Scilit] [PubMed]
- Georgiev, N.I.; Bakov, V.V.; Anichina, K.K.; Bojinov, V.B. Fluorescent Probes as a Tool in Diagnostic and Drug Delivery Systems. Pharmaceuticals 2023, 16, 381. [Google Scholar] [CrossRef] [Scilit] [PubMed]
- Scarabelli, S.; Tan, K.T.; Griss, R.; Hovius, R.; D’alessandro, P.L.; Vorherr, T.; Johnsson, K. Evaluating Cellular Drug Uptake with Fluorescent Sensor Proteins. ACS Sens. 2017, 2, 1191–1197. [Google Scholar] [CrossRef] [Scilit] [PubMed]
- Yuan, L.; Lin, W.; Zheng, K.; Zhu, S. FRET-based small-molecule fluorescent probes: Rational design and bioimaging applications. Acc. Chem. Res. 2013, 46, 1462–1473. [Google Scholar] [CrossRef] [Scilit] [PubMed]
- Kalyanaraman, B.; Darley-Usmar, V.; Davies, K.J.; Dennery, P.A.; Forman, H.J.; Grisham, M.B.; Mann, G.E.; Moore, K.; Roberts, L.J., II; Ischiropoulos, H. Measuring reactive oxygen and nitrogen species with fluorescent probes: Challenges and limitations. Free Radic. Biol. Med. 2012, 52, 1–6. [Google Scholar] [CrossRef] [Scilit] [PubMed]
- Xiao, Y.; Meierhofer, D. Are Hydroethidine-Based Probes Reliable for Reactive Oxygen Species Detection? Antioxid. Redox Signal. 2019, 31, 359–367. [Google Scholar] [CrossRef] [Scilit] [PubMed]
- Xing, W.; Xu, H.; Ma, H.; Abedi, S.A.A.; Wang, S.; Zhang, X.; Liu, X.; Xu, H.; Wang, W.; Lou, K. A PET-based fluorescent probe for monitoring labile Fe(II) pools in macrophage activations and ferroptosis. Chem. Commun. 2022, 58, 2979–2982. [Google Scholar] [CrossRef] [Scilit] [PubMed]
- Dunn, K.W.; Kamocka, M.M.; McDonald, J.H. A practical guide to evaluating colocalization in biological microscopy. Am. J. Physiol. Cell Physiol. 2011, 300, C723–C742. [Google Scholar] [CrossRef] [Scilit] [PubMed]
- Aaron, J.S.; Taylor, A.B.; Chew, T.L. Image co-localization—Co-occurrence versus correlation. J. Cell Sci. 2018, 131, jcs211847. [Google Scholar] [CrossRef] [Scilit] [PubMed]
- Sheng, H.; Stauffer, W.; Lim, H.N. Systematic and general method for quantifying localization in microscopy images. Biol. Open 2016, 5, 1882–1893. [Google Scholar] [CrossRef] [Scilit] [PubMed]
- Xu, L.; Rönnlund, D.; Aspenström, P.; Braun, L.J.; Gad, A.K.B.; Widengren, J. Resolution, target density and labeling effects in colocalization studies—Suppression of false positives by nanoscopy and modified algorithms. FEBS J. 2016, 283, 882–898. [Google Scholar] [CrossRef] [Scilit] [PubMed]
- Brunstein, M.; Oheim, M. Dependence of descriptors of co-localization on microscope spatiotemporal resolution and the choice of regions of interest. Microsc. Res. Tech. 2017, 80, 220–230. [Google Scholar] [CrossRef] [Scilit] [PubMed]
- Moreno-Echeverri, A.M.; Susnik, E.; Vanhecke, D.; Taladriz-Blanco, P.; Balog, S.; Petri-Fink, A.; Rothen-Rutishauser, B. Pitfalls in methods to study colocalization of nanoparticles in mouse macrophage lysosomes. J. Nanobiotechnol. 2022, 20, 464. [Google Scholar] [CrossRef] [Scilit] [PubMed]
- Pike, J.A.; Styles, I.B.; Rappoport, J.Z.; Heath, J.K. Quantifying receptor trafficking and colocalization with confocal microscopy. Methods 2017, 115, 42–54. [Google Scholar] [CrossRef] [Scilit] [PubMed]
- McDonald, J.H.; Dunn, K.W. Statistical tests for measures of colocalization in biological microscopy. J. Microsc. 2013, 252, 295–302. [Google Scholar] [CrossRef] [Scilit] [PubMed]
- Paredes, R.M.; Etzler, J.C.; Watts, L.T.; Zheng, W.; Lechleiter, J.D. Chemical calcium indicators. Methods 2008, 46, 143–151. [Google Scholar] [CrossRef] [Scilit] [PubMed]
- Gonzales, G.A.; Canton, J. Measuring Phagosomal pH by Fluorescence Microscopy. Methods Mol. Biol. 2023, 2692, 153–169. [Google Scholar] [CrossRef] [Scilit] [PubMed]
- Kuimova, M.K.; Yahioglu, G.; Levitt, J.A.; Suhling, K. Molecular rotor measures viscosity of live cells via fluorescence lifetime imaging. J. Am. Chem. Soc. 2008, 130, 6672–6673. [Google Scholar] [CrossRef] [Scilit] [PubMed]
- Suhling, K.; Levitt, J.A.; Chung, P.H.; Kuimova, M.K.; Yahioglu, G. Fluorescence lifetime imaging of molecular rotors in living cells. J. Vis. Exp. 2012, 60, e2925. [Google Scholar] [CrossRef] [Scilit] [PubMed]
- Kuimova, M.K. Mapping viscosity in cells using molecular rotors. Phys. Chem. Chem. Phys. 2012, 14, 12671–12686. [Google Scholar] [CrossRef] [Scilit] [PubMed]
- Vyšniauskas, A.; López-Duarte, I.; Duchemin, N.; Vu, T.-T.; Wu, Y.; Budynina, E.M.; Volkova, Y.A.; Cabrera, E.P.; Ramírez-Ornelas, D.E.; Kuimova, M.K. Exploring viscosity, polarity and temperature sensitivity of BODIPY-based molecular rotors. Phys. Chem. Chem. Phys. 2017, 19, 25252–25259. [Google Scholar] [CrossRef] [Scilit] [PubMed]
- Zheng, K.; Jensen, T.P.; Rusakov, D.A. Monitoring intracellular nanomolar calcium using fluorescence lifetime imaging. Nat. Protoc. 2018, 13, 581–597. [Google Scholar] [CrossRef] [Scilit] [PubMed]
- Żurawik, T.M.; Pomorski, A.; Belczyk-Ciesielska, A.; Goch, G.; Niedźwiedzka, K.; Kucharczyk, R.; Krężel, A.; Bal, W. Revisiting Mitochondrial pH with an Improved Algorithm for Calibration of the Ratiometric 5(6)-carboxy-SNARF-1 Probe Reveals Anticooperative Reaction with H+ Ions and Warrants Further Studies of Organellar pH. PLoS ONE 2016, 11, e0161353. [Google Scholar] [CrossRef] [Scilit] [PubMed]
- Brooks, M.M.; Neelam, S.; Fudala, R.; Gryczynski, I.; Cammarata, P.R. Lenticular mitoprotection. Part A: Monitoring mitochondrial depolarization with JC-1 and artifactual fluorescence by the glycogen synthase kinase-3β inhibitor, SB216763. Mol. Vis. 2013, 19, 1406–1412. [Google Scholar] [PubMed]
- Song, X.; Li, N.; Wang, C.; Xiao, Y. Targetable and fixable rotor for quantifying mitochondrial viscosity of living cells by fluorescence lifetime imaging. J. Mater. Chem. B 2017, 5, 360–368. [Google Scholar] [CrossRef] [Scilit] [PubMed]
- Laissue, P.P.; Alghamdi, R.A.; Tomancak, P.; Reynaud, E.G.; Shroff, H. Assessing phototoxicity in live fluorescence imaging. Nat. Methods 2017, 14, 657–661. [Google Scholar] [CrossRef] [Scilit] [PubMed]
- Liu, T.; Kompa, J.; Ling, J.; Lardon, N.; Zhang, Y.; Chen, J.; Reymond, L.; Chen, P.; Tran, M.; Yang, Z.; et al. Gentle Rhodamines for Live-Cell Fluorescence Microscopy. ACS Cent. Sci. 2024, 10, 1933–1944. [Google Scholar] [CrossRef] [Scilit] [PubMed]
- Cimini, B.A.; Chandrasekaran, S.N.; Kost-Alimova, M.; Miller, L.; Goodale, A.; Fritchman, B.; Byrne, P.; Garg, S.; Jamali, N.; Logan, D.J.; et al. Optimizing the Cell Painting assay for image-based profiling. Nat. Protoc. 2023, 18, 1981–2013. [Google Scholar] [CrossRef] [Scilit] [PubMed]
- Klionsky, D.J.; Abdel-Aziz, A.K.; Abdelfatah, S.; Abdellatif, M.; Abdoli, A.; Abel, S.; Abeliovich, H.; Abildgaard, M.H.; Abudu, Y.P.; Acevedo-Arozena, A.; et al. Guidelines for the use and interpretation of assays for monitoring autophagy (4th edition). Autophagy 2021, 17, 1–382. [Google Scholar] [CrossRef] [Scilit] [PubMed]
- Hafner, M.; Niepel, M.; Chung, M.; Sorger, P.K. Growth rate inhibition metrics correct for confounders in measuring sensitivity to cancer drugs. Nat. Methods 2016, 13, 521–527. [Google Scholar] [CrossRef] [Scilit] [PubMed]
- Arevalo, J.; Su, E.; Ewald, J.D.; van Dijk, R.; Carpenter, A.E.; Singh, S. Evaluating batch correction methods for image-based cell profiling. Nat. Commun. 2024, 15, 6516. [Google Scholar] [CrossRef] [Scilit] [PubMed]
- Winter, U.; Aschero, R.; Fuentes, F.; Buontempo, F.; Zugbi, S.; Sgroi, M.; Sampor, C.; Abramson, D.H.; Carcaboso, A.M.; Schaiquevich, P. Tridimensional Retinoblastoma Cultures as Vitreous Seeds Models for Live-Cell Imaging of Chemotherapy Penetration. Int. J. Mol. Sci. 2019, 20, 1077. [Google Scholar] [CrossRef] [Scilit] [PubMed]
- Perry, S.W.; Norman, J.P.; Barbieri, J.; Brown, E.B.; Gelbard, H.A. Mitochondrial membrane potential probes and the proton gradient: A practical usage guide. BioTechniques 2011, 50, 98–115. [Google Scholar] [CrossRef] [Scilit] [PubMed]
- Wang, L.; Song, W.; Li, F.; Shuang, S.; Song, S.; Yang, Y.; Huang, Y.; Wang, K. Mitochondria-immobilized fluorescent probes for viscosity and cellular imaging. Spectrochim. Acta A Mol. Biomol. Spectrosc. 2026, 346, 126847. [Google Scholar] [CrossRef] [Scilit] [PubMed]
- Pan, X.; Zhao, Y.; Wang, J.L.; Feng, S.; Yu, X.-Q.; Wu, M.-Y. Mitochondrial membrane potential-independent near-infrared fluorescent probes for viscosity-exclusive imaging. J. Mater. Chem. B 2025, 13, 177–183. [Google Scholar] [CrossRef] [Scilit] [PubMed]
- Klier, P.E.Z.; Martin, J.G.; Miller, E.W. Imaging Reversible Mitochondrial Membrane Potential Dynamics with a Masked Rhodamine Voltage Reporter. J. Am. Chem. Soc. 2021, 143, 4095–4099. [Google Scholar] [CrossRef] [Scilit] [PubMed]
- Shi, Y.; Zou, X.; Wen, S.; Gao, L.; Li, J.; Han, J.; Han, S. An organelle-directed chemical ligation approach enables dual-color detection of mitophagy. Autophagy 2021, 17, 3475–3490. [Google Scholar] [CrossRef] [Scilit] [PubMed]
- Li, Y.; Lei, J.; Qin, X.; Li, G.; Zhou, Q.; Yang, Z. A mitochondria-targeted dual-response sensor for monitoring viscosity and peroxynitrite in living cells with distinct fluorescence signals. Bioorg. Chem. 2023, 138, 106603. [Google Scholar] [CrossRef] [Scilit] [PubMed]
- Li, Y.; Zhou, Z.; Chen, S.; Pang, X.; Wu, C.; Li, H.; Zhang, Y. Mitochondria-targeting fluorescent sensor with high photostability and permeability for visualizing viscosity in mitochondrial malfunction, inflammation, and AD models. Anal. Chim. Acta 2023, 1250, 340967. [Google Scholar] [CrossRef] [Scilit] [PubMed]
- Steinmark, I.E.; James, A.L.; Chung, P.H.; Morton, P.E.; Parsons, M.; Dreiss, C.A.; Lorenz, C.D.; Yahioglu, G.; Suhling, K. Targeted fluorescence lifetime probes reveal responsive organelle viscosity and membrane fluidity. PLoS ONE 2019, 14, e0211165. [Google Scholar] [CrossRef] [Scilit] [PubMed]
- Ding, Y.; Fang, B.; Li, Q.; Zhang, B.; Li, J.; Bai, H.; Voelcker, N.H.; Peng, B.; Yang, X.; Li, L. Single Mitochondrion Morphology-Function Relationship Analysis Using Fluorescent Probes and Artificial Intelligence. Adv. Sci. 2025, 12, e09140. [Google Scholar] [CrossRef] [Scilit] [PubMed]
- Mena, D.; Arusei, R.J.; Rahhali, K.; Di Lisa, F.; Kaludercic, N. Measurement of Mitochondrial ROS Formation. Methods Mol. Biol. 2025, 2878, 99–116. [Google Scholar] [CrossRef] [Scilit] [PubMed]
- Chikte, S.; Panchal, N.; Warnes, G. Use of LysoTracker dyes: A flow cytometric study of autophagy. Cytom. Part A 2014, 85, 169–178. [Google Scholar] [CrossRef] [Scilit] [PubMed]
- Kaizuka, T.; Morishita, H.; Hama, Y.; Tsukamoto, S.; Matsui, T.; Toyota, Y.; Kodama, A.; Ishihara, T.; Mizushima, T.; Mizushima, N. An Autophagic Flux Probe that Releases an Internal Control. Mol. Cell 2016, 64, 835–849. [Google Scholar] [CrossRef] [Scilit]
- Katayama, H.; Hama, H.; Nagasawa, K.; Kurokawa, H.; Sugiyama, M.; Ando, R.; Funata, M.; Yoshida, N.; Homma, M.; Nishimura, T.; et al. Visualizing and Modulating Mitophagy for Therapeutic Studies of Neurodegeneration. Cell 2020, 181, 1176–1187.e16. [Google Scholar] [CrossRef] [Scilit] [PubMed]
- Kirkham, E.; Gardiner, S.; Lloyd-Evans, E.; Best, H.; Waller-Evans, H. Lysosomal pH Measurements via Dual-Imaging Microscopy. Methods Mol. Biol. 2026, 2976, 11–24. [Google Scholar] [CrossRef] [Scilit] [PubMed]
- Xia, M.C.; Cai, L.; Zhang, S.; Zhang, X. A cell-penetrating ratiometric probe for simultaneous measurement of lysosomal and cytosolic pH change. Talanta 2018, 178, 355–361. [Google Scholar] [CrossRef] [Scilit] [PubMed]
- Yang, R.; Gao, Q.; Lu, X.; Wu, Y.; Zhu, C.; Han, Z.; Li, C.; Wei, M. Wash-free and ultra-low concentration monitor lysosomal viscosity in apoptosis with a noteworthy fluorescent probe. Spectrochim. Acta A Mol. Biomol. Spectrosc. 2025, 329, 125481. [Google Scholar] [CrossRef] [Scilit] [PubMed]
- Harlan, F.K.; Lusk, J.S.; Mohr, B.M.; Guzikowski, A.P.; Batchelor, R.H.; Jiang, Y.; Naleway, J.J. Fluorogenic Substrates for Visualizing Acidic Organelle Enzyme Activities. PLoS ONE 2016, 11, e0156312. [Google Scholar] [CrossRef] [Scilit] [PubMed]
- Yitzhak, Y.; Gaikwad, H.; Weiss-Sadan, T.; Merquiol, E.; Turk, B.; Blum, G. Improved Cathepsin Probes for Sensitive Molecular Imaging. Molecules 2022, 27, 842. [Google Scholar] [CrossRef] [Scilit] [PubMed]
- Xu, H.; Xu, L.Z.; Huai, R.P.; Zhang, C.; Suo, S.-N.; Li, Y.-Q.; Peng, Y.; Wang, Y.-W. A lysosome-targetable fluorescent probe for the ratiometric detection of formaldehyde in living cells and in vivo. Org. Biomol. Chem. 2023, 21, 6405–6409. [Google Scholar] [CrossRef] [Scilit] [PubMed]
- Zhang, Y.; Du, Y.; Liao, K.; Peng, T. Modular development of organelle-targeting fluorescent probes for imaging formaldehyde in live cells. Anal. Methods 2024, 16, 3646–3653. [Google Scholar] [CrossRef] [Scilit] [PubMed]
- Jiang, Z.; Dai, X.; Zhou, L.; Yang, Z.; Yu, F.; Kong, X. Development of a polarity-sensitive ratiometric fluorescent probe based on the intramolecular reaction of spiro-oxazolidine and its applications for in situ visualizing the fluctuations of polarity during ER stress. Spectrochim. Acta A Mol. Biomol. Spectrosc. 2024, 316, 124337. [Google Scholar] [CrossRef] [Scilit] [PubMed]
- Fakim, A.; Maatouk, B.I.; Maiti, B.; Dey, A.; Alotaiby, S.H.; Moosa, B.A.; Lin, W.; Khashab, N.M. Flaring Inflammation and ER Stress by an Organelle-Specific Fluorescent Cage. Adv. Healthc. Mater. 2024, 13, e2401117. [Google Scholar] [CrossRef] [Scilit] [PubMed]
- Rojo-Ruiz, J.; Sánchez-Rabadán, C.; Calvo, B.; García-Sancho, J.; Alonso, M.T. Using Fluorescent GAP Indicators to Monitor ER Ca2+. Curr. Protoc. 2024, 4, e1060. [Google Scholar] [CrossRef] [Scilit] [PubMed]
- Xing, Z.; Yan, J.; Miao, Y.; Ruan, Y.; Yao, H.; Zhou, Y.; Tang, Y.; Li, G.; Song, Z.; Peng, Y.; et al. Endoplasmic Reticulum-Targeting Quinazolinone-Based Lipophilic Probe for Specific Photoinduced Ferroptosis and Its Induced Lipid Dynamic Regulation. J. Med. Chem. 2024, 67, 1900–1913. [Google Scholar] [CrossRef] [Scilit] [PubMed]
- Li, Y.; Yang, Z.; Lei, J.; Dai, Q.; Li, G.; Xu, H.; Lu, J.; Yoon, J. Golgi-Targeted Viscosity Fluorescent Probe for Monitoring Acute Lung Injury. Chem. Eur. J. 2025, 31, e02835. [Google Scholar] [CrossRef] [Scilit] [PubMed]
- Danylchuk, D.I.; Jouard, P.H.; Klymchenko, A.S. Targeted Solvatochromic Fluorescent Probes for Imaging Lipid Order in Organelles under Oxidative and Mechanical Stress. J. Am. Chem. Soc. 2021, 143, 912–924. [Google Scholar] [CrossRef] [Scilit] [PubMed]
- Shimolina, L.E.; Gulin, A.A.; Paez-Perez, M.; López-Duarte, I.; Druzhkova, I.N.; Lukina, M.M.; Gubina, M.V.; Brooks, N.J.; Zagaynova, E.V.; Kuimova, M.K.; et al. Mapping cisplatin-induced viscosity alterations in cancer cells using molecular rotor and fluorescence lifetime imaging microscopy. J. Biomed. Opt. 2020, 25, 126004. [Google Scholar] [CrossRef] [Scilit] [PubMed]
- Shimolina, L.; Gulin, A.; Khlynova, A.; Ignatova, N.; Druzhkova, I.; Gubina, M.; Zagaynova, E.; Kuimova, M.K.; Shirmanova, M. Development of resistance to 5-fluorouracil affects membrane viscosity and lipid composition of cancer cells. Methods Appl. Fluoresc. 2022, 10, 044008. [Google Scholar] [CrossRef] [Scilit] [PubMed]
- Shimolina, L.; Gulin, A.; Khlynova, A.; Ignatova, N.; Druzhkova, I.; Gubina, M.; Zagaynova, E.; Kuimova, M.K.; Shirmanova, M. Effects of Paclitaxel on Plasma Membrane Microviscosity and Lipid Composition in Cancer Cells. Int. J. Mol. Sci. 2023, 24, 12186. [Google Scholar] [CrossRef] [Scilit] [PubMed]
- Gu, B.; Zhao, J.; Tang, S.; Li, H.; Long, R.; Wang, L.; Liao, Y.; Li, Y.; Chen, W.; Zhang, Y. Membrane-Targetable Dual-Responsive Fluorescent Probe for Simultaneous Detection of Polarity and Hypochlorite and Its Application in Apoptosis and Cancer Models. Anal. Chem. 2026, 98, 6021–6033. [Google Scholar] [CrossRef] [Scilit] [PubMed]
- Wu, S.; Yan, Y.; Hou, H.; Huang, Z.; Li, D.; Zhang, X.; Xiao, Y. Polarity-Sensitive and Membrane-Specific Probe Quantitatively Monitoring Ferroptosis through Fluorescence Lifetime Imaging. Anal. Chem. 2022, 94, 11238–11247. [Google Scholar] [CrossRef] [Scilit] [PubMed]
- Iwashita, H.; Tokunaga, R.; Shioji, K. Visualization of Ferroptosis-Induced Lipid Peroxidation Using Plasma Membrane-Specific Fluorescent Probe LipoxPM. Chem. Eur. J. 2025, 31, e202404323. [Google Scholar] [CrossRef] [Scilit] [PubMed]
- Zhu, L.; Huang, L.; Su, W.; Liang, X.; Lin, W. A Fluorescent Probe Targeting Mitochondria and Lipid Droplets for Visualization of Cell Death. Chem. Asian J. 2022, 17, e202101304. [Google Scholar] [CrossRef] [Scilit] [PubMed]
- Wei, D.; Dai, Y.; Cao, J.; Fu, N. A novel fluorescent probe for visualizing viscosity changes in lipid droplets during chemotherapy-induced ferroptosis. Anal. Chim. Acta 2024, 1299, 342422. [Google Scholar] [CrossRef] [Scilit] [PubMed]
- Drummen, G.P.; van Liebergen, L.C.; Op den Kamp, J.A.; Post, J.A. C11-BODIPY(581/591), an oxidation-sensitive fluorescent lipid peroxidation probe: (micro)spectroscopic characterization and validation of methodology. Free Radic. Biol. Med. 2002, 33, 473–490. [Google Scholar] [CrossRef] [Scilit] [PubMed]
- Dai, Z.; Zhang, W.; Zhou, L.; Huang, J. Probing Lipid Peroxidation in Ferroptosis: Emphasizing the Utilization of C11-BODIPY-Based Protocols. Methods Mol. Biol. 2023, 2712, 61–72. [Google Scholar] [CrossRef] [Scilit] [PubMed]
- Dixon, S.J.; Lemberg, K.M.; Lamprecht, M.R.; Skouta, R.; Zaitsev, E.M.; Gleason, C.E.; Patel, D.N.; Bauer, A.J.; Cantley, A.M.; Yang, W.S.; et al. Ferroptosis: An iron-dependent form of nonapoptotic cell death. Cell 2012, 149, 1060–1072. [Google Scholar] [CrossRef] [Scilit] [PubMed]
- Chen, D.; Eyupoglu, I.Y.; Savaskan, N. Ferroptosis and Cell Death Analysis by Flow Cytometry. Methods Mol. Biol. 2017, 1601, 71–77. [Google Scholar] [CrossRef] [Scilit] [PubMed]
- Zhou, Q.; Meng, Y.; Li, D.; Yao, L.; Le, J.; Liu, Y.; Sun, Y.; Zeng, F.; Chen, X.; Deng, G. Ferroptosis in cancer: From molecular mechanisms to therapeutic strategies. Signal Transduct. Target. Ther. 2024, 9, 55. [Google Scholar] [CrossRef] [Scilit] [PubMed]
- Icha, J.; Weber, M.; Waters, J.C.; Norden, C. Phototoxicity in live fluorescence microscopy, and how to avoid it. BioEssays 2017, 39, 1700003. [Google Scholar] [CrossRef] [Scilit] [PubMed]
- Kiepas, A.; Voorand, E.; Mubaid, F.; Siegel, P.M.; Brown, C.M. Optimizing live-cell fluorescence imaging conditions to minimize phototoxicity. J. Cell Sci. 2020, 133, jcs242834. [Google Scholar] [CrossRef] [Scilit] [PubMed]
- Beghetto, C.; Renken, C.; Eriksson, O.; Jori, G.; Bernardi, P.; Ricchelli, F. Implications of the generation of reactive oxygen species by photoactivated calcein for mitochondrial studies. Eur. J. Biochem. 2000, 267, 5585–5592. [Google Scholar] [CrossRef] [Scilit] [PubMed]
- Lee, C.H.; Wallace, D.C.; Burke, P.J. Photobleaching and phototoxicity of mitochondria in live cell fluorescent super-resolution microscopy. Mitochondrial Commun. 2024, 2, 38–47. [Google Scholar] [CrossRef] [Scilit] [PubMed]
- Liu, T.; Stephan, T.; Chen, P.; Keller-Findeisen, J.; Chen, J.; Riedel, D.; Yang, Z.; Jakobs, S.; Chen, Z. Multi-color live-cell STED nanoscopy of mitochondria with a gentle inner membrane stain. Proc. Natl. Acad. Sci. USA 2022, 119, e2215799119. [Google Scholar] [CrossRef] [Scilit] [PubMed]
- Waters, J.C. Live-cell fluorescence imaging. Methods Cell Biol. 2013, 114, 125–150. [Google Scholar] [CrossRef] [Scilit] [PubMed]
- Zhao, X.; Jiang, S.; Yan, J.; Bu, L.; Li, G.; Huang, J. Photocaged fluorescent probes for spatiotemporally monitoring G-Quadruplex DNA in live cells. Bioorg. Chem. 2025, 160, 108446. [Google Scholar] [CrossRef] [Scilit] [PubMed]
- Pak, V.V.; Ezeriņa, D.; Lyublinskaya, O.G.; Pedre, B.; Tyurin-Kuzmin, P.A.; Mishina, N.M.; Thauvin, M.; Young, D.; Wahni, K.; Gache, S.A.M.; et al. Ultrasensitive Genetically Encoded Indicator for Hydrogen Peroxide Identifies Roles for the Oxidant in Cell Migration and Mitochondrial Function. Cell Metab. 2020, 31, 642–653.e6. [Google Scholar] [CrossRef] [Scilit] [PubMed]
- Gutscher, M.; Pauleau, A.L.; Marty, L.; Brach, T.; Wabnitz, G.H.; Samstag, Y.; Meyer, A.J.; Dick, T.P. Real-time imaging of the intracellular glutathione redox potential. Nat. Methods 2008, 5, 553–559. [Google Scholar] [CrossRef] [Scilit] [PubMed]
- Calabrese, G.; Jacobs, L.J.H.C.; Riemer, J. Real-Time Monitoring of Hydrogen Peroxide Levels in Yeast and Mammalian Cells. Methods Mol. Biol. 2023, 2675, 149–165. [Google Scholar] [CrossRef] [Scilit] [PubMed]
- Radzinski, M.; Fassler, R.; Yogev, O.; Breuer, W.; Shai, N.; Gutin, J.; Ilyas, S.; Geffen, Y.; Tsytkin-Kirschenzweig, S.; Nahmias, Y.; et al. Temporal profiling of redox-dependent heterogeneity in single cells. eLife 2018, 7, e37623. [Google Scholar] [CrossRef] [Scilit] [PubMed]
- Barakat, S.; Çimen, Ş.; Miri, S.M.; Vatandaşlar, E.; Yelkenci, H.E.; Martín, A.S.; Beker, M.Ç.; Kök, K.; Öztürk, G.; Eroglu, E. Bioenergetic shift and proteomic signature induced by lentiviral-transduction of GFP-based biosensors. Redox Biol. 2024, 78, 103416. [Google Scholar] [CrossRef] [Scilit] [PubMed]
- Koren, S.A.; Ahmed Selim, N.; De la Rosa, L.; Horn, J.; Farooqi, M.A.; Wei, A.Y.; Müller-Eigner, A.; Emerson, J.; Johnson, G.V.W.; Wojtovich, A.P. All-optical spatiotemporal mapping of ROS dynamics across mitochondrial microdomains in situ. Nat. Commun. 2023, 14, 6036, Correction in Nat. Commun. 2023, 14, 8230. https://doi.org/10.1038/s41467-023-44146-6. [Google Scholar] [CrossRef] [Scilit] [PubMed]
- Haslum, J.F.; Lardeau, C.H.; Karlsson, J.; Turkki, R.; Leuchowius, K.-J.; Smith, K.; Müllers, E. Cell Painting-based bioactivity prediction boosts high-throughput screening hit-rates and compound diversity. Nat. Commun. 2024, 15, 3470. [Google Scholar] [CrossRef] [Scilit] [PubMed]
- Seal, S.; Dee, W.; Shah, A.; Cerisier, N.; Zhang, A.; Miglietta, E.; Titterton, K.; Cabrera, Á.A.; Boiko, D.; Beatson, A.; et al. Counting cells can accurately predict small-molecule bioactivity benchmarks. Nat. Commun. 2026, 17, 2436. [Google Scholar] [CrossRef] [Scilit] [PubMed]
- Martinez Molina, D.; Jafari, R.; Ignatushchenko, M.; Seki, T.; Larsson, E.A.; Dan, C.; Sreekumar, L.; Cao, Y.; Nordlund, P. Monitoring drug target engagement in cells and tissues using the cellular thermal shift assay. Science 2013, 341, 84–87. [Google Scholar] [CrossRef] [Scilit] [PubMed]
- Jafari, R.; Almqvist, H.; Axelsson, H.; Ignatushchenko, M.; Lundbäck, T.; Nordlund, P.; Molina, D.M. The cellular thermal shift assay for evaluating drug target interactions in cells. Nat. Protoc. 2014, 9, 2100–2122. [Google Scholar] [CrossRef] [Scilit] [PubMed]
- Hashimoto, M.; Girardi, E.; Eichner, R.; Superti-Furga, G. Detection of Chemical Engagement of Solute Carrier Proteins by a Cellular Thermal Shift Assay. ACS Chem. Biol. 2018, 13, 1480–1486. [Google Scholar] [CrossRef] [Scilit] [PubMed]
- Chen, Z.; Li, G.; Zhang, J.; Xu, X.; Yan, Q.; Wang, Q.; Zhang, Q.; Huang, J. Activity-Based Ubiquitin Probes Capture the Sulfenylated State of Deubiquitinases. Angew. Chem. Int. Ed. 2025, 64, e202512311. [Google Scholar] [CrossRef] [Scilit] [PubMed]
- Li, L.; Si, Y.; He, B.; Li, J. Au-Ag alloy/porous-SiO2 core/shell nanoparticle-based surface-enhanced Raman scattering nanoprobe for ratiometric imaging analysis of nitric oxide in living cells. Talanta 2019, 205, 120116. [Google Scholar] [CrossRef] [Scilit] [PubMed]
- Becker, L.; Fischer, F.; Fleck, J.L.; Harland, N.; Herkommer, A.; Stenzl, A.; Aicher, W.K.; Schenke-Layland, K.; Marzi, J. Data-Driven Identification of Biomarkers for In Situ Monitoring of Drug Treatment in Bladder Cancer Organoids. Int. J. Mol. Sci. 2022, 23, 6956. [Google Scholar] [CrossRef] [Scilit] [PubMed]
- Hall, M.D.; Yasgar, A.; Peryea, T.; Braisted, J.C.; Jadhav, A.; Simeonov, A.; Coussens, N.P. Fluorescence polarization assays in high-throughput screening and drug discovery: A review. Methods Appl. Fluoresc. 2016, 4, 022001. [Google Scholar] [CrossRef] [Scilit] [PubMed]
- Yang, Z.Y.; Dong, J.; Yang, Z.J.; Yin, M.; Jiang, H.-L.; Lu, A.-P.; Chen, X.; Hou, T.-J.; Cao, D.-S. ChemFLuo: A web-server for structure analysis and identification of fluorescent compounds. Brief. Bioinform. 2021, 22, bbaa282. [Google Scholar] [CrossRef] [Scilit] [PubMed]
- Bray, M.A.; Singh, S.; Han, H.; Davis, C.T.; Borgeson, B.; Hartland, C.; Kost-Alimova, M.; Gustafsdottir, S.M.; Gibson, C.C.; Carpenter, A.E. Cell Painting, a high-content image-based assay for morphological profiling using multiplexed fluorescent dyes. Nat. Protoc. 2016, 11, 1757–1774. [Google Scholar] [CrossRef] [Scilit]
- Laraia, L.; Garivet, G.; Foley, D.J.; Kaiser, N.; Müller, S.; Zinken, S.; Pinkert, T.; Wilke, J.; Corkery, D.; Pahl, A.; et al. Image-Based Morphological Profiling Identifies a Lysosomotropic, Iron-Sequestering Autophagy Inhibitor. Angew. Chem. Int. Ed. 2020, 59, 5721–5729. [Google Scholar] [CrossRef] [Scilit] [PubMed]
- Rezaei Adariani, S.; Agne, D.; Koska, S.; Burhop, A.; Seitz, C.; Warmers, J.; Janning, P.; Metz, M.; Pahl, A.; Sievers, S.; et al. Detection of a Mitochondrial Fragmentation and Integrated Stress Response Using the Cell Painting Assay. J. Med. Chem. 2024, 67, 13252–13270. [Google Scholar] [CrossRef] [Scilit] [PubMed]
- Pahl, A.; Liu, J.; Patil, S.; Adariani, S.R.; Schölermann, B.; Warmers, J.; Bonowski, J.; Koska, S.; Akbulut, Y.; Seitz, C.; et al. Illuminating Dark Chemical Matter Using the Cell Painting Assay. J. Med. Chem. 2024, 67, 8862–8876. [Google Scholar] [CrossRef] [Scilit] [PubMed]
- Pahl, A.; Schölermann, B.; Lampe, P.; Rusch, M.; Dow, M.; Hedberg, C.; Nelson, A.; Sievers, S.; Waldmann, H.; Ziegler, S. Morphological subprofile analysis for bioactivity annotation of small molecules. Cell Chem. Biol. 2023, 30, 839–853.e7. [Google Scholar] [CrossRef] [Scilit] [PubMed]
- Cerisier, N.; Dafniet, B.; Badel, A.; Taboureau, O. Linking chemicals, genes and morphological perturbations to diseases. Toxicol. Appl. Pharmacol. 2023, 461, 116407. [Google Scholar] [CrossRef] [Scilit] [PubMed]
- Chandrasekaran, S.N.; Cimini, B.A.; Goodale, A.; Miller, L.; Kost-Alimova, M.; Jamali, N.; Doench, J.G.; Fritchman, B.; Skepner, A.; Melanson, M.; et al. Three million images and morphological profiles of cells treated with matched chemical and genetic perturbations. Nat. Methods 2024, 21, 1114–1121. [Google Scholar] [CrossRef] [Scilit] [PubMed]
- Ewald, J.D.; Titterton, K.L.; Bäuerle, A.; Beatson, A.; Boiko, D.A.; Cabrera, Á.A.; Cheah, J.; Cimini, B.A.; Gorissen, B.L.; Harrill, J.; et al. Cell Painting for cytotoxicity and mode-of-action analysis in primary human hepatocytes. Cell Syst. 2026, 17, 101566. [Google Scholar] [CrossRef] [Scilit] [PubMed]
- Cross-Zamirski, J.O.; Mouchet, E.; Williams, G.; Schönlieb, C.-B.; Turkki, R.; Wang, Y. Label-free prediction of cell painting from brightfield images. Sci. Rep. 2022, 12, 10001. [Google Scholar] [CrossRef] [Scilit] [PubMed]
- Shirmanova, M.V.; Shimolina, L.E.; Lukina, M.M.; Zagaynova, E.V.; Kuimova, M.K. Live Cell Imaging of Viscosity in 3D Tumour Cell Models. Adv. Exp. Med. Biol. 2017, 1035, 143–153. [Google Scholar] [CrossRef] [Scilit]
- Bergmann, S.; Lawler, S.E.; Qu, Y.; Fadzen, C.M.; Wolfe, J.M.; Regan, M.S.; Pentelute, B.L.; Agar, N.Y.R.; Cho, C.-F. Blood-brain-barrier organoids for investigating the permeability of CNS therapeutics. Nat. Protoc. 2018, 13, 2827–2843. [Google Scholar] [CrossRef] [Scilit] [PubMed]
- Close, D.A.; Johnston, P.A. Miniaturization and characterization of patient derived hepatocellular carcinoma tumor organoid cultures for cancer drug discovery applications. SLAS Discov. 2025, 30, 100201. [Google Scholar] [CrossRef] [Scilit] [PubMed]
- Walsh, A.J.; Cook, R.S.; Skala, M.C. Functional Optical Imaging of Primary Human Tumor Organoids: Development of a Personalized Drug Screen. J. Nucl. Med. 2017, 58, 1367–1372. [Google Scholar] [CrossRef] [Scilit] [PubMed]
- Fang, C.; Deng, Q.; Zhao, K.; Zhou, Z.; Zhu, X.; Liu, F.; Yin, P.; Liu, M.; Li, H.; Zhang, Y.; et al. Fluorescent Probe for Investigating the Mitochondrial Viscosity and Hydrogen Peroxide Changes in Cerebral Ischemia/Reperfusion Injury. Anal. Chem. 2024, 96, 3436–3444. [Google Scholar] [CrossRef] [Scilit] [PubMed]
- Berker, Y.; ElHarouni, D.; Peterziel, H.; Fiesel, P.; Witt, O.; Oehme, I.; Schlesner, M.; Oppermann, S. Patient-by-patient deep transfer learning for drug-response profiling using confocal fluorescence microscopy of pediatric patient-derived tumor-cell spheroids. IEEE Trans. Med. Imaging 2022, 41, 3981–3999. [Google Scholar] [CrossRef] [Scilit] [PubMed]
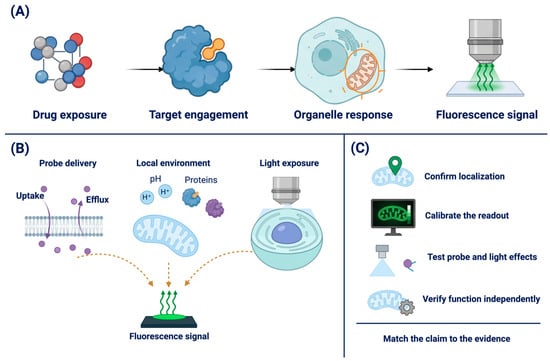
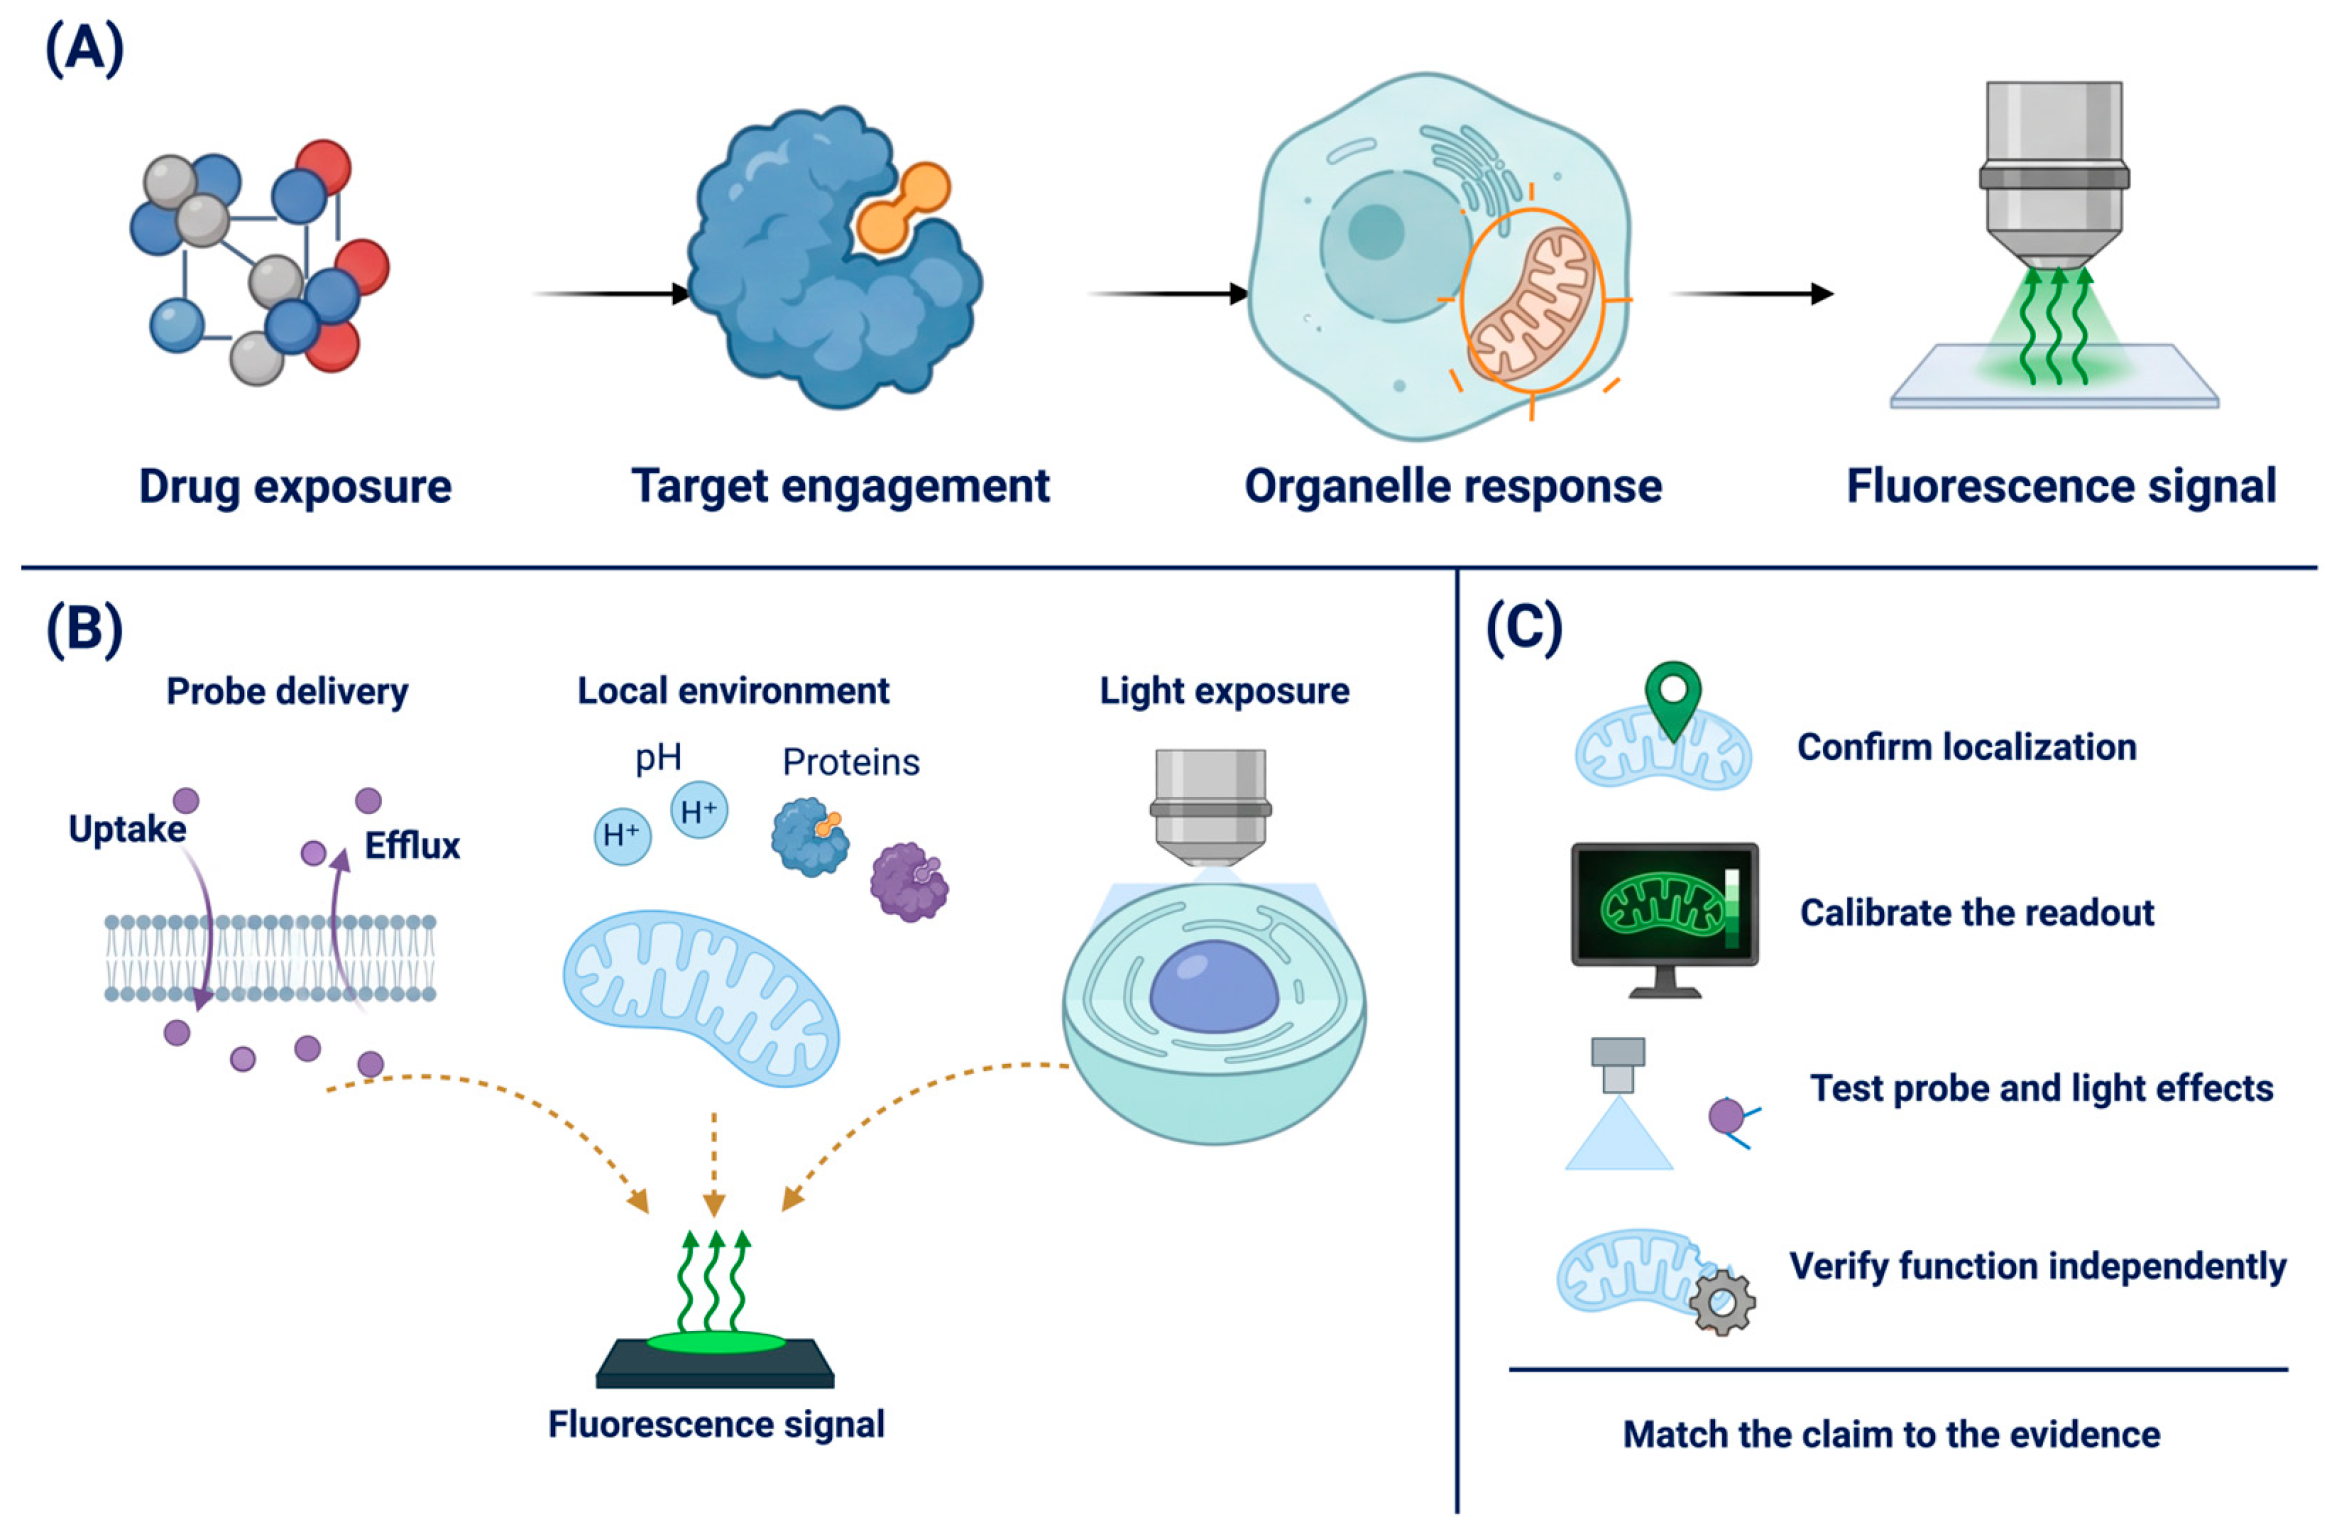
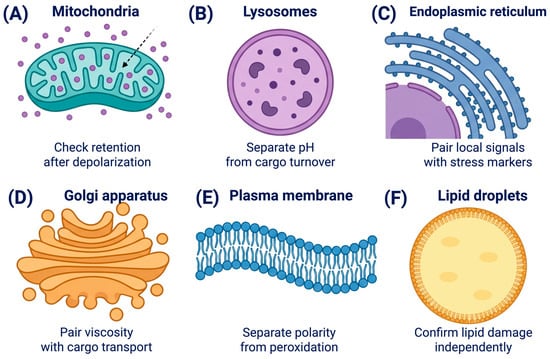
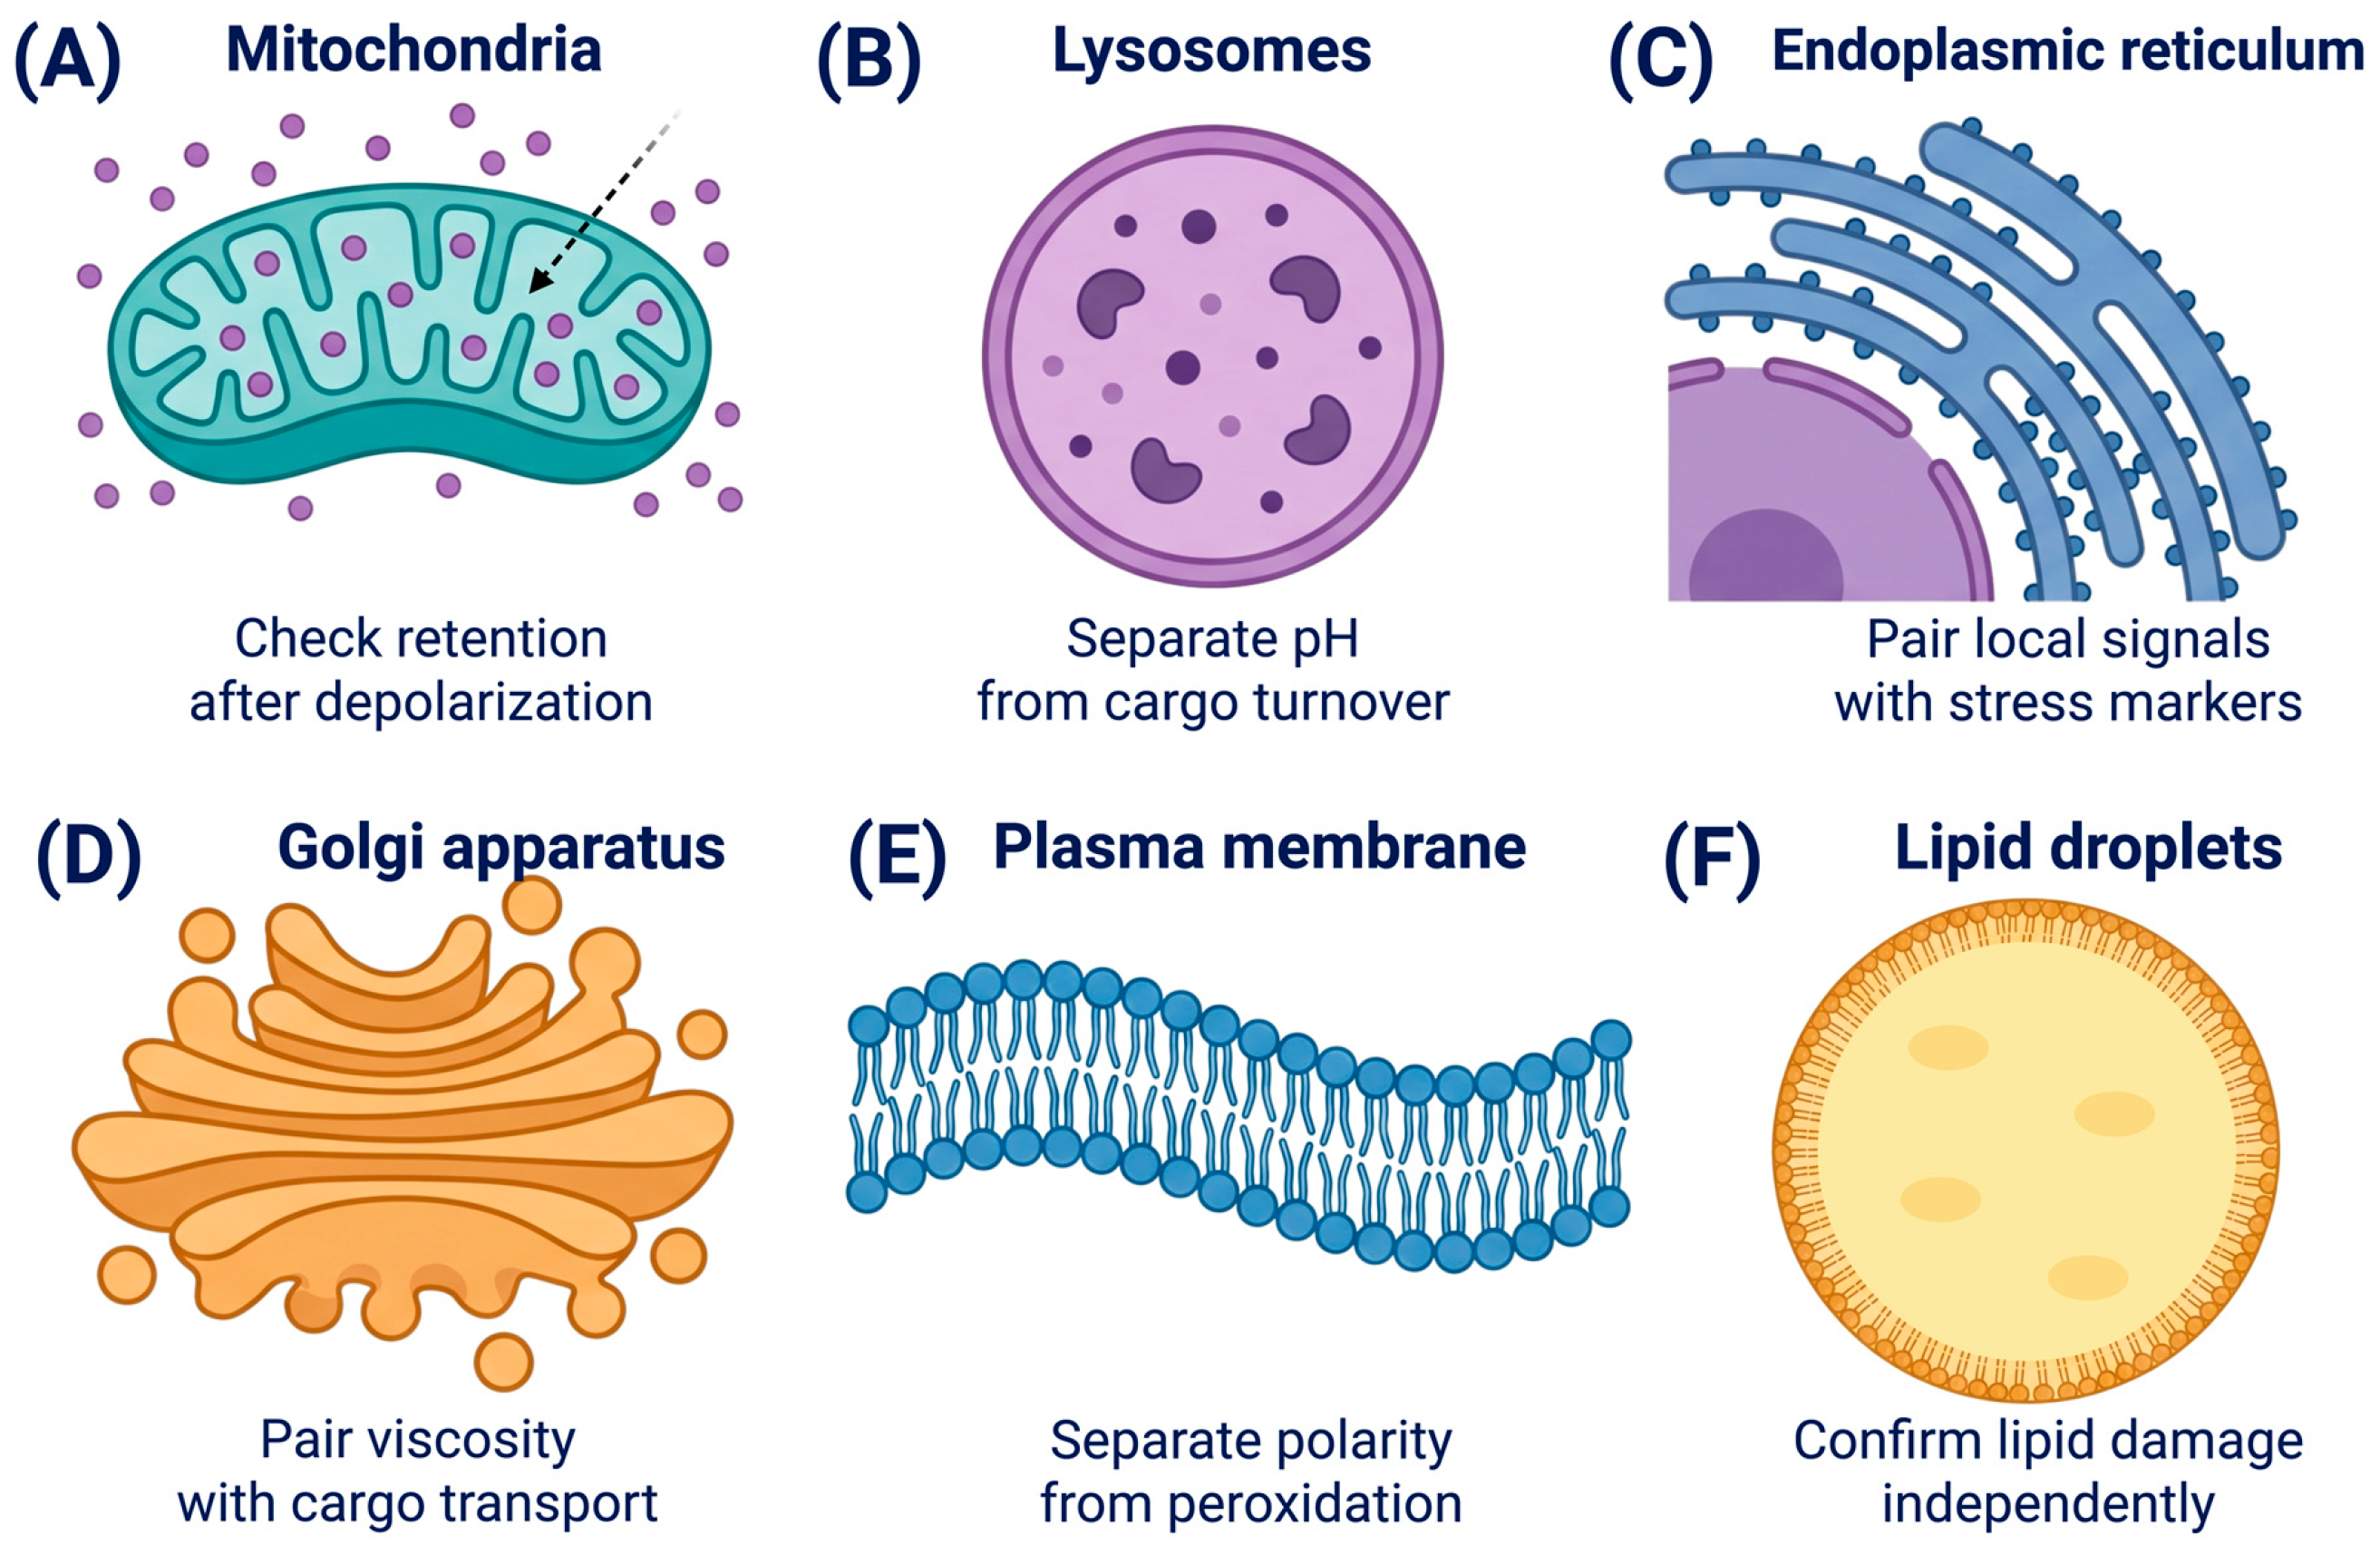
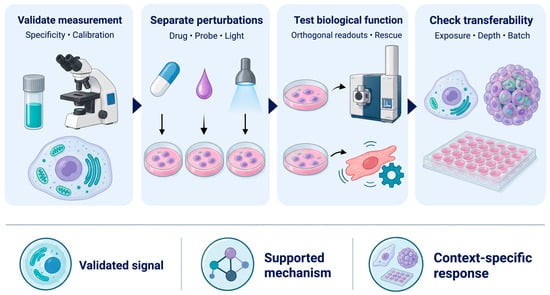
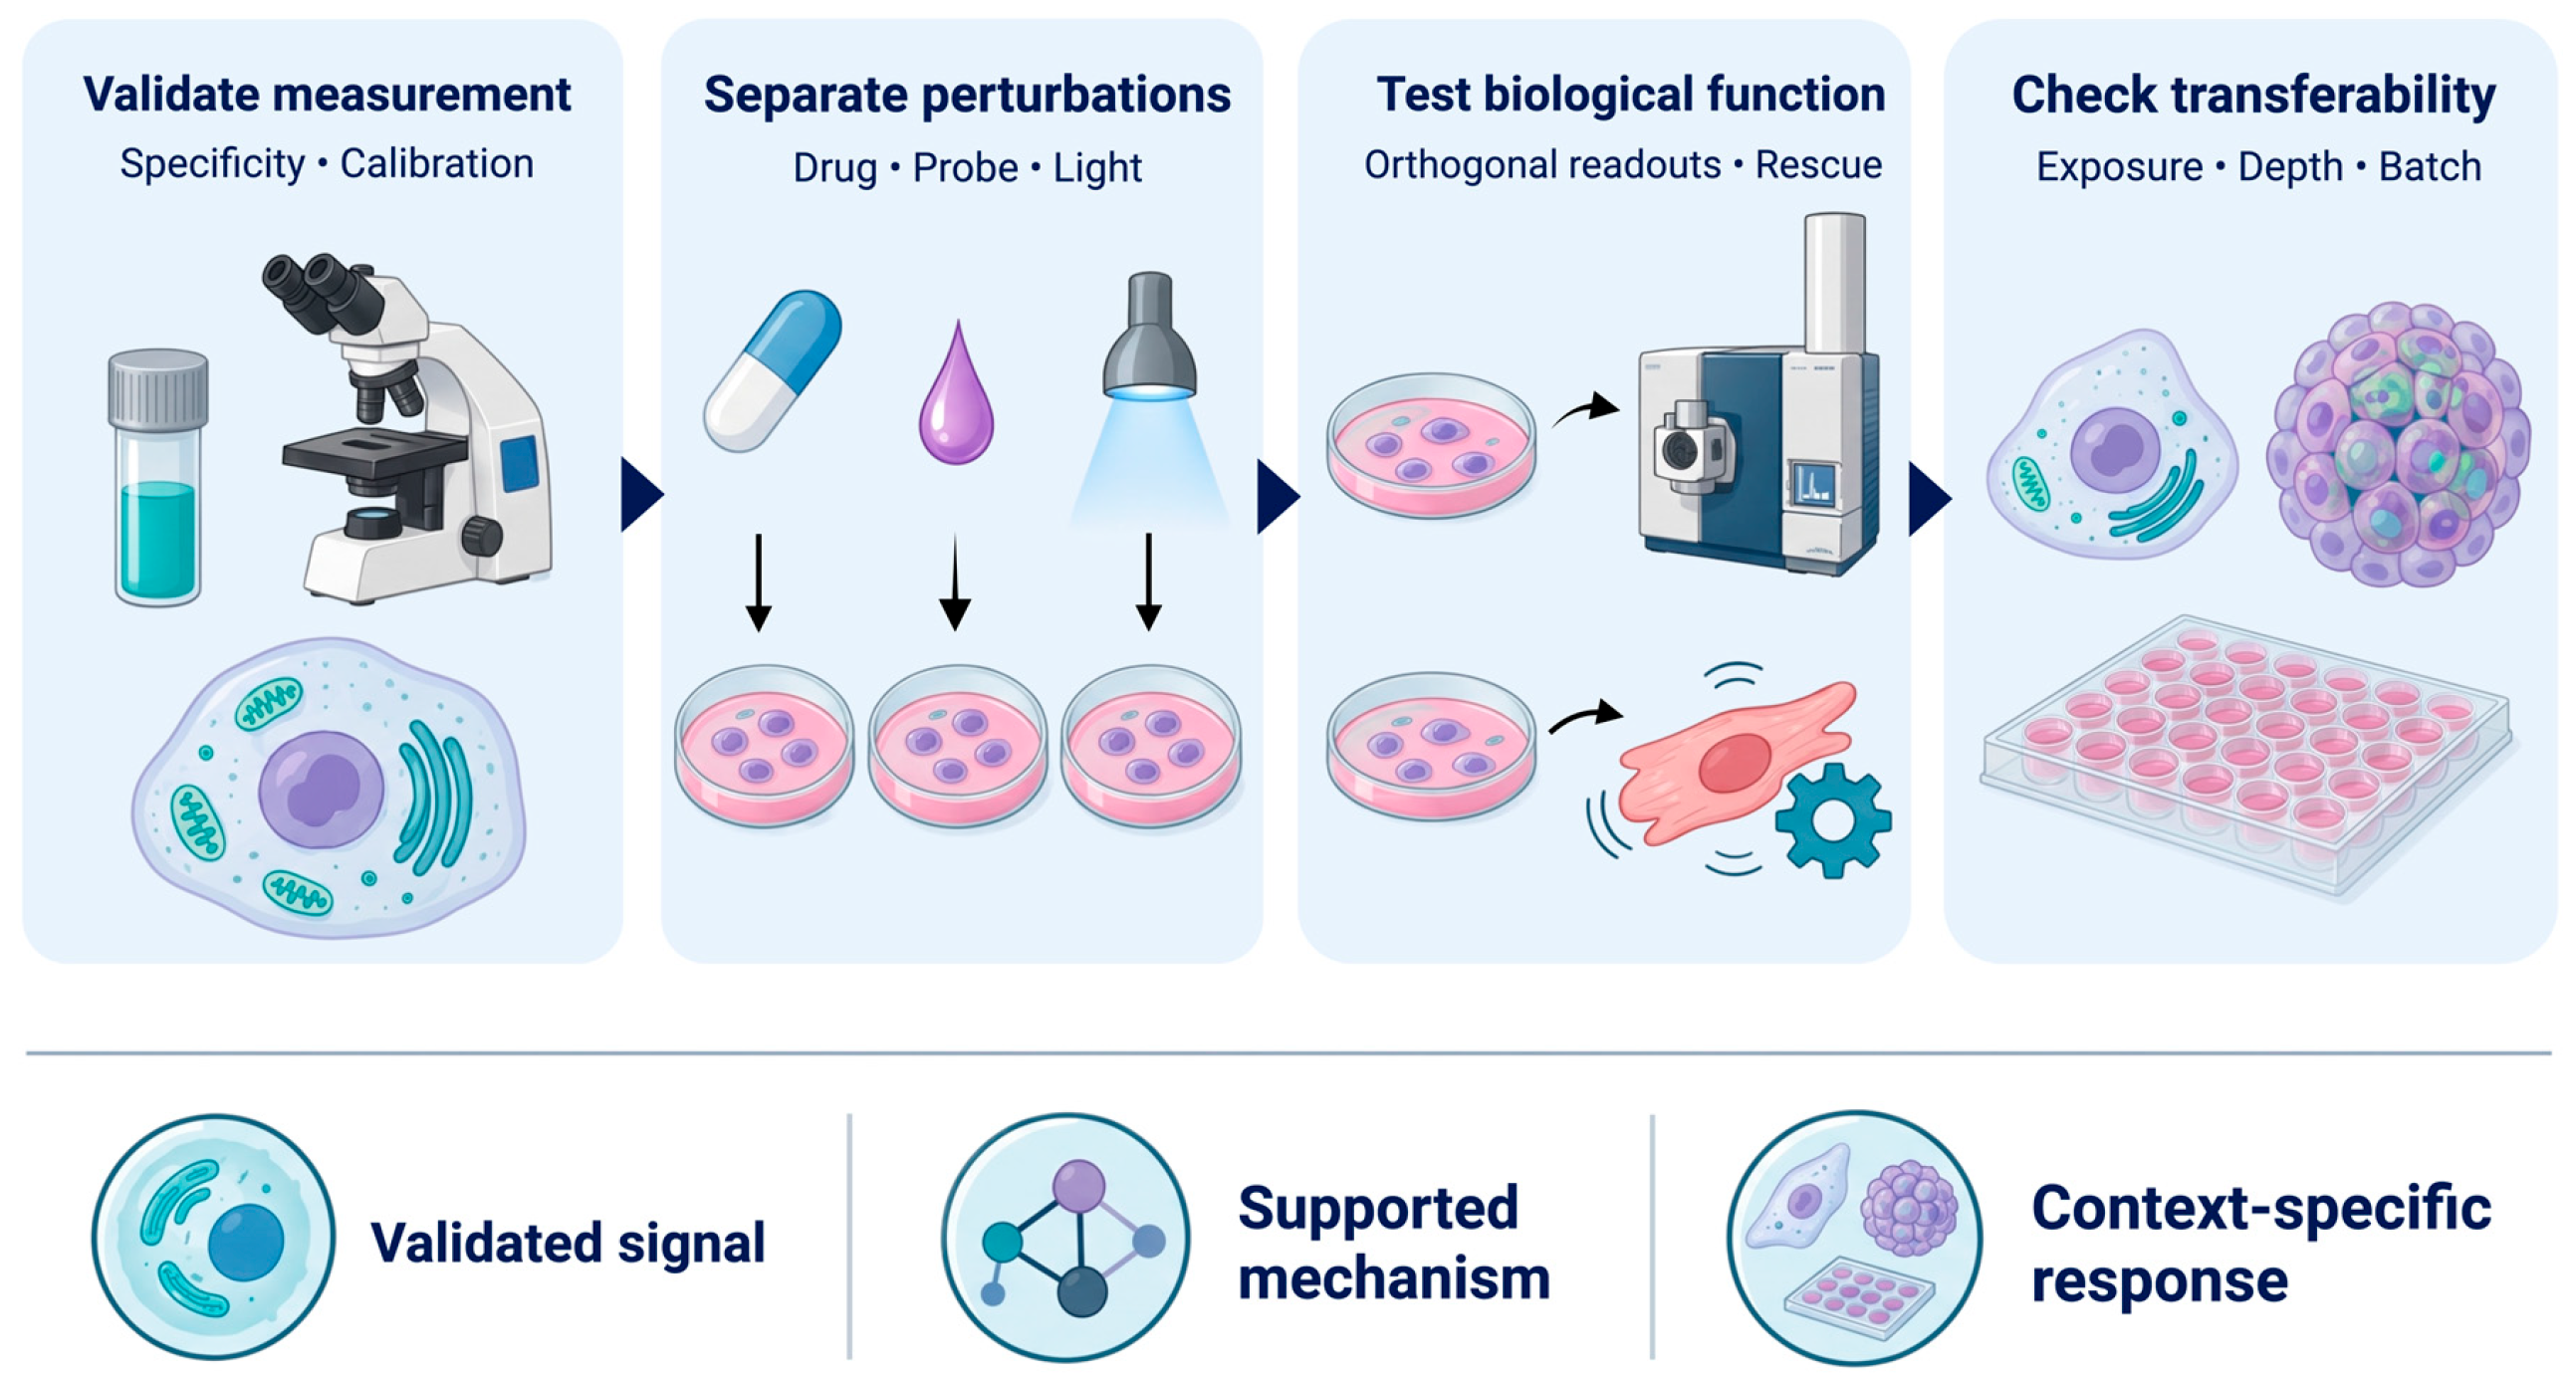
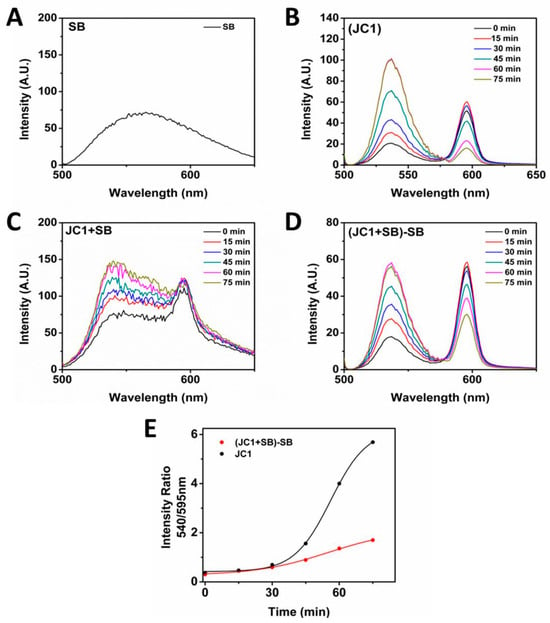
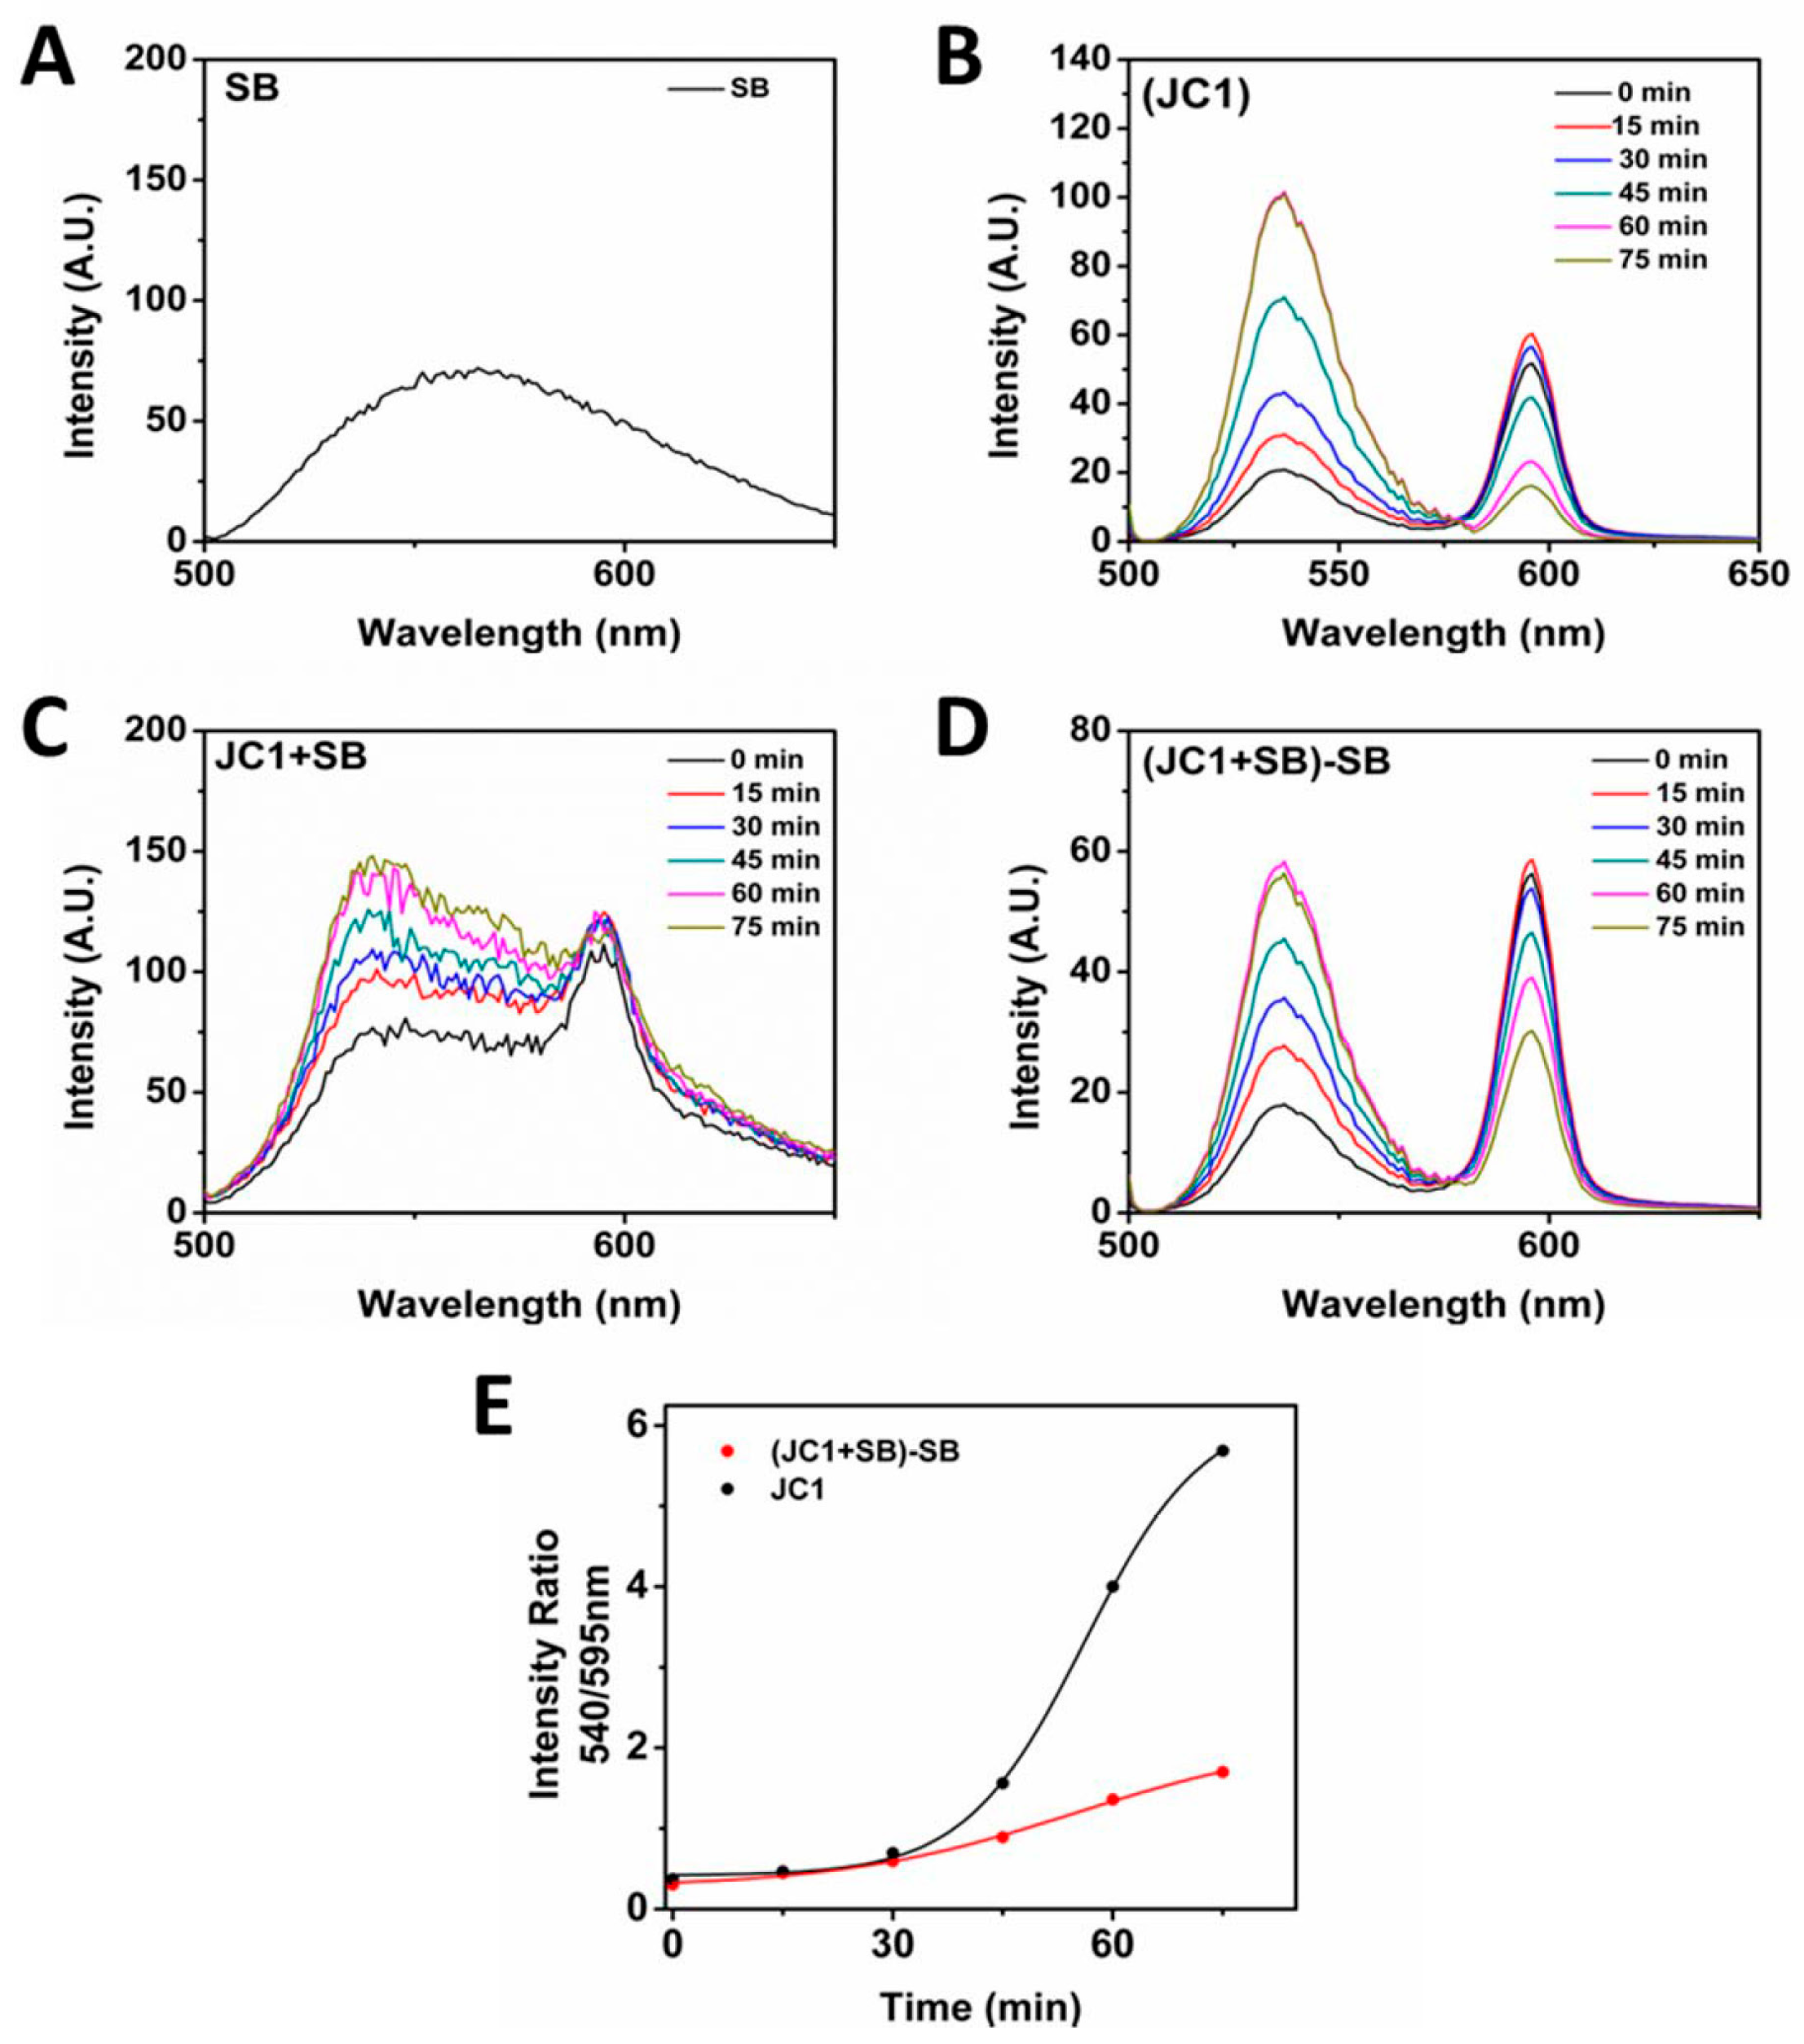

Disclaimer/Publisher’s Note: The statements, opinions and data contained in all publications are solely those of the individual author(s) and contributor(s) and not of MDPI and/or the editor(s). MDPI and/or the editor(s) disclaim responsibility for any injury to people or property resulting from any ideas, methods, instructions or products referred to in the content. |
© 2026 by the authors. Licensee MDPI, Basel, Switzerland. This article is an open access article distributed under the terms and conditions of the Creative Commons Attribution (CC BY) license.