


Abstract
Background/Objectives: Reproducing enamel optical behavior requires appropriate refractive and translucency characteristics. This in vitro study compared the effective group refractive index (RI) and visible translucency of five resin composites with human enamel and assessed whether the two optical properties corresponded. Methods: Sixty 1 mm specimens were evaluated across six groups (n = 10 each): Filtek Easy Match, Tetric EvoCeram, Estelite Sigma Quick, Charisma Diamond ONE, Harmonize, and human enamel. Effective group RI was measured at 1310 nm using optical coherence tomography. CIELAB coordinates were recorded over white and black backgrounds, and CIEDE2000 (TP00) and CIELAB (TPaβ) translucency parameters were calculated. Heteroscedasticity-robust models with Holm-adjusted composite-versus-enamel contrasts were used. Results: Enamel had a mean RI of 1.628 and TP00 of 15.76. All composites had lower RI values than enamel (adjusted p < 0.001). TP00 did not differ significantly from enamel for Filtek Easy Match, Tetric EvoCeram, or Charisma Diamond ONE, whereas Estelite Sigma Quick and Harmonize had lower TP00 values (adjusted p = 0.012 and 0.018). RI was not independently associated with TP00 after adjustment for material (p = 0.352). Conclusions: None of the composites reproduced enamel RI, while visible translucency was material-dependent and was not explained by effective group RI alone.
1. Introduction
Successful anterior restorations must reproduce not only the selected shade but also the natural interaction of light with tooth structure. Optical integration determines whether a restoration blends with the adjacent tissues or remains visually detectable under different backgrounds and lighting conditions [1]. Enamel translucency permits light interaction with the underlying dentin, contributing to the depth, brightness, and vitality of the natural tooth appearance [2,3]. Reproducing these enamel-like optical characteristics is therefore essential for contemporary esthetic composites to provide a natural and clinically acceptable result [1,4].
Manufacturers have developed several strategies to improve the optical integration of esthetic composites with adjacent enamel. Simplified shade-family and single-shade systems are designed to enhance color adjustment [5,6], enamel-shade nanohybrids are formulated to reproduce enamel translucency [7,8], and bleach and opaque shades provide the higher value or masking required for light or discolored substrates [9,10]. Supra-nano spherical fillers and other refined filler structures are also used to control light scattering and promote a smoother visual transition between the restoration and surrounding enamel [5,6,11].
These manufacturer-driven optical strategies are largely determined by the composition and structural characteristics of each resin composite. The organic resin matrix, inorganic fillers, silane coupling agent, photoinitiators, pigments, and opacifiers collectively influence light transmission, scattering, and absorption [11,12]. Resin matrix chemistry affects the refractive index before and after polymerization and therefore influences optical transmission through the cured material [13,14]. Filler composition, particle size, shape, distribution, and volume fraction influence the number and nature of resin–filler interfaces at which light is scattered [11,15,16]. Specimen thickness and light measurement conditions also affect translucency [16,17], while surface roughness and finishing may modify reflected and transmitted light [18]. Pigments and opacifiers provide shade and masking but may also increase absorption or scattering [9,10].
Refractive index (RI) governs light propagation through resin composites; mismatch between the polymerized resin matrix and fillers increases interfacial refraction and scattering, whereas closer matching promotes light transmission [19,20,21,22,23]. The CIEDE2000 translucency parameter (TP00) and RI therefore characterize distinct but formulation-dependent aspects of optical behavior, supporting their complementary assessment rather than treating them as interchangeable. Visible translucency can be quantified spectrophotometrically from the color difference of specimens measured against white and black backgrounds, whereas optical coherence tomography (OCT) provides a nondestructive estimate of wavelength-dependent effective group RI from optical path length and independently measured physical thickness [24,25]. These methods characterize complementary optical responses in different spectral regions.
Existing evidence has addressed visible translucency in contemporary resin composites [5,6,7,8,9,10], resin–filler refractive-index matching [19,20,21,22,23], and OCT-based optical characterization of selected composites and enamel [24,25], largely as separate areas of investigation. However, the extent to which contemporary esthetic composite formulations simultaneously reproduce the effective group refractive index and visible translucency of natural enamel remains insufficiently understood, particularly when both properties are evaluated in the same specimens against a directly measured human enamel reference.
Accordingly, this study aimed to compare OCT-derived effective group RI and TP00 in five contemporary esthetic composite categories and natural human enamel under standardized thickness and testing conditions. It also aimed to quantify each composite’s absolute RI and TP00 deviation from the enamel reference and to examine whether specimen-level variation in effective group RI corresponded to variation in visible translucency after accounting for material type. The null hypotheses were that: (1) effective group RI would not differ between each composite category and enamel; (2) TP00 would not differ between each composite category and enamel; and (3) specimen-level effective group RI would not be associated with TP00 after adjustment for material group.
2. Materials and Methods
2.1. Study Design and Materials
This in vitro comparative study included five esthetic resin composites and natural human enamel (n = 10 independent specimens per group; total N = 60). The tested materials were Filtek Easy Match–Bright (FEM; Solventum, St. Paul, MN, USA), Charisma Diamond ONE (CDO; Kulzer GmbH, Hanau, Germany), Tetric EvoCeram–Bleach L (TEC; Ivoclar, Schaan, Liechtenstein), Estelite Sigma Quick–WE (ESQ; Tokuyama Dental Corporation, Tokyo, Japan), and Harmonize–B1E Enamel (HAR; Kerr Dental, Brea, CA, USA). Natural human enamel (EN) served as the biological optical reference. The individual specimen was the experimental unit, and each specimen underwent both OCT-derived effective group RI and translucency measurements. Effective group RI and TP00 were co-primary outcomes; TPaβ was a secondary outcome. Enamel-referenced absolute deviation and the material-adjusted association between RI and TP00 were exploratory outcomes. Material composition and characteristics are summarized in Table 1.
Table 1.
Composition and material characteristics of the tested resin composites.
2.2. Sample Size Determination
The protocol included 10 independent specimens per group (six groups; total N = 60). Because specimen-level refractive-index variance was unavailable for the exact selected material categories, the design was evaluated using a sensitivity analysis in G*Power (version 3.1.9.7; Heinrich Heine University Düsseldorf, Düsseldorf, Germany). For a fixed-effects omnibus one-way analysis of variance with six groups, α = 0.05, and 80% power, the planned sample provided sensitivity to detect an overall standardized effect of Cohen f = 0.49. The same specimen underwent both refractive-index and translucency measurements, providing paired specimen-level outcomes. This classical ANOVA sensitivity calculation was used only for design planning and was not intended to represent the operating characteristics of the final HC3-robust models or multiplicity-adjusted contrasts.
2.3. Composite Specimen Preparation
Ten disc-shaped specimens (10.0 mm diameter × 1.0 mm thickness) were prepared from each composite using a stainless-steel mold placed between polyester strips and optically flat glass plates. Each material was inserted in one increment, slightly overfilled, compressed, and light-cured with a VALO Cordless LED curing light (Ultradent Products Inc., South Jordan, UT, USA) in standard mode for 20 s per surface at a standardized distance of 1 mm. The light guide was centered and perpendicular to the specimen, and curing-light output was checked periodically using a calibrated MARC Resin Calibrator (BlueLight Analytics Inc., Halifax, NS, Canada) to verify consistent performance during specimen fabrication.
Both surfaces were wet-ground in an automated grinder–polisher using Federation of European Producers of Abrasives (FEPA) P600, P1200, P2400, and P4000 silicon-carbide papers under continuous water cooling. The specimens were rotated 90° between abrasive grades, with a standardized speed of 300 rpm, load of 10 N, and grinding time of 15 s per surface for each grade. No polishing paste, sealant, glaze, or acid treatment was applied, because finishing and polishing procedures can alter the optical parameters of resin composites [18].
After finishing, the specimens were rinsed and ultrasonically cleaned in distilled/deionized water for 5 min. Thickness was measured using a calibrated digital micrometer (Mitutoyo Digimatic Micrometer, Mitutoyo Corp., Kawasaki, Japan; resolution 0.001 mm) at one central and four equidistant peripheral sites permanently mapped for optical coherence tomography measurement. Specimens were accepted when their mean thickness was 1.00 ± 0.05 mm, all mapped thickness readings were within 0.95–1.05 mm, and no voids, fractures, incomplete polymerization, or gross surface defects were present.
Accepted specimens were stored individually in light-protected distilled/deionized water at 37 ± 1 °C for seven days before optical testing. The same preparation and storage procedures were applied to all composite groups.
2.4. Human Enamel Specimen Preparation
Ten sound extracted permanent human anterior teeth were obtained after approval by the Institutional Review Board of King Abdullah International Medical Research Center (KAIMRC; approval no. NRR25/036/12). Teeth with caries, restorations, cracks, developmental defects, fluorosis, hypomineralization, visible staining, or previous bleaching were excluded. One enamel specimen was obtained from each tooth, providing 10 independent biological specimens. The tooth-selection and reporting criteria are detailed in Supplementary Table S1.
Following debridement, the teeth were stored in distilled water at 4 °C for no longer than 3 months. An approximately rectangular enamel slab measuring 5.0 ± 0.5 × 5.0 ± 0.5 mm was sectioned from the middle facial third using a low-speed precision diamond saw (IsoMet 1000, Buehler, Lake Bluff, IL, USA) under continuous water cooling. Sectioning orientation was standardized, and dentin was completely removed. Each slab was examined under a stereomicroscope (Leica M80, Leica Microsystems, Wetzlar, Germany) at 10× magnification to exclude residual dentin, cracks, or structural defects.
Both enamel surfaces were finished using the same automated protocol applied to the composites: sequential wet grinding with FEPA P600, P1200, P2400, and P4000 silicon-carbide papers under continuous water cooling, with 90° rotation between grades and standardized machine speed, load, and duration. The specimens were rinsed, ultrasonically cleaned, and examined before testing; no polishing paste, sealant, glaze, or acid treatment was used [7,18].
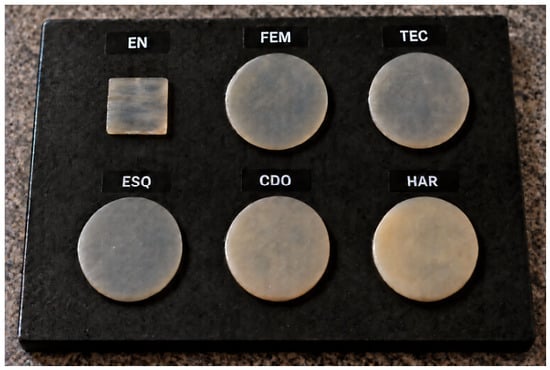
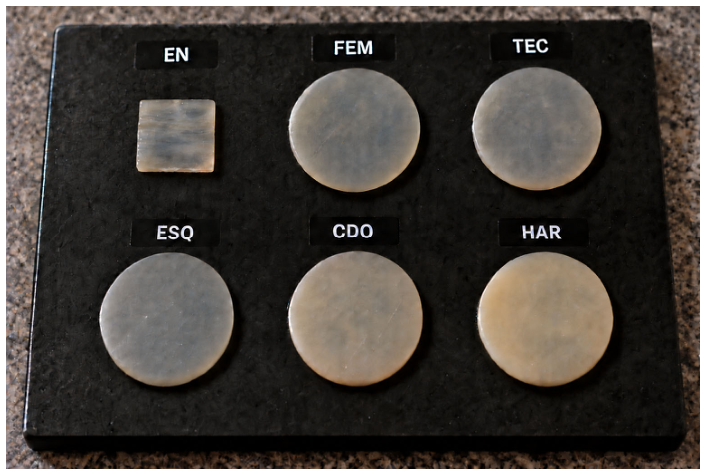
Final enamel slab dimensions were 5.0 ± 0.5 × 5.0 ± 0.5 × 1.00 ± 0.05 mm, measured at the same five mapped sites using the calibrated micrometer. Enamel specimens were stored in distilled/deionized water at 37 ± 1 °C and kept hydrated throughout testing. Before each optical measurement, they were gently blotted for 5 s and measured within 30 s, with the time outside the storage medium recorded [7]. Representative composite and enamel specimens are shown in Figure 1.
Figure 1.
Representative appearance of the tested specimens photographed over a black background. Five resin-composite discs (10 mm diameter × 1 mm thickness) and a human enamel slab (approximately 5 × 5 × 1 mm) are shown. EN, human enamel; FEM, Filtek Easy Match–Bright; TEC, Tetric EvoCeram–Bleach L; ESQ, Estelite Sigma Quick–WE; CDO, Charisma Diamond ONE; HAR, Harmonize–B1E Enamel.
2.5. Specimen Positioning and Spatial Co-Registration
To ensure reproducible positioning between optical coherence tomography (OCT) and spectrophotometric measurements, each specimen was seated in a customized heavy-body vinyl-polysiloxane index supported by a rigid acrylic frame. The composite index contained a standardized 10 mm circular recess, whereas an individual recess was fabricated for each approximately rectangular enamel slab. The silicone contacted only the peripheral margins and did not extend beneath or overlap either optical surface; an asymmetric orientation notch preserved rotational positioning after removal and repositioning.
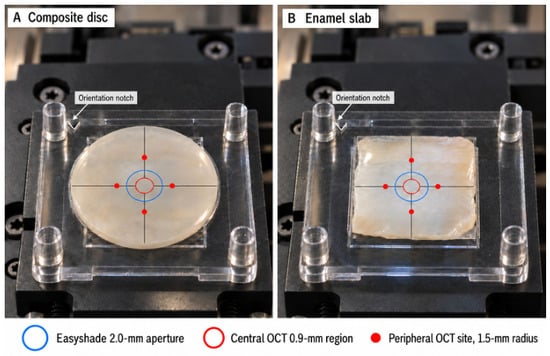
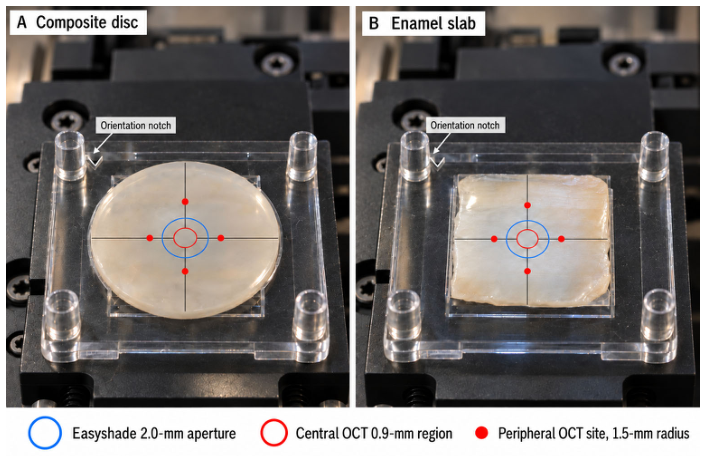
The geometric center of the exposed specimen area was transferred to the frame and used as the common spatial reference for both instruments. OCT sampling comprised one central site and four peripheral sites at a 1.5 mm radial distance, whereas spectrophotometric acquisition was confined to a concentric 2.0 mm central area. The measurements were therefore co-centered but differed in spatial extent, in accordance with the acquisition principles of the two instruments. The co-centered sampling geometry is illustrated in Figure 2.
Figure 2.
Photographic representation of the standardized co-centered sampling geometry for (A) composite discs and (B) enamel slabs. The arrow indicates the asymmetric orientation notch. The central red marker denotes the OCT sampling site, with four peripheral OCT sites positioned at 0°, 90°, 180°, and 270° at a 1.5 mm radius; the blue circle indicates the co-centered 2.0 mm Easyshade measurement area.
2.6. OCT-Derived Effective Group Refractive-Index Measurement
Effective group refractive index (RI) was measured using a swept-source optical coherence tomography system (IVS-300, Santec, Komaki, Japan). The installed configuration used a 100 nm spectral bandwidth centered at 1310 nm, with nominal axial and lateral resolutions of 11 µm in air and 17 µm, respectively. The axial acquisition window was configured to encompass both specimen interfaces throughout the tested thickness range. The outcome was defined as OCT-derived effective group RI over the source bandwidth centered at 1310 nm; this wavelength-dependent group index was used as the bulk propagation parameter for optical path-length scaling, and identical acquisition settings were used for enamel and composite specimens [24,25,26,27].
Before each measurement session, the OCT axial scale was verified using an optically flat reference plate with independently known geometric thickness and certified group refractive index at approximately 1310 nm. Automatic tissue-index depth correction was disabled, and one-way air-equivalent axial coordinates were exported. Reference-plate measurements were used to confirm stable system performance before specimen acquisition [25,26,27].
Each specimen was placed horizontally on an optically flat reflective stage and aligned perpendicular to the incident beam. A preliminary B-scan confirmed clear identification of the anterior specimen surface and posterior specimen–stage interface without saturation, clipping, or an interfacial air gap. Physical thickness was measured independently at the corresponding site using a calibrated digital micrometer. The site-specific effective group RI was calculated as follows [25,27]:
where zposterior,i and zanterior,i are the one-way air-equivalent axial coordinates of the posterior and anterior interfaces at site i, respectively, and ti is the independently measured physical thickness at the same site.
Five sites were evaluated per specimen: one central site and four peripheral sites positioned at 0°, 90°, 180°, and 270°, each 1.5 mm from the center (Figure 2). A removable transparent positioning template guided site localization and was removed before acquisition to prevent interference with the incident OCT beam; every acquisition region was required to remain entirely within intact specimen margins. Three repositioned acquisitions were averaged to obtain each site-specific RI, and the five site values were then averaged to obtain the specimen-level RI used in the statistical analyses. Individual sites and acquisitions were treated as technical replicates. No separate repeatability coefficient was prespecified; therefore, the dispersion of the averaged specimen-level values should not be interpreted as an estimate of instrument repeatability.
The central OCT site was aligned with the center of the 2.0 mm spectrophotometric measurement area, providing a common spatial reference between the two optical assessments. The individual acquisition values were additionally used to assess within-site measurement variability.
2.7. Color Measurement and CIEDE2000 Translucency
Color was measured using a calibrated spectrophotometer (VITA Easyshade V, VITA Zahnfabrik, Bad Säckingen, Germany) over the visible wavelength range of 400–700 nm. The instrument was calibrated using its matched calibration block at the beginning of each session, after every 10 specimens, and whenever prompted by the instrument.
Commission Internationale de l’Éclairage (CIE) L*, a*, and b* coordinates were obtained using the D65 standard illuminant, the 2° standard observer, and the manufacturer-configured measurement geometry. The probe was centered over the region corresponding to the central OCT site. CIE L*a*b* coordinates were reported according to ISO/CIE 11664-4:2019 [28].
A customized heavy-body silicone positioning mask was adapted to the probe tip to confine measurements to a reproducible 2.0 mm central region that remained within the intact surface of both enamel slabs and composite discs and was concentrically aligned with the central OCT reference site. The mask defined the exposed area without contacting the measurement surface.
Each specimen was measured over standardized ceramic white and black reflectance backgrounds (X-Rite Inc., Grand Rapids, MI, USA). The CIE L*, a*, and b* coordinates of both backgrounds were measured and recorded before the experiment.
The specimen remained seated in its positioning index during measurements over both backgrounds, and the index–specimen assembly was transferred intact to preserve orientation and central alignment. The index contacted only the lateral margins, while the lower specimen surface was optically coupled to the background by the standardized glycerin layer.
A fixed volume of 20 µL glycerin (catalog No. G7893, Sigma-Aldrich, Merck KGaA, Darmstadt, Germany; ACS reagent grade, ≥99.5%; refractive index n20/D = 1.474, lit.) was placed between the specimen and background to provide standardized optical coupling. The same glycerin volume, seating procedure, orientation, and contact pressure were used for enamel and composite specimens. The order of the white and black backgrounds was randomized. Three readings were obtained at the center of each specimen on each background, with specimen removal and repositioning between readings. The three readings were averaged separately for the white and black backgrounds. Enamel and composite specimens underwent the same hydration, blotting, and measurement-timing procedures.
The optically coupled CIEDE2000 translucency parameter (TP00) was calculated as the color difference between measurements of the same specimen over the white and black backgrounds [3,4,29]:
where the subscripts W and B represent measurements over the white and black backgrounds, respectively. The CIEDE2000 color difference was calculated according to ISO/CIE 11664-6:2022 using parametric factors kL = kC = kH = 1 [30]. Higher TP00 values indicated greater translucency. One mean TP00 value was calculated for each specimen and used in the statistical analyses.
2.8. Enamel-Referenced Absolute Deviation
The enamel reference was obtained from 10 independent enamel specimens measured using the same OCT and spectrophotometric procedures as the composite specimens. The mean enamel RI and mean enamel TP00 were calculated from the 10 specimen-level values.
For composite specimen i within material m, the absolute RI deviation from the mean enamel reference was calculated as follows:
The corresponding absolute TP00 deviation was calculated as follows:
Lower absolute-deviation values indicated closer specimen-level proximity to the measured enamel mean. Each material was summarized by averaging the specimen-level absolute deviations. For TP00, this metric reflects both displacement of the material mean from enamel and within-material dispersion; it is therefore not equivalent to the composite-versus-enamel group-mean contrast. Confidence intervals were obtained as percentile intervals from 10,000-resample stratified nonparametric bootstrap resampling of the independent enamel and composite specimens at the specimen level.
The relationship between effective group RI and visible-light translucency was evaluated using the paired specimen-level RI and TP00 measurements in a statistical model adjusted for material group. The association based on the five composite-material means was reported as exploratory.
2.9. Randomization, Masking, and Quality Control
Specimens received computer-generated coded identifiers before optical measurements. OCT acquisition order and color-measurement order were independently randomized. The analyst extracting OCT interface positions and the statistician were masked to material identity until the measurement database was locked. Exclusions with reasons, micrometer readings, raw OCT measurements, and raw CIE L*a*b* values were retained. No specimen was excluded solely because its RI or TP00 value appeared extreme; exclusion required a prespecified technical or specimen-quality reason.
2.10. Statistical Analysis
Effective group refractive index (RI) and CIEDE2000 translucency parameter (TP00) were the co-primary outcomes; TPaβ was secondary. Analyses were performed in R version 4.4.1 using the specimen as the experimental unit, with technical replicates averaged before analysis. Each outcome was analyzed with material as a fixed factor using HC3 heteroscedasticity-robust standard errors. Prespecified composite-versus-enamel comparisons were Holm-adjusted; mean differences, unadjusted 95% confidence intervals, adjusted p values, and Hedges’ g are reported. Enamel-referenced absolute RI and TP00 deviations were exploratory and summarized with 95% confidence intervals from 10,000 stratified bootstrap resamples. The RI–TP00 relationship was examined descriptively with Pearson correlation and inferentially with material-adjusted HC3-robust linear regression. All tests were two-sided at α = 0.05, and no outcome-based imputation was performed. Central-site sensitivity analysis and OCT measurement-variability assessments were also performed to evaluate the robustness of the material-adjusted RI–TP00 association.
3. Results
3.1. Descriptive Optical Characteristics
Table 2 summarizes the effective group refractive index (RI) and CIEDE2000 translucency parameter (TP00) for the 60 specimens. All specimens were included, with 10 observations in each group. Enamel had the highest mean RI (1.628 ± 0.004), whereas Filtek Easy Match had the highest RI among the composites (1.589 ± 0.007). The TP00 values of Filtek Easy Match (15.88 ± 2.78) and Tetric EvoCeram (15.05 ± 3.14) were closest to that of enamel (15.76 ± 2.40). Charisma Diamond ONE showed an intermediate TP00 value (12.92 ± 3.77), whereas Estelite Sigma Quick (11.46 ± 3.25) and Harmonize (11.24 ± 3.89) showed the lowest values. The complete CIELAB coordinates measured over white and black backgrounds are provided in Supplementary Table S2.
Table 2.
Effective group refractive index and CIEDE2000 translucency parameter of human enamel and the tested resin composites, with planned composite-versus-enamel comparisons.
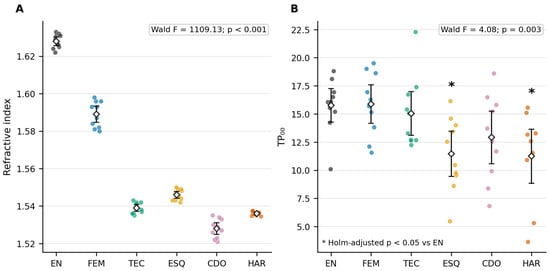
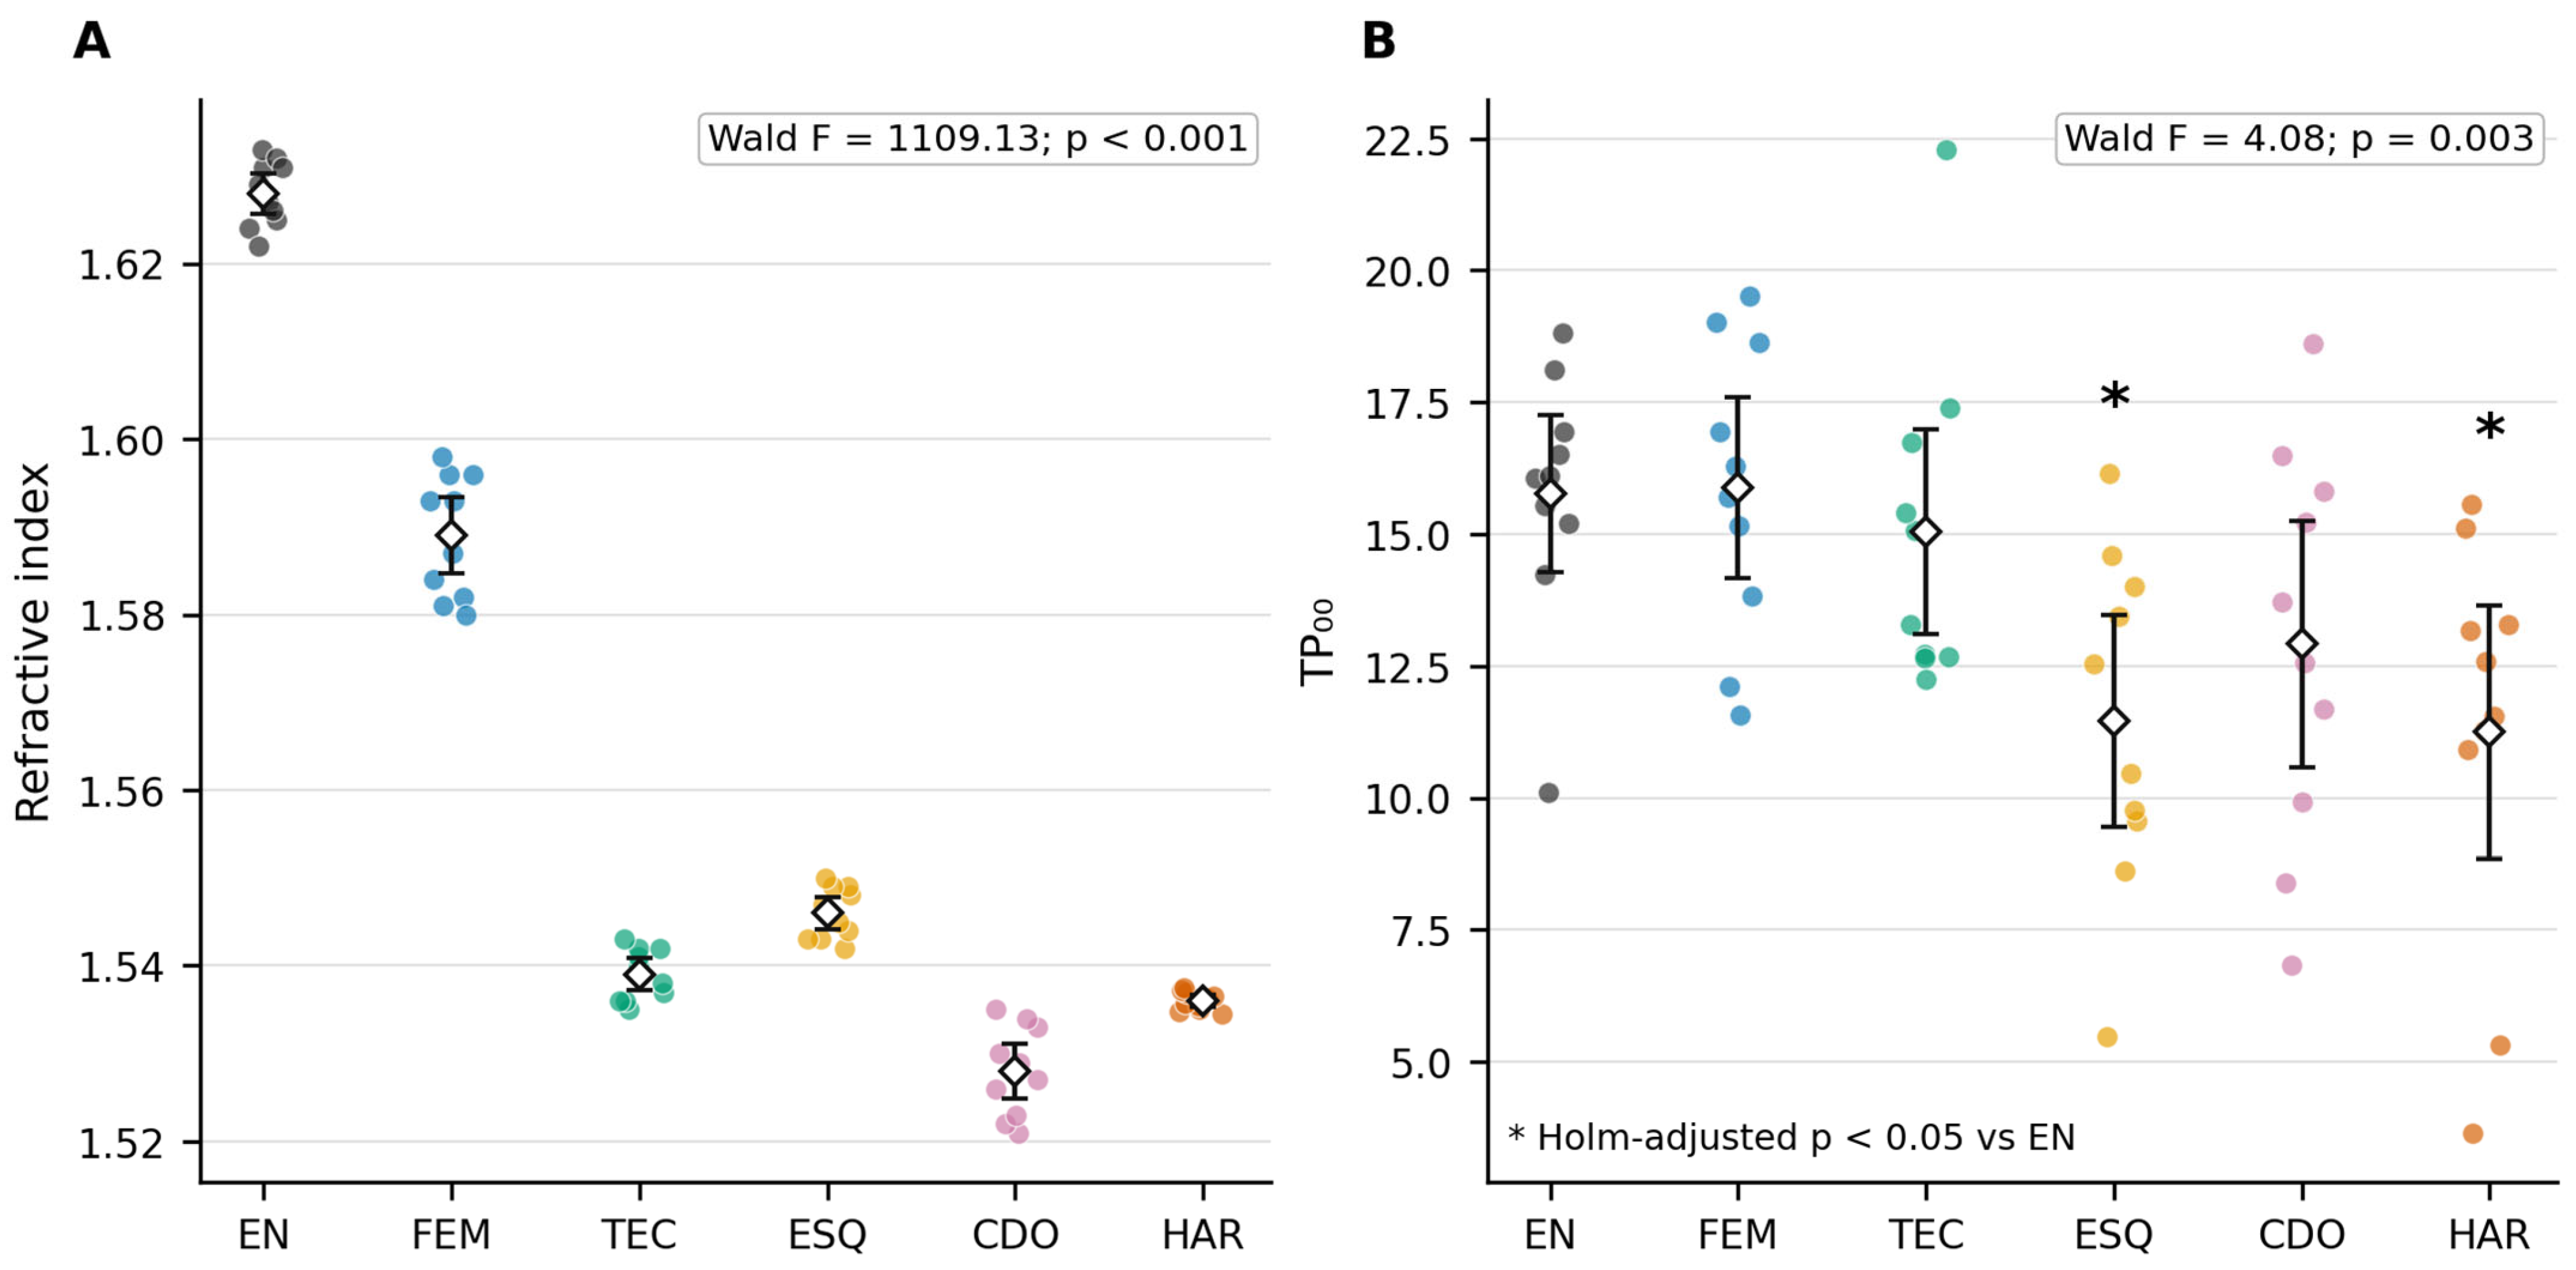
Figure 3 shows the specimen-level distributions of RI and TP00. RI values formed clearly separated material-specific clusters, with enamel positioned above all composite groups. Greater overlap was observed for TP00, particularly among enamel, Filtek Easy Match, and Tetric EvoCeram. Charisma Diamond ONE occupied an intermediate position, while the distributions of Estelite Sigma Quick and Harmonize were shifted toward lower TP00 values.
Figure 3.
Specimen-level distributions of (A) effective group refractive index at 1310 nm and (B) CIEDE2000 translucency parameter (TP00). Circles represent individual specimens, open diamonds group means, and error bars 95% confidence intervals. Insets show HC3-robust omnibus Wald tests. In (B), asterisks indicate significant composite-versus-enamel differences after Holm adjustment. EN, human enamel; FEM, Filtek Easy Match–Bright; TEC, Tetric EvoCeram–Bleach L; ESQ, Estelite Sigma Quick–WE; CDO, Charisma Diamond ONE; HAR, Harmonize–B1E Enamel.
3.2. Refractive Index
A significant overall material effect was detected for RI using the heteroscedasticity-robust model (Wald F5,54 = 1109.13, p < 0.001). The five prespecified comparisons with enamel were subsequently evaluated using Holm-adjusted p values (Table 2). All composites had significantly lower RI values than enamel after multiplicity adjustment (all adjusted p < 0.001).
Filtek Easy Match produced the smallest estimated RI difference from enamel (mean difference: −0.039; 95% CI: −0.044 to −0.034; Hedges’ g = −6.70). The differences were greater for Estelite Sigma Quick (−0.082; 95% CI: −0.085 to −0.079; g = −23.33), Tetric EvoCeram (−0.089; 95% CI: −0.092 to −0.086; g = −25.32), and Harmonize (−0.092; 95% CI: −0.095 to −0.089; g = −32.07). Charisma Diamond ONE showed the greatest mean difference from enamel (−0.100; 95% CI: −0.104 to −0.096; g = −21.54). Thus, although Filtek Easy Match most closely approached the enamel RI, none of the evaluated composites reproduced the enamel RI distribution under the present measurement conditions. These Hedges’ g values are numerically large chiefly because within-group RI variability was very small; the magnitude of g should not be read as evidence of greater clinical importance than the absolute mean differences and confidence intervals reported above, which remain the primary basis for interpretation.
3.3. CIEDE2000 Translucency Parameter
The robust omnibus analysis identified a significant material effect for TP00 (Wald F5,54 = 4.08, p = 0.003). Nevertheless, the planned comparisons demonstrated that this overall effect was not shared uniformly across the composites (Table 2).
Filtek Easy Match showed a near-zero difference from enamel (mean difference: 0.11; 95% CI: −2.34 to 2.57; adjusted p = 1.000; Hedges’ g = 0.04). Tetric EvoCeram showed a small negative difference (−0.72; 95% CI: −3.36 to 1.92; adjusted p = 1.000; g = −0.25). No statistically significant difference from enamel was detected for either material. Charisma Diamond ONE showed a larger negative difference of −2.84, but its confidence interval included zero (95% CI: −5.83 to 0.14; adjusted p = 0.185; g = −0.86).
Conversely, Estelite Sigma Quick and Harmonize had significantly lower TP00 values than enamel. Estelite Sigma Quick showed a mean difference of −4.30 (95% CI: −7.00 to −1.60; adjusted p = 0.012; g = −1.44), while Harmonize showed a mean difference of −4.52 (95% CI: −7.57 to −1.47; adjusted p = 0.018; g = −1.34). Therefore, the significant omnibus TP00 finding was primarily attributable to the lower translucency of Estelite Sigma Quick and Harmonize rather than to a consistent difference between enamel and every tested composite.
3.4. Secondary Analysis of the Conventional CIELAB Translucency Parameter
TPaβ differed significantly among the six groups (Wald F5,54 = 4.14, p = 0.003). Enamel had a mean TPaβ of 20.57 ± 3.60. Filtek Easy Match (21.81 ± 4.26; mean difference: 1.24; 95% CI: −2.49 to 4.97; adjusted p = 1.000) and Tetric EvoCeram (20.72 ± 4.35; mean difference: 0.15; 95% CI: −3.62 to 3.92; adjusted p = 1.000) showed values centered near the enamel reference.
Charisma Diamond ONE had a lower mean TPaβ of 17.68 ± 5.47, but its difference from enamel was not significant after Holm adjustment (mean difference: −2.88; 95% CI: −7.26 to 1.49; adjusted p = 0.576). Harmonize also showed a lower mean value of 15.52 ± 5.07; however, its difference of −5.05 did not retain statistical significance following adjustment (95% CI: −9.21 to −0.90; adjusted p = 0.073). Estelite Sigma Quick was the only composite with a significantly lower TPaβ than enamel (14.87 ± 4.14; mean difference: −5.70; 95% CI: −9.37 to −2.04; adjusted p = 0.015).
The TPaβ findings were therefore broadly consistent with the principal TP00 analysis, although the difference between Harmonize and enamel did not remain statistically significant when translucency was calculated using the conventional CIELAB formula.
3.5. Specimen-Level Absolute Deviation from the Enamel Reference
The specimen-level absolute RI deviation differed significantly among the five composites (Wald F4,45 = 155.20, p < 0.001; Table 3). Filtek Easy Match exhibited the smallest absolute RI deviation (0.039 ± 0.007; 95% bootstrap CI: 0.034–0.044), followed by Estelite Sigma Quick (0.082 ± 0.003; 0.079–0.085), Tetric EvoCeram (0.089 ± 0.003; 0.086–0.092), Harmonize (0.092 ± 0.001; 0.090–0.094), and Charisma Diamond ONE (0.100 ± 0.005; 0.096–0.104). Because every composite had a lower mean RI than enamel, this RI deviation closely parallels the absolute composite-versus-enamel RI contrast reported in Table 2.
Table 3.
Specimen-level absolute deviation of the tested resin composites from the human enamel reference.
In contrast, specimen-level absolute TP00 deviation did not differ significantly among the composites (Wald F4,45 = 1.54, p = 0.205; Table 3). The lowest numerical deviations were observed for Filtek Easy Match (2.20 ± 1.53; 95% bootstrap CI: 1.35–3.29) and Tetric EvoCeram (2.54 ± 1.80; 1.48–3.80), followed by Charisma Diamond ONE (3.57 ± 3.01; 1.95–5.69), Estelite Sigma Quick (4.38 ± 3.13; 2.37–6.67), and Harmonize (4.52 ± 3.89; 2.21–7.36). The broad overlap of the bootstrap intervals was consistent with the nonsignificant omnibus result. Because this measure is the mean absolute specimen-level deviation from the enamel mean, it incorporates both between-group displacement and within-material dispersion and should not be interpreted as a second estimate of the group-mean difference.
3.6. Association Between Refractive Index and Translucency
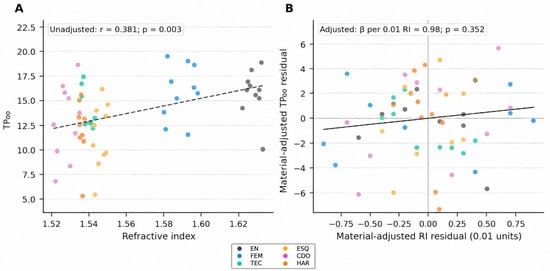
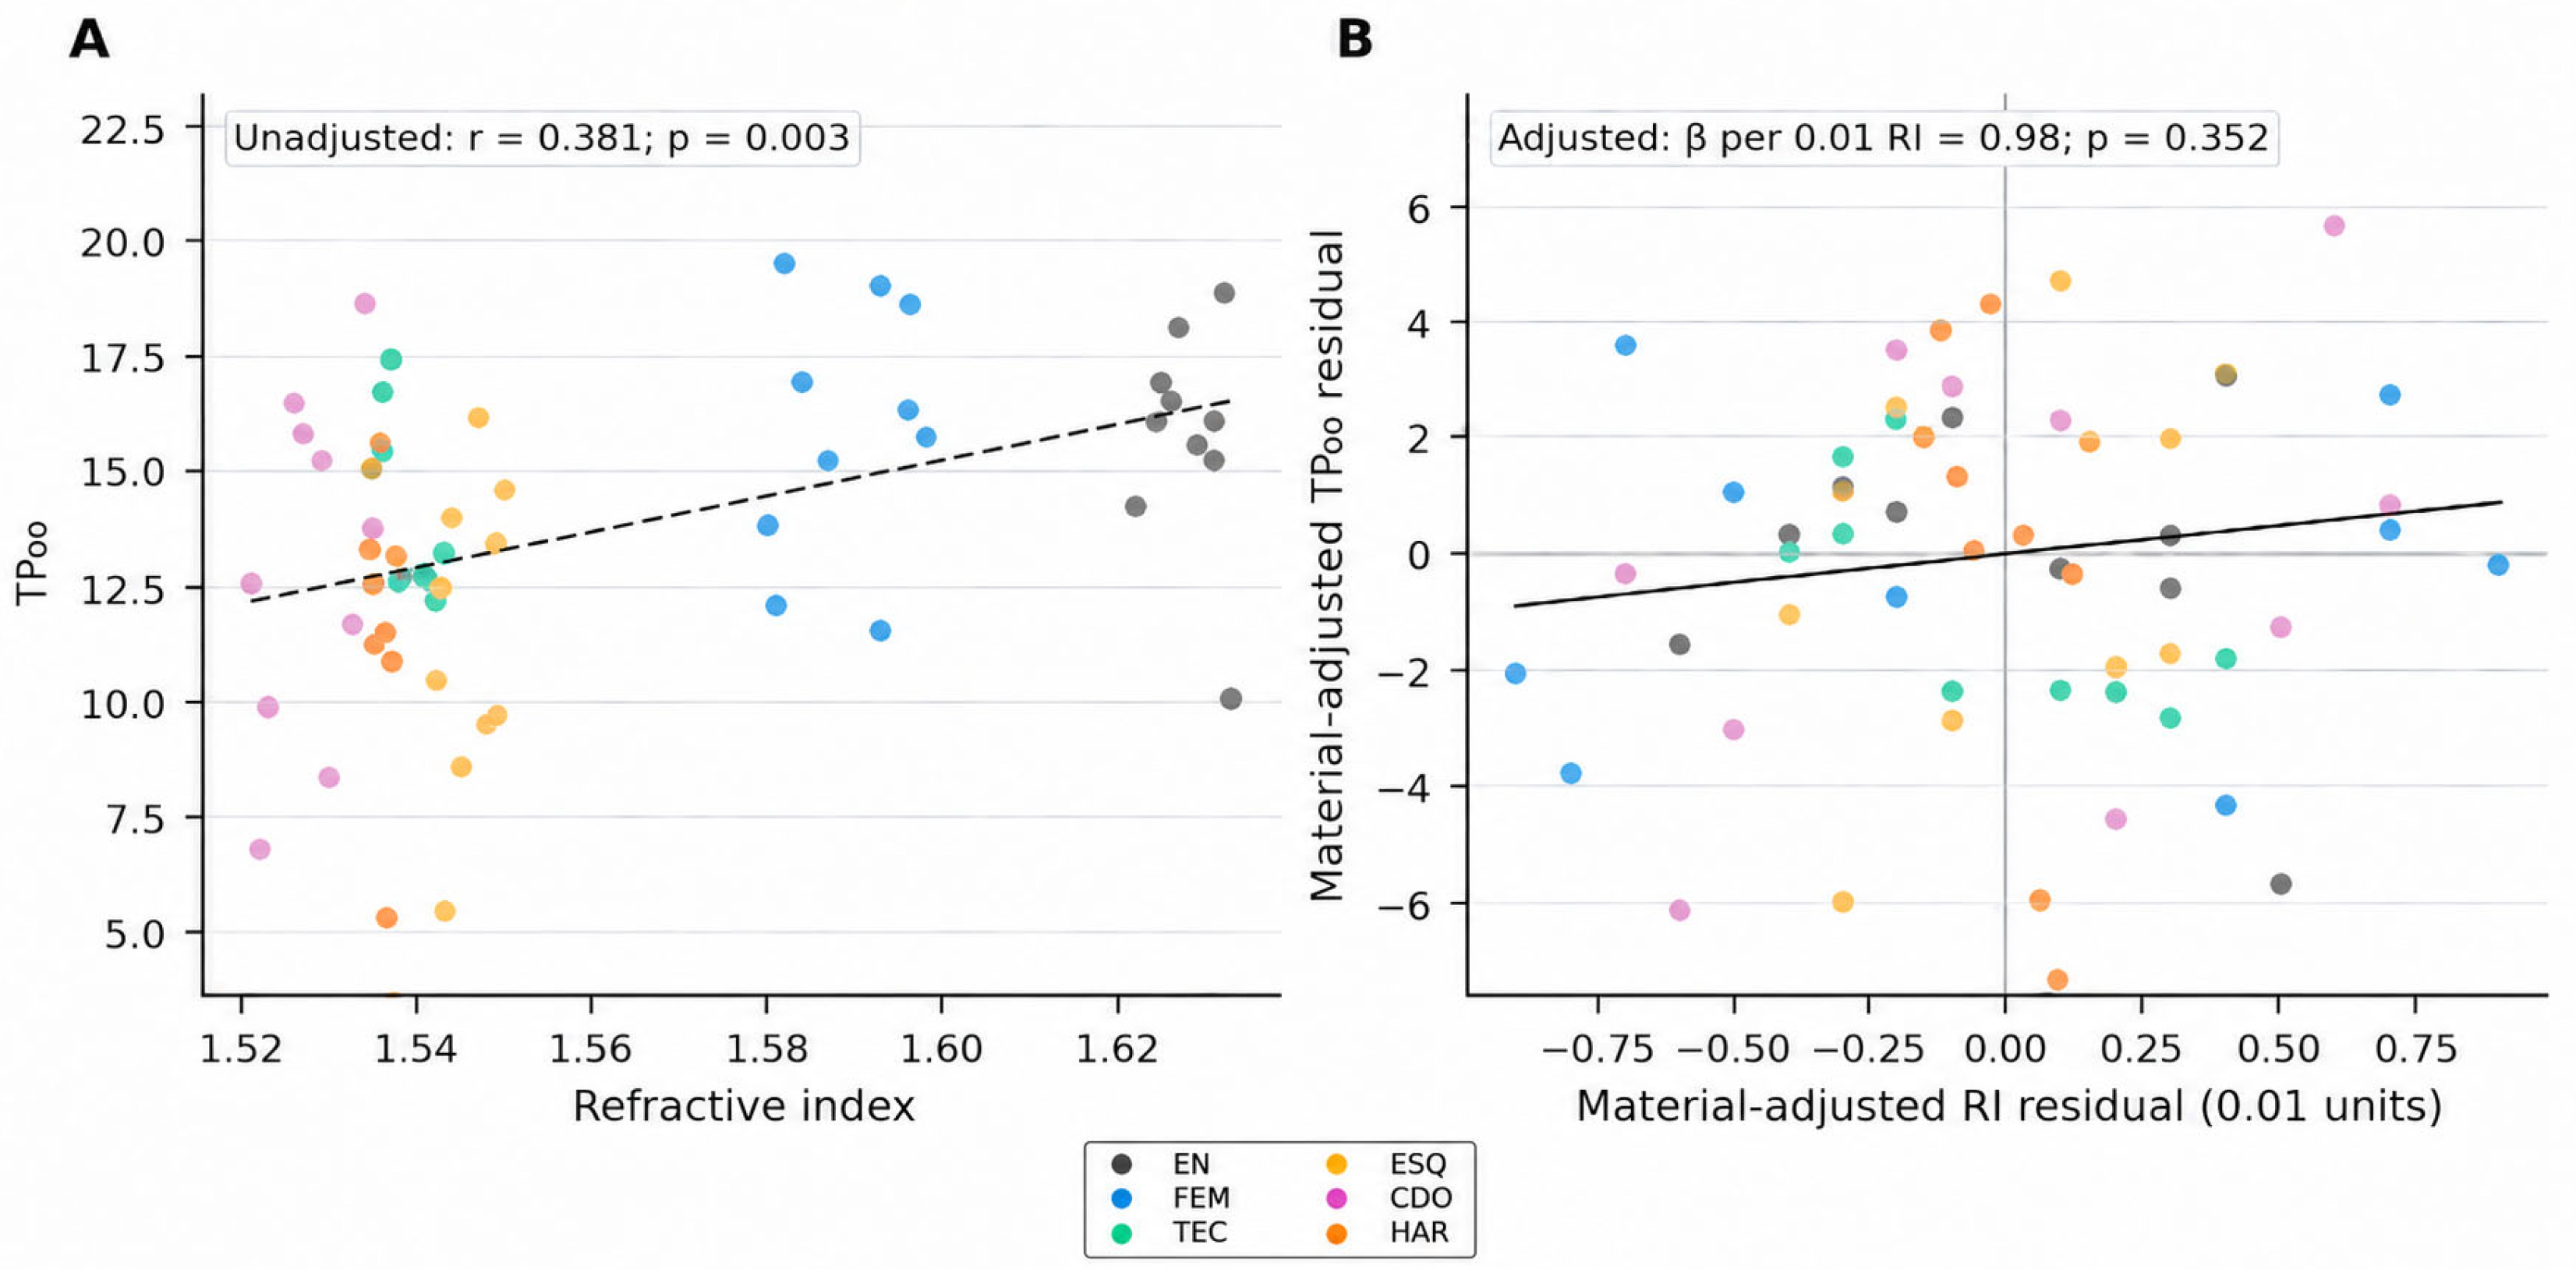
A descriptive all-specimen analysis showed a positive correlation between RI and TP00 (r = 0.381, p = 0.003), but this pooled association combines enamel and five composite groups and is confounded by material identity. In the material-adjusted robust regression, a 0.01-unit increase in RI corresponded to an estimated TP00 increase of 0.98 units; the confidence interval included both negative and positive associations (95% CI: −1.11 to 3.06; p = 0.352). Thus, no statistically significant within-material association was detected after adjustment for material group.
The adjusted association and material-specific specimen distributions are displayed in Figure 4. The composites-only correlation was r = 0.337 (p = 0.017), whereas the correlation calculated from the five composite group means was r = 0.627 (p = 0.257). The material-mean analysis was based on only five aggregate observations and was therefore treated as descriptive and inconclusive. The central-site sensitivity analysis showed no significant material-adjusted RI–TP00 association (β = 74.09; 95% CI: −150.39 to 298.56; p = 0.511), consistent with the original five-site analysis (p = 0.352). Across 900 OCT acquisitions, the pooled within-site standard deviation was 0.00450 RI units. Uncertainty-propagation analyses preserved the nonsignificant association in 99.3–100% of resamples (Supplementary Table S3).
Figure 4.
Relationship between effective group refractive index (RI) and CIEDE2000 translucency parameter (TP00). (A) Pooled specimen-level relationship; the dashed line represents the fitted regression and is descriptive because material groups are combined. (B) Added-variable plot of material-adjusted RI and TP00 residuals; the solid line represents the adjusted fit. Each point represents one specimen, with colors identifying material groups as shown in the legend. Insets report the pooled Pearson correlation and the material-adjusted regression coefficient per 0.01-unit increase in RI. EN, human enamel; FEM, Filtek Easy Match–Bright; TEC, Tetric EvoCeram–Bleach L; ESQ, Estelite Sigma Quick–WE; CDO, Charisma Diamond ONE; HAR, Harmonize–B1E Enamel.
4. Discussion
The present study demonstrated that effective group refractive index (RI) and visible translucency describe complementary but non-equivalent aspects of composite optical behavior. In this study, all tested composites had significantly lower RI values than human enamel; therefore, the first null hypothesis was rejected for every material. The TP00 findings were material-dependent: Filtek Easy Match, Tetric EvoCeram, and Charisma Diamond ONE did not differ significantly from enamel, whereas Estelite Sigma Quick and Harmonize were significantly less translucent. Accordingly, the second null hypothesis was rejected for Estelite Sigma Quick and Harmonize but not for the other composites. The third null hypothesis was not rejected because this study detected no statistically significant RI–TP00 association after adjustment for material group.
Earlier investigations identified enamel as a highly translucent tissue whose optical behavior varies naturally with anatomical origin, thickness, mineralization, and prism orientation [2,7,26]. In the present study, the enamel TP00 value of 15.76 closely approximated the CIEDE2000 relative translucency parameter (RTP00) value of 15.01 reported by Paravina et al. for 1 mm human enamel, despite differences in measurement configuration and optical coupling [3]. This agreement supports the use of the enamel specimens in this study as a biologically relevant reference.
Composite translucency is influenced by polymer matrix chemistry, filler composition and morphology, interfacial structure, pigments, porosity, and degree of conversion [13,14,15,16,17,18,19,20,21,22]. Importantly, the OCT-derived effective group RI is not a direct measurement of matrix–filler phase-index mismatch and should not be used to infer visible-light interfacial reflectance. Two composites with similar effective group RI may therefore exhibit different visible translucency because scattering and absorption depend on multiple wavelength- and formulation-dependent factors [15,16,17,18,19,20,21,24]. Consistently, the material-adjusted analysis in this study did not detect a significant RI–TP00 association (p = 0.352).
OCT-derived effective group RI characterizes bulk optical propagation at 1310 nm, whereas visible translucency reflects wavelength-dependent scattering and absorption influenced by resin-matrix chemistry, filler characteristics, and their optical interactions. Understanding these distinct optical contributions may guide the refinement of composite formulations toward more comprehensive reproduction of enamel optical behavior.
The different responses observed among the five composites may be considered in relation to their distinct formulations, although internal scattering and matrix–filler refractive-index matching were not directly measured. Filtek Easy Match demonstrated the closest effective group RI to enamel, and its TP00 was not significantly different from enamel. Its heterogeneous nanofiller morphology and filler loading have been characterized directly by Perdigão et al. [11]; however, comparable baseline TP00 data for its Bright shade remain unavailable. In this study, Tetric EvoCeram likewise showed no statistically significant TP00 difference from enamel despite a greater effective group RI difference, supporting the view that bulk group RI alone does not determine visible translucency. Its formulation includes barium glass, ytterbium fluoride, prepolymerized fillers, mixed oxides, and silica [31]. The present finding is compatible with the moderate TP00 reported by Lopez et al. (2024), although they evaluated the A2 rather than Bleach L shade [31]. Charisma Diamond ONE showed intermediate translucency in this study. Özdemir et al. (2024) also reported TP00 values for this material, although differences in shade and measurement conditions limit direct comparison [32]. Its formulation may contribute to the observed balance between transmission and scattering, but these mechanisms were not measured directly in the present study [32].
The lower TP00 observed for Estelite Sigma Quick in this study agrees with Sari and Aydemir Aydın (2026), who also reported relatively low translucency for 1 mm Estelite Sigma Quick specimens [33]. Its response may reflect the interaction of filler architecture with filler concentration, interparticle spacing, aggregation, pigments, and matrix–filler optical compatibility [11,23]. Harmonize similarly exhibited lower translucency in line with findings for another Harmonize shade reported by Balci et al. (2021) [7]. Its response may reflect the combined influence of its highly filled nanohybrid structure, zirconia–silica-containing filler system, resin composition, and chromatic components [7]. The TP00 reductions relative to enamel for Estelite Sigma Quick and Harmonize were approximately 4.3 and 4.5 units, respectively, indicating lower translucency under the tested backgrounds and potentially greater masking. Overall, the differences observed in this study cannot be attributed to a single compositional component and should instead be interpreted as formulation-level effects [11,15,19,20,23,24].
The TPaβ findings broadly supported the principal TP00 analysis. Filtek Easy Match and Tetric EvoCeram remained centered near enamel, whereas Estelite Sigma Quick was the only composite with significantly lower TPaβ after multiplicity adjustment. Harmonize showed a lower mean TPaβ, but the difference did not remain statistically significant. This modest variation between the two outcomes is expected because TPaβ represents a direct Euclidean distance in CIELAB space, whereas TP00 applies perceptual corrections for lightness, chroma, and hue [4,28,30]. The findings of this study therefore support considering the two parameters as complementary but not interchangeable and support the selection of TP00 as the principal translucency outcome.
For descriptive clinical context, the absolute group-mean TP00 differences observed in this study were 0.11 for Filtek Easy Match, 0.72 for Tetric EvoCeram, 2.84 for Charisma Diamond ONE, 4.30 for Estelite Sigma Quick, and 4.52 for Harmonize. These values may be viewed alongside the published 2.62-unit 50:50 translucency acceptability threshold [4]; however, because that threshold was derived from resin-composite comparisons and was not prespecified for enamel equivalence in this study, it should be interpreted only as contextual reference rather than as a formal criterion of clinical acceptability or equivalence.
The enamel-referenced absolute-deviation analysis in this study provided a specimen-level description of proximity to the same biological reference. For RI, the absolute deviation largely paralleled the composite-versus-enamel contrast because all composite means in this study were below enamel. For TP00, however, the measure incorporated both displacement from the enamel mean and within-material dispersion. Filtek Easy Match and Tetric EvoCeram showed the smallest numerical TP00 deviations, but differences among materials were not significant and the bootstrap confidence intervals overlapped substantially. Table 3 should therefore be interpreted as an exploratory, descriptive analysis of the present study rather than as a ranking of clinical performance.
The material-adjusted analysis did not identify a consistent within-material RI–TP00 association, while the correlation based on only five composite means remained inconclusive. This finding is consistent with previous evidence that refractive-index matching contributes to translucency but does not independently determine it [19,20,21,22]. Contemporary composites employ different optical strategies, including engineered filler morphology, structural color, and simplified shade/color-adjustment approaches [11,23,29,34,35]. Because effective group RI in this study was measured at 1310 nm whereas TP00 reflects visible-light behavior, wavelength-dependent dispersion, absorption, and scattering may further reduce correspondence between these outcomes. The central-site sensitivity analysis yielded an interpretation consistent with the primary five-site assessment, indicating that the RI–TP00 association was not materially influenced by OCT sampling location. Similarly, uncertainty-propagation analyses demonstrated that the nonsignificant material-adjusted association remained stable under the observed measurement variability.
From a clinical perspective, the findings of this study suggest that materials approximating enamel TP00 may favor optical integration when the underlying tooth structure contributes to the restoration’s appearance, whereas materials with lower TP00 may provide greater background masking. This background-dependent color blending, commonly described as the chameleon effect, is an important consideration in the optical design of esthetic composites. The desired optical response will nevertheless depend on restoration thickness, substrate color, and clinical location.
4.1. Limitations of This Study
The standardized in vitro conditions may not fully reproduce the optical complexity of clinical restorations. Differences in measurement wavelengths and sampling areas, together with the selected composite shades, manufacturing lots, and natural enamel variability, should be considered when extending these findings to broader clinical and material conditions.
4.2. Recommendations for Future Research
The present study establishes a foundation for future investigations through its paired assessment of effective group RI and visible translucency against a human enamel reference, supported by standardized optical measurements and quantitative variability analyses. Future research incorporating broader composite formulations, clinically relevant thicknesses, and aging conditions, may extend these findings and guide the development of enamel-mimicking restorative materials.
5. Conclusions
Within the limitations of this in vitro study, all tested composites exhibited significantly lower effective group RI than human enamel. No statistically significant TP00 difference from enamel was detected for Filtek Easy Match, Tetric EvoCeram, or Charisma Diamond ONE, although this does not establish formal equivalence; Estelite Sigma Quick and Harmonize were significantly less translucent. After adjustment for material group, no statistically significant specimen-level RI–TP00 association was detected. The findings support interpreting OCT-derived effective group RI at 1310 nm and visible translucency as complementary optical properties whose relationship depends on material formulation and wavelength-dependent light interaction.
Supplementary Materials
The following supporting information can be downloaded at https://www.mdpi.com/article/10.3390/jfb17110567/s1: Table S1, Eligibility and reporting criteria for extracted teeth used to prepare human enamel specimens; Table S2, CIELAB coordinates measured over white and black backgrounds.; Table S3, OCT measurement-variability and RI–TP00 sensitivity analyses.
Author Contributions
Conceptualization, R.S.I. and A.B.; Methodology, R.S.I., A.B. and A.A.K.; Formal Analysis, R.S.I., A.B., A.A.K., M.M.A. and A.A.; Investigation, R.S.I., A.B., A.A.K., M.M.A. and A.A.; Data Curation, R.S.I., A.B., A.A.K., M.M.A. and A.A.; Writing—Original Draft Preparation, R.S.I. and A.B.; Writing—Review and Editing, R.S.I., A.A.K., M.M.A., A.A. and A.B. All authors have read and agreed to the published version of the manuscript.
Funding
This research received no external funding.
Institutional Review Board Statement
This study was approved by the Institutional Review Board of King Abdullah International Medical Research Center (KAIMRC; protocol code NRR25/036/12; approval date: 8 January 2026).
Informed Consent Statement
Not applicable. This study used anonymized extracted human teeth obtained under the above institutional approval.
Data Availability Statement
The data generated and analyzed in this study are available from the corresponding author upon reasonable request.
Acknowledgments
During preparation of this manuscript, the authors used OpenAI ChatGPT (GPT-6 model, OpenAI, San Francisco, CA, USA) for language/formatting assistance. The authors reviewed and edited the output and take full responsibility for the final content. No generative-AI output was used as experimental data, and all numerical results and data-derived figures were verified by the authors.
Conflicts of Interest
The authors declare no conflicts of interest.
References
- Ismail, E.H.; Paravina, R.D. Color adjustment potential of resin composites: Optical illusion or physical reality, a comprehensive overview. J. Esthet. Restor. Dent. 2022, 34, 42–54. [Google Scholar] [CrossRef] [Scilit]
- Yu, B.; Ahn, J.S.; Lee, Y.K. Measurement of translucency of tooth enamel and dentin. Acta Odontol. Scand. 2009, 67, 57–64. [Google Scholar] [CrossRef] [Scilit]
- Paravina, R.D.; Cevik, P.; Ontiveros, J.C.; Johnston, W.M. Translucency of enamel and dentin: A biomimetic target for esthetic dental materials. J. Esthet. Restor. Dent. 2025, 37, 1127–1134. [Google Scholar] [CrossRef] [Scilit]
- Salas, M.; Lucena, C.; Herrera, L.J.; Yebra, A.; Della Bona, A.; Pérez, M.M. Translucency thresholds for dental materials. Dent. Mater. 2018, 34, 1168–1174. [Google Scholar] [CrossRef] [Scilit]
- Zhu, J.; Chen, S.; Anniwaer, A.; Xu, Y.; Huang, C. Effects of background color and restoration depth on color adjustment potential of a new single-shade resin composite versus multishade resin composites. Front. Bioeng. Biotechnol. 2023, 11, 1328673. [Google Scholar] [CrossRef] [Scilit]
- Durand, L.B.; Ruiz-López, J.; Perez, B.G.; Ionescu, A.M.; Carrillo-Pérez, F.; Ghinea, R.; Pérez, M.M. Color, lightness, chroma, hue, and translucency adjustment potential of resin composites using CIEDE2000 color difference formula. J. Esthet. Restor. Dent. 2021, 33, 836–843. [Google Scholar] [CrossRef] [Scilit]
- Balci, M.; Ergucu, Z.; Uzer Çelik, E.; Turkun, L.S. Comparison between translucencies of anterior resin composites and natural dental tissues. Color Res. Appl. 2021, 46, 635–644. [Google Scholar] [CrossRef] [Scilit]
- Sulaiman, T.A.; Rodgers, B.; Suliman, A.A.; Johnston, W.M. Color and translucency stability of contemporary resin-based restorative materials. J. Esthet. Restor. Dent. 2021, 33, 899–905. [Google Scholar] [CrossRef] [Scilit]
- Valizadeh-Haghi, H.; Molaee, S.; Kamran, A.; Davoodzadeh, S. Masking ability of bleach-shade composite resins in different thicknesses. Int. J. Dent. 2022, 2022, 7479299. [Google Scholar] [CrossRef] [Scilit]
- Kim, S.J.; Son, H.H.; Cho, B.H.; Lee, I.B.; Um, C.M. Translucency and masking ability of various opaque-shade composite resins. J. Dent. 2009, 37, 102–107. [Google Scholar] [CrossRef] [Scilit]
- Perdigão, J.; Zatt, F.P.; Lopes, G.C.; Caon, N.B.; Chen, R. Characterization of universal composite resin filler particles. J. Esthet. Restor. Dent. 2025, 37, 2472–2480. [Google Scholar] [CrossRef] [Scilit]
- Ferracane, J.L. Resin composite—State of the art. Dent. Mater. 2011, 27, 29–38. [Google Scholar] [CrossRef] [Scilit]
- Azzopardi, N.; Moharamzadeh, K.; Wood, D.J.; Martin, N.; van Noort, R. Effect of resin matrix composition on the translucency of experimental dental composite resins. Dent. Mater. 2009, 25, 1564–1568. [Google Scholar] [CrossRef] [Scilit]
- Fujita, K.; Nishiyama, N.; Nemoto, K.; Okada, T.; Ikemi, T. Effect of base monomer’s refractive index on curing depth and polymerization conversion of photo-cured resin composites. Dent. Mater. J. 2005, 24, 403–408. [Google Scholar] [CrossRef] [Scilit]
- Lee, Y.K. Influence of filler on the difference between the transmitted and reflected colors of experimental resin composites. Dent. Mater. 2008, 24, 1243–1247. [Google Scholar] [CrossRef] [Scilit]
- Emami, N.; Sjödahl, M.; Söderholm, K.J.M. How filler properties, filler fraction, sample thickness, and light source affect light attenuation in particulate-filled resin composites. Dent. Mater. 2005, 21, 721–730. [Google Scholar] [CrossRef] [Scilit]
- Arimoto, A.; Nakajima, M.; Hosaka, K.; Nishimura, K.; Ikeda, M.; Foxton, R.M.; Tagami, J. Translucency, opalescence and light transmission characteristics of light-cured resin composites. Dent. Mater. 2010, 26, 1090–1097. [Google Scholar] [CrossRef] [Scilit]
- Değirmenci, A.; Pehlivan, I.E.; Değirmenci, B.U. Effects of polishing procedures on optical parameters and surface roughness of composite resins with different viscosities. Dent. Mater. J. 2023, 42, 199–210. [Google Scholar] [CrossRef] [Scilit]
- Miletic, V.; Jakovljevic, N.; Manojlovic, D.; Marjanovic, J.; Rosic, A.A.; Dramićanin, M.D. Refractive indices of unfilled resin mixtures and cured composites related to color and translucency of conventional and low-shrinkage composites. J. Biomed. Mater. Res. B Appl. Biomater. 2017, 105, 7–13. [Google Scholar] [CrossRef] [Scilit]
- Oivanen, M.; Keulemans, F.; Garoushi, S.; Vallittu, P.K.; Lassila, L. The effect of refractive index of fillers and polymer matrix on translucency and color matching of dental resin composite. Biomater. Investig. Dent. 2021, 8, 48–53. [Google Scholar] [CrossRef] [Scilit]
- Shortall, A.C.; Palin, W.M.; Burtscher, P. Refractive index mismatch and monomer reactivity influence composite curing depth. J. Dent. Res. 2008, 87, 84–88. [Google Scholar] [CrossRef] [Scilit]
- Kolb, C.; Gumpert, K.; Wolter, H.; Sextl, G. Highly translucent dental resin composites through refractive index adaption using zirconium dioxide nanoparticles and organic functionalization. Dent. Mater. 2020, 36, 1332–1342. [Google Scholar] [CrossRef] [Scilit]
- Yamaguchi, S.; Karaer, O.; Lee, C.; Sakai, T.; Imazato, S. Color-matching ability of resin composites incorporating supra-nano spherical filler producing structural color. Dent. Mater. 2021, 37, e269–e275. [Google Scholar] [CrossRef] [Scilit]
- Beolchi, R.S.; Mehta, D.; Pelissier, B.; Gênova, L.A.; Freitas, A.Z.; Bhandi, S.H. Influence of filler composition on the refractive index of four different enamel shades of composite resins. J. Contemp. Dent. Pract. 2021, 22, 557–561. [Google Scholar] [CrossRef] [Scilit]
- Meng, Z.; Yao, X.S.; Yao, H.; Liang, Y.; Liu, T.; Li, Y.; Wang, G.; Lan, S. Measurement of the refractive index of human teeth by optical coherence tomography. J. Biomed. Opt. 2009, 14, 034010. [Google Scholar] [CrossRef] [Scilit]
- Hariri, I.; Sadr, A.; Shimada, Y.; Tagami, J.; Sumi, Y. Effects of structural orientation of enamel and dentine on light attenuation and local refractive index: An optical coherence tomography study. J. Dent. 2012, 40, 387–396. [Google Scholar] [CrossRef] [Scilit]
- Tomlins, P.H.; Palin, W.M.; Shortall, A.C.; Wang, R.K. Time-resolved simultaneous measurement of group index and physical thickness during photopolymerization of resin-based dental composite. J. Biomed. Opt. 2007, 12, 014020. [Google Scholar] [CrossRef] [Scilit][Green Version]
- ISO/CIE 11664-4:2019; Colorimetry—Part 4: CIE 1976 L*a*b* Colour Space. ISO: Geneva, Switzerland, 2019.
- Lucena, C.; Ruiz-Lopez, J.; Pulgar, R.; Della Bona, A.; Perez, M.M. Optical behavior of one-shaded resin-based composites. Dent. Mater. 2021, 37, 840–848. [Google Scholar] [CrossRef] [Scilit]
- ISO/CIE 11664-6:2022; Colorimetry—Part 6: CIEDE2000 Colour-Difference Formula. ISO: Geneva, Switzerland, 2022.
- Lopez, C.; Nizami, B.; Robles, A.; Gummadi, S.; Lawson, N.C. Correlation between dental composite filler percentage and strength, modulus, shrinkage stress, translucency, depth of cure and radiopacity. Materials 2024, 17, 3901. [Google Scholar] [CrossRef] [Scilit]
- Özdemir, B.; Kurucu Karadeniz, B.K.; Özdemir, S.B.; Akbulut, Ö. How the translucency and color stability of single-shade universal resin composites are affected by coffee? Curr. Res. Dent. Sci. 2024, 34, 270–275. [Google Scholar] [CrossRef] [Scilit]
- Sari, C.; Aydemir Aydın, E. Impact of water absorption on the translucency of single-shade and conventional resin composites: An in vitro comparative study. Odontology 2026, Online ahead of print. [Google Scholar] [CrossRef] [Scilit]
- Forabosco, E.; Josic, U.; Consolo, U.; Generali, L.; D’Alessandro, C.; Breschi, L.; Checchi, V. Color match of single-shade versus multi-shade resin composites: A systematic review with meta-analysis. J. Esthet. Restor. Dent. 2025, 37, 1443–1451. [Google Scholar] [CrossRef] [Scilit]
- Koi, K.; Amaya-Pajares, S.P.; Kawashima, S.; Arora, G.; Ferracane, J.; Watanabe, H. The color-matching ability of single-shade universal composites in extracted human teeth. J. Esthet. Restor. Dent. 2025, 37, 456–464. [Google Scholar] [CrossRef] [Scilit]

Disclaimer/Publisher’s Note: The statements, opinions and data contained in all publications are solely those of the individual author(s) and contributor(s) and not of MDPI and/or the editor(s). MDPI and/or the editor(s) disclaim responsibility for any injury to people or property resulting from any ideas, methods, instructions or products referred to in the content. |
© 2026 by the authors. Licensee MDPI, Basel, Switzerland. This article is an open access article distributed under the terms and conditions of the Creative Commons Attribution (CC BY) license.