


Abstract
The SENDER (Sustainable Consumer Engagement and Demand Response) project aims to develop an innovative interface that engages energy consumers in Demand Response (DR) programs by developing new technologies to predict energy consumption, enhance market flexibility, and manage the exploitation of Renewable Energy Sources (RES). The current paper presents a replication study for consumer Digital Twins (DTs) that simulate energy consumption patterns and occupancy behaviors in various households across three pilot sites (Austria, Spain, Finland) based on six-month historical and real-time data related to loads, sensors, and relevant details for every household. Due to data limitations and inhomogeneity, we conducted a replication analysis focusing only on Austria and Spain, where available data regarding power and motion alarm sensors were sufficient, leading to a replication scenario by gradually increasing the number of households. In addition to limited data and short time of measurements, other challenges faced included inconsistencies in sensor installations and limited information on occupancy. In order to ensure reliable results, data was filtered, and households with common characteristics were grouped together to improve accuracy and consistency in DT modeling. Finally, it was concluded that a successful replication procedure requires sufficient continuous, frequent, and homogeneous data, along with its validation.
1. Introduction
To meet growing energy needs driven by population growth, economic development, and changing consumption patterns, governments and global organizations are constantly working to find solutions. With energy demand expected to increase by approximately 40% between 2006 and 2030, the importance of sustainable strategies is obvious [1]. Increased consumption often leads to environmental problems, so the need for both environmentally friendly energy sources and efficient resource management is evident.
Public dissatisfaction with rising energy consumption, combined with growing energy needs, has prompted many industries in various countries to encourage the creation of renewable energy alternatives. Industries worldwide account for over 27% of total energy consumption and have often faced public criticism during energy crises [2]. Optimizing energy consumption is becoming a vital strategy, alongside approaches such as demand management and collaborative planning [3]. Significant improvements in the way energy is produced, transported, utilized, and distributed are involved in the transition to new energy sources, resulting in a considerable positive impact on the environment. This transition requires creativity on the part of governments, individuals, and businesses, as well as the ability to manage a process of change that is sensitive to politics [4].
The energy sector currently faces several challenges related to energy efficiency, long-term sustainability, and reliable energy supply [5]. In addition to the increase in global electricity demand and efforts to mitigate carbon dioxide emissions, the urgent need to identify and implement new strategies to enhance the operational efficiency of existing energy-related facilities is a high priority, as is the need to develop comprehensive roadmaps for future development [6]. In this context, the integration of digital technologies is one way of addressing these systemic issues, with the example of Digital Twin (DT) emerging as a promising solution [7], especially when applied to repeatable studies at multiple pilot sites to validate its effectiveness under different conditions.
A DT model creates an accurate representation of real-world conditions by using data from sensors, machines, and various devices [8,9], facilitating real-time monitoring, simulation, and optimization. This system incorporates advanced technologies such as the Internet of Things (IoT), artificial intelligence (AI), machine learning, cloud computing, and edge computing. These technologies enable the collection and analysis of data from the physical entity, providing information for better strategic decisions and performance optimization [10,11,12].
Shafto et al. [13] originally developed DTs for the virtual representation of NASA equipment, and they quickly gained wide acceptance and utility. Currently, DT-based decisions are used in numerous domains, including manufacturing, logistics, healthcare, automotive, energy, and smart cities [10,14,15].
The concept extends beyond basic data collection and includes the interaction of people, processes, and technologies to achieve optimal results, as shown in the example of the Digital Twin of a Digital World (DTDW) framework. DTDW incorporates process mining, experience mining, data mining, and simulation to optimize business processes [16]. Briefly, DT technology marks a significant step forward in the seamless integration of physical and virtual systems, promoting innovation and efficiency across various industries.
Currently, for the energy sector, this technology is mainly used in microgrid [17,18] and large-scale solar energy systems [19], offering opportunities for both proactive and predictive resource management. The growing global interest in DTs is reflected in the geographical spread of scientific publications. This technological development is receiving considerable global attention, as reflected in the geographical distribution of DT research in the energy sector [20]. Several countries have contributed significantly to the research on DTs, indicating a global effort to promote the energy transition through the use of these innovative technologies.
Smart energy systems are becoming a feasible solution thanks to the combination of DTs and AI. AI applications using machine learning and deep learning, analyze data from electricity generation to predict failures, improve energy efficiency, and enhance decision-making [21,22]. When these technologies are combined, they address important issues such as the variable nature of RES and how to effectively integrate them into electricity grids. However, challenges remain for these technologies, such as data security, significant implementation costs, and the ability to operate across different systems within the energy sector [22].
Besides the simplification of operations, DTs allow for the modeling of innovative ideas and the evaluation of the impact of strategic decisions. They also encourage environmentally friendly practices, effectively accelerating the energy transition through faster development of RES and improved resource management through technologically advanced, algorithmic feedback loops [17,23,24].
To ensure that DT models can reliably reproduce system behavior in a variety of pilot locations, particularly when addressing issues related to data diversity and inconsistency, it is vital to integrate simulation, machine learning, big data, cloud computing, and Internet of Things (IoT) [25]. In replication studies, DTs can forecast energy consumption and supply under varying conditions to evaluate model reliability across different pilot sites. Ghenai et al. [26] reviewed recent developments in DT applications for energy systems, concluding that progress in machine learning, AI, and control systems encourages the development of DT technologies and their validation across different pilot sites.
DTs are promising for the simulation of the thermal performance of smart homes, since they allow the prediction of temperature fluctuations and the evaluation of different control methods [27]. It should be noted that the application of DTs for temperature management in smart homes is still in a preliminary phase, especially when considering the use of more advanced analytical tools such as neural networks [28].
Corssac and Wickboldt [29] presented two different applications to show the way a bi-directional connection between a home and its DT can provide homeowners with simulation-based analysis and automation. The first highlighted the DT’s ability to answer questions, acting as an energy consumption monitoring system for a home, providing people with a better picture of their habits, and encouraging them to use energy more efficiently. The second application highlighted the predictive capability of the concept. It determined the best time to turn on the heating in a room, ensuring that the indoor temperature will reach the desired level at a specific time, based on simulation data that predicts the heating of the space, effectively increasing the thermal comfort of users.
Bouchabou et al. [30] presented a DT framework that showed significant progress in observing and interpreting daily actions in a smart home. By developing an integrated virtual model of the physical environment, the model effectively monitored and evaluated various activities, improving the detection and understanding of occupant behaviors. Their method greatly enhanced the system’s ability to distinguish between different types of daily activities, resulting in more accurate and reliable monitoring. The integration of the DT ensured that the system could effectively assist and adapt to the changing requirements of residents. It was concluded that the DT framework proved to be a significant advantage in improving activity recognition and providing enhanced support for daily living tasks in smart homes.
Teng et al. [31] introduced a new method for managing real-time temperature in smart homes by combining DTs and neural networks, utilizing ZigBee wireless sensor networks. Their system continually observed and evaluated environmental information gathered from strategically located Xbee S2 modules within a smart home, enabling adaptable temperature control through an intelligent management system. A DT of the smart home was developed to simulate and forecast temperature changes based on real-time data, while a neural network model refined the control methods to sustain ideal thermal comfort. The findings indicate that the integrated system significantly improves the effectiveness of temperature regulation, resulting in a more stable indoor environment. Furthermore, the energy usage for heating and cooling was lowered by 8.05%, emphasizing the system’s capacity for energy conservation.
As the European Union moves towards a more sustainable future, active consumer participation is a key part of the energy transition. The SENDER (Sustainable Consumer Engagement and Demand Response) project [32] puts consumers at the heart of the energy sector by developing an innovative interface to achieve proactive Demand Response (DR) and optimize the use of Renewable Energy Sources (RES). For this purpose, consumer behaviors and actions within households were monitored, enabling the forecast of energy consumption and supply, leading to higher energy efficiency, lower costs, and more sustainable lifestyles.
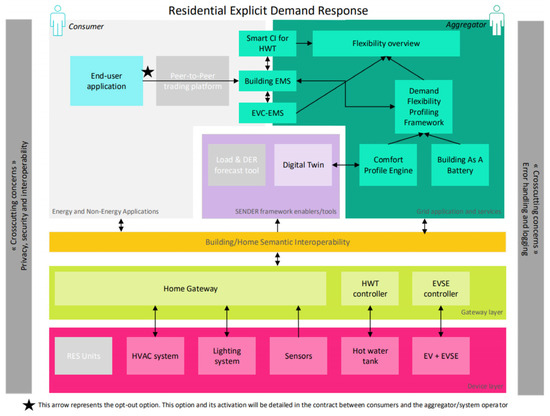
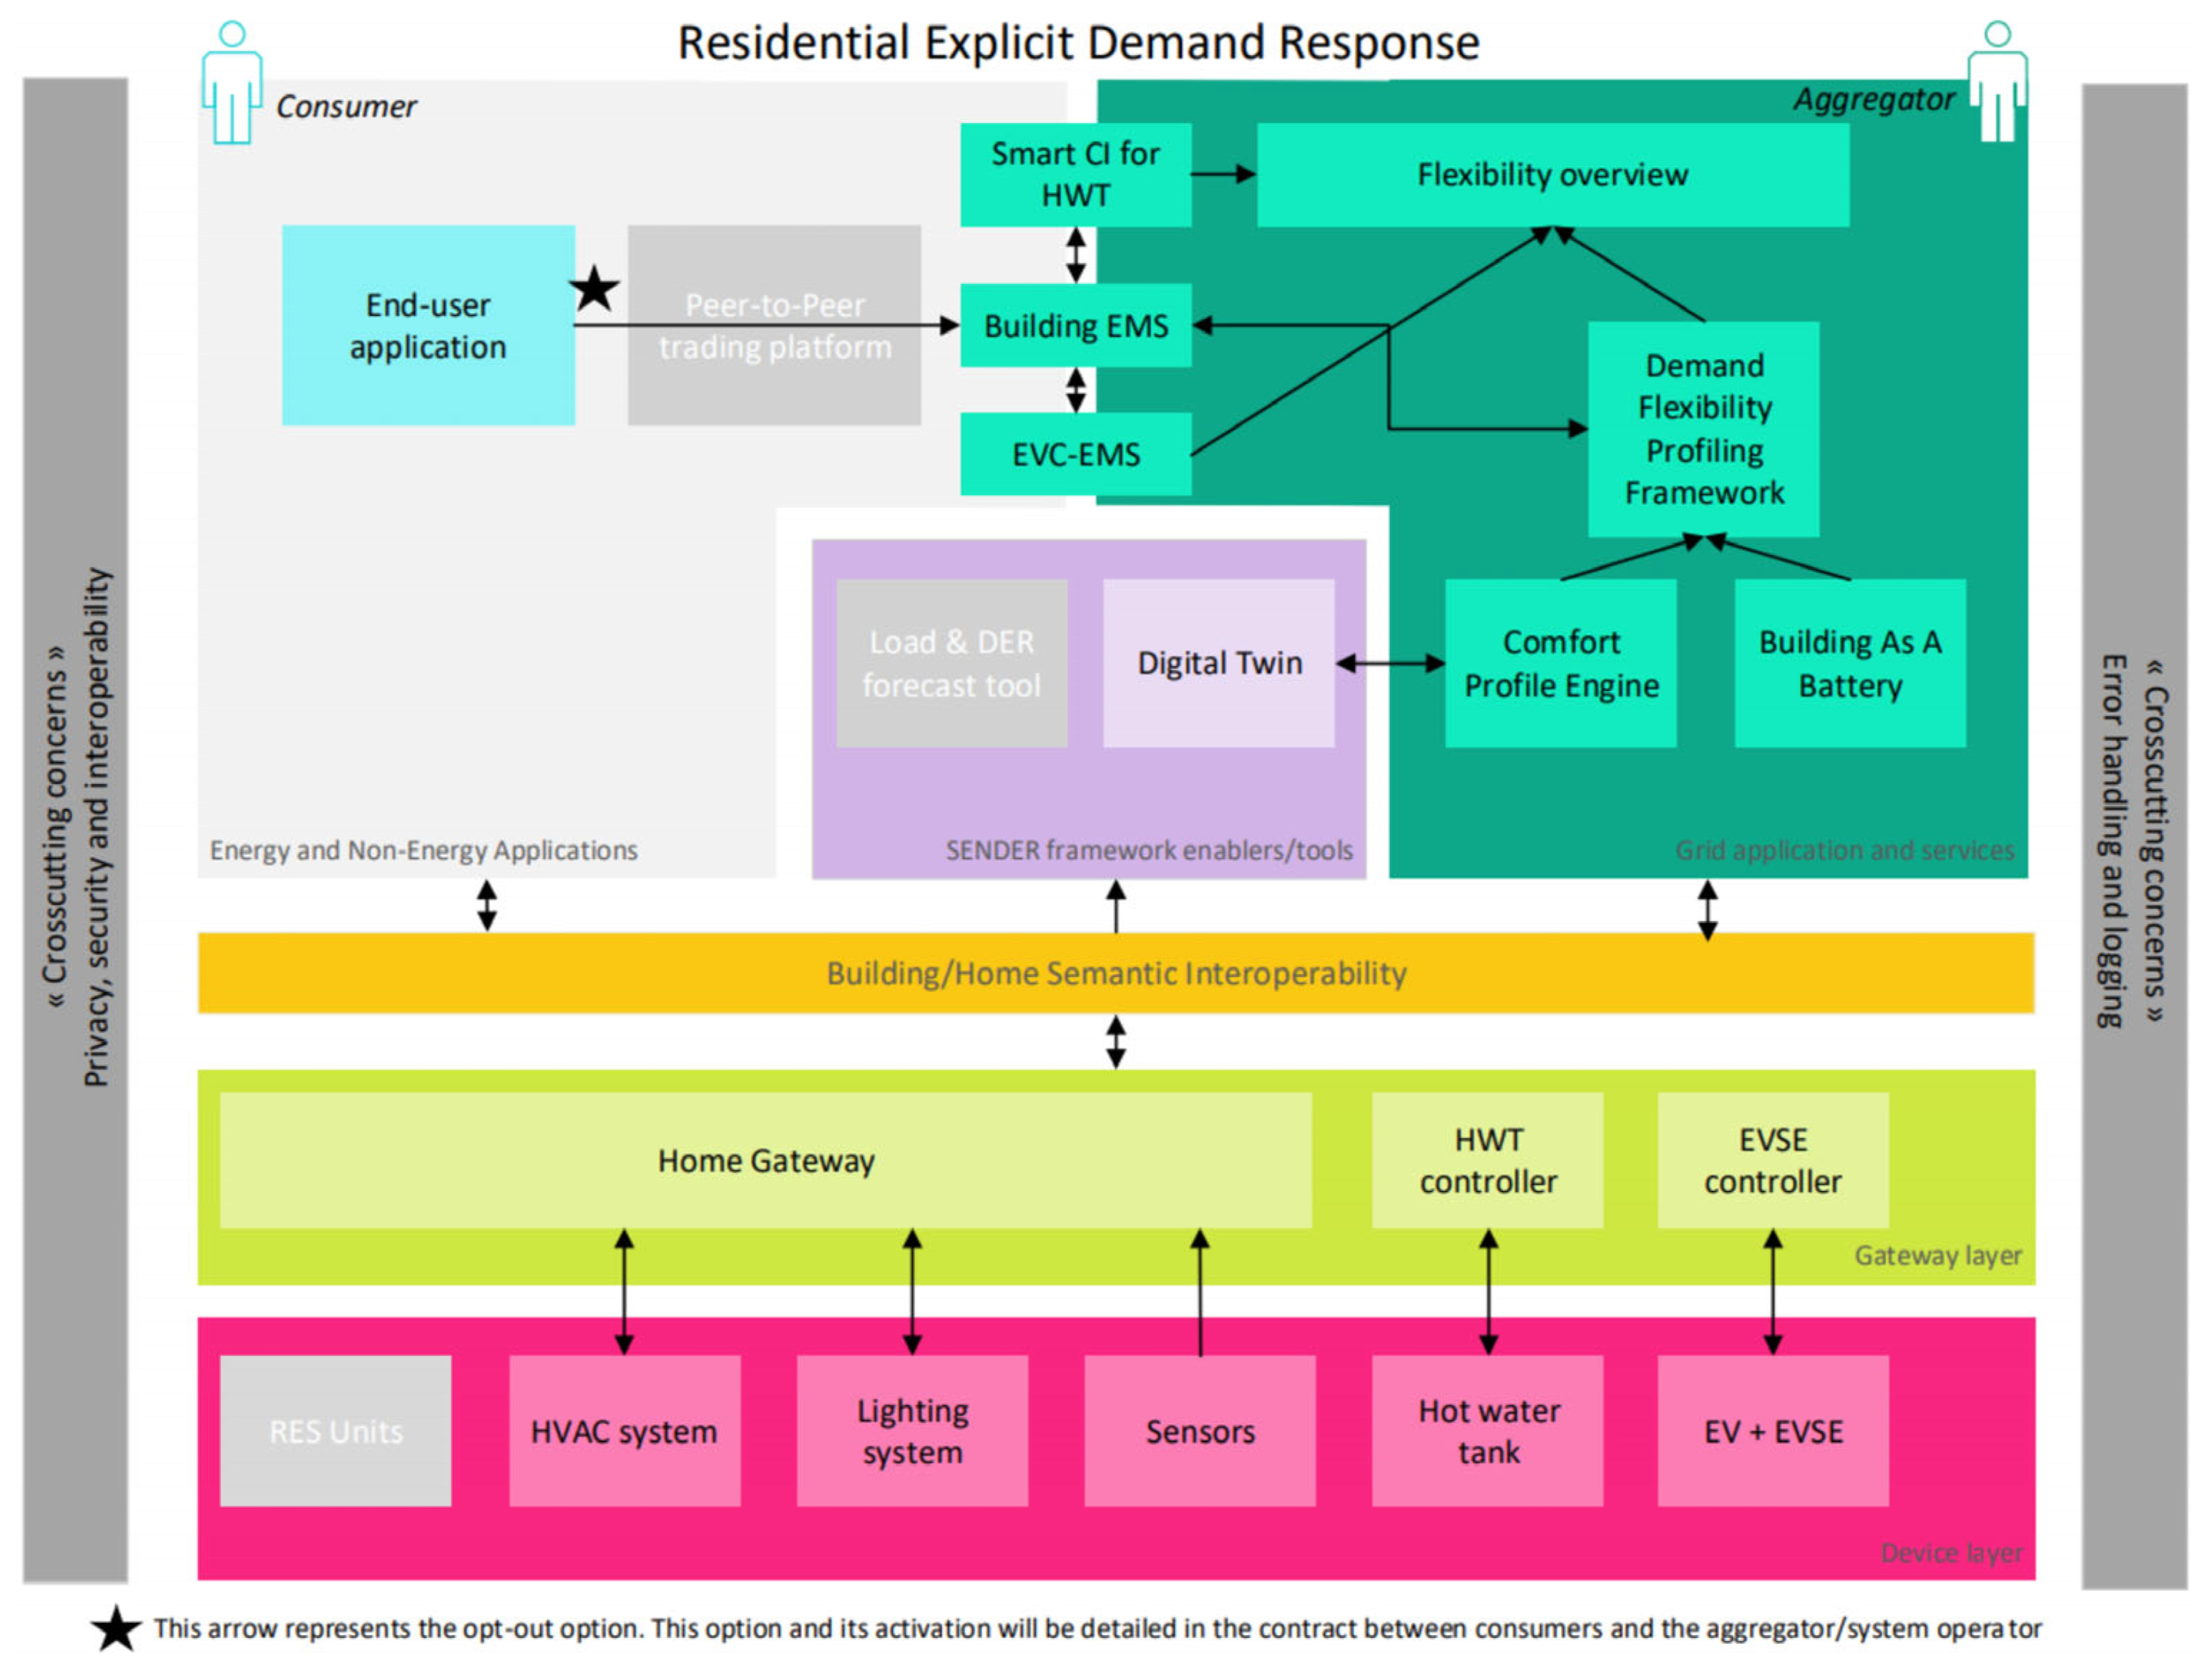
The SENDER project [33] is architecturally structured to incorporate several key innovations and solutions, such as virtual thermal energy storage, a smart SENDER box, dynamic user and demand flexibility profiles, DT, a smart energy management system (EMS), and peer-to-peer trading, in a technically efficient way, taking into account the project context. Figure 1 describes the general architecture of the SENDER system. The SENDER architecture includes (i) two main stakeholders, the Consumer and the Aggregator; (ii) crosscutting concerns at every layer to address requirements of data protection and security, as well as internal and external interoperability; (iii) Consumer Digital Twin and the Load and Distributed Energy Resource (DER) Forecasting tool, at the center of the architecture, positioned as the core elements to enable proactive demand-response services—the primary objective of SENDER.
Figure 1.
The SENDER solution and modules [33].
This study, which is part of the SENDER project [32], investigates the replication of consumer DT models, using pilot data from Austria, Spain, and Finland, to evaluate the DT model’s applicability across different regions. For the replication, historical and real-time data for six months were used, focused mainly on Austria and Spain, due to data availability and sensor reliability. The findings suggest that reliable DT replication depends on the availability of continuous, homogeneous data and its proper validation.
In terms of the technical part of the SENDER project, the development and implementation of a consumer DT for energy demand prediction was crucial. To achieve this, real-time and historical data was collected and processed from three different pilot sites in Austria, Spain, and Finland. The DT was designed to support a replication study based on these pilots, making it possible to be expanded to other regions for a better understanding of energy consumption patterns and occupant behaviors, resulting in reduced overall energy consumption.
2. State of the Art
2.1. Digital Twins: Conceptual Background
The idea of the DT first appeared in product lifecycle management as a way of digitally representing a physical asset and keeping it aligned with its real-world counterpart over time [34]. Subsequent work on cyber-physical systems expanded on this view, focusing on the way in which real-time data can be integrated into simulation and analysis tools to enable tasks such as system monitoring and predictive analytics [3,35,36]. Overall, DTs are treated as developing entities that depend on data rather than as static simulation models.
Further studies suggest that there is currently no widely accepted definition of DTs. As a result, the application of DTs across various sectors results in notable differences [37]. More specifically, DTs are often treated in the construction sector as equivalent to building information models (BIM) or advanced simulation tools, despite significant conceptual differences.
2.2. Digital Twins in Building Energy Systems
Regarding the building sector, DTs have mainly been studied in relation to energy consumption, operational performance, and long-term facility management. Boje et al. [38] analyzed the evolution from BIM to construction DT, emphasizing that traditional BIM systems, although useful for design and construction, are limited in terms of dynamic data management, automation, and interoperability. The introduction of DT enables a comprehensive, real-time connection between the physical and digital worlds, integrating sensors, IoT, AI, and big data, with the aim of smart construction and improved building lifecycle management. By this approach, costs would be reduced and construction sustainability would increase, while the environmental footprint would decrease.
Cespedes-Cubides and Jradi [39] examined the application of DTs in the operation and maintenance of existing buildings, emphasizing the improvement of energy efficiency through monitoring, fault detection, operation optimization, and predictive maintenance. They concluded that despite the savings in costs and building performance, DT implementation is limited by its dependence on BIM, the quality of existing data, and the complexity of integrating various systems. They proposed for future research the development of BIM-independent methods, the use of AI/machine learning, and the evaluation of the economic and environmental value of DTs throughout the life cycle of buildings.
Arsecularatne et al. [40] reviewed the ways in which DT technology can improve energy management and user behavior in buildings through virtual replicas that enable real-time monitoring, predictive maintenance, and decision support to reduce energy consumption and improve comfort. Their study highlighted key barriers to DT implementation, such as compatibility, data quality, and physical–digital process integration issues, and emphasizes the need for standardized frameworks, enhanced security, and the incorporation of user behavior into models.
Sghiri et al. [41] presented a systematic review of how DTs can enhance the energy efficiency of buildings through real-time monitoring, predictive modeling, integration of RES, and preventive maintenance, focusing on the technologies that support them, such as IoT, BIM, and AI. The main barriers to implementing this technology include issues of interoperability, scalability, and data protection, as well as limited adoption in the building sector compared to other industries. The article highlighted the need for future research to promote standards, integrated solutions, and accelerate the use of DTs for sustainable and smart energy management in buildings.
Boukaf et al. [42] evaluated the use of DTs to predict energy consumption in buildings, focusing on applications such as total consumption prediction; Heating, Ventilation, and Air-Conditioning (HVAC) performance; and comfort and air quality improvement. Key advantages include real-time monitoring, decision support, and energy efficiency optimization, while challenges related to data quality, quantity, and data protection, as well as scalability and integration issues in large-scale models. The authors recommended further research into independent data collection methods, leveraging AI/edge computing, enhancing interoperability, and developing scalable computing infrastructures to improve the accuracy and effectiveness of DTs.
Ghaemi et al. [43] investigated the combined use of AI and DTs in commercial and residential buildings, with an emphasis on autonomous systems that are capable of learning from user behavior, optimizing energy efficiency in real time, and integrating with other building systems. Their findings showed significant progress in the implementation of DTs and highlighted the potential of AI-driven optimization for comfort, efficiency, and sustainability. They suggested future research into standardizing data protocols, integrating a common ontological framework, human-centered models, and circular economy strategies to fully leverage the potential of AI-enhanced DTs.
Han et al. [44] presented a DT platform for a university educational building that integrates IoT sensors, environmental data, and monitoring, with the aim of predicting electricity consumption and optimizing energy management. They compared various machine learning models (e.g., back-propagation neural network, support vector model, multiple linear regression) for predicting energy consumption, with the back-propagation neural network showing the highest accuracy. The application of this approach helps to manage energy supply and reduce energy waste, contributing to the creation of more energy-efficient building systems.
Hodavand et al. [45] proposed a comprehensive DT framework for intelligent monitoring and fault detection in multi-zone building spaces, using IoT sensors and machine learning models to predict short-term and long-term indoor conditions. The proposed framework combined real-time data, robust processing, and modern prediction and detection techniques to improve the operational performance, fault prevention, and energy efficiency of building systems. The proposed model was validated in a real educational building with one year of data, demonstrating high reliability in predictions and practical application for modern smart building management needs.
Iqbal and Mirzabeigi [46] presented a DT framework that combines BIM and IoT sensors to optimize thermal comfort in buildings, enabling real-time monitoring and control through a web environment. The proposed system utilizes a hybrid machine learning model to predict future indoor environmental parameters and improve indoor comfort through controlled HVAC decisions. They concluded that this approach increases energy efficiency and supports data-driven decision-making for building systems management.
Additionally, recent studies have highlighted the application of DTs for predictive maintenance and personalized occupant comfort. Xie et al. [47] proposed a DT-enabled fault detection and diagnosis process for HVAC systems, combining real-time sensor data with semantic web technologies to automate fault identification. Liu et al. [48] introduced a service-oriented DT framework for infrastructure operations and maintenance, addressing challenges such as data heterogeneity and interoperability while providing real-time, linked data for improved decision-making. Zhao et al. [49] demonstrated the use of DTs to monitor critical building systems, enabling the early detection of faults and timely maintenance actions.
2.3. Occupancy-Aware Modeling and Behavioral Integration
Previous studies have demonstrated the critical role of occupant presence and behavior in improving building energy efficiency, using unsupervised machine learning to identify operational inefficiencies [50]. Research shows that occupancy-aware HVAC control can achieve significant energy savings [51,52]. In addition, supervised learning techniques enable accurate energy consumption prediction and evaluation of efficiency measures in commercial buildings [53]. Furthermore, some other studies have used data mining techniques to analyze user behavior patterns, such as opening and closing windows in offices [54], highlighting the importance of incorporating human behavior into occupancy-aware models to optimize energy management. Combining unsupervised and occupancy-aware supervised approaches supports more effective energy management and optimization of Building Energy Management Systems (BEMS).
Anan et al. [55] described a model that combines energy time-series data and occupancy information to predict energy consumption in a smart office building, using data collected every minute from a real building. The integration of user behavior into the prediction improves the accuracy of both hourly and daily energy forecasts, which can enhance energy management and efficiency. The model is validated with metrics such as mean absolute error, mean absolute percentage error, and root mean square error, demonstrating the effectiveness of the approach for improved energy forecasts taking occupancy into account.
Mylonas et al. [56] systematically reviewed methods for modeling resident behavior in building environments, from simple statistical approaches to advanced machine learning and IoT-enhanced models, with the aim of reducing the gap between predicted and actual energy consumption. They highlighted the trend towards incorporating more realistic, data-driven occupant behavior models in energy performance simulations and the need for further integration of such models into integrated building management systems, particularly in energy performance certifications and standards. They concluded that an accurate representation of human behavior is critical for the reliable prediction and optimization of building energy performance.
A recent literature review by Reis et al. [57] summarizes occupant behavior modeling approaches in residential buildings, focusing on the integration of occupancy, presence, and adaptive behavior characteristics into energy, thermal comfort, and indoor air quality simulations. The analysis shows that current occupancy models are often simplified and highlights the need for more diverse, stochastic, and dynamic approaches that account for variety, uncertainty, and change in user behavior. Such methodologies can improve the accuracy of simulations and support more effective energy management tools, and although not directly addressing DTs, the study provides occupant behavior models that can be incorporated into DT frameworks for more realistic and reliable building performance predictions.
Moreover, Banfi et al. [58] provided an extensive review of occupant behavior modeling techniques at the building and urban environment level, highlighting the differences between static and dynamic occupancy profiles and their impact on energy simulations. Their analysis demonstrated the need to incorporate more realistic, stochastic, and context-aware models into energy performance simulations, supported by modern IoT data and modeling techniques. In summary, they pointed out that reliable representation of human behavior is critical for accurate energy use prediction and the development of energy management tools to support energy saving policies and strategies.
Furthermore, recent studies demonstrate the integration of DTs with occupancy-aware and comfort-focused modeling to enhance building energy management. Hosamo et al. [59] combined BIM, real-time sensor data, and occupant feedback within a DT framework to evaluate comfort levels and predict HVAC issues using Bayesian networks. Lee et al. [60] developed personalized thermal preference models that account for individual variability in metabolic rate, air speed, and clothing levels, improving prediction and control of indoor conditions. Feng et al. [61] compared data-driven methods such as decision trees, random forest, and neural networks for personal thermal comfort prediction, emphasizing the value of individual-specific data for optimized energy management. These DT-based occupant comfort frameworks complement existing occupancy-aware BEMS, allowing for more accurate, adaptive, and user-centered energy optimization strategies.
2.4. Research Gap and Positioning of This Work
A notable gap identified across the literature is that most models are developed and validated for a single building or pilot site under controlled conditions. This restricts their replicability, transferability, and generalization [44,45,46]. Additionally, reviews highlight that multi-building applications are still limited, and issues such as data quality, scalability, and integration further need broader adoption [40,41,42]. Table 1 summarizes representative studies, highlighting the limitations in replication and generalization across single-site DT applications.
Table 1.
Representative studies on DTs in buildings.
The present study under the SENDER project addresses this limitation by developing a consumer DT that has been developed and validated across heterogeneous pilot sites in Austria, Spain, and Finland. Real-time and historical energy consumption data allowed the DT to learn patterns across different residential environments. This multi-site approach demonstrates that replication, robustness, and transferability are achievable, providing a clear advancement compared to previous single-site case studies.
Despite progress in the field, several critical gaps remain in DT research for residential energy systems:
- The absence of standardized methods to validate DT models across heterogeneous sites;
- Limited quantitative validation of DT performance under realistic, variable data conditions;
- Current approaches often struggle to handle differences in data, sensors, and system compatibility, especially in large-scale deployments.
In response to these gaps, this work proposes a replication-oriented DT framework, tested with real pilot data from multiple residential sites. The results show that DT models can be applied reliably across different sites, offering insights into multi-site scalability and deployment that were previously missing in the literature.
3. Methodology
3.1. Data Collection and Pilot Overview
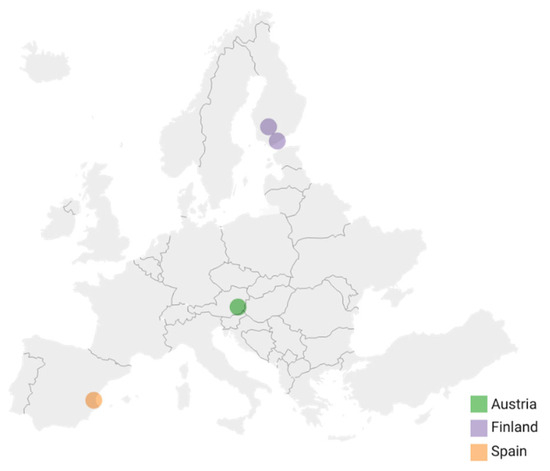
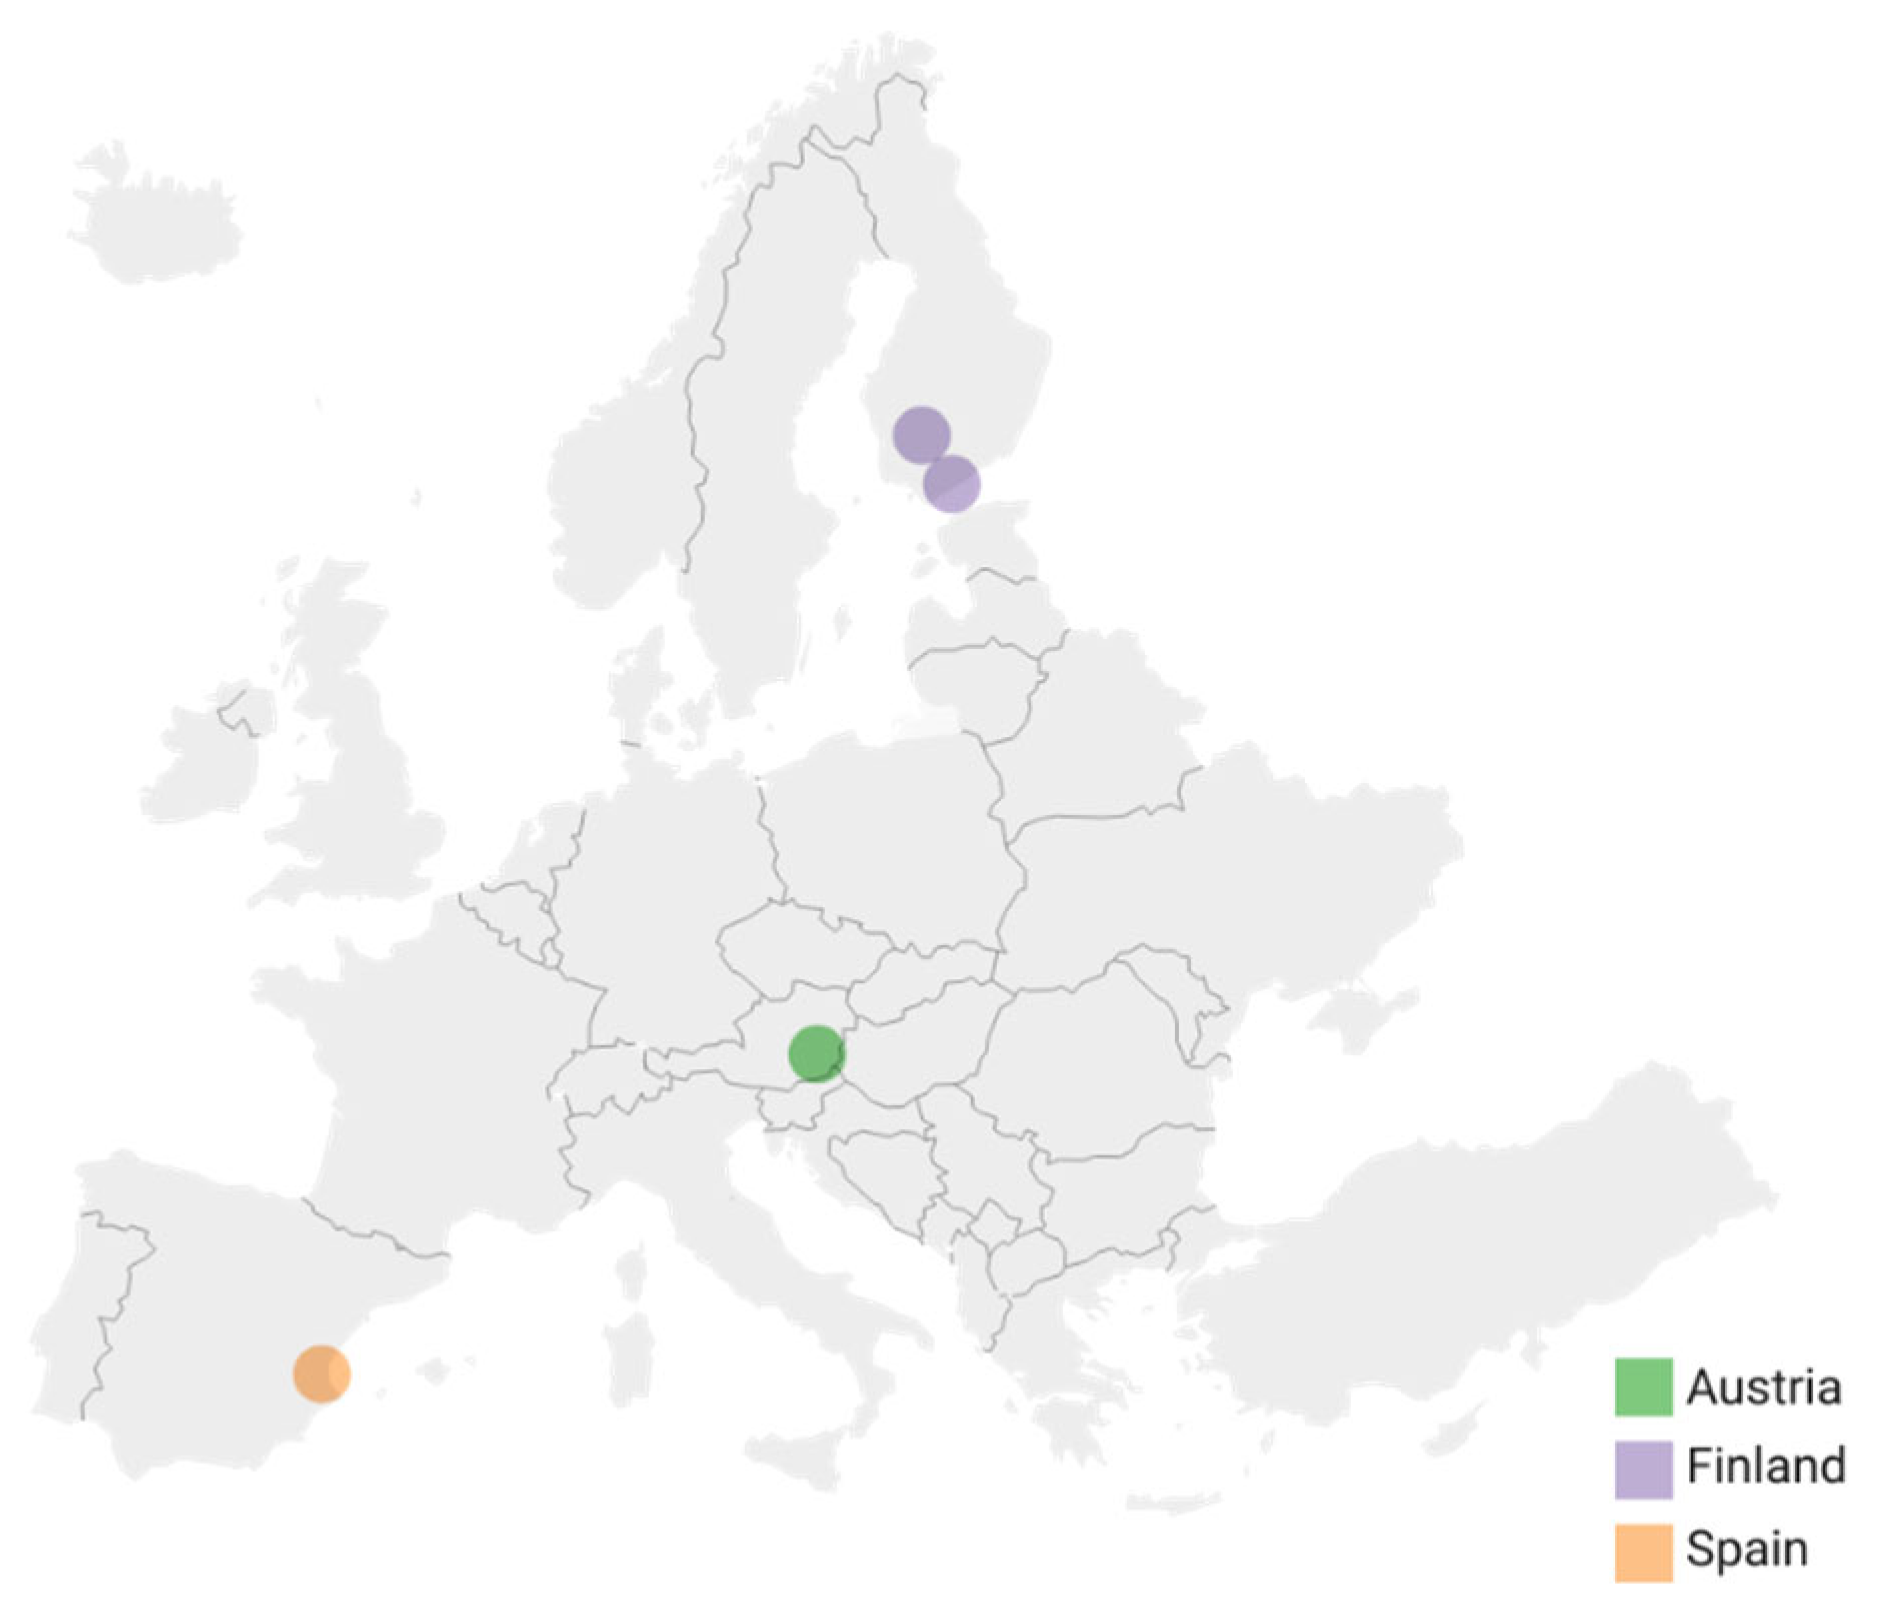
Data was collected from various households across three distinct pilot sites: Austria, Spain, and Finland, as depicted in Figure 2. Each pilot site is characterized by different environmental conditions and cultures, energy consumption patterns, and occupant behaviors, enabling the DT to perform accurately under varying environmental and social conditions.
Figure 2.
SENDER pilot sites.
The pilot data was retrieved from a database designed by Hypertech [62], which provides detailed information about energy and power loads, sensors, and other relevant attributes for each installed household across the three pilot sites. This data was accessed through a Representational State Transfer (REST) Application Programming Interface (API), developed to integrate with Hypertech Information Management Layer (IML) and to enable the access of the collected real-time and historical data from the SENDER pilot sites. The REST API provides user authentication, retrieval of prosumers and item configuration, and time-series data retrieval. Firstly, user authentication is achieved by delivering access tokens for secure service access. Secondly, static building configurations can be retrieved, including the household name, the residential classification, the rooms and zones within the specific building, and the loads and other relevant details, such as controllability. Thirdly, specific metrics are described, and hyperlinks for data retrieval are provided. Finally, time-series data can be retrieved based on parameters requested by the user.
The original plan was to include 400 households from Austria, Spain, and Finland and to collect consistent one-year data. After analyzing the pilot sites’ data, it was concluded that the measured total loads, which refer to Domestic Hot Water (DHW), Heating, Ventilating and Air-Conditioning (HVAC), photovoltaics (PVs), and total metering, were different among the three pilot sites during the specific period, as depicted in Table 2. Although Electric Vehicle (EV) charging infrastructure was initially included in the SENDER project plan, development constraints—including material availability, installation delays, and limited willingness to participate—meant no households were ultimately equipped with EV chargers during the data collection period covered by this study. As a result, EV-related measurements are not available in the Hypertech database used to develop the DT and are therefore not included in the measurements presented in Table 2. In general, Spain clearly has the most available data, while Austria has more limited data, and Finland has the least data, measuring the power and energy of the total metering. More specifically, it was shown that there were no PV measurements in Finland, and DHW data were only available in Spain. On the other hand, data was available for all pilot sites regarding power (W) and energy (kWh) total metering, as well as motion alarms and multisensors measuring temperature (°C), humidity (%), and luminance (lux).
Table 2.
Measurement differences between pilot sites.
These restrictions were mainly the result of shortages and price increases in electronic components due to the COVID-19 pandemic. In addition, several households that had registered to participate withdrew, and some necessary equipment was no longer available, leading to further installation delays and unexpected compatibility issues, while the Ever-Given ship incident in March 2021 caused further delays in the timely supply of essential equipment.
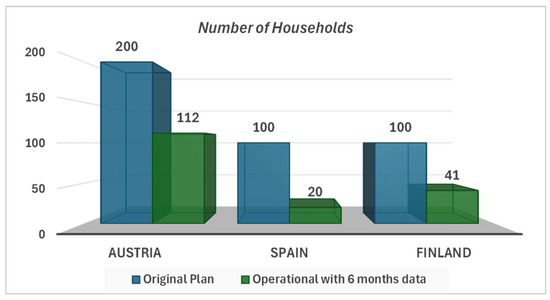
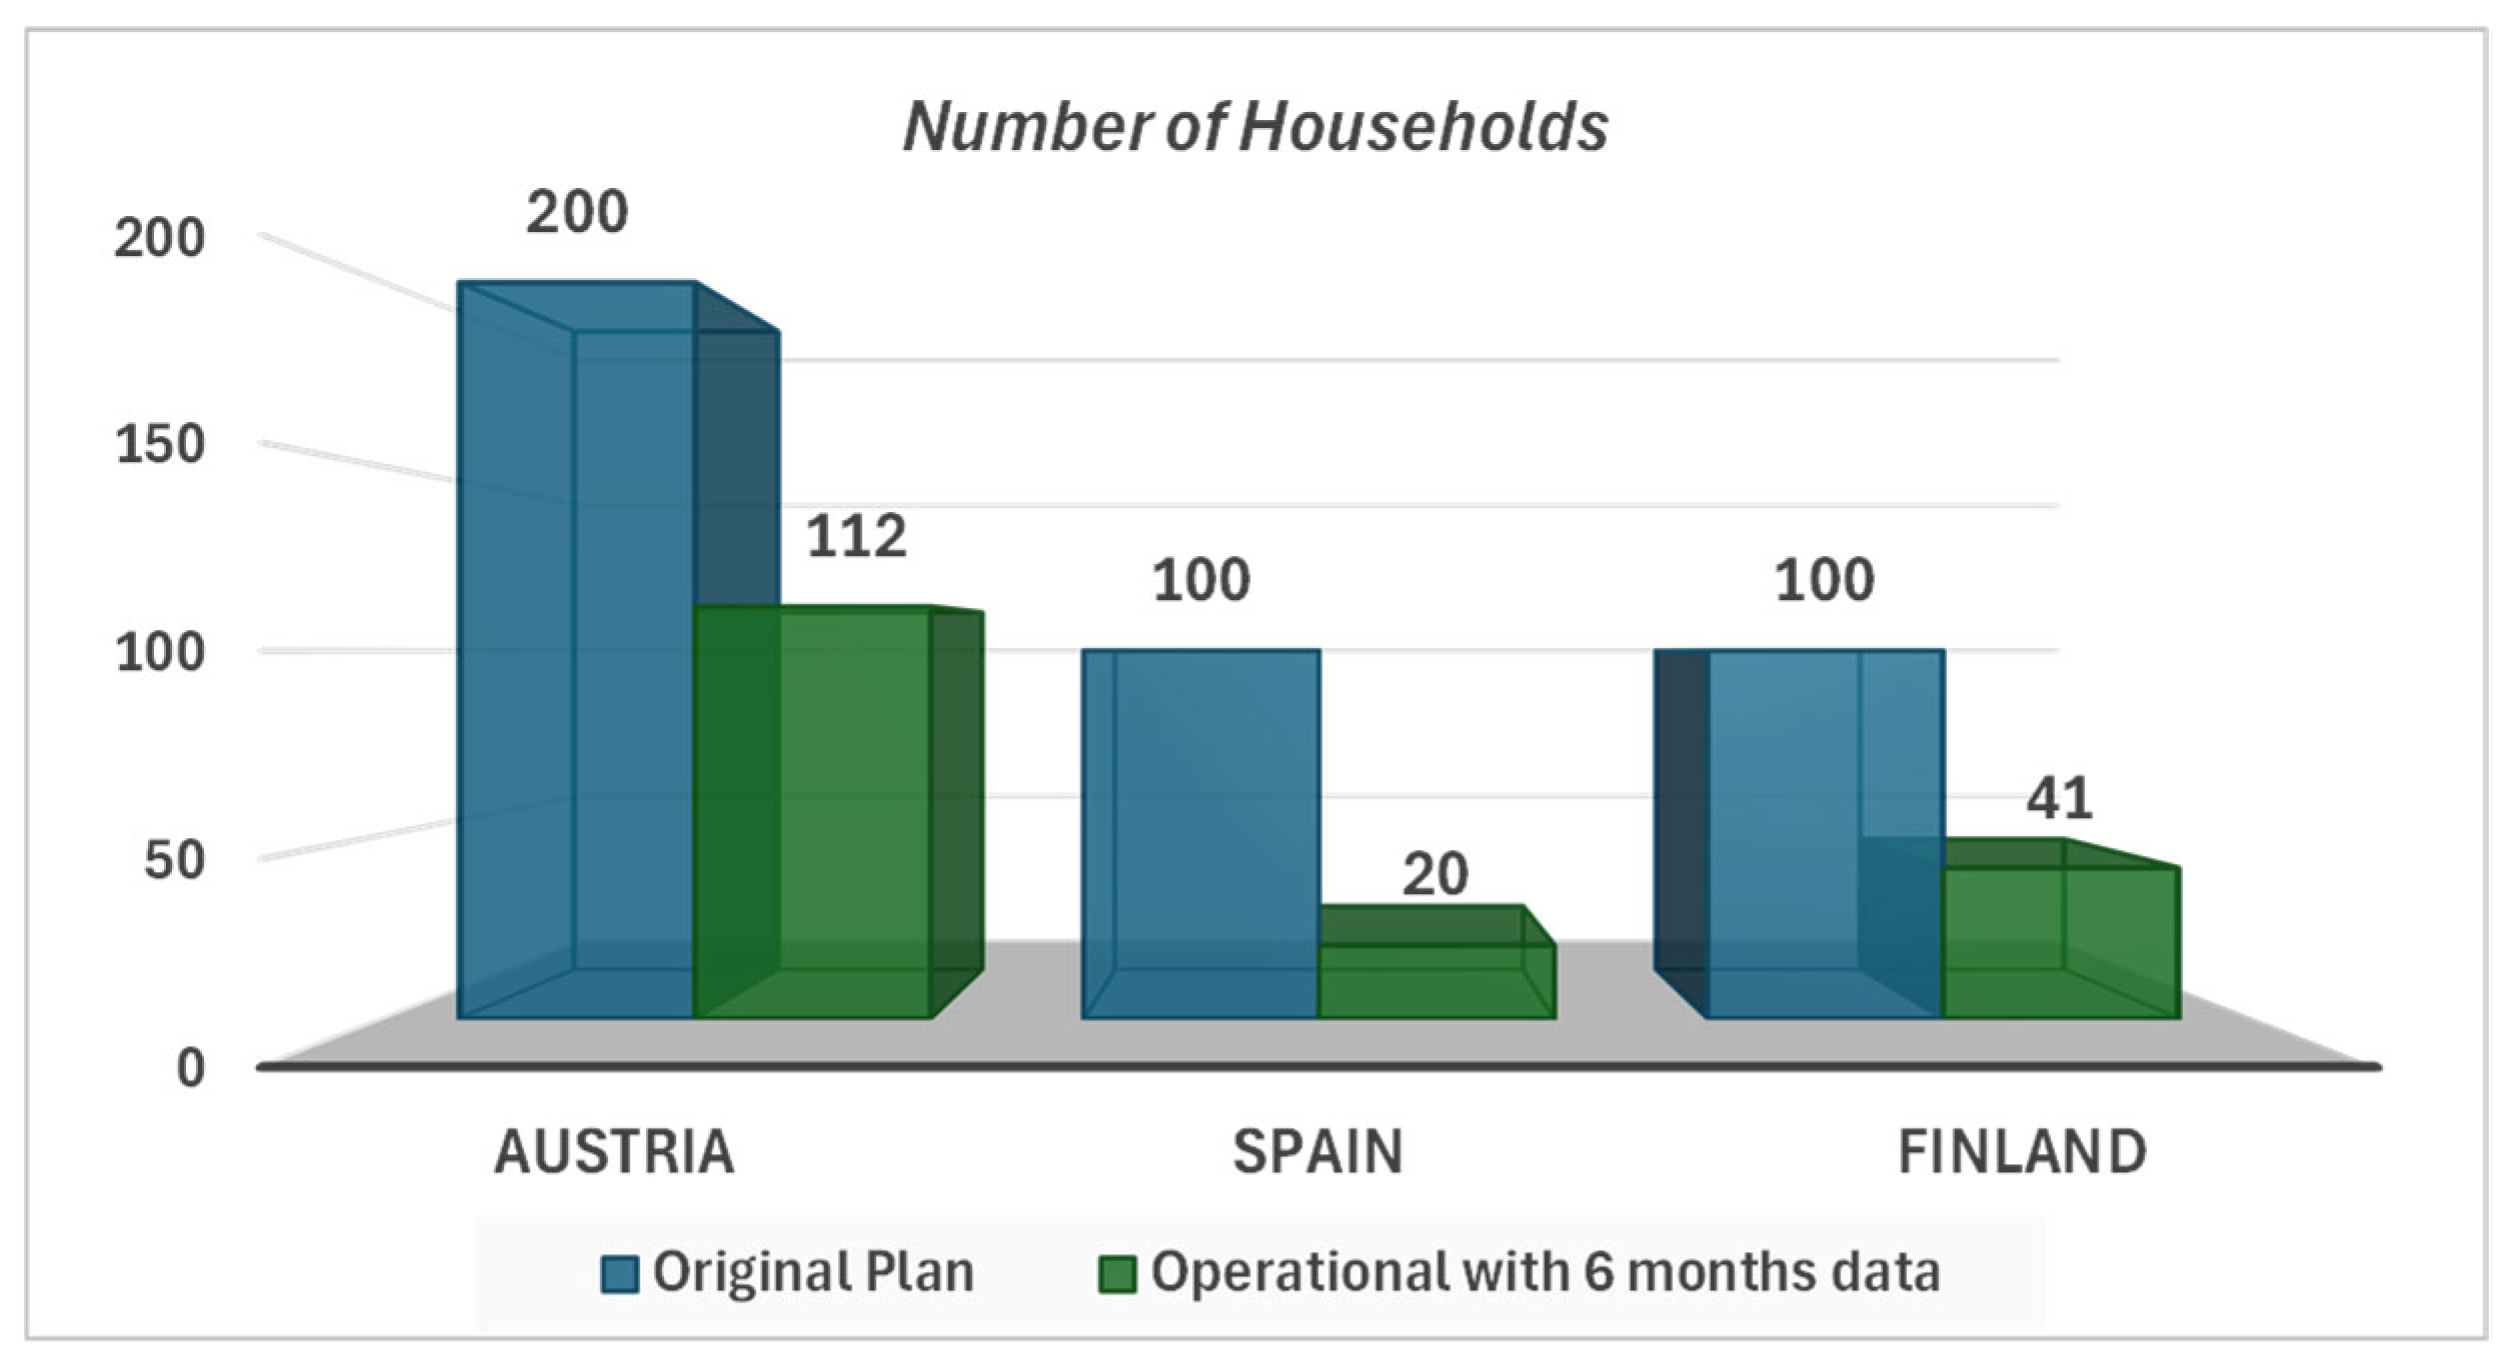
As a result, the original plan, which included one-year measurements from 200 households in Austria, 100 in Spain, and 100 in Finland, could not be fully implemented. Instead, the number of operational households was approximately half of the initially selected, and the measurements lacked homogeneity across the pilot sites. Furthermore, due to installation delays, the available pilot site data was chosen to cover at least 6 months of measurements instead of a year, focusing on just two seasons, mostly spring and summer. The chosen time period was between 1 April 2024 and 30 September 2024. Ultimately, the number of operational households with 6 months of data dropped to 173, as shown in Figure 3. Although not aligned with the original goal, the SENDER project offered the largest and most detailed dataset among the sister projects ACCEPT [63], HESTIA [64], iFLEX [65], and REDREAM [66].
Figure 3.
Original plan of number of households to be included in the study and number of operational households with 6 months data.
Notably, by the end of the SENDER project, more data was available as the number of operational households increased significantly. Nevertheless, it was decided to focus on a six-month period of data collection to develop the DT model, ensuring that there was sufficient time for data processing and analysis to continue with the development and training of the DT, given the approaching completion of the project. Selecting a shorter but more complete data set allowed for a more reliable implementation within the available time constraints.
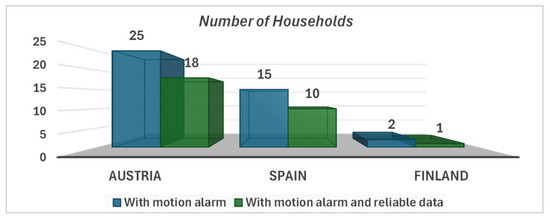
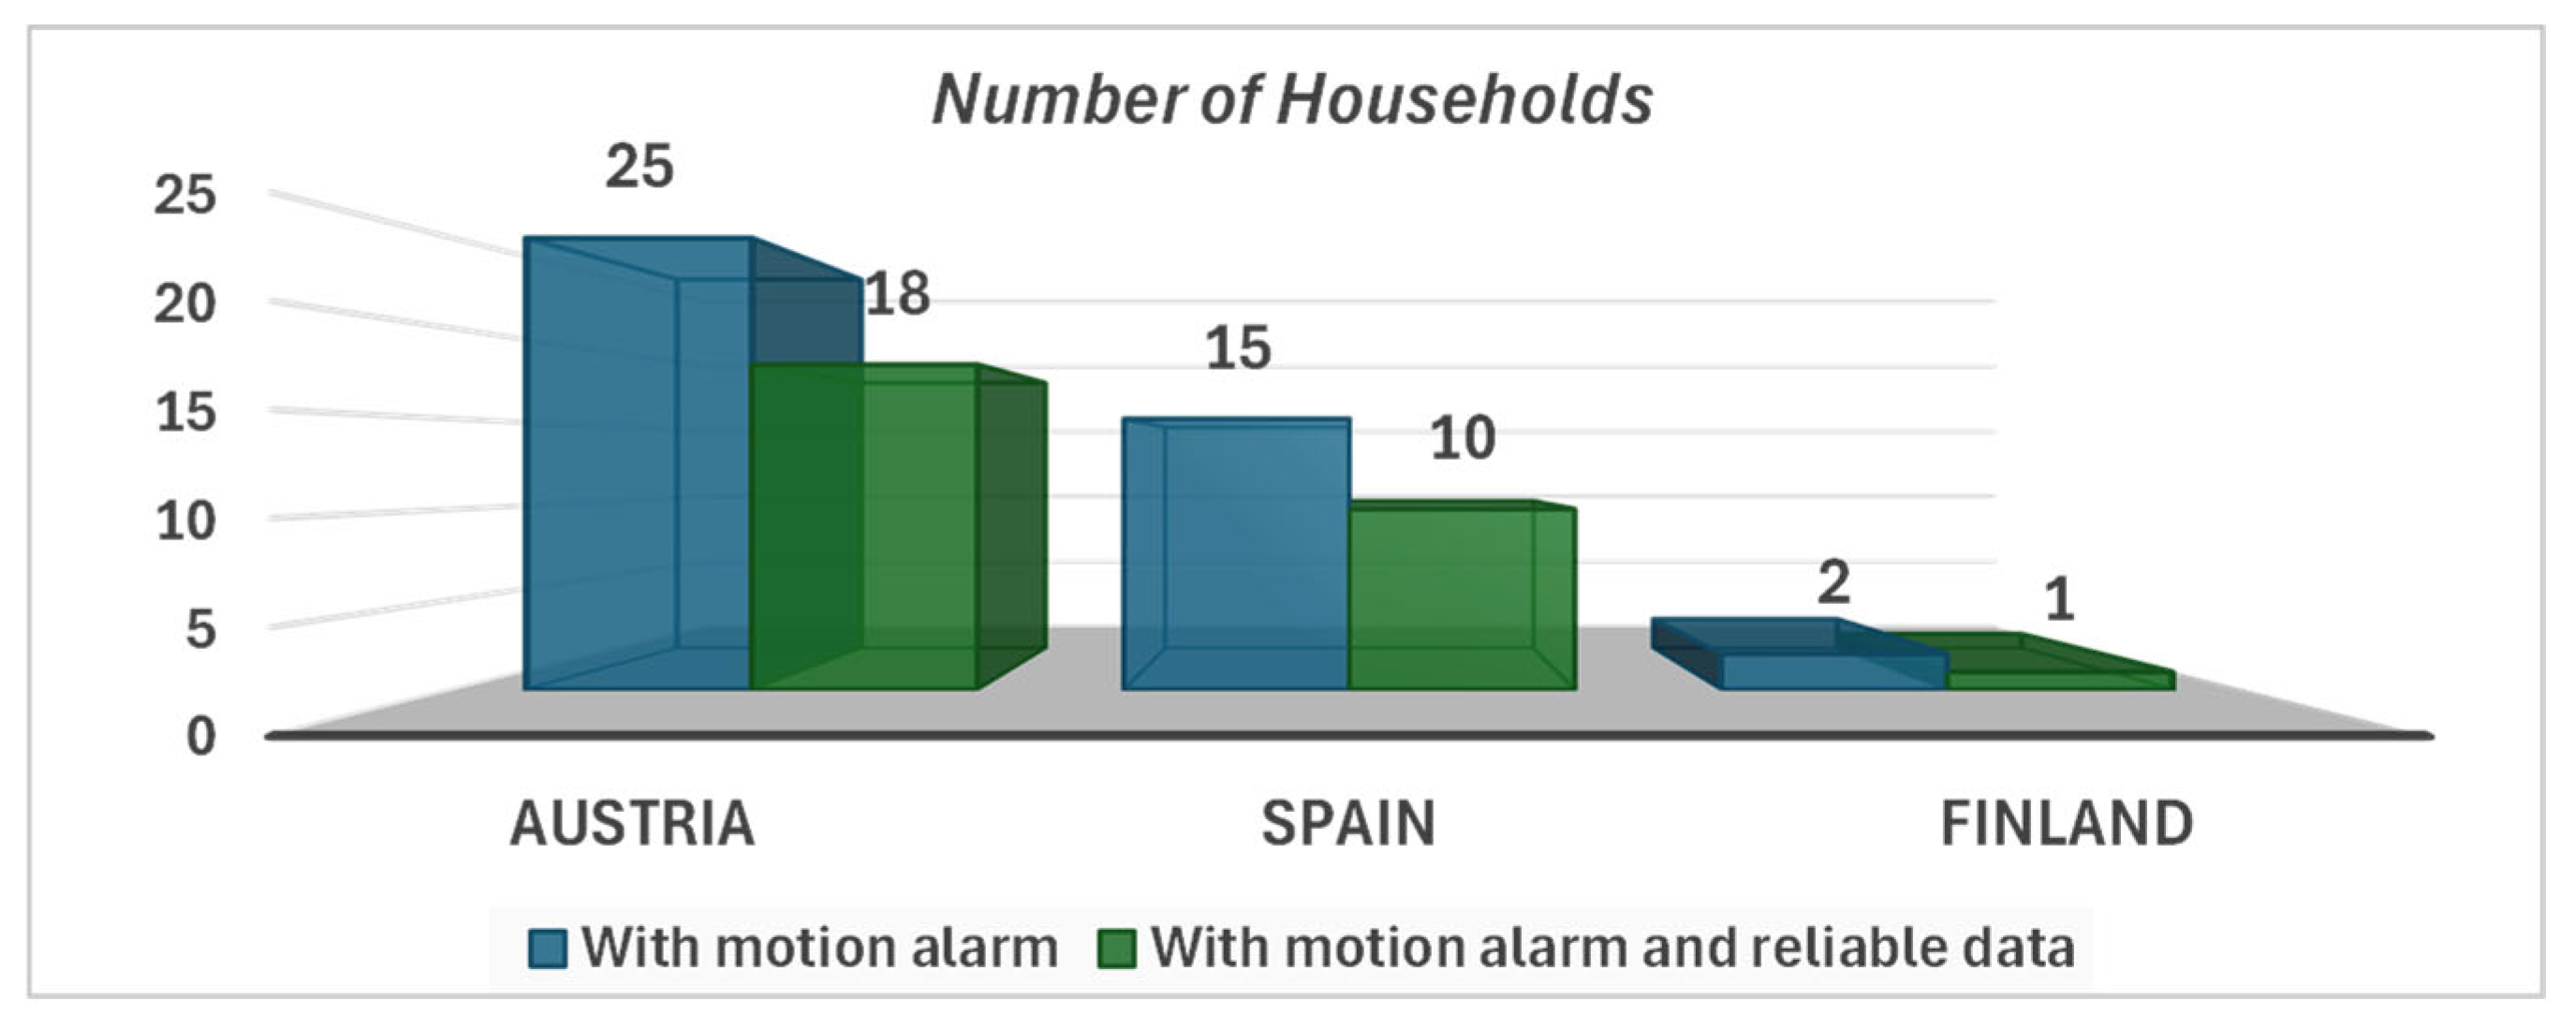
In addition, motion alarm sensors were installed instead of occupancy meters due to their availability and cost-effectiveness, negatively impacting the ability of the DT to correlate occupancy with consumption behaviors. Despite this limitation, motion alarms were essential for understanding occupant behaviors. Therefore, the number of selected operational households was further reduced to ensure that each household had at least one motion alarm installed. The final number of households equipped with motion alarms that provided reliable data for 6 months is depicted in Figure 4.
Figure 4.
Number of households equipped with motion alarms and number of them that give reliable data.
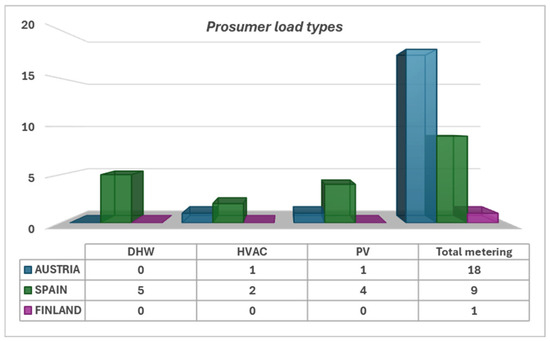
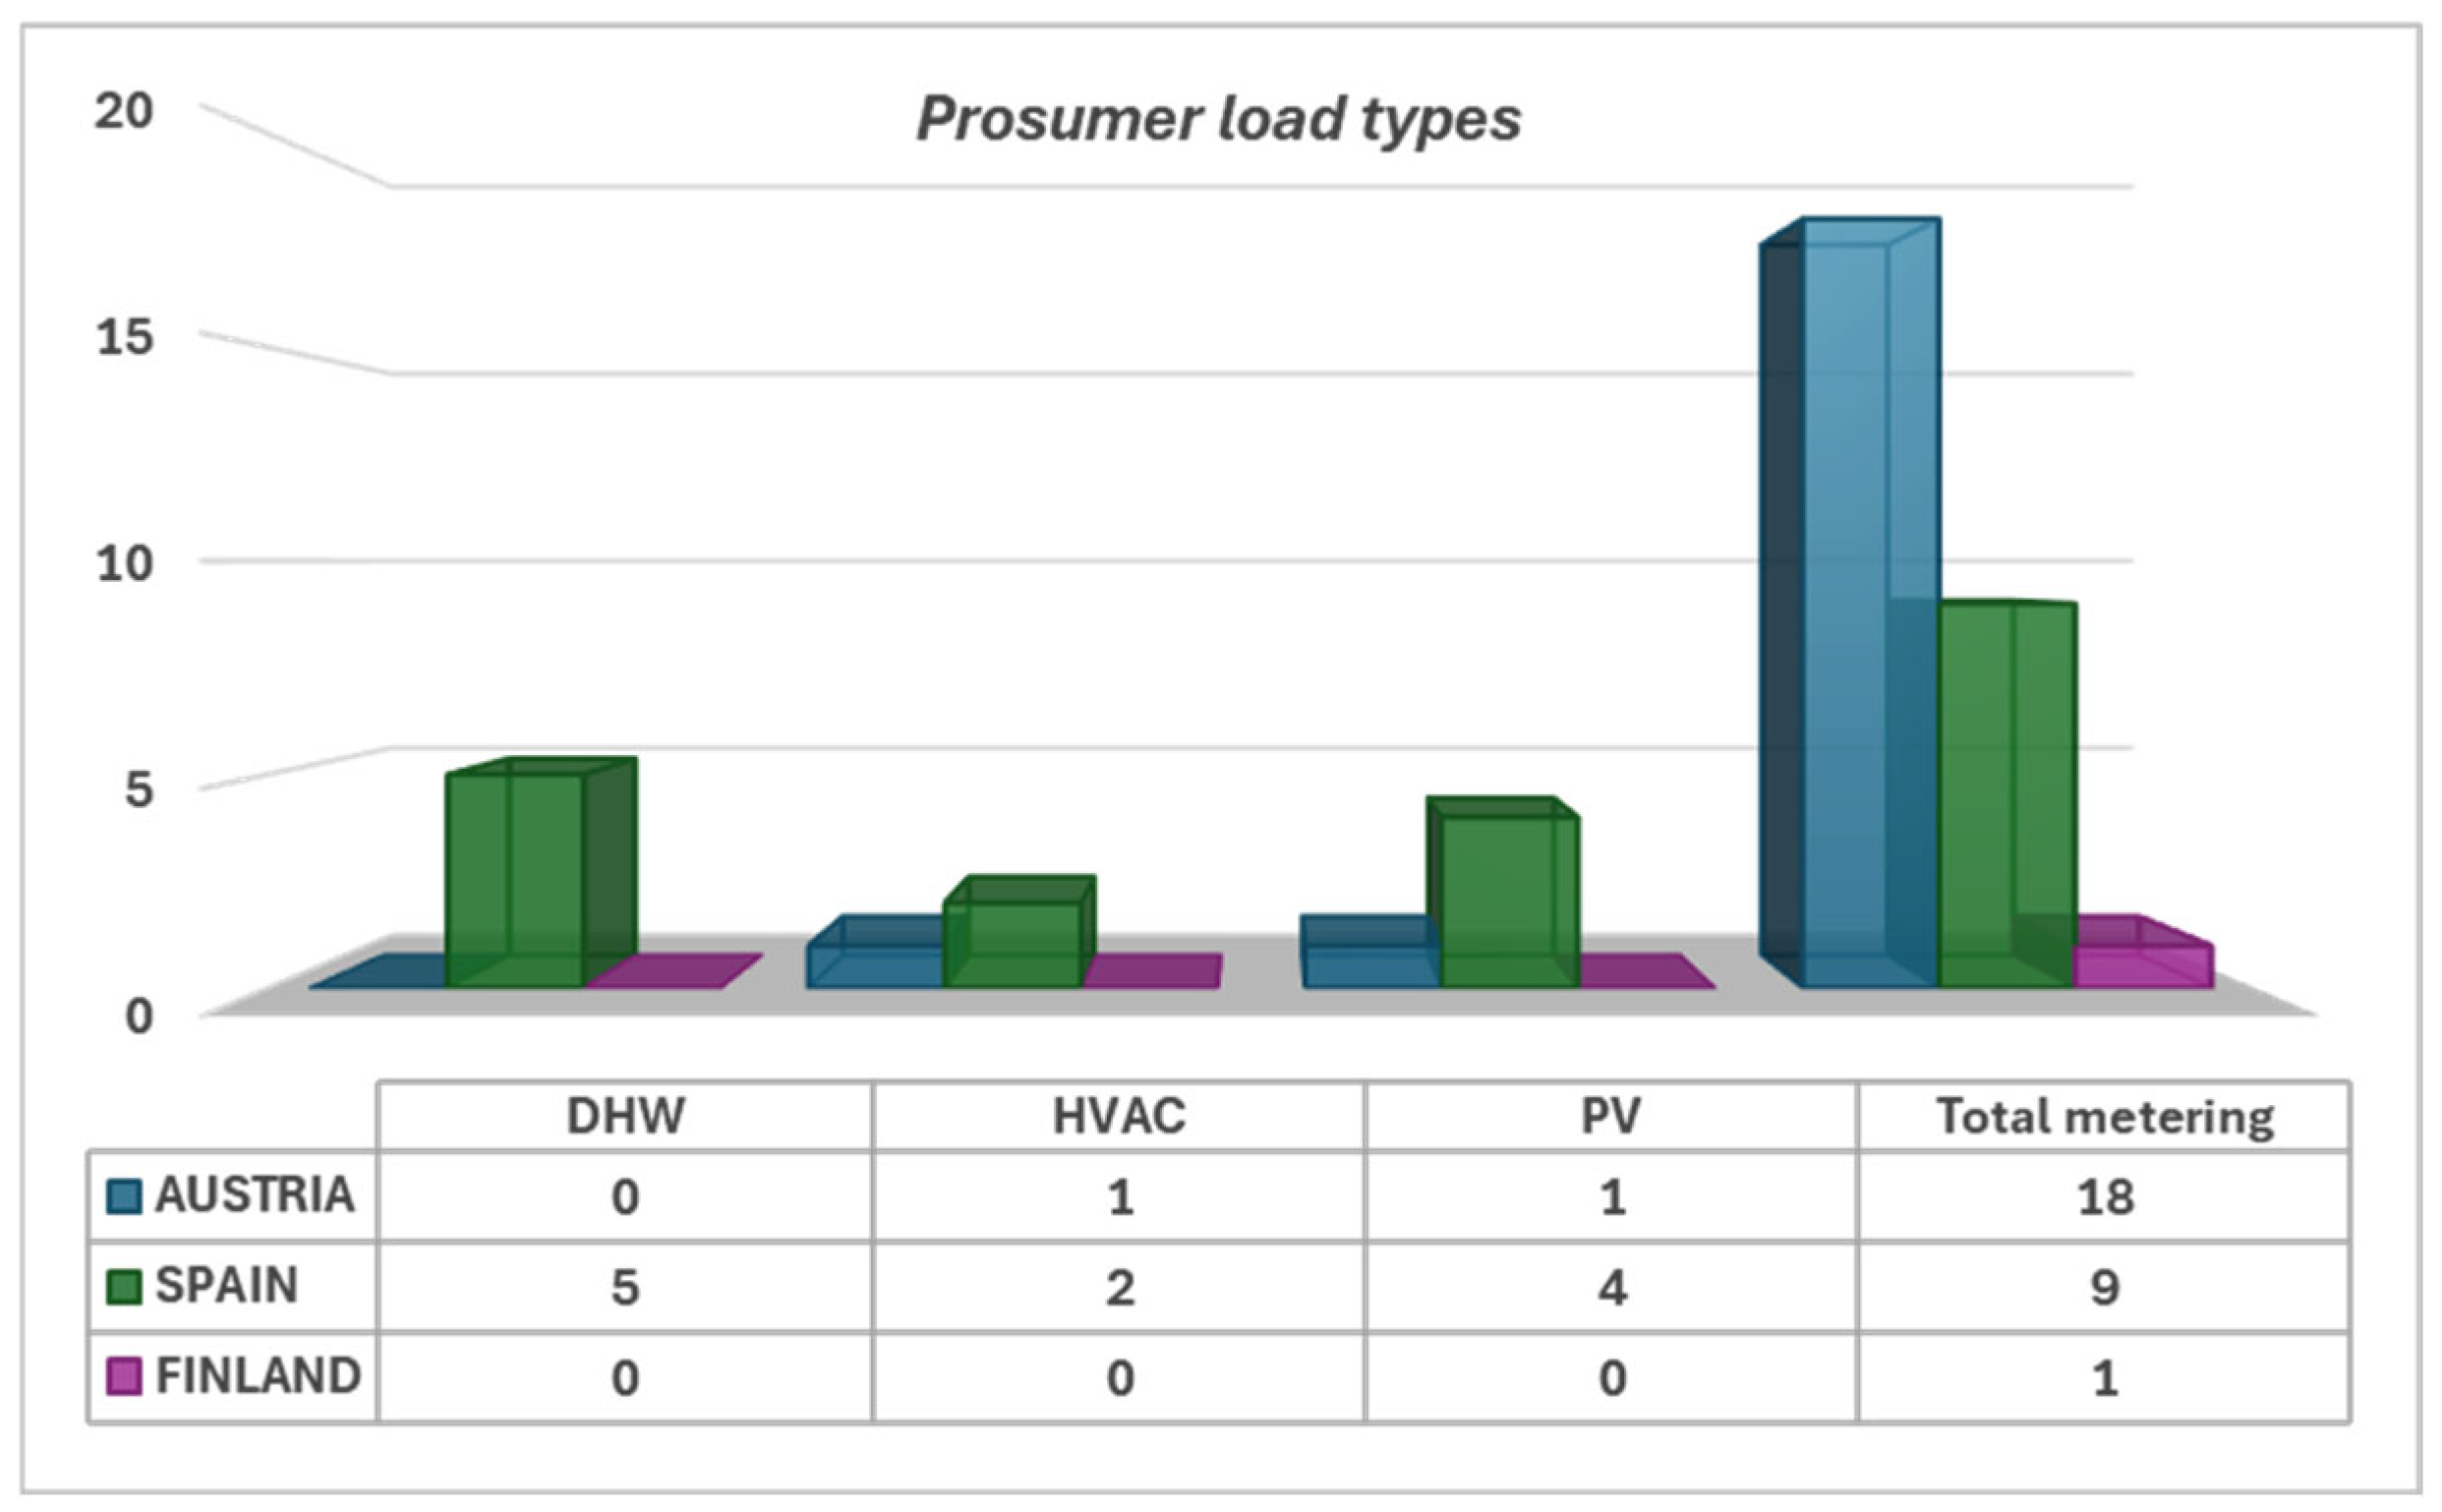
Subsequently, Figure 5 presents the prosumer load types for the selected households with motion alarms and reliable data in Austria, Spain, and Finland, for the selected period between 1 April 2024 and 30 September 2024, as retrieved from the Hypertech database. It was revealed that the majority of the Austrian households use total metering, while there was only one household with photovoltaics, total metering, and Heating, Ventilation and Air-Conditioning. In Spain, there was data for households equipped with photovoltaics; domestic hot water; Heating, Ventilation, and Air-Conditioning; and total metering, but they were scattered across the households, resulting in inhomogeneity. Regarding Finland, there was only one household using total metering at that time.
Figure 5.
Prosumer load types for households across the three pilot sites.
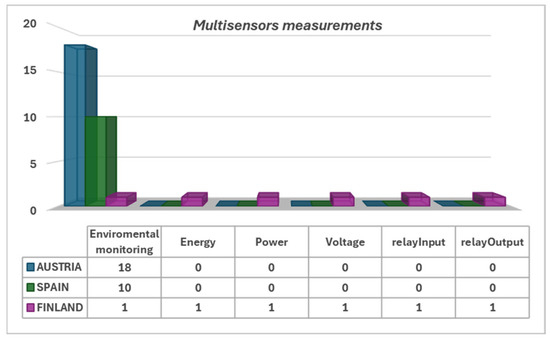
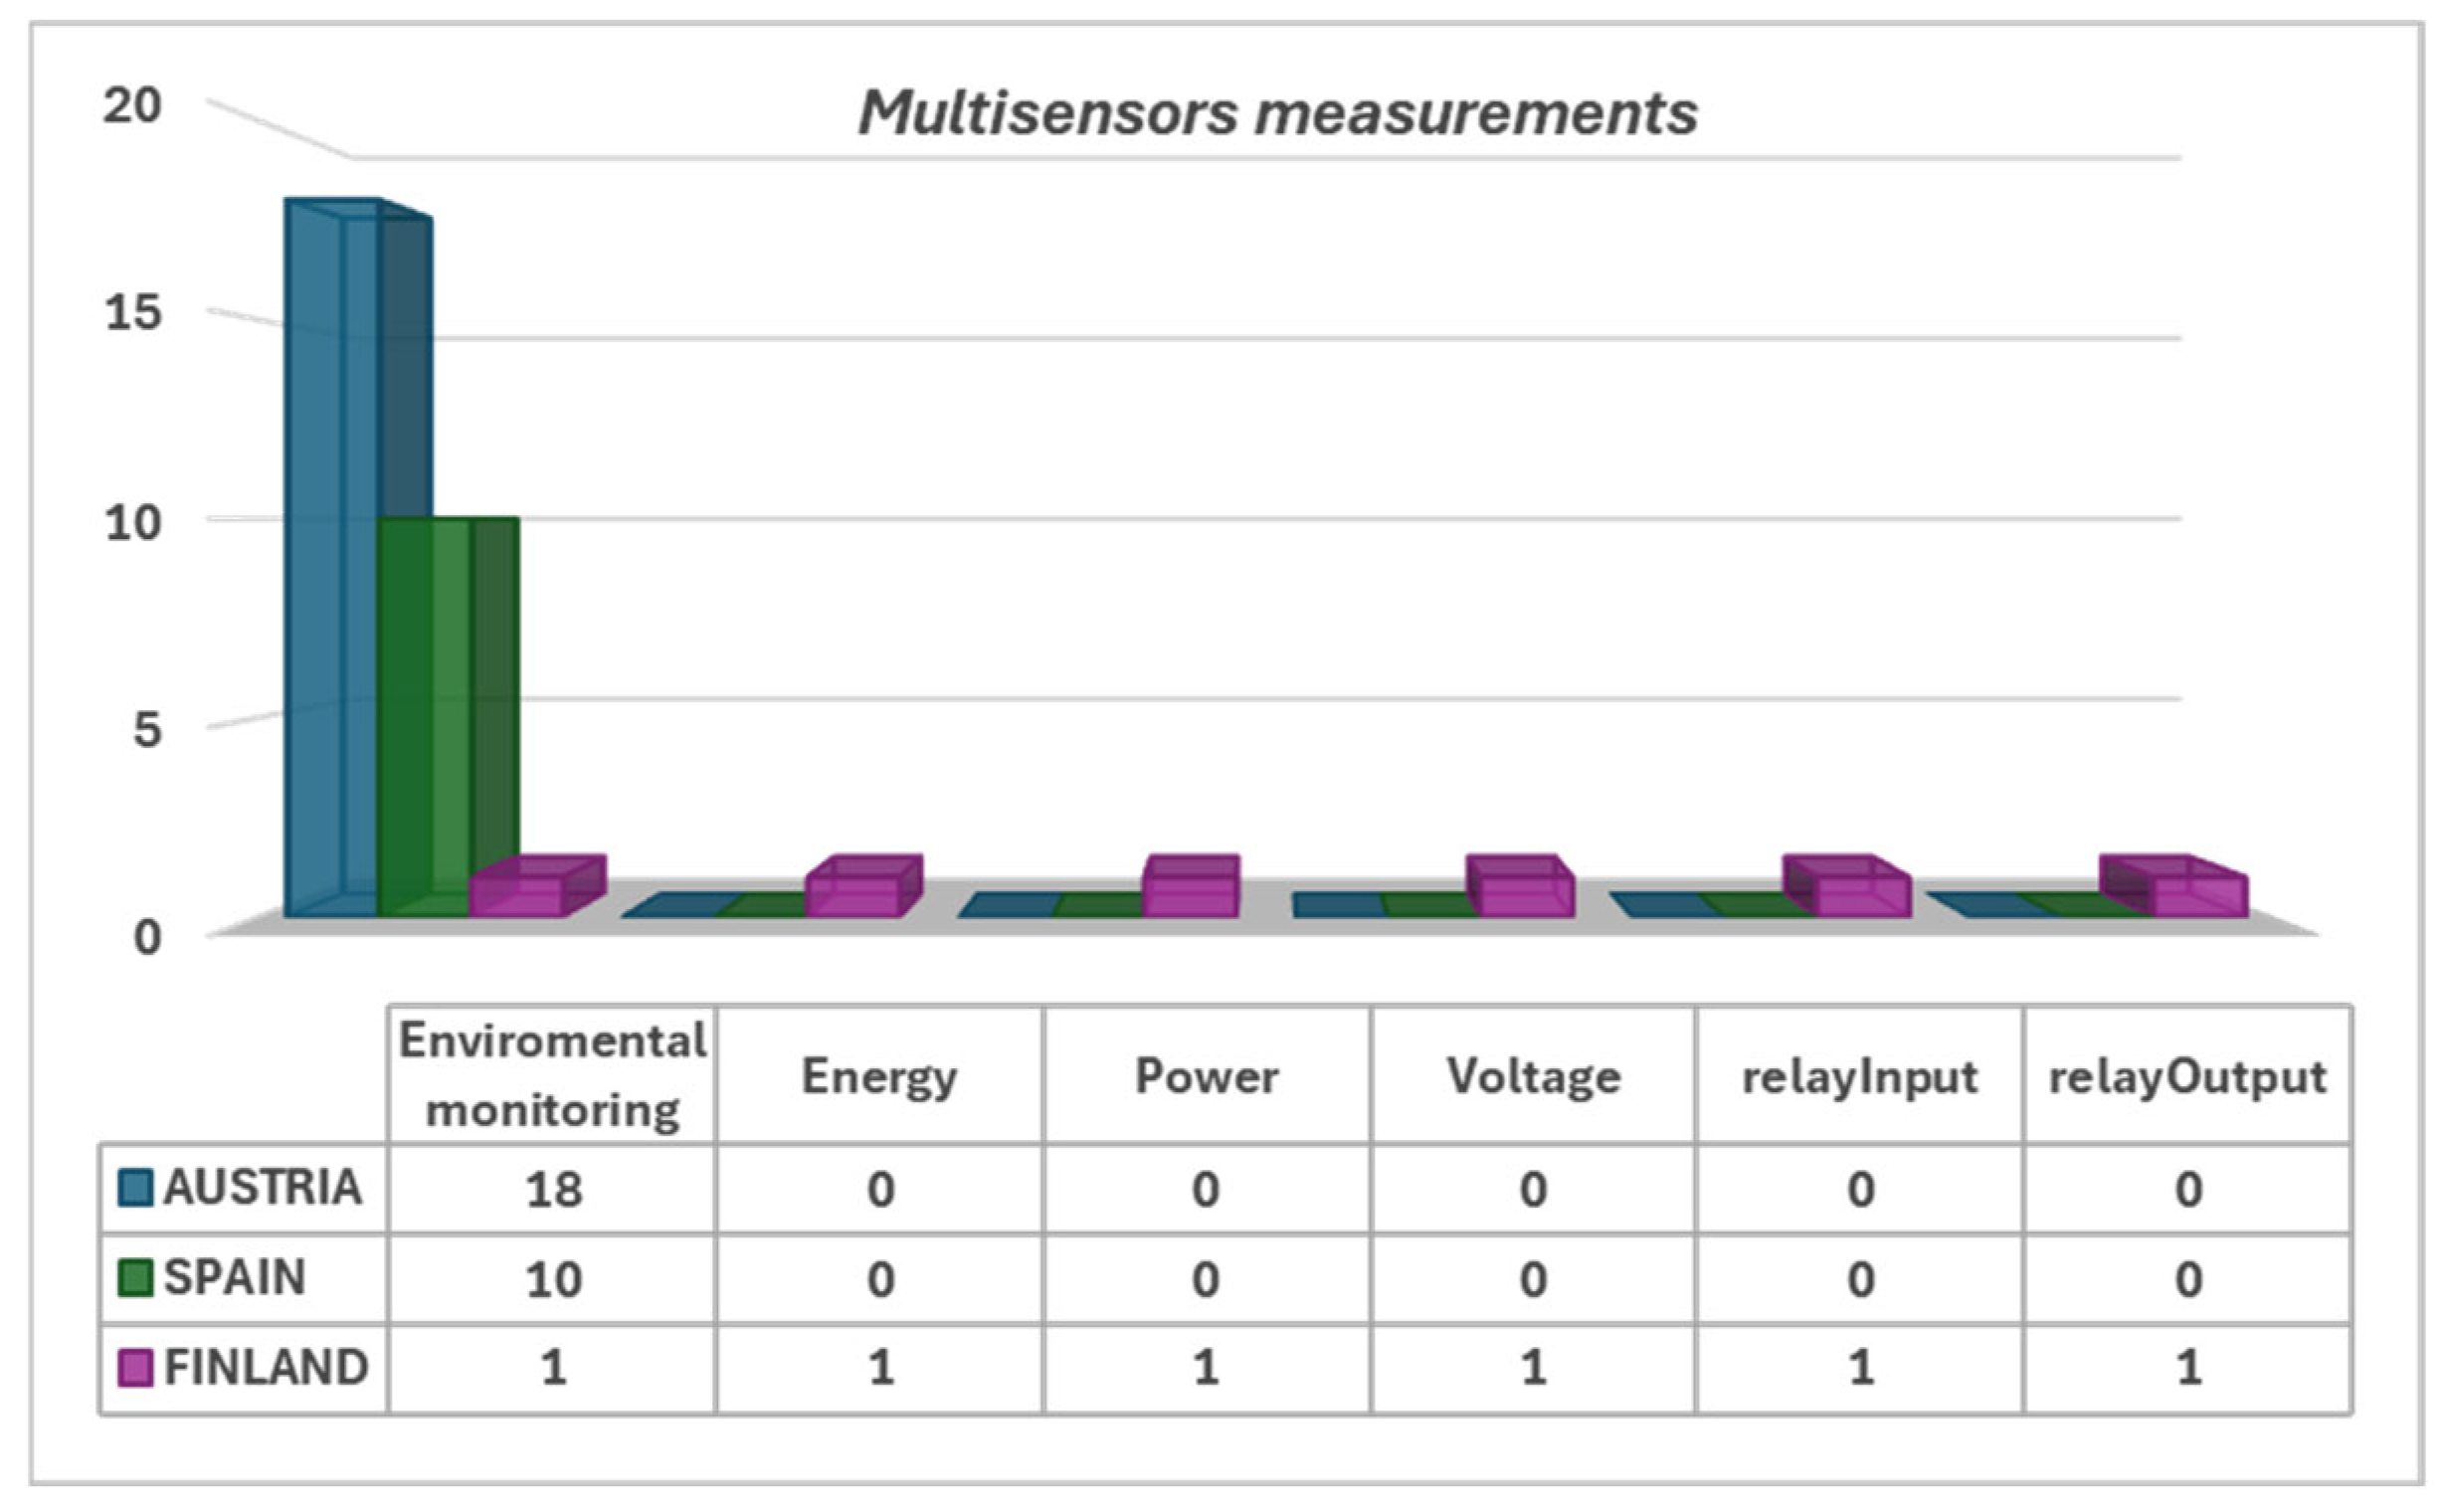
Next, Figure 6 shows the multisensory data collected at the pilot sites. Austria and Spain were recording environmental measurements for humidity, luminance, motion alarm, and temperature. Finland recorded further measurements, and more specifically, RelayInput and relayOutput were used to receive commands to turn the HVAC on/off, while SwitchBinary indicated the on/off status of the DHW, without control capability.
Figure 6.
Multisensor measurements across the three pilot sites.
From this analysis, it was concluded that the measurements were not homogeneous between the pilot sites. In particular, the following discoveries were made:
- The total loads (DHW, HVAC, PV, and total metering) differed among the pilot sites;
- From the analysis of the sensors of each household, it emerged that there was data for just a few households.
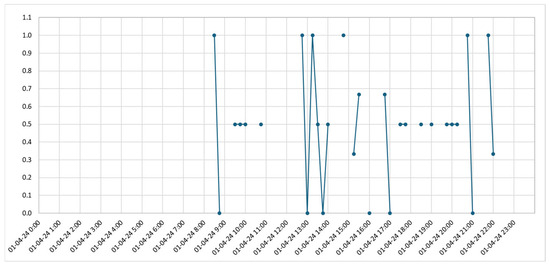
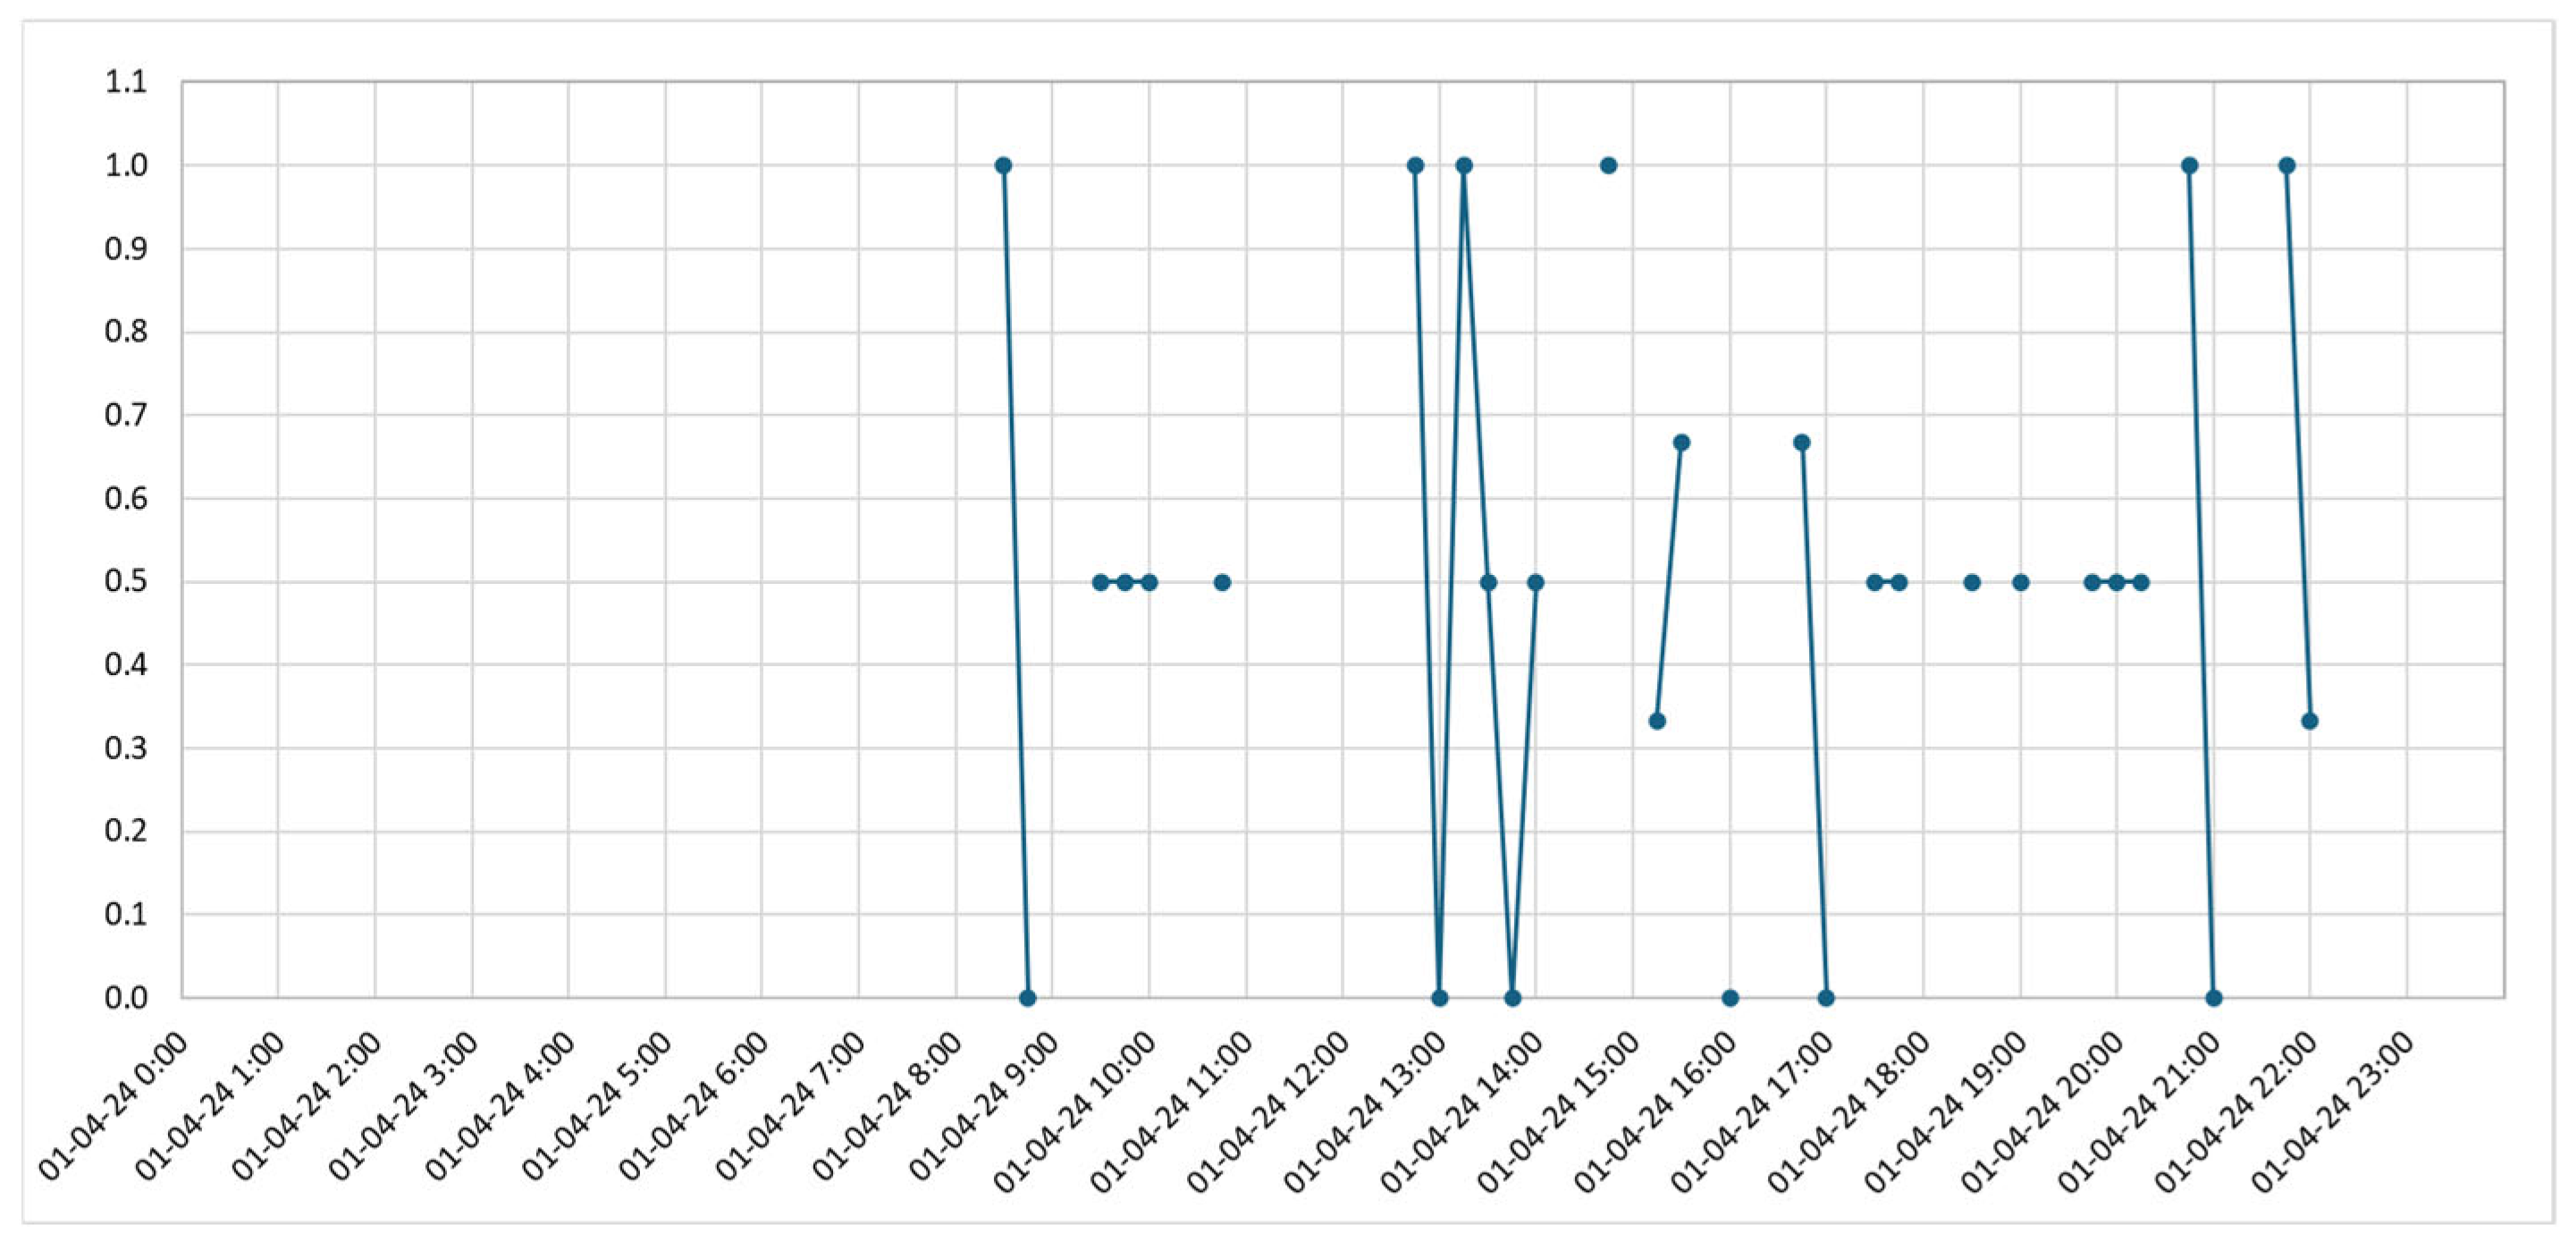
Figure 7 shows an example of the averaged motion alarm data for a single day in one household in Austria. The motion alarm data collected from the sensors was binary and event-based. Specifically, the sensors generated a binary output of either 0 or 1:
Figure 7.
Averaged motion alarm data for a single day in an Austrian household.
- “0”: No movement detected.
- “1”: Movement detected.
Motion alarm data was averaged every quarter of an hour with values of 0/0.33/0.5/0.66/1, so DT gave such predictions.
3.2. Digital Twin Design and Methodology
DT was mainly designed for residential buildings and small commercial spaces across the three pilot sites (Figure 2), in order to extract meaningful results into energy consumption patterns, occupant behaviors, and DR management, by studying the variations in each country’s lifestyle regarding energy consumption patterns under different climate conditions and how these are affected by the season of the year [67].
Given the heterogeneity of the pilot sites across different countries, particularly in terms of climatic conditions, occupant behavior, and available measurements, the DT was calibrated separately for each country using site-specific data. As a result, the analysis focuses on demonstrating the adaptability and applicability of the DT across the different pilot countries, rather than on direct cross-country performance comparisons. In the present work, the DT design and implementation follow a well-established framework previously detailed in our published study [68]. The DT architecture is based on a behavioral ontology that structures the representation of occupant behavior and energy use patterns. Data flows are standardized and integrated through the functional mock-up interface, allowing the co-simulation of building energy dynamics with external tools. A key component of the DT uses an artificial neural network that is trained on historical and real-time-series data to predict energy consumption and occupancy patterns.
Therefore, the data used to train the DT needed to include consistent real-time and historical time-series data describing the environmental conditions inside each household, power and energy consumption over time, as well as the occupancy. To achieve this, every household should be equipped with temperature, humidity, luminance, and motion detection sensors. Moreover, data sources had to be reliable and frequently updated to train the DT model more accurately.
After the data was collected, it was necessary to verify that each household had the essential data points required for DT modeling. That means that the model had to be trained only with high-quality, continuous, and accurate data. Any inconsistencies were removed, errors were fixed, and missing values were managed in order to improve the accuracy of the model. The data format also needed to be standardized across different households to ensure similar processing.
Subsequently, the data was categorized into relevant groups. Households with specific features, such as PV systems or DHW, were grouped together to simplify the analysis and facilitate the easier identification of patterns and trends. For the further development of an accurate and consistent DT model, the data was filtered again, keeping only the most relevant information. This selection is based on the time period of measurements to ensure comparability and consistency, the presence of motion alarms to indicate domestic activities, and the overall quality and quantity of the data.
3.3. Baseline and Replication Scenarios
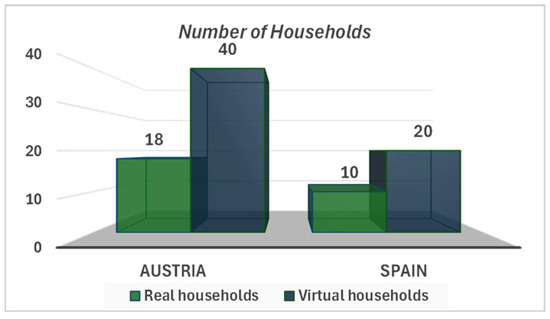
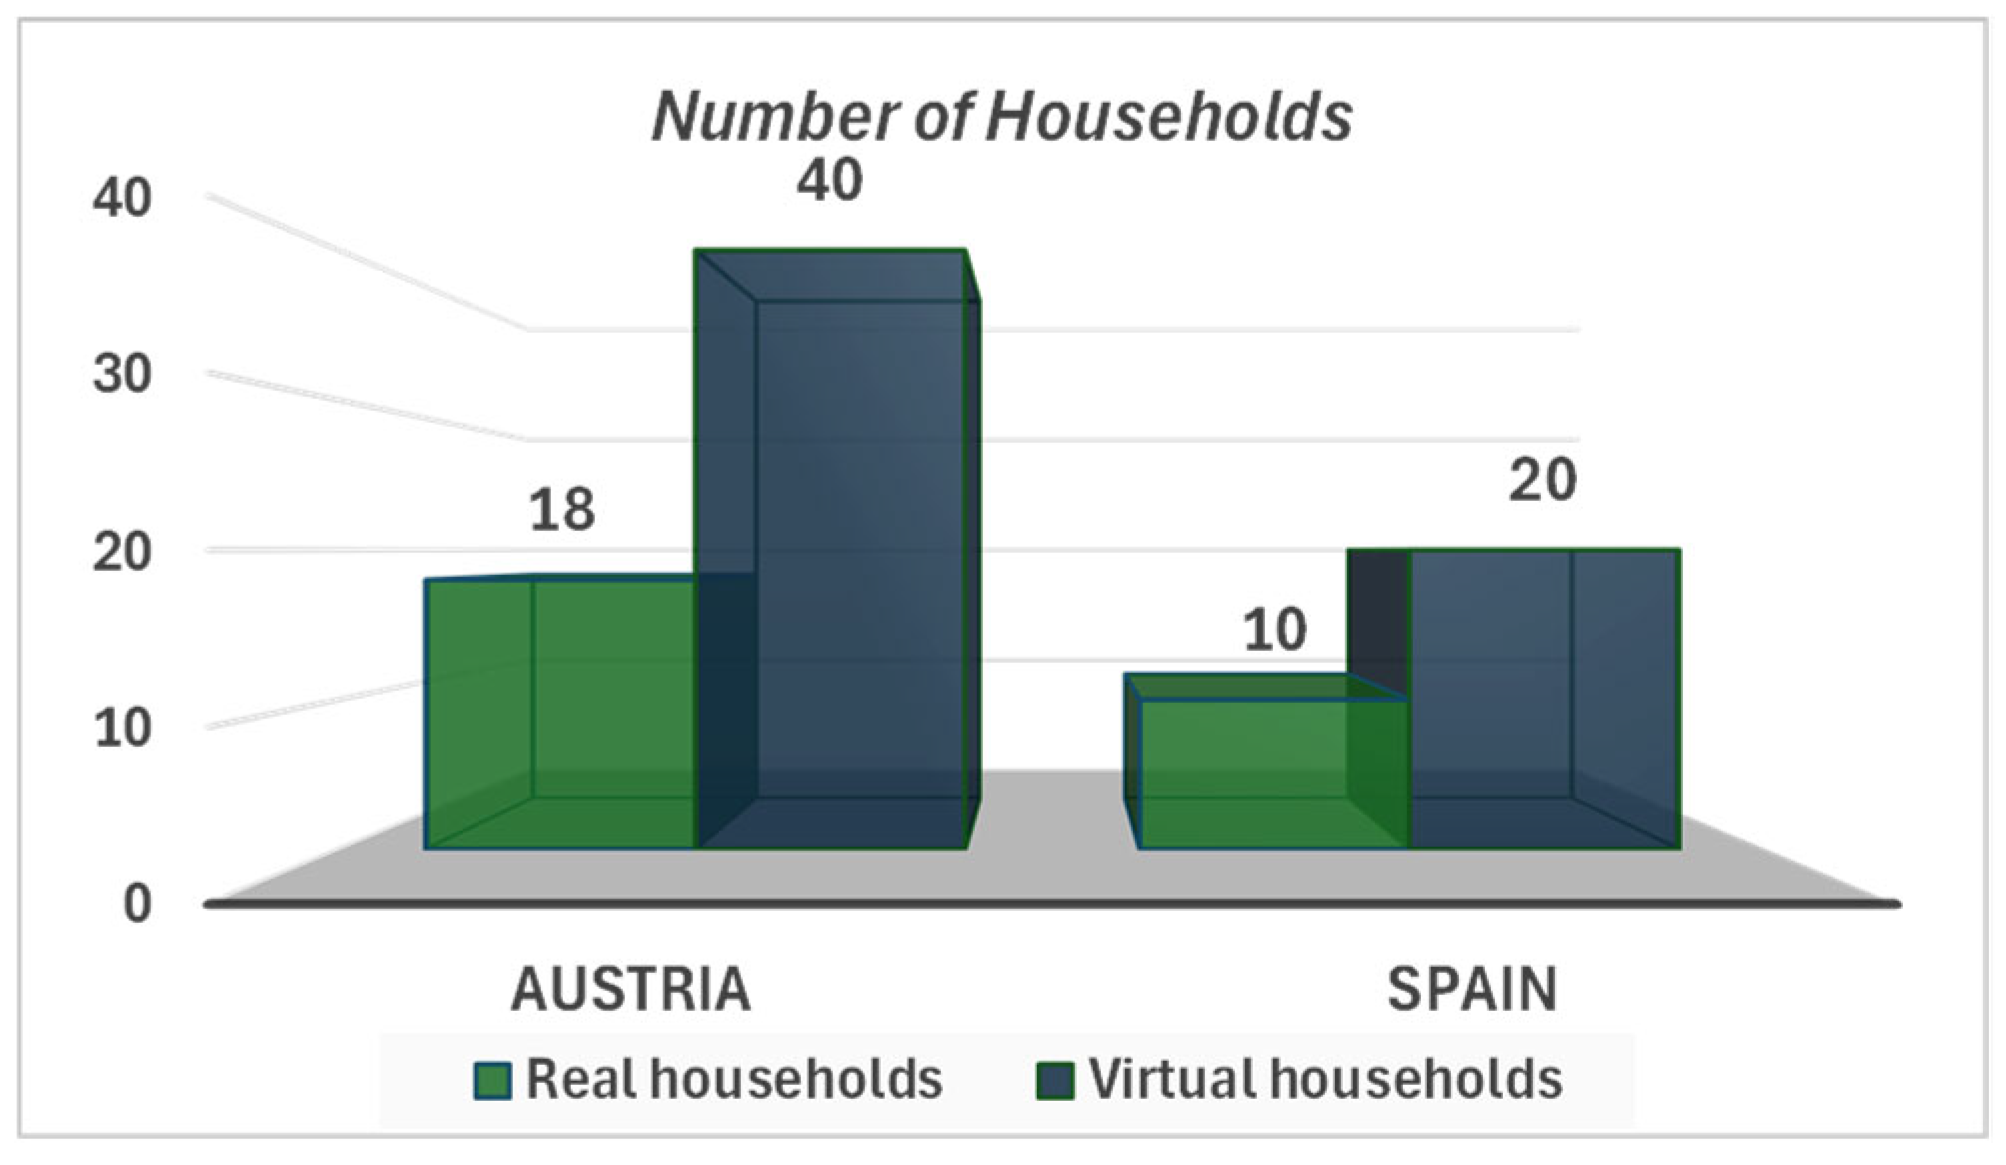
Given the limited and heterogeneous characteristics of the available datasets, the scope of this study focuses on demonstrating the applicability and operational feasibility of the proposed DT under real-world conditions, rather than on the statistical generalization of the results. After data filtering, it emerged that the available data was limited, so the baseline scenario had to be redefined to focus on Austria and Spain, since generating a DT based on data provided by a single Finnish household equipped with a motion alarm that gives reliable data is prohibitive. In Austria, the number of available households was 18, indicating that the dataset was sufficient to simulate occupancy patterns, while in Spain, the number of households was 10, a marginal number to ensure the accuracy of the DT model.
In the context of this study, real households refer to actual pilot households that provide measured data, while virtual households are artificially created by the DT model by scaling and combining real household profiles, allowing for the analysis of scenarios that go beyond the available dataset.
The baseline scenario represented 18 households in Austria and 10 in Spain. For the replication scenario, the number of households and the corresponding load types were increased in 20% steps up to 80%, as shown in Table 3. Figure 8 depicts the final number of virtual households generated by the DT.
Table 3.
Number of households for the baseline scenario (B.S.) and every replication scenario.
Figure 8.
Number of real and virtual households for the baseline scenario and replication scenarios, respectively.
4. Digital Twin Analysis
The DT was specifically designed to consider consumer behavior in different countries or contexts by adjusting key parameters of the occupant behavior model, such as age, social factors, technological literacy, gender, and location, in order to produce an energy consumption forecast. This allows the DT to be adapted to different environments, including residential, office buildings, and other types of households, providing valuable information on energy use patterns and consumption trends.
4.1. Comparison Between Simulated and Measured Data
Due to the large number of households, sensors, and replication scenarios included in the study, the results are presented for a limited number of representative households. These samples are typical of the overall behavior observed in the entire dataset.
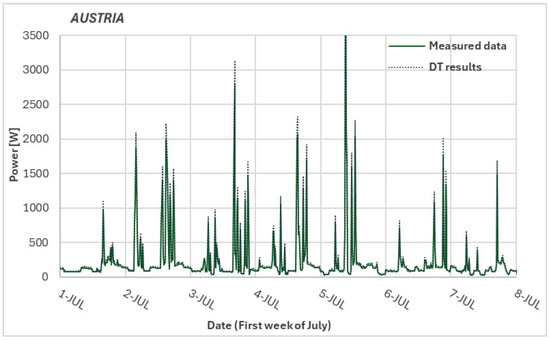
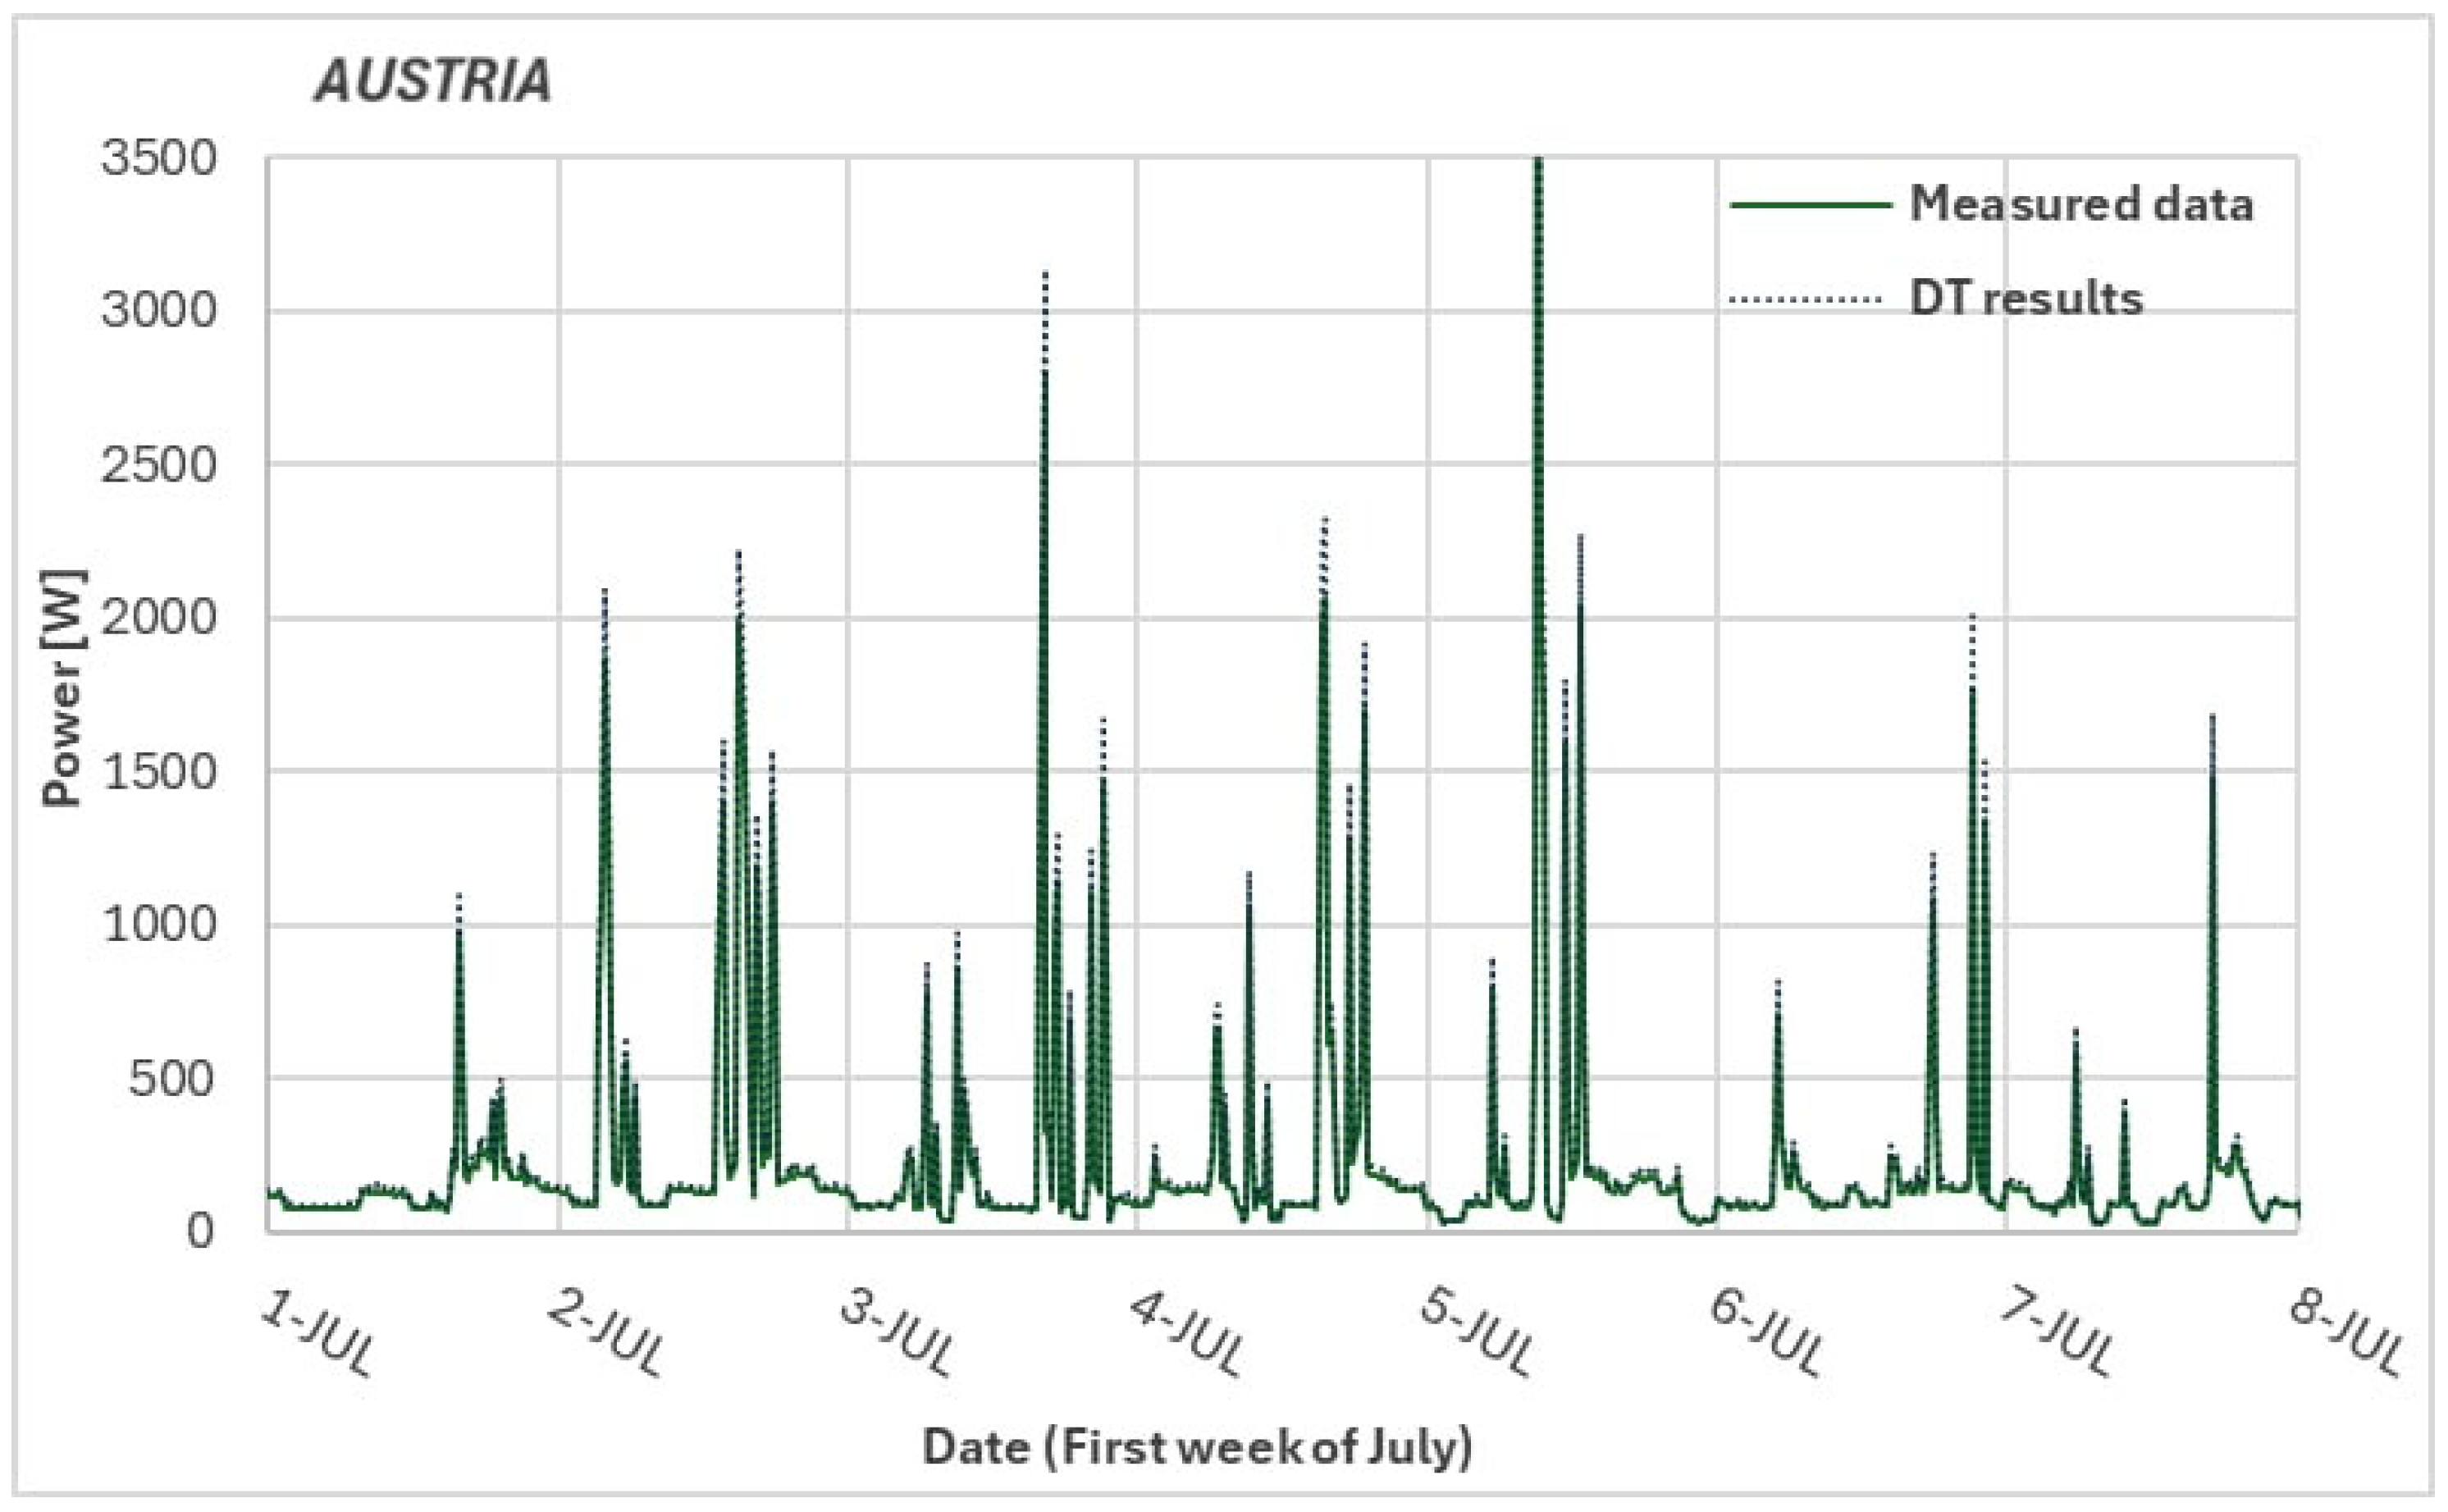
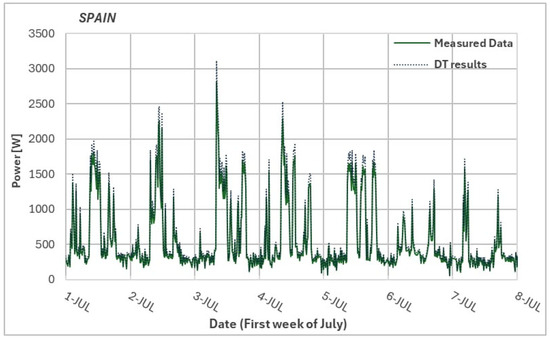
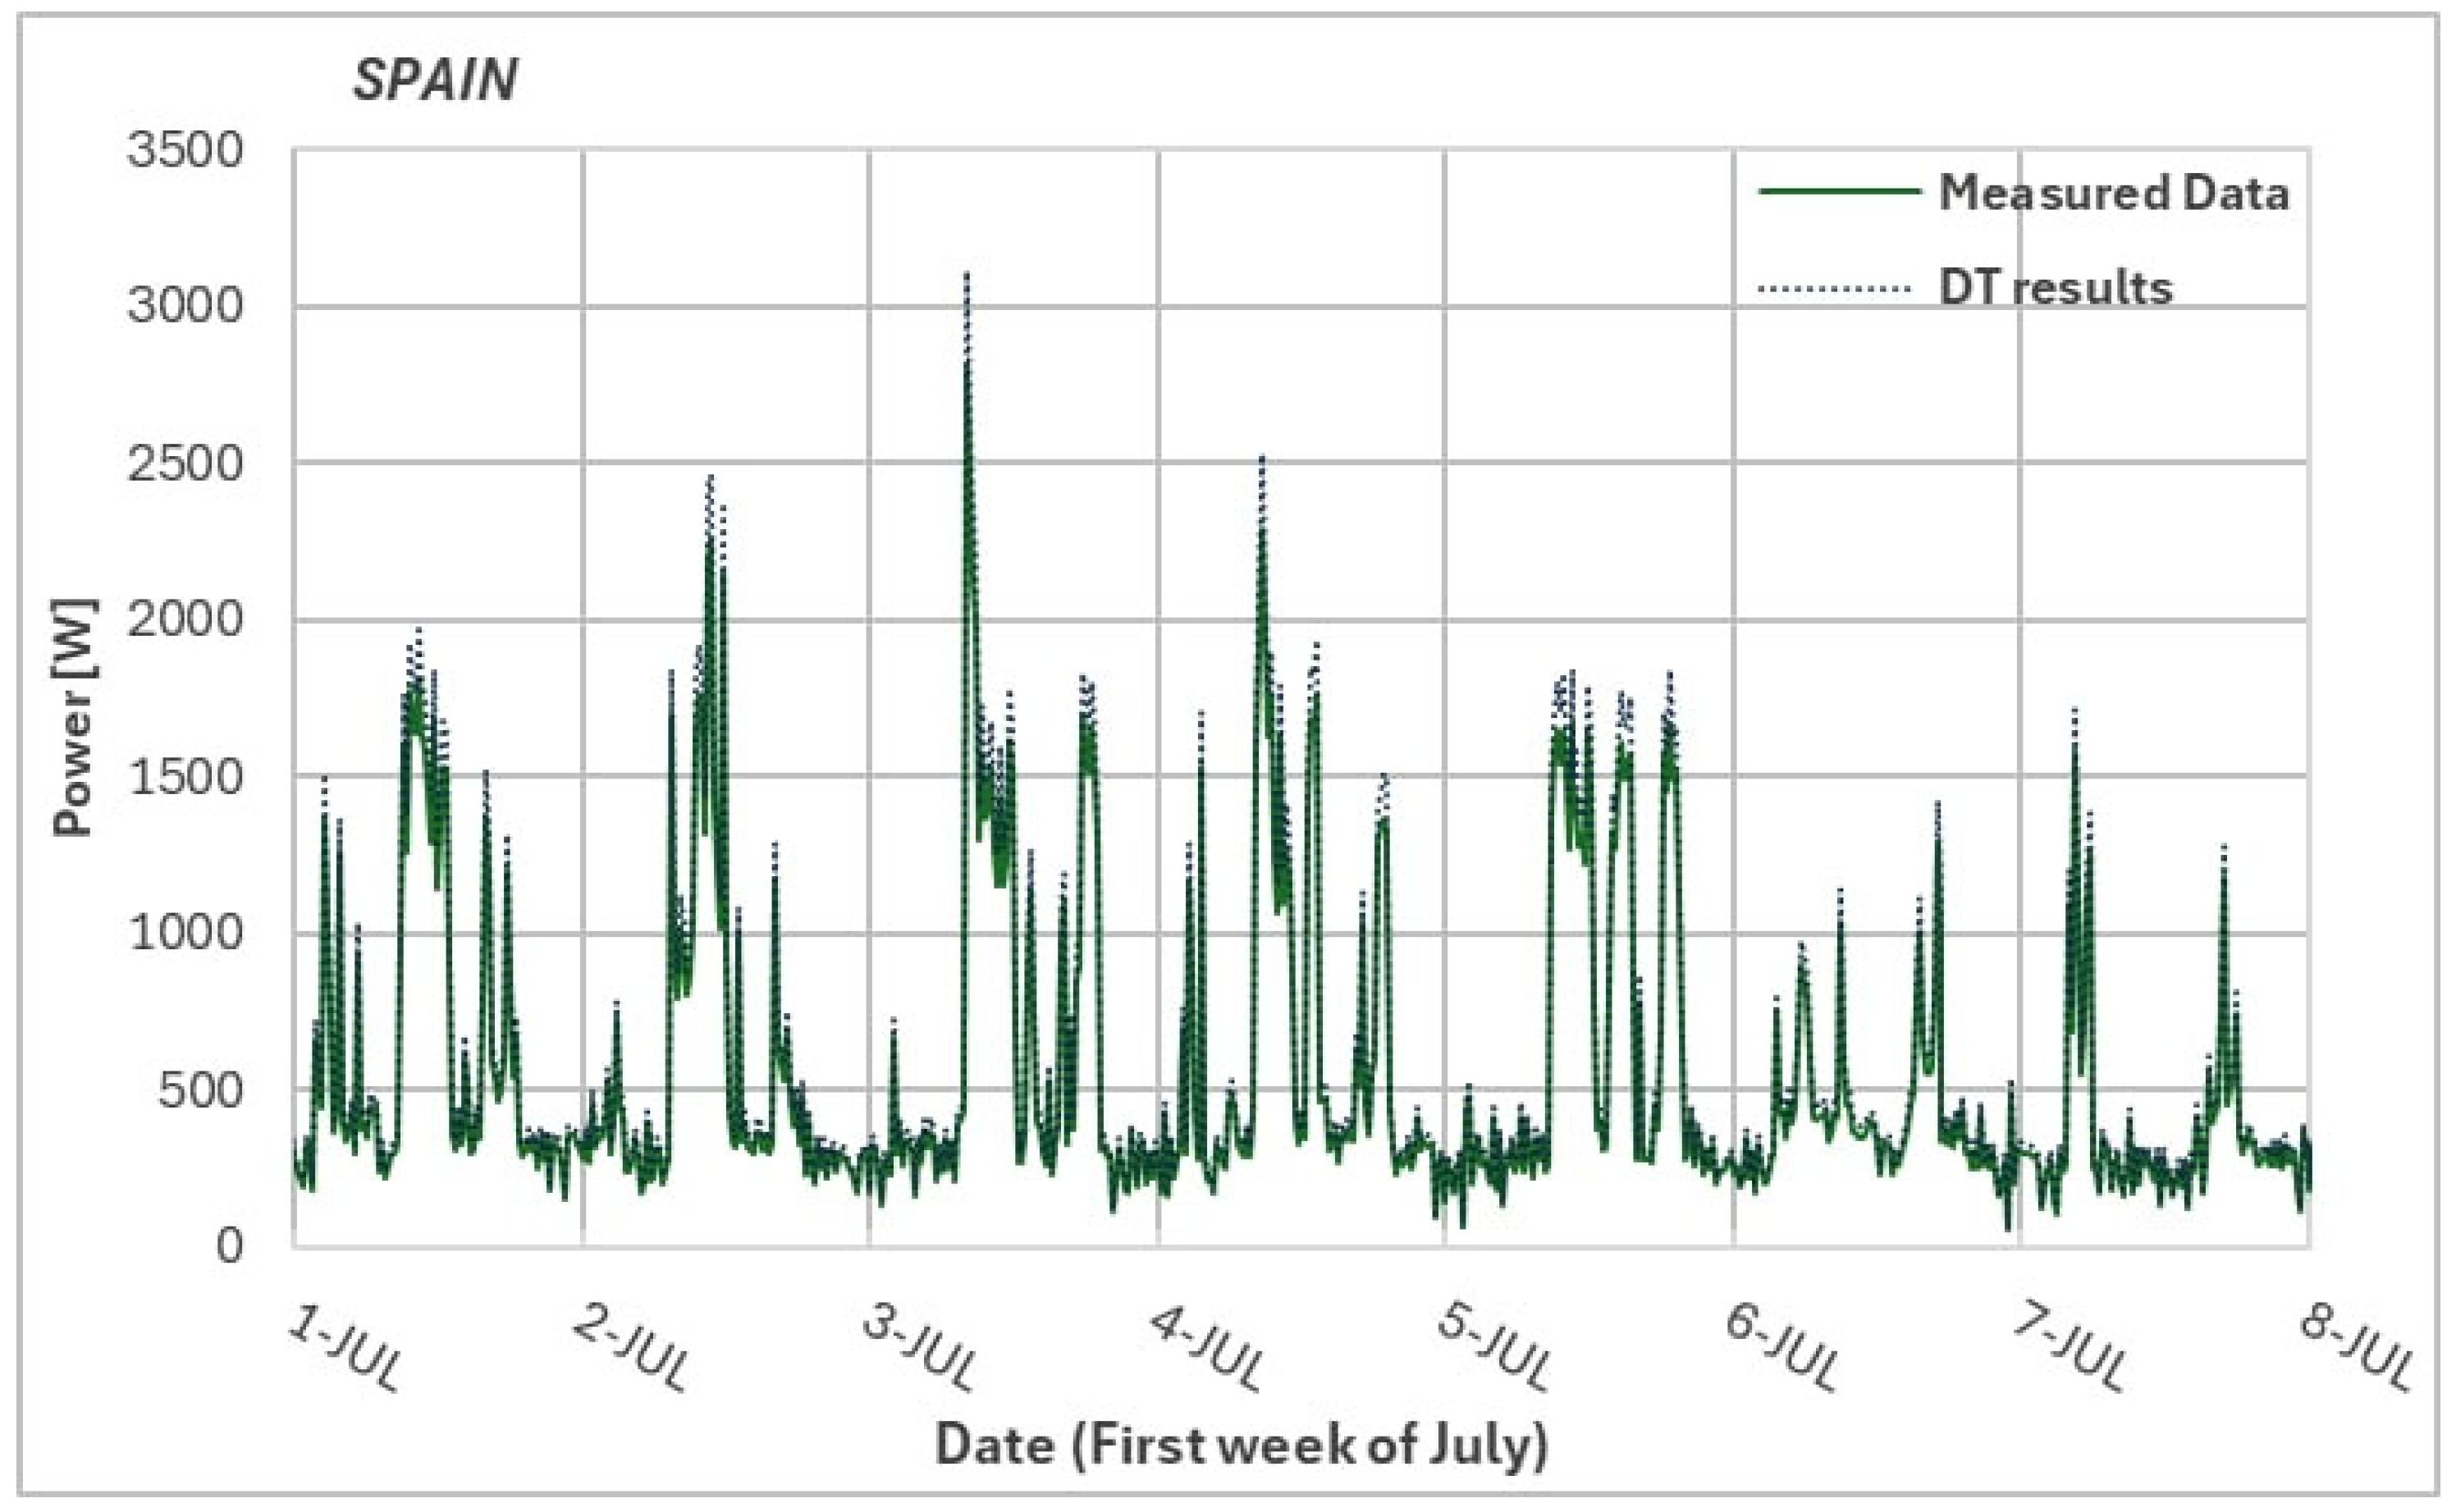
Figure 9 presents a comparison between measured power consumption and the corresponding DT results for the first week of July in a household in the Austria pilot site and Figure 10 displays the corresponding results for Spain. The DT matches the power consumption trends seen in the measured data, showing that the simulated and actual values are in good agreement. Similar behavior was observed for the remaining households, supporting DT’s ability to replicate occupancy-driven power demand under the heterogeneous conditions of the pilot sites.
Figure 9.
Comparison between measured and DT power consumption data for the first week of July in a household at the Austria pilot site.
Figure 10.
Comparison between measured and DT power consumption data for the first week of July in a household at the Spain pilot site.
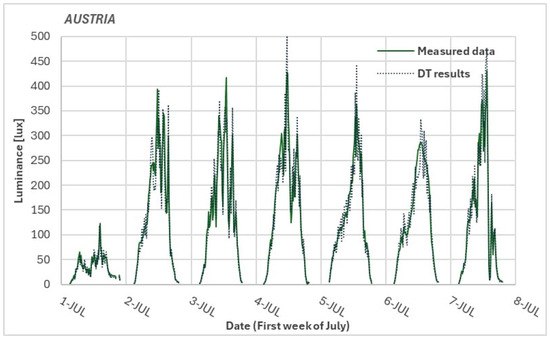
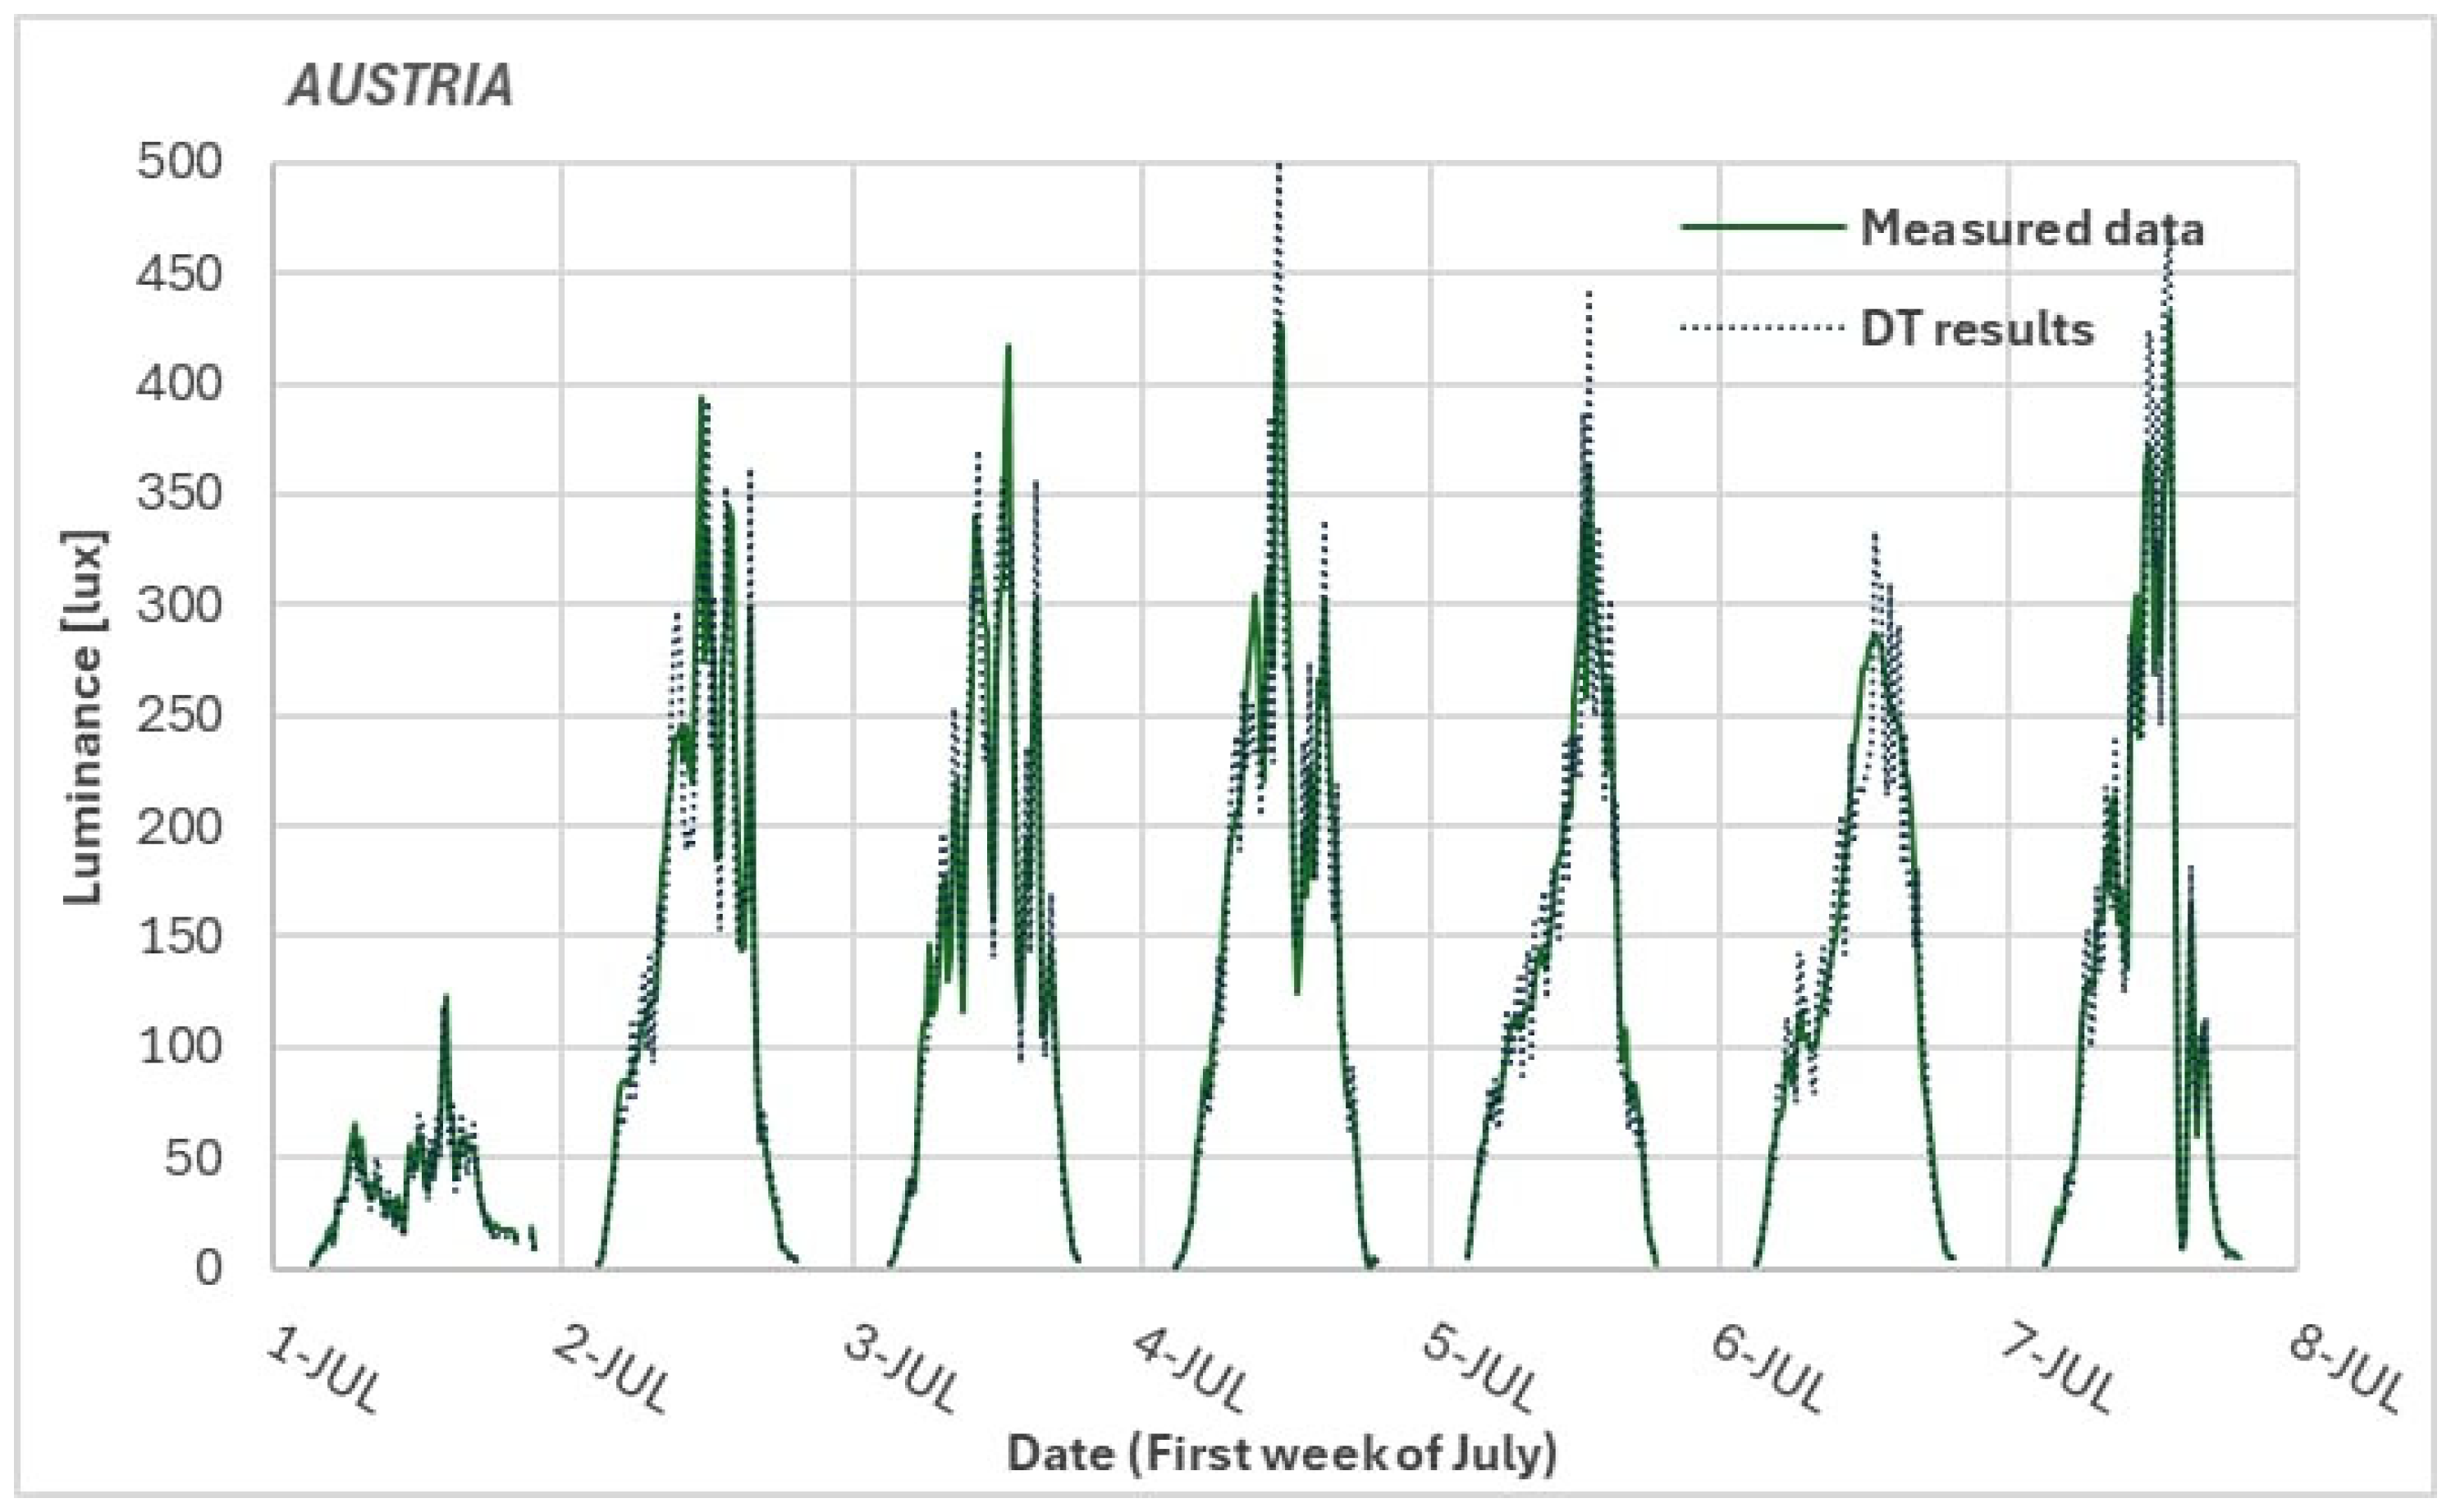
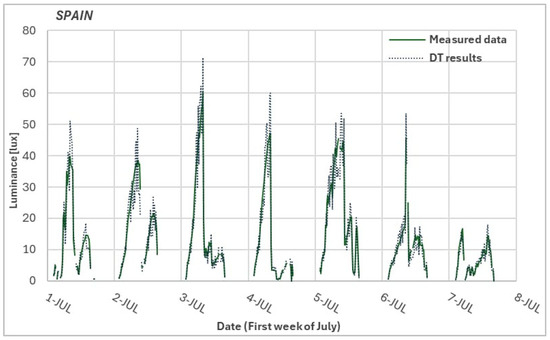
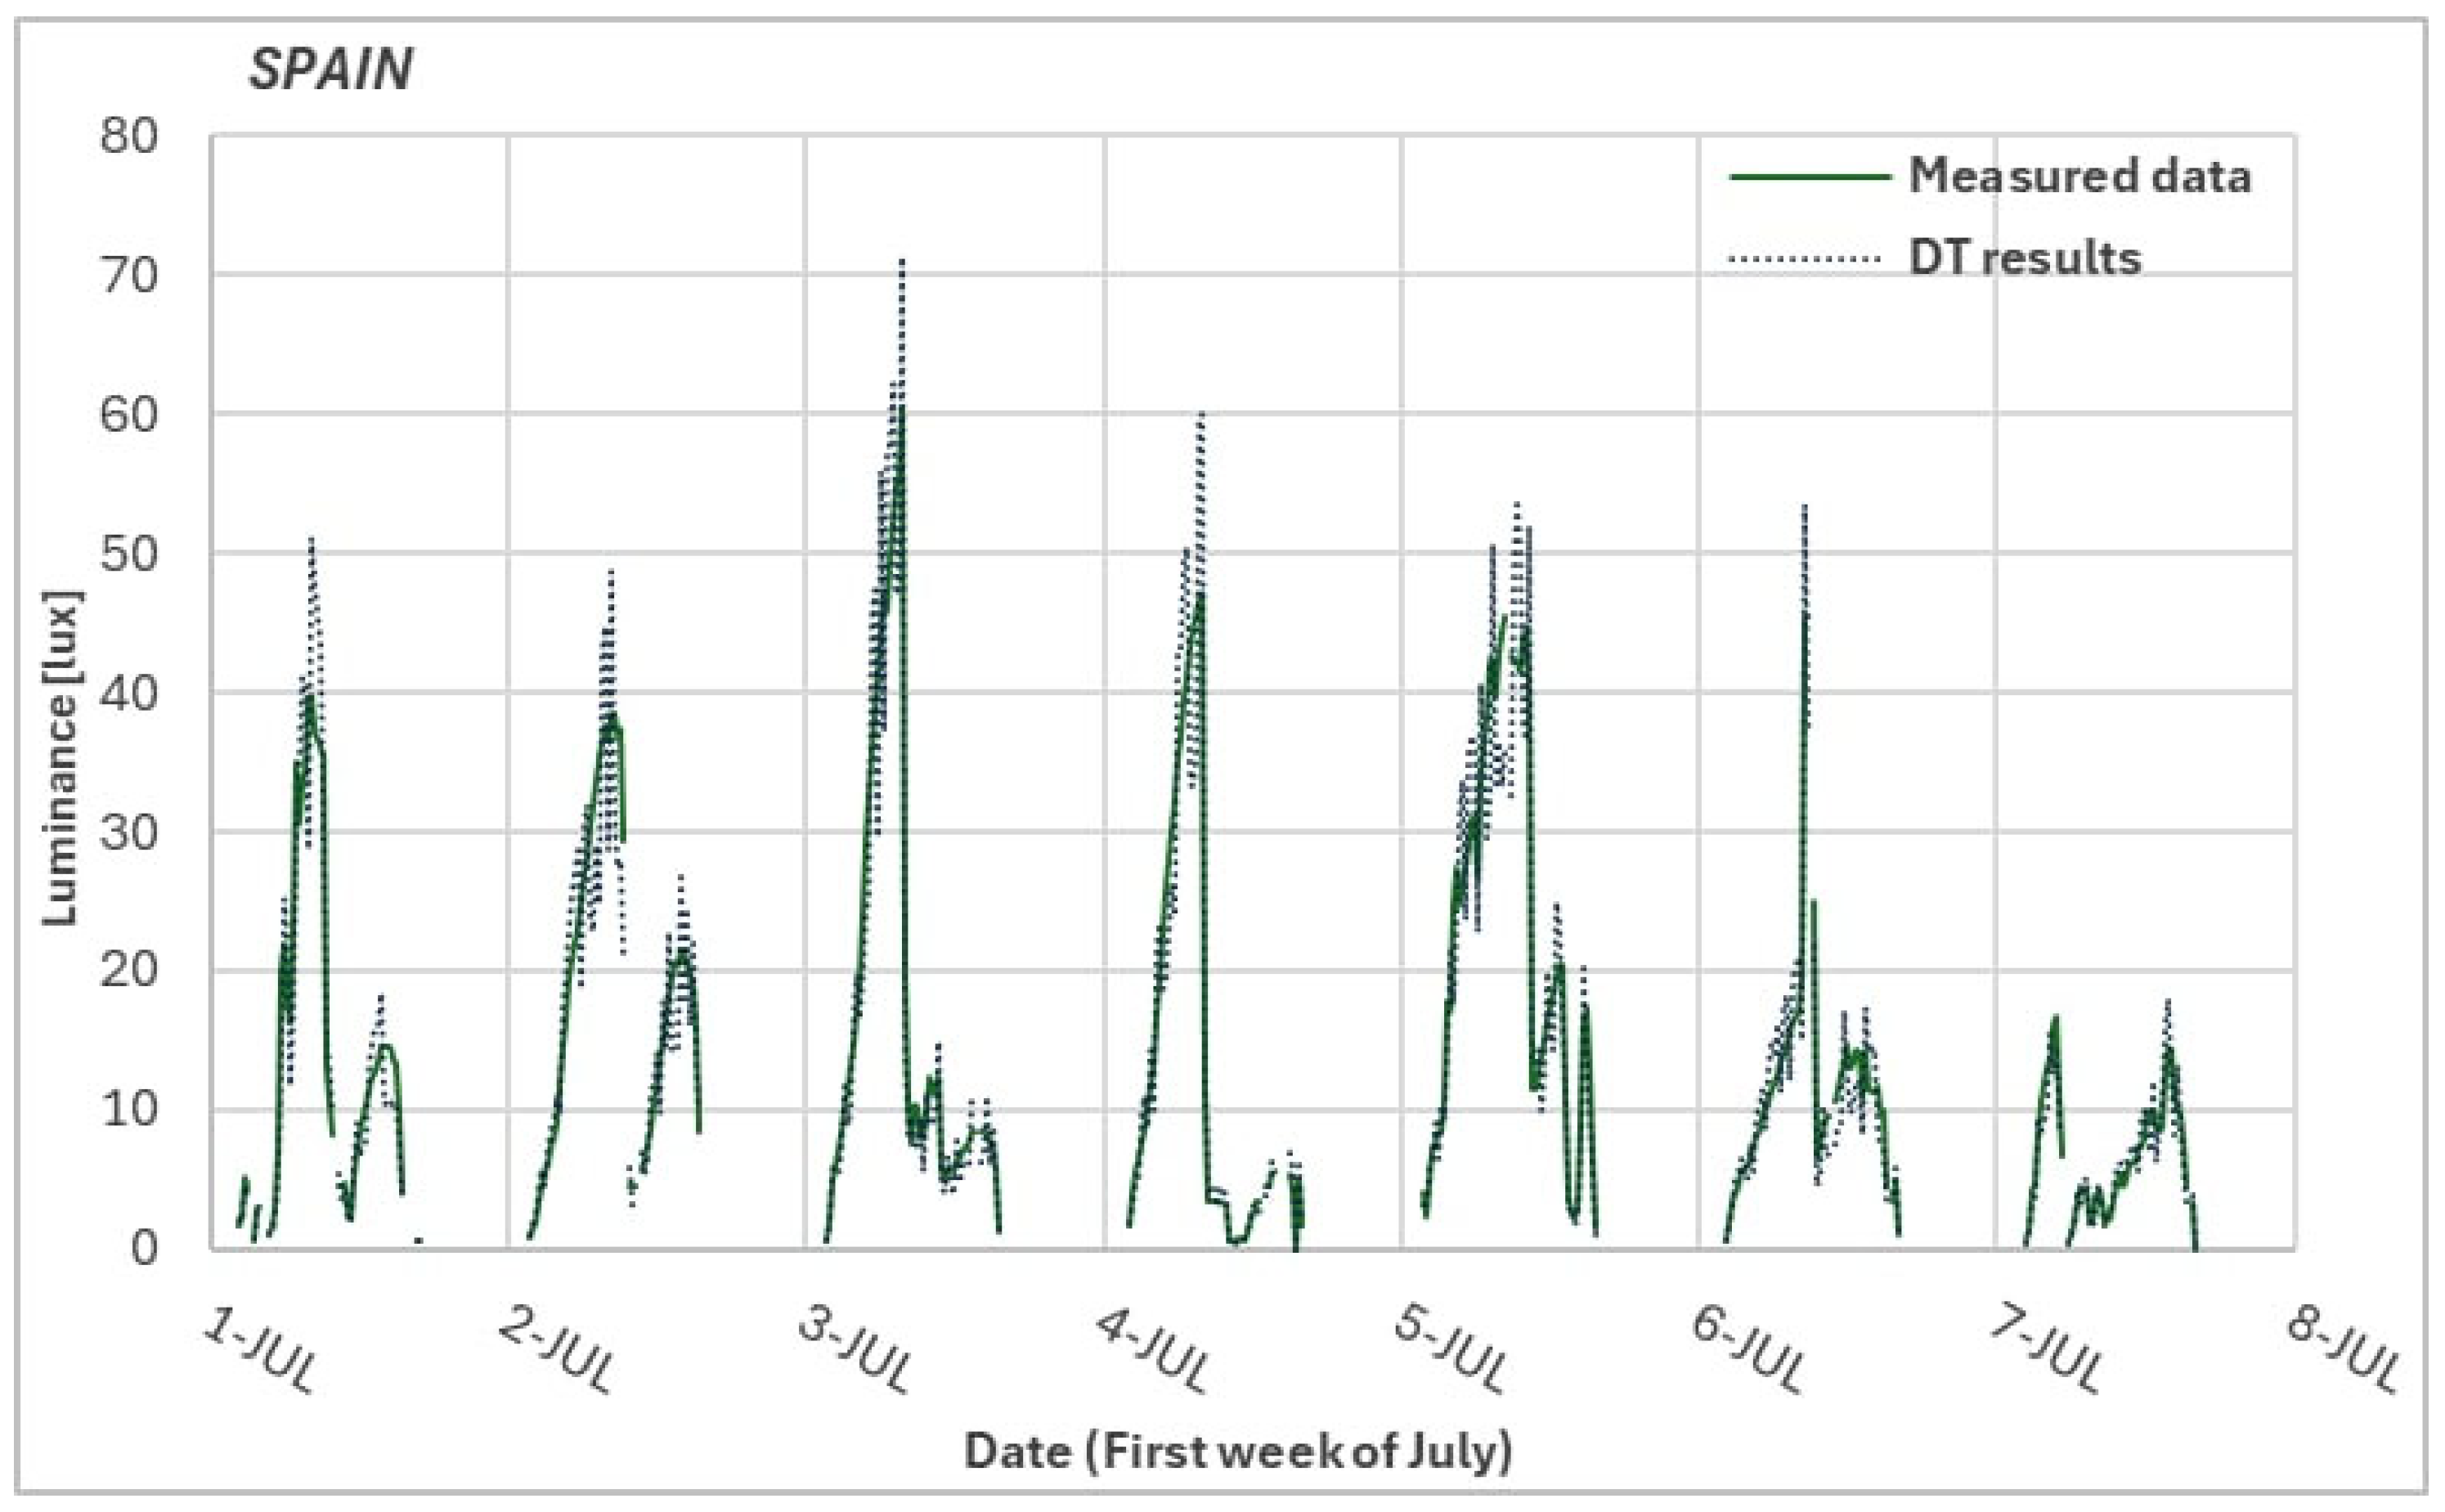
In addition to power consumption, environmental measurements from multisensors were also analyzed. Figure 11 shows the comparison between measured data and DT results for luminance for a selected household in Austria, while Figure 12 shows the corresponding results for Spain. In all cases, the DT is able to reproduce the overall daily patterns and variations observed in the measured data. Similar behavior was observed across the other households, indicating that the DT can capture environmental dynamics consistently, supporting its use for scenario analysis and replication across heterogeneous residential contexts.
Figure 11.
Comparison between measured and DT luminance data for the first week of July in a household at the Austria pilot site.
Figure 12.
Comparison between measured and DT luminance data for the first week of July in a household at the Spain pilot site.
Quantitative validation of the proposed DT was performed for two households located in Austria and Spain, respectively. For power consumption, the DT achieved a Mean Absolute Error (MAE) of 31.2 W (≈13% of the average demand of 236 W) and a Root Mean Square Error (RMSE) of 62.2 W (Normalized RMSE (NRMSE) = 0.26) for the Austrian household, while for the Spanish household, the MAE was 82.1 W (≈9.7% of the average demand of 848 W) and the RMSE was 108.2 W, corresponding to a NRMSE of 12.8% relative to the mean power consumption. With regard to luminance, the DT achieved an MAE of 13.7 lux and RMSE of 21.4 lux (NRMSE = 0.25) in Austria, and an MAE of 2.47 lux and RMSE of 3.49 lux (NRMSE = 0.30) in Spain. These results demonstrate that the DT can replicate both power consumption and lighting conditions reliably across multiple households, capturing occupancy-driven and environmental variations as expected in real-world residential conditions. Table 4 summarizes the NRMSE values for power and luminance across the two pilot sites.
Table 4.
NRMSE values for power and luminance.
4.2. Limitations, Lessons Learnt, and Future Recommendations
The effectiveness of the DT model was significantly influenced by several factors, primarily due to delayed household installations caused by the COVID-19 pandemic. To begin with, during the period from 1 April to 30 September, the number of operational households was less than the original plan, resulting in limited data. The data collection period was also reduced from two years to six months, significantly impacting the model’s ability to identify long-term behavioral patterns. Apart from that, the household data was not homogeneous, not only between Austria and Spain, but also within individual pilot sites, impacting the reliability of any conclusions, since it could not be guaranteed that each household was measuring the same parameters with high-quality data. Moreover, the model’s accuracy was further affected by quality issues regarding occupancy information.
There are several actions to be proposed in order to improve the accuracy and reliability of the model. First of all, data should be continuously monitored by a qualified data manager or a responsible team to detect any missing data or irregularities. Such issues could be addressed through the implementation of automated scripts to check data integrity and set predefined limits for missing or incomplete data. Additionally, each household should consistently measure the right parameters with high-quality data and record the equipment used. To ensure similar data processing, the standardization of the data format across all households is necessary. Moreover, the data collection period should be extended to at least one year to ensure the meaningful analysis of seasonal behavioral patterns and accurate simulations.
Although the DT was designed to be adapted to different environments, countries, or contexts by adjusting key parameters of occupant behavior, such as age, gender, technological literacy, and social factors or location, in order to predict energy demand, the limited available data made it unfeasible for the DT to further investigate behavior variabilities or to correlate specific occupant behaviors with different populations and regions.
5. Conclusions
From this study, it was concluded that DTs play a key role in energy demand prediction. In terms of the SENDER project, a consumer DT model was designed and developed in order to cover the technical aspects of a replication study, based on real-world pilot data from Austria and Spain, with the potential of being expanded across different regions, taking into account various occupant behaviors and energy consumption patterns, in order to achieve a higher energy efficiency.
Data was collected from households in three pilot sites, and it was accessed by a REST API developed by Hypertech. Challenges such as the COVID-19 pandemic, component shortages, and delays in logistical infrastructure reduced the number of operational households to 173 (down from 400 predicted), with the available data only covering six months instead of a full year. The quality of the data was further affected by inconsistent data types and missing metrics.
The DT model was developed using filtered, standardized data, including energy loads, data from sensors, and motion alarms. Households were grouped by key characteristics (e.g., presence of PV or DHW) in order to improve identification of patterns. Only data from households with reliable motion alarms were used to estimate occupancy behavior. The emergent data limitations led to a baseline scenario focusing on 18 Austrian and 10 Spanish households. Replication was conducted by increasing the number of virtual households by 20% steps.
Despite not having homogeneous data and the reduced number of operational households, the DT model showed promising results. Comparisons between measured data and DT results showed that DT could replicate power consumption and luminance trends in both Austrian and Spanish households. The results show good agreement and indicate that the DT model is able to reproduce occupancy-determined energy demand in heterogeneous conditions. The quantitative validation of DT further supports its ability to successfully replicate both power consumption and luminance in different households in Austria and Spain. NRMSE values remained below 0.30, confirming that the model accurately reproduces power consumption and luminance depending on occupancy.
The study was affected by several methodological limitations. The relatively small dataset and six-month monitoring period limit the reliability of the results. Using only households with reliable motion alarms may cause errors in estimated values, while grouping households based on the presence of PVs or DHW systems may simplify the behavioral variability. Replication through virtual households may also not fully reflect the real-world heterogeneity, highlighting the need for standardized sensors and improved data quality.
However, future efforts should focus on expanding the number of involved households and their available data, improving data quality, and ensuring longer periods of data collection to capture seasonal and behavioral variability more accurately.
Author Contributions
Conceptualization, E.D., D.D. and J.T.; methodology, E.D., D.D. and J.T.; software, E.D. and D.D.; validation, J.T. and H.-T.T.; formal analysis, D.D.; investigation, E.D.; resources, J.T. and H.-T.T.; data curation, E.D.; writing—original draft preparation, E.D.; writing—review and editing, D.D. and J.T.; visualization, E.D.; supervision, J.T. and H.-T.T.; project administration, J.T. and H.-T.T.; funding acquisition, J.T. and H.-T.T. All authors have read and agreed to the published version of the manuscript.
Funding
This project has received funding from the European Union’s Horizon 2020 research and innovation program under grant agreement No. 957755 (SENDER). This output reflects only the author’s view and the European Union cannot be held responsible for any use that may be made of the information contained therein.
Data Availability Statement
The original contributions presented in this study are included in the article. Further inquiries can be directed to the corresponding author.
Conflicts of Interest
Authors Dimitra Douvi and Eleni Douvi were employed by the company Paragon S.A. Jason Tsahalis and Haralabos-Theodoros Tsahalis are owners of the company Paragon S.A. All authors declare that the research was conducted in the absence of any commercial or financial relationships that could be construed as a potential conflict of interest.
Abbreviations
The following abbreviations are used in this manuscript:
| SENDER | Sustainable Consumer Engagement and Demand Response |
| DR | Demand Response |
| RES | Renewable Energy Sources |
| DT | Digital Twin |
| BIM | Building Information Modeling |
| BEMS | Building Energy Management Systems |
| REST | Representational State Transfer |
| API | Application Programming Interface |
| IML | Information Management Layer |
| DHW | Domestic Hot Water |
| HVAC | Heating, Ventilation, and Air-Conditioning |
| PVs | Photovoltaics |
| EV | Electric Vehicle |
| B.S. | Baseline Scenario |
| MAE | Mean Absolute Error |
| RMSE | Root Mean Square Error |
| NRMSE | Normalized RMSE |
References
- Crippa, M.; Guizzardi, D.; Pagani, F.; Banja, M.; Muntean, M.; Schaaf, E.; Quadrelli, R.; Risquez Martin, A.; Taghavi-Moharamli, P.; Köykkä, J.; et al. GHG Emissions of All World Countries—2025 Report; JRC143227; Publications Office of the European Union: Luxembourg, 2025. [Google Scholar] [CrossRef]
- International Energy Agency (IEA). World Energy Outlook 2025; IEA: Paris, France, 2025; Available online: https://www.iea.org/reports/world-energy-outlook-2025 (accessed on 2 December 2024).
- Tao, F.; Zhang, H.; Liu, A.; Nee, A.Y.C. Digital Twin in Industry: State-of-the-Art. IEEE Trans. Ind. Inform. 2019, 15, 2405–2415. [Google Scholar] [CrossRef] [Scilit]
- Bayer, D.; Pruckner, M. A digital twin of a local energy system based on real smart meter data. Energy Inform. 2023, 6, 8. [Google Scholar] [CrossRef] [Scilit]
- Eshraghi, H.; de Queiroz, A.; Sankarasubramanian, A.; DeCarolis, J. Quantification of climate-induced interannual variability in residential U.S. electricity demand. Energy 2021, 236, 121273. [Google Scholar] [CrossRef] [Scilit]
- Plazas-Niño, F.; Ortiz-Pimiento, N.; Montes-Páez, E. National energy system optimisation modelling for decarbonisation pathways analysis: A systematic literature review. Renew. Sustain. Energy Rev. 2022, 162, 112406. [Google Scholar] [CrossRef] [Scilit]
- Agostinelli, S.; Cumo, F.; Guidi, G.; Tomazzoli, C. Cyber-Physical Systems Improving Building Energy Management: Digital Twin and Artificial Intelligence. Energies 2021, 14, 2338. [Google Scholar] [CrossRef] [Scilit]
- Alam, K.; El Saddik, A. C2PS: A digital twin architecture reference model for the cloud-based cyber-physical systems. IEEE Access 2017, 5, 2050–2062. [Google Scholar] [CrossRef] [Scilit]
- Starkey, J.; Hancock, C.P.; Chen, L.L.; Meng, Q. Digital twinning proof of concept for utility-scale solar: Benefits, issues, and enablers. Int. Arch. Photogramm. Remote Sens. Spat. Inf. Sci. 2022, XLVI-5/W1, 231–237. [Google Scholar] [CrossRef] [Scilit]
- Ferrigno, E.; Barsola, G.A. 3D Real Time Digital Twin. In Proceedings of the SPE Latin American and Caribbean Petroleum Engineering Conference, Port of Spain, Trinidad and Tobago, 14–15 June 2023. [Google Scholar] [CrossRef] [Scilit]
- Tumburu, C.; Balija, A.; Kumaran, S.R.R.; Singh, B. Digital Twins—Enabling Technologies Including AI, Sensors, Cloud, and Edge Computing. In Handbook of Research on Applications of AI, Digital Twin, and Internet of Things for Sustainable Development; Mishra, B.K., Ed.; IGI Global Scientific Publishing: Palmdale, PA, USA, 2023; pp. 306–331. [Google Scholar] [CrossRef] [Scilit]
- Gupta, M.; Khan, N. Digital Twin—Understanding, Current Progressions, and Future Perspectives. In Handbook of Research on Applications of AI, Digital Twin, and Internet of Things for Sustainable Development; Mishra, B.K., Ed.; IGI Global Scientific Publishing: Palmdale, PA, USA, 2023; pp. 332–343. [Google Scholar] [CrossRef] [Scilit]
- Shafto, M.; Conroy, M.; Doyle, R.; Glaessgen, E.; Kemp, C.; LeMoigne, J.; Wang, L. Modeling, Simulation, Information Technology and Processing Roadmap; National Aeronautics and Space Administration (NASA): Washington, DC, USA, 2010.
- Wright, L.; Davidson, S. How to tell the difference between a model and a digital twin. Adv. Model. Simul. Eng. Sci. 2020, 7, 13. [Google Scholar] [CrossRef] [Scilit]
- Vasumathi, M.T.; Khan, A.; Sadasivan, M.; Ramamoorthy, U. Digital Twins—A Futuristic Trend in Data Science, Its Scope, Importance, and Applications. In Expert Clouds and Applications; Jeena Jacob, I., Kolandapalayam Shanmugam, S., Izonin, I., Eds.; Lecture Notes in Networks and Systems; Springer: Singapore, 2023; Volume 673. [Google Scholar] [CrossRef] [Scilit]
- Jadhav, S.G.; Sarnikar, S. Digital Twin of a Digital World: Process, Data, and Experience Perspectives. IT Prof. 2023, 25, 68–73. [Google Scholar] [CrossRef] [Scilit]
- Li, Q.; Cui, Z.; Cai, Y.; Su, Y. Multi-objective operation of solar-based microgrids incorporating artificial neural network and grey wolf optimizer in digital twin. Sol. Energy 2023, 262, 111873. [Google Scholar] [CrossRef] [Scilit]
- Akbari, E.; Zare Ghaleh Seyyedi, A. Power quality enhancement of distribution grid using a photovoltaic-based hybrid active power filter with three-level converter. Energy Rep. 2023, 9, 5432–5448. [Google Scholar] [CrossRef] [Scilit]
- Yuan, G.; Xie, F. Digital twin-based economic assessment of solar energy in smart microgrids using reinforcement learning technique. Sol. Energy 2023, 250, 398–408. [Google Scholar] [CrossRef] [Scilit]
- do Amaral, J.V.S.; Santos, C.; Montevechi, J.A.B.; de Queiroz, A.R. Energy digital twin applications: A review. Renew. Sustain. Energy Rev. 2023, 188, 113891. [Google Scholar] [CrossRef] [Scilit]
- Khan, M.A.; Çamur, H.; Kassem, Y. Modeling predictive assessment of wind energy potential as a power generation source at some selected locations in Pakistan. Model. Earth Syst. Environ. 2019, 5, 555–569. [Google Scholar] [CrossRef] [Scilit]
- Batarseh, F.A.; Freeman, L.; Huang, C.H. A survey on artificial intelligence assurance. J. Big Data 2021, 8, 60. [Google Scholar] [CrossRef] [Scilit]
- Wang, X.; Liu, S. Novel economic models for advancing urban energy management and transition: Simulation of urban energy system in digital twin. Sustain. Cities Soc. 2024, 101, 105154. [Google Scholar] [CrossRef] [Scilit]
- Artetxe, E.; Uralde, J.; Barambones, O.; Calvo, I.; Martin, I. Maximum Power Point Tracker Controller for Solar Photovoltaic Based on Reinforcement Learning Agent with a Digital Twin. Mathematics 2023, 11, 2166. [Google Scholar] [CrossRef] [Scilit]
- Semeraro, C.; Lezoche, M.; Panetto, H.; Dassisti, M. Digital twin paradigm: A systematic literature review. Comput. Ind. 2021, 130, 103469. [Google Scholar] [CrossRef] [Scilit]
- Ghenai, C.; Husein, L.; Al Nahlawi, M.; Hamid, A.; Bettayeb, M. Recent trends of digital twin technologies in the energy sector: A comprehensive review. Sustain. Energy Technol. Assess. 2022, 54, 102837. [Google Scholar] [CrossRef] [Scilit]
- Singh, S.K.; Kumar, M.; Tanwar, S.; Park, J. GRU-based Digital Twin Framework for Data Allocation and Storage in IoT-enabled Smart Home Networks. Future Gener. Comput. Syst. 2023, 153, 391–402. [Google Scholar] [CrossRef] [Scilit]
- Mahmoudi Rashid, S. A Novel Voltage Control System Based on Deep Neural Networks for MicroGrids Including Communication Delay as a Complex and Large-Scale System. ISA Trans. 2025, 158, 344–362. [Google Scholar] [CrossRef] [Scilit] [PubMed]
- Corssac, L.B.; Wickboldt, J.A. A Digital Twin-based Smart Home: A Proof of Concept Study. arXiv 2022, arXiv:2212.14238. [Google Scholar] [CrossRef] [Scilit]
- Bouchabou, D.; Grosset, J.; Nguyen, S.; Lohr, C.; Puig, X. A Smart Home Digital Twin to Support the Recognition of Activities of Daily Living. Sensors 2023, 23, 7586. [Google Scholar] [CrossRef] [Scilit] [PubMed]
- Teng, M.; Al-Hamdawee, Z.M.A.; Ali, A.B.M.; Jin, K.; Ahmadi, M. Integrating digital twins and neural networks for real-time temperature management in smart homes: An innovative approach using ZigBee networks. Energy Rep. 2025, 13, 6201–6218. [Google Scholar] [CrossRef] [Scilit]
- SENDER H2020. SENDER Project. Available online: https://www.sender-h2020.eu/sender-project/ (accessed on 1 November 2023).
- Farré, M.; Lafforgue, H.; Genest, O.; Kazmi, J.; Pitsiladis, G. Interoperable Architecture Report. Deliverable D3.1; TRIALOG, AIT, HPT: 2023. Available online: https://www.sender-h2020.eu/wp-content/uploads/2023/10/Attachment_0-23.pdf (accessed on 3 December 2025).
- Grieves, M.; Vickers, J. Digital Twin: Mitigating unpredictable, undesirable emergent behavior in complex systems. In Transdisciplinary Perspectives on Complex Systems; Springer: Cham, Switzerland, 2017. [Google Scholar]
- Qi, Q.; Tao, F. Digital Twin and Big Data towards Smart Manufacturing and Industry 4.0: 360 Degree Comparison. IEEE Access 2018, 6, 3585–3593. [Google Scholar] [CrossRef] [Scilit]
- Lu, Y.; Liu, C.; Kevin, I.; Wang, K.; Huang, H.; Xu, X. Digital Twin-driven smart manufacturing: Connotation, reference model, applications and research issues. Robot. Comput. Integr. Manuf. 2020, 61, 101837. [Google Scholar] [CrossRef] [Scilit]
- Fuller, A.; Fan, Z.; Day, C.; Barlow, C. Digital Twin: Enabling Technologies, Challenges and Open Research. IEEE Access 2020, 8, 108952–108971. [Google Scholar] [CrossRef] [Scilit]
- Boje, C.; Guerriero, A.; Kubicki, S.; Rezgui, Y. Towards a semantic Construction Digital Twin: Directions for future research. Autom. Constr. 2020, 114, 103179. [Google Scholar] [CrossRef] [Scilit]
- Cespedes-Cubides, A.S.; Jradi, M. A review of building digital twins to improve energy efficiency in the building operational stage. Energy Inform. 2024, 7, 11. [Google Scholar] [CrossRef] [Scilit]
- Arsecularatne, B.; Rodrigo, N.; Chang, R. Digital Twins for Reducing Energy Consumption in Buildings: A Review. Sustainability 2024, 16, 9275. [Google Scholar] [CrossRef] [Scilit]
- Sghiri, A.; Gallab, M.; Merzouk, S.; Assoul, S. Leveraging Digital Twins for Enhancing Building Energy Efficiency: A Literature Review of Applications, Technologies, and Challenges. Buildings 2025, 15, 498. [Google Scholar] [CrossRef] [Scilit]
- Boukaf, M.; Fadli, F.; Meskin, N. A comprehensive review of digital twin technology in building energy consumption forecasting. IEEE Access 2024, 12, 187778–187799. [Google Scholar] [CrossRef] [Scilit]
- Ghaemi, A.; Rezgui, Y.; Petri, I.; Beach, T.; Ghoroghi, A. AI and digital twin applications in building energy management: A state-of-the-art review. In Proceedings of the 2025 IEEE International Conference on Engineering, Technology, and Innovation (ICE/ITMC), Valencia, Spain, 16–19 June 2025; pp. 1–11. [Google Scholar] [CrossRef] [Scilit]
- Han, F.; Du, F.; Jiao, S.; Zou, K. Predictive Analysis of a Building’s Power Consumption Based on Digital Twin Platforms. Energies 2024, 17, 3692. [Google Scholar] [CrossRef] [Scilit]
- Hodavand, F.; Ramaji, I.; Sadeghi, N.; Zandi Goharrizi, S. Digital Twin-Enabled Framework for Intelligent Monitoring and Anomaly Detection in Multi-Zone Building Systems. Buildings 2025, 15, 4030. [Google Scholar] [CrossRef] [Scilit]
- Iqbal, F.; Mirzabeigi, S. Digital Twin-Enabled Building Information Modeling–Internet of Things (BIM-IoT) Framework for Optimizing Indoor Thermal Comfort Using Machine Learning. Buildings 2025, 15, 1584. [Google Scholar] [CrossRef] [Scilit]
- Xie, X.; Merino, J.; Moretti, N.; Pauwels, P.; Chang, J.Y.; Parlikad, A. Digital twin enabled fault detection and diagnosis process for building HVAC systems. Autom. Constr. 2023, 146, 104695. [Google Scholar] [CrossRef] [Scilit]
- Liu, L.; Zeng, N.; Liu, Y.; Han, D.; König, M. Multi-domain data integration and management for enhancing service-oriented digital twin for infrastructure operation and maintenance. Develop. Built Environ. 2024, 18, 100475. [Google Scholar] [CrossRef] [Scilit]
- Zhao, J.; Feng, H.; Chen, Q.; Garcia de Soto, B. Developing a conceptual framework for the application of digital twin technologies to revamp building operation and maintenance processes. J. Build. Eng. 2022, 49, 104028. [Google Scholar] [CrossRef] [Scilit]
- Talei, H.; Benhaddou, D.; Gamarra, C.; Benbrahim, H.; Essaaidi, M. Smart Building Energy Inefficiencies Detection through Time Series Analysis and Unsupervised Machine Learning. Energies 2021, 14, 6042. [Google Scholar] [CrossRef] [Scilit]
- Ardiyanto, D.; Pipattanasomporn, M.; Rahman, S.; Hariyanto, N.S. Occupant-based HVAC Set Point Interventions for Energy Savings in Buildings. In Proceedings of the 2018 International Conference and Utility Exhibition on Green Energy for Sustainable Development (ICUE), Phuket, Thailand, 24–26 October 2018; IEEE: Piscataway, NJ, USA, 2018; pp. 1–6. [Google Scholar] [CrossRef] [Scilit]
- Capozzoli, A.; Piscitelli, M.S.; Gorrino, A.; Ballarini, I.; Corrado, V. Data analytics for occupancy pattern learning to reduce the energy consumption of HVAC systems in office buildings. Sustain. Cities Soc. 2017, 35, 191–208. [Google Scholar] [CrossRef] [Scilit]
- Fan, C.; Xiao, F.; Wang, S. Development of prediction models for next-day building energy consumption and peak power demand using data mining techniques. Appl. Energy 2014, 127, 1–10. [Google Scholar] [CrossRef] [Scilit]
- D’Oca, S.; Hong, T. A data-mining approach to discover patterns of window opening and closing behavior in offices. Build. Environ. 2014, 82, 726–739. [Google Scholar] [CrossRef] [Scilit]
- Anan, M.; Kanaan, K.; Benhaddou, D.; Nasser, N.; Qolomany, B.; Talei, H.; Sawalmeh, A. Occupant-Aware Energy Consumption Prediction in Smart Buildings Using a LSTM Model and Time Series Data. Energies 2024, 17, 6451. [Google Scholar] [CrossRef] [Scilit]
- Mylonas, A.; Tsangrassoulis, A.; Pascual, J. Modelling occupant behaviour in residential buildings: A systematic literature review. Build. Environ. 2024, 265, 111959. [Google Scholar] [CrossRef] [Scilit]
- Reis, D.V.A.; Loomans, M.G.L.C.; Hajdukiewicz, M. A systematic literature review on occupant behaviour modelling for residential building performance simulation in future climate change scenarios. Build. Environ. 2026, 287, 113796. [Google Scholar] [CrossRef] [Scilit]
- Banfi, A.; Ferrando, M.; Li, P.; Shi, X.; Causone, F. Integrating Occupant Behaviour into Urban-Building Energy Modelling: A Review of Current Practices and Challenges. Energies 2024, 17, 4400. [Google Scholar] [CrossRef] [Scilit]
- Hosamo, H.H.; Nielsen, H.K.; Kraniotis, D.; Svennevig, P.R.; Svidt, K. Improving building occupant comfort through a digital twin approach: A Bayesian network model and predictive maintenance method. Energy Build. 2023, 288, 112992. [Google Scholar] [CrossRef] [Scilit]
- Lee, S.; Karava, P.; Tzempelikos, A.; Bilionis, I. Inference of thermal preference profiles for personalized thermal environments with actual building occupants. Build. Environ. 2019, 148, 714–729. [Google Scholar] [CrossRef] [Scilit]
- Feng, Y.; Liu, S.; Wang, J.; Yang, J.; Jao, Y.-L.; Wang, N. Data-driven personal thermal comfort prediction: A literature review. Renew. Sustain. Energy Rev. 2022, 161, 112357. [Google Scholar] [CrossRef] [Scilit]
- Hypertech, S.A. Digital Transformation, Communication, Innovation. Available online: https://www.hypertech.gr/ (accessed on 6 April 2024).
- ACCEPT—Active Communities & Energy Prosumers for the Energy Transition Project; European Union Horizon 2020 Programme, Grant Agreement No. 957781; Digital Toolbox for Energy Communities; 1 January 2021–31 December 2024. Available online: https://www.accept-project.eu/ (accessed on 22 December 2025).
- HESTIA—Holistic dEmand Response Services for European Residential Communities; European Union Horizon 2020 Programme; 1 November 2020–31 October 2023. Available online: https://hestia-eu.com/ (accessed on 22 December 2025).
- iFLEX—Intelligent Assistants for Flexibility Management Project; European Union Horizon 2020 Programme, Grant Agreement No. 957670; Empowering Energy Consumers to Participate in Demand Response via Intelligent Personal Assistants and Flexibility Management Tools; 1 November 2020–30 April 2024. Available online: https://www.iflex-project.eu/ (accessed on 22 December 2025).
- ReDREAM—Real Consumer Engagement Through a New User-Centric Ecosystem Development for End-Users’ Assets in a Multi-Market Scenario; European Union Horizon 2020 Programme, Grant Agreement No. 957837; Open, Co-Creative Energy Ecosystem Empowering Consumer Participation in Electricity Market; October 2020–September 2023. Available online: https://redream-energy-network.eu/ (accessed on 22 December 2025).
- Douvi, D.; Douvi, E.; Tsahalis, J.; Tsahalis, H.-T. A consumer digital twin for energy demand prediction: Development and implementation under the SENDER project (Horizon 2020). In Proceedings of the 11th International Conference on Experiments/Process/System Modeling/Simulation/Optimization (11th IC-EPSMSO), Loutraki, Greece, 2–5 July 2025. [Google Scholar]
- Douvi, D.; Douvi, E.; Tsahalis, J.; Tsahalis, H.-T. A Consumer Digital Twin for Energy Demand Prediction: Development and Implementation Under the SENDER Project (HORIZON 2020). Computation 2026, 14, 9. [Google Scholar] [CrossRef] [Scilit]

Disclaimer/Publisher’s Note: The statements, opinions and data contained in all publications are solely those of the individual author(s) and contributor(s) and not of MDPI and/or the editor(s). MDPI and/or the editor(s) disclaim responsibility for any injury to people or property resulting from any ideas, methods, instructions or products referred to in the content. |
© 2026 by the authors. Licensee MDPI, Basel, Switzerland. This article is an open access article distributed under the terms and conditions of the Creative Commons Attribution (CC BY) license.