


Abstract
Fuel scarcity remains a recurrent challenge in Nigeria, with significant socioeconomic consequences despite the country’s status as a major crude oil producer. This study develops a novel deterministic mathematical model to examine the dynamics of petroleum product distribution in Nigeria’s downstream sector, with particular emphasis on Premium Motor Spirit (PMS). The model explicitly incorporates key disruption and behavioral mechanisms: pipeline vandalism, industrial actions, product diversion, and hoarding that collectively drive persistent fuel shortages. The model’s feasibility, positivity of solutions, and existence and uniqueness were established, ensuring consistency with real-world operational conditions. Five equilibrium points were identified, reflecting distinct operational regimes within the distribution network. A critical distribution threshold was analytically derived and numerically validated, revealing that a minimum supply of approximately 42 million liters of PMS per day is required to satisfy demand and eliminate fuel queues. Local and global stability analyses, conducted using Lyapunov functions and the Routh–Hurwitz criteria, demonstrate that stable fuel distribution is achievable under effective policy coordination and stakeholder compliance. Numerical simulations show that hoarding by private retail marketers substantially intensifies scarcity, while industrial actions by transporters exert a more severe disruption than pipeline vandalism. The results further highlight the stabilizing role of alternative transportation routes, such as rail systems, in mitigating infrastructure failures and road-based logistics risks. Although refinery sources are aggregated and rail transport is idealized, the proposed framework offers a robust and adaptable tool for policy analysis, with relevance to both oil-producing and fuel-import-dependent economies.
1. Introduction
Petroleum products remain central to Nigeria’s economic and social functioning, supplying energy for transportation, industrial production, electricity generation, and household consumption. Despite its strategic importance, the downstream petroleum sector has been persistently characterized by supply disruptions, long queues, and recurrent scarcity of refined products, particularly Premium Motor Spirit (PMS). These challenges have constrained economic growth, elevated transaction costs, and imposed significant welfare losses on households and businesses. Addressing these persistent shortages requires not only policy reforms but also a rigorous, system-level understanding of the structural and behavioral mechanisms governing fuel distribution.
Crude oil exploration in Nigeria dates back to 1908 with the activities of Shell Darcy in present-day Ondo State [1,2,3,4,5], culminating in the discovery of oil in commercial quantities at Oloibiri, Rivers State, in 1956 [3]. By 1958, Nigeria had commenced commercial production at a rate of 5100 barrels per day [6,7,8], laying the foundation for its emergence as a major oil-producing nation. Since then, crude oil production has expanded substantially [9], positioning Nigeria as Africa’s leading crude oil producer and exporter [1,10,11].
Paradoxically, this abundance has not translated into domestic energy security. Nigeria operates four major refineries with a combined installed capacity of approximately 445,000 barrels per day [10,12,13], supplemented by six modular refineries commissioned between 2020 and 2022 with an additional capacity of about 41,000 barrels per day [11]. Nevertheless, domestic refining capacity has remained insufficient and unreliable, resulting in heavy dependence on imported refined petroleum products [14,15,16]. Estimates suggest that up to 95% of refined fuel consumed domestically is imported [6,11,17], exposing the economy to external price shocks, foreign exchange pressures, and logistical vulnerabilities.
Beyond supply inadequacies, structural inefficiencies in fuel distribution have compounded scarcity. Aging pipeline infrastructure, frequent vandalism, road transport constraints, hoarding by retail marketers, diversion of products, and cross-border smuggling particularly of PMS to neighboring countries with higher prices continue to undermine availability and market stability [18,19,20]. Despite multiple reform attempts spanning military and civilian administrations, these challenges have proven persistent [21], reflecting the complex interaction between infrastructure, institutions, and human behavior.
Recent policy interventions, including the removal of fuel subsidies and the enactment of the Petroleum Industry Act (PIA) [22], seek to address long-standing inefficiencies and attract private investment into the downstream sector [13,23,24]. In parallel, the commencement of operations at the Dangote Refinery in January 2024 represents a potentially transformative development for domestic fuel supply [25]. While these reforms signal progress, concerns remain regarding transportation bottlenecks, inadequate integration of logistics into regulatory frameworks, and the sector’s resilience to behavioral and infrastructural disruptions.
From a modeling perspective, several mathematical and economic studies have examined aspects of the downstream oil sector, including supply chain optimization, pricing mechanisms, transportation logistics, and market coordination [19,26,27,28,29,30,31,32,33,34,35]. However, existing models largely treat these components in isolation. In particular, there is a notable absence of mechanistic frameworks that simultaneously integrate infrastructure disruptions (such as pipeline vandalism), behavioral responses (including hoarding and diversion), and dynamic flow propagation across distribution stages within a single, country-specific system calibrated to Nigeria’s downstream petroleum sector.
This study addresses this gap by developing a novel compartmental mathematical model that captures the coupled dynamics of refined fuel source, transportation, retail distribution, and consumption under both infrastructural and behavioral disruptions.
Overall, this work offers a structured analytical framework for understanding Nigeria’s downstream fuel distribution challenges in both pre- and post-subsidy regimes. Beyond its immediate application, the model provides a quantitative basis for policy evaluation, infrastructure planning, and future extensions involving optimal control, stochastic effects, and cost-effectiveness analysis.
The remainder of this article is organized as follows. Section 2 presents the materials and methodology, including the model formulation and underlying assumptions. Section 3 details the qualitative and quantitative analyses, simulation results, and discussion. Section 4 concludes with a summary of results, insights, limitations, and directions for future research.
2. Materials and Methodology
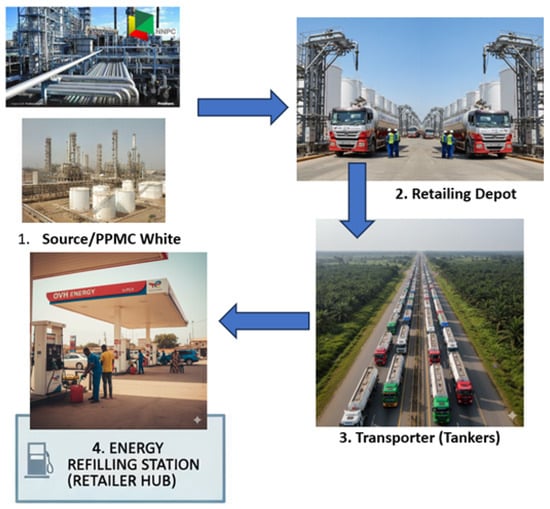
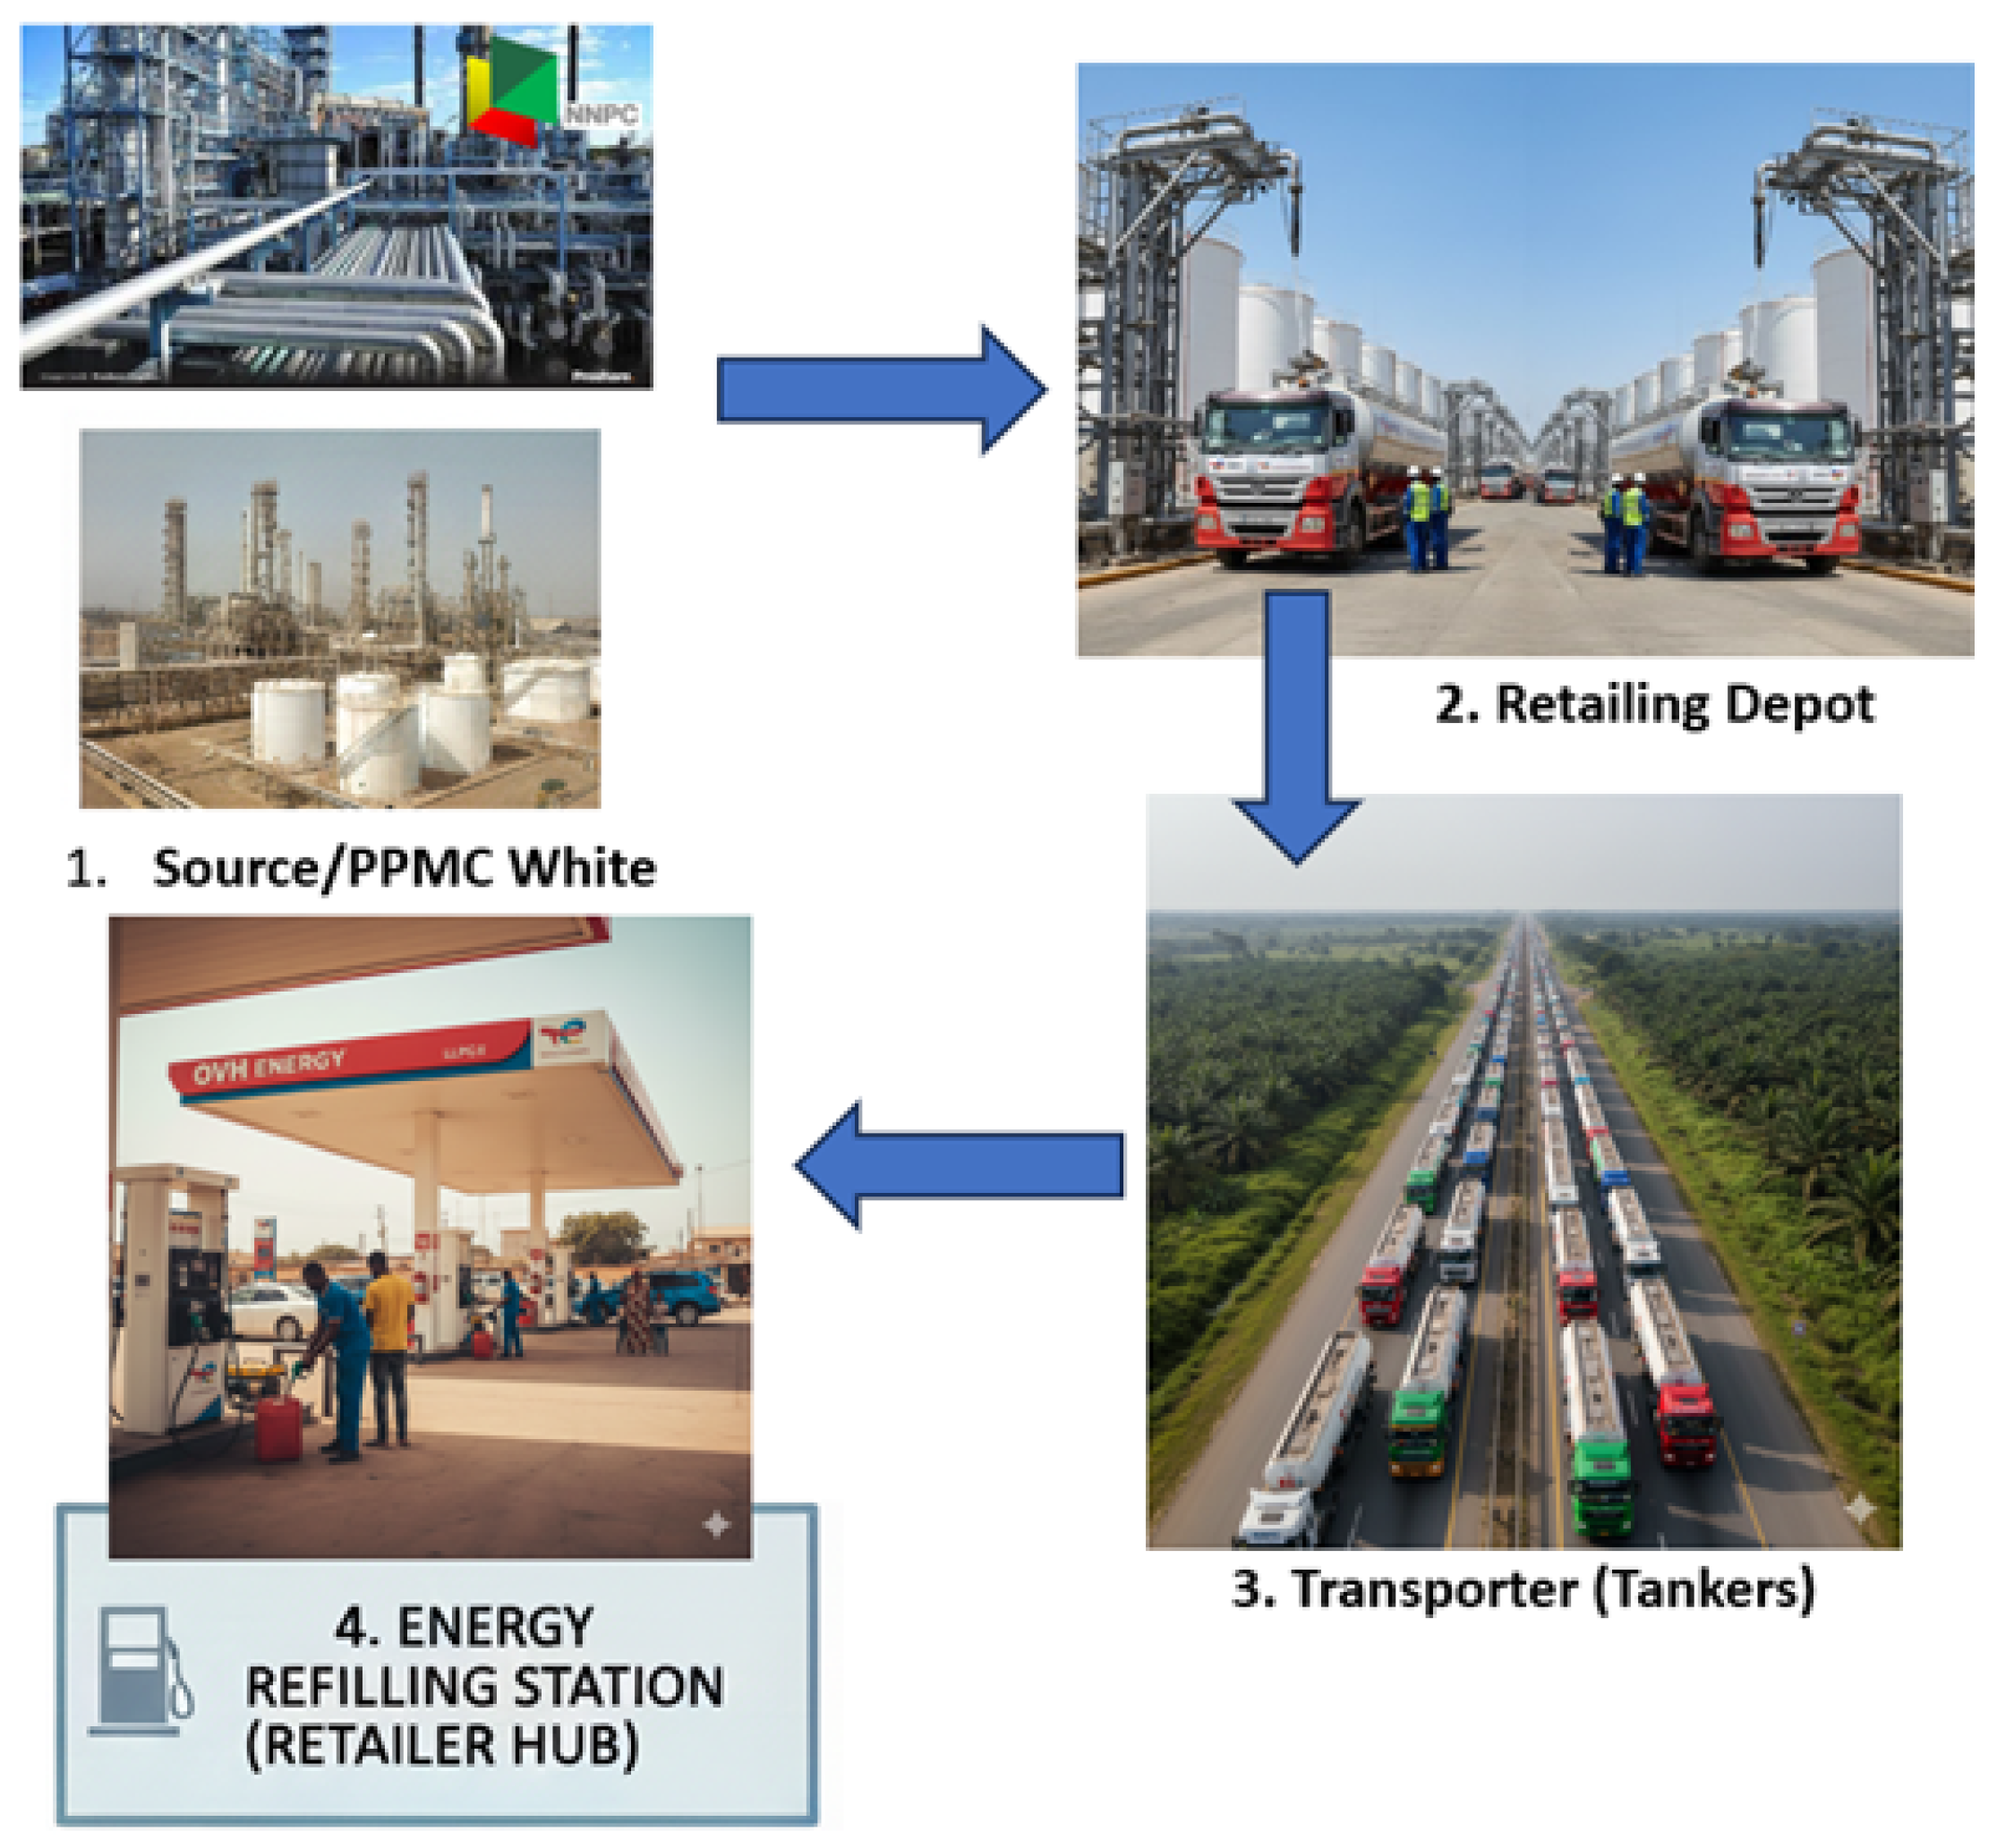
To investigate the dynamics of Nigeria’s downstream oil and gas sector, this study adopts a compartmental modelling framework formulated as a system of autonomous ordinary differential equations (ODEs). The framework decomposes the downstream supply chain into interacting compartments representing key functional entities: refined product sources and storage facilities (Q), retail distribution hubs (depots, A), transporters (oil and gas workers), and consumers [3,36]. The interactions among these compartments are illustrated using a socioeconomic flow diagram (Figure 1).
Figure 1.
Socioeconomic flow of the Nigeria Downstream oil sector.
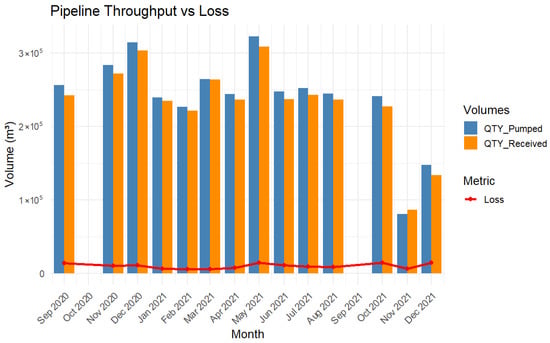
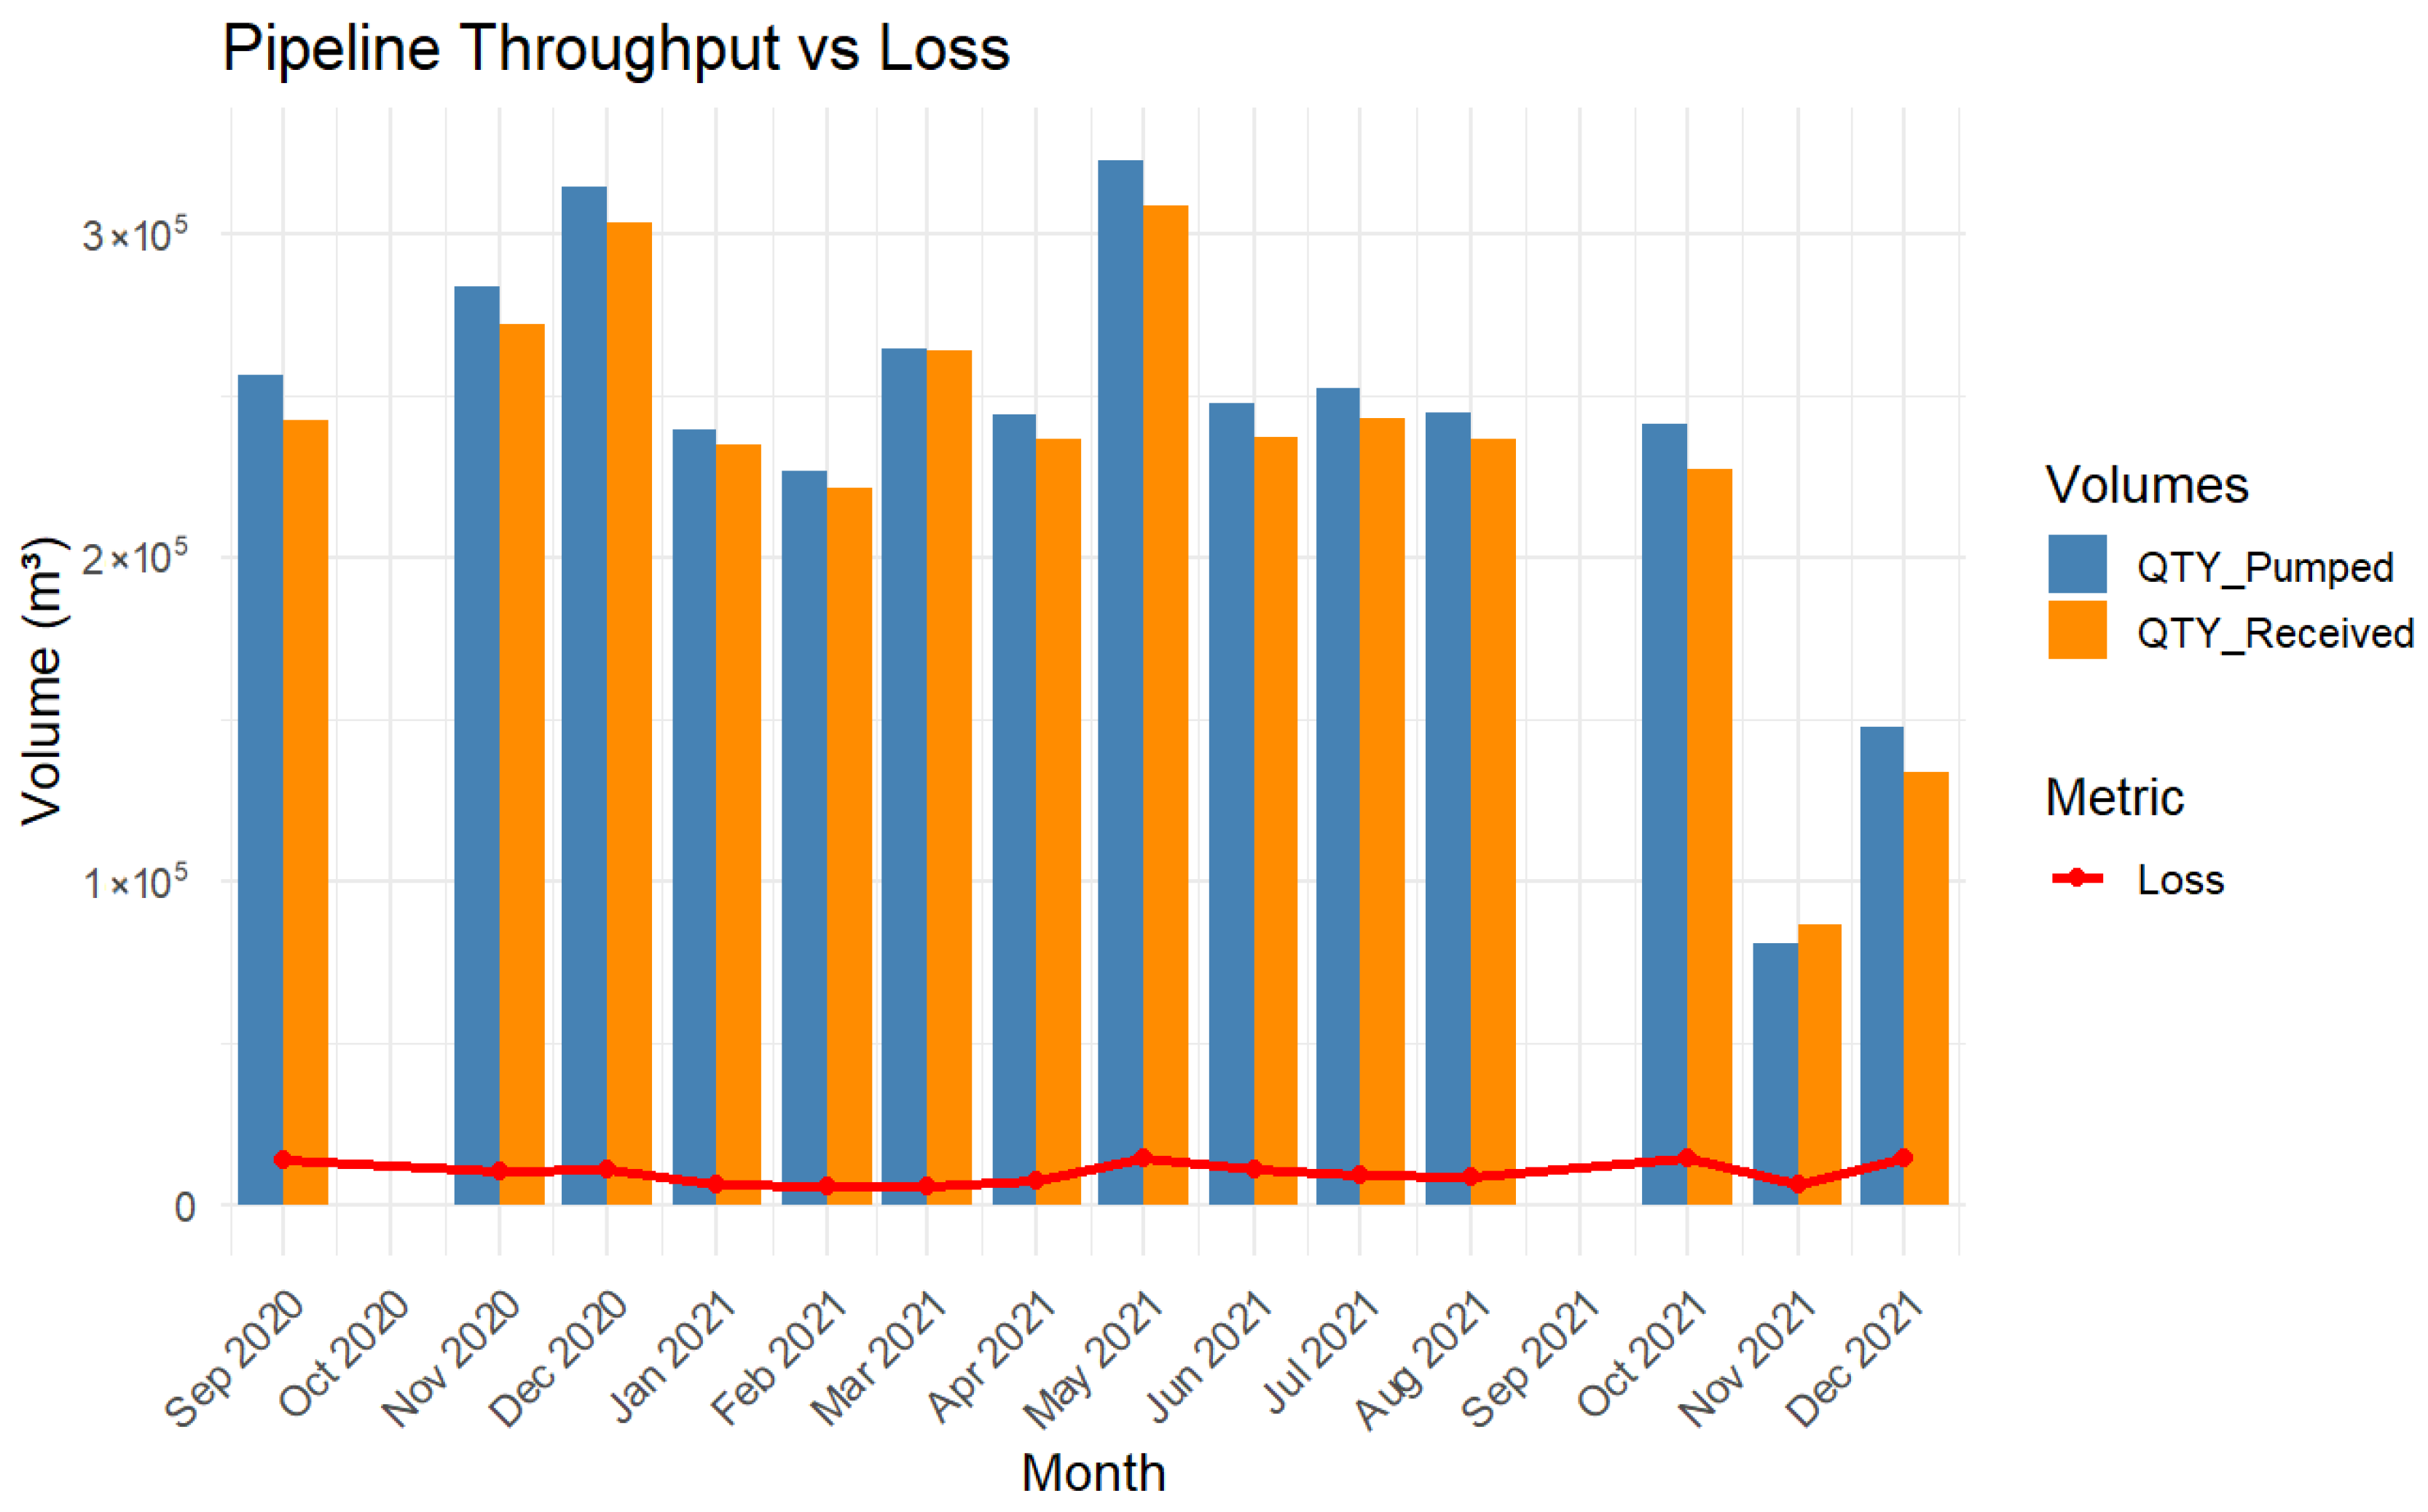
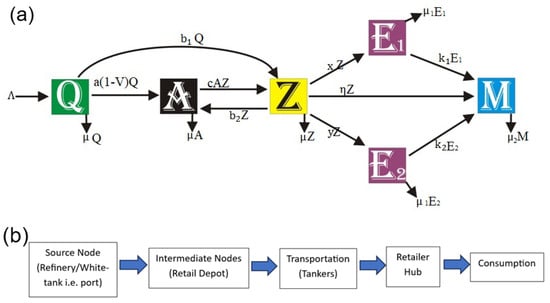
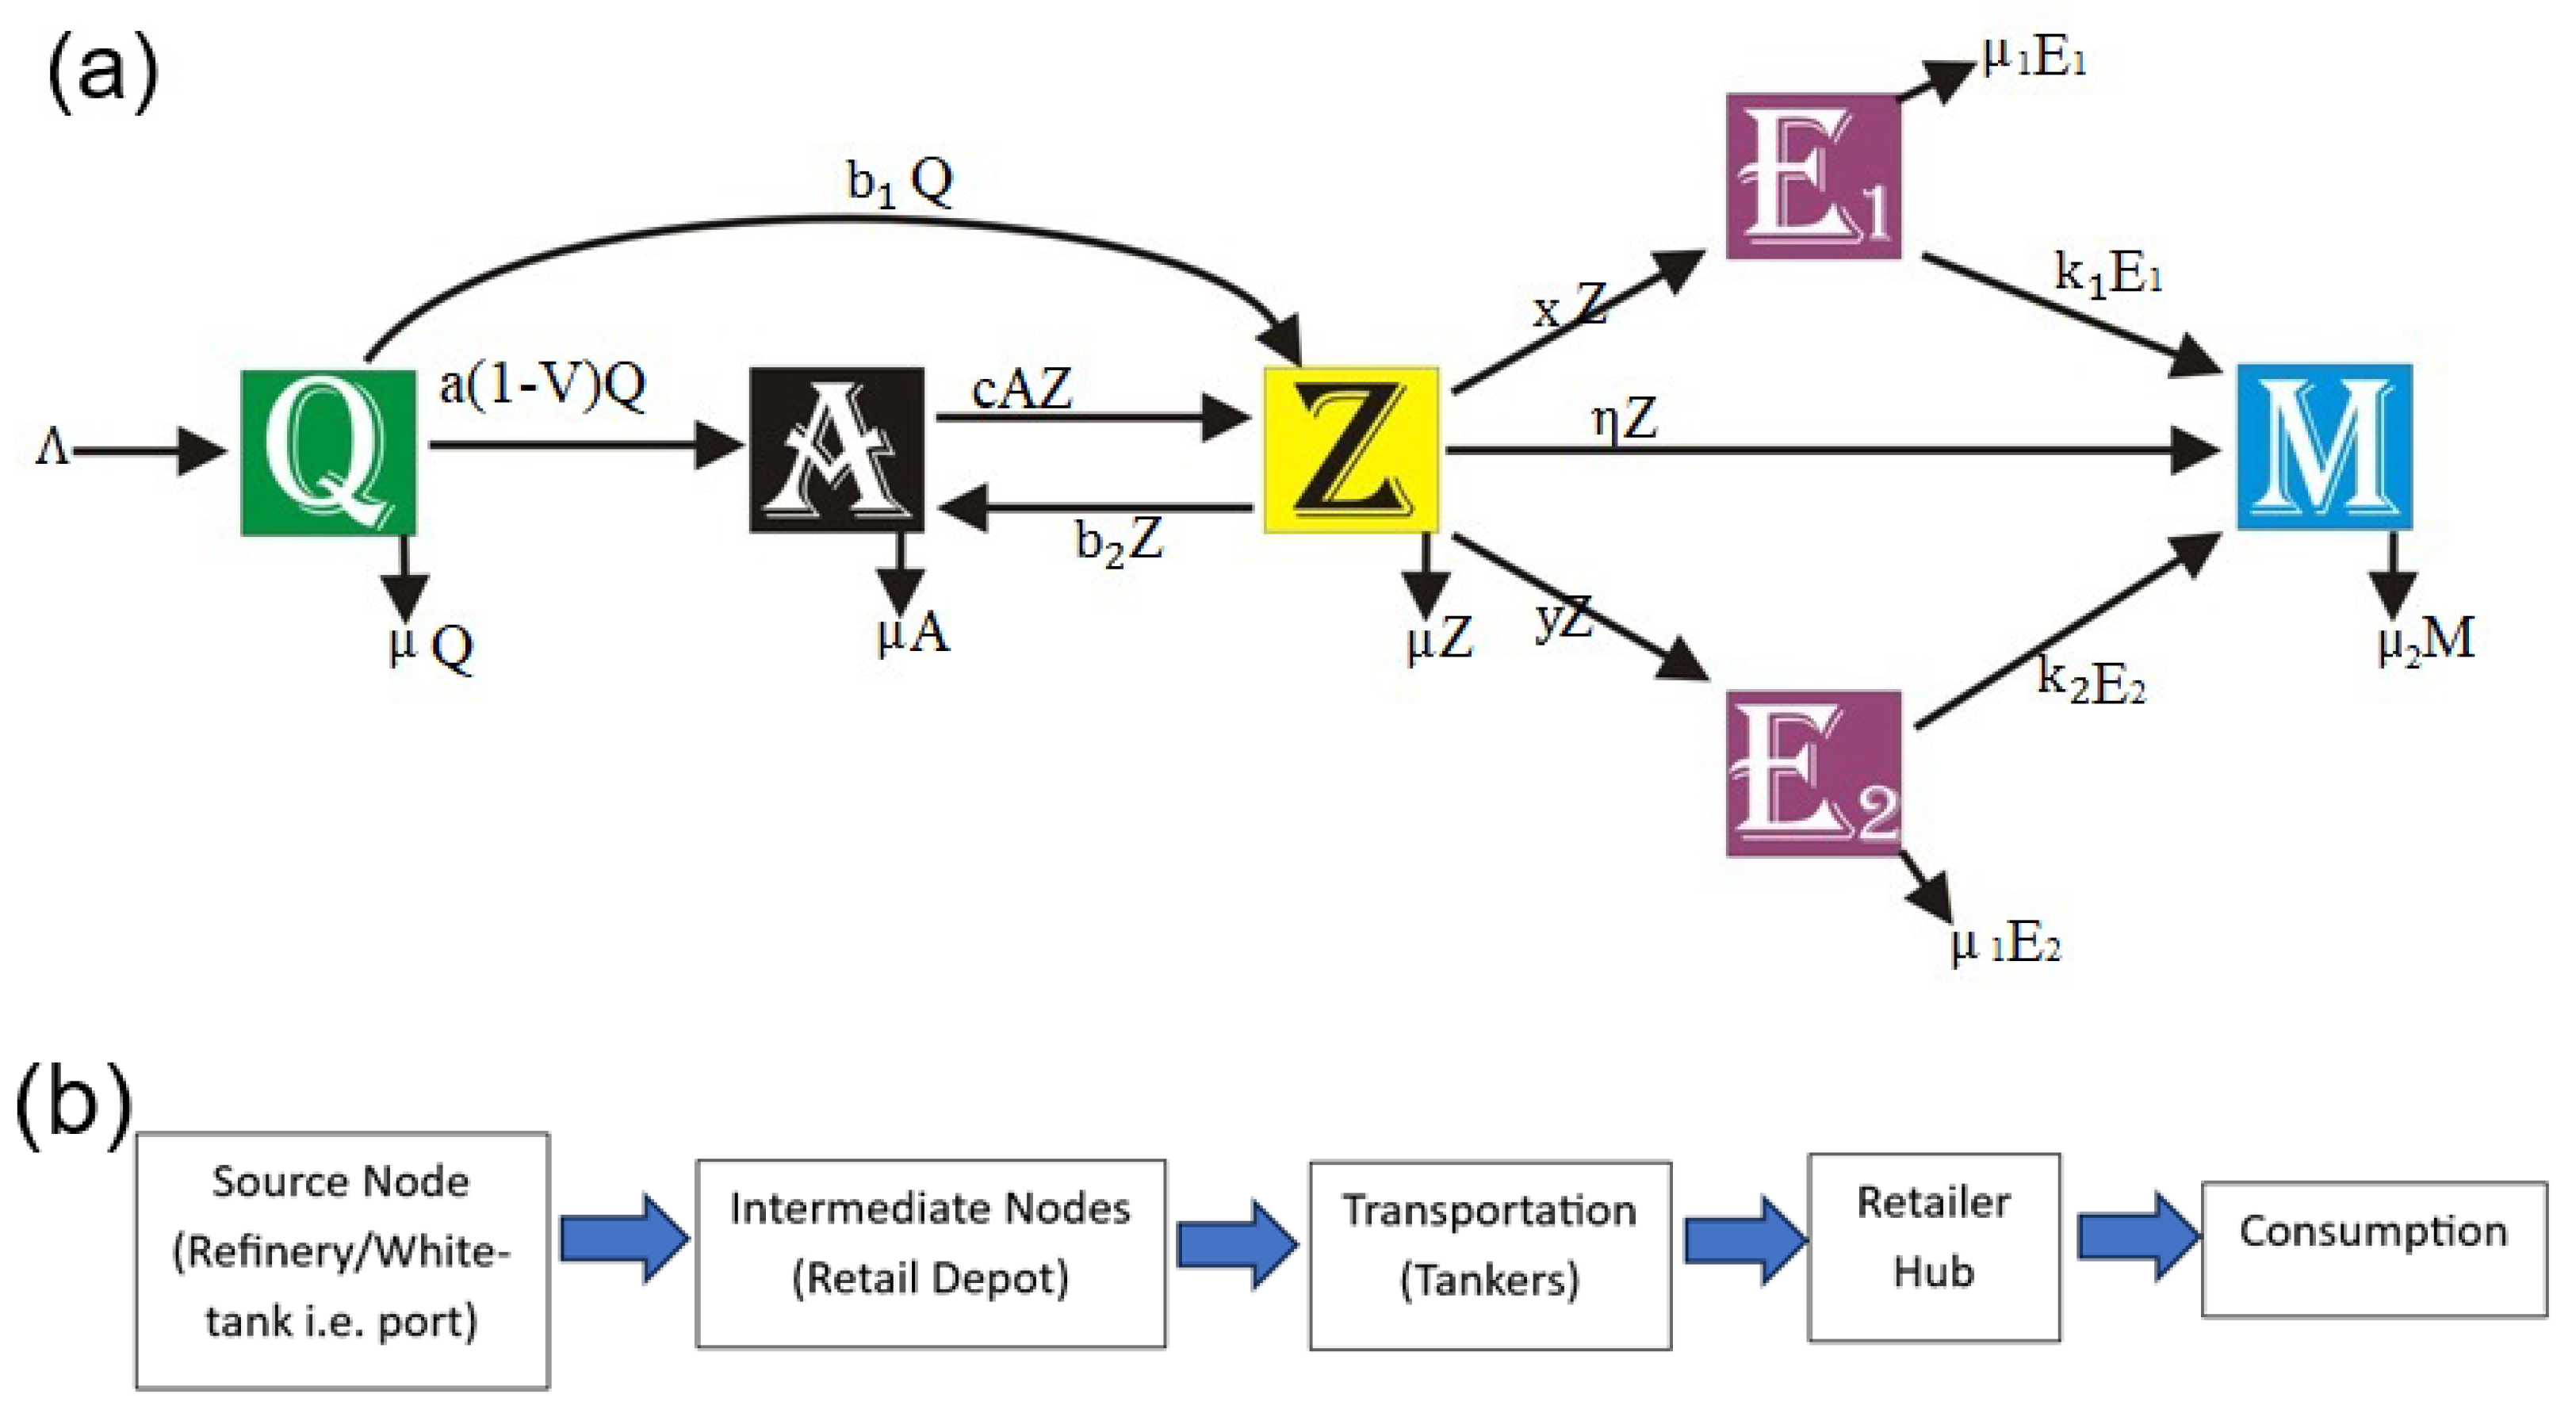
A critical feature of the model is the explicit incorporation of pipeline throughput (Figure 2), which constitutes one of the principal parameters governing product flow within the system. To ensure methodological clarity and transparency, the model structure is presented in both mathematical and non-mathematical block representations (Figure 3). Transition rates between compartments, corresponding to distribution, transportation, and consumption processes, are parameterised to quantify the flow of refined products across the supply chain.
Figure 2.
Quantity of PMS product loses per month for the year 2021 NNPC FAAC Reports.
Figure 3.
(a) Mathematical flow diagram of the proposed model. (b) Structural block representation corresponding to Figure 3a. Proposed model for Petroleum Product Distribution (PPD).
This formulation facilitates analytical examination of system behaviour under both normal and disruptive conditions, including the impacts of pipeline vandalism, hoarding, and industrial actions on fuel availability. The proposed framework supports the derivation of equilibrium points, threshold conditions for fuel sufficiency, and stability criteria. These analytical outcomes form the core objectives of the study and provide a rigorous basis for policy-relevant insights and recommendations.
This modelling choice is adopted in preference to agent-based models (ABMs) [35,37], mixed-integer programming approaches [34,38], and system dynamics models, for several methodological reasons. While ABMs explicitly simulate individual agents and their interactions, they typically require detailed micro-level data and high computational resources. Such requirements limit their applicability in large-scale national fuel distribution systems, where data availability is often incomplete or aggregated [39]. In contrast, the compartmental framework captures population-level dynamics and aggregate flows, making it more appropriate for modelling nationwide downstream petroleum operations.
Moreover, the compartmental ODE formulation is mathematically tractable and supports rigorous analytical investigations, including equilibrium analysis, Lyapunov-based stability assessment [14,40], and parameter estimation using likelihood-based or Bayesian inference methods [41]. Compared with simulation-intensive system dynamics models or optimisation-driven mixed-integer formulations [42], the proposed approach offers a transparent, flexible, and scalable structure. These properties are particularly advantageous in data-constrained or noisy environments, such as Nigeria’s petroleum sector, where interpretability and analytical insight are essential for informed policy evaluation [43].
Furthermore, the compartmental model aligns well with the policy-oriented goals of this study. It allows the simulation of various intervention scenarios, such as the provision of alternative transportation routes (rail), improved monitoring of private retail independent marketers, and the impact of regulatory or infrastructural reforms. Its analytical nature provides clarity on cause–effect relationships, ensuring that recommendations are not only data-informed but also grounded in a mechanistic understanding of how the system behaves. Thus, the compartmental ODE framework stands out as a practical, efficient, and insightful tool for analyzing and forecasting the downstream challenges and prospects in Nigeria’s energy landscape.
2.1. Model Formulation
The proposed model captures the flow of petroleum products across key nodes in Nigeria’s downstream sector. The system is stratified into six compartments [1]:
- Refineries/Seaside Storage (onshore): the Nigerian National Petroleum Corporation (NNPC) downstream infrastructure for refined petroleum products (Source) and it is represented by .
- Intermediate Storage Facilities (Depot): This is a large-scale refined products holding facilities managed by refineries owners or major independent marketers (124 storage depots in 21 locations nationwide) [44,45] is denoted as .
- Transporter/NUPENG/PENGASSAN: Distributors responsible for delivering products to retail energy stations, .
- Retail Energy Stations : Points of sale, classified into major marketers (NNPC Retail/Mega Stations) and independent private marketers.
- Consumers (): The final stage where petroleum products are utilized.
This stratification is coined in the Figure 1, and the interactions among these compartments are modeled using autonomous ordinary differential equations (ODEs). Key operational, policy, and environmental factors such as vandalism rates (), natural loss rates (), and stakeholders contributions () [12] are incorporated as the coefficient (parameters) of the ODE state variables.
The model is represented as () evolves over time t. At time t, holds a quantity of petroleum refined product, replenished daily at a rate of (representing the amount refined or imported by PPMC/day). The products transported via pipelines per day is denoted by (throughput efficiency), while vandalism is modeled as a constant function (), and the loss caused by vandalism is , and it is accounted for in [46,47,48,49,50,51,52,53,54].
There is an assumption of losses that occurs at various stages in the downstream: depot losses, , retail station loses and consumer-level loses (). This study extracted all the losses associated between Q and A as reported in [46,47,48,49,50,51,52,53,54] and graphed in Figure 2.
The quantity of fuel dispensed to retail marketers depends on the refined products available at [12]. The efficiency of the distribution from NNPC depots via PENGASSAN/NUPENG to filling stations is denoted by c, resulting in a net distribution rate of .
To facilitate the model formulation, the fundamental assumptions in the next Section 2.2 are considered.
2.2. Basic Assumption of the Model
The model assumptions are as follows:
- 1.
- Petroleum product scarcity in Nigeria is a multi-factored [3,55] issue; however, this study considers NUPENG strikes , fuel diversion, hoarding, and persistent vandalization of NNPC pipelines.
- 2.
- Vandalization is treated as a constant function () due to continuous occurrence reported in [46,47,48,49,50,51,52,53], and it is assumed to satisfies the property of probability except in the case where is zero.
- 3.
- The literature highlights that vandalization increases fuel distribution costs [15,21,56], resulting in scarcity for consumers. An alternative route for transportation is incorporated in the proposed model.
- 4.
- Fuel scarcity leads to price increases, either directly at the pump or through parallel markets (black markets), prompting hoarding and diversion, as considered.
- 5.
- Ideally, retail marketers are meant to be the sole suppliers to consumers unless tanker drivers siphon products, so a siphon parameter () is included in the model but is insignificant, and there is no data for this parameter.
- 6.
- All parameters are non-negative; any negative results in the model will be interpreted as impractical.
- 7.
- Fuel scarcity can be resolved when consumer demand is lower than supply from major and independent marketers. Therefore, policy and good implementation are embedded in the model simulation.
2.3. The Proposed Model
The formulation of the model in Section 2.1, together with its underlying assumptions in Section 2.2, is summarized schematically in Figure 3. The first panel (Figure 3a) presents the mathematically induced compartmental flow of refined petroleum products, while the second panel (Figure 3b) illustrates an equivalent structural representation designed for non-mathematical interpretation. This structural representation figure is intuitive built using the socioeconomic image generated by Gemini Nano Model (Figure 1).
The dynamic behavior of the system is governed by the following set of nonlinear differential equations:
The total quantity of refined products in the downstream system at any time t is given by
This compartmental structure captures the flow of products from refinery to depots, transporters, retail stations, and final consumers, while incorporating losses, leakages, operational inefficiencies, and stakeholder-driven distribution dynamics. The model provides a flexible analytical framework for assessing the influence of policy shocks, operational disruptions, subsidy removal, and regulatory interventions on petroleum product availability.
2.4. Data Description and Baseline Values
Data used in this study are primarily sourced from multiple authoritative national datasets, including the 2021 Nigerian National Petroleum Corporation (NNPC) Federation Account Allocation Committee (FAAC) reports [46,47,48,49,50,51,52,53,54], the Nigerian Midstream and Downstream Petroleum Regulatory Authority (NMDPRA) Petroleum Products Stock and Days Sufficiency Reports [24], publications of the National Bureau of Statistics (NBS) [10,15,57,58]. These sources provide comprehensive and credible information on product inflows, distribution volumes, losses, and consumption patterns within Nigeria’s downstream petroleum sector.
A detailed description of all model parameters, including the baseline values employed in the numerical simulations, is presented in Table 1. The initial (baseline) values of the state variables are obtained as point estimates derived from summary statistics. Specifically, the mean, median, and mode computed over at least five consecutive months of available data. These baseline conditions are designed to ensure internal consistency of the simulations and to enhance the empirical relevance of the model to the operational realities of Nigeria’s downstream petroleum supply chain.
Table 1.
Description of Parameters, Variables, and Baseline Values for Numerical Simulation.
Parameter values are obtained through a combination of direct extraction from official reports and informed assumptions introduced to allow broader exploration of plausible operational scenarios. For instance, the parameters and c represent efficiency measures: denotes the proportion of product successfully transferred from refinery or white tank storage to intermediate depots, while c captures the efficiency of tanker operations in delivering products to retail energy stations. Consistent with standard engineering and systems theory, efficiency parameters are defined as ratios of output to input; hence, assigning is both scientifically grounded and operationally realistic, particularly given the ten-year span of the available dataset.
Similarly, the parameters and represent the rates of fuel sales at retail outlets, corresponding to mega/major marketer stations and independent or private retail stations, respectively. Under ideal operating conditions, it is reasonable to assume comparable sales rates across retail outlets (i.e., ). However, deviations from this symmetry are informative: a scenario in which may indicate uneven distribution practices or preferential access, potentially exacerbating fuel scarcity, whereas reflects a dominant role of mega stations and major marketers in stabilizing supply. These distinctions allow the model to capture realistic heterogeneities in retail operations and their implications for downstream fuel availability.
3. Model Analysis, Results and Discussions
3.1. Existence and Uniqueness of Solutions
To ensure that the model is mathematically well-posed, the study investigated the Lipschitz criterion. The system (1)–(6) can be written as
For the Lipschitz continuity, compute the partial derivatives of (7), with respect to each state variable i.e.,
Similar steps are applied to the remaining state variables, ensuring that all partial derivatives are bound. The study investigates each of the model state variables solutions at any two points in the region as follows
Similarly for ,
This is the Lipschitz constant. Hence, the system has solution for every .
The boundedness and solutions at any two points satisfies the Lipschitz criteria. Thus, the model exist and has solution in the region .
3.2. Equilibrium Points
Theorem 1.
The system (1)–(6) exhibits five equilibrium points, denoted as , subject to the following conditions:
- (vandalism level),
- (industrial action level),
vandalism reaches its peak when , and is NUPENG embarks on industrial action.
Proof.
To establish Theorem 1, the right-hand sides (RHS) of (1)–(6) are set to zero. On the simplification, three scenarios were obtained and they are
Scenario I: Severe Vandalism.
- 1.
- 2.
where
Scenario II: Reduced Vandalism.
- 1.
- Partial functionality: When vandalism is significantly reduced () and , the system stabilizes at
- 2.
- Moderate functionality: Vandalism is reduced (), , and . The equilibrium iswhere
Scenario III (Optimal Distribution): Increased Fuel Demand and Systemic Challenges.
For this scenario, , , and . These are considered while solving (1)–(6) and the equilibrium is
where
□
3.3. Threshold for Product Distribution
The daily consumption threshold required to prevent PMS scarcity is derived using the Next Generation Matrix (NGM) approach, a method originally developed in epidemiological modeling to characterize transmission potential and determine conditions under which outbreaks can be prevented [60,61,62]. Beyond infectious disease modeling, the NGM has been effectively adapted to socioeconomic and behavioral systems by Akande et al. [63] and by Castillo-Chavez and collaborators [64], thereby demonstrating its robustness in analyzing systems where transitions between compartments govern overall system stability.
In the Nigerian downstream petroleum sector, industrial actions or operational disruptions frequently result in the complete shutdown of fuel distribution channels, with immediate and widespread socioeconomic consequences. This systemic sensitivity resembles epidemic processes in which small perturbations can trigger large-scale impacts once a critical threshold is surpassed. Drawing on this analogy, the present study interprets fuel scarcity as a dynamic process in which scarcity propagates when “consumption pressure” exceeds the system’s replenishment and distribution capacity akin to how an epidemic grows when the effective reproduction number exceeds unity. The NGM framework is, therefore, adopted because it provides a mathematically rigorous and transparent means of deriving threshold conditions, enabling the identification of precise criteria under which fuel supply can consistently meet national consumption demands, thereby preventing the spread of scarcity across the distribution network.
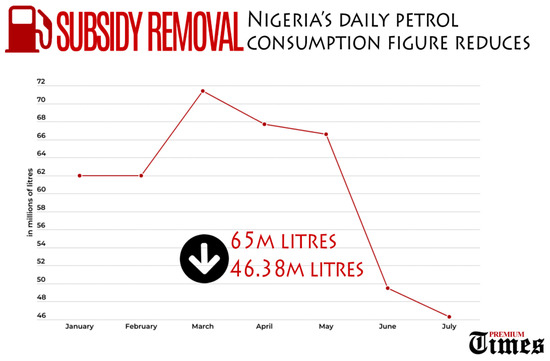
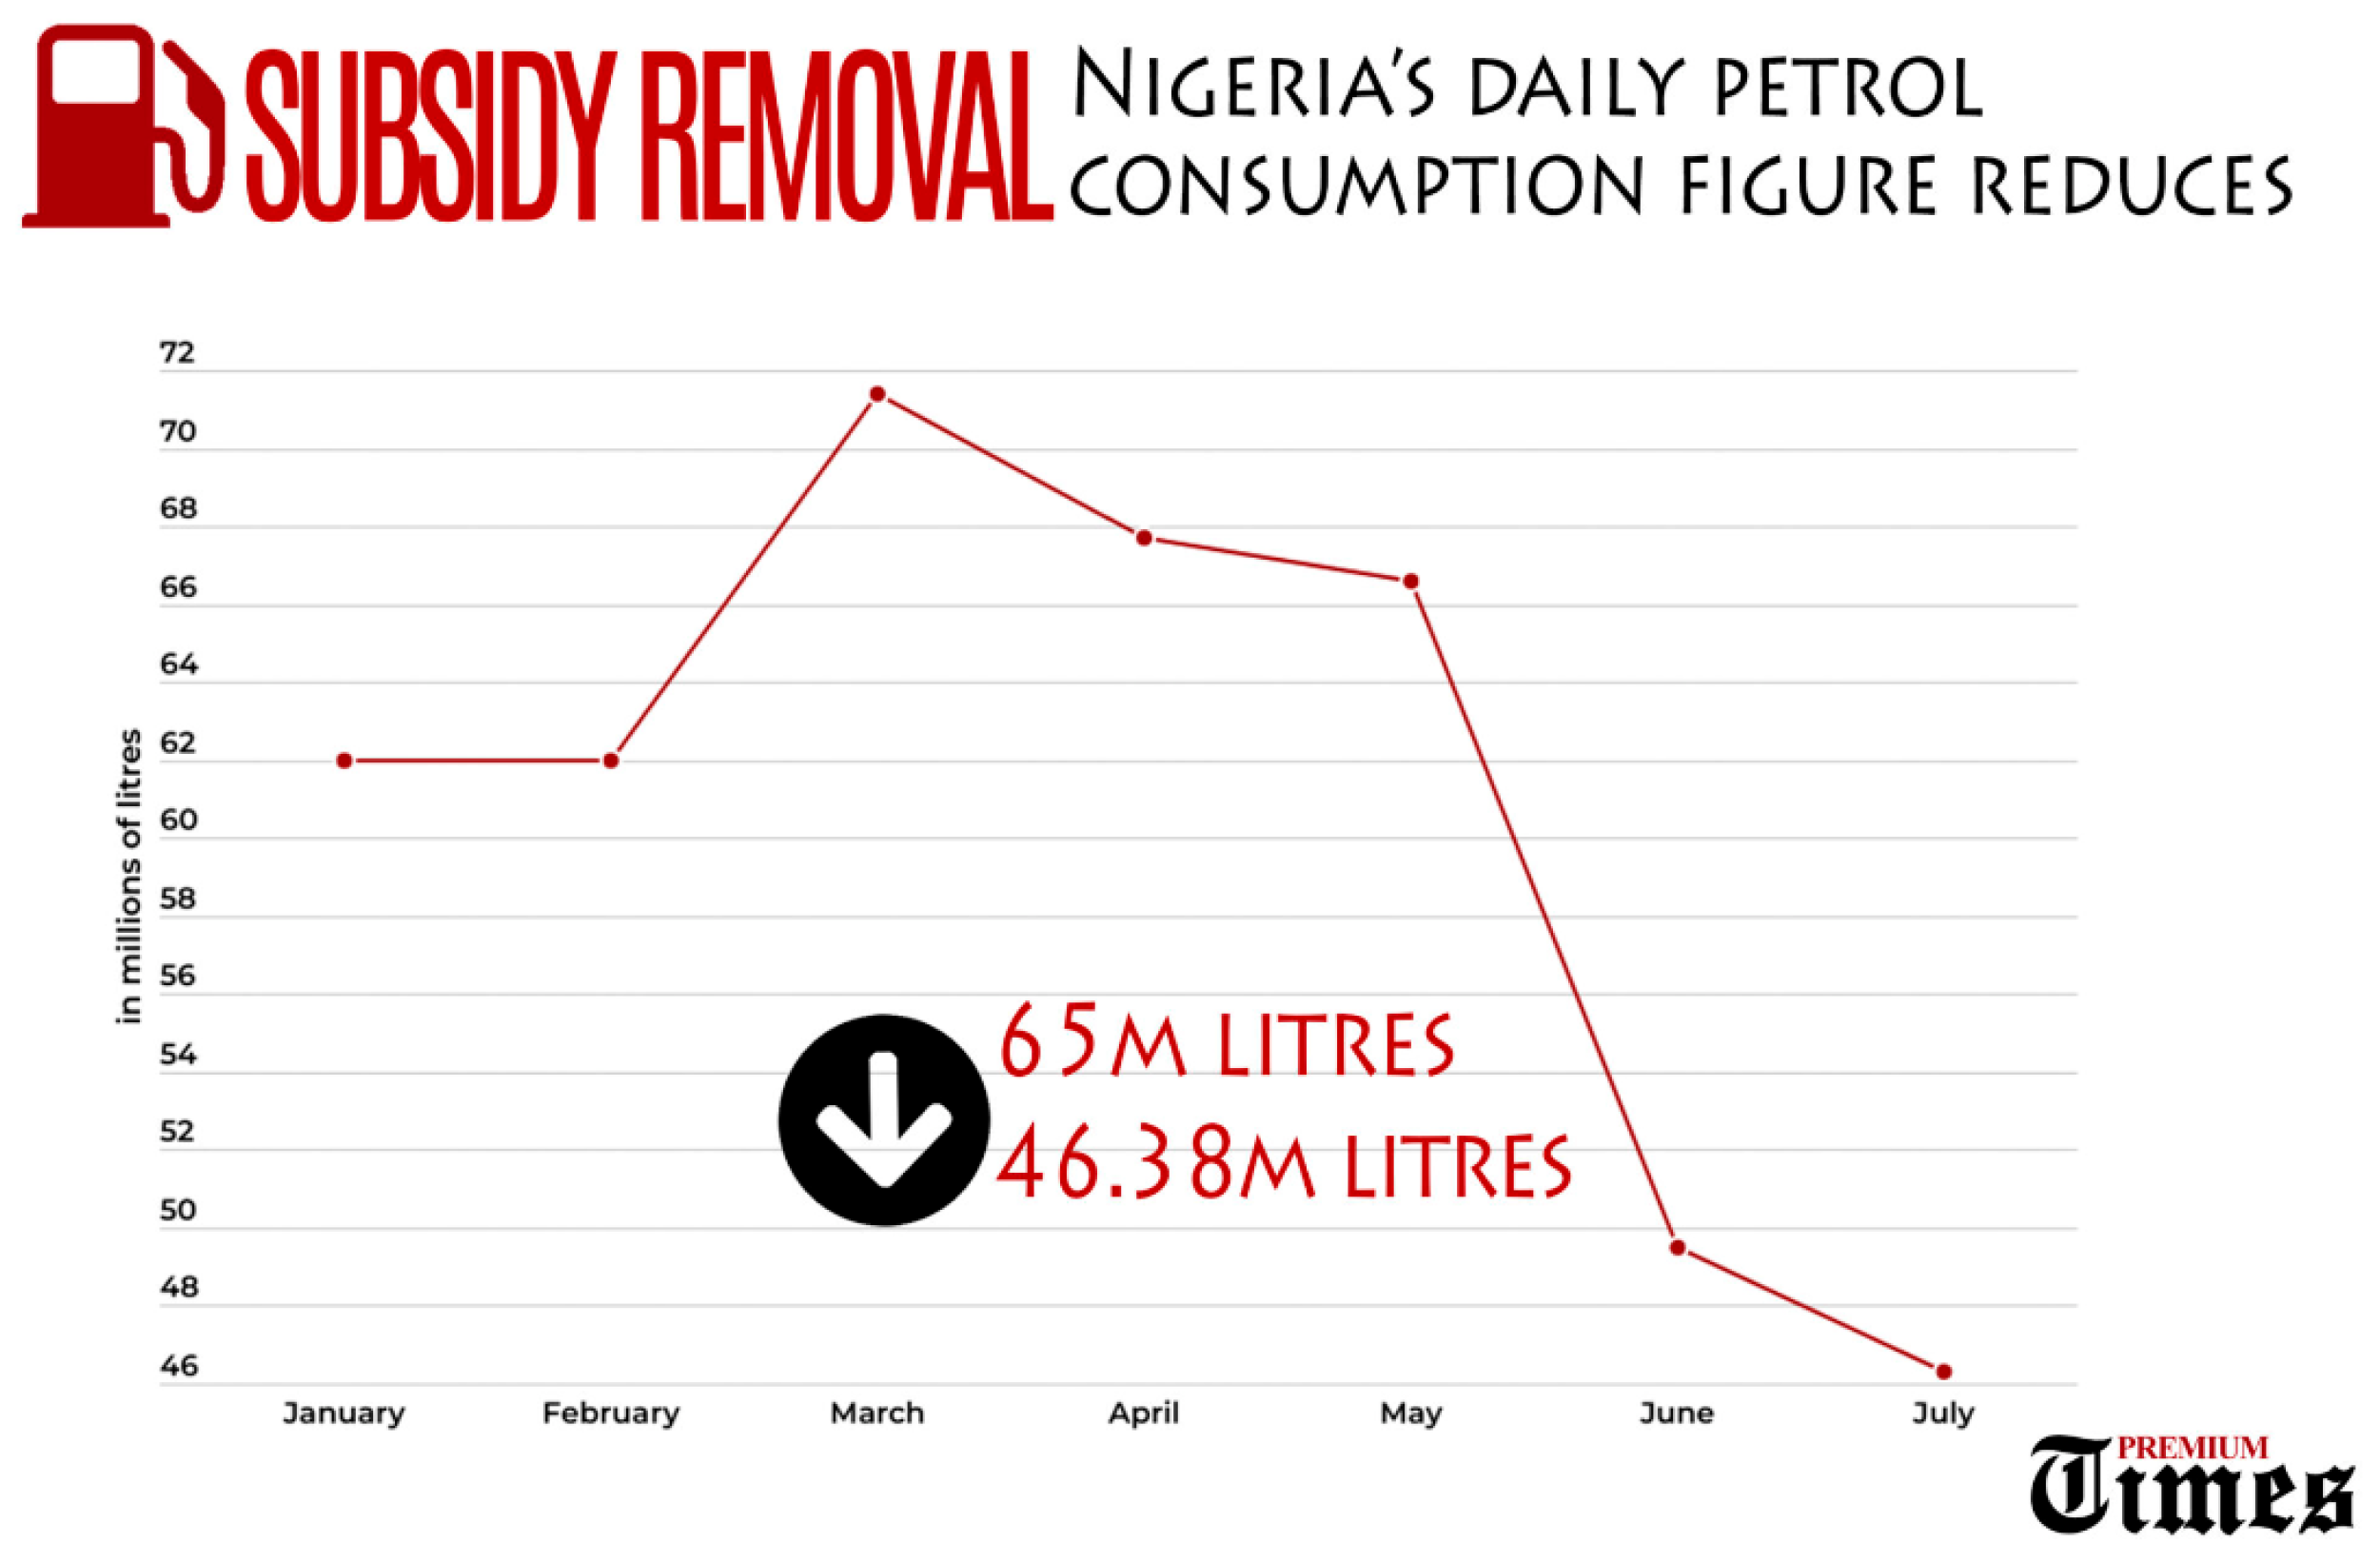
The removal of fuel subsidies in 2023 further underscores the importance of understanding consumption thresholds. Reports indicate that daily PMS consumption declined due to the combined effects of increased pump prices and reduced household purchasing power, as illustrated in Figure 4.
Figure 4.
Effect of subsidy removal on daily PMS consumption in May 2023 (source: Premium Times).
Theorem 2.
Fuel scarcity can be eliminated if the threshold parameters and satisfy the following:
- 1.
- and in the presence of pipeline crises or distribution shocks;
- 2.
- under smooth and uninterrupted transportation conditions.
Proof.
Matrix F represents the volume of petroleum transported via pipelines to storage facilities, while matrix V accounts for transitions leading to product delivery to consumers.
If alternative routes are unavailable , the system relies solely on pipelines. The inverse of V is given by
The threshold parameter, which accounts for both smooth distribution and disruptions, is determined by the spectral radius of . The results for the two scenarios are
At the Petroleum Distribution-Free Equilibrium (PDE), substituting the value of A in Equation (21) yields the following:
□
It is important to note that the condition occurs only when (industrial action), indicating that effective supply falls below consumption (demand) a classical supply-demand imbalance that inevitably produces fuel scarcity. Unlike its epidemiological analogue, here measures supply adequacy; thus, for stable downstream operations, the threshold in Equation (22) must remain strictly greater than unity to ensure that PMS supply consistently exceeds demand.
3.4. Stability Analysis
This section establishes the analytical criteria used to assess the robustness and practical relevance of the proposed model in supporting policy formulation and operational decision-making within Nigeria’s downstream petroleum sector. Stability analysis, a fundamental component of mathematical modeling and dynamical systems theory and widely applied in epidemiology [61,65], is employed to investigate both the local and global behavior of the system under small perturbations.
Specifically, the stability results provide insight into the conditions under which disruptions such as pipeline vandalism, industrial action, or other disturbances capable of impeding fuel transportation and distribution can be mitigated. A stable equilibrium implies that, following such shocks, the system is able to recover and return to its steady operational state, rather than evolving into a persistent fuel scarcity regime.
3.4.1. Methodology for Local Stability Analysis
The local stability of each equilibrium point of the system is examined using the standard linearization approach. The procedure consists of the following steps:
- 1.
- 2.
- Eigenvalue Evaluation: The eigenvalues of the Jacobian matrix are evaluated at the equilibrium points.
- 3.
- Stability Classification: The stability nature of each equilibrium point is determined using eigenvalue-based criteria, following the framework presented in [66] and summarized in Table 2.
- 4.
- Stability Conditions: Analytical conditions on the model parameters are derived to ensure that all eigenvalues satisfy the required stability constraints.
Table 2.
Characterization of Stability Analysis [66].
3.4.2. Application of the Methodology
Accordingly, stability is analyzed around the equilibrium points corresponding to Scenarios II and III, encompassing partial functionality, moderate functionality, and optimal distribution states. These specific equilibrium points are
3.5. Asymptotically Stability Analysis Result Summary
The stability results are summarized in the below theorem and the proof in Section 3.4.2:
Theorem 3.
The system (1)–(6) is locally asymptotically stable (LAS) near Scenario II if the following conditions hold:
- ,
- and , ensuring product demand does not exceed supply, regardless of the distribution method.
Additionally,
- is globally asymptotically stable
- is globally asymptotically stable whenever the arithmetic mean exceeds the geometric mean of Lyapnouv function for
3.5.1. Local Stability
To demonstrate local asymptotic stability, the following steps are undertaken: The Jacobian matrix J of the system is defined as
- Step 1: Linearization: The Jacobian matrix of the system is obtained and evaluated near the partial functionality equilibrium and for a specific case; in the absence of alternative routes, the Jacobian reduces to
- Step 2: Eigenvalue Computation: The eigenvalues are determined from the characteristic equation .
- Step 3: Characterization of Eigenvalues: The eigenvalues of the Jacobian are
- Step 4: Stability Criteria: By the Routh–Hurwitz stability criterion, all eigenvalues must be negative for local asymptotic stability.
- -
- hold true.
- -
- For , the vandalism rate must satisfy .
- -
- For , the fuel demand should not exceed the supply at retailer filling stations, implying .
Consequently, smooth running depends on controlling vandalism and ensuring the supply meets consumer demand. The model is locally asymptotically stable under these conditions (step 4), affirming Theorem 3.
3.5.2. Global Stability Analysis
To simplify the stability analysis, fuel distribution is narrowed to major petroleum dealers and suppliers in the community. This enables qualitative analysis of the subsystem and the proofis by contradiction (i.e., ):
where .
This subsystem possesses two equilibrium points; (15) and (17). These are, respectively, denoted and rewritten as , : , where and .
- At : The Jacobian matrix evaluated at yields the characteristic equation:Eigenvalues are
Theorem 4.
The stability at is globally asymptotically stable if and the system transits to instability .
Proof.
Consider the Lyapnouv function with derivative of
from PDE (partial functionality), , (30) becomes
simplification gives
Therefore, if and if . Thus, F is a Lyapnouv function and by LaSellei invariance principle, every solution of (25) approaches as .
- At : Using the Goh–Volterra nonlinear Lyapunov function, global stability at is confirmed if . The proof for this is in the next Section 3.6.
□
3.6. Global Stability at Moderate Functionality
Proof.
To establish the system’s global stability, it is sufficient to use the reduced system (25) at by formulating the Goh–Volterra nonlinear Lyapnouv function.
Differentiating the Lyapnouv function (33) gives
substituting (25) in (34) to get
substitute into (35) to obtain
Expanding and simplification of (36) gives
Let , such that
factorizing the common terms and further simplification gives
Since the arithmetic mean exceeds the geometric mean, it follows that
and
In this view, the relationship between the arithmetic mean of being greater than or equal to the geometric mean supports the conclusion about for and for .
This completed the last part of the Theorem 3. □
3.7. Results Discussion and Scenario Simulation
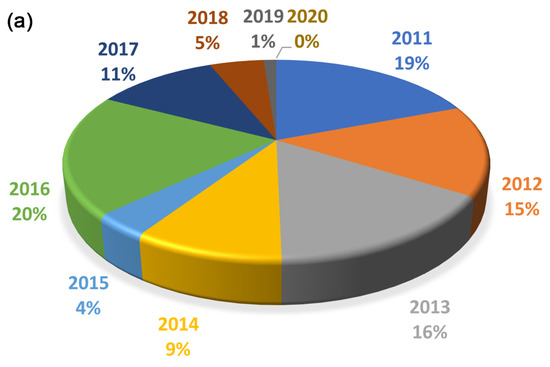
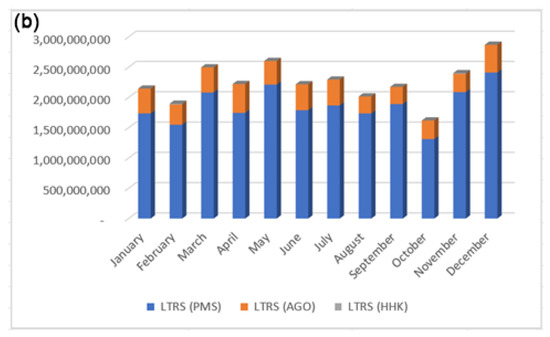
Premium Motor Spirit (PMS) constitutes the highest share of domestic petroleum product consumption (Figure 5b); accordingly, its distribution data obtained from the NNPC FAAC reports and the National Bureau of Statistics [15] forms the empirical basis for the simulations in this study. This emphasis enables the analysis to reflect the most consequential component of Nigeria’s downstream supply dynamics.
Figure 5.
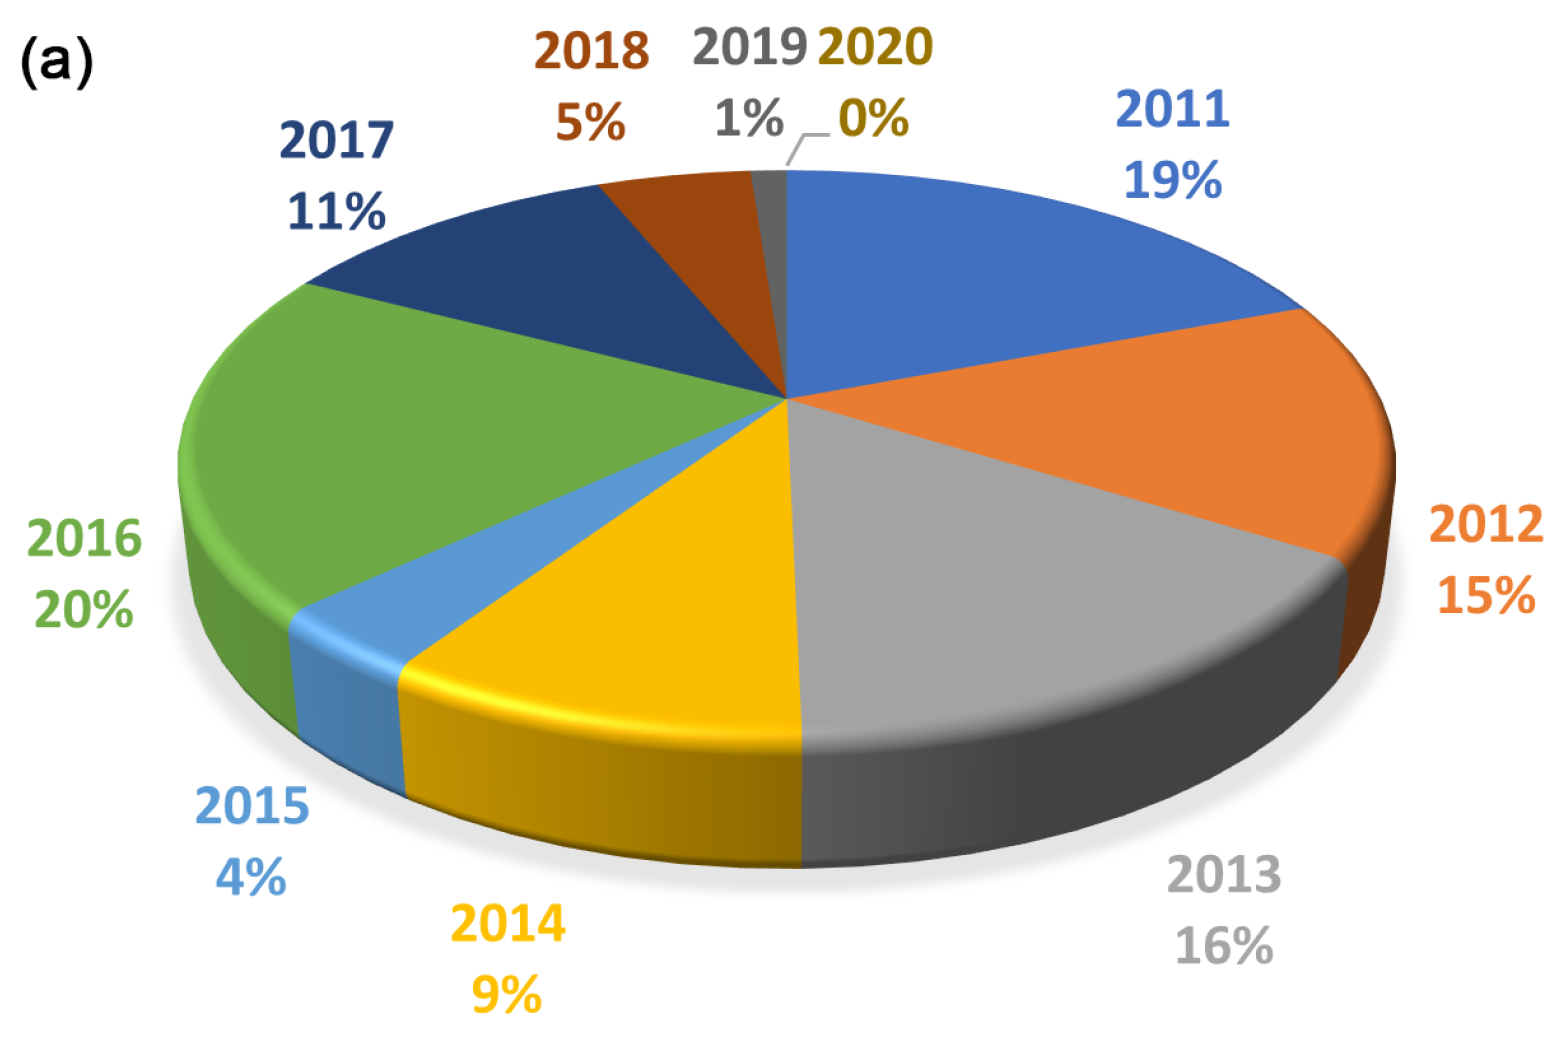
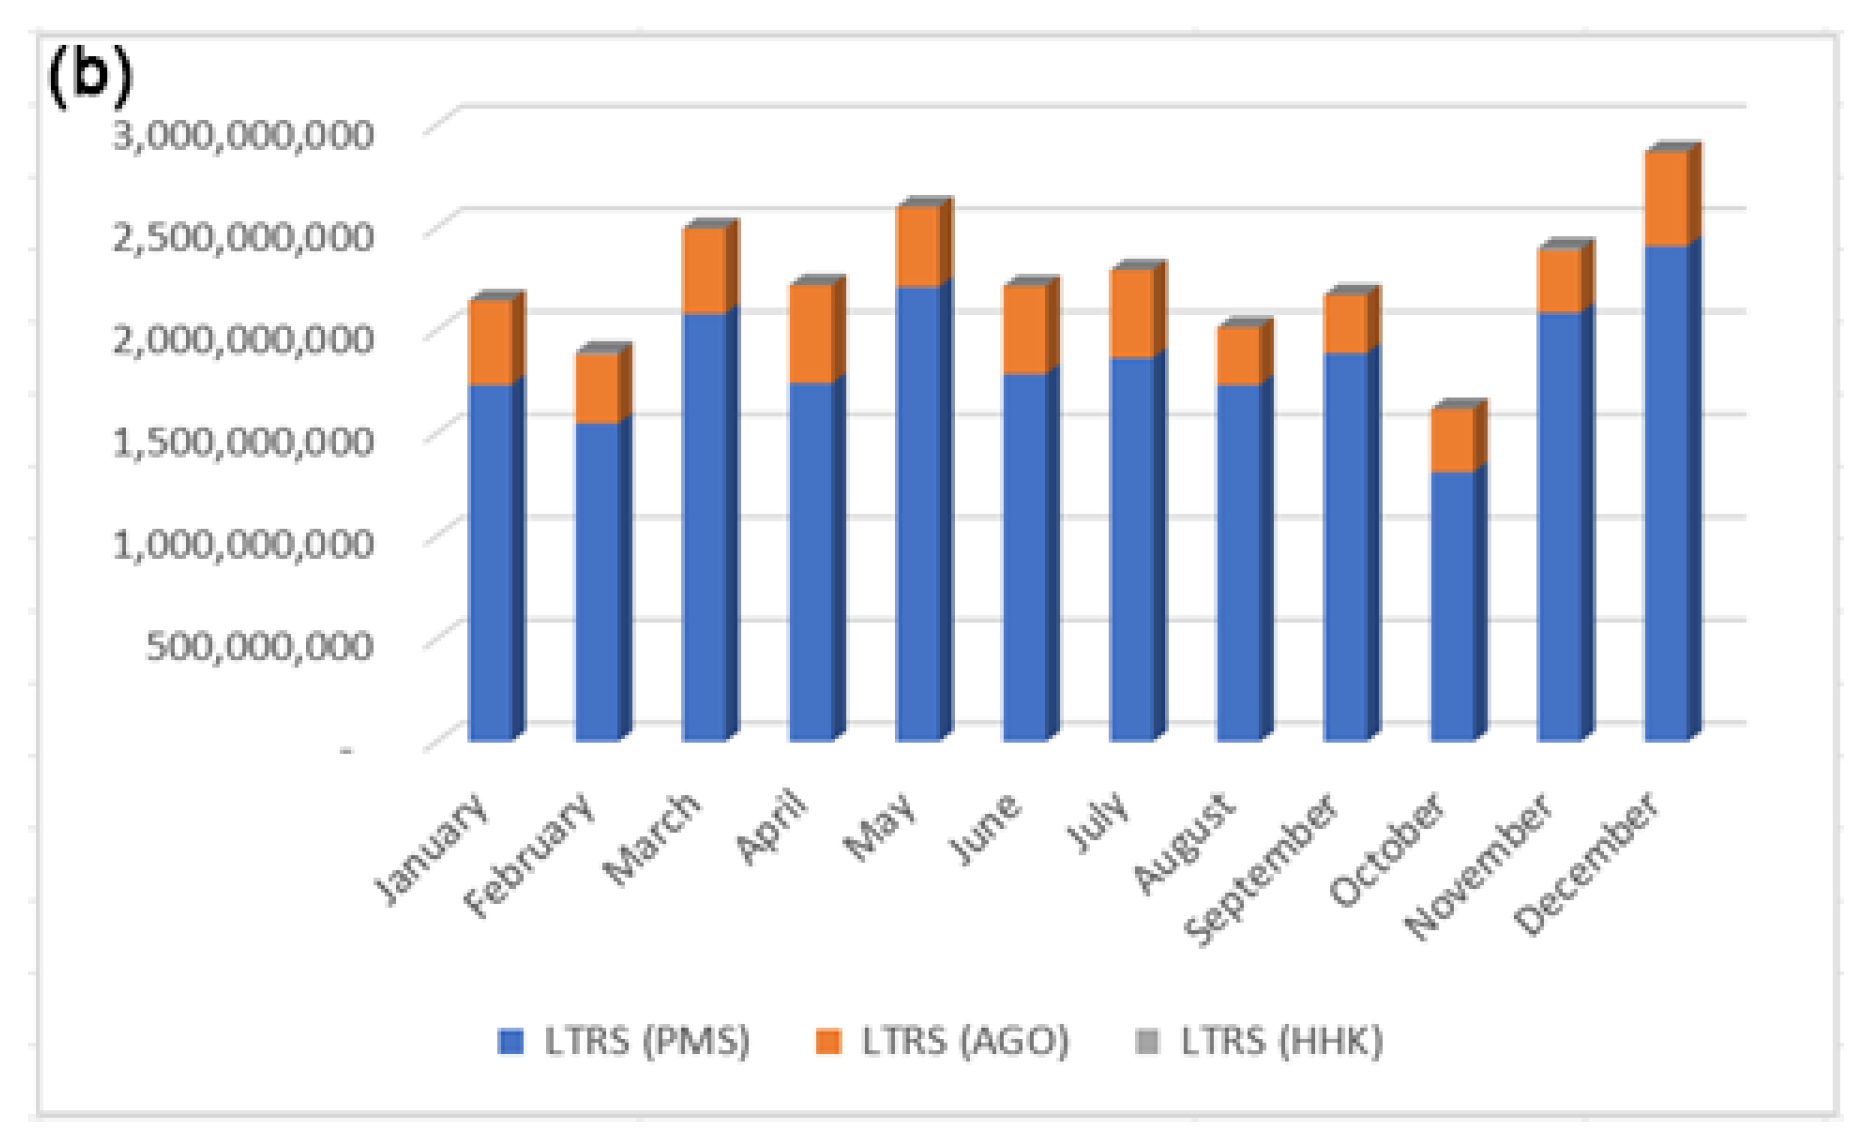
(a) Ten (10) years performance of the country’s refineries (NNPCL refineries). (b) Distribution of petroleum products imported to the country in the year 2021. Sources of Petroleum Products for the Downstream. In Figure 5, a zero output from the refineries and data from [15] revealed that none of the country’s refineries are in operation. Therefore, the data of imported products is presented in Figure 5b.
As shown in Figure 5a, the reported output of all NNPCL-operated refineries is consistently zero [15], indicating that no refinery was operational from 2020 through 2023, including the period following fuel subsidy removal. Consequently, the downstream system relies almost entirely on imported petroleum products, as illustrated in Figure 5b.
3.8. Distribution Threshold () Validation
This subsection provides a numerical validation of the distribution threshold parameter (). From Equation (22), the threshold quantity is given by
To evaluate , the following parameter values are adopted:
According to [12], NNPC Retail Limited and major marketers jointly account for approximately of downstream share, while private independent marketers contribute about . The combined contribution amounts to , with the remaining attributed to product losses arising from tanker driver siphoning ().
The parameter is set to zero to reflect the absence of alternative transportation routes under condition of severe pipeline vandalism, while the vandalism intensity is fixed at . This choice of and V is theoretically supported by the equilibrium analysis presented in Equations (15) and (16). Substituting the parameters value into the expression for yields
This value closely aligns with the estimated national PMS demand of approximately 42 million liters per day, thereby validating the analytical threshold derived in Equation (22) and confirming the internal consistency of the model under high-vandalism, no-alternative-route conditions.
3.8.1. Effect of Vandalism and Alternative Routes on
Numerical simulations are conducted to quantify the joint effects of pipeline vandalism and the availability of alternative transportation routes on the fuel distribution threshold , defined in Equation (22). The threshold value evaluated in Equation (41) serves as the reference benchmark for subsequent simulations involving industrial action, product diversion, and hoarding, as discussed in later subsections.
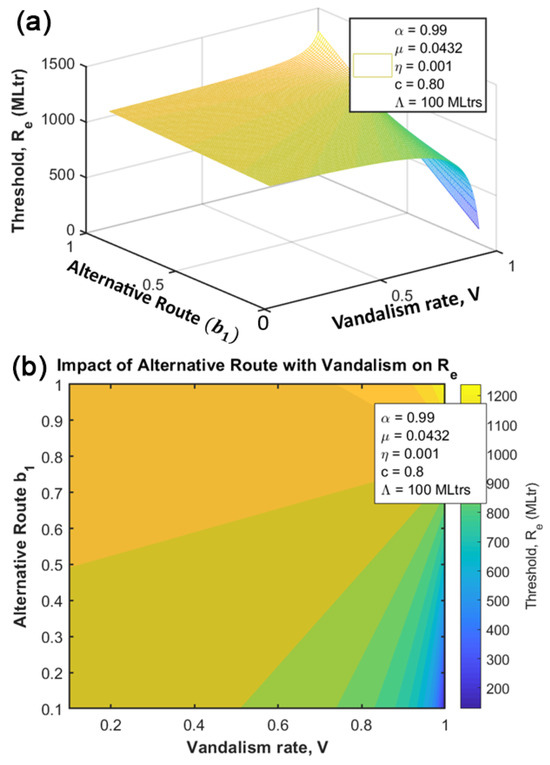
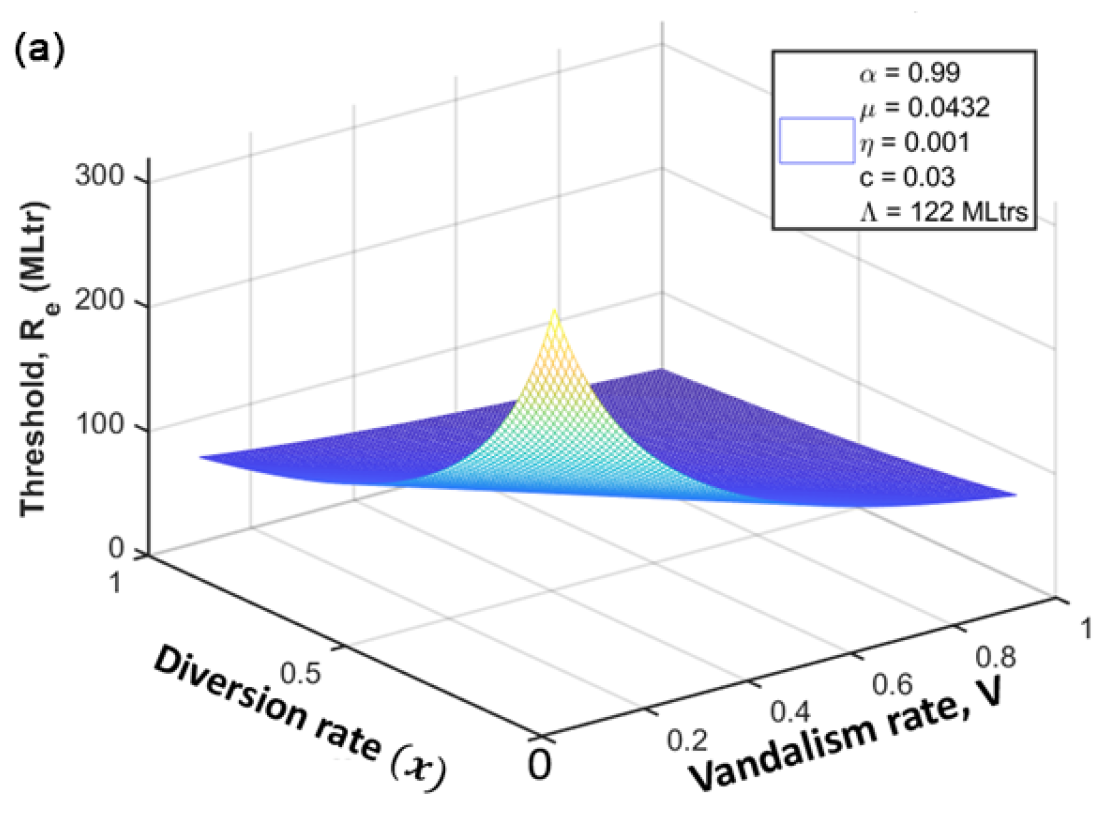
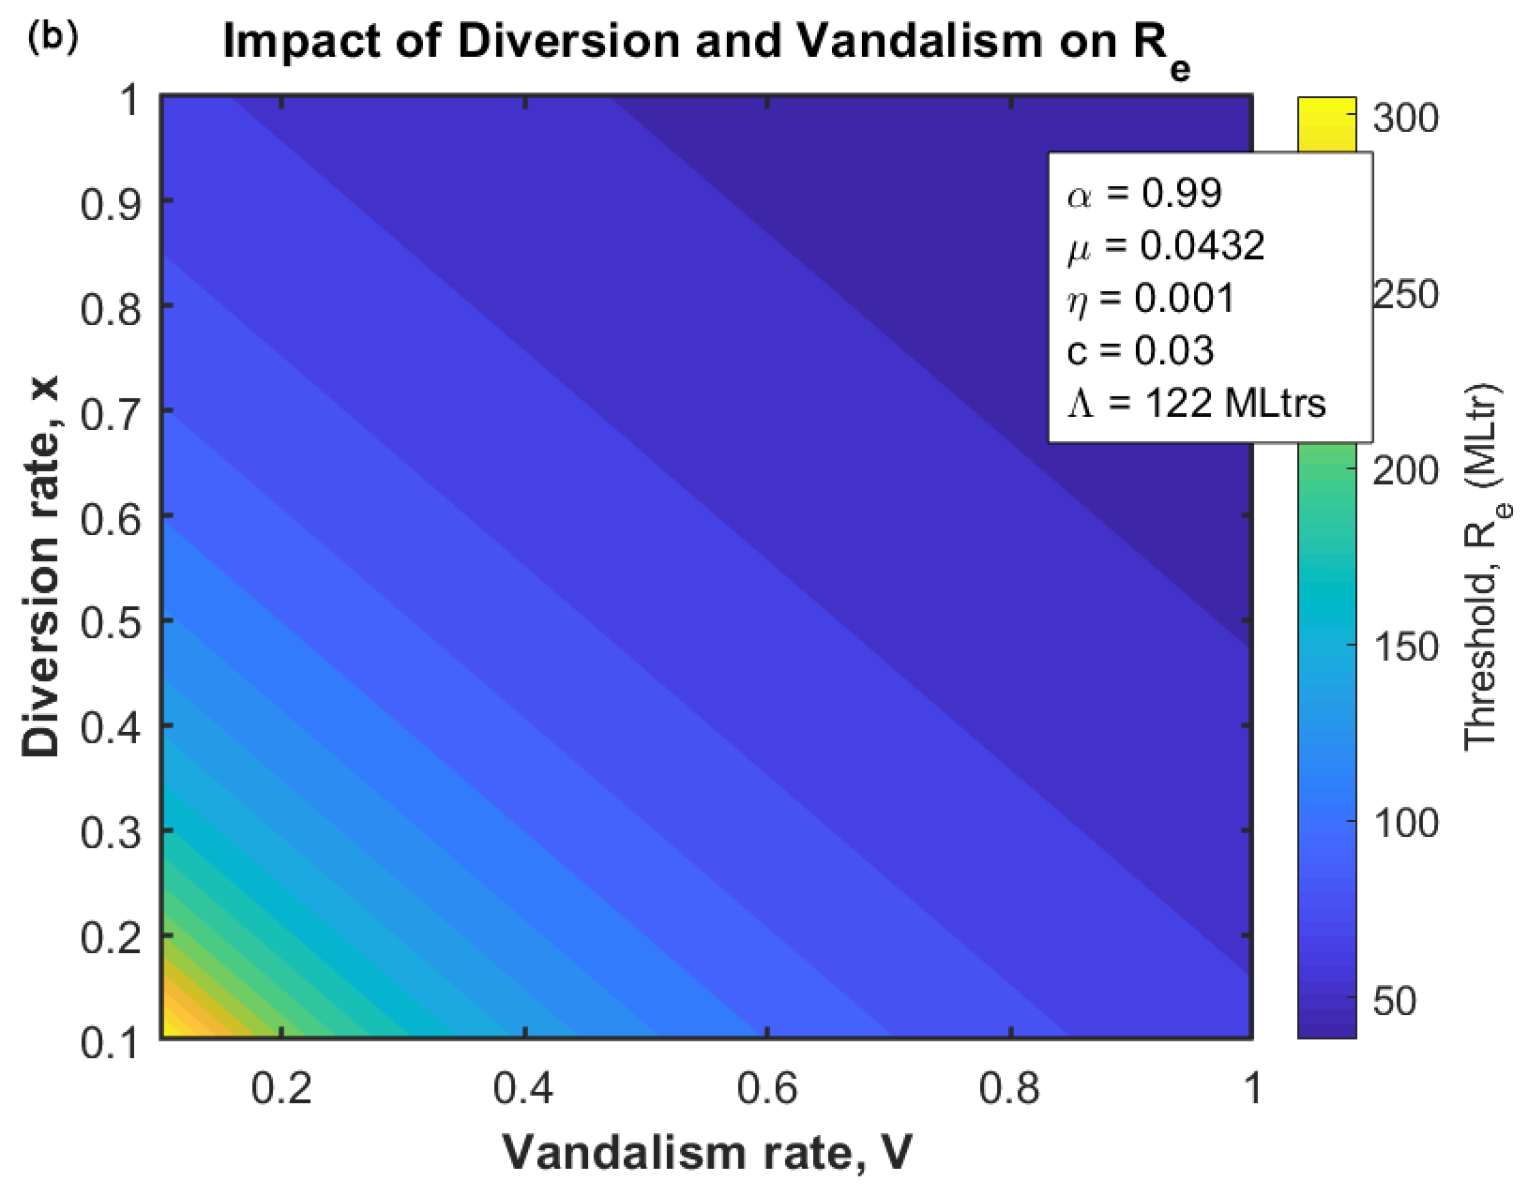
Figure 6 illustrates the simulation outcomes. Panel (a) presents the three-dimensional (mesh) representation, while panel (b) shows the corresponding contour plot. The simulations consider the alternative route implementation parameter under scenarios of severe vandalism (). The horizontal axis represents the level of vandalism, with darker (blue) regions indicating higher levels, while the vertical axis denotes the extent of alternative route deployment. The color gradient reflects the resulting magnitude of the threshold parameter .
Figure 6.
(a) Three-dimensional representation of the combined effects of vandalism and alternative route implementation on . Blue regions correspond to high vandalism with limited alternative routes, while yellow regions indicate improved resilience due to increased alternative route deployment. (b) Contour plot equivalent of Figure 6a, illustrating that higher levels of vandalism require proportionally stronger alternative distribution routes to sustain . Impact of alternative transportation routes under high vandalism scenarios on the fuel distribution threshold .
The results demonstrate that the provision of alternative transportation routes substantially mitigates the adverse impact of vandalism on fuel distribution. Even under extreme vandalism, a modest implementation of alternative routes (approximately 10%) is sufficient to ensure that exceeds the minimum demand threshold. Furthermore, when alternative routes are implemented at levels below 30% effectiveness (), the threshold consistently remains above the estimated daily demand of 42 million liters. This outcome implies a resilient supply chain capable of sustaining stable fuel availability and reducing the likelihood of economic disruptions despite infrastructure sabotage.
3.8.2. Effect of Hoarding and Product Diversion on
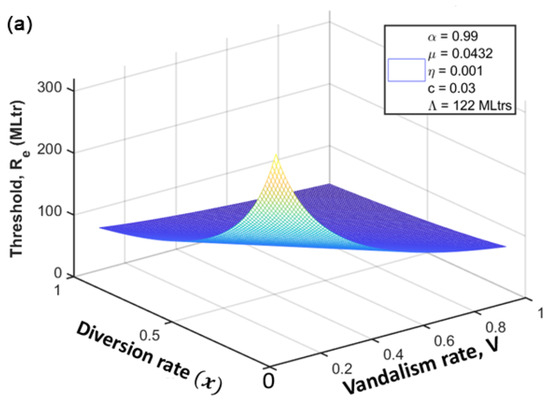
This set of simulations examines the combined influence of fuel diversion and pipeline vandalism on the distribution threshold . Figure 7 depicts the outcomes under varying levels of vandalism and diversion intensity. At extreme vandalism () coupled with substantial diversion of products (low effective contribution from regulated distribution channels), the system struggles to meet the minimum consumption threshold, as indicated by the deep blue regions. In such scenarios, fuel availability is barely sufficient to satisfy consumer demand, leaving minimal or no surplus for national reserves.
Figure 7.
(a) Three-dimensional view of the interaction between vandalism and product diversion on . Maximum supply stability is achieved under minimal vandalism and negligible diversion (yellow region). (b) Contour representation of Figure 7a, showing that increased vandalism amplifies the adverse effects of fuel diversion on . Joint impact of vandalism and product diversion on the fuel distribution threshold .
Conversely, the yellow regions in Figure 7 correspond to conditions of minimal vandalism and negligible diversion. Under these circumstances, the threshold is comfortably exceeded, indicating not only adequate supply to meet consumption needs but also the accumulation of strategic reserves. The transition from yellow to blue regions highlights how increasing diversion, particularly when combined with vandalism, progressively erodes system efficiency and threatens supply stability.
Overall, these results underscore that meeting or exceeding the threshold is essential for preventing fuel scarcity. They further emphasize the importance of robust regulatory oversight, effective monitoring by relevant authorities, and coordinated supply chain management to limit diversion and hoarding. Such measures are critical for enhancing the resilience of Nigeria’s downstream petroleum distribution network.
3.9. Numerical Simulation of Global Stability Analysis
Global asymptotic stability of an equilibrium implies that, irrespective of the initial fuel stock levels at depots, transporters, or retail outlets, the downstream fuel distribution system converges to a unique steady operating state, provided the effective distribution threshold satisfies the required condition. In this subsection, numerical simulations are conducted to validate the analytical global stability results established in Section 3.5.2 and Section 3.6.
The simulations focus on the subsystem comprising Equations (1)–(3), which describe the dynamics of White Tank/Refinery Storage , retail allocation (intermediate storage/Retail depot) , and transporter stock . Parameter values and baseline conditions are adopted from Table 1. To assess robustness against perturbations, diverse initial conditions (twenty (20) distinct initial conditions) were selected within realistic operational ranges, representing diverse fuel supply and distribution scenarios.
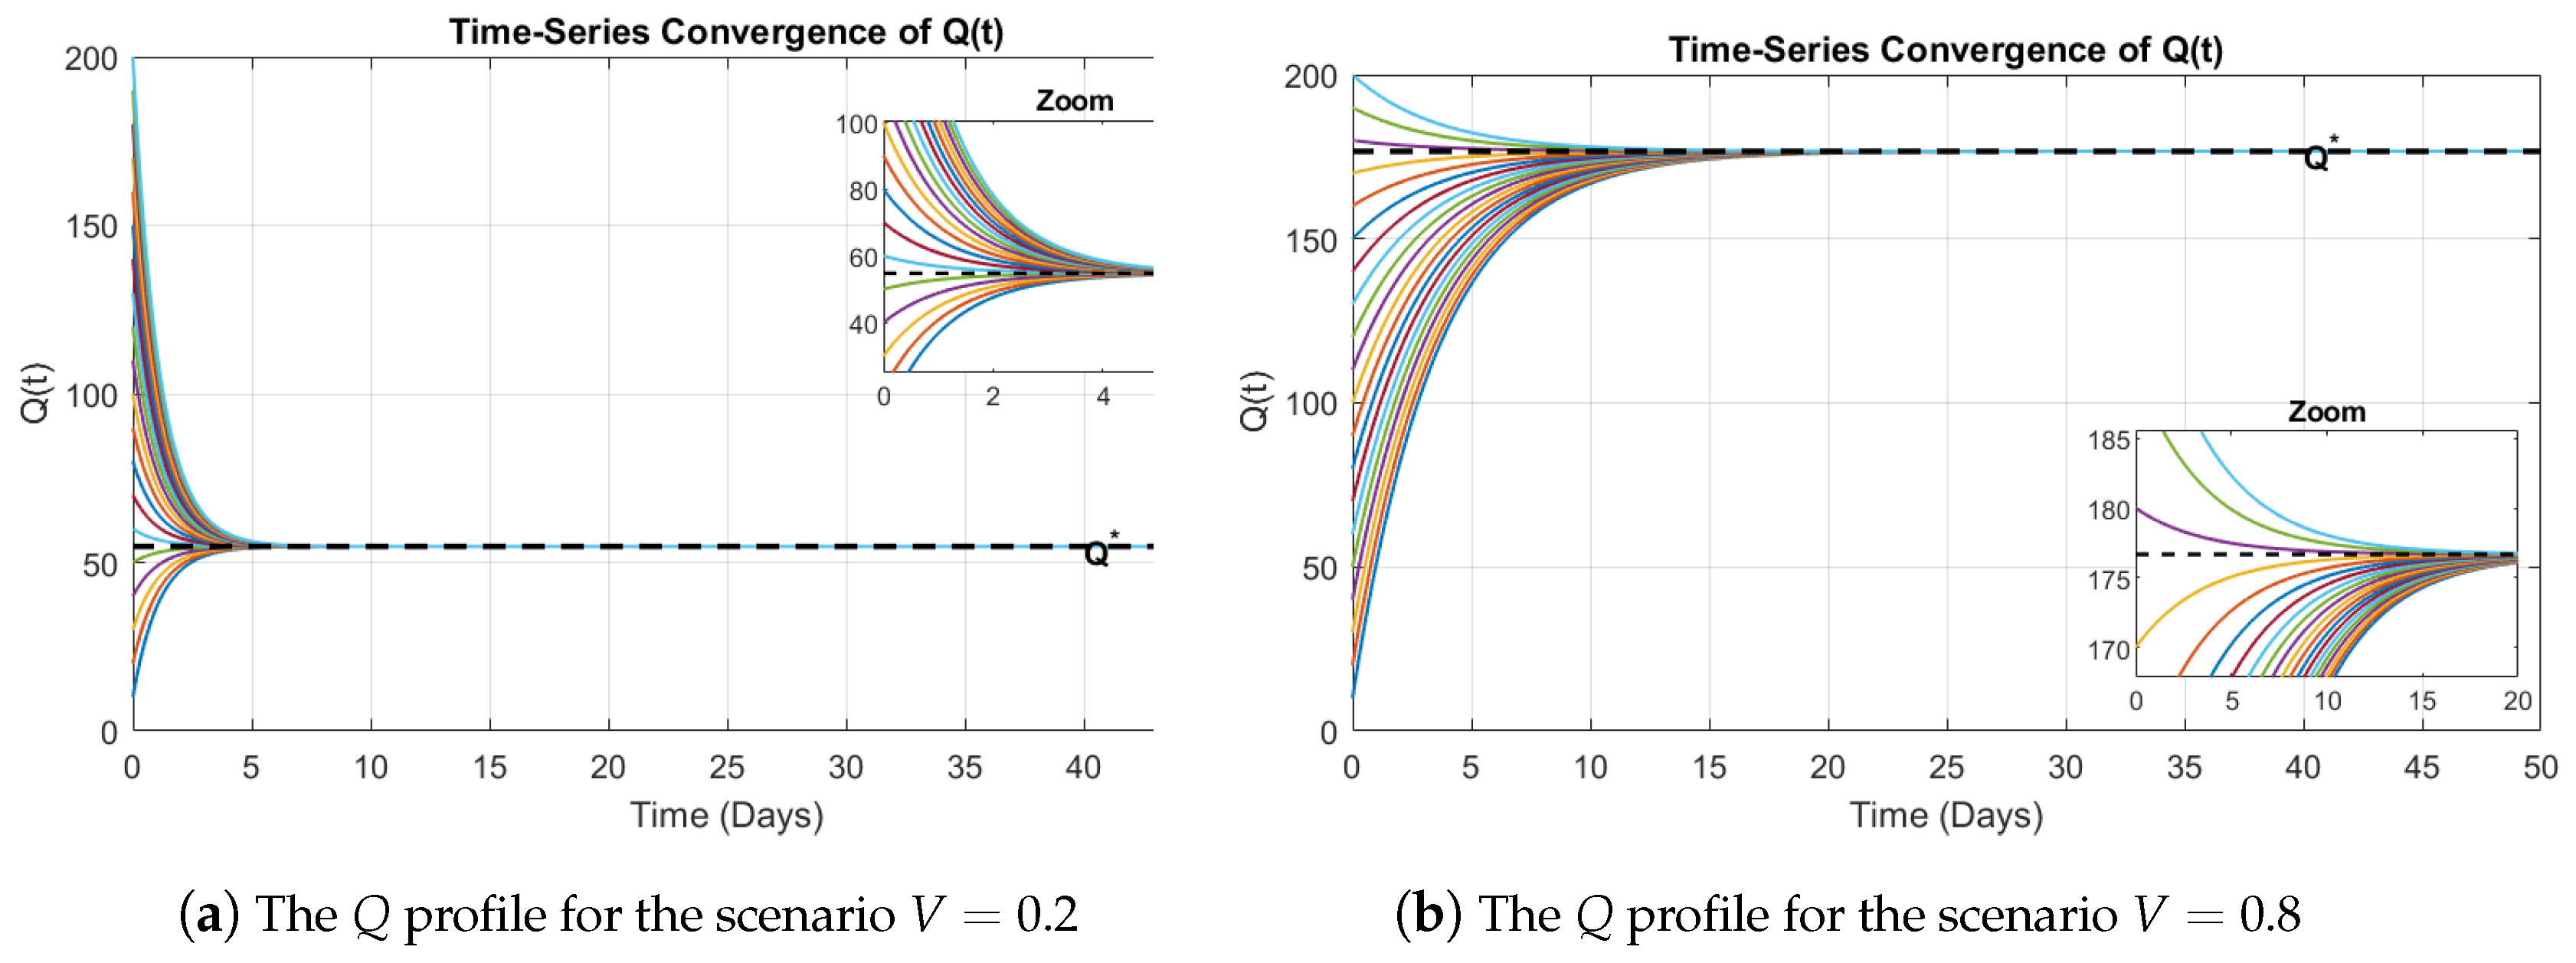
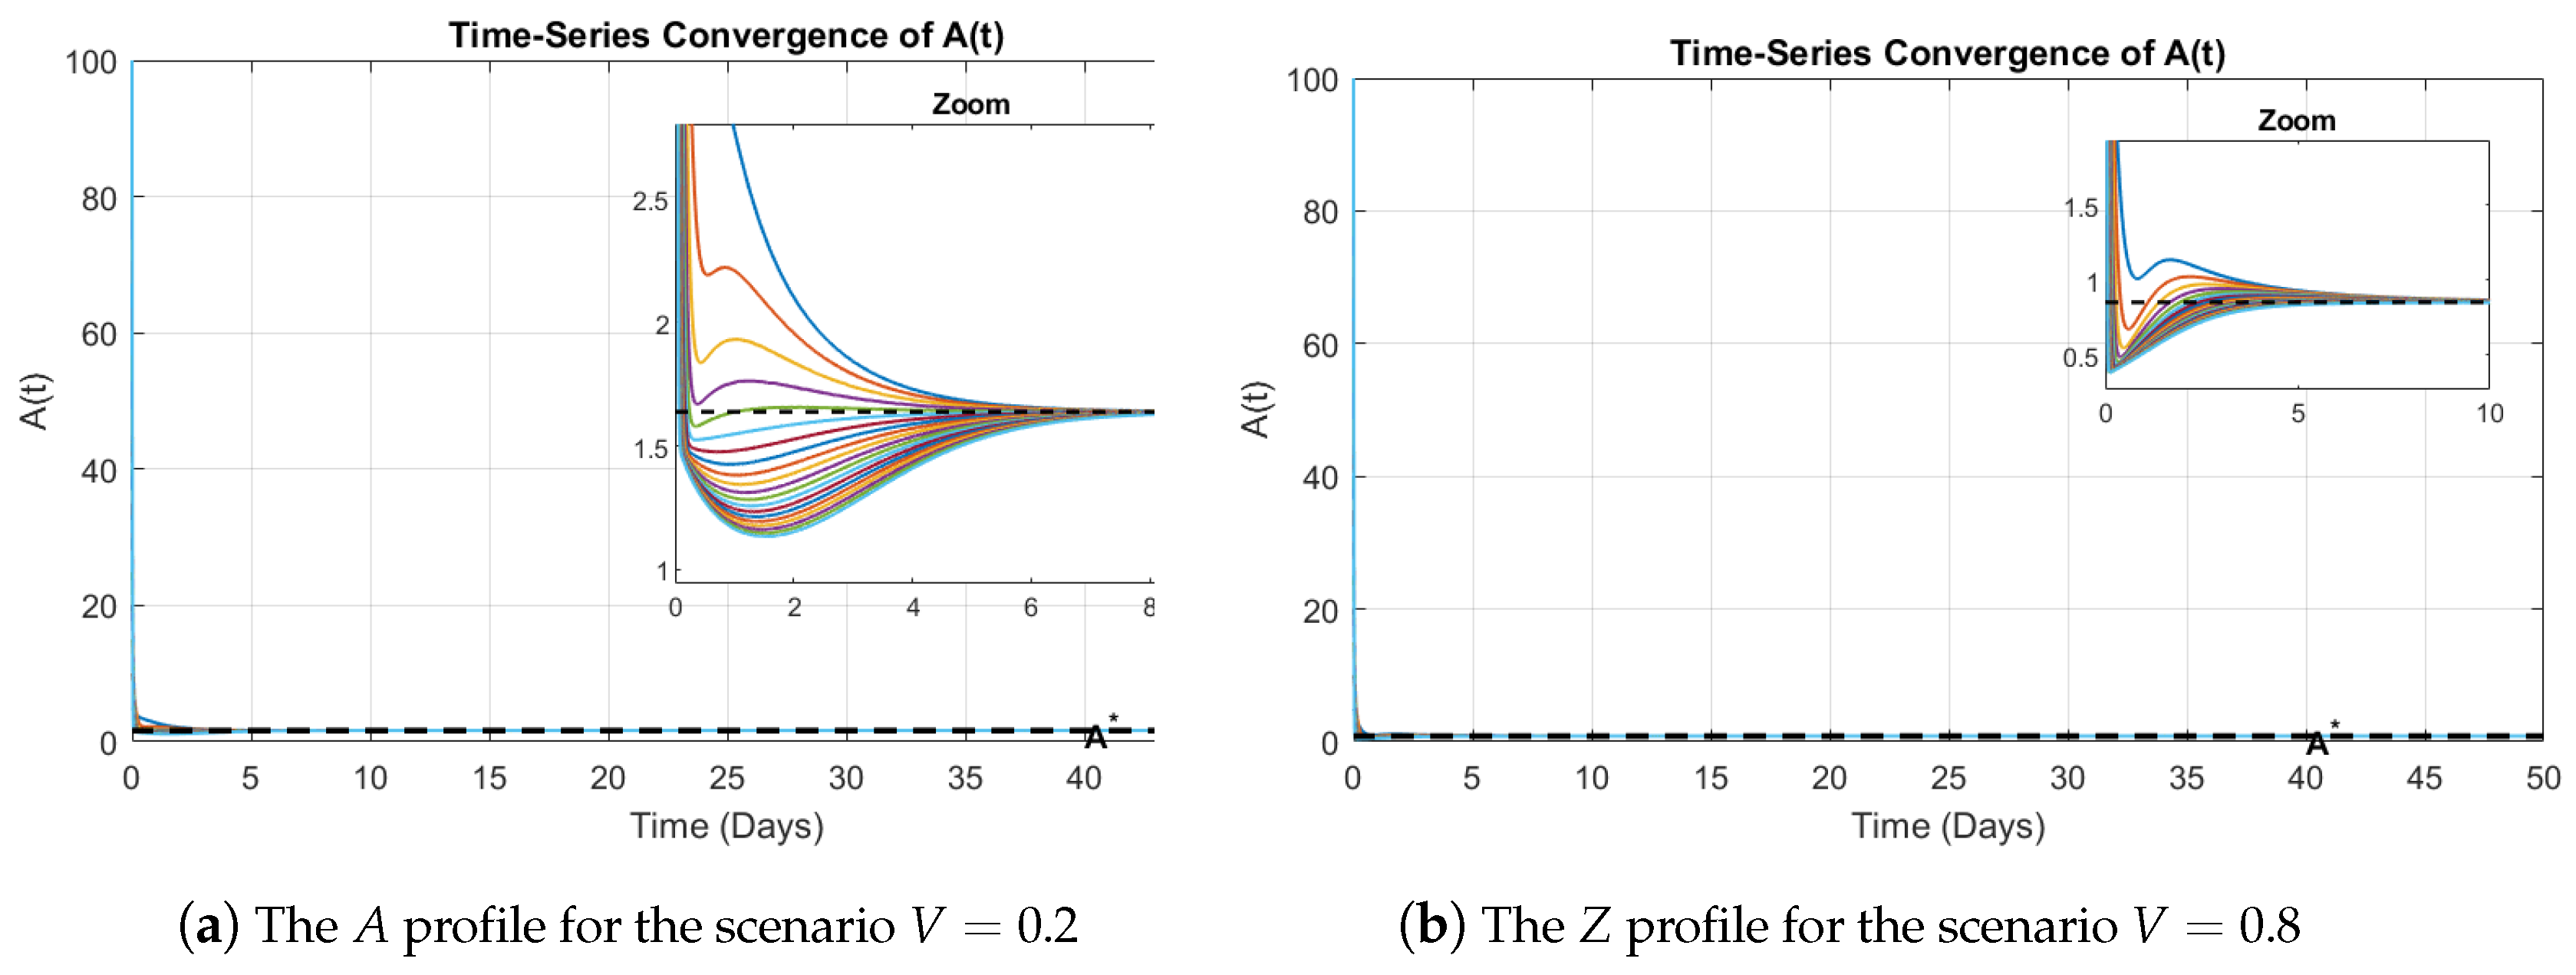
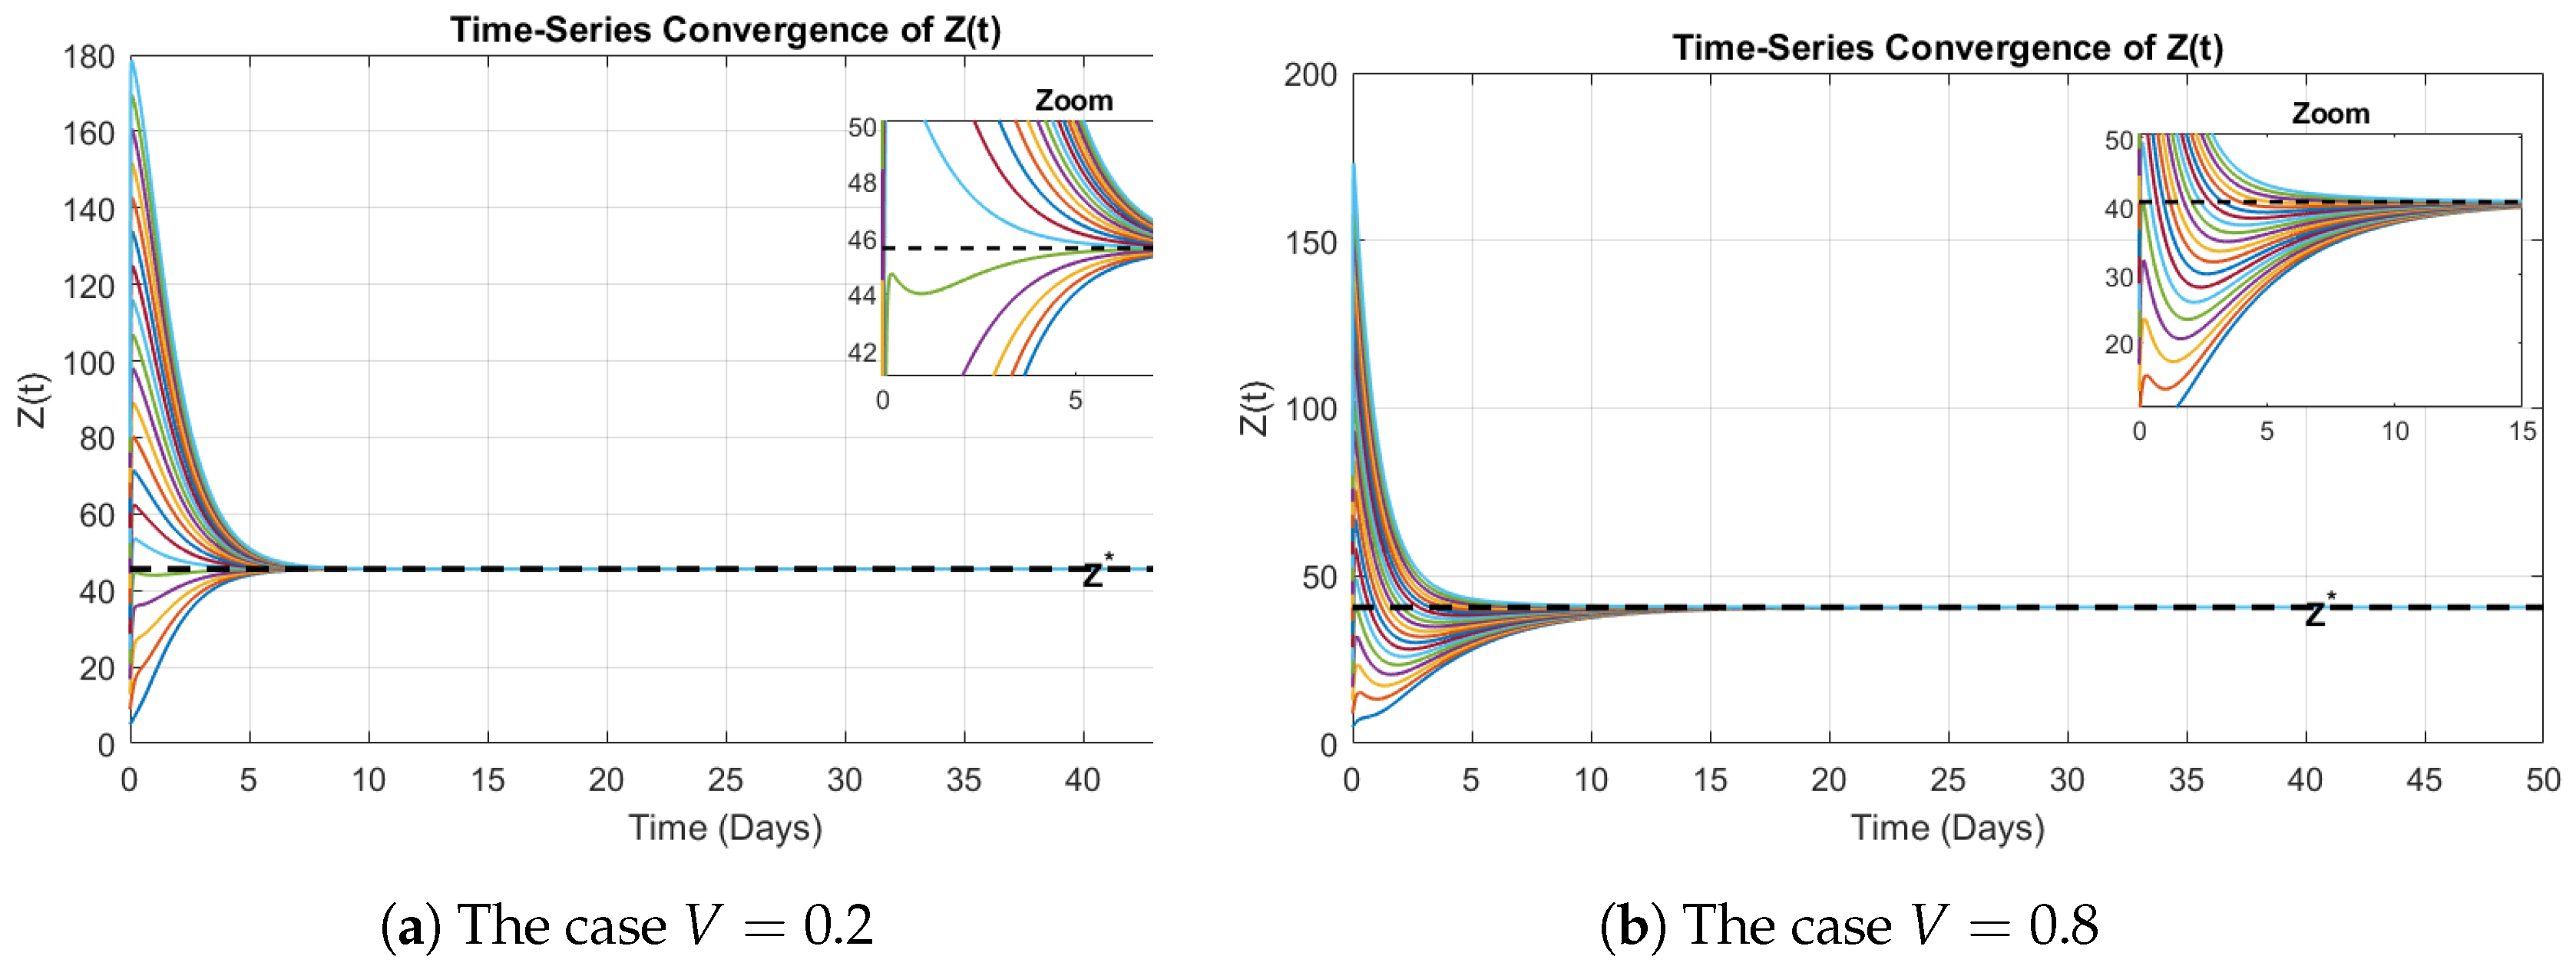
Two vandalism regimes were considered to examine the influence of pipeline disruption on system stability: a low-vandalism scenario () and a near-maximal vandalism scenario (). These scenarios allow for evaluating the sensitivity of the convergence behavior to infrastructure stress while maintaining all other parameters fixed. For both cases, the computed distribution threshold satisfies , with a representative value , indicating a strongly supply-dominant regime.
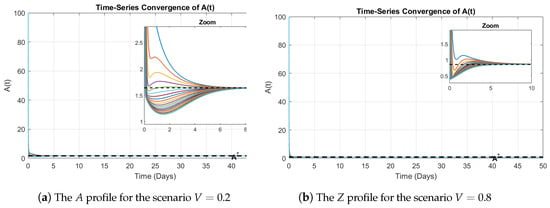
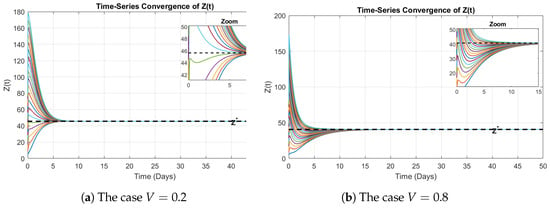
The time-series simulations for , , and , shown in Figure 8, Figure 9 and Figure 10, demonstrate that all solution trajectories converge to the same equilibrium point, regardless of the initial perturbations. Although transient dynamics differ across simulations due to initial imbalances, these differences diminish over time, and the system uniformly approaches its steady state. This convergence behavior persists across both vandalism scenarios, highlighting the resilience of the subsystem.
Figure 8.
Time-series convergence profile of Q.
Figure 9.
Time-series convergence profile of Intermediate (Retail) Depot (A).
Figure 10.
Time-series convergence of transporters (Z) class.
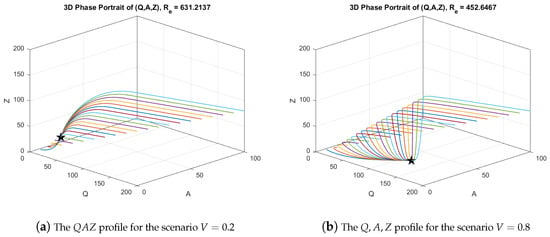
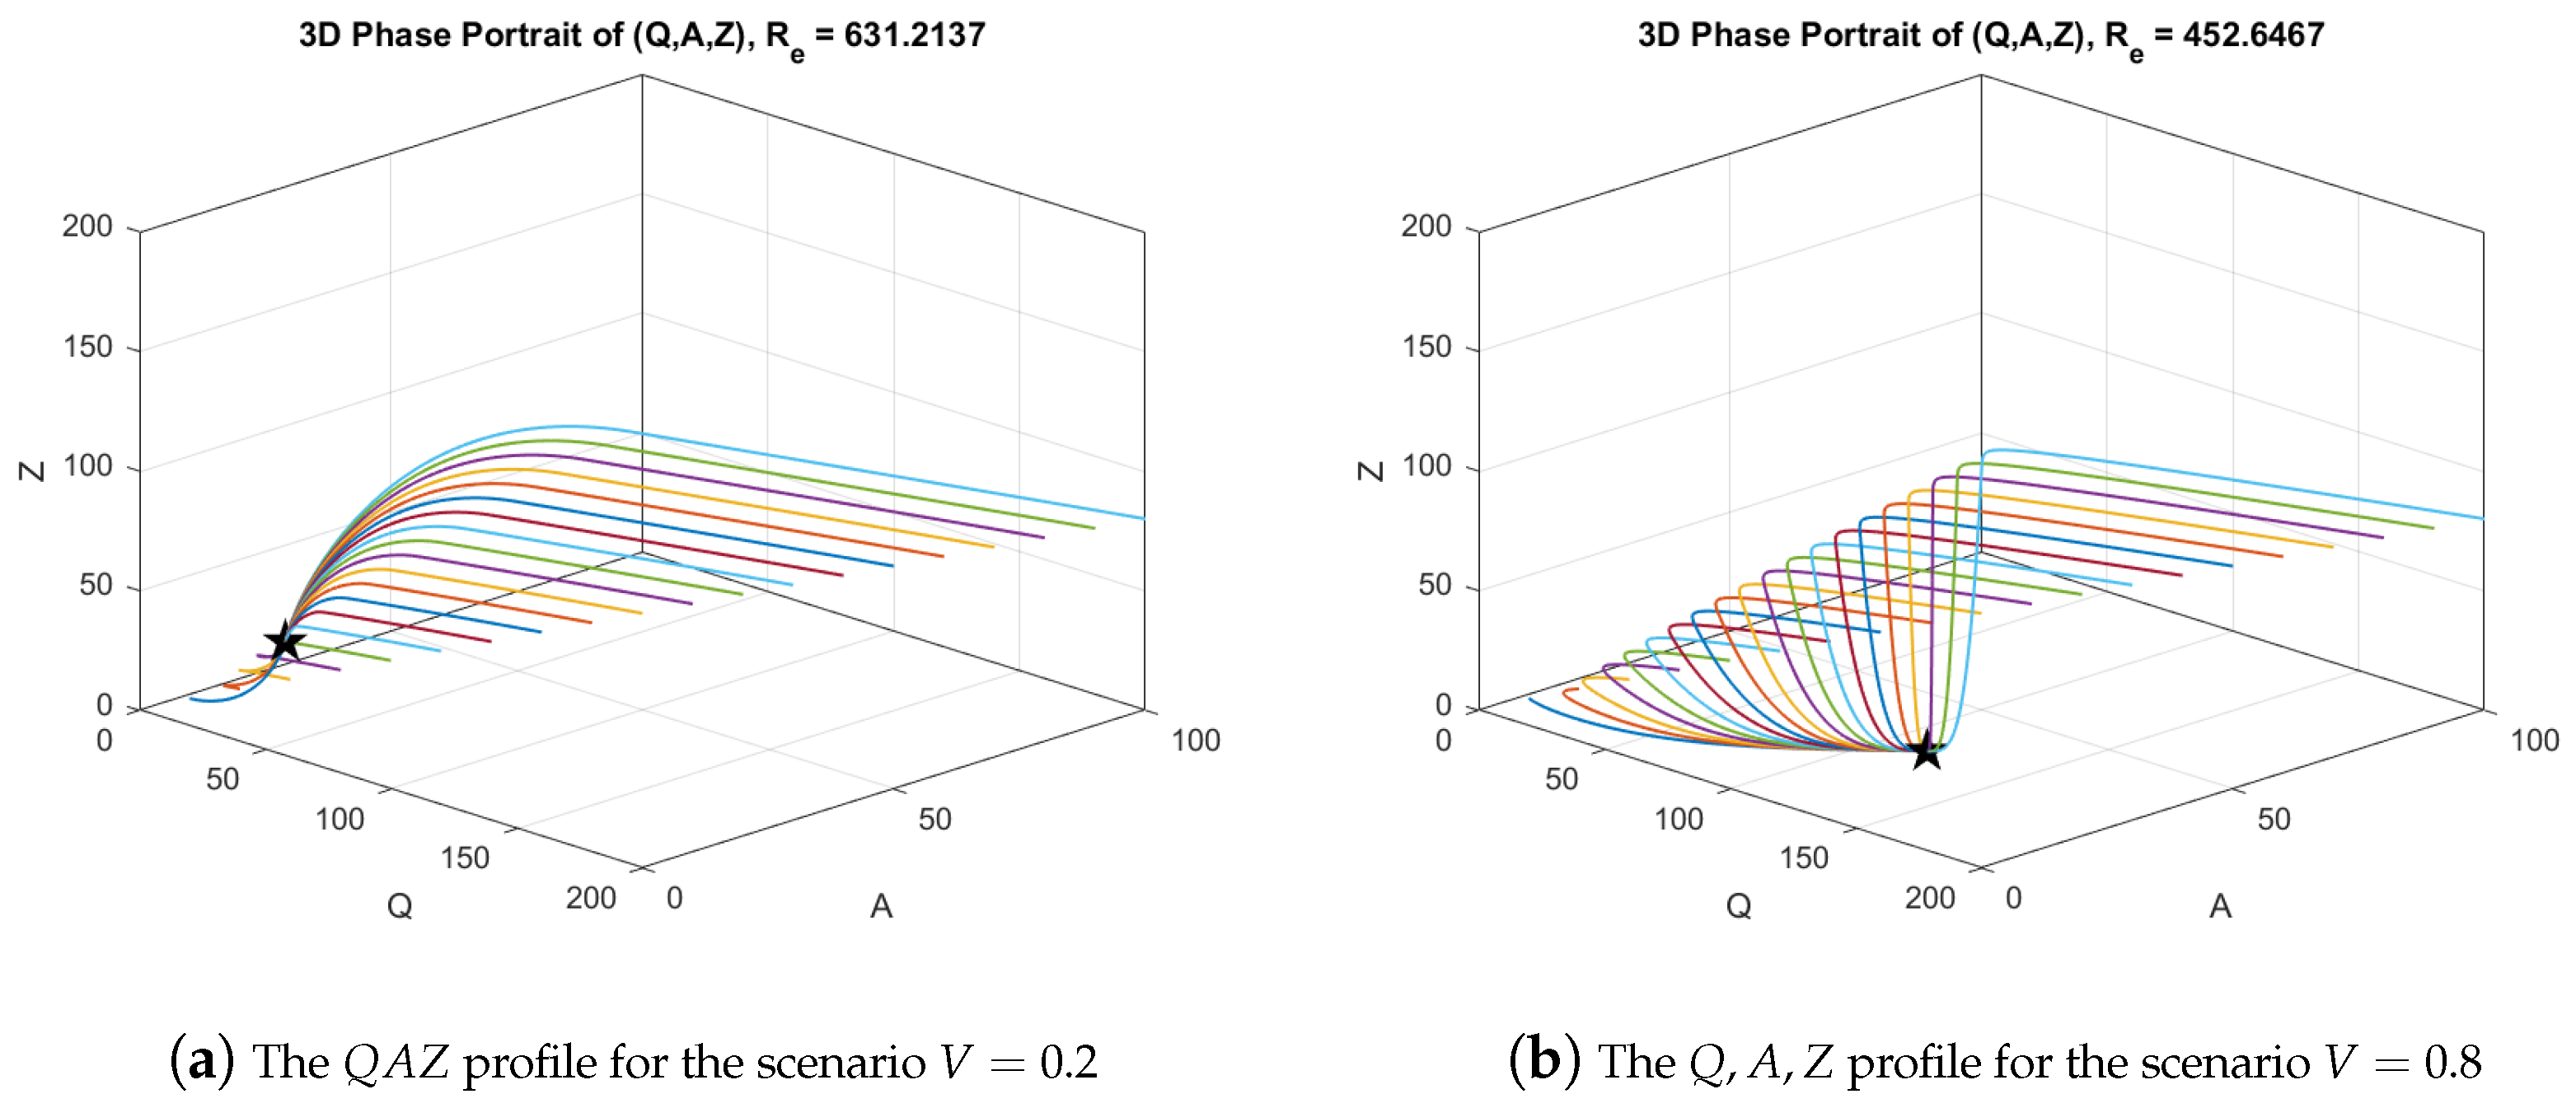
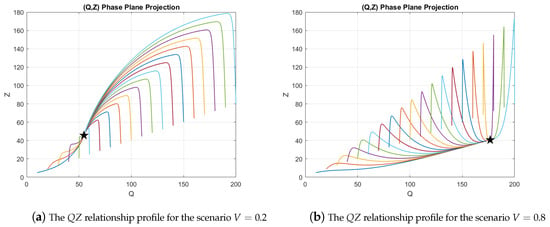
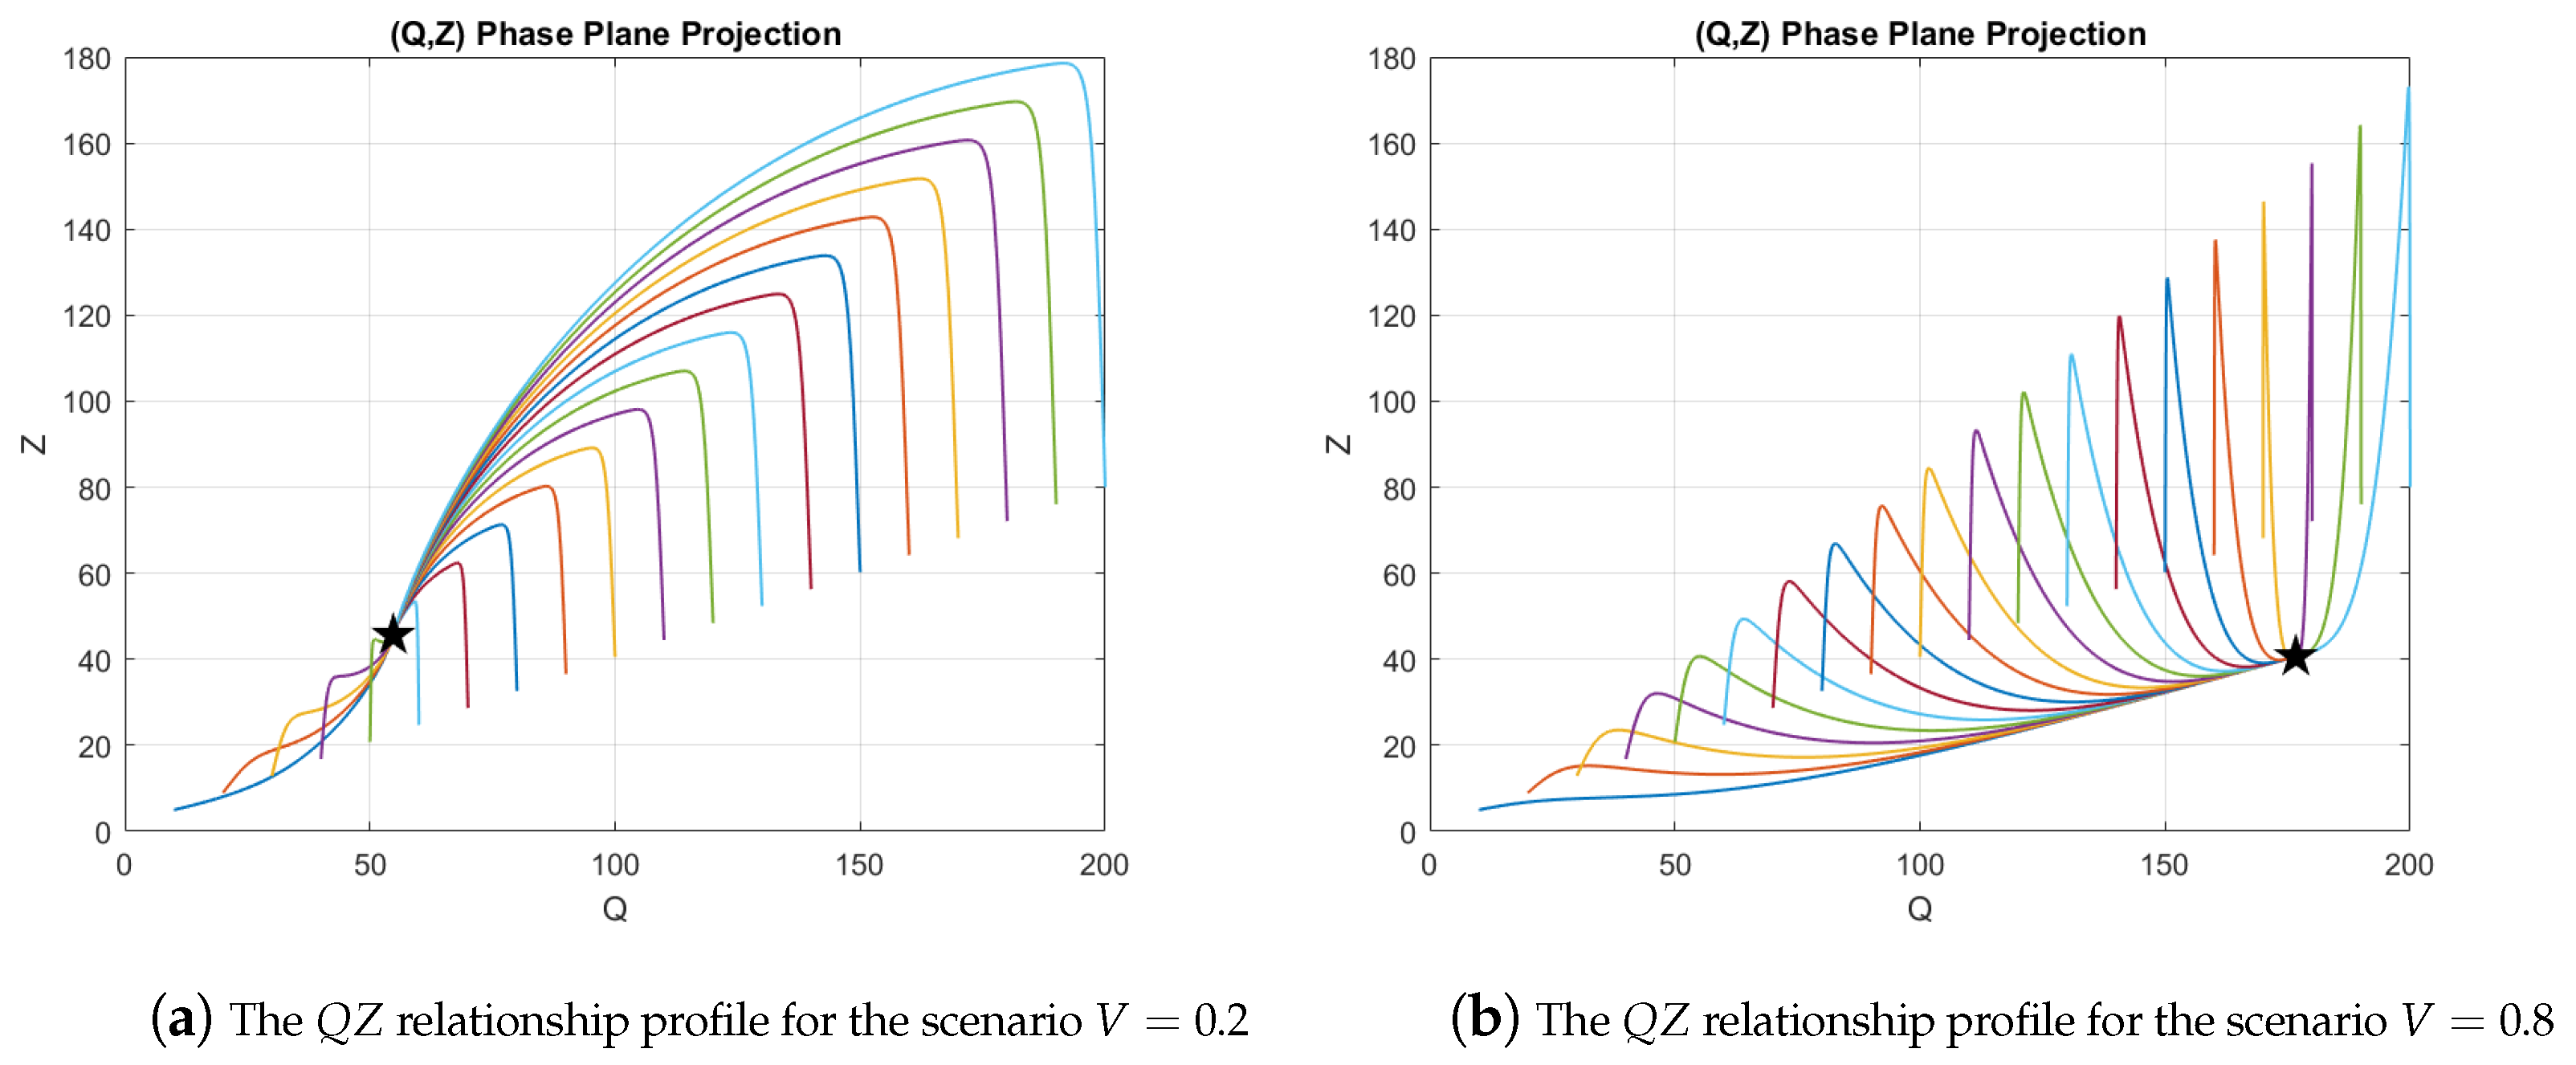
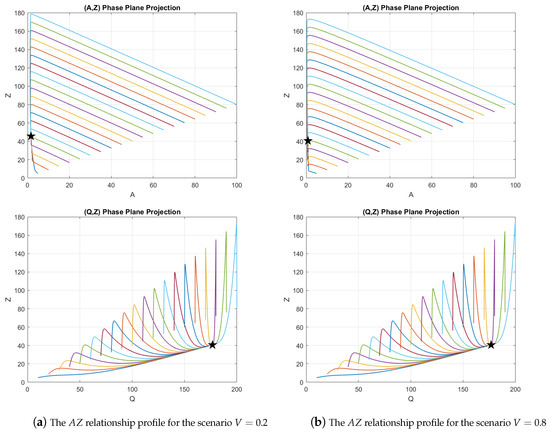
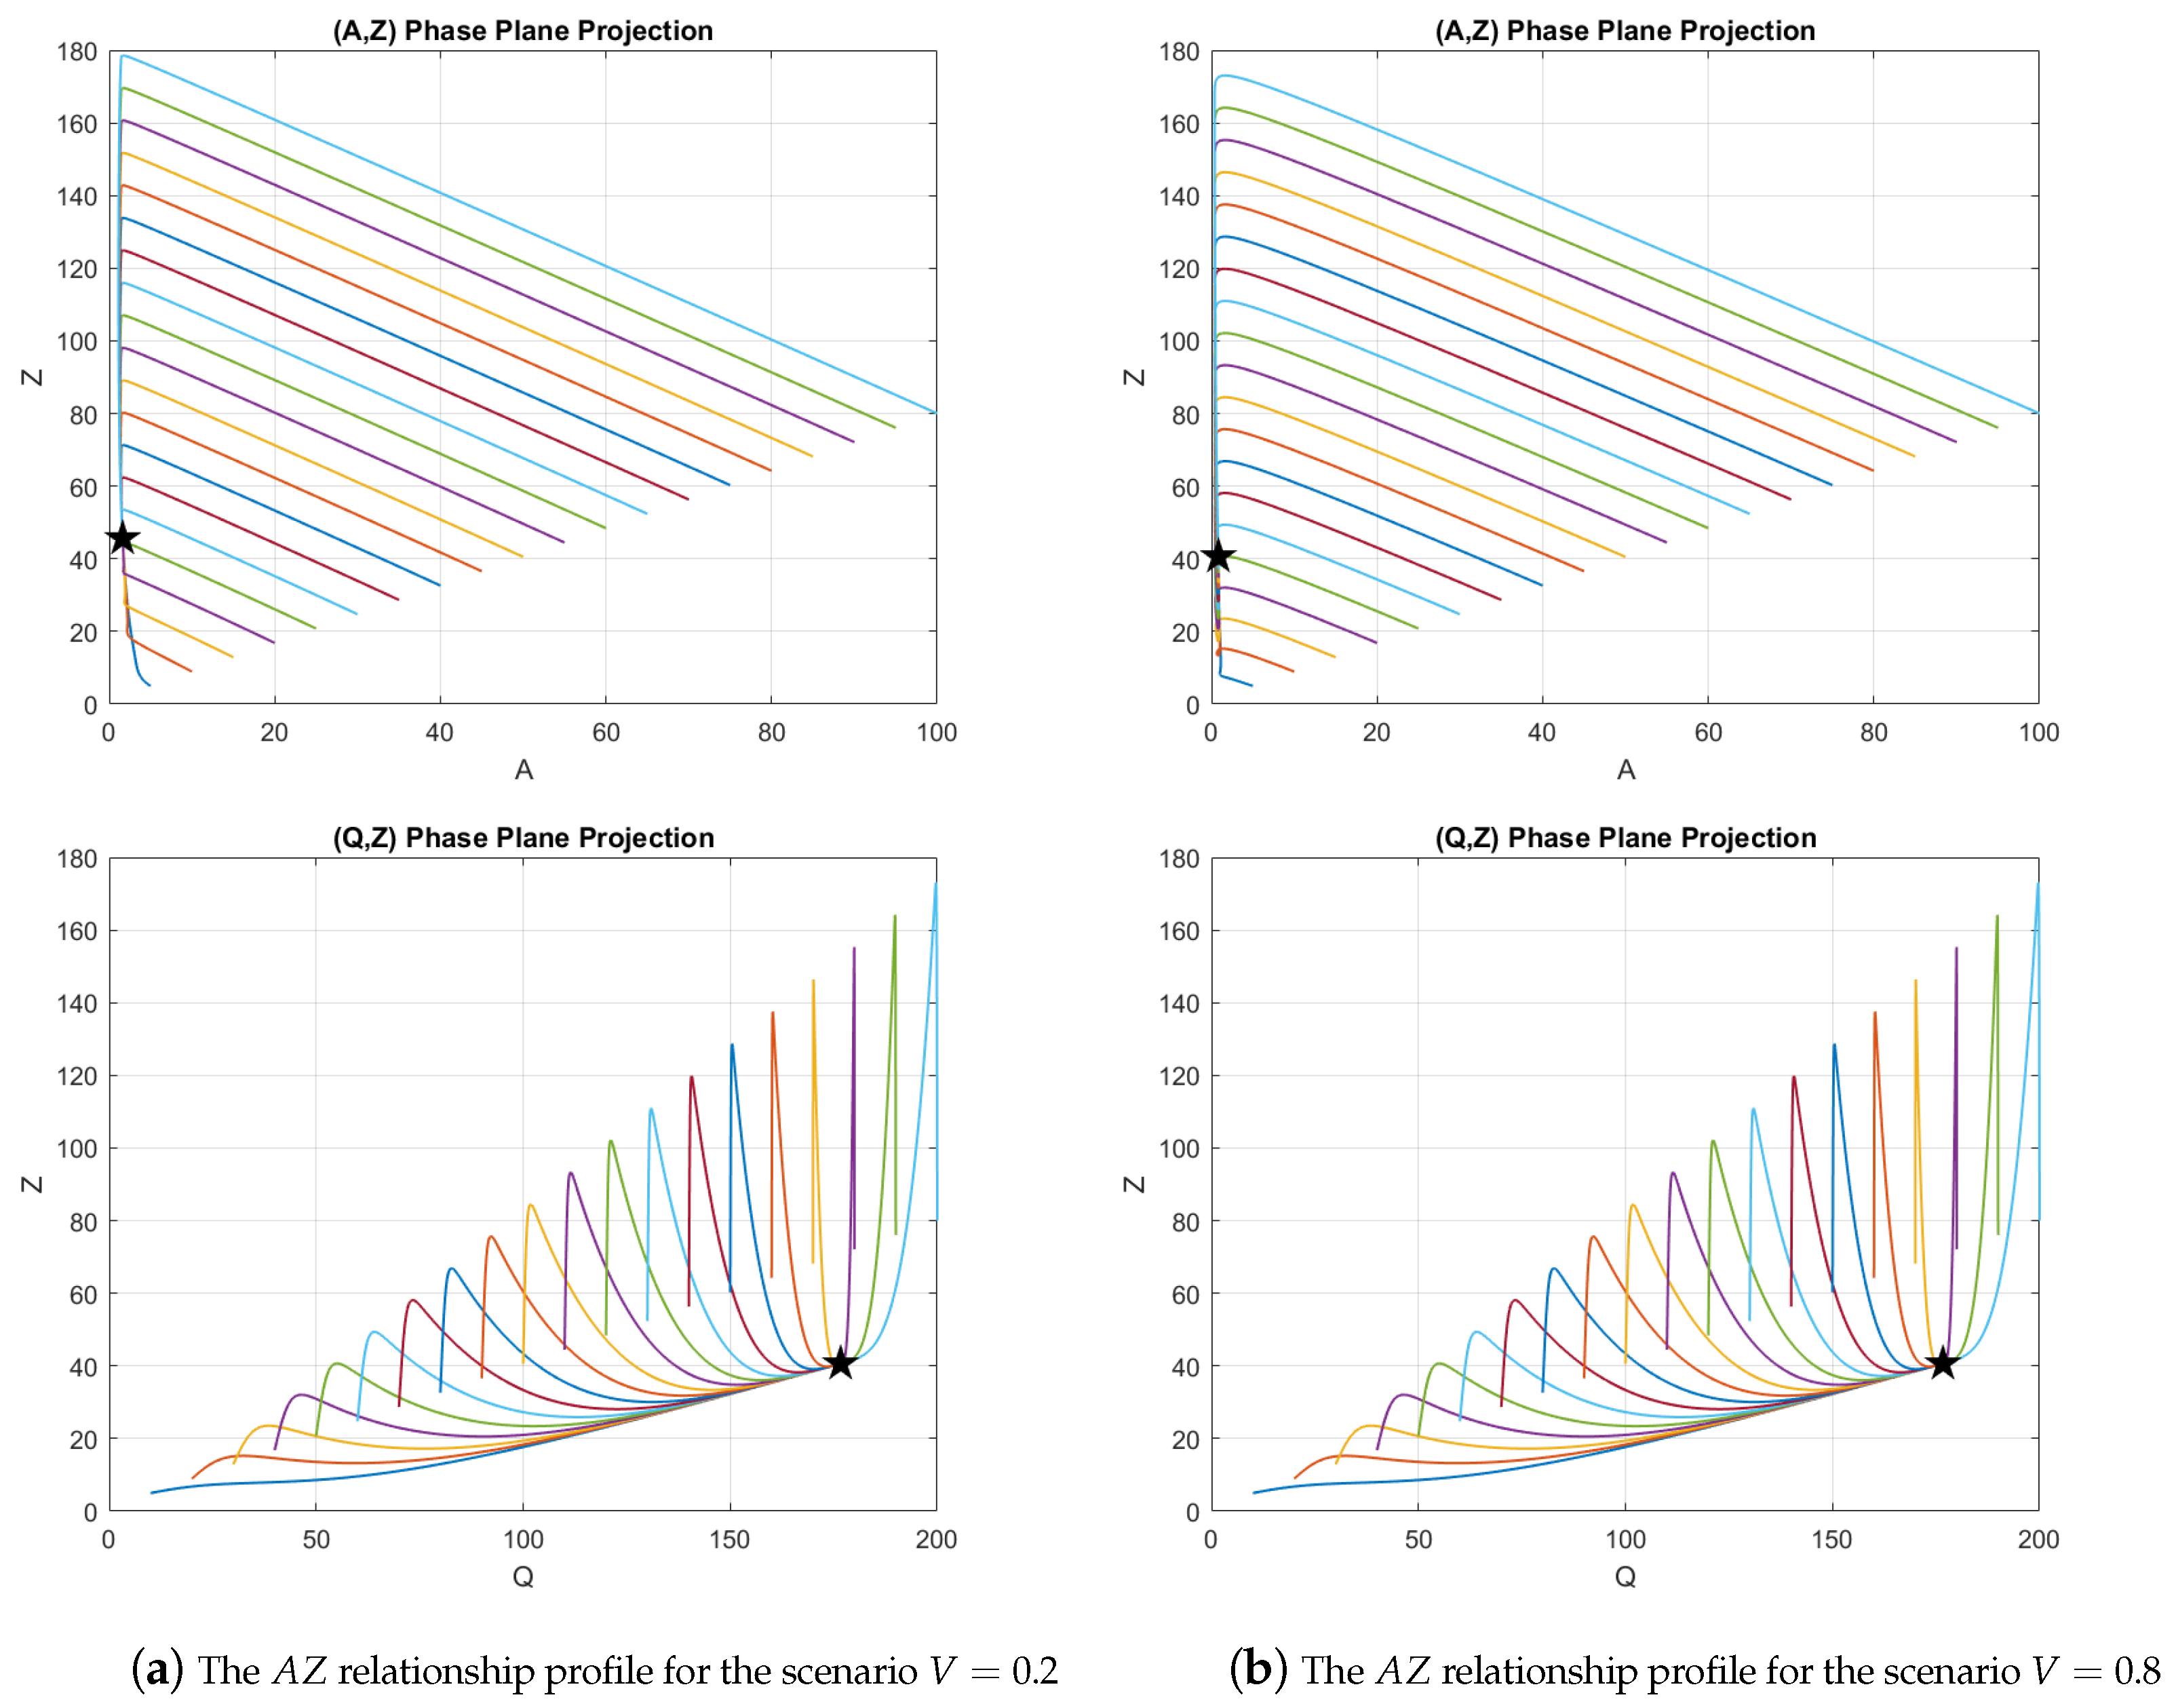
Phase-space analyses further corroborate the global stability property. The three-dimensional phase-plane projections displayed in Figure 11 reveal that trajectories originating from widely separated initial conditions contract toward a single equilibrium point, forming a unique global attractor. No oscillatory behavior, divergence, or multistability is observed. Complementary two-dimensional projections in the and planes, presented in Figure 12 and Figure 13, exhibit similar contraction patterns, reinforcing the conclusion of global asymptotic stability.
Figure 11.
Three-dimensional phase-plane projections () demonstrate a single global attractor; the five-pointed star (equilibrium point).
Figure 12.
Two-dimensional phase-plane projections. Impact of perturbation on subsystem and convergence to equilibrium point (the five-pointed star).
Figure 13.
Two-dimensional phase-plane projections. Different colour indicate different initial conditions, which each exihibits corresponding dynamics but all converges to the same equilibrium point (the five-point star).
The observed stability is further supported by the underlying parameter regime. A sufficiently large inflow rate (), high distribution efficiency (, ), and loss rates (, ) jointly yield a large threshold value, as illustrated in Figure 11. This combination ensures that effective fuel supply and distribution capacity dominate system losses, thereby sustaining convergence to equilibrium even under substantial perturbations.
Collectively, these numerical findings corroborate the analytical stability results and confirm that the downstream fuel distribution system is globally stable whenever . From a practical standpoint, this implies that temporary disturbances such as short-term supply shocks, logistical disruptions, or abnormal fuel accumulation do not permanently destabilize the system. Provided that effective supply capacity outweighs aggregate losses due to diversion, decay, and inefficiencies, the fuel distribution dynamics naturally return to a stable operating regime. These results provide strong numerical validation of the global asymptotic stability established analytically in Theorem 3.
3.9.1. Simulation of the Whole Model
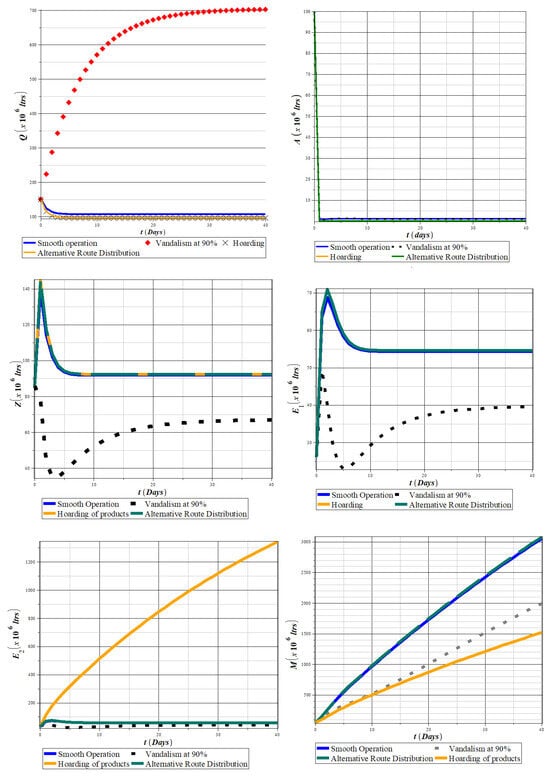
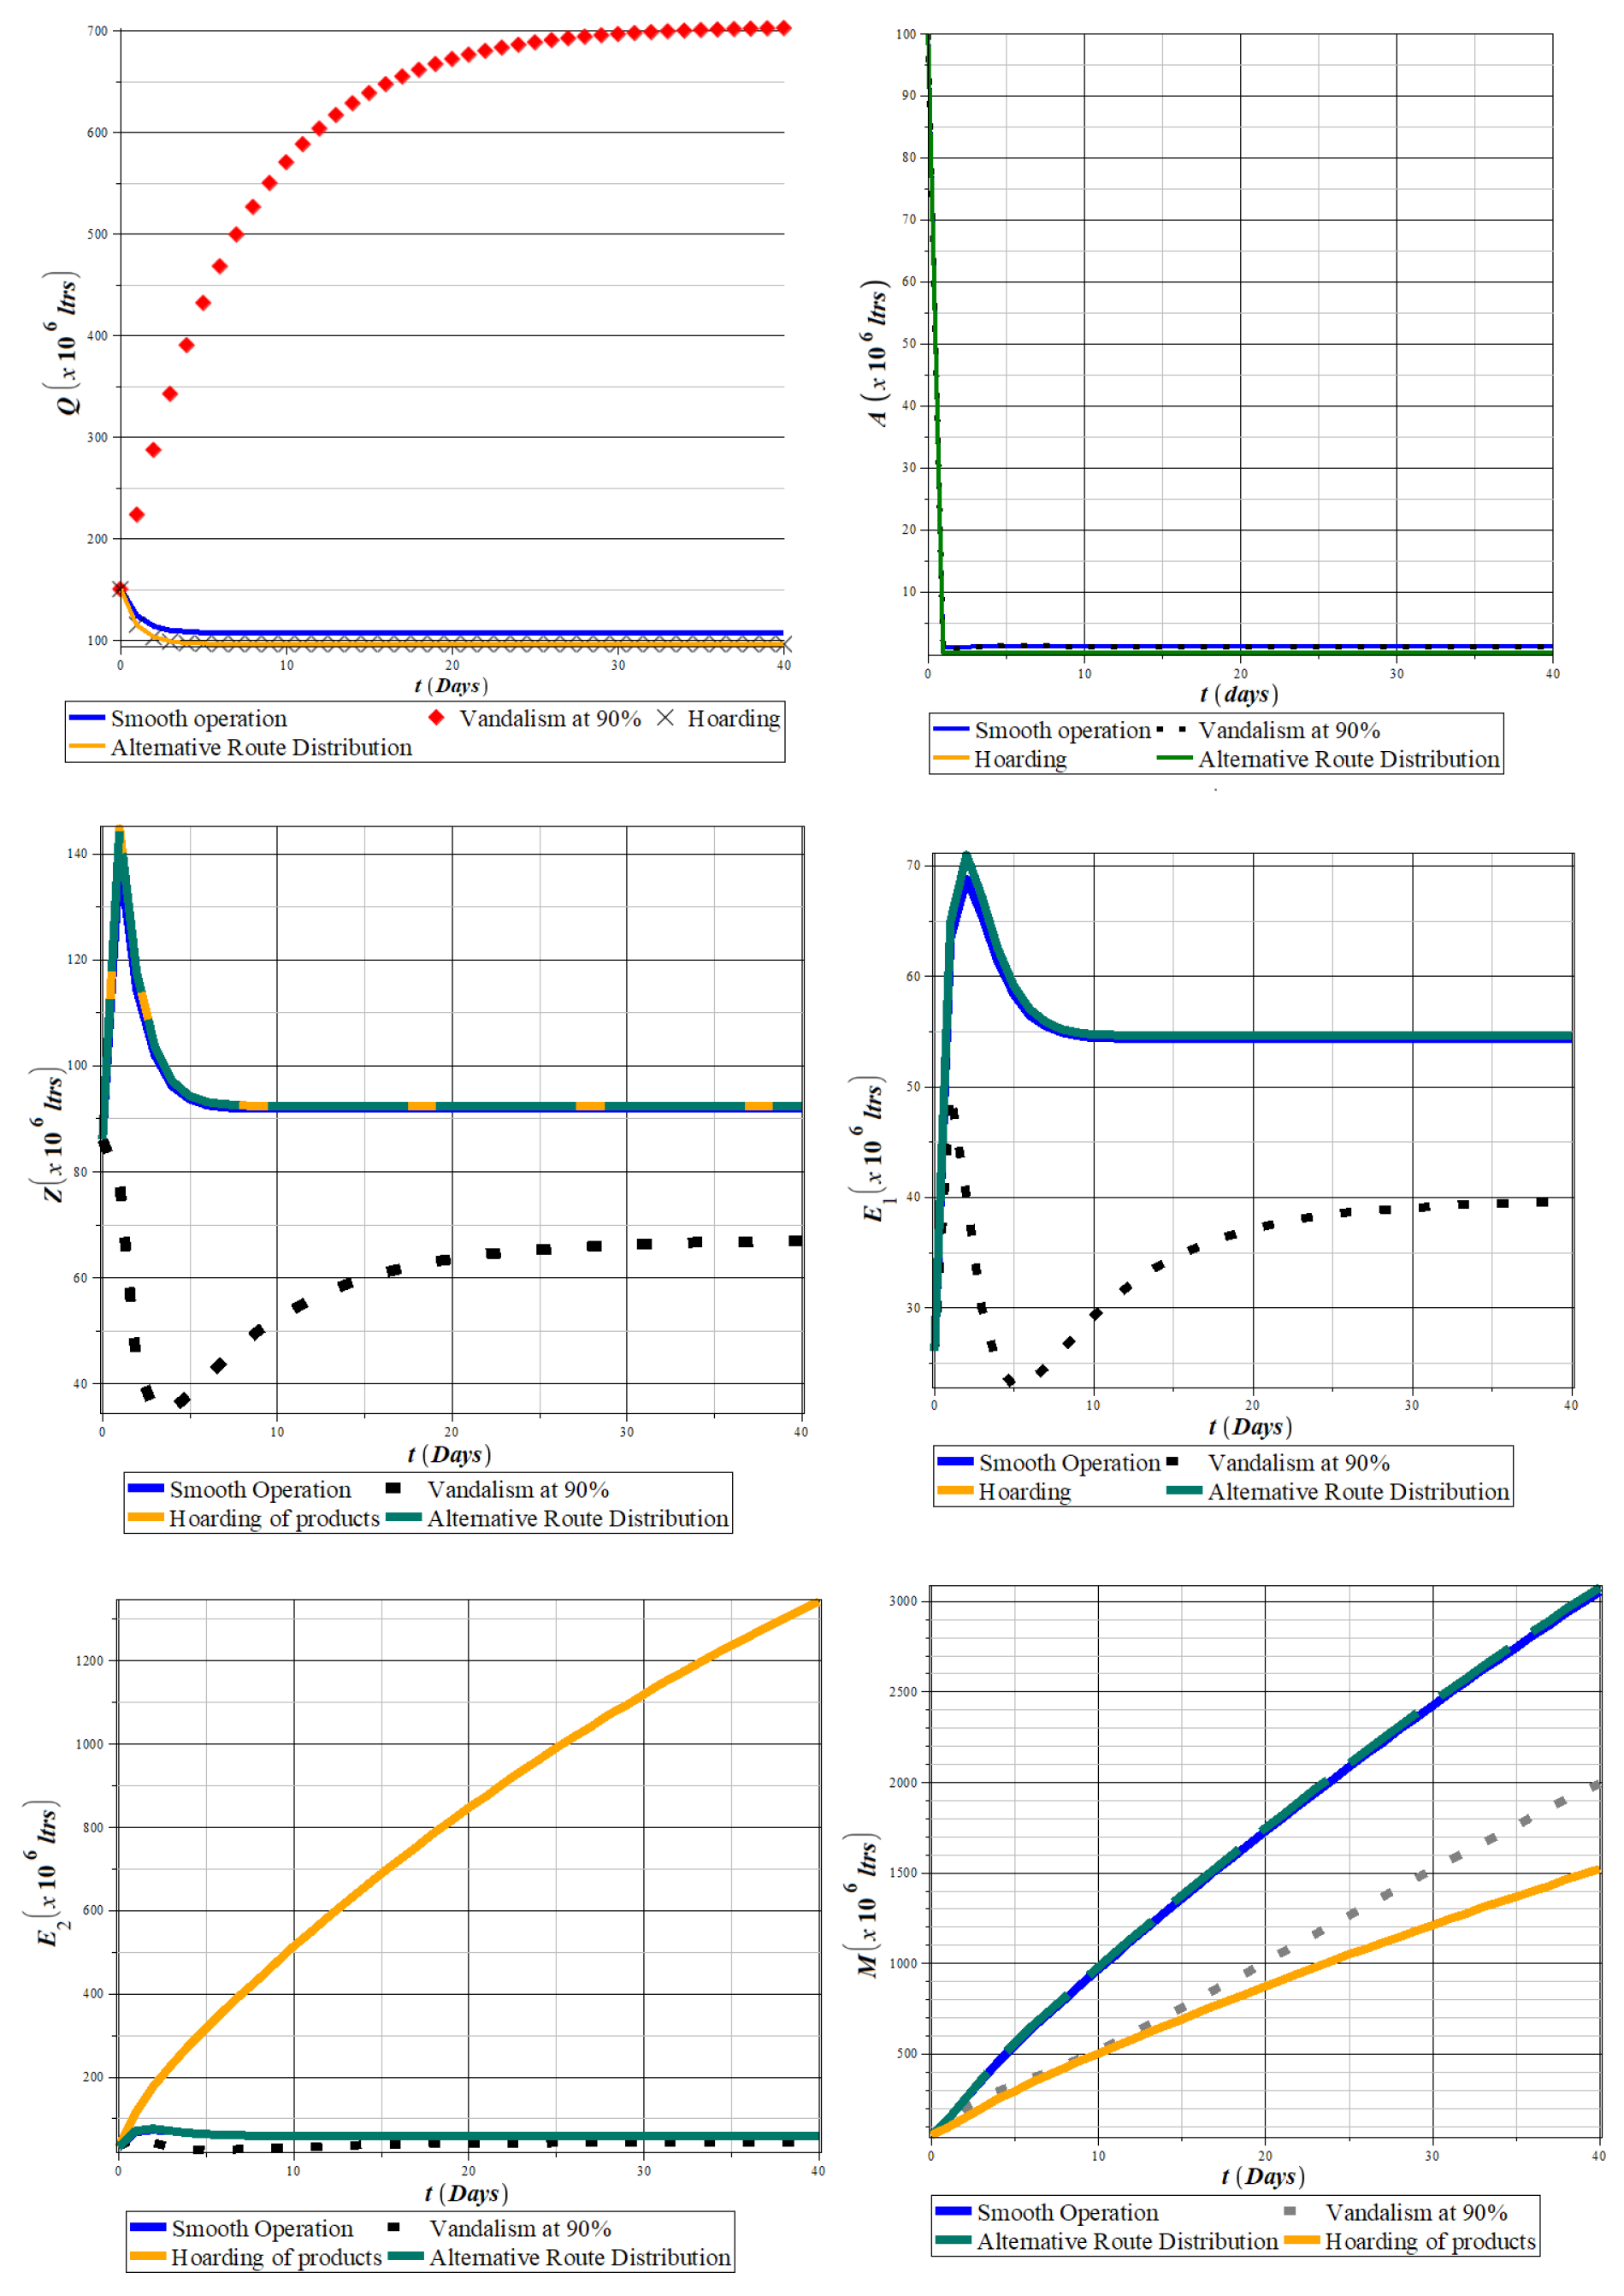
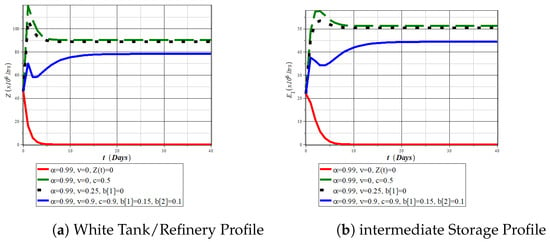
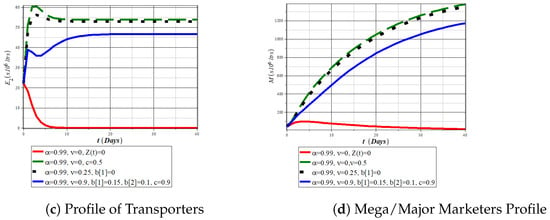
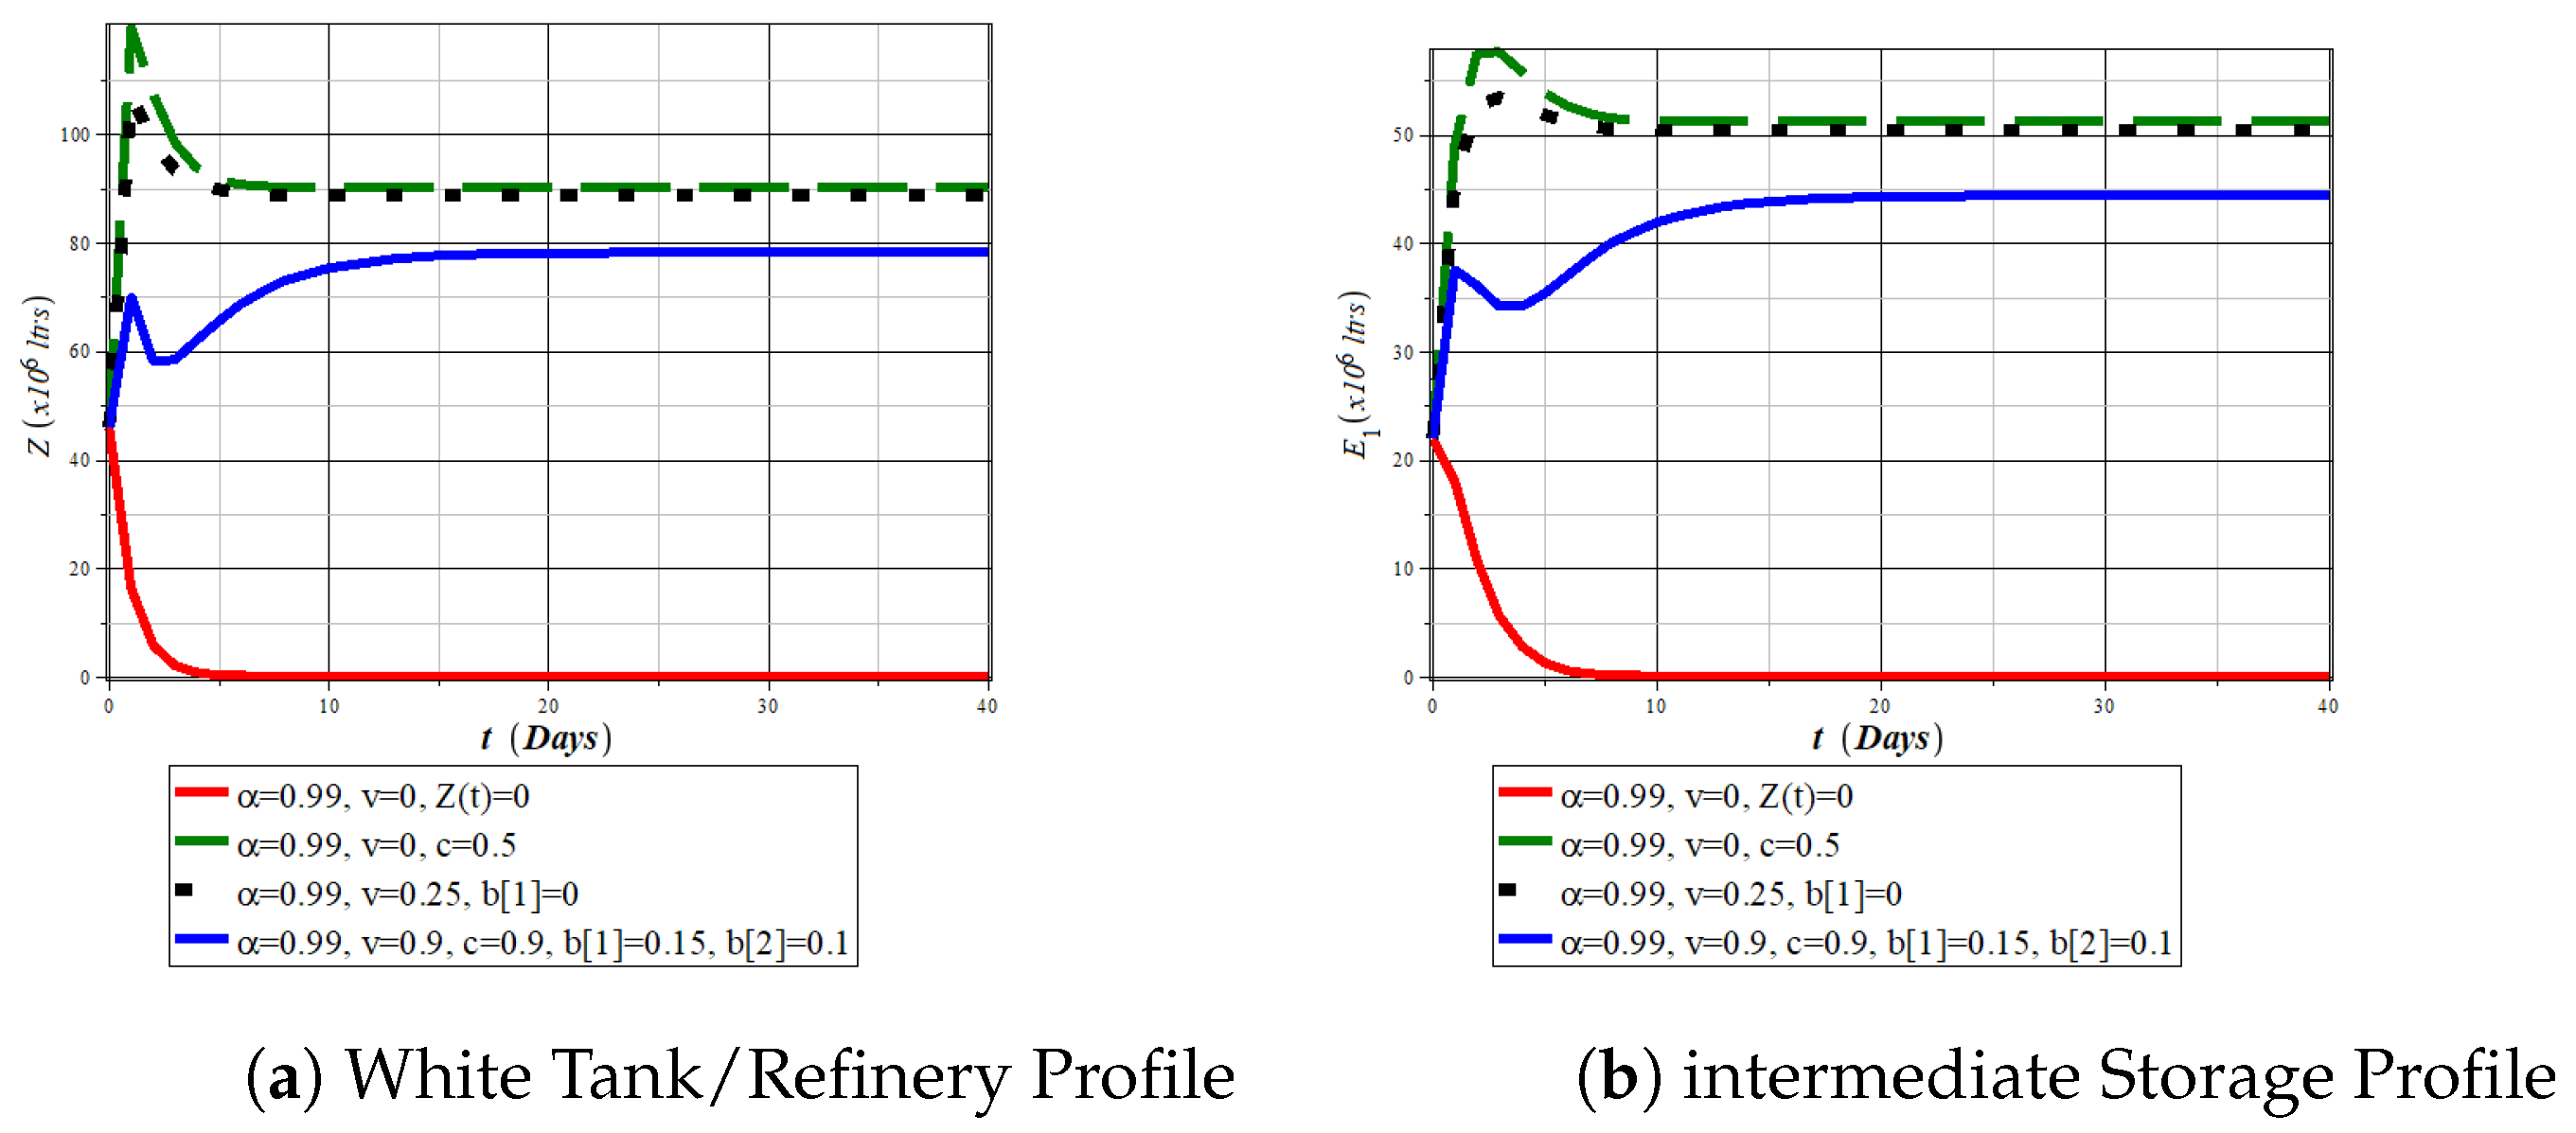
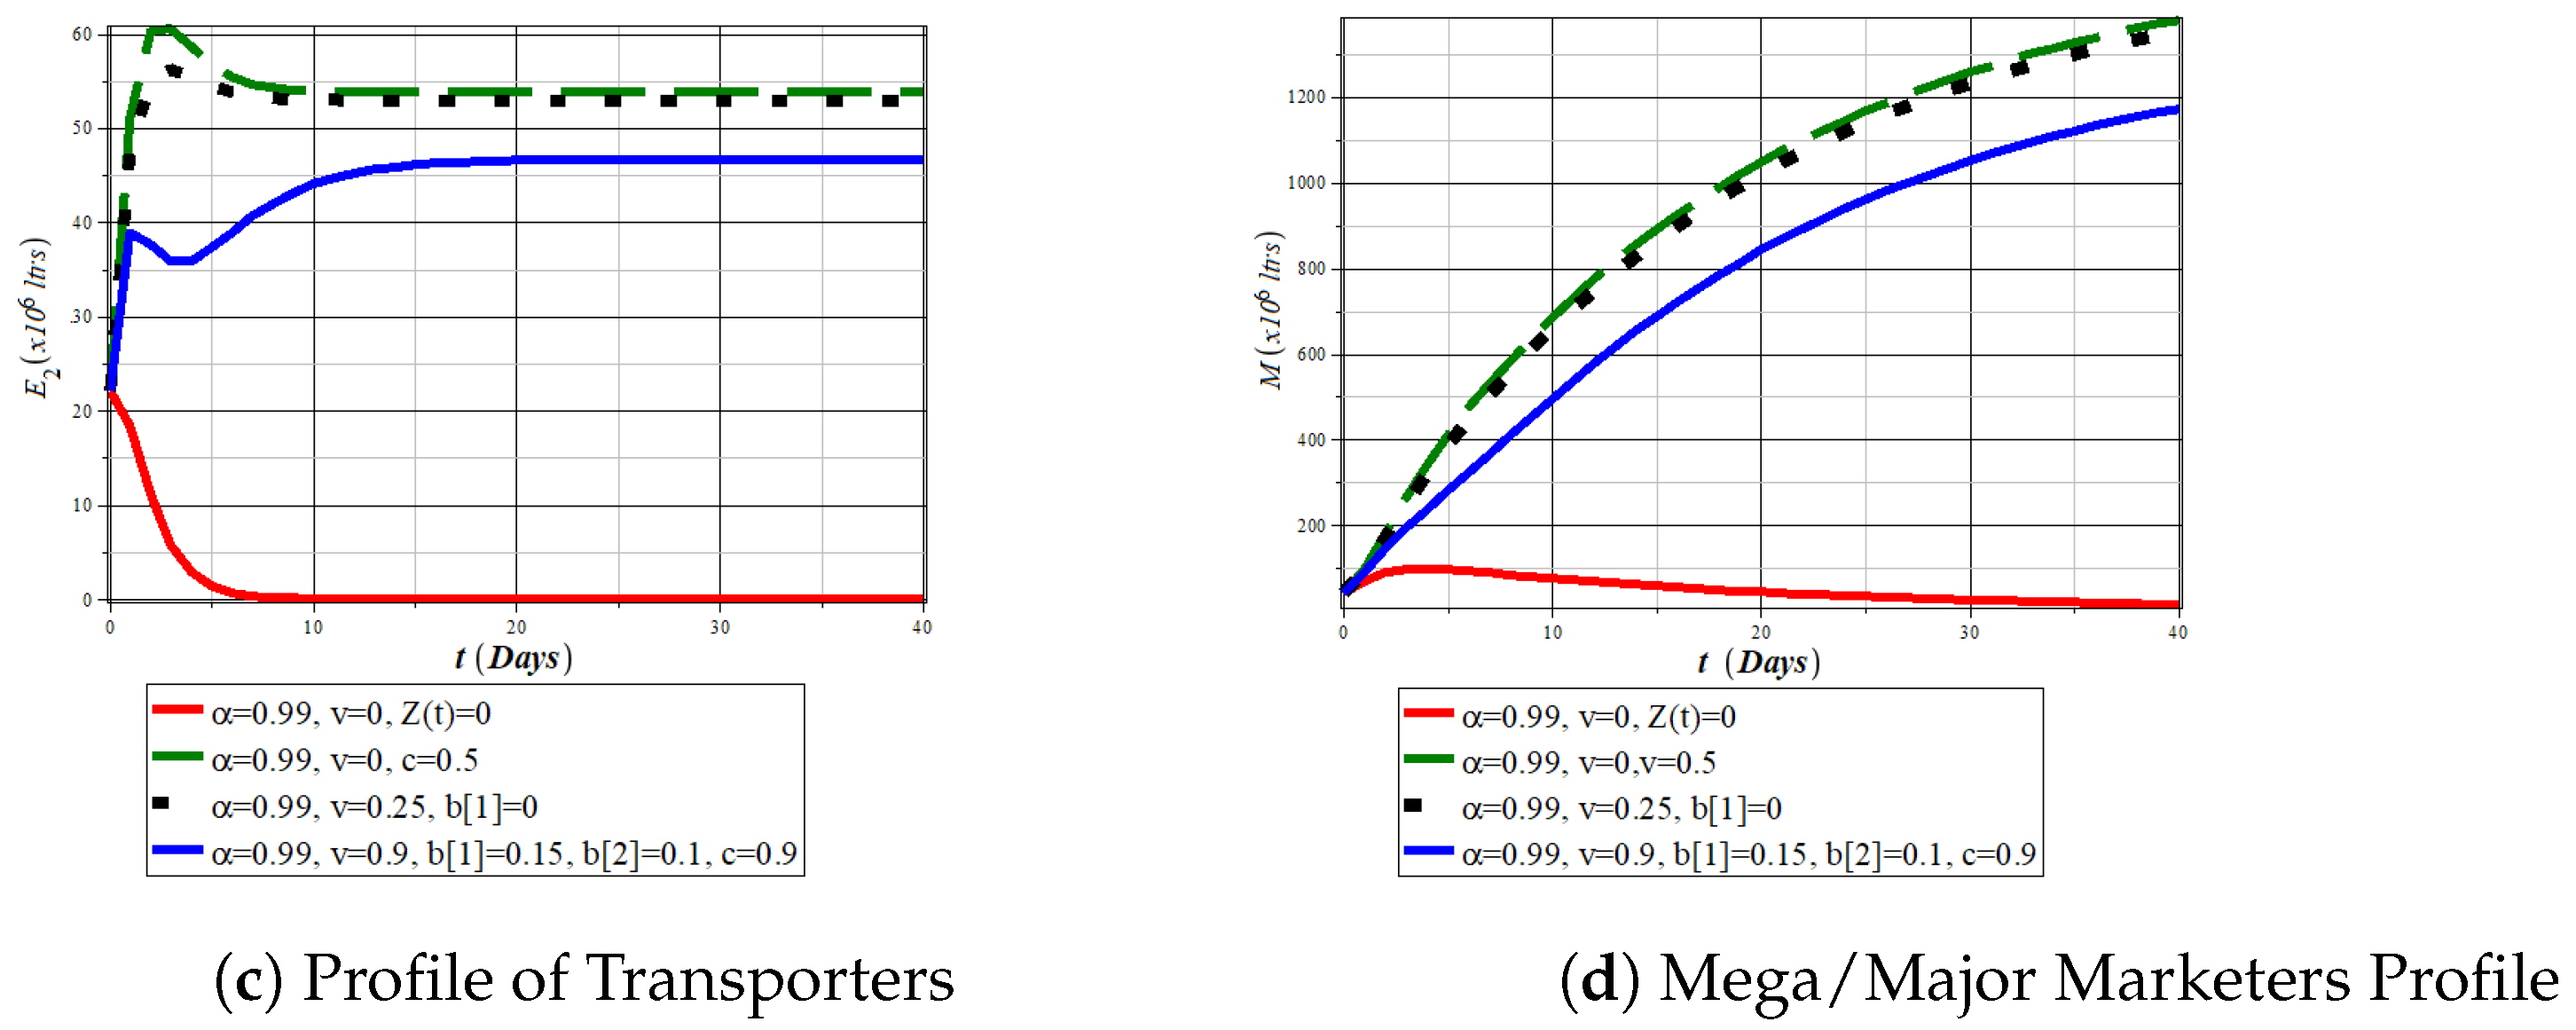
Numerical simulations of the full system (1)–(6) are conducted to examine the combined effects of vandalism, alternative transportation routes, hoarding, diversion, and industrial actions on fuel distribution dynamics. The results are presented in Figure 14 and Figure 15.
Figure 14.
Simulation results under scenarios of vandalism, hoarding, and fuel diversion across compartments and M. The smooth operation scenario (no vandalism, no hoarding or diversion, and ) yields stable distribution, while high vandalism and behavioral distortions induce severe scarcity.
Figure 15.
Impact of industrial actions () and vandalism on retail and consumer compartments. The red trajectories illustrate severe shortages during transporter strikes, whereas continued transporter participation, even under high vandalism, mitigates supply disruptions through alternative routes.
Under extreme vandalism (approximately 90%) and in the absence of alternative transportation routes, pipeline operations originating from the refinery/White Storage depot are effectively halted. As shown by the dashed blue trajectory of in Figure 14, refined products accumulate at the first storage, creating a severe source node bottleneck. This accumulation propagates other downstream, significantly constraining product flow to , , , , and ultimately , thereby precipitating a critical fuel scarcity scenario.
By contrast, under moderate operational conditions or near steady-state behavior (labeled “smooth operation” in Figure 14), the presence of alternative transportation routes () substantially alleviates these disruptions. In this case, the system exhibits reduced sensitivity to pipeline vandalism, and the dominance of the compartment diminishes. This outcome underscores the strategic importance of complementary transport infrastructure, such as rail and marine logistics, in mitigating the vulnerabilities associated with Nigeria’s aging pipeline network. Moreover, improved route diversification enhances distribution efficiency and reduces over-reliance on road transportation, thereby lowering accident risks and operational losses. These findings are consistent with existing studies on resilient fuel logistics systems [67].
Hoarding by Retail Marketers
The simulations further reveal the significant impact of fuel hoarding, particularly by privately owned independent marketers represented by the compartment. As illustrated in Figure 14, hoarding behavior causes fuel to accumulate within , reducing the volume that reaches final consumers (orange trajectory). This behavior exacerbates scarcity at the consumer level and creates incentives for illicit cross-border smuggling, especially in contexts where PMS prices are higher in neighboring countries. The results highlight the necessity for targeted regulatory oversight of independent marketers to ensure equitable distribution and timely release of fuel to consumers.
Although the Department of Petroleum Resources (DPR) is mandated to regulate licensing, safety, and product quality within Nigeria’s downstream sector [68], the model outcomes suggest that stronger enforcement and enhanced transparency mechanisms are required to effectively curb hoarding and associated supply distortions.
Transportation Efficiency and Industrial Actions
Comparative simulations involving vandalism (V), hoarding (), and diversion () indicate that, while these factors negatively affect system performance, their impacts are relatively moderate when transport operations remain functional. In sharp contrast, industrial actions by transporters modeled as generate the most severe disruptions, as illustrated in Figure 15.
During strike scenarios, the red trajectories across retailers and consumers’ compartments in Figure 15 demonstrate pronounced reductions in fuel availability, with the consumer compartment attaining its lowest levels. This result highlights the extreme vulnerability of the downstream supply chain to disruptions within the transportation sector. The comparison between in Figure 14 and Figure 15 further confirms that industrial actions have a more destabilizing effect than vandalism alone.
These findings emphasize the critical role of the transporter class in sustaining downstream fuel availability. Addressing stakeholder grievances within this group, alongside maintaining cooperative industrial relations, is therefore essential for preserving supply chain stability and preventing recurrent fuel crises.
Furthermore, the blue trajectories across the compartments in Figure 15 represent system operation under high vandalism with the availability of alternative transportation routes. Although these routes mitigate the severity of supply disruptions, their performance remains suboptimal when compared with the smooth-operation scenario illustrated in Figure 14. This observation suggests that alternative routing alone may be insufficient to fully stabilize the downstream supply chain. Consequently, future research is warranted to incorporate optimal control techniques to identify cost-effective and resilient distribution strategies capable of ensuring sustained and efficient fuel delivery under adverse conditions.
4. Results Summary, Insights, Limitations, and Future Directions
4.1. Summary of Mathematical Analysis and Key Results
This study develops a novel deterministic compartmental model to investigate fuel distribution dynamics in Nigeria’s downstream petroleum sector, explicitly incorporating pipeline vandalism, industrial actions, diversion, and hoarding as dominant mechanisms driving fuel scarcity. Both analytical and numerical investigations yield several key findings with direct operational and policy relevance.
First, the proposed model was shown to be mathematically well posed. The feasible invariant region was established, and solutions were proven to be positive, bounded, and unique for all admissible initial conditions. These properties ensure that the model remains consistent with the physical, logistical, and operational constraints of real-world fuel distribution systems.
Second, five equilibrium points were identified, each representing a distinct operational regime within the downstream supply chain. These equilibria range from efficient and uninterrupted fuel distribution to severely disrupted states characterized by persistent scarcity. Their existence highlights the structural complexity of the downstream sector and the potential for regime shifts driven by policy, infrastructure, or behavioral changes.
Third, a critical distribution threshold was analytically derived and numerically evaluated. The results indicate that a minimum daily supply of approximately 42 million liters of Premium Motor Spirit (PMS) is required to eliminate persistent queues and satisfy consumer demand under normal operating conditions. This threshold provides a quantitative benchmark for national supply planning, logistics coordination, and regulatory oversight.
Fourth, both local and global stability analyses were conducted using Routh–Hurwitz criteria and the Lyapunov-based techniques respectively. The analysis established that, whenever the effective distribution threshold , the fuel distribution subsystem admits a unique globally asymptotically stable equilibrium. Numerical simulations confirmed that all solution trajectories converge to this equilibrium irrespective of initial fuel stock levels at depots, transporters, or retail outlets. This global stability result implies strong resilience of the downstream system to transient shocks, provided that supply inflow and distribution efficiency remain sufficiently high.
Finally, numerical simulations implemented using a fourth-order Runge–Kutta scheme revealed two critical system-level insights. Hoarding by private retail outlets significantly amplifies fuel scarcity and prolongs recovery time, while industrial actions by transport unions exert a more immediate and severe disruption to fuel availability than pipeline vandalism alone. These findings underscore the disproportionate impact of behavioral and institutional disruptions relative to purely infrastructural failures.
4.2. Insights, Challenges, and Future Research Directions
The proposed modeling framework captures the coupled effects of infrastructure integrity, human behavior, and institutional coordination within a unified mechanistic structure. Beyond its application to Nigeria, the framework is readily adaptable to other oil-producing developing economies experiencing similar downstream vulnerabilities.
The global asymptotic stability results provide an important operational insight: when the distribution threshold exceeds unity, the downstream system self-corrects after perturbations, converging to a stable steady state regardless of initial imbalances. This finding highlights the importance of maintaining adequate supply inflow, minimizing transportation losses, and sustaining operational efficiency. In contrast, when falls below unity, even minor disruptions may trigger persistent scarcity.
Parameter estimation in this study relied primarily on NNPCL FAAC monthly reports, National Bureau of Statistics (NBS) publications, and NMDPRA records. While these sources provide valuable baseline information, future studies should enhance robustness by integrating independent industry datasets, real-time logistics data, and high-frequency consumption records. Improved data triangulation would strengthen empirical calibration and support more reliable forecasting.
A notable contribution of this work is the explicit incorporation of alternative transportation routes, including rail systems, alongside pipeline and road-based tanker distribution. This extension enhances the model’s relevance for regions facing infrastructure degradation and vandalism. However, data limitations prevented a detailed assessment of transportation costs and efficiency trade-offs. Future research should incorporate sensitivity analysis, optimal control, and cost-effectiveness studies to identify optimal fuel distribution strategies under competing risks.
Although the framework accommodates both pre- and post-subsidy regimes, numerical calibration focused primarily on subsidy-era data to establish historical demand thresholds. Future studies should prioritize post-subsidy consumption behaviour, demand elasticity, and adaptive responses by consumers and marketers to provide a more comprehensive assessment of long-term policy impacts.
4.3. Conclusions, Policy Implications, and Recommendations
This study demonstrates that fuel scarcity in Nigeria is not solely a supply problem but a systemic outcome of infrastructure vulnerability, behavioral responses, and institutional coordination failures. The global stability analysis reveals that sustained fuel availability is achievable when effective distribution capacity dominates system losses and disruptions.
Key policy implications emerging from the analysis include the following:
- Investment in diversified transportation infrastructure, particularly rail systems, to reduce dependence on vandalism-prone pipelines and deteriorating road networks.
- Deployment of advanced surveillance, monitoring, and enforcement technologies to curb pipeline vandalism and illegal tapping.
- Strengthening regulatory oversight of private marketers and transport operators to mitigate hoarding, improve transparency, and stabilize downstream supply chains.
With the commencement of operations at the Dangote Refinery and the removal of fuel subsidies, domestic refining capacity is approaching a more stable operational regime. To prevent monopolistic dominance, policy frameworks should promote competitive market participation, enforce transparent pricing mechanisms, and encourage private-sector investment across the value chain.
Regional cooperation also presents a viable pathway for improving energy security. Coordinated refining, storage, and cross-border transportation initiatives within frameworks such as ECOWAS could reduce smuggling, enhance supply efficiency, and stabilize regional markets.
Model Limitations and Future Extensions
The accuracy of parameter estimates in this study is constrained by data availability and reporting inconsistencies. Global oil price dynamics, international supply shocks, and exchange rate effects were not explicitly incorporated. Moreover, the framework is deterministic and does not capture stochastic disturbances or random shocks. Future extensions should integrate stochastic modeling, price dynamics, uncertainty quantification, and real-time data assimilation to enhance realism, predictive capability, and policy relevance.
Author Contributions
Conceptualization, K.B.A.; Methodology, A.A.I., K.B.A. and S.T.A.; Software, K.B.A.; Validation, A.A.I., K.B.A., S.T.A., K.C.M. and K.O.; Formal analysis, A.A.I., K.B.A. and S.T.A.; Investigation, A.A.I., K.B.A., S.T.A., A.A.A., K.C.M. and K.O.; Resources, K.B.A., A.A.A. and K.O.; Data curation, A.A.I. and K.B.A.; Writing—original draft, A.A.I., K.B.A., S.T.A., A.A.A., K.C.M. and K.O.; Writing—review and editing, A.A.I., K.B.A., S.T.A., A.A.A., K.C.M. and K.O.; Visualization, K.B.A.; Supervision, K.B.A. and K.C.M.; Project administration, K.B.A. and K.C.M.; APC Funding acquisition, A.A.A. and K.O. All authors have read and agreed to the published version of the manuscript.
Funding
This research received no external funding.
Data Availability Statement
The values used for simulation in this study were estimated or sourced from publicly available reports, including the NNPC Monthly FAAC Report, NNPC Annual Statistical Report, and Truck-Stock Report. All data sources are properly cited, with links in the reference list.
Acknowledgments
A special thanks to Muftaudeen Taoheed of Baze University, Abuja, for reviewing the initial draft of this manuscript. Furthermore, we deeply appreciate the editorial team and peer reviewers for their insightful feedback and constructive critiques, which have significantly enhanced the quality of this work.
Conflicts of Interest
The authors declare that there are no conflicts of interest associated with this manuscript, and this work has neither been published previously nor is it under consideration for publication elsewhere.
References
- Who Are We: Our History. NNPC New Websitefrom. Available online: https://nnpcgroup.com/who-we-are (accessed on 18 July 2022).
- Abayomi, A.; Adam, S.; Alumbugu, A.I. Oil Exportation and Economic Growth in Nigeria. Dev. Ctry. Stud. 2015, 5, 83–92. [Google Scholar]
- Kate, N.E.; Obiageli, O.L.; Uzochukwu, O.C.; Onyilofor, T.U. Fuel Scarcity and Business Growth in Nigeria from 2005 to 2015. Eur. J. Bus. Econ. Account. 2016, 4, 9–31. [Google Scholar]
- Odularu, G.O. Crude Oil and the Nigerian Economic Performance. Oil Gas Bus. 2008, 2007, 1–29. [Google Scholar]
- Steyn, P. Oil Exploration in Colonial Nigeria, C.1903–1958. J. Imp. Commonw. Hist. 2009, 37, 249–274. [Google Scholar]
- OPEC. OPEC: Nigeria and OPEC: 50 Years Together; OPEC: Vienna, Austria, 2021; Volume 20, p. 2. [Google Scholar]
- Nwankwo, G.O. Nigeria and OPEC: To Be or Not to Be. Cbn Econ. Financ. Rev. 1982, 20, 6–13. [Google Scholar]
- Onwe, O.J. Economic Implications of Petroleum Policies in Nigeria: An Overview. Am. Int. J. Contemp. Res. 2012, 2, 60–71. [Google Scholar]
- Industry History. NNPC Old Website. Available online: https://nnpcgroup.com/NNPC-Business/Business-Information/Pages/Industry-History.aspx (accessed on 18 July 2022).
- NBS. Foreign Trade in Goods Statistics: Q1 2021 (Issue March). 2021. Available online: https://www.nigerianstat.gov.ng/pdfuploads/FOREIGN%20TRADE%20STATISTICS%%20%E2%80%93%20Q1%202021.pdf (accessed on 21 June 2022).
- OPEC. 2023 OPEC Annual Statistical Bulletin, 58th ed.; OPEC: Vienna, Austria, 2023. [Google Scholar]
- Ambituuni, A.; Amezaga, J.; Emeseh, E. Analysis of safety and environmental regulations for downstream petroleum industry operations in Nigeria: Problems and prospects. Environ. Dev. 2014, 9, 43–60. [Google Scholar] [CrossRef] [Scilit]
- BPE. Pipelines and Products Marketing Company Limited (PPMC). Bureau of Public Enterprises BPE News. 2022. Available online: https://bpe.gov.ng/pipelines-and-products-marketing-company-limited-ppmc/ (accessed on 20 April 2022).
- Ibrahim, M.O.; Akinyemi, S.T.; Dago, M.M.; Bakare, G.N.; Olawale, K.B.; Yayock, E.S. Mathematical Modelling of a Staged Progression HIV/AIDS Model with Control Measures. J. Niger. Assoc. Math. 2015, XXIX, 151–162. [Google Scholar]
- National Bureau of Statistics (NBS). Petroleum Products Distribution Statistics—Full Year 2023. 2024. Available online: https://nigerianstat.gov.ng/pdfuploads/Petroleum_Statistics_Repor_2023.%pdf (accessed on 12 January 2025).
- Olawale, K.B.; Yayock, E.S. Persistent fuel scarcity, price increases, and way forward in Nigeria. Int. J. Res. Innov. Appl. Sci. 2023, VIII, 72–79. [Google Scholar] [CrossRef] [Scilit]
- OEC. Refined Petroleum in Nigeria: OEC—The Observatory of Economic Complexity. In OEC Profile Summary; OEC: Fairlawn, OH, USA, 2022. [Google Scholar]
- Onyeizugbe, C.; Onwuka, E. Fuel Subsidy Removal as an Imperative for Enhancing Business Development in Nigeria. Vsrd Int. J. Bus. Manag. Res. 2012, 2, 454–461. [Google Scholar]
- Seddighi, A.H.; Naimi-Sadigh, A. A Mathematical Model for Fuel Pricing Considering Supply Chain Network Design Decisions. Energy Eng. Manag. 2023, 8, 58–69. [Google Scholar] [CrossRef] [Scilit]
- Simon, S.E. Nigeria’s subsidised petrol rated 8th cheapest globally. DailyTrustrust, 2022. Available online: https://dailytrust.com/nigerias-subsidised-petrol-rated-8th-cheapest-globally (accessed on 2 June 2022).
- Ugbodoga, M. Nnpc: We Spent n49.69bn on Pipeline Repairs in 10 Months. 2021. Available online: https://www.thecable.ng/nnpc-spent-n49-69bn-on-pipeline-repairs-10-mont%hs (accessed on 21 December 2021).
- Petroleum Industry Act. PIA 2021 Annual Report; Petroleum Industry Act Authority, Nigerian Government: Lagos, Nigeria, 2021. [Google Scholar]
- Olujobi, O.J. Deregulation of the downstream petroleum industry: An overview of the legal quandaries and proposal for improvement in Nigeria. Heliyon 2021, 7, e06848. [Google Scholar] [CrossRef] [Scilit]
- NMDPRA. Nigerian Midstream & Downstream Petroleum Regulatory Authority (Nmdpra) Petroleum Products Stock & Days Sufficiency Reports, (January 2023–June 2023). Available online: https://www.nmdpra.gov.ng/DailyTruckout (accessed on 3 July 2023).
- Dangote Industries Limited. Dangote Petroleum Refinery Starts Production. 2023. Available online: https://www.dangote.com/dangote-petroleum-refinery-starts-production/ (accessed on 14 July 2025).
- Acosta-Amado, R.J. Optimization of petroleum products distribution via pipeline systems: Modeling and computational challenges. Heliyon 2024, 10, e33947. [Google Scholar] [CrossRef] [Scilit]
- Androutsopoulos, K.N.; Zografos, K.G. Modeling and solving the fuel distribution problem with unloading precedence and loading sequence considerations. Ann. Oper. Res. 2024, 332, 909–947. [Google Scholar] [CrossRef] [Scilit]
- Djuric, S.; Nogo, S.; Varupa, E.; Kuzmic, G. Mathematical Model of Gasification of Solid Fuel. Symmetry 2024, 16, 1040. [Google Scholar] [CrossRef] [Scilit]
- Donmuen, M.; Pitiruek, K. The mathematical models as a decision support tool for the oil transportation business: A case study of an oil business in Thailand. Cogent Eng. 2022, 9, 2145680. [Google Scholar] [CrossRef] [Scilit]
- Fulop, M.T.; Guban, M.; Kovacs, G.; Avornicului, M. Economic Development Based on a Mathematical Model: An Optimal Solution Method for the Fuel Supply of International Road Transport Activity. Energies 2021, 14, 2963. [Google Scholar] [CrossRef] [Scilit]
- Hareli, S.; Nave, O.; Gol’dshtein, V. Impact of a polydispersed fuel distribution on the ignition characteristic. Sci. Rep. 2024, 14, 18304. [Google Scholar] [CrossRef] [Scilit]
- Hatami-Marbini, A.; Asu, J.O.; Hafeez, K.; Khoshnevis, P. DEA-driven risk management framework for oil supply chains. Socio-Econ. Plan. Sci. 2024, 95, 101996. [Google Scholar] [CrossRef] [Scilit]
- Kubek, D.; Więcek, P. Hybrid Demand Forecasting in Fuel Supply Chains: ARIMA with Non-Homogeneous Markov Chains and Feature-Conditioned Evaluation. Energies 2025, 18, 6044. [Google Scholar] [CrossRef] [Scilit]
- Qiu, R.; Zhang, B.; Zhao, W.; Tu, R.F.; He, M.Q.; Liao, Q.; Liang, Y.T. An integrated MINLP model for multi-party coordination in downstream oil supply chain. Pet. Sci. 2024, 21, 2066–2079. [Google Scholar] [CrossRef] [Scilit]
- Zhao, Z.; Zhou, Y.; Guan, J.; Yan, Y.; Zhao, J.; Peng, Z.; Chen, F.; Zhao, Y.; Shao, F. The relationship between compartment models and their stochastic counterparts: A comparative study with examples of the COVID-19 epidemic modelling. J. Biomed. Res. 2024, 38, 175–188. [Google Scholar] [CrossRef] [Scilit]
- Ayaga, D. Optimizing Channel Structure for Effective Distribution of Petroleum Products in Nigeria. Br. J. Mark. Stud. 2019, 7, 26–36. [Google Scholar]
- Macal, C.M.; North, M.J. Tutorial on agent-based modeling and simulation. J. Simul. 2010, 23, 14. [Google Scholar]
- AlMajed, A.M.; Syed, M.N.; Malik, A.I. Multi-Objective Mathematical Model for Crude Oil Terminal Scheduling with Tank Farm Operations. Mathematics 2025, 13, 3817. [Google Scholar] [CrossRef] [Scilit]
- Gatto, A.; Accarino, G.; Aloisi, V.; Immorlano, F.; Donato, F.; Aloisio, G. Limits of Compartmental Models and New Opportunities for Machine Learning: A Case Study to Forecast the Second Wave of COVID-19 Hospitalizations in Lombardy, Italy. Informatics 2021, 8, 57. [Google Scholar] [CrossRef] [Scilit]
- Zabczyk, J. Mathematical Control Theory. In Mathematical Control Theory; Springer: Berlin/Heidelberg, Germany, 2020. [Google Scholar]
- Hastie, T.; Tibshirani, R.; Friedman, J. The Elements of Statistical Learning: Data Mining, Inference, and Prediction; Springer: Berlin/Heidelberg, Germany, 2009. [Google Scholar]
- Singh, H.; Kumar, D.; Baleanu, D. Methods of Mathematical Modelling: Fractional Differential Equations; CRC Press: Boca Raton, FL, USA, 2019. [Google Scholar]
- Zieyel, E.R. Operations Research: Applications and Algorithms; Technometrics, Taylor and Francis, Thomson Learning, Inc.: Boston, MA, USA, 2020. [Google Scholar] [CrossRef] [Scilit]
- NNPC/Independent Marketers Depot Facilities. DAPPMA-Storage Facilities; NNPC: Abuja, Nigeria, 2022. [Google Scholar]
- Tata, H.; Ariyo, T.O.; Omogunloye, O.G. Mapping and Spatial Distribution of Petroleum Products by Marketers in Nigeria. In Proceedings of the Joint International Conference (JIC) on 21st Century Human Habitat: Issues, Sustainability, and Development, Abuja, Nigeria, 21–24 March 2016; pp. 1037–1044. [Google Scholar]
- NNPC-FAAC. NNPC JAN 2021 Crude Oil and Gas Sales and Proceeds Received in February 2021. In NNPC—Federation Account Allocation Committee (FAAC) Report; NNPC: Abuja, Nigeria, 2021. [Google Scholar]
- NNPC-FAAC. NNPC February—March 2021 Crude Oil and Gas Sales and Proceeds Received in April 2021. In NNPC—Federation Account Allocation Committee (FAAC) Report; NNPC: Abuja, Nigeria, 2021. [Google Scholar]
- NNPC-FAAC. NNPC April 2021 Crude Oil and Gas Sales and Proceeds Received in May 2021. In NNPC—Federation Account Allocation Committee (FAAC) Report; NNPC: Abuja, Nigeria, 2021. [Google Scholar]
- NNPC-FAAC. NNPC May 2021 Crude Oil and Gas Sales and Proceeds Received in June 2021. In NNPC—Federation Account Allocation Committee (FAAC) Report; NNPC: Abuja, Nigeria, 2021. [Google Scholar]
- NNPC-FAAC. NNPC June–July 2021 Crude Oil and Gas Sales and Proceeds Received in August 2021. In NNPC—Federation Account Allocation Committee (FAAC) Report; NNPC: Abuja, Nigeria, 2021. [Google Scholar]
- NNPC-FAAC. NNPC August 2021 Crude Oil and Gas Sales and Proceeds Received in September 2021. In NNPC—Federation Account Allocation Committee (FAAC) Report; NNPC: Abuja, Nigeria, 2021. [Google Scholar]
- NNPC-FAAC. NNPC September 2021 Crude Oil and Gas Sales and Proceeds Received in October 2021. In NNPC—Federation Account Allocation Committee (FAAC) Report; NNPC: Abuja, Nigeria, 2021. [Google Scholar]
- NNPC-FAAC. NNPC November 2021 Crude Oil and Gas Sales and Proceeds Received in December 2021. In NNPC—Federation Account Allocation Committee (FAAC) Report; NNPC: Abuja, Nigeria, 2021. [Google Scholar]
- NNPC-FAAC. NNPC October 2021 Crude Oil and Gas Sales and Proceeds Received in November 2021. In NNPC—Federation Account Allocation Committee (FAAC) Report; NNPC: Abuja, Nigeria, 2021. [Google Scholar]
- Izuaka, M. Fuel Scarcity: NUPENG Threatens Nationwide Strike. Premium Times Nigeria. Premium Times News 2021. Available online: https://www.premiumtimesng.com/news/top-news/495670-fuel-scarcity-nupeng-threatens-nationwide-strike.html (accessed on 20 April 2022).
- Akinpelu, Y. ANALYSIS: Nigeria Spends Billions on Pipeline Maintenance as Hundreds are Vandalized Annually. Premium Times News 2021. Available online: https://www.premiumtimesng.com/news/headlines/454439-analysis-nigeria-spends-billions-on-pipeline-maintenance-as-hundreds-are-vandalised-annually.html (accessed on 24 November 2021).
- NNPC-ASB. 2019 Annual Statistical Bulletin, 1st ed.; Nigeria Bureau of Statistics—NBS: Abuja, Nigeria, 2019. [Google Scholar]
- NNPC-ASB. 2020 Annual Statistical Bulletin; NNPC ASB: Abuja, Nigeria, 2020. [Google Scholar]
- NNPC-FAAC. NNPC June 2021 Crude Oil and Gas Sales and Proceeds Received in July 2021. In NNPC—Federation Account Allocation Committee (FAAC) Report; NNPC: Abuja, Nigeria, 2021. [Google Scholar]
- Zhien, M.; Jia, L. Dynamical Modeling and Analysis of Epidemics; World Scientific Publishing Co.: Singapore, 2009. [Google Scholar]
- Brauer, F.; Castillo-Chavez, C. Mathematical Models in Population Biology and Epidemiology, 1st ed.; Springer: Berlin/Heidelberg, Germany, 2001. [Google Scholar] [CrossRef] [Scilit]
- Brauer, F.; Castillo-Chavez, C. Mathematical Models in Population Biology and Epidemiology, 2nd ed.; Springer: Berlin/Heidelberg, Germany, 2012. [Google Scholar] [CrossRef] [Scilit]
- Akande, K.B.; Makinde, J.; Ibrahim, M.O. Dynamics of Terrorism in Contemporary Society for Effective Management. Int. J. Math. Math. Sci. 2022, 2022, 9056841. [Google Scholar] [CrossRef] [Scilit]
- Castillo-Chavez, C.; Song, B. 7 Models for the Transmission Dynamics of Fanatic Behaviors. In Frontiers in Applied Mathematics; SIAM: Philadelphia, PA, USA, 2003. [Google Scholar] [CrossRef] [Scilit]
- Diekmann, O.; Heesterbeek, J. Mathematical Epidemiology of Infectious Diseases: Model Building, Analysis, and Interpretation; John Wiley & Sons: Hoboken, NJ, USA, 2000. [Google Scholar]
- Morgan, R. Linearization and Stability Analysis of Nonlinear Problems. Rose-Hulman Undergrad. Math. J. 2015, 16, 5. [Google Scholar]
- Josiah, O. Ondo mourns victims of deadly oil tanker explosion. Primium Times Niger. 2023, 7, 26. [Google Scholar]
- DPR Facilitates Licensing of Downstream Operations with Digital Platform. DPR Responsibility. Available online: https://www.nuprc.gov.ng/dpr-facilitates-licensing-of-downstream-operat%ions-with-digital-platform/#:~:text=He%20explained:%20%E2%80%9CAmong%20the%20e%xpected,the%20oil%20and%20gas%20industry.%E2%80%9D (accessed on 25 June 2022).

Disclaimer/Publisher’s Note: The statements, opinions and data contained in all publications are solely those of the individual author(s) and contributor(s) and not of MDPI and/or the editor(s). MDPI and/or the editor(s) disclaim responsibility for any injury to people or property resulting from any ideas, methods, instructions or products referred to in the content. |
© 2026 by the authors. Licensee MDPI, Basel, Switzerland. This article is an open access article distributed under the terms and conditions of the Creative Commons Attribution (CC BY) license.