


Abstract
Artificial intelligence (AI) has emerged as a transformative analytical paradigm for modelling cancer progression using medical imaging and complementary clinical data. This systematic review collates and analyses AI-powered systems and techniques for cancer progression risk analytics and prediction. It provides an empirical examination of algorithmic approaches, imaging-derived feature domains, and clinical metrics that underpin progression prediction. Following the PRISMA 2020 reporting guidance, empirical English-language studies published between 2020 and the final search cutoff date of 15 May 2026 were identified from PubMed, EBSCOhost, Google Scholar and Web of Science. Forty (40) eligible studies spanning diverse cancer types were included, appraised using the MMAT and synthesised narratively. The evidence shows that both classical machine learning models and deep learning architectures are widely used to extract predictive information from radiological data. Radiomic descriptors of intratumoural heterogeneity, tumour morphology, functional imaging biomarkers and multiscale transform-based features consistently demonstrate strong associations with disease progression. Imaging-derived features were linked to clinically meaningful progression endpoints, including progression-free survival, disease-free survival, recurrence and metastasis, while clinical and molecular covariates supported risk stratification. This study further develops the AI-driven cancer progression risk analytics framework (AI CanPRAF), which integrates AI taxonomies, imaging phenotypes, clinical context, progression analytics and decision support into one clinically oriented model. The results demonstrate the growing role of multimodal AI systems in the development of clinically grounded cancer progression analytics and prediction solutions.
1. Introduction
Cancer remains a major global health burden that directly affects patient survival after diagnosis. According to the World Health Organisation (WHO), cancer accounted for an estimated 9.6 million deaths in 2018, approximately 10 million deaths globally in 2020, or nearly one in six deaths [1]. In 2022, 20 million new cancers were diagnosed and 9.7 million deaths were attributed to cancer [2,3]. Furthermore, it is projected that by 2050, there will be over 35 million new cases of cancer diagnosed worldwide, representing a 77% increase over the estimated number of cases diagnosed in 2022. Many people die from cancer not only because of the primary tumour but also because the cancer continues to progress, either through local recurrence, distant metastasis, or developing resistance to treatment [4].
In clinical oncology, cancer progression commonly refers to the transition from localised disease to recurrence, metastasis, treatment resistance or cancer-related mortality after initial therapy [5]. However, clinicians continue to face a “prognostic paradox”, whereby patients with identical clinical stages may follow markedly different survival trajectories [6]. This variability underscores the urgent need for more granular risk analytics and predictive models that can capture heterogeneity in progression. Accurate identification and prediction of cancer progression are, therefore, central to reducing avoidable mortality and advancing precision oncology.
Conventionally, monitoring cancer progression has been based on the interpretation of radiology, histopathologic examination and clinical staging systems such as the tumour–node–metastasis (TNM) classification [7]. Imaging modalities, such as computed tomography (CT), magnetic resonance imaging (MRI) and positron emission tomography (PET), remain central for assessing tumour growth, structural change and response to treatment. Nonetheless, these methods have important limitations. Radiological interpretation is often subjective, and inter-observer variation may contribute to the overlooking of sub-visual textural alterations that reflect early progression [8,9]. In addition, the molecular and spatial heterogeneity of tumours creates imaging phenotypes that cannot be interpreted manually [10,11]. Traditional anatomical staging also has limited capacity to capture the dynamic heterogeneity of the tumour microenvironment [12]. Standard statistical approaches, including Cox proportional hazards models, may also be limited in capturing complex non-linear interactions between genomic biomarkers, radiographic features and progression outcomes [13]. Such limitations can delay intervention and heighten the risk of both over-treatment and under-treatment.
Recent developments in machine learning (ML) and deep learning (DL) are changing how cancer progression is characterised and predicted. ML algorithms can examine thousands of quantitative imaging features simultaneously, revealing sub-visual patterns and transforming imaging data into high-dimensional radiomic signatures of tumour morphology, texture and function [14,15]. These imaging-derived tumour characteristics can be combined with clinical and molecular variables to produce predictive models of progression risk or survival. Modern DL platforms allow the combination of various data streams such as imaging, pathology and circulating biomarkers to produce composite risk scores [16,17]. The resultant AI-driven systems offer objective and reproducible stratification of patients and facilitate proactive disease management by detecting high-risk disease signatures long before they become clinically apparent.
Recent scholarship has increasingly highlighted the value of AI and radiomics in oncological imaging, with previous reviews demonstrating that high-dimensional imaging features can capture tumour heterogeneity and support outcome prediction [18,19,20]. Advances in sampling techniques, feature selection methods and multi-omics integration have enabled AI-based modelling to generate radiomics signatures with improved prognostic performance [19,20,21]. Existing reviews and meta-analyses offer strong support for AI as a diagnostic tool, citing strong AI performance in tumour detection, classification and prognostic evaluation across all forms of imaging [22,23,24]. Additionally, review studies have examined the use of AI for staging, grading and predicting therapy response in head and neck, liver, oral, gastric, pancreatic and rare tumours [25,26,27,28,29,30,31,32]. Another systematic review specifically examined radiomics and AI in stereotactic body radiotherapy and stereotactic radiosurgery, focusing on the prediction of patient outcomes and treatment-related toxicity across heterogeneous tumour sites [33].
Nonetheless, important gaps remain in the existing review literature. Many prior reviews focus mainly on diagnostic accuracy, tumour detection, segmentation or treatment response, while cancer is often treated as a relatively static condition rather than a dynamic process of progression. Existing syntheses also tend to remain siloed within specific tumour types, imaging modalities or computational techniques, thereby limiting our understanding of how AI-driven imaging can support progression-centred risk analytics across oncology contexts. This gap underscores the need for a systematic review that examines how AI systems operationalise, model and predict cancer progression by integrating imaging-derived features, clinical covariates and progression-related endpoints.
The present review addresses this gap by systematically collating and synthesising empirical evidence on AI taxonomies, imaging-derived feature domains and clinical metrics that underpin cancer progression prediction. This review was guided by the following research questions:
- What taxonomies of AI approaches are most commonly employed for predicting cancer progression?
- Which imaging-derived feature domains contribute most significantly to cancer progression prediction performance?
- What clinical and quantitative metrics underpin the characterisation of cancer progression within AI-driven imaging systems?
- How can an integrative framework explain the pathway from AI-driven cancer progression analytics to clinically meaningful risk prediction and decision support?
Technical Contributions
- This study develops the AI-driven cancer progression risk analytics framework, which integrates AI taxonomies, imaging-derived progression signatures, clinical covariates, progression endpoints and decision support pathways into one clinically oriented model for cancer progression prediction.
- This study presents a systematic taxonomy of available AI systems and techniques used for cancer progression analytics and prediction, including classical machine learning approaches, deep learning architectures, hybrid fusion techniques, survival-aware learning systems, and explainable AI methodologies.
- This study identifies feature domains based on core imaging derivatives that consistently drive progression prediction performance, including intratumoural heterogeneity signatures, morphological tumour biomarkers, functional imaging metrics and transform-based latent representations.
- This study offers a wide-ranging collation and synthesis of the empirical evidence pertaining to cancer progression risk analytics and prediction using AI-driven systems, including algorithmic taxonomies, imaging-derived feature domains and clinically informed progression measures.
- This study systematically identifies the clinical and quantitative metrics used to operationalise cancer progression within AI-driven imaging systems, distinguishing between primary clinical endpoints and derived analytical metrics.
2. Materials and Methods
This study employed a structured systematic review methodology to synthesise empirical evidence on AI-driven cancer progression prediction using medical imaging and clinical data. The review process was designed to ensure methodological transparency, rigour and reproducibility. The methodological framework was informed by established systematic review guidelines, including the Preferred Reporting Items for Systematic Reviews and Meta-Analyses (PRISMA) 2020 reporting guidance for study identification and selection [34,35], alongside methodological guidance for evidence synthesis and narrative integration [36,37]. The procedure comprised sequential stages, including formulation of research questions, systematic literature searching, eligibility screening, quality appraisal, structured data extraction and narrative synthesis of findings across the included studies. The completed PRISMA Abstract Checklist is provided in Appendix A.1, and the PRISMA 2020 checklist is provided in Appendix A.2.
2.1. Research Question Definition
The research question guiding this review was developed using the Population–Phenomenon of Interest–Context (PICo) framework to ensure conceptual clarity and methodological transparency. Within this framework, the population comprises human cancer patients. The phenomenon of interest was AI-driven cancer progression risk analytics and prediction. The context was clinical oncology, where medical imaging and associated clinical data are used for disease monitoring, prognostic assessment and treatment planning. Guided by these elements, we asked the following: how are AI-driven systems applied to analyse medical imaging and clinical data to predict cancer progression risk among human cancer patients within contemporary clinical oncology settings?
2.2. Literature Search Approach
A systematic literature search was conducted to identify empirical studies that apply AI-based methods to predict cancer progression using medical imaging and/or associated clinical data. The search covered the interdisciplinary literature in oncology, radiology, biomedical informatics and ML. Searches were conducted in PubMed, EBSCOhost, Google Scholar and Web of Science because these databases cover the literature in clinical medicine, imaging sciences and computational research. The systematic literature search was conducted from 1 May 2026 to 15 May 2026, with 15 May 2026 serving as the final search cutoff date. The review was conducted in 2026. Therefore, studies published in 2026 were included only if they had already been published or indexed in the searched databases on or before 15 May 2026.
Database searches used combinations of controlled vocabulary and free-text terms tailored to each database’s search functions. The core Boolean search string was as follows: (“cancer progression” OR recurrence OR metastasis OR “progression-free survival” OR “disease-free survival” OR survival OR prognosis) AND (“artificial intelligence” OR “machine learning” OR “deep learning” OR “neural network” OR radiomics OR “medical imaging” OR “computed tomography” OR CT OR “magnetic resonance imaging” OR MRI OR PET OR “digital pathology”). Reference-list screening and citation tracking were also used to identify additional relevant studies not retrieved through database searches.
2.3. Study Eligibility and Selection Procedure
Studies were selected after a multi-stage systematic screening process that aimed to ensure conceptual relevance and methodological quality. The procedure was carried out based on the Preferred Reporting Items for Systematic Reviews and Meta-Analyses (PRISMA) 2020 guidelines [35], which offer universally recognised principles for reporting systematic reviews. First, titles and abstracts obtained through the database searches were screened to exclude records that were clearly irrelevant. Publications focusing solely on cancer detection and segmentation algorithms, diagnostic classification tasks and treatment planning without disease progression outcomes were not included in this phase. Subsequently, potentially relevant studies were evaluated manually to determine whether they met the predefined inclusion criteria. Articles were included when they investigated cancer progression prediction using AI systems or techniques applied to medical imaging or clinical data and reported measurable clinical or predictive outcomes.
Records retrieved from the database searches were first screened by title and abstract against the predefined eligibility criteria. Full texts were then assessed for studies that appeared potentially relevant. Screening was conducted independently by the two authors, and disagreements were resolved through discussion until consensus was reached. Where eligibility remained unclear, the full article was reviewed against the inclusion and exclusion criteria before a final decision was made.
The eligibility criteria guiding study inclusion and exclusion are summarised in Table 1.
Table 1.
Eligibility criteria for study inclusion and exclusion.
The screening process resulted in a final set of 40 empirical studies, which formed the evidence base for further analysis. In Section 3 (Figure 1), the PRISMA study selection flow diagram presents the selection process.
Figure 1.
PRISMA study identification and selection flow diagram.
2.4. Quality Assessment
To assess methodological rigour of the included studies, the Mixed Methods Appraisal Tool (MMAT), version 2018, was used [38]. The MMAT is extensively used in systematic reviews that synthesise heterogeneous empirical designs, providing a consistent framework for appraising qualitative, quantitative, and mixed-methods research. All studies were initially filtered to ensure they answered a well-defined research question and used data capable of addressing it. The MMAT criteria were then used to assess specific aspects such as the sampling strategy, validity of measurements and data analysis steps, as well as the clarity between the aims of research and presented results.
The MMAT guidelines require studies to be assessed using categorical responses of “Yes”, “No” or “Can’t tell” rather than numerical scoring. This approach was used to preserve transparency by identifying methodological strengths and limitations within individual studies instead of generating aggregate quality scores. Quality appraisal was conducted independently by the two authors, and any differences in judgement were resolved through discussion. The appraisal considered whether each study had a clearly defined research question, appropriate data sources, relevant sampling or cohort selection, valid measurement of outcomes and predictors, and an appropriate analytical strategy. The MMAT results were not used as exclusion thresholds. Instead, they informed the interpretation of the narrative synthesis by giving greater interpretive weight to studies with stronger methodological transparency, appropriate validation procedures, clear reporting of model performance and clinically relevant outcome measures. The quality appraisal results are summarised in Appendix B.
2.5. Data Extraction
Data from the included studies were extracted using a structured data extraction matrix designed to capture the methodological, clinical and computational features of each study. The extraction process followed established guidance for systematic evidence synthesis in interdisciplinary research [36]. Data extraction was conducted independently by the two authors and cross-checked for accuracy. Any discrepancies were resolved through discussion and rechecking of the original article. Extracted information included author(s), year of publication, study design, country or study location, participant or dataset characteristics, cancer type, imaging modality, AI techniques, clinical outcomes, progression-related endpoints, model performance metrics, main findings, strengths and reported limitations. Where multiple model outputs were reported, priority was given to clinically relevant progression outcomes, externally validated results and interpretable performance metrics, such as AUC, C-index, hazard ratios, calibration and decision curve analysis, where available. This structured extraction process enabled comparison across studies and supported the identification of methodological and technological patterns in AI-driven cancer progression prediction.
2.6. Data Synthesis
This study employed narrative synthesis, as the method offers flexibility in integrating research findings that vary by design, imaging modality, and computational modelling approach. The synthesis process required multiple analytical stages that began with data familiarisation and continued through comparative analysis of the studies, culminating in the identification of repeating patterns across methods and technologies. The extracted data were coded and organised around thematic codes, which facilitated the organisation of the results around themes emerging from the review questions. These thematic codes were finally integrated into the principal thematic domains, which represented the dominant analytical dimensions identified in the literature: (1) AI taxonomies used for cancer progression prediction, (2) imaging-based feature domains associated with cancer progression risk, (3) clinical and quantitative measures of cancer progression and (4) an integrative framework that explains the pathway from AI-driven cancer progression analytics to clinically meaningful risk prediction and decision support. This process facilitated the integration of results from all 40 research studies, ensuring analytical transparency and reproducibility in their presentation. A summary of the included articles is presented in Appendix C.
3. Results
3.1. PRISMA Flow Diagram: Study Identification and Selection
The PRISMA flow diagram in Figure 1 presents the systematic process of identifying, screening and selecting eligible studies. The database search yielded 3214 records from the selected databases. After removing 242 duplicate records, 2972 records remained for title and abstract screening. Of these, 2634 records were excluded because they did not meet the inclusion criteria. A total of 338 full-text reports were assessed for eligibility, of which 298 were excluded after full-text review. The exclusions were based on reasons, such as lack of progression-related outcomes, absence of AI-based imaging or clinical prediction models, diagnosis- or segmentation-only focus, non-empirical design, non-human data, inaccessible full text or duplication. After applying the predefined eligibility criteria, 40 empirical studies were included in the final synthesis and analysis.
3.2. Journal Article Quartile Distribution
This review included 40 articles, of which 24 articles (60%) were published in first-quartile journals and 16 articles (40%) were published in second-quartile journals according to SCImago Journal Rank quartile classifications, as shown in Figure 2. This distribution indicates that the included articles were largely drawn from journals with recognised scholarly visibility in their respective fields. However, journal quartile ranking was not used as a substitute for methodological appraisal. The methodological quality of individual studies was assessed separately using the MMAT, as reported in Section 3.6 and Appendix B.
Figure 2.
Quartile ranking of the included articles.
3.3. Distribution of Included Studies by Year of Publication
The temporal distribution of the included studies in Figure 3 reflects the incorporation of the recent and contemporary literature addressing AI-driven cancer progression analytics. The range of published literature is from 2020 to 2026, with 10% published in 2020, 7.5% published in 2021, 15% published in 2022, 12.5% published in 2023, 17.5% published in 2024, 35% published in 2025 and 2.5% published in 2026. This distribution highlights the strong inclusion of contemporary literature, reflecting rapid advances in AI, radiomics and multimodal imaging analytics. The single 2026 article represents evidence available up to the final search cutoff date of 15 May 2026, rather than the full 2026 publication year.
Figure 3.
Number of included articles by year of publication.
3.4. Distribution of Articles by Country of Publisher
The distribution of the included articles according to the country (Figure 4) in which they were published shows that the majority of the articles were drawn from journals headquartered in the United Kingdom (n = 14, 35%) and Switzerland (n = 13, 32.5%), followed by Germany (n = 6, 15%) and the United States (n = 5, 12.5%), while fewer articles were published in journals in China (n = 1, 2.5%) and Ireland (n = 1, 2.5%). Although publisher country does not necessarily reflect the geographical setting of the primary study data, the included studies themselves covered diverse research settings, including China, the United States, the United Kingdom, Canada, France, Germany, Spain, Romania, Belgium, Norway, the Netherlands and South Korea.
Figure 4.
Geographic distribution of included articles by country of publisher.
3.5. Distribution of Cancer Types in Included Articles
Table 2 shows the diverse cancer types represented in the included studies. Colorectal and rectal cancers account for nine studies, while lung cancers also contribute nine, reflecting strong coverage of these domains. Head-and-neck cancers accounted for seven studies, while nasopharyngeal carcinoma accounted for five studies. Other cancers, such as gastric, hepatocellular, skin, renal, prostate, thyroid, gynaecologic and brain tumours, are represented in smaller numbers. This distribution illustrates the range of cancers covered across the dataset.
Table 2.
Cancer types in the included articles.
3.6. Quality Assessment Results
The methodological quality of the 40 included studies was assessed using the Mixed Methods Appraisal Tool (MMAT). The appraisal showed that 36 studies (90%) were rated high quality, while 4 (10%) were rated moderate quality. No study was rated as low quality. High-quality studies generally had clearly defined research objectives, appropriate quantitative or computational designs, relevant clinical datasets, transparent modelling procedures, and clearly reported predictive performance measures. Moderate-quality studies remained relevant to the review question but were limited by factors, such as retrospective design, single-centre datasets, relatively small samples or absence of external validation. The MMAT findings were used to support interpretation of the narrative synthesis rather than to exclude studies from the review. The full study-level appraisal is presented in Appendix B.
3.7. Taxonomies of AI Approaches for Predicting Cancer Progression
The results show that cancer progression analytics employ several AI taxonomic streams. These methodologies vary from traditional feature-oriented ML models to DL models, hybrid fusion models, survival-aware models and explainable AI models. The following subsections highlight key streams of AI methodology, illustrating how different computational approaches contribute to predicting recurrence, metastasis and survival outcomes.
3.7.1. Conventional Feature-Based Frameworks
One major pathway in AI-driven cancer progression analytics is the conventional feature-based ML approach. In this approach, radiomic, clinical and molecular features are engineered and modelled using traditional statistical and ML techniques. A common thematic finding is the use of LASSO-Cox and similar Cox-based regularised survival frameworks for feature reduction and disease progression risk modelling. These methods were especially common where progression-free survival was modelled using features extracted from MRI, CT and PET/CT images [39,40,41,42]. This implies a strong preference for survival-aware conventional pipelines when progression is operationalised as a time-to-event outcome. The application of random forest (RF), support vector machine (SVM), logistic regression (LR) and XGBoost as central classifiers in cancer progression, recurrence, or metastasis prediction was evident in the collated results. RF and SVM with LASSO-Cox feature selection were found in nearly one-third of the implementations, indicating that these classical pipelines provide reliable pathways for progression prediction. These algorithms were repeatedly applied across diverse cancer types, including head and neck, rectal, gastric, cervical and metastatic risk studies. They were used with engineered radiomic features and structured clinicopathological variables to stratify patients into progression and non-progression groups [43,44,45,46,47,48]. Related to this is the frequent use of the feature selection models, such as recursive feature elimination (RFE), Boruta, minimum redundancy maximum relevance (mRMR) and LASSO, to determine the most progression-relevant radiomic signatures prior to classification or survival modelling [42,43,49,50]. Although classical approaches rely on handcrafted feature engineering, they remain robust for predicting cancer progression across various cancer types.
3.7.2. Deep Learning and End-to-End Neural Architectures
Deep learning and end-to-end neural modelling constitute the second major taxonomic pathway. In this pathway, progression-related information is learned directly from images, histology or report sequences without relying entirely on manual feature engineering. DL and end-to-end neural architectures represent a significant shift in the domain of cancer progression analytics as the progression-relevant features can be extracted automatically through imaging data rather than manually engineered. In related results, the application of convolutional neural networks (CNNs) and ResNet-based backbones to extract latent progression signatures of CT, MRI, positron emission tomography-computed tomography (PET/CT) and histopathology data was also common. This trend is evident in research that used ResNet-18 or similar CNN backbones. These models were applied to predict postoperative progression, extract deep image omics features and support prognostic MRI modelling or multimodal deep radiomics in lung and rectal cancer [51,52,53,54,55]. The common usage of 3D DL architectures such as three-dimensional U-Net neural network (3D-UNet), 3D-RPNUNet and DenseNet-style models, particularly where 3D volumetric lesion detection, segmentation and progression classification are necessary, is also closely related to lung cancer and glioblastoma [52,56]. This indicates that automated feature discovery is a key point of emphasis when it comes to the modelling of disease progression.
Another striking observation is the development of transformer-based, graph-based and multiple-instance learning (MIL) models for capturing complex spatial and contextual patterns linked to cancer progression. These architectures are used to predict disease-free survival, distant metastasis, recurrence and progression from whole-slide images and multi-planar imaging, in particular, Swin Transformer, RoBERTa-based federated transformers, graph neural networks (GNNs) and MIL-based histopathology or MRI systems [18,57,58,59,60]. These end-to-end architectures represent a significant shift in how cancer progression is addressed in the context of predictive analytics, enabling AI systems to identify sub-visual morphological and spatial indicators that traditional feature engineering may miss.
3.7.3. Hybrid and Ensemble Fusion Models
To capture the multidimensional nature of cancer progression, many past studies point to the use of hybrid or ensemble-based fusion models rather than relying on imaging alone. One key theme is the integration of imaging-based signatures with clinical, pathological or molecular biomarkers. These multimodal fusion pipelines generally achieve better progression-prediction results than unimodal models. The integration of radiomics data with clinical or pathological data is evident in at least 40% of the studies reviewed, which consistently demonstrate higher accuracy than using image data or clinical data alone in cancer progression prediction models. The findings imply that cancer progression is better characterised when imaging information is integrated with other patient-level data, rather than interpreted in isolation. In particular, the convergence of radiomic or deep imaging signatures with clinical, pathological and molecular signatures to enhance prediction of cancer progression-free survival, disease-free survival, recurrence and metastasis is a common trend. This pattern was observed in MRI-based and CT-based models that combined imaging features with stage, EBV DNA, albumin, EGFR or clinicopathological variables. These combined models achieved stronger discriminatory performance than models based only on imaging or clinical data [39,41,49,51]. A similar tendency appears in broader multimodal systems, in which CT, PET/CT, histology, or whole-slide imaging is combined with pathology or molecular classifiers to refine the recurrence and metastasis risk in colorectal, renal, nasopharyngeal and lung cancer [18,55,57,61,62].
An additional thread is the integrated nomograms, composite risk scores and ensemble comparison pipelines that integrate handcrafted radiomics, DL signatures and conventional predictors within a single framework for cancer progression risk prediction. The models are not merely additive; rather, they enhance patient stratification and separate high- and low-risk groups more clearly and accurately compared to models that use only staging variables or conventional clinicopathological models [39,41,49,51,55]. This indicates that progression risk prediction is a multidimensional problem. The best-performing AI models are those that integrate data on tumour behaviour through a combined interpretation of imaging phenotype, biological context and conventional clinical risk factors.
3.7.4. Survival-Aware and Time-to-Event Learning Systems
The findings show a consistent pattern that treats cancer progression as a clinical process that unfolds over time rather than as a simple yes/no outcome. The findings include the common use of Cox proportional hazards modelling and associated survival-based models to estimate the probability and timing of progression, recurrence or metastasis. This is evident in MRI- and CT-based radiomics studies that linked selected imaging features of disease progression to either progression-free or disease-free survival and to build prognostic models that retained the temporal structure of progression events [39,40,41,42,49,63]. Pathology-driven and multimodal systems also feature the same approach, where Cox regression is incorporated into recurrence and metastasis modelling to measure future risk, rather than current disease status only [55,57,58,60]. Another observation is the derivation of quantitative survival-ranking and risk-scoring models, particularly Rad-scores, combined prognostic scores and nomogram-based risk groups, typically assessed using the concordance index (C-index). These techniques are useful for ordering patients on a continuum of progression in order to identify high-risk and low-risk groups that have statistically significant differences in their survival trajectories [39,40,41,42,64,65]. The results indicate that survival-aware AI systems play a key role in cancer progression analytics since they move beyond static classification and instead model the expected timing and risk intensity of future progression events.
3.7.5. Explainable, Interpretable and Distributed AI Approaches
With the development of AI-based progression prediction models at the stage of clinical application, transparency is now a necessity rather than a luxury. Several studies, therefore, attempt to address this issue by “opening the black box” of prediction models, demonstrating the specific variables or image regions that drive high-risk progression assignments. In this regard, SHapley Additive exPlanations (SHAP) emerged as one of the most prominent methods for providing feature-level attribution in recurrence, progression and survival risk prediction models. Models that incorporated SHAP often combined clinical, laboratory and imaging variables, allowing progression predictions to become more clinically understandable rather than only statistically valid [39,46,47,48,66]. Through the use of SHAP, the issue of interpretability is integrated into the modelling process itself, making the progression prediction score clinically interpretable rather than merely statistically correct.
Visual attribution methods are being used to serve the same function in image-based systems. For instance, in the case of rectal cancer, gradient-weighted class activation mapping (Grad-CAM) was employed to identify the MRI image regions that contribute to the prediction of survival and recurrence [55]. In the case of cutaneous squamous cell carcinoma, integrated gradients and heatmap-based methods are used to identify image regions that contribute to predicting progression. This demonstrates that the aggressive nature of the disease is not only encoded within the tumour but also within the tumour border and microenvironment [59,67]. In order to ensure that the proposed prediction models generalise across different patient populations without compromising patient privacy, the federated learning (FL) framework has been successfully implemented for gastric cancer and cutaneous squamous cell carcinoma [59,68]. The key to opening the algorithmic black box using such approaches is to generate the clinical trust needed to implement AI-based progression risk analytics in real-world oncology practice.
3.8. Imaging-Derived Feature Domains in Cancer Progression Prediction
The extracted results demonstrate that cancer progression analytics is supported by diverse imaging-derived feature domains. These domains capture tumour behaviour across multiple dimensions—internal heterogeneity, morphological structure, functional activity and advanced transform-based or deep representations. The subsections below outline the major feature categories most consistently retained in empirical studies.
3.8.1. Intratumoural Heterogeneity and Texture Signatures
Intratumoural heterogeneity emerged as one of the established imaging foundations of cancer progression analytics. The findings indicate that progression risk is associated with texture descriptors that quantify disorder within tumours, the spatial distribution of irregularity and voxel-level non-uniformity. The most frequently identified features were grey-level co-occurrence matrix (GLCM) and grey-level size-zone matrix (GLSZM) texture features. These features were used to assess textural contrast, intensity correlation structure, clustered intensity behaviour and grey-level zoning within MRI, CT and PET/CT datasets [40,41,42,44,63,64]. This is further supported by common findings in which the grey-level run-length matrix (GLRLM), grey-level dependence matrix (GLDM) and neighbourhood grey-tone difference matrix (NGTDM) features are among the most strongly related variables in terms of progression or survival outcomes, especially for recurrence, distant spread or progression-free survival prediction tasks [39,41,44,49]. The texture feature sets provided by the GLCM and the GLSZM appeared in well over one-third of the implementations or modelling tasks of the included studies, supporting the idea of spatial disorder as a well-established radiographic predictor of aggressive tumour behaviour. The entropy-based measures of the heterogeneity of tumour architecture and biological aggressiveness, which include zone entropy, histogram entropy and other entropy descriptors sensitive to heterogeneity, are also key observations [39,42,43,49]. It is evident that tumour development is not simply a function of tumour size or tumour stage but also of the degree of disorder within the tumour itself. The more disordered the tumour’s phenotype, the more likely it is to recur or progress over time.
3.8.2. Morphological and Structural Biomarkers
Morphological and structural biomarkers are prominent in the evidence base as visible surrogates of tumour aggressiveness and progression potential. The findings derived on the basis of CT-, MRI- and pathology-based models consistently demonstrate that tumour size and volumetric load are among the most consistent predictors of cancer evolution. In particular, lesion long diameter, lesion short diameter, tumour volume and the percentage of tumour components are explicitly used in dynamic CT-based progression models of lung adenocarcinoma. Moreover, tumour size is also independently used as a reliable biomarker of tumour progression in rectal and lung cancers at early stages, as indicated in MRI- and CT-based models [39,42,43,49].
In glioblastoma, tumour volumetric enlargement of contrast-enhancing lesions plays a critical role in distinguishing tumour progression from pseudoprogression [56]. The findings provide substantial evidence for the significance of shape irregularity, elongation, eccentricity and boundary complexity. MRI radiomics of nasopharyngeal carcinoma retained shape-based elongation in the final progression model, and CT radiomics of head-and-neck cancer demonstrated differential topology and morphological descriptors to describe the tumour structural instability [41,63]. The histopathology-based and whole-slide systems took this further by identifying that progression is not only encoded in the tumour mass but also in the architecture at the tumour border. Tumour-border salience, inflammatory-cell distribution, nuclear size, ellipticity and heterogeneous tissue arrangement are found to be linked to high-risk cutaneous squamous cell carcinoma (cSCC) and nasopharyngeal carcinoma (NPC) cases, indicating that structural disorganisation of the tumour interface is closely linked with progression and metastatic potential [59,60,67]. These findings position morphology as a central imaging language through which cancer progression can be quantified.
3.8.3. Functional and Multiparametric Imaging
In additional findings, functional and multiparametric imaging domains are used to capture the biological activity underlying cancer progression, particularly when anatomical descriptors are inadequate. The results of positron emission tomography (PET)-based investigations put great emphasis on the metabolic uptake markers, especially standardised uptake value (SUV)-related parameters as predictors of aggressive tumour behaviour. Other measures, such as SUVmax, SUVmin, metabolic tumour volume and total lesion glycolysis, were also used in head-and-neck cancer and PET/CT-based progression models. These measures supported prediction of early progression, progression-free survival and treatment response, suggesting that hypermetabolic lesions have a higher likelihood of relapse or clinical progression [42,43,44,50,64]. MRI-based findings add complementary physiological information by capturing diffusion- and perfusion-sensitive features. For example, the apparent diffusion coefficient (ADC) value is evaluated as a means of reflecting both the cellularity of tissue and the degree of invasion in rectal cancer, while the dynamic contrast-enhanced (DCE) imaging and the contrast enhancement associated with it are used to describe tumour vascularisation and the risk of treatment-related tumour growth progression in nasopharyngeal carcinoma [41,49,54]. In glioblastoma, T2-weighted images and contrast-enhanced T1-weighted images are useful for distinguishing progression, further validating that multiparametric MRI can not only quantify radiation-induced biological activity but also identify changes occurring in the underlying cellular architecture [56].
3.8.4. Transform-Based and Deep Feature Representations
A large proportion of progression-relevant information is encoded, not in the readily apparent tumour characteristics but in transform-based and deep representations that capture the sub-visual image structures. The Wavelet-derived features extracted from MRI, CT and PET/CT images were consistently associated with progression prediction. Their high- and low-frequency components help identify recurrence, metastasis and survival-related outcomes [39,40,41,44,49]. Additional mathematical transformations, including log-transformed, exponential-transformed, square-transformed and Hessian-transformed features, were also applied to voxel data. These transformations improved the capture of progression-related patterns through local image geometry and topology rather than raw voxel-intensity measures [41,44,63]. Deep latent features and learned embeddings also emerged as important representations in progression prediction models. In such systems, an abstract feature space is constructed using convolutional networks, transformers, graph models or MIL instead of using handcrafted radiomic variables. This pattern is also evident in CT and MRI research using DL signatures, multi-plane transformer representations, graph-based patch embeddings and MIL-derived prognostic features to predict recurrence, distant metastasis, progression-free survival, or disease-free survival [18,51,53,55,59,60,69]. The results show that the most informative cancer progression imaging signatures exist at scales which require advanced mathematical and neural feature extraction methods for their discovery.
3.9. Clinical and Quantitative Metrics in AI-Driven Cancer Progression Analytics
AI-based imaging systems are closely tied to clinical outcomes and quantitative metrics. The findings show that cancer progression is characterised through endpoints and metrics such as survival metrics, risk stratification metrics, prediction performance metrics and integrated clinico-molecular covariates. These areas make algorithmic predictions clinically understandable, biologically grounded and quantitatively validated. The following subsections describe the critical clinical and computational metrics used in cancer progression modelling.
3.9.1. Survival and Event-Based Clinical Endpoints
AI cancer progression analytics rely on clinical data, where outcomes are defined through survival-based and event-based endpoints rather than abstract model outputs. Progression-free survival (PFS) was a major outcome variable across the collated evidence. It was especially common where AI models were used to estimate disease progression during chemoradiotherapy, targeted therapy or multimodal treatment. In this context, progression-free survival captures the time to local recurrence, distant metastasis, death or radiological disease worsening, thus making progression-free survival a clinically relevant outcome variable in AI algorithmic prediction [39,40,41,49,50,52,61,64]. What emerges from these findings is that PFS is especially valuable where the central task is to anticipate future disease activity while patients are still on treatment or under close post-treatment surveillance.
In postoperative and recurrence-oriented research, disease-free survival (DFS), recurrence-free survival and explicit recurrence or metastasis events are used to define progression more precisely after surgery or definitive treatment. This is evident in stage I non-small cell lung cancer (NSCLC), rectal cancer, papillary renal cell cancer, colon cancer, colorectal cancer and thyroid cancer, where recurrence events, distant metastases and disease-free survival are the reference standard for cancer progression modelling [18,42,44,51,55,57,58,65,69]. Inclusion of reference standard metrics specific to these various cancer types and correlating the outputs from AI models to these references keeps progression prediction closely aligned with the actual clinical progression of cancer.
3.9.2. Risk Stratification and Hazard Modelling Metrics
One key finding is the transformation of AI outputs into clinically interpretable risk gradients rather than abstract prediction scores. Commonly used metrics include hazard ratios (HRs) and Cox-based estimates of effect to measure how strongly specific imaging, pathological, or multimodal features are associated with future progression. Hazard-based modelling is also employed to show significant differences in the risk of recurrence and survival between prognostic groups in colon cancer, papillary thyroid carcinoma and head-and-neck cancer to quantify the progression risk associated with the identified signatures [58,63,65]. Comparable results are also described in longitudinal and multicentre research scenarios, in which Cox models are used to estimate locoregional failure, progression-free survival, or disease-free survival using radiomic and multimodal inputs [42,48,70,71]. These models are clinically relevant because their outputs can be converted to high- and low-risk groups, typically plotted as Kaplan–Meier survival separation. This step is especially evident in MRI radiomics and integrated prognostic models, which employ image-based scores, Rad-scores, or composite indices in stratifying patients according to clearly divergent progression patterns [39,40,41,42,55,57]. A related development is evident in text-based and sequential models, in which risk embedding and survival ranking are also applied to stratify cancer progression over time [72]. The real value of cancer progression analytics lies not simply in prediction but also in producing actionable stratification for monitoring treatments and developing personalised treatment plans.
3.9.3. Predictive Performance and Model Discrimination Metrics
Another key finding concerns the common use of predictive performance and model discrimination metrics to assess whether progression models are clinically credible. Model credibility was commonly assessed using discrimination measures. These measures enabled comparison across cancer progression prediction models, imaging modalities and analytical pipelines. The most widely used metrics are AUROC/AUC and the C-index, which assess whether an AI system’s ability to differentiate between high- and low-risk progression trajectories is accurate. This is evident in the application of these measures across MRI, CT, PET/CT and whole-slide image modalities to determine progression prediction, recurrence prediction, metastasis prediction, or survival prediction discrimination [39,40,42,43,48,51,56,64,69,72]. These findings should not be understood as a simple demonstration of statistical performance but as the ability of AI systems to prioritise patients based on the probability of future progression events in a clinically meaningful way.
Quantitative evaluation was supplemented by the use of calibration curves, decision curve analysis and related measures of clinical utility, particularly when the focus is on moving beyond technical prediction to risk stratification. In radiomics and multimodal progression models, calibration and decision curve analysis (DCA) were used to demonstrate that predicted risk scores had both discriminatory performance and clinical utility for decision making [41,47,49,52,62]. In additional results, simulation-based scenarios still use rigorous quantitative analysis in terms of root mean square error (RMSE), mean absolute error (MAE), reduction in normal tissue complication probability (NTCP), preservation of biologically equivalent dose (BED) and local control, extending discrimination to adaptive optimisation [68,73,74,75].
3.9.4. Integrated Clinico-Molecular and Pathological Covariates
This study presents compelling evidence that cancer progression models should not rely on imaging alone but should situate radiographic features within established clinical, molecular and pathological contexts. TNM or overall stage was frequently combined with circulating and laboratory biomarkers. These biomarkers included Epstein–Barr virus deoxyribonucleic acid (EBV DNA), carcinoembryonic antigen (CEA), carbohydrate antigen 19-9 (CA19-9), albumin, epidermal growth factor receptor (EGFR) expression and other blood-based indicators used to refine imaging-derived progression signatures. This was particularly evident in cancer models such as nasopharyngeal, lung, rectal and gastric cancer models, in which staging variables and biomarkers made significant contributions to predicting progression-free survival, recurrence, or metastatic spread over image-only systems [39,41,46,47,49,51,54]. Similarly, this is also observed for immunotherapy and multicentre NSCLC research, in which clinical performance status, programmed death ligand 1 (PD-L1) and traditional prognostic factors are used to contextualise radiomic risk predictions [50,76].
Pathological and tumour-specific variables are equally important in ensuring the biological validity of AI predictions. The included studies repeatedly incorporated histological grade, lymphovascular invasion, perineural invasion, nodal burden, depth of stromal invasion, tumour deposits and margin-related factors in the final model of progression, particularly in colorectal, cervical, renal and head-and-neck cancers [40,42,45,48,57,69]. At the higher-dimensional end, lncRNA and proteomic signatures are combined with imaging or clinicopathological information to improve the accuracy of recurrence risk stratification, which again underscores the importance of progression analytics in the context of interpreting the radiographic phenotype with biological context [57,65].
3.10. AI-Driven Cancer Progression Risk Analytics Framework (AI CanPRAF)
The AI-driven Cancer Progression Risk Analytics Framework (AI CanPRAF), shown in Figure 5, provides an integrative model for explaining how AI-based systems translate imaging and clinical data into clinically meaningful progression predictions. The framework is organised into five interconnected layers that move from computational modelling to clinical decision support. The first layer, algorithmic intelligence (ALi), represents the computational foundation of the framework. It captures the AI taxonomies, including conventional ML, DL, hybrid and ensemble fusion, survival-aware learning, explainable AI and distributed learning systems. This layer shows that cancer progression prediction is supported by different algorithmic pathways, ranging from handcrafted radiomics models to end-to-end neural architectures and privacy-preserving federated systems.
Figure 5.
AI-Driven Cancer Progression Risk Analytics Framework (AI CanPRAF) linking AI taxonomies, imaging-derived signatures, clinical covariates, progression endpoints and translational decision support.
The second layer, imaging phenotypes (IPs), represents disease-related imaging features extracted from medical imaging data. It includes intratumoural heterogeneity, texture signatures, morphological and structural biomarkers, functional imaging markers, transform-based features and deep latent representations. This layer explains that progression risk is not only reflected in visible tumour size or stage but also in sub-visual patterns of tumour disorder, metabolic activity, tissue architecture and spatial complexity that AI systems can quantify.
The third layer, clinical context (CC), explains how imaging-derived features gain stronger clinical meaning when combined with patient-level, molecular and pathological covariates. These include TNM stage, clinicopathological variables, tumour-specific factors, circulating biomarkers, laboratory markers, EGFR, PD-L1, lncRNA, proteomic indicators and other biological features. This layer shows that cancer progression is a multimodal process and that imaging features are more clinically useful when interpreted alongside established clinical and biological markers.
The fourth layer, progression analytics (PA), links algorithmic outputs to clinically meaningful endpoints and quantitative validation metrics. It includes progression-free survival, disease-free survival, recurrence, metastasis, cancer-related death, hazard ratios, Cox-based modelling, Rad-scores, risk groups, Kaplan–Meier survival separation, AUC, C-index, calibration and decision curve analysis. This layer demonstrates how AI outputs are translated into measurable progression risk, enabling models to distinguish patients with a stable condition from those likely to experience recurrence, metastasis or survival-related events.
The final layer, decision support (DS), represents the translational value of AI-driven progression analytics in clinical oncology. It shows how integrated predictions can inform high-risk patient stratification, surveillance planning, treatment adaptation, precision oncology decision support, model interpretability, external validation and federated learning. This layer emphasises that the ultimate value of AI-based progression prediction lies not only in statistical performance but also in its ability to support clinically transparent, validated and actionable decisions.
4. Discussion
The findings indicate that AI technology has emerged as an important analytical tool for modelling cancer progression, particularly in imaging-driven prediction systems. Several complementary technological and methodological approaches converge to translate imaging information into clinically interpretable indicators of disease trajectory. In these systems, cancer progression is represented through clinically detectable post-treatment events, including primary tumour recurrence, metastatic disease and cancer-related death during longitudinal follow-up. These endpoints provide quantifiable clinical targets for AI-based imaging systems. By and large, cancer progression analytics is shaped by interactions among classical ML, DL, morphological imaging features, functional imaging biomarkers, multiscale latent representations, progression endpoints, risk assessment tools and patient clinical data. The AI CanPRAF framework provides a clinically measurable representation of cancer progression by integrating explicit progression endpoints, established risk stratification metrics and clinically relevant covariates.
The findings of this review align with recent work showing that AI and radiomics are becoming central to oncological imaging and clinical decision support. Huang et al. [77] showed that AI is increasingly used across tumour diagnosis, segmentation, prognostic assessment and treatment monitoring, while Ferro et al. [78] highlighted the expanding value of radiomics and DL in breast and lung cancer imaging. Similar developments are reported in radiation oncology. Russo et al. [79] revealed that radiomics can support treatment response prediction, outcome assessment and clinical decision making. More recent syntheses also show growing interest in AI-based prediction of targeted therapy response, explainable radiomics and tumour response assessment across cancer types [80,81,82]. The present findings build on this wider direction but place stronger emphasis on cancer progression as a dynamic clinical trajectory. The linkage between AI taxonomies, imaging-derived progression signatures, survival-aware modelling, multimodal clinical covariates and decision support pathways shows that AI-driven progression analytics is moving beyond isolated prediction tasks towards clinically interpretable risk stratification.
The coexistence of classical ML pipelines and deep neural architectures reflects a transition in the computational landscape. Classical radiomic modelling now coexists with automated feature-learning systems. Recent empirical research confirms that convolutional neural networks and hybrid radiomics pipelines can capture complex tumour phenotypes associated with recurrence, metastasis and treatment resistance with considerable predictive power [14,15]. This development coincides with the wider medical AI adoption, in which imaging-based ML models are progressively integrated into oncology decision support settings to enhance early identification of high-risk disease progression trajectories and better patient monitoring [14,83].
The predictive capacity of these systems is strongly linked to their ability to quantify tumour heterogeneity and physiological activity. Radiomic texture features, morphological indicators and transform-based imaging features recurrently emerged as reliable computational representations of aggressive tumour behaviour. Similar independent oncological imaging studies demonstrate that intratumoral heterogeneity reflects underlying genomic instability, microenvironment complexity and adaptive tumour evolution leading to metastatic progression and recurrence [7,84]. PET metabolic uptake, diffusion-weighted MRI parameters and other functional imaging biomarkers strengthen this capability. They capture metabolic activity and changes in cellular density that may precede observable anatomical changes. Multiparametric imaging, thus, measures both structural and biological aspects of the tumour behaviour that are critical in the process of disease trajectory modelling [85,86].
There is also evidence that the strongest progression prediction systems are based on multimodal integration and not on isolated imaging features. Combinations of radiomic phenotypes with clinical staging variables, molecular biomarkers and pathological indicators consistently show stronger prognostic discrimination in AI frameworks. Cancer progression is, therefore, not merely a radiographic phenomenon. It is a complex biological process influenced by molecular activity, treatment exposure and patient-specific factors. The fusion of imaging features with genomic and clinical data in the form of integrative analytical pipelines is being increasingly observed as a key requirement of precision oncology applications [87,88]. Similar assertions have been made by the international health organisations that AI predictive analytics may be used to augment the management of cancer by aiding earlier detection of high-risk patients and guiding personalised treatment plans [89].
The methodological structure of progression modelling also underscores the critical role that survival-oriented analysis plays. Cox proportional hazards (CoxPH) analysis remains one of the main time-to-event methods for mapping imaging-derived signals into. Performance metrics such as AUC, concordance indices, discrimination curves and calibration tests provide quantitative evidence that the AI systems are able to differentiate between patients with stable disease and those at high risk of progression. Explainable AI techniques are increasingly used alongside these models. They clarify how individual imaging features contribute to cancer progression risk. Such transparency supports clinical adoption by demonstrating that algorithmic predictions correspond to meaningful biological patterns rather than opaque computational outputs. These findings suggest that cancer progression analytics follows a structured pathway. Multimodal imaging features, survival-based outcomes and clinical covariates are integrated to produce risk-stratified representations of disease trajectory.
The main conceptual contribution of this study is the development of the AI-Driven Cancer Progression Risk Analytics Framework (AI CanPRAF). Unlike prior reviews that mainly emphasise diagnostic accuracy, segmentation or treatment response prediction, AI CanPRAF is progression-centred. It explains how AI taxonomies, imaging-derived phenotypes, clinical covariates, survival endpoints and decision support pathways can be integrated to generate clinically meaningful progression risk analytics. In practical terms, the framework may support future AI systems that stratify patients into high- and low-risk progression groups. It may also guide surveillance intensity, inform treatment adaptation and identify patients who require closer monitoring. However, its clinical usefulness will require prospective validation, external testing across multicentre datasets, standardised radiomics pipelines and evaluation within real clinical workflows.
5. Limitations
This review has several limitations. Firstly, the included evidence was largely based on retrospective studies, which may introduce selection bias and limit causal interpretation. Secondly, many studies relied on single-centre datasets or relatively small cohorts, reducing the generalisability of model performance across different populations, institutions and imaging environments. Thirdly, heterogeneity in imaging protocols, scanner types, acquisition parameters, segmentation methods and feature extraction pipelines may affect the reproducibility of radiomics and deep learning models. Fourthly, radiomics standardisation remains a major challenge because differences in preprocessing, feature selection, model training and validation can produce inconsistent progression signatures across studies. Fifth, although several studies reported strong predictive performance, external validation and prospective clinical evaluation were limited in many cases.
6. Conclusions
The findings further indicate that models integrating imaging features with clinical staging, molecular biomarkers and pathological variables achieve stronger progression risk stratification. Survival-oriented modelling and validation metrics strengthen clinical relevance by connecting algorithmic predictions to patient-level outcomes. Overall, AI-driven cancer progression risk analytics is advancing towards a clinically grounded approach that can support earlier identification of high-risk progression pathways and improve precision oncology decision making. The AI CanPRAF framework offers a structured foundation for organising this emerging evidence and guiding future development of clinically validated progression prediction systems.
7. Future Directions
Future research should move beyond anatomy-based risk analytics towards molecularly informed, multimodal and clinically validated AI systems for cancer progression prediction. This will require closer integration of radiological features, multi-omics profiles, pathology data, longitudinal electronic health records and treatment response information to generate more comprehensive representations of disease trajectory.
A key future direction is the standardisation of imaging acquisition, tumour segmentation, image preprocessing, radiomics feature extraction, feature selection and model reporting. Greater methodological consistency is needed to improve reproducibility across institutions, scanners, cancer types and patient populations. Standardised radiomics and deep learning pipelines would also facilitate comparisons of progression signatures across studies and reduce variability caused by differences in imaging protocols or analytical workflows.
Future studies should prioritise prospective, multicentre and externally validated designs to test whether AI-based progression models remain reliable across real clinical settings. Such validation should assess not only predictive performance but also calibration, clinical utility, fairness across patient subgroups and impact on treatment decision making. Prospective validation is especially important for determining whether models can support surveillance planning, early identification of high-risk patients and treatment adaptation in routine oncology practice.
Future AI systems should be designed to model cancer progression as a dynamic process rather than a single fixed prediction task. Adaptive architectures, including transformer-based models, recurrent neural networks and longitudinal survival-learning systems, may support continuous updating of progression risk as patients undergo treatment, follow-up imaging and biomarker monitoring. These approaches could improve prediction of progression-free survival, recurrence, metastasis and cancer-related mortality over time.
The AI CanPRAF framework should be further tested as a practical guide for organising AI-driven cancer progression analytics across algorithmic, imaging, clinical, progression, and decision support layers. Future work should evaluate how the framework can support clinically interpretable risk stratification, personalised surveillance, multidisciplinary decision making and integration into oncology workflows. Explainable AI methods should also be strengthened so that clinicians can understand which imaging-derived, clinical or molecular factors drive progression risk predictions. Overall, future progress will depend on combining technical model performance with standardisation, prospective validation, interpretability, workflow integration and demonstrable clinical benefit.
Author Contributions
Conceptualisation, W.K. and B.C.; methodology, W.K. and B.C.; validation, W.K. and B.C.; formal analysis, W.K. and B.C.; investigation, W.K. and B.C.; writing—original draft preparation, W.K. and B.C.; writing—review and editing, W.K. and B.C.; visualisation, W.K. All authors have read and agreed to the published version of the manuscript.
Funding
This research received no external funding.
Institutional Review Board Statement
Not applicable.
Informed Consent Statement
Not applicable.
Data Availability Statement
No new data were created or analyzed in this study. Data sharing is not applicable to this article.
Acknowledgments
During the preparation of this manuscript/study, the author(s) used QuillBot (https://www.quillbot.com) and Grammarly (https://www.grammarly.com) for grammar and spelling checks and to improve clarity. The authors have reviewed and edited the output and take full responsibility for the content of this publication.
Conflicts of Interest
The authors declare no conflicts of interest.
Abbreviations
The following abbreviations are used in this manuscript:
| 3D-RPNUNet | Three-Dimensional Region Proposal Network U-Net |
| 3D-UNet | Three-Dimensional U-Net Neural Network |
| AI | Artificial Intelligence |
| AUC | Area Under the Curve |
| AUROC | Area Under the Receiver Operating Characteristic Curve |
| BERT | Bidirectional Encoder Representations from Transformers |
| CI | Confidence Interval |
| CT | Computed Tomography |
| CV | Cross Validation |
| C-index | Concordance Index |
| cSCC | Cutaneous Squamous Cell Carcinoma |
| cSCCNet | Cutaneous Squamous Cell Carcinoma Neural Network |
| DCE-MRI | Dynamic Contrast-Enhanced Magnetic Resonance Imaging |
| DL | Deep Learning |
| DLR | Deep Learning Radiomics |
| DLS | Deep Learning Signature |
| EBV DNA | Epstein–Barr Virus Deoxyribonucleic Acid |
| EGFR | Epidermal Growth Factor Receptor |
| Grad-CAM | Gradient-weighted Class Activation Mapping |
| H&E | Haematoxylin and Eosin |
| HNSCC | Head-and-Neck Squamous Cell Carcinoma |
| HR | Hazard Ratio |
| InceptionV3 | Inception Version 3 Neural Network |
| KNN | K-Nearest Neighbour |
| LASSO | Least Absolute Shrinkage and Selection Operator |
| LR | Logistic Regression |
| ML | Machine Learning |
| MRI | Magnetic Resonance Imaging |
| mRMR | Minimum Redundancy Maximum Relevance |
| NLP | Natural Language Processing |
| NSCLC | Non-Small Cell Lung Cancer |
| OAR BED | Organ at Risk Biologically Effective Dose |
| OS | Overall Survival |
| PCa | Prostate Cancer |
| PET | Positron Emission Tomography |
| PET/CT | Positron Emission Tomography–Computed Tomography |
| PFS | Progression-Free Survival |
| PPO | Proximal Policy Optimisation |
| RF | Random Forest |
| RL | Reinforcement Learning |
| RMSE | Root Mean Square Error |
| RNN | Recurrent Neural Network |
| ROC | Receiver Operating Characteristic |
| ROI | Region of Interest |
| SHAP | SHapley Additive exPlanations |
| SVM | Support Vector Machine |
| SUV | Standardised Uptake Value |
| TNM | Tumour–Node–Metastasis |
| WHO | World Health Organisation |
| WSI | Whole-Slide Imaging |
| XGBoost | Extreme Gradient Boosting |
Appendix A
Appendix A.1. PRISMA Abstract Checklist
| TITLE | |||
| Title | 1 | Identify the report as a systematic review. | Yes |
| BACKGROUND | |||
| Objectives | 2 | Provide an explicit statement of the main objective(s) or question(s) the review addresses. | Yes |
| METHODS | |||
| Eligibility criteria | 3 | Specify the inclusion and exclusion criteria for the review. | Yes |
| Information sources | 4 | Specify the information sources (e.g. databases, registers) used to identify studies and the date when each was last searched. | Yes |
| Risk of bias | 5 | Specify the methods used to assess risk of bias in the included studies. | Yes |
| Synthesis of results | 6 | Specify the methods used to present and synthesise results. | Yes |
| RESULTS | |||
| Included studies | 7 | Give the total number of included studies and participants and summarise relevant characteristics of studies. | |
| Synthesis of results | 8 | Present results for main outcomes, preferably indicating the number of included studies and participants for each. If meta-analysis was done, report the summary estimate and confidence/credible interval. If comparing groups, indicate the direction of the effect (i.e. which group is favoured). | Yes |
| DISCUSSION | |||
| Limitations of evidence | 9 | Provide a brief summary of the limitations of the evidence included in the review (e.g. study risk of bias, inconsistency and imprecision). | Yes |
| Interpretation | 10 | Provide a general interpretation of the results and important implications. | Yes |
| OTHER | |||
| Funding | 11 | Specify the primary source of funding for the review. | NO |
| Registration | 12 | Provide the register name and registration number. | NO |
Appendix A.2. PRISMA 2020 Checklist Summary
| TITLE | |||
| Title | 1 | Identify the report as a systematic review. | Title page, p. 1: title identifies the report as “A Systematic Review”. |
| ABSTRACT | |||
| Abstract | 2 | See the PRISMA 2020 for Abstracts checklist. | Abstract, p. 1. Abstract checklist completed. |
| INTRODUCTION | |||
| Rationale | 3 | Describe the rationale for the review in the context of existing knowledge. | Section 1, Introduction, pp. 1–3: cancer burden, progression problem, limitations of staging/imaging, and need for AI-driven progression analytics. |
| Objectives | 4 | Provide an explicit statement of the objective(s) or question(s) the review addresses. | Section 1, last part of the Introduction section: four (4) questions provided. |
| METHODS | |||
| Eligibility criteria | 5 | Specify the inclusion and exclusion criteria for the review and how studies were grouped for the syntheses. | Section 2.3; Study eligibility and selection procedure; Table 1; Section 2.6, Data synthesis; grouped by AI taxonomy, imaging feature domain and clinical/progression metrics |
| Information sources | 6 | Specify all databases, registers, websites, organisations, reference lists and other sources searched or consulted to identify studies. Specify the date when each source was last searched or consulted. | Section 2.2, Literature Search Approach, Search done from PubMed, EBSCOhost, Google Scholar, Web of Science, reference-list screening, and citation tracking. |
| Search strategy | 7 | Present the full search strategies for all databases, registers and websites, including any filters and limits used. | Section 2, Section 2.1 and Section 2.2; the searching process detailed including search strings. |
| Selection process | 8 | Specify the methods used to decide whether a study met the inclusion criteria of the review, including how many reviewers screened each record and each report retrieved, whether they worked independently, and if applicable, details of automation tools used in the process. | Section 2; study methods, eligibility, selection procedure and inclusion criteria articulated, two peer reviewers provided valuable support during manuscript development. |
| Data collection process | 9 | Specify the methods used to collect data from reports, including how many reviewers collected data from each report, whether they worked independently, any processes for obtaining or confirming data from study investigators, and if applicable, details of automation tools used in the process. | Section 2.5, Data extraction. Two peer reviewers provided valuable support during manuscript development. |
| Data items | 10a | List and define all outcomes for which data were sought. Specify whether all results that were compatible with each outcome domain in each study were sought (e.g. for all measures, time points, analyses), and if not, the methods used to decide which results to collect. | Section 2.5 Data extraction. Progression-related outcomes and model performance results were extracted, prioritising study-defined primary outcomes, externally validated findings and clinically interpretable progression estimates where multiple results were reported. Section 3.9 and Appendix C: Clinical and quantitative metrics, recurrence, metastasis, PFS, DFS, cancer-related death/survival, hazard/risk estimates, and model performance metrics. |
| 10b | List and define all other variables for which data were sought (e.g. participant and intervention characteristics, funding sources). Describe any assumptions made about any missing or unclear information. | Section 2.5, Data extraction, and Appendix C, Summary of included articles. Variables include author(s), year, research type, study methods, country/setting, participant details, cancer type(s), AI systems or techniques, results, strengths and/or limitations. | |
| Study risk of bias assessment | 11 | Specify the methods used to assess risk of bias in the included studies, including details of the tool(s) used, how many reviewers assessed each study and whether they worked independently, and if applicable, details of automation tools used in the process. | Section 2.4, Quality assessment; Appendix B, MMAT appraisal matrix; two peer reviewers provided valuable support independently. |
| Effect measures | 12 | Specify for each outcome the effect measure(s) (e.g. risk ratio, mean difference) used in the synthesis or presentation of results. | Section 3.9.2, Risk stratification and hazard modelling metrics; Section 3.9.3, Predictive performance and model discrimination metrics. Revise Methods to state no pooled effect measure was calculated; extracted measures included HR, C-index, AUC/AUROC, sensitivity, specificity, accuracy, calibration, DCA, RMSE, MAE, and related measures where available. |
| Synthesis methods | 13a | Describe the processes used to decide which studies were eligible for each synthesis (e.g. tabulating the study intervention characteristics and comparing against the planned groups for each synthesis (item #5)). | Section 2.3, Section 2.5 and Section 2.6; Table 1; Appendix C. Studies were eligible for synthesis when they met the empirical AI-based cancer progression prediction criteria and were grouped by planned synthesis domains. |
| 13b | Describe any methods required to prepare the data for presentation or synthesis, such as handling of missing summary statistics, or data conversions. | Section 2.5 and Section 2.6 reflected in results—Section 3. No statistical conversion/imputation of missing summary statistics was undertaken because synthesis was narrative. | |
| 13c | Describe any methods used to tabulate or visually display results of individual studies and syntheses. | Table 1, Figure 1, Figure 2, Figure 3, Figure 4 and Figure 5, and Table 2; Appendix B; Appendix C. | |
| 13d | Describe any methods used to synthesize results and provide a rationale for the choice(s). If meta-analysis was performed, describe the model(s), method(s) to identify the presence and extent of statistical heterogeneity, and software package(s) used. | Section 2.6, Data synthesis: narrative synthesis selected because studies varied by cancer type, imaging modality, AI method, endpoint, and validation metric; no meta-analysis was performed. | |
| 13e | Describe any methods used to explore possible causes of heterogeneity among study results (e.g. subgroup analysis, meta-regression). | Section 2.6; Section 3.5; Section 3.7, Section 3.8 and Section 3.9: heterogeneity explored narratively by cancer type, AI taxonomy, imaging-feature domain, clinical/progression endpoint, and quantitative metric. | |
| 13f | Describe any sensitivity analyses conducted to assess robustness of the synthesized results. | Not currently reported. N/A | |
| Reporting bias assessment | 14 | Describe any methods used to assess risk of bias due to missing results in a synthesis (arising from reporting biases). | The MMAT (Section 3.6) and Appendix B used helped to some extent, though missing result assessment was not a major issue in the study |
| Certainty assessment | 15 | Describe any methods used to assess certainty (or confidence) in the body of evidence for an outcome. | Section 2.4, Quality assessment; Section 3.6, Quality assessment results; Appendix B Confidence in evidence was judged narratively using MMAT-informed appraisal rather than GRADE. |
| RESULTS | |||
| Study selection | 16a | Describe the results of the search and selection process, from the number of records identified in the search to the number of studies included in the review, ideally using a flow diagram. | Section 3, Section 3.1, PRISMA flow diagram, Figure 1, pp. 6–7: from 3214 records identified to 40 empirical studies included. |
| 16b | Cite studies that might appear to meet the inclusion criteria, but which were excluded, and explain why they were excluded. | Figure 1, p. 7 reports 298 full-text exclusions. Full-text exclusions were cited and justified by reason, including diagnosis/segmentation-only focus, absence of progression outcomes, no AI/imaging-based model, non-empirical design, non-human data, or inaccessible/duplicate records. | |
| Study characteristics | 17 | Cite each included study and present its characteristics. | Section 3.5, Distribution of Cancer Types, p. 9–10; Table 2, p. 10; Appendix C; included studies and characteristics |
| Risk of bias in studies | 18 | Present assessments of risk of bias for each included study. | Section 3.6, Quality assessment results; Appendix B, MMAT quality appraisal. |
| Results of individual studies | 19 | For all outcomes, present, for each study: (a) summary statistics for each group (where appropriate) and (b) an effect estimate and its precision (e.g. confidence/credible interval), ideally using structured tables or plots. | Section 3.7, Section 3.8 and Section 3.9; Appendix C included relevant outcomes based on this narrative systematic review. |
| Results of syntheses | 20a | For each synthesis, briefly summarise the characteristics and risk of bias among contributing studies. | Section 3.7, Section 3.8 and Section 3.9; Section 3.6; Appendix B: characteristics and quality patterns are summarised for contributing studies. |
| 20b | Present results of all statistical syntheses conducted. If meta-analysis was done, present for each the summary estimate and its precision (e.g. confidence/credible interval) and measures of statistical heterogeneity. If comparing groups, describe the direction of the effect. | Not applicable: no meta-analysis or pooled statistical synthesis was conducted. Narrative synthesis results are presented in Section 3.7, Section 3.8, Section 3.9 and Section 3.10. | |
| 20c | Present results of all investigations of possible causes of heterogeneity among study results. | Section 3.5; Section 3.7, Section 3.8 and Section 3.9: heterogeneity reported narratively across cancer types, AI taxonomies, imaging-derived feature domains, and clinical/progression metrics. | |
| 20d | Present results of all sensitivity analyses conducted to assess the robustness of the synthesized results. | Not applicable. No sensitivity analyses were conducted because no pooled quantitative synthesis was undertaken. | |
| Reporting biases | 21 | Present assessments of risk of bias due to missing results (arising from reporting biases) for each synthesis assessed. | Not currently reported. Reporting bias due to missing results was not statistically assessed because the review used heterogeneous narrative synthesis. |
| Certainty of evidence | 22 | Present assessments of certainty (or confidence) in the body of evidence for each outcome assessed. | Section 3.6; Appendix B: Certainty was interpreted narratively from MMAT quality appraisal, methodological consistency, external validation, sample size, and convergence of findings across study clusters. |
| DISCUSSION | |||
| Discussion | 23a | Provide a general interpretation of the results in the context of other evidence. | Section 4, Discussion: interpretation of AI-driven cancer progression analytics in relation to oncology imaging, radiomics, multimodal integration, survival modelling, and explainable AI. |
| 23b | Discuss any limitations of the evidence included in the review. | Appendix C notes study limitations such as retrospective designs, single-centre datasets, and limited external validation. | |
| 23c | Discuss any limitations of the review processes used. | Database coverage –Table 1, English-language restriction and published peer-reviewed studies only. | |
| 23d | Discuss implications of the results for practice, policy, and future research. | Section 4, Discussion, Section 5, Conclusion; Section 6, Future Directions: implications for decision support, multimodal AI, federated learning, external validation, explainability, and future oncology research. The findings imply the need for clinically interpretable, multimodal and federated AI systems that integrate imaging, multi-omics and longitudinal EHR data to support privacy-preserving precision oncology and adaptive cancer progression monitoring. | |
| OTHER INFORMATION | |||
| Registration and protocol | 24a | Provide registration information for the review, including register name and registration number, or state that the review was not registered. | This systematic review was not registered. |
| 24b | Indicate where the review protocol can be accessed, or state that a protocol was not prepared. | The review protocol was not registered | |
| 24c | Describe and explain any amendments to information provided at registration or in the protocol. | Not applicable. No amendments to a registered protocol were applicable. | |
| Support | 25 | Describe sources of financial or non-financial support for the review, and the role of the funders or sponsors in the review. | Funding statement provided in the manuscript on sections just after Section 6: This research received no external funding |
| Competing interests | 26 | Declare any competing interests of review authors. | Conflicts of Interest statement provided in the manuscript on sections just after Section 6: The authors declare no conflicts of interest. |
| Availability of data, code and other materials | 27 | Report which of the following are publicly available and where they can be found: template data collection forms; data extracted from included studies; data used for all analyses; analytic code; any other materials used in the review. | Data Availability statement provided in the manuscript on sections just after Section 6: No data used in the study. |
Appendix B
Quality Appraisal of the Included Articles Based on MMAT
| Article | Method Category | MMAT Criteria (Yes/No/Can’t Tell) | Assessment | Overall Notes |
| [18] | Quantitative Non-Randomized (Criteria 3.1–3.5) | S1: Yes; S2: Yes; 3.1: Yes; 3.2: Yes; 3.3: Yes; 3.4: Yes; 3.5: Yes | High Quality | Multicentre deep-learning CT classifier integrated with pathological markers for risk stratification in stage II colorectal cancer using a large multicentre dataset (N = 2992), enabling robust external validation across independent institutions. |
| [39] | Quantitative Non-Randomized (3.1–3.5) | S1: Yes; S2: Yes; 3.1: Yes; 3.2: Yes; 3.3: Yes; 3.4: Yes; 3.5: Yes | High Quality | This research endeavour entails a large multicenter study which applied MRI radiomics with XGBoost survival modelling, integrating radscore and clinicopathological factors. SHAP enhanced interpretability, and external validation confirmed predictive reliability. |
| [40] | Quantitative Non-Randomized (Criteria 3.1–3.5) | S1: Yes; S2: Yes; 3.1: Yes; 3.2: Yes; 3.3: Yes; 3.4: Yes; 3.5: Can’t tell | Moderate Quality | This study integrated radiomics and clinical features using Random Survival Forests to predict progression-free survival in LANPC. RSF models significantly outperformed Cox regression, enabling risk stratification, though single-center design limits external generalisability. |
| [41] | Quantitative Non-Randomized (Criteria 3.1–3.5) | S1: Yes; S2: Yes; 3.1: Yes; 3.2: Can’t tell; 3.3: Yes; 3.4: Yes; 3.5: Yes | High Quality | Include systematic radiomic feature selection via LASSO and RFE, construction of multiple comparative prognostic models, and validation using Harrell’s C index with Kaplan–Meier survival analysis. Random assignment to training and validation cohorts enhanced internal validity. |
| [42] | Quantitative Non-Randomized (Criteria 3.1–3.5) | S1: Yes; S2: Yes; 3.1: Yes; 3.2: Yes; 3.3: Yes; 3.4: Yes; 3.5: Yes | High Quality | AI-assisted tumour segmentation and feature extraction applied to radiological datasets with clear reporting of survival modelling outcomes. |
| [43] | Quantitative Non-Randomized (Criteria 3.1–3.5) | S1: Yes; S2: Yes; 3.1: Yes; 3.2: Yes; 3.3: Yes; 3.4: Can’t Tell; 3.5: Yes | Moderate Quality | Machine-learning radiomics analysis evaluating FDG PET-CT features for predicting early disease progression in laryngeal and hypopharyngeal squamous cell carcinoma treated with radiotherapy or chemoradiotherapy. RF classifiers were developed using PET, CT, clinical, and combined radiomic feature sets; a relatively small single-center retrospective cohort, which limits external validity and increases risk of model overfitting. |
| [44] | Quantitative Non-Randomized (3.1–3.5) | S1: Yes; S2: Yes; 3.1: Yes; 3.2: Yes; 3.3: Yes; 3.4: Yes; 3.5: Yes | High Quality | The authors applied PET/CT radiomics with ensemble survival forests, achieving strong prognostic accuracy. Combined radiomic and clinicopathologic features enhanced prediction. |
| [45] | Quantitative Non-Randomized (Criteria 3.1–3.5) | S1: Yes; S2: Yes; 3.1: Yes; 3.2: Yes; 3.3: Yes; 3.4: No; 3.5: Yes | High Quality | Integrated modelling combining radiomics with clinical covariates. Kaplan–Meier analysis demonstrates significant stratification of progression risk groups. The study compared multiple ML algorithms integrating clinical, imaging, and pathological data for rectal adenocarcinoma. |
| [46] | Quantitative Non-Randomized (Criteria 3.1–3.5) | S1: Yes; S2: Yes; 3.1: Yes; 3.2: Yes; 3.3: Yes; 3.4: Yes; 3.5: Can’t tell | Moderate Quality | This study fused clinicopathological and radiomic features, comparing multiple ML algorithms with SHAP interpretability; and performs feature reduction using LASSO regression before constructing a logistic regression model; lack of external validation |
| [47] | Quantitative Non-Randomized (Criteria 3.1–3.5) | S1: Yes; S2: Yes; 3.1: Yes; 3.2: Yes; 3.3: Yes; 3.4: Yes; 3.5: Yes | High Quality | This is a large population-based multiple ML study developing predictive models for distant metastasis in rectal cancer using clinicopathological variables. The study utilised 23,867 rectal cancer patients from the SEER database and included an external validation cohort of 1178 patients from a Chinese hospital + SHAP interpretability. |
| [48] | Quantitative Non-Randomized (Criteria 3.1–3.5) | S1: Yes; S2: Yes; 3.1: Yes; 3.2: Yes; 3.3: Yes; 3.4: Yes; 3.5: Can’t tell | Moderate Quality | This study integrates clinical and radiomics features with explainable ML methods. Random survival forest and XGBoost models provided meaningful risk stratification, though single-centre design and absence of external validation limit broader applicability. |
| [49] | Quantitative Non-Randomized (Criteria 3.1–3.5) | S1: Yes; S2: Yes; 3.1: Yes; 3.2: Yes; 3.3: Yes; 3.4: Yes; 3.5: Yes | High Quality | The multi-sequence MRI radiomics with validation cohorts showed predictive efficacy; Kaplan–Meier curves demonstrate clear stratification of progression risk groups. |
| [50] | Quantitative Non-Randomized (Criteria 3.1–3.5) | S1: Yes; S2: Yes; 3.1: Yes; 3.2: Yes; 3.3: Yes; 3.4: Yes; 3.5: Yes | High Quality | This single-center study explored multimodal CT and PET/CT radiomics with delta features. Models achieved near-perfect progression prediction, though retrospective design and small sample size constrain broader clinical generalisability. |
| [51] | Quantitative Non-Randomized (Criteria 3.1–3.5) | S1: Yes; S2: Yes; 3.1: Yes; 3.2: Yes; 3.3: Yes; 3.4: Yes; 3.5: Can’t tell | High Quality | Multimodal deep-learning radiomics model integrating CT imaging features and clinicopathological variables for predicting postoperative progression in stage I NSCLC. External validation cohort strengthens methodological reliability and clinical applicability. |
| [52] | Quantitative Non-Randomized (Criteria 3.1–3.5) | S1: Yes; S2: Yes; 3.1: Yes; 3.2: Yes; 3.3: Yes; 3.4: Yes; 3.5: Yes | High Quality | The modelling pipeline integrates CT imaging features extracted using 3D-RPNUNet and 3D-UNet architectures together with clinical variables to predict treatment response. |
| [53] | Quantitative Non-Randomized (3.1–3.5) | S1: Yes; S2: Yes; 3.1: Yes; 3.2: Yes; 3.3: Yes; 3.4: Yes; 3.5: Yes | High Quality | DL and radiomics framework developed for subtype classification and survival prediction in lung adenocarcinoma using CT images. The study employed a large multicentre dataset (N = 1222) across three institutions with both internal and external validation cohorts |
| [54] | Quantitative Non-Randomized (3.1–3.5) | S1: Yes; S2: Yes; 3.1: Yes; 3.2: Yes; 3.3: Yes; 3.4: Yes; 3.5: Yes | High Quality | Observational imaging study using DL and radiomics features from MRI to distinguish T2 and T3 rectal cancer stages. The modelling framework combined radiomic features and ResNet-based DL; however, the single-institution dataset (n = 361). |
| [55] | Quantitative Non-Randomized (Criteria 3.1–3.5) | S1: Yes; S2: Yes; 3.1: Yes; 3.2: Yes; 3.3: Yes; 3.4: Yes; 3.5: Yes | High Quality | CNN-based radiomics pipeline integrating imaging and clinical features demonstrates strong external validation performance. Multicenter design, interpretability via Grad-CAM, and transparent modelling pipeline strengthen methodological rigor, predictive reliability, and translational applicability across rectal cancer survival outcomes. |
| [56] | Quantitative Non-Randomized (Criteria 3.1–3.5) | S1: Yes; S2: Yes; 3.1: Yes; 3.2: Yes; 3.3: Yes; 3.4: No; 3.5: Yes | High Quality | This study trained 3D DenseNet121 models on multiparametric MRI to distinguish pseudoprogression from true progression in GBM. Strong sensitivity supported clinical utility, though limited sample size and single-institution design necessitate larger multi-institutional validation. |
| [57] | Quantitative Non-Randomized (Criteria 3.1–3.5) | S1: Yes; S2: Yes; 3.1: Yes; 3.2: Yes; 3.3: Yes; 3.4: Yes; 3.5: Yes | High Quality | This study developed integrated classifiers combining lncRNA, DL on histology slides, and clinicopathological variables. Multi-cohort validation and rigorous Cox modelling strengthen prognostic reliability. |
| [58] | Quantitative Non-Randomized (Criteria 3.1–3.5) | S1: Yes; S2: Yes; 3.1: Yes; 3.2: Yes; 3.3: Yes; 3.4: Yes; 3.5: Yes | High Quality | The study applied CNN-based segmentation of H&E slides with gradient boosting classifiers. Strong hazard ratios and external validation supported survival modelling. |
| [59] | Quantitative Non-Randomized (Criteria 3.1–3.5) | S1: Yes; S2: Yes; 3.1: Yes; 3.2: Yes; 3.3: Yes; 3.4: Yes; 3.5: Yes | High Quality | The study implemented a transformer-based multiple instance learning architecture trained across three medical centers, enabling privacy-preserving multi-institutional model development. The integration of explainability methods (Integrated Gradients) to identify histological predictors of progression further strengthens methodological transparency. |
| [60] | Quantitative Non-Randomized (Criteria 3.1–3.5) | S1: Yes; S2: Yes; 3.1: Yes; 3.2: Yes; 3.3: Yes; 3.4: Yes; 3.5: Yes | High Quality | A deep-learning framework integrating histopathology and clinical data predicted metastasis in nasopharyngeal carcinoma. Large multicentre validation (N = 1949) confirmed GNPC model’s strong prognostic performance across survival outcomes |
| [61] | Quantitative Non-Randomized (Criteria 3.1–3.5) | S1: Yes; S2: Yes; 3.1: Yes; 3.2: Yes; 3.3: Yes; 3.4: Yes; 3.5: Yes | High Quality | Multimodality DL radiomics model using pretreatment PET/CT imaging to predict 5-year progression-free survival (PFS) in advanced nasopharyngeal carcinoma. The modelling pipeline includes internal cross-validation and independent external validation cohorts, improving robustness and reducing overfitting risk. |
| [62] | Quantitative Non-Randomized (Criteria 3.1–3.5) | S1: Yes; S2: Yes; 3.1: Yes; 3.2: Yes; 3.3: Yes; 3.4: Yes; 3.5: Yes | High Quality | The study applies a ML radiomics pipeline across PET/CT and clinical features. Fusion strategies improved discrimination (AUC 0.811), with survival validation and decision curve analysis enhancing transparency, though single-center design limits broader generalizability. |
| [63] | Quantitative Non-Randomized (Criteria 3.1–3.5) | S1: Yes; S2: Yes; 3.1: Yes; 3.2: Yes; 3.3: Yes; 3.4: Yes; 3.5: Yes | High Quality | The research applied CT radiomics with Hessian index features to capture tumour heterogeneity; integration with clinical variables improved prognostic power; training and independent testing cohorts were used to evaluate model robustness and survival stratification performance. |
| [64] | Quantitative Non-Randomized (Criteria 3.1–3.5) | S1: Yes; S2: Yes; 3.1: Yes; 3.2: Yes; 3.3: Yes; 3.4: Yes; 3.5: Yes | High Quality | Multicentre radiomics comparison evaluating machine-learning and deep-learning models for treatment outcome prediction using PET/CT imaging and clinical data. External validation across two institutions strengthens methodological robustness and model generalisability. |
| [65] | Quantitative Non-Randomized (Criteria 3.1–3.5) | S1: Yes; S2: Yes; 3.1: Yes; 3.2: Yes; 3.3: Yes; 3.4: Yes; 3.5: Can’t tell | High Quality | Machine-learning–assisted proteomics framework identifying recurrence risk signatures in Paediatric papillary thyroid carcinoma. Extensive proteomic profiling and rigorous quality control support robustness, though retrospective cohort design limits causal inference. |
| [66] | Quantitative Non-Randomized (Criteria 3.1–3.5) | S1: Yes; S2: Yes; 3.1: Yes; 3.2: Yes; 3.3: Yes; 3.4: Yes; 3.5: Yes | High Quality | Large retrospective SEER cohort (20,346 patients) with SMOTE addressing imbalance, Boruta feature selection, and multivariate LR. Eight ML models compared; RF achieved strongest performance. SHAP interpretability enhanced transparency, |
| [67] | Quantitative Non-Randomized (3.1–3.5) | S1: Yes; S2: Yes; 3.1: Yes; 3.2: Yes; 3.3: Yes; 3.4: No; 3.5: Yes | High Quality | This study applied a dual deep-learning pipeline (cSCCNet) to whole-slide H&E images, stratifying metastatic risk with explainable heatmaps. Strong predictive accuracy outperformed staging systems |
| [68] | Quantitative Non-Randomized (Criteria 3.1–3.5) | S1: Yes; S2: Yes; 3.1: Yes; 3.2: Yes; 3.3: Yes; 3.4: Yes; 3.5: Yes | High Quality | Federated deep-learning framework predicting postoperative gastric cancer recurrence using multicentre CT datasets. Privacy-preserving federated architecture enables cross-institutional modelling while maintaining strong predictive performance across four hospitals. |
| [69] | Quantitative Non-Randomized (Criteria 3.1–3.5) | S1: Yes; S2: Yes; 3.1: Yes; 3.2: Yes; 3.3: Yes; 3.4: Yes; 3.5: Yes | High Quality | This study integrated CT and histology features using DL evaluation. IDLE achieved superior prognostic accuracy and risk stratification. |
| [70] | Quantitative Non-Randomized (Criteria 3.1–3.5) | S1: Yes; S2: Yes; 3.1: Yes; 3.2: Yes; 3.3: Yes; 3.4: Yes; 3.5: Yes | High Quality | This study introduced a Bayesian Sequential Network with multi-task learning, enhancing survival prediction and outperforming nomograms. Automated segmentation and uncertainty quantification added methodological strength |
| [71] | Quantitative Non-Randomized (Criteria 3.1–3.5) | S1: Yes; S2: Yes; 3.1: Yes; 3.2: Yes; 3.3: Yes; 3.4: Yes; 3.5: Can’t tell | High Quality | Longitudinal radiomics analysis using CT and FDG-PET imaging acquired during treatment to predict loco-regional control in head-and-neck cancer. Innovative multimodal modelling approach, though cohort size and class imbalance affect stability of prediction. |
| [72] | Quantitative Non-Randomized (Criteria 3.1–3.5) | S1: Yes; S2: Yes; 3.1: Yes; 3.2: Yes; 3.3: Yes; 3.4: Yes; 3.5: Yes | High Quality | Deep-transfer-learning study applying natural language processing to serial free-text MRI radiology reports for predicting overall survival in rectal cancer patients; a large sample—4338 patients from a cancer center EMR database and developed a model integrating ClinicalBERT embeddings, recurrent neural networks, and Cox proportional hazards modelling. |
| [73] | Quantitative Descriptive/Computational Modelling | S1: Yes; S2: Yes; 4.1: Yes; 4.2: Yes; 4.3: Yes; 4.4: Yes; 4.5: Yes | High Quality | The study proposes a reinforcement learning framework using the Proximal Policy Optimization (PPO) algorithm to simulate chemotherapy strategies within mathematical tumour models. The modelling framework integrates differential equation-based tumour dynamics with immune–tumour interaction terms and drug concentration control variables. Although the computational modelling is methodologically structured and the reinforcement learning pipeline is clearly described, the study relies primarily on simulation experiments rather than real clinical datasets. |
| [74] | Quantitative Non-Randomized (Criteria 3.1–3.5) | S1: Yes; S2: Yes; 3.1: Yes; 3.2: Yes; 3.3: Yes; 3.4: Yes; 3.5: Yes | High Quality | Reinforcement learning framework for optimizing radiotherapy fractionation based on tumour growth simulation. The modelling framework is clearly described, but reliance on simulated environments rather than clinical datasets limits real-world generalisability. |
| [75] | Quantitative Non-Randomized (Criteria 3.1–3.5) | S1: Yes; S2: Yes; 3.1: Yes; 3.2: Can’t tell; 3.3: Yes; 3.4: Yes; 3.5: Yes | High Quality | Deep reinforcement learning approach for optimizing radiotherapy dose fractionation in head-and-neck cancer. Although algorithm development and modelling are clearly reported, results are derived from simulated patient environments rather than empirical clinical cohorts. |
| [76] | Quantitative Non-Randomized (Criteria 3.1–3.5) | S1: Yes; S2: Yes; 3.1: Yes; 3.2: Yes; 3.3: Yes; 3.4: Yes; 3.5: Yes | High Quality | The study included 642 NSCLC patients collected across four academic institutions, with a discovery cohort (n = 512) and an external validation cohort (n = 130). The modelling framework incorporated radiomic features extracted from CT scans using both PyRadiomics and DeepRadiomics pipelines, alongside clinical predictors such as age, ECOG status, smoking history, and treatment line. Rigorous methodology included cross-center cross-validation, image harmonization to reduce scanner variability, and a global hyperparameter search framework to optimize feature selection and model tuning. |
| [90] | Quantitative Non-Randomized (Criteria 3.1–3.5) | S1: Yes; S2: Yes; 3.1: Yes; 3.2: Yes; 3.3: Yes; 3.4: Yes; 3.5: Yes | High Quality | This study applied CNN-based DL (DeepLRHE) to histopathology images for lung cancer classification. The model combines CNN and ResNet architectures with tile-based analysis (512 × 512 patches) and heat-map visualization for recurrence probability estimation. The training dataset included 110 TCGA lung cancer cases, with an independent test set of 101 cases. |
Appendix C
Included Articles Summary
| Author(s), Year | Research Type | Study Methods | Country/Setting | Participant Details | Cancer Type(s) | AI Systems or Techniques | Results | Strengths (+) and Limitations (−) |
| [18] | Retrospective multicenter cohort | Two-stage DL model training; multi-planar CT analysis; integration with pathological markers; 7:3 train-validation split. | China (12 centers) | 2992 patients with operated stage II colorectal cancer; median age 61–62. | Stage II Colorectal Cancer (CRC). | Swin Transformer DL network (STAR-CRC); multi-plane CT foundation model; Cox PH; voting ensemble; Intelligent Risk Integration System (IRIS-CRC) composite model | External validation C-index 0.686; hazard ratios (HR) up to 9.13; 3-year disease-free survival (DFS) stratification 0.95 → ≤0.55. IRIS-CRC reclassified 27.1% of high-risk patients as lower risk and upstaged 6.5% of low-risk patients compared to traditional guidelines. | + Large multicenter cohort + External validation + DL + pathological integration − Retrospective design |
| [39] | Retrospective multicenter prognostic study | MRI radiomics extraction; Radiomics features selected via univariate Cox and LASSO regression. XGBoost integrated radscore with clinicopathological factors. SHAP and visualization applied for interpretability of prognostic models. | China (Guangxi Medical University Cancer Hospital, Wuzhou Red Cross Hospital, and The Second Affiliated Hospital of Guangxi Medical University) | 1098 LANPC patients: training cohort 700 (70% from 2 hospitals), internal validation 300 (30%), external validation 98 (3rd hospital) | Nasopharyngeal Carcinoma (NPC) | XGBoost survival model; LASSO Cox; SHAP; | Combined model integrating radscore with IC, EBV-DNA, and albumin achieved superior predictive performance (C-index 0.762 training, 0.729 internal, 0.752 external). SHAP identified top radiomics features; Kaplan-Meier confirmed subgroup prognostic differences. | + Large sample; + External validation; + Interpretable AI − Single country study |
| [40] | Retrospective empirical cohort | Eligible LANPC patients underwent pre-treatment MRI; radiomics features extracted and combined with clinical data; training cohort analyzed using Random Survival Forests (RSF) to predict PFS, tested in validation cohort; performance assessed with AUC and Delong test, compared against Cox models. | China (single center) | 294 LANPC patients (206 training; 88 testing) | Nasopharyngeal carcinoma | Random Survival Forest (RSF), Cox proportional hazards, radiomics feature selection | integrated clinical + radiomics RSF model achieved superior AUCs for 3- and 5-year PFS prediction (train: 0.899/0.897 vs. 0.545–0.648; test: 0.861/0.847 vs. 0.566–0.736); Delong test confirmed significant improvement (p < 0.001); RSF stratified high-risk patients with lower PFS, outperforming Cox models. | + ML vs. Cox comparison; risk stratification. − Single-center |
| [41] | Retrospective Empirical | Clinical and MRI data collected; radiomic features selected via LASSO and RFE; five prognostic models (clinical, stage, radiomics, radiomics + stage, radiomics + stage + EBV DNA) constructed; performance evaluated with Harrell’s C-index; survival analysis by Kaplan–Meier. | China | 327 consecutive nonmetastatic NPC patients enrolled (June 2013–June 2017); pathologically confirmed, no prior treatment, complete clinical/MRI data; randomly assigned to training (n = 230) and validation (n = 97) cohorts; treated with IMRT ± cisplatin-based chemotherapy per stage) | Nasopharyngeal Carcinoma (NPC) | Radiomic feature selection with LASSO and RFE-SVM; prognostic modelling via Cox proportional hazards; risk stratification using Rad-score; predictive visualization through nomogram. | The integrated approach combining radiomics, overall stage, and EBV DNA achieved the highest C-indices for PFS prediction (train: 0.805 vs. 0.766–0.563; validation: 0.874 vs. 0.839–0.456), with survival curves showing significantly lower PFS in high-risk compared to low-risk groups | + Multi-model comparison EBV integration − Retrospective |
| [42] | Retrospective multicentre empirical radiomics study | Image biomarker standardisation initiative (IBSI)-compliant radiomics extraction (346 features); Lasso-Cox regression for feature selection; CoxPH models for PFS prediction; ComBat harmonization strategies; tumour sub-volume clustering; automatic segmentations. | Multicentre dataset from six European institutions (Head-and-Neck Tumour Segmentation Challenge (HECKTOR) 2021 challenge), including CHUP Poitiers, France | 325 oropharyngeal HNC patients (224 training, 101 testing) | Head-and-Neck Cancer (Oropharynx) | Lasso-Cox survival modelling; CoxPH; ComBat harmonization; K-means clustering; Principal Component Analysis (PCA); 3D U-Net CNN | Radiomics with clinical factors achieved C-index 0.69. ComBat harmonization (post-FS, clustering labels) improved to 0.71. Tumour sub-volume features further raised performance to 0.72. Automatic segmentations produced slightly lower results (0.67–0.70), compared to expert contours | + Large multicenter dataset + External testing + Harmonization analysis − Moderate performance gains |
| [43] | Retrospective empirical cohort | Radiomic feature analysis of pre-treatment fluorodeoxyglucose (FDG) PET-CT; feature selection via recursive feature elimination; 80/20 train-validation split. | UK; Specialist cancer centre (Leeds Teaching Hospitals NHS Trust) | 72 patients, mean age 61; locally advanced SCC receiving (chemo) radiotherapy | Larynx and hypopharynx squamous cell carcinoma (SCC). | RF classifier; Recursive Feature Elimination (RFE); local image feature extraction software (lifex) software for radiomic feature extraction. | Combined PET-CT model achieved the highest validation AUC of 0.94 for predicting 12-month progression. 80% accuracy; sensitivity 100%. | + Adherence to transparent reporting of a multivariable prediction model for individual prognosis or diagnosis (TRIPOD) guidelines; use of multimodal (PET-CT) data. − Small sample size (72 patients) |
| [44] | Retrospective prognostic modelling | PET/CT radiomics; feature selection via C-index + variance inflation factor (VIF); Random Survival Forest; 4-fold CV | China (Fudan University Shanghai Cancer Center) | 201 patients (FIGO IB–IIA); radical surgery; 140 training/61 testing | Uterine cervical squamous cancer | Ensemble random survival forest (RSF); survival ensemble learning; | Six radiomic (5 CT, 1 PET) and six clinicopathologic features were selected. Prognostic models achieved C-indices of 0.9338 (radiomic), 0.9019 (clinicopathologic), and 0.9527 (combined), with mean C/D AUCs of 0.9146, 0.8645, and 0.9199 | + Survival modelling; + External test cohort; − Single-center |
| [45] | Empirical (Retrospective observational study) | Comparison of 4 ML algorithms; feature selection; clinical-imaging-pathological data integration. | Romania (Regional Institute of Oncology, Iasi) | 164 patients with locally advanced low rectal adenocarcinoma; neoadjuvant CRT + surgery | Low rectal adenocarcinoma | Decision Tree, Naïve Bayes, SVM, RF | RF achieved the highest predictive performance, with 90.85% accuracy for recurrence, 89.63% for metastasis, and strong discrimination (AUC 0.885 for local recurrence; 0.887 for metastasis) | + Multi-model comparison; − Retrospective single-center design. |
| [46] | Empirical (Retrospective) | Clinical-pathological data were fused with radiomic features. Five ML algorithms were compared, 10-fold cross-validation, and SHAP value analysis. Feature selection employed LASSO, with multivariate LR for final model construction | China (The Fourth Hospital of Hebei Medical University) | Data from 161 rectal cancer patients treated with nCRT and TME were collected. After preprocessing and feature selection, 135 patients with 45 clinical variables were finally included | Locally advanced rectal adenocarcinoma (LARC). | XGBoost, RF, SVM, Decision Tree, LR; SHAP | High performing RF AUC 0.97; final logistic model AUC 0.9486 and sensitivity 94% | + Multi-model comparison + Feature reduction; − Single-center and no external validation |
| [47] | Empirical (Retrospective) | 8 ML models; 10-fold CV; external validation; SHAP; ROC; PR; DCA | USA (SEER) + China [the First Hospital of Jilin University] (for external validation) | 23,867 rectal cancer patients and 2840 patients with distant metastasis + 1178 Chinese cohort | Rectal cancer | XGB, RF, DT, LR, KNN, SVM, naïve bayes classifier (NBC), MLP; SHAP | The XGB model achieved the best predictive performance: mean AUC 0.859 (ten-fold CV), AUC 0.855 with 0.900 accuracy and 0.880 precision in the internal test, and AUC 0.814 with 0.800 accuracy and 0.810 precision in external validation | + Large multi-cohort validation; + SHAP interpretability; − Retrospective single-center design and limited biomarkers |
| [48] | Empirical (single-centre observational Study) | Single-centre observational design collected clinical data and baseline CT scans from LAHNSCC patients treated with chemoradiation; dataset split 80/20, five-fold cross-validation, 108 radiomics features, survival/classification models, SHAP importance, Kaplan–Meier stratification. | Spain (Single center Hospital Clínico Universitario de Valencia) | 171 diagnosed with LAHNSCC eligible for definitive chemoradiation with cisplatin or cetuximab, with 53% experiencing disease progression at 5 years. | Head-and-Neck Cancer | Random Survival Forest; XGBoost; SHAP; kNN imputation; Feature selection; Cross-validation | Random survival forest predicted PFS with AUC 0.64 and CI 0.66, highlighting tumour–node–metastasis staging system [8th edition] (TNM8) and four radiomics features. Extreme gradient boosting predicted 5-year progression with AUC 0.74, sensitivity 0.53, specificity 0.81, and accuracy 0.66; significant risk stratification | + Integrated clinical-radiomics + Explainable ML − Single centre and no external validation |
| [49] | Retrospective empirical study | Retrospective design; dynamic contrast-enhanced magnetic resonance imaging (DCE-MRI) radiomics, clinical, and combined models built to predict PFS; EGFR expression assessed with Kaplan–Meier; model performance evaluated via AUC, calibration, DeLong tests; decision curve analysis measured clinical benefit. | China (Hainan General Hospital, Department of Otolaryngology) | 136 locally advanced nasopharyngeal carcinoma patients receiving Nimotuzumab Therapy [NTZ] (2018–2022) | Nasopharyngeal carcinoma | Radiomics pipeline with ITK-SNAP software segmentation, Darwin feature extraction, intraclass correlation coefficient (ICC) stability testing, mRMR and LASSO selection; LR models built; evaluated via ROC, calibration, DeLong tests; risk stratification using Rad-score. | Univariate Cox regression identified EGFR as the only independent predictor of PFS (p < 0.05). Patients with EGFR 3+ had longer PFS than EGFR 1+ (HR = 3.025, p < 0.05). Clinical-radiomics model showed superior predictive efficacy (training AUC = 0.887 vs. 0.845, 0.654; validation AUC = 0.831, 0.824 vs. 0.567; all p < 0.001). | + Multi-sequence MRI; validation cohort; risk stratification; strong HRs. − Retrospective; small sample; single-center; no external validation. |
| [50] | Empirical retrospective | Radiomic feature extraction from CT and PET/CT; feature selection using Boruta or LASSO; RF classification and 10-fold cross-validation. | France (Poitiers University Hospital) | 83 patients with NSCLC; treated with Nivolumab or Pembrolizumab. | Non-Small Cell Lung Cancer (NSCLC) | LASSO and Boruta feature selection, RF (RF) classification; delta-radiomics; multimodal PET-CT models; the use of LIFEx software | Radiomics and delta-radiomics outperformed clinical metrics, with PET-CT models achieving near-perfect progression prediction (AUC 1.0/0.96) and strong durable clinical benefit prediction (AUC 0.85/0.83). | + Multimodal imaging; + External validation subset; − Small sample size and single-center retrospective design. |
| [51] | Retrospective multicenter | Clinicopathological and CT features underwent univariate analysis. Significant variables trained an ELM classifier. ResNet18 with transfer learning extracted deep features, integrated into multimodal DL radiomics (MDLR) model, evaluated by AUC for diagnostic efficiency. | China | 459 stage I NSCLC patients (239 male, 220 female; mean age 60.2). Training cohort 321, internal validation 138, external validation 104 (54 male, 50 female; mean age 57.1) | Non-Small Cell Lung Cancer (NSCLC) | Multimodal DL framework: ResNet-18 with transfer learning for feature extraction; Extreme Learning Machine (ELM) classifier | MDLR model combining clinical variables and DLS achieved superior performance (AUC 0.885), outperforming clinical (0.675) and DLS (0.882) models.) | + External validation + Multimodal integration − Binary endpoint only; |
| [52] | Retrospective empirical cohort | 3D-UNet model fine-tuning; DL binary classification, integrating dynamic CT analysis with clinical features to predict PFS. | China (Peking University Third Hospital) | 438 patients, including 183 patients with EGFR mutations (N = 133) and wild-type EGFR (N = 50) | Lung adenocarcinoma (LUAD) | 3D-UNet (segmentation), 3D-RPNUNet (detection), ResNet-18 (malignancy), and Multilayer Neural Network (PFS prediction). | In EGFR-mutant test set, AUC for 9-month and 12-month progression prediction models were 0.858 and 0.873 respectively. | + Dynamic CT modelling + Clinical integration + External wild-type validation. − Retrospective single-center design. |
| [53] | Retrospective empirical study | Preoperative CT images with pathological labels were classified into 2-, 3-, and 8-categories using a modified 3D-ResNet-34 backbone from MedicalNet. DL, radiomics, and combined deep radiomics approaches were applied. | China (West China Hospital of Sichuan University, Suining Central Hospital and Chengdu Shangjin Nanfu Hospital) | 1222 patients with lung adenocarcinoma diagnosed via computed tomography (CT); Patients with complete 5-year follow-up were enrolled in the prognosis estima- tion analysis. | Lung adenocarcinoma | Modified ResNet-34 DL network, radiomics strategies and deep radiomics combined algorithm | Deep radiomics achieved ACC 0.878 (2-class), 0.806 (3-class), AUC 0.739–0.940 (8-class); prognostic model C-index 0.892, guiding lung adenocarcinoma treatment. | + Large sample and combined AI framework. − Requires further external validation in diverse populations. |
| [54] | Retrospective observational cohort | Retrospective analysis of high-resolution MR images; manual ROI segmentation; Z-score standardization of features; 10-fold cross-validation. | China | 361 participants (236 males, 125 females) with pathologically verified rectal cancer; mean age 63.3 years. | Rectal cancer | DL: ResNet-18. ML: SVM, KNN, XGBoost, and LASSO regression for dimensionality reduction. | Test AUC up to 0.977; Training AUC 0.998; Accuracy 97% (XGBoost combined model) | + Large sample + Multi-model comparison − Single-slice ROI − Retrospective design. |
| [55] | Multicenter retrospective empirical study | Multi-instance learning (MIL) to integrate slice-level predictions; DL feature extraction combined with clinicopathologic parameters in a nomogram; model performance evaluated using Harrell’s C-index and time-dependent ROC curves. | China ( Shengjing Hospital of China Medical University, Chaoyang Central Hospital, First Affiliated Hospital of Jinzhou Medical University) | 586 consecutive rectal adenocarcinoma patients undergoing radical surgery in three tertiary hospitals in China were enrolled; after exclusions, 458 patients with stage II/III disease and ≥3-year follow-up were included | Rectal Cancer | ResNet18-based 2.5D CNN with Z-score normalization, augmentation, and cosine decay learning; Multi-Instance Learning fusion (Predict Likelihood Histograms, Bag-of-Words TF-IDF) integrated with radiomic and clinical features; Cox proportional hazards for signature building; combined MIL-clinical nomogram; interpretability via Grad-CAM. | MIL model achieved C-index 0.757 (training), 0.754 (validation), 0.741 (test) for OS, compared to 0.666–0.772–0.756 for clinical model. Combined MIL + clinical model improved predictive performance: OS C-index 0.819–0.822–0.759; DFS C-index 0.768–0.750–0.721 | + Multicenter; external test cohort; interpretability (Grad-CAM). − Retrospective; |
| [56] | Retrospective empirical | GBM patients with new or enlarging lesions were labeled pseudoprogression (PsP) or true progression (TP) clinically and histologically. Coregistered T1/T2 MRIs trained a 3-D Densenet121 model using five-fold cross-validation to predict PsP versus TP. | USA | 124 glioblastoma (GBM) patients met criteria; 63 labeled PsP and 61 labeled TP. | Glioblastoma (GBM) | DL with 3D convolutional neural networks: DenseNet-121 using transfer learning and ResNet-based architectures | DL model achieved mean accuracy 76.4% (70–84%), AUROCC 0.7560 (0.6553–0.8535), sensitivity 88.7% (SD 6.86), specificity 62.1% (SD 9.11), effectively distinguishing PsP from TP. | + Uses standard-of-care multi-parametric MRI; provides automated end-to-end classification − Requires larger multi-institutional validation. |
| [57] | Retrospective multi-cohort empirical study | Developed a multi-classifier system integrating lncRNA-based classifier (RNA-seq, quantitative reverse transcription polymerase chain reaction (qRT-PCR), LASSO Cox regression), DL WSI-based classifier (EfficientNet on Haematoxylin and Eosin Formalin-Fixed Paraffin Embedded Tissue (H&E FFPE slides)), and clinicopathological classifier (stage, grade via Cox regression); validated across training, independent, and TCGA cohorts | China (South, East, North; five hospitals) and USA (TCGA cohort); multicentre retrospective study using FFPE tissues, RNA-seq, WSIs, and clinical data). | 793 pRCC patients (stage I–III): 382 training (South/East China), 207 validation (North China), 204 TCGA (USA); plus 53 paired tumour/normal discovery samples for RNA-seq. | Papillary Renal Cell Carcinoma (pRCC) | lncRNA-based classifier (RNA-seq, qRT-PCR, LASSO Cox regression); DL WSI-based classifier (EfficientNet on H&E FFPE slides); clinicopathological classifier (stage, grade via Cox regression); nomogram construction; Kaplan–Meier survival analysis; multivariate Cox regression; Harrell’s C-index for discrimination | Multi-classifier system achieved significantly higher predictive accuracy for RFS than single classifiers (C-index 0.831–0.858 vs. 0.642–0.777, p < 0.05). High-risk stage I/II and grade 1/2 groups had worse RFS than low-risk stage III and grade 3/4 groups (p < 0.05). | + Large multicentre validation − Retrospective manual tumour annotation |
| [58] | Retrospective empirical | Retrospective study of 101 stage III colon cancers (West China Hospital); CNN segmentation of H&E slides with tissue-proportion feature extraction; multiple classifiers compared, Gradient Boosting Decision Tree selected; Cox survival modelling applied; predictive performance validated internally (n = 67, WCH) and externally (n = 47, TCGA) | China (West China Hospital) + TCGA database for external validation (USA) | 168 stage III colon adenocarcinoma patients (West China Hospital, 2008–2015); curative resection plus FOLFOX/CAPOX chemotherapy; complete follow-up, H&E slides analysed; cohorts split into training (101), validation (67), external TCGA (47) | Colon Cancer | Model training with CNNs (Visual geometry group 19-layer network (VGG19), Residual Neural Network (50-layer architecture [ResNet50], InceptionV3, InceptionResNetV2); InceptionResNetV2 selected for H&E patch segmentation; tissue-proportion feature extraction; Gradient Boosting Decision Tree classifier construction; five-fold cross-validation, Jackknife testing; Cox proportional hazards modelling; internal (WCH) and external (TCGA) validation; implemented in Python (scikit-learn, Adam optimizer) | Gradient Boosting-Colon model yielded strong prognostic power: HR for high vs. low recurrence 8.976 (CI 2.824–28.528, p < 0.001) and 10.273 (CI 2.177–48.472, p = 0.003); HR for poor vs. good prognosis 10.687 (CI 2.908–39.272, p = 0.001) and 5.033 (CI 1.792–14.132, p = 0.002). Independent predictor enabling direct stratification of stage III colon cancers into recurrence and prognosis groups from H&E slides | + Multicenter validation; survival modelling; full-slide analysis. − Retrospective; modest sample size |
| [59] | Retrospective multicentre DL study | Retrospective, multicentre study; Haematoxylin- Eosin-(H&E) stained whole-slide images digitized and analysed; progression defined as recurrence/metastasis within 2 years; federated transformer-based DL model developed for risk prediction and interpretability. | Germany (Cologne, Bonn, Munich) | Total 252 patients across three centres; cohorts included progression (n = 106 tumours) and non-progression (n = 174 tumours) cases; all had HE-stained whole-slide images digitized for analysis | Cutaneous Squamous Cell Carcinoma | Federated transformer-based DL model using RoBERTa encoder; WSIs pre-processed with EfficientNet feature extraction and multiple instance learning; parameter-efficient fine-tuning with attention pooling; interpretability via Integrated Gradients heatmaps and HoverNet nuclei segmentation; handcrafted cellular composition features analyzed with XGBoost for progression prediction. | AUROC 0.92 internal; 0.82 federated; HR up to 7.42; PFS separation significant | + Multicentre FL; Explainability; Survival modelling; Cellular-level features − Retrospective; Cohort imbalance; Generalization variance pre-FL |
| [60] | Empirical (Retrospective multicentric study) | Whole-slide imaging (WSI) + graph construction + multimodal DL + Cox regression, applied to retrospectively collected WSIs and clinical data, with an 80/20 train–internal validation split and external validation | China (Sun Yat-sen University Cancer Center) & Hong Kong (Chinese University of Hong Kong) | 1949 patients total; 1849 from SYSUCC and 100 from CUHK. | Nasopharyngeal Carcinoma (NPC) | Graph Neural Network (GCN), Foundation model, Contrastive Oncology Representation Learning (CONCH), graph-based multimodal DL, and multimodal DL combining GCN with a Fully Connected Layer (FCN), using CONCH as a feature extractor | External validation yielded C-indices of 0.775 for distant metastasis-free survival (DMFS), 0.814 for OS, and 0.647 for local recurrence-free survival (LRFS) (all p < 0.001). The GNPC score achieved C-indices of 0.683 and 0.775 for 5-year DMFS in internal and external cohorts, respectively (p < 0.001). | + First multicentric study using DL with WSIs for NPC; consistently outperformed TNM staging. − Molecular data limited to specific cohorts |
| [61] | Retrospective multicenter | End-to-end multimodality DLR with 3D CNN on PET/CT predicted 5-year PFS; TNM stage integrated; compared against conventional radiomics; risk stratification performed using clinical, radiomics, and DLR signatures. | China (Fudan University Shanghai Cancer Center, Shanghai Proton and Heavy Ion Center) | Medical records of 281 NPC patients from FUSCC and 178 from SPHIC screened; eligibility TNM stage III/IVa, ≥5-year follow-up. Finally, 170 FUSCC and 87 SPHIC enrolled. | Nasopharyngeal Carcinoma (NPC) | 3D CNN; end-to-end DL; PET/CT fusion; data augmentation; cross-entropy optimization | Multimodality DLR using PET/CT achieved superior prognostic performance (AUC 0.842/0.823) over conventional radiomics and single-modality models, enabling significant risk stratification; clinical signature failed externally (p = 0.177). | + External validation + Multimodality fusion + Robust comparison − Moderate sample size |
| [62] | Retrospective radiomics ML study | PET/CT radiomics and CP variables analyzed; features extracted via PyRadiomics with robustness testing. Models trained using LR, RF, Gradient Boosting, XGBoost, CatBoost; fusion strategies applied with nested cross-validation and synthetic minority over-sampling technique (SMOTE) for class imbalance. | United States, specifically at Stanford University and the Palo Alto Veterans Affairs Medical Center (California). | 211 NSCLC patients from the cancer imaging archive (tcia) cohorts R01 (Stanford, Palo Alto VA, 2008–2012) and AMC (Stanford). Focused on R01; after exclusions, 131 remained, with 38 recurrences (29%) monitored eight years. | Non-Small Cell Lung Cancer (NSCLC) | ElasticNet LR; RF; Gradient Boosting; XGBoost; CatBoost; Multimodal fusion | CT with Elastic Net achieved highest single-modality AUC (0.679). Fusion PET + CT + Clinical late fusion improved performance (AUC 0.811), showing stronger discrimination, better calibration, higher clinical benefit, and clearer survival stratification. | + Multimodal fusion + Decision curve analysis + Survival validation − Single-center and external validation |
| [63] | Retrospective Empirical | CT Radiomic analysis of CT images using Hessian index of differential topology; voxel-wise eigenvalue computation to capture tumour heterogeneity; signatures built from conventional, Hessian, and combined features; prognostic value assessed via survival curve comparison (log-rank test) | Training cohort: United States (MD Anderson Cancer Center, TCIA Grossberg dataset). Test cohort: Canada (multi-institutional TCIA Vallières dataset: Hôpital général juif, CHU Sherbrooke, Hôpital Maisonneuve-Rosemont, Centre hospitalier universitaire de Montréal) | 126 head-and-neck cancer patients in training cohort; CT imaging used to extract conventional and Hessian index features; patients stratified into low- and high-risk groups for survival analysis; test n = 68 | Head-and-Neck Cancer | CT-based radiomics pipeline; Hessian index images generated via Gaussian filtering and voxel-wise eigenvalue computation; feature extraction (histogram, texture, wavelet); Coxnet algorithm for feature selection; radiomic signature construction; Cox proportional hazards modelling; integration with clinical variables; artifact robustness assessment | In test cohort (n = 68), models built with conventional, index, combined features, and clinical variables yielded p = 2.95 × 10⁻², 1.85 × 10⁻², 3.17 × 10⁻², and 1.87 × 10⁻³, respectively. Integration with clinical variables improved prognostic power (conventional p = 3.53 × 10⁻³; index p = 1.28 × 10⁻³; combined p = 1.45 × 10⁻³). Index features provided superior prognostic information, enhancing clinical variable prediction in HN cancer patients | + Multiscale heterogeneity modelling; artifact analysis. − Moderate sample size. |
| [64] | Retrospective multicenter empirical study | FDG PET/CT images and clinical data collected retrospectively. Models trained on clinical and radiomics features, compared with CNNs using PET/CT images ± Gross Tumour Volume (GTV). Performance evaluated by accuracy, AUC, Matthews correlation coefficient (MCC), and F1 scores. | Norway (Oslo University Hospital) and Netherlands (Maastricht Radiation Oncology Clinic). | HNSCC patients treated with radio(chemo)therapy at Oslo University Hospital (n = 139, 2007–2013) and Maastricht University Medical Center (n = 99, 2008–2014). Inclusion: oral cavity, oropharynx, hypopharynx, larynx; staged per AJCC TNM8 | Head-and-neck squamous cell carcinoma (HNSCC) | Conventional ML (LR, RF); DL fully connected neural network (FCNNS) (with/without interaction) on tabular data; EfficientNet3D CNNs on PET/CT images ± GTV contours; feature selection via RENT; interpretability with VarGrad. | CNNs trained on images achieved AUCs 65–75% for OS/DFS, rivaling radiomics-clinical models. Combining radiomics with clinical factors improved OS prediction. Feature selection discarded key information, reducing external generalisability, while multimodal integration enhanced performance across cohorts | + External validation − Moderate overall predictive performance |
| [65] | Retrospective Empirical | Formalin-fixed paraffin-embedded (FFPE) slides collected and reviewed; proteomic profiling via pressure cycling technology, TMTpro labeling, LC-MS/MS acquisition; differential protein expression analysis; immune microenvironment profiled with Cell-Type Identification by Estimating Relative Subsets of RNA Transcripts (CIBERSORTx); multiplex immunohistochemistry performed; recurrence risk modeled using Cox proportional hazards and random survival forests; stratification validated in independent test cohort | China (First Hospital of China Medical University) | 234 patients: 85 pediatric malignant (≤18 year), 83 pediatric benign, 66 adult malignant nodules; all surgically treated; follow-up imaging and thyroid function monitoring performed. | Pediatric Papillary Thyroid Carcinoma (PPTC) | Random Survival Forest (ProtRsf); Cox proportional hazard model; LASSO; Grid search; 3-fold cross-validation | ML model achieved 88.24% accuracy, stratifying PPTC patients into high- and low-risk recurrence groups for individualized treatment. | + Large proteomic depth (10,426 proteins) − Single center; Limited recurrence events (n = 12) |
| [66] | Retrospective empirical cohort | Surveillance, epidemiology, and end results (SEER) database analysis (2010–2018); SMOTE for imbalance; Boruta + LR for feature selection; eight ML models compared; SHAP for interpretability | USA (SEER registry) | 20,346 Hepatocellular carcinoma (HCC) patients; independent risk factors identified (age, race, TNM stage, metastases, treatment variables) | Hepatocellular carcinoma (HCC) with pulmonary metastasis | RF (best performer), LR, other ML models; SHAP for feature importance | RF achieved AUC 0.894 (training) and 0.830 (validation); web-based tool developed for clinical use | + Large population-based dataset + Rigorous feature selection and SHAP interpretability − Retrospective registry design and no external non-SEER validation. |
| [67] | Retrospective cohort (multicentre empirical study) | Analyses via whole-slide H&E imaging. Tile extraction and dual DL pipeline (cSCCNet) applied with cross-validation, multivariate Cox regression, and 20% hold-out testing. Model stratified metastatic risk into high/low categories with explainable heatmaps. | UK pathology centres (Glasgow’s Queen Elizabeth Hospital, Cheltenham General Hospital, Southampton General Hospital and Barts Health NHS Trust) | 227 patients with primary cSCC with known metastasis outcomes and associated clinical archival tissue. | Cutaneous squamous cell carcinoma (cSCC) | DL framework integrating ResNet50 with ImageNet transfer learning, dual-model pipeline, and automated ROI selection; cSCCNet employing InceptionV3-based feature extraction with heatmap-driven explainability. | The model achieved AUC 0.95, accuracy 95%, sensitivity 93%, and specificity 96%, outperforming Brigham and Women’s Hospital Staging System (BWH) and American Joint Committee on Cancer Staging System [8th Edition] (AJCC8) staging systems as an independent predictor of metastasis. | + Multicentre cohort; + Explainability heatmaps; validation − Focused on metastasis only |
| [68] | Empirical (Multicentre retrospective cohort) | Multicentre study collecting raw CT images; development of a robust federated learning model (RFLM); comparison with traditional federated learning (FL) algorithms; five random permutations for robustness evaluation. | China (4 medical centres) | 641 postoperative gastric cancer patients (R-AGC vs. NR-AGC) | Gastric Cancer | RFLM (ResNet18 + Convolutional Block Attention Module (CBAM)), WGAN, GCN, Sparse Bayesian extreme learning machine (ELM); Comparison with FedAvg, FedProx, Moon, HarmoFL, pFedMe, and pFedFSL. | The RFLM achieved AUC values ranging from 0.710 to 0.869 across four centres, reducing misdiagnosis by 42.23% and improving overall accuracy by 32.36% compared to the clinical model. | + Multicentre robustness; + Federated privacy; + Radiomic interpretability; − No external international validation |
| [69] | Retrospective empirical | Preoperative low-dose CT and histologic H&E features extracted; integrated DL evaluation (IDLE) applied to predict recurrence/progression risk; added value assessed against TNM staging and tumour grade for risk stratification. | United States; data derived from the National Lung Screening Trial (NLST) conducted across 10 LSS clinical centers and ACRIN pathology core laboratory. | 182 stage IA NSCLC patients from the U.S. NLST; pathologically confirmed, underwent primary lung tumour surgery within 2 years of last low dose computed tomography (LDCT) screening | Non-Small Cell Lung Cancer (NSCLC) | Multilayer Perceptron (MLP); Random Survival Forest; Integrated DL Evaluation (IDLE) | integrated DL evaluation (IDLE) achieved a superior 5-year AUC (0.817 ± 0.037) vs. TNM (0.561 ± 0.042) and grade (0.573 ± 0.044); IDLE score significantly associated with recurrence (p < 0.0001) after adjustment; synergy of CT and histology markers drove improved prognostic accuracy; integration enhanced risk stratification beyond TNM and grade | + Multiplatform integration; long follow-up; survival modelling. − Retrospective; small sample; cross-validation only |
| [70] | Retrospective empirical cohort | Bayesian Sequential Network developed via constructive approach; hypotheses tested sequentially with prior results guiding. Experiments used 250-patient learning set, evaluated by 5-fold cross-validation on five 50-patient test sets, with holdout set assessing best model performance. | Canada (Quebec City, tertiary care center, Urology Department) | 295 high-grade prostate cancer (PCa) patients (Gleason ≥8) treated with RP + PLND, 2011–2020 | Prostate Cancer (PCa) | Bayesian Sequential Network (BSN); U-NEXtractor; CNN; U-Net; multi-task learning; PET/CT feature extraction. | Improved imaging for Lymph Node Invasion (LNI) and Biochemical Recurrence-Free Survival (BCR-FS) through multi-task learning enhanced survival prediction. BSN outperformed nomograms; BSN also proffer automated segmentation, uncertainty quantification, personalized features, and dynamic prediction for long-term prognosis. | + Multi-task survival modelling + Multimodal integration − Single-institution dataset. |
| [71] | Empirical (Retrospective multicenter analyses) | Feature extraction (CT + FDG-PET); MRMR + univariate selection; Cox proportional hazards; longitudinal CT/PET imaging (baseline and week 3–5); ComBat harmonization; Boruta feature selection; RF modelling. | Germany | 55 patients (37 exploratory, 18 validation) | Advanced head-and-neck squamous cell carcinoma (HNSCC). | RF; Boruta algorithm for feature selection; ComBat for batch effect harmonization | CT imaging demonstrated the best prognostic performance with a C-index of 0.78. FDG-PET features from week three provided significant stratification (p = 0.044, p < 0.001) but led to imbalanced risk groups, highlighting the need for further evaluation on larger datasets. | + Independent validation; longitudinal imaging. − Small sample size; imbalanced risk groups |
| [72] | Empirical (Retrospective cohort study) | Deep transfer learning model implemented with BERT embeddings, attention weighting, RNN aggregation, and Cox-PH survival prediction. High-/low-risk features extracted via N-gram clustering; patient embeddings visualized with t-SNE; performance evaluated using C-index, AUROC, log-rank test, and correlation analyses. | South Korea (Yonsei Cancer Center, Seoul, Korea) | 4338 patients with available rectal MRI radiological reports were analysed. | Rectal cancer | Deep transfer learning NLP, BERT embeddings, attention weighting, Gated Recurrent Unit (GRU) aggregation, Cox-PH survival modelling, N-gram clustering for risk features, t-SNE visualization of patient embeddings. | ClinicalBERT achieved best survival prediction. Serial MRI reports improved C-index (0.667 vs. 0.626). Model stratified risk groups (p < 0.002), predicted risk correlated strongly with survival, outperforming CEA, with higher AUROC values. | + Large cohort; + Captures longitudinal progression through serial reports − Limited to text data rather than raw images. |
| [73] | In silico empirical modelling | Tumour growth modeled with logistic ODEs and immune–tumour competition; deep reinforcement learning (PPO-Clip) with noise injection; performance evaluated via RMSE/MAE; mathematical modelling of tumour-immune-drug interactions; RL training compared PPO, Genetic Algorithm (GA), and traditional dosing. | China | Simulated tumour system (normal, tumour, immune cells) | General Solid Tumours (growth modelling). | Under identical experimental conditions, ablation experiments compared three mainstream algorithms: PPO, Deep Deterministic Policy Gradient (DDPG), and Soft Actor-Critic (SAC). | Significant tumour suppression; MAE reduced (0.346 → 0.318 with noise training); RMSE improved; sustained suppression after drug cessation | + Adaptive dosing − No patient dataset − Purely simulation |
| [74] | Empirical (Simulation-study) | In silico tumour growth simulations (2D, 100 runs) were conducted using the Linear-Quadratic (LQ) and Lyman NTCP models. Reinforcement Learning agents (SARSA/Q-learning) were trained, with feature selection and predictive modelling integrated into the workflow | Belgium | Simulated (2D, 100 runs) tumour model (rectum, head and neck, lung) | Rectal cancer; head and neck cancer; lung cancer | Reinforcement learning—state-action-reward-state-action (SARSA); tumour growth modelling (linear-quadratic (LQ) model) | Normal Tissue Complication Probability (NTCP) reduction: Rectum −10.74%; head and neck −49.1%; Lung −37.5%; reduced fractions and duration. | + Integrated RL, NTCP and tumour growth modelling − No clinical dataset |
| [75] | Empirical (Simulation-based experimental study) | Virtual environment simulated tumour dynamics under RT; deep reinforcement learning (DRL) optimized fractionation; PSI and LQ models predicted responses; SVM segmented parameter space under uncertainty, identifying patients robust to noise while preserving local regional control (LRC). | China | Personalised de-escalation plans were compared to conventional radiotherapy (RT) in a cohort of 5000 virtual patients | Head-and-Neck Squamous Cell Carcinoma (HNSCC) | DRL; Proliferation Saturation Index model; Support Vector Machine | Personalized fractionation reduced tumour dose and Organ at Risk Biologically Effective Dose (OAR BED) by 29%, average reduction 5.61 ± 2.96 Gy; prognostic outcomes nearly identical, 99.8% low-risk LRC failure. | + Dynamic tumour modelling; + Reinforcement learning optimization. + Noise robustness analysis − Virtual cohort with no clinical validation |
| [76] | Retrospective multicenter cohort | Radiomics features extracted from pre-ICI NSCLC scans using PyRadiomics and DeepRadiomics. Discovery and validation cohorts from multiple centers. Images harmonized; multivariable models with cross-validation estimated predictive value of clinical variables, PD-L1 expression, and radiomics for six-month progression-free survival (pfs-6). | Canada (Centre Hospitalier de l’Université de Jewish General Hospital; Institut Universitaire de Cardiologie et de Pneumologie de Québec—Université Laval; Centre Hospitalier Universitaire de Sherbrooke) | 642 advanced stage III/IV NSCLC patients treated with anti-programmed cell death protein 1 (PD-1) ± chemotherapy (2015–2021, pre-ICI CT scans) across four Canadian academic centers, split into discovery cohort (512, three centers) and validation cohort (130, fourth center). | Non-Small Cell Lung Cancer | PyRadiomics, DeepRadiomics, SimCLR contrastive learning, VGG16 backbone, LR, XGBoost, and GHPS | Clinical + programmed death ligand 1 (PD-L1) achieved AUC 0.66 (discovery) and 0.62 (validation). Without harmonization, Clinical + PyRadiomics/DeepRadiomics dropped from 0.69 (discovery) to 0.57/0.52 (validation). Harmonization improved reproducibility: Clinical + DeepRadiomics sustained AUC 0.67 (discovery) and 0.63 (validation). | + Multicenter validation + External validation cohort − Retrospective design and limited to CT modality. |
| [90] | Empirical DL study | DeepLRHE CNN analyzed histopathology images; tumour region detection, normalization, biomarker identification, classification; trained on 110 the cancer genome atlas (TCGA) samples, tested on 101 samples; 5-fold cross-validation was applied. | United States (Multi-institutional study) | 110 lung cancer samples from TCGA used for training/validation; 101 independent TCGA samples served as test dataset. | Lung cancer (adenocarcinoma and Squamous carcinoma) | CNN; ResNet residual blocks; Deep Convolutional Gaussian Mixture Model (DCGMM); GridSearchCV; Heatmap generation | AUC 0.79 (test); Sensitivity 0.84; Specificity 0.67; F1 0.81 | + Direct recurrence modelling; -Small dataset. |
References
- World Health Organisation. Cancer. 2025. Available online: https://www.who.int/news-room/fact-sheets/detail/cancer (accessed on 12 April 2026).
- The International Agency for Research on Cancer. Cancer Factsheets. 2022. Available online: https://gco.iarc.who.int/media/globocan/factsheets/cancers/39-all-cancers-fact-sheet.pdf (accessed on 12 April 2026).
- National Cancer Institute. Cancer Statistics. 2025. Available online: https://www.cancer.gov/about-cancer/understanding/statistics (accessed on 12 April 2026).
- World Health Organization. Global Cancer Burden Growing, Amidst Mounting Need for Services. 2024. Available online: https://www.who.int/news/item/01-02-2024-global-cancer-burden-growing--amidst-mounting-need-for-services#:~:text=Over%2035%20million%20new%20cancer%20cases%20are,a%20key%20driver%20of%20environmental%20risk%20factors (accessed on 12 April 2026).
- Kim, H.T. Competing risks data in clinical oncology. Front. Oncol. 2024, 14, 1360266. [Google Scholar] [CrossRef] [Scilit] [PubMed]
- Li, H.; Fu, G.; Wei, W.; Huang, Y.; Wang, Z.; Liang, T.; Tian, S.; Chen, H.; Zhang, W. Re-Evaluation of the Survival Paradox Between Stage IIB/IIC and Stage IIIA Colon Cancer. Front. Oncol. 2020, 10, 595107. [Google Scholar] [CrossRef] [Scilit] [PubMed]
- Gillies, R.J.; Kinahan, P.E.; Hricak, H. Radiomics: Images are more than pictures, they are data. Radiology 2016, 278, 563–577. [Google Scholar] [CrossRef] [Scilit] [PubMed]
- Gitto, S.; Cuocolo, R.; Emili, I.; Tofanelli, L.; Chianca, V.; Albano, D.; Messina, C.; Imbriaco, M.; Sconfienza, L.M. Effects of Interobserver Variability on 2D and 3D CT- and MRI-Based Texture Feature Reproducibility of Cartilaginous Bone Tumors. J. Digit. Imaging 2021, 34, 820–832. [Google Scholar] [CrossRef] [Scilit] [PubMed]
- Quinn, L.; Tryposkiadis, K.; Deeks, J.; De Vet, H.C.; Mallett, S.; Mokkink, L.B.; Takwoingi, Y.; Taylor-Phillips, S.; Sitch, A. Interobserver variability studies in diagnostic imaging: A methodological systematic review. Br. J. Radiol. 2023, 96, 20220972. [Google Scholar] [CrossRef] [Scilit]
- Cavinato, L.; Pegoraro, M.; Ragni, A.; Sollini, M.; Erba, P.A.; Ieva, F. Imaging-based representation and stratification of intra-tumor heterogeneity via tree-edit distance. Sci. Rep. 2022, 12, 19607. [Google Scholar] [CrossRef] [Scilit] [PubMed]
- Lai, Q.; Teng, X.; Zhang, J.; Zhang, X.; Jiang, Y.; Pu, Y.; Yu, P.; Li, W.; Li, T.; Cai, J.; et al. Tumor Imaging Heterogeneity Index-Inspired Insights into the Unveiling Tumor Microenvironment of Breast Cancer. Int. J. Mol. Sci. 2025, 26, 11624. [Google Scholar] [CrossRef] [Scilit]
- Deshmukh, A.; Dhar, H.; Thomas, A.E.; D’Cruz, A.K. Cancer Staging. In Tata Memorial Centre Textbook of Oncology; Badwe, R.A., Gupta, S., Shrikhande, S.V., Laskar, S., Eds.; Springer: Singapore, 2024. [Google Scholar] [CrossRef] [Scilit]
- Xue, J.; Chen, Y.; Xue, C.; Yin, Q.; Lai, R.; Chen, L.; Wang, M. Limitations of applying the COX proportional hazards model to glioma studies. J. Transl. Med. 2024, 22, 1156. [Google Scholar] [CrossRef] [Scilit]
- Esteva, A.; Chou, K.; Yeung, S.; Naik, N.; Madani, A.; Mottaghi, A.; Liu, Y.; Topol, E.; Dean, J.; Socher, R. Deep learning-enabled medical computer vision. npj Digit. Med. 2021, 4, 5. [Google Scholar] [CrossRef] [Scilit] [PubMed]
- Bi, W.L.; Hosny, A.; Schabath, M.B.; Giger, M.L.; Birkbak, N.J.; Mehrtash, A.; Allison, T.; Arnaout, O.; Abbosh, C.; Dunn, I.F.; et al. Artificial intelligence in cancer imaging: Clinical challenges and applications. CA Cancer J. Clin. 2019, 69, 127–157. [Google Scholar] [CrossRef] [Scilit] [PubMed]
- Lipkova, J.; Chen, R.J.; Chen, B.; Lu, M.Y.; Barbieri, M.; Shao, D.; Vaidya, A.J.; Chen, C.; Zhuang, L.; Williamson, D.F.K.; et al. Artificial intelligence for multimodal data integration in oncology. Cancer Cell. 2022, 40, 1095–1110. [Google Scholar] [CrossRef] [Scilit] [PubMed]
- Jang, H.J.; Lee, S.H. AI-Driven Digital Pathology: Deep Learning and Multimodal Integration for Precision Oncology. Int. J. Mol. Sci. 2026, 27, 379. [Google Scholar] [CrossRef] [Scilit] [PubMed]
- Huang, Y.Q.; Chen, X.B.; Cui, Y.F.; Yang, F.; Huang, S.X.; Li, Z.H.; Ying, Y.J.; Li, S.Y.; Li, M.H.; Gao, P.; et al. Enhanced risk stratification for stage II colorectal cancer using deep learning-based CT classifier and pathological markers to optimize adjuvant therapy decision. Ann. Oncol. 2025, 36, 1178–1189. [Google Scholar] [CrossRef] [Scilit] [PubMed]
- Picone, C.; Fusco, R.; Granata, V.; Ottaiano, A.; Brunese, M.C.; Mormile, R.; Petrillo, A. Artificial intelligence and radiological imaging in oncology: State of the art and future perspectives. J. Med. Imaging Interv. Radiol. 2025, 12, 41. [Google Scholar] [CrossRef] [Scilit]
- Xu, Y.; Li, Y.; Wang, F.; Zhang, Y.; Huang, D. Addressing the current challenges in the clinical application of AI-based Radiomics for cancer imaging. Front. Med. 2025, 12, 1674397. [Google Scholar] [CrossRef] [Scilit]
- Huang, M.; Law, H.K.W.; Tam, S.Y. Radiomics-Driven Tumor Prognosis Prediction Across Imaging Modalities: Advances in Sampling, Feature Selection, and Multi-Omics Integration. Cancers 2025, 17, 3121. [Google Scholar] [CrossRef] [Scilit] [PubMed]
- Zheng, Q.; Yang, L.; Zeng, B.; Li, J.; Guo, K.; Liang, Y.; Liao, G. Artificial intelligence performance in detecting tumor metastasis from medical radiology imaging: A systematic review and meta-analysis. EClinicalMedicine 2021, 31, 100669. [Google Scholar] [CrossRef] [Scilit] [PubMed]
- Yuan, X.; Xu, H.; Zhu, J.; Yang, Z.; Pan, B.; Wu, L.; Chen, H. Systematic review and meta-analysis of artificial intelligence for image-based lung cancer classification and prognostic evaluation. npj Precis. Oncol. 2025, 9, 300. [Google Scholar] [CrossRef] [Scilit]
- Thong, L.T.; Chou, H.S.; Chew, H.S.J.; Lau, Y. Diagnostic test accuracy of artificial intelligence-based imaging for lung cancer screening: A systematic review and meta-analysis. Lung Cancer 2023, 176, 4–13. [Google Scholar] [CrossRef] [Scilit] [PubMed]
- Granata, V.; Fusco, R.; Setola, S.V.; Santorsola, M.; Ottaiano, A.; Cerrone, M.; Pizza, N.; Ferrara, G.; Zerunian, M.; Caruso, D.; et al. An Update of AI and Radiomics in Precision Oncology: Insights from Liver Tumors as Case Models. Technol. Cancer Res. Treat. 2025, 24, 15330338251387928. [Google Scholar] [CrossRef] [Scilit] [PubMed]
- Termure, D.A.; Badea, M.E.; Donci, D.D.; Petre, G.E. Artificial Intelligence and radiomics in cervical lymph node staging for head and neck squamous cell carcinoma: A narrative review. Rom. J. Stomatol. 2025, 71, 259–266. [Google Scholar] [CrossRef] [Scilit]
- Mohideen, K.; Ghosh, S.; Krithika, C.; Mulk, B.S.; Chole, R.; Chatterjee, J.; Dhungel, S. Application of artificial intelligence and radiomics in the prediction of lymph node metastasis and tumour grading of oral cancer—A systematic review and meta analysis. BMC Oral Health 2026, 26, 142. [Google Scholar] [CrossRef] [Scilit] [PubMed]
- Broggi, G.; Maniaci, A.; Lentini, M.; Palicelli, A.; Zanelli, M.; Zizzo, M.; Koufopoulos, N.; Salzano, S.; Mazzucchelli, M.; Caltabiano, R. Artificial Intelligence in Head and Neck Cancer Diagnosis: A Comprehensive Review with Emphasis on Radiomics, Histopathological, and Molecular Applications. Cancers 2024, 16, 3623. [Google Scholar] [CrossRef] [Scilit] [PubMed]
- Navarro-Ballester, A. Artificial intelligence-driven radiological biomarkers: A narrative review of artificial intelligence in meningioma diagnosis. NeuroMarkers 2025, 2, 100033. [Google Scholar] [CrossRef] [Scilit]
- Govindarajan, V. Early Detection and Risk Stratification of Osteosarcoma, A Rare Tumor, Using Artificial Intelligence: A Systematic Review. Adv. Artif. Intell. Mach. Learn. 2025, 5, 3900. [Google Scholar] [CrossRef] [Scilit]
- Ma, T.; Wang, H.; Ye, Z. Artificial intelligence applications in computed tomography in gastric cancer: A narrative review. Transl. Cancer Res. 2023, 12, 2379. [Google Scholar] [CrossRef] [Scilit] [PubMed]
- Lu, J.; Zhang, H.; Yuan, Z.; Yue, J.; Yao, Q.; Liu, Y.; Jie, P.; Fan, M.; Zhao, J. Image-based artificial intelligence for preoperative differentiation of pancreatic cancer from pancreatitis: A systematic review and meta-analysis. Front. Oncol. 2026, 15, 1660271. [Google Scholar] [CrossRef] [Scilit]
- Morelli, I.; Banini, M.; Greto, D.; Visani, L.; Garlatti, P.; Loi, M.; Aquilano, M.; Valzano, M.; Salvestrini, V.; Bertini, N.; et al. Integrating Radiomics and Artificial Intelligence (AI) in Stereotactic Body Radiotherapy (SBRT)/Stereotactic Radiosurgery (SRS): Predictive Tools for Tailored Cancer Care. Cancers 2025, 17, 2906. [Google Scholar] [CrossRef] [Scilit] [PubMed]
- Moher, D.; Liberati, A.; Tetzlaff, J.; Altman, D.G. Preferred reporting items for systematic reviews and meta-analyses: The PRISMA statement. BMJ 2009, 339, b2535. [Google Scholar] [CrossRef] [PubMed]
- Page, M.J.; McKenzie, J.E.; Bossuyt, P.M.; Boutron, I.; Hoffmann, T.C.; Mulrow, C.D.; Shamseer, L.; Tetzlaff, J.M.; Akl, E.A.; Brennan, S.E.; et al. The PRISMA 2020 statement: An updated guideline for reporting systematic reviews. BMJ 2021, 372, n71. [Google Scholar] [CrossRef] [Scilit] [PubMed]
- Caldwell, P.H.Y.; Bennett, T. Easy guide to conducting a systematic review. J. Paediatr. Child. Health 2020, 56, 853–856. [Google Scholar] [CrossRef] [Scilit] [PubMed]
- Khan, K.S.; Kunz, R.; Kleijnen, J.; Antes, G. Five steps to conducting a systematic review. J. R. Soc. Med. 2003, 96, 118–121. [Google Scholar] [CrossRef] [Scilit] [PubMed]
- Hong, Q.N.; Fàbregues, S.; Bartlett, G.; Boardman, F.; Cargo, M.; Dagenais, P.; Gagnon, M.-P.; Griffiths, F.; Nicolau, B.; O’Cathain, A.; et al. The Mixed Methods Appraisal Tool (MMAT) version 2018 for information professionals and researchers. Educ. Inf. 2018, 34, 285–291. [Google Scholar] [CrossRef] [Scilit]
- Lai, P.H.; Chen, X.B.; Pei, W.; Huang, X.; Fang, Z.; Yang, F.; Ying, Y.J.; Song, Y.X.; Jin, W.F.; Lu, S.L.; et al. Development and validation of an MRI radiomics-based interpretable machine learning model for predicting the progression-free survival in locally advanced nasopharyngeal carcinoma. Quant. Imaging Med. Surg. 2025, 300, 5347–5361. [Google Scholar] [CrossRef] [Scilit] [PubMed]
- Pei, W.; Wang, C.; Liao, H.; Chen, X.; Wei, Y.; Huang, X.; Liang, X.; Bao, H.; Su, D.; Jin, G. MRI-based random survival Forest model improves prediction of progression-free survival to induction chemotherapy plus concurrent Chemoradiotherapy in Locoregionally Advanced nasopharyngeal carcinoma. BMC Cancer 2022, 22, 739. [Google Scholar] [CrossRef] [Scilit] [PubMed]
- Shen, H.; Wang, Y.; Liu, D.; Lv, R.; Huang, Y.; Peng, C. Predicting Progression-Free Survival Using MRI-Based Radiomics for Patients With Nonmetastatic Nasopharyngeal Carcinoma. Front. Oncol. 2020, 10, 618. [Google Scholar] [CrossRef] [Scilit] [PubMed]
- Xu, H.; Abdallah, N.; Marion, J.M.; Chauvet, P.; Tauber, C.; Carlier, T.; Lu, L.; Hatt, M. Radiomics prognostic analysis of PET/CT images in a multicenter head and neck cancer cohort: Investigating ComBat strategies, sub-volume characterization, and automatic segmentation. Eur. J. Nucl. Med. 2023, 50, 1720–1734. [Google Scholar] [CrossRef] [Scilit] [PubMed]
- Zhong, J.; Frood, R.; Brown, P.; Nelstrop, H.; Prestwich, R.; Mcdermott, G.; Currie, S.; Vaidyanathan, S.; Scarsbrook, A.F. Machine learning-based FDG PET-CT radiomics for outcome prediction in larynx and hypopharynx squamous cell carcinoma. Clin. Radiol. 2021, 76, 78.e9–78.e17. [Google Scholar] [CrossRef] [Scilit] [PubMed]
- Liu, S.; Li, R.; Liu, Q.; Sun, D.; Yang, H.; Pan, H.; Wang, L.; Song, S. Radiomics model of 18F-FDG PET/CT imaging for predicting disease-free survival of early-stage uterine cervical squamous cancer. Cancer Biomark. 2022, 33, 249–259. [Google Scholar] [CrossRef] [Scilit] [PubMed]
- Volovat, C.-C.; Scripcariu, D.-V.; Boboc, D.; Volovat, S.-R.; Vasilache, I.-A.; Ursulescu-Lupascu, C.; Gheorghe, L.; Baean, L.-M.; Volovat, C.; Scripcariu, V. Machine Learning-Based Algorithms for Enhanced Prediction of Local Recurrence and Metastasis in Low Rectal Adenocarcinoma Using Imaging, Surgical, and Pathological Data. Diagnostics 2024, 14, 625. [Google Scholar] [CrossRef] [Scilit] [PubMed]
- Hu, J.; Sheng, Y.; Ma, J.; Tang, Y.; Liu, D.; Zhang, J.; Wei, X.; Yang, Y.; Liu, Y.; Zhang, Y.; et al. Construction and validation of a progression prediction model for locally advanced rectal cancer patients received neoadjuvant chemoradiotherapy followed by total mesorectal excision based on machine learning. Front. Oncol. 2024, 13, 1231508. [Google Scholar] [CrossRef] [Scilit] [PubMed]
- Qiu, B.; Shen, Z.; Wu, S.; Qin, X.; Yang, D.; Wang, Q. A machine learning-based model for predicting distant metastasis in patients with rectal cancer. Front. Oncol. 2023, 13, 1235121. [Google Scholar] [CrossRef] [Scilit] [PubMed]
- Bruixola, G.; Dualde-Beltrán, D.; Jimenez-Pastor, A.; Nogué, A.; Bellvís, F.; Fuster-Matanzo, A.; Alfaro-Cervelló, C.; Grimalt, N.; Salhab-Ibáñez, N.; Escorihuela, V.; et al. CT-based clinical-radiomics model to predict progression and drive clinical applicability in locally advanced head and neck cancer. Eur. Radiol. 2025, 35, 4277–4288. [Google Scholar] [CrossRef] [Scilit] [PubMed]
- Jin, X.; Li, W.-Z.; Guo, Y.-H.; Wu, G.; Huang, W.-Y.; Chen, F. Predicting progression-free survival using dynamic contrast-enhanced imaging- based radiomics in advanced nasopharyngeal carcinoma patients treated with nimotuzumab. Eur. Radiol. 2025, 35, 5135–5145. [Google Scholar] [CrossRef] [Scilit] [PubMed]
- Tankyevych, O.; Trousset, F.; Latappy, C.; Berraho, M.; Dutilh, J.; Tasu, J.P.; Lamour, C.; Cheze Le Rest, C. Development of Radiomic-Based Model to Predict Clinical Outcomes in Non-Small Cell Lung Cancer Patients Treated with Immunotherapy. Cancers 2022, 14, 5931. [Google Scholar] [CrossRef] [Scilit] [PubMed]
- Kuang, Q.; Feng, B.; Xu, K.; Chen, Y.; Chen, X.; Duan, X.; Lei, X.; Chen, X.; Li, K.; Long, W. Multimodal deep learning radiomics model for predicting postoperative progression in solid stage I non-small cell lung cancer. Cancer Imaging 2024, 24, 140. [Google Scholar] [CrossRef] [Scilit] [PubMed]
- Liu, Y.; Luo, X.; Yang, L.; Cheng, X.; Zhu, X.; Zhang, H.; Hou, B.; Cao, B. Free Survival Prediction Model Based on Enhanced Dynamic Radiomics for Personalized TKI Treatment Monitoring Patients with Lung Adenocarcinoma. Thorac. Cancer 2025, 16, e70010. [Google Scholar] [CrossRef] [Scilit] [PubMed]
- Wang, C.; Shao, J.; Lv, J.; Cao, Y.; Zhu, C.; Li, J.; Shen, W.; Shi, L.; Liu, D.; Li, W. Deep learning for predicting subtype classification and survival of lung adenocarcinoma on computed tomography. Transl. Oncol. 2021, 14, 101141. [Google Scholar] [CrossRef] [Scilit] [PubMed]
- Zhang, L.; Wang, K.; Xiang, P. Analysis of the clinical tumor stage and survival prognosis of rectal cancer patients on the basis of deep learning and imaging characteristics: An observational study. Curr. Probl. Surg. 2025, 69, 101817. [Google Scholar] [CrossRef] [Scilit] [PubMed]
- Zhu, J.-H.; Gao, Y.; Wu, Y.-B.; Wang, Q.; Liu, Q.; Zhang, C.-J.; Chen, W.-Z.; Lyu, X.-H.; Zhang, X.-L.; Liu, Z.; et al. Application of deep learning on MRI for prognostic prediction in rectal cancer. Eur. Radiol. 2026, 36, 4563–4578. [Google Scholar] [CrossRef] [Scilit] [PubMed]
- Moassefi, M.; Faghani, S.; Conte, G.M.; Kowalchuk, R.O.; Vahdati, S.; Crompton, D.J.; Perez-Vega, C.; Cabreja, R.A.D.; Vora, S.A.; Quiñones-Hinojosa, A.; et al. A deep learning model for discriminating true progression from pseudoprogression in glioblastoma patients. J. Neurooncol. 2022, 159, 447–455. [Google Scholar] [CrossRef] [Scilit] [PubMed]
- Huang, K.-B.; Gui, C.-P.; Xu, Y.-Z.; Li, X.-S.; Zhao, H.-W.; Cao, J.-Z.; Chen, Y.-H.; Pan, Y.-H.; Liao, B.; Cao, Y.; et al. A multi-classifier system integrated by clinico-histology-genomic analysis for predicting recurrence of papillary renal cell carcinoma. Nat. Commun. 2024, 15, 6215. [Google Scholar] [CrossRef] [Scilit] [PubMed]
- Jiang, D.; Liao, J.; Du, H.; Wu, Q.; Owen, G.; Shu, C.; Chen, L.; He, Y.; Wu, Z.; He, D.; et al. A machine learning-based prognostic predictor for stage III colon cancer. Sci. Rep. 2020, 10, 10333. [Google Scholar] [CrossRef] [Scilit] [PubMed]
- Pisula, J.I.; Helbig, D.; Sancéré, L.; Persa, O.D.; Bürger, C.; Fröhlich, A.; Lorenz, C.; Bingmann, S.; Niebel, D.; Drexler, K.; et al. Explainable, federated deep learning model predicts disease progression risk of cutaneous squamous cell carcinoma. npj Precis. Oncol. 2025, 9, 205. [Google Scholar] [CrossRef] [Scilit] [PubMed]
- Zhou, J.; Wibawa, M.; Wang, R.; Deng, Y.; Huang, H.; Luo, Z.; Xia, Y.; Guo, X.; Young, L.S.; Lo, K.-W.; et al. Multimodal AI-based risk stratification for distant metastasis in nasopharyngeal carcinoma. ESMO Open 2025, 10, 105809. [Google Scholar] [CrossRef] [Scilit] [PubMed]
- Gu, B.; Meng, M.; Bi, L.; Kim, J. Prediction of 5-year progression-free survival in advanced nasopharyngeal carcinoma with pretreatment PET/CT using multi-modality deep learning-based radiomics. Front. Oncol. 2022, 12, 899351. [Google Scholar] [CrossRef] [Scilit] [PubMed]
- Mehri-kakavand, G.; Mdletshe, S.; Amini, M.; Wang, A. Multimodal radiomics fusion for predicting postoperative recurrence in NSCLC patients. J. Cancer Res. Clin. Oncol. 2025, 151, 261. [Google Scholar] [CrossRef] [Scilit] [PubMed]
- Le, Q.C.; Arimura, H.; Ninomiya, K.; Kabata, Y. Radiomic features based on Hessian index for prediction of prognosis in head-and-neck cancer patients. Sci. Rep. 2020, 10, 21301. [Google Scholar] [CrossRef] [Scilit] [PubMed]
- Huynh, B.N.; Groendahl, A.R.; Tomic, O.; Liland, K.H.; Knudtsen, I.S.; Hoebers, F.; van Elmpt, W.; Malinen, E.; Dale, E.; Futsaether, C.M. Head and neck cancer treatment outcome prediction: A comparison between machine learning with conventional radiomics features and deep learning radiomics. Front. Med. 2023, 10, 1217037. [Google Scholar] [CrossRef] [Scilit] [PubMed]
- Wang, Z.; Wang, H.; Zhou, Y.; Li, L.; Lyu, M.; Wu, C.; He, T.; Tan, L.; Zhu, Y.; Guo, T.; et al. An individualized protein-based prognostic model to stratify pediatric patients with papillary thyroid carcinoma. Nat. Commun. 2024, 15, 3560. [Google Scholar] [CrossRef] [Scilit] [PubMed]
- Zhu, G.; Yi, Q.; Xu, R.; Xie, Y.; Chen, S.; Song, Y.; Xiang, Y.; Wang, X.; Huang, L. Development and validation of a machine learning model for predicting pulmonary metastasis in hepatocellular carcinoma patients. Discov. Oncol. 2025, 16, 1477. [Google Scholar] [CrossRef] [Scilit] [PubMed]
- Peleva, E.; Chen, Y.; Finke, B.; Rizvi, H.; Healy, E.; Lai, C. Enhanced metastasis risk prediction in cutaneous squamous cell carcinoma using deep learning and computational histopathology. npj Precis. Oncol. 2025, 9, 308. [Google Scholar] [CrossRef] [Scilit] [PubMed]
- Feng, B.; Shi, J.; Huang, L.; Yang, Z.; Feng, S.-T.; Li, J.; Chen, Q.; Xue, H.; Chen, X.; Wan, C.; et al. Robustly federated learning model for identifying high-risk patients with postoperative gastric cancer recurrence. Nat. Commun. 2024, 15, 742. [Google Scholar] [CrossRef] [Scilit] [PubMed]
- Huang, P.; Illei, P.B.; Franklin, W.; Wu, P.H.; Forde, P.M.; Ashrafinia, S.; Hu, C.; Khan, H.; Vadvala, H.V.; Shih, I.-M. Lung Cancer Recurrence Risk Prediction through Integrated Deep Learning Evaluation. Cancers 2022, 14, 4150. [Google Scholar] [CrossRef] [Scilit] [PubMed]
- Larose, M.; Archambault, L.; Touma, N.; Brodeur, R.; Desroches, F.; Raymond, N.; Bédard-Tremblay, D.; LeBlanc, D.; Rasekh, F.; Hovington, H.; et al. Multi-task Bayesian model combining FDG-PET/CT imaging and clinical data for interpretable high-grade prostate cancer prognosis. Sci. Rep. 2024, 14, 26928. [Google Scholar] [CrossRef] [Scilit] [PubMed]
- Starke, S.; Zwanenburg, A.; Leger, K.; Zöphel, K.; Kotzerke, J.; Krause, M.; Baumann, M.; Troost, E.G.C.; Löck, S. Longitudinal and Multimodal Radiomics Models for Head and Neck Cancer Outcome Prediction. Cancers 2023, 15, 673. [Google Scholar] [CrossRef] [Scilit] [PubMed]
- Kim, S.; Lee, C.-K.; Choi, Y.; Baek, E.S.; Choi, J.E.; Lim, J.S.; Lim, J.S.; Kang, J.; Shin, S.J. Deep-Learning-Based Natural Language Processing of Serial Free-Text Radiological Reports for Predicting Rectal Cancer Patient Survival. Front. Oncol. 2021, 11, 747250. [Google Scholar] [CrossRef] [Scilit] [PubMed]
- Luo, D.; Xu, L.; Yang, Y.; Wu, J.; Li, X. Simulating chemotherapy of tumor models via adopting an artificial intelligence approach. Phys. Scr. 2025, 100, 75249. [Google Scholar] [CrossRef] [Scilit]
- Ghislain, M.; Martin, F.; Dausort, M.; Dasnoy-Sumell, D.; Maria, A.; Montero, A.M.B.; Macq, B. Optimal Fractionation Scheduling for Radiotherapy Treatments with Reinforcement Learning, Tumor Growth Modeling and Outcome Modeling. Biomedicines 2025, 13, 1367. [Google Scholar] [CrossRef] [Scilit] [PubMed]
- Yan, Y.; Sun, X.; Chen, Y.; Sun, Z.; Yan, S.; Lu, Z. Optimizing fractionation schedules for de-escalation radiotherapy in head and neck cancers using deep reinforcement learning. Radiother. Oncol. 2025, 207, 110833. [Google Scholar] [CrossRef] [Scilit] [PubMed]
- Tonneau, M.; Phan, K.; Manem, V.S.K.; Low-kam, C.; Dutil, F.; Kazandjian, S.; Vanderweyen, D.; Panasci, J.; Malo, J.; Coulombe, F.; et al. Generalization optimizing machine learning to improve CT scan radiomics and assess immune checkpoint inhibitors’ response in non-small cell lung cancer: A multicenter cohort study. Front. Oncol. 2023, 13, 1196414. [Google Scholar] [CrossRef] [Scilit] [PubMed]
- Huang, J.; Xiang, Y.; Gan, S.; Wu, L.; Yan, J.; Ye, D.; Zhang, J. Application of artificial intelligence in medical imaging for tumor diagnosis and treatment: A comprehensive approach. Discov. Oncol. 2025, 16, 1625. [Google Scholar] [CrossRef] [Scilit] [PubMed]
- Ferro, A.; Bottosso, M.; Dieci, M.V.; Scagliori, E.; Miglietta, F.; Aldegheri, V.; Bonanno, L.; Caumo, F.; Guarneri, V.; Griguolo, G.; et al. Clinical applications of radiomics and deep learning in breast and lung cancer: A narrative literature review on current evidence and future perspectives. Crit. Rev. Oncol. Hematol. 2024, 203, 104479. [Google Scholar] [CrossRef] [Scilit] [PubMed]
- Russo, L.; Charles-Davies, D.; Bottazzi, S.; Sala, E.; Boldrini, L. Radiomics for clinical decision support in radiation oncology. Clin. Oncol. 2024, 36, e269–e281. [Google Scholar] [CrossRef] [Scilit] [PubMed]
- Yang, B.; Chen, S.; Wang, Y.; Wang, H.; Deng, J.; Liu, Y.; Ran, J.; Deng, Y.; Li, T.; Zhang, X.; et al. Radiology-based artificial intelligence for predicting targeted therapy response in pan-cancer: A comprehensive review. J. Transl. Med. 2025, 23, 1337. [Google Scholar] [CrossRef] [Scilit] [PubMed]
- Ray, P.P. A review on explainable artificial intelligence in radiomics: State-of-the-art tools, prospective use cases, challenges and future directions. Eur. J. Radiol. Artif. Intell. 2026, 5, 100069. [Google Scholar] [CrossRef] [Scilit]
- Yu, S.; Gong, M.; Wang, H.; Liu, H.; Deng, M. Radiomics and artificial intelligence-based prediction of tumor response in digestive system neoplasm: A systematic review and meta-analysis. Front. Med. 2026, 13, 1795060. [Google Scholar] [CrossRef] [Scilit] [PubMed]
- Hosny, A.; Parmar, C.; Quackenbush, J.; Schwartz, L.H.; Aerts, H.J.W.L. Artificial intelligence in radiology. Nat. Rev. Cancer. 2018, 18, 500–510. [Google Scholar] [CrossRef] [Scilit] [PubMed]
- Lambin, P.; Leijenaar, R.T.H.; Deist, T.M.; Peerlings, J.; de Jong, E.E.C.; van Timmeren, J.; Sanduleanu, S.; Larue, R.T.H.M.; Even, A.J.G.; Jochems, A.; et al. Radiomics: The bridge between medical imaging and personalized medicine. Nat. Rev. Clin. Oncol. 2017, 14, 749–762. [Google Scholar] [CrossRef] [Scilit] [PubMed]
- Fan, M.; Chen, H.; You, C.; Liu, L.; Gu, Y.; Peng, W.; Gao, X.; Li, L. Radiomics of tumor heterogeneity in longitudinal dynamic contrast-enhanced magnetic resonance imaging for predicting response to neoadjuvant chemotherapy in breast cancer. Front. Mol. Biosci. 2021, 8, 622219. [Google Scholar] [CrossRef] [Scilit] [PubMed]
- Zhang, X.; Zhang, Y.; Zhang, G.; Qiu, X.; Tan, W.; Yin, X.; Liao, L. Deep Learning With Radiomics for Disease Diagnosis and Treatment: Challenges and Potential. Front. Oncol. 2022, 12, 773840. [Google Scholar] [CrossRef] [Scilit] [PubMed]
- Li, S.; Zhou, B. A review of radiomics and genomics applications in cancers: The way towards precision medicine. Radiat. Oncol. 2022, 17, 217. [Google Scholar] [CrossRef] [Scilit] [PubMed]
- Swanson, K.; Wu, E.; Zhang, A.; Alizadeh, A.A.; Zou, J. From patterns to patients: Advances in clinical machine learning for cancer diagnosis, prognosis, and treatment. Cell 2023, 186, 1772–1791. [Google Scholar] [CrossRef] [Scilit] [PubMed]
- World Health Organization. Ethics and Governance of Artificial Intelligence for Health: WHO Guidance. 2021. Available online: https://www.who.int/publications/i/item/9789240029200 (accessed on 16 April 2026).
- Wu, Z.; Wang, L.; Li, C.; Cai, Y.; Liang, Y.; Mo, X.; Lu, Q.; Dong, L.; Liu, Y. DeepLRHE: A Deep Convolutional Neural Network Framework to Evaluate the Risk of Lung Cancer Recurrence and Metastasis from Histopathology Images. Front. Genet. 2020, 11, 768. [Google Scholar] [CrossRef] [Scilit] [PubMed]
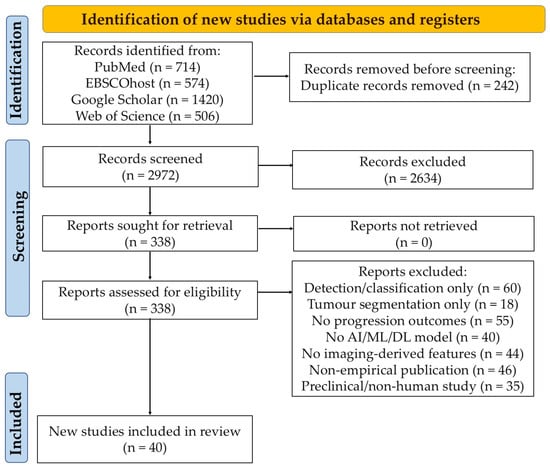
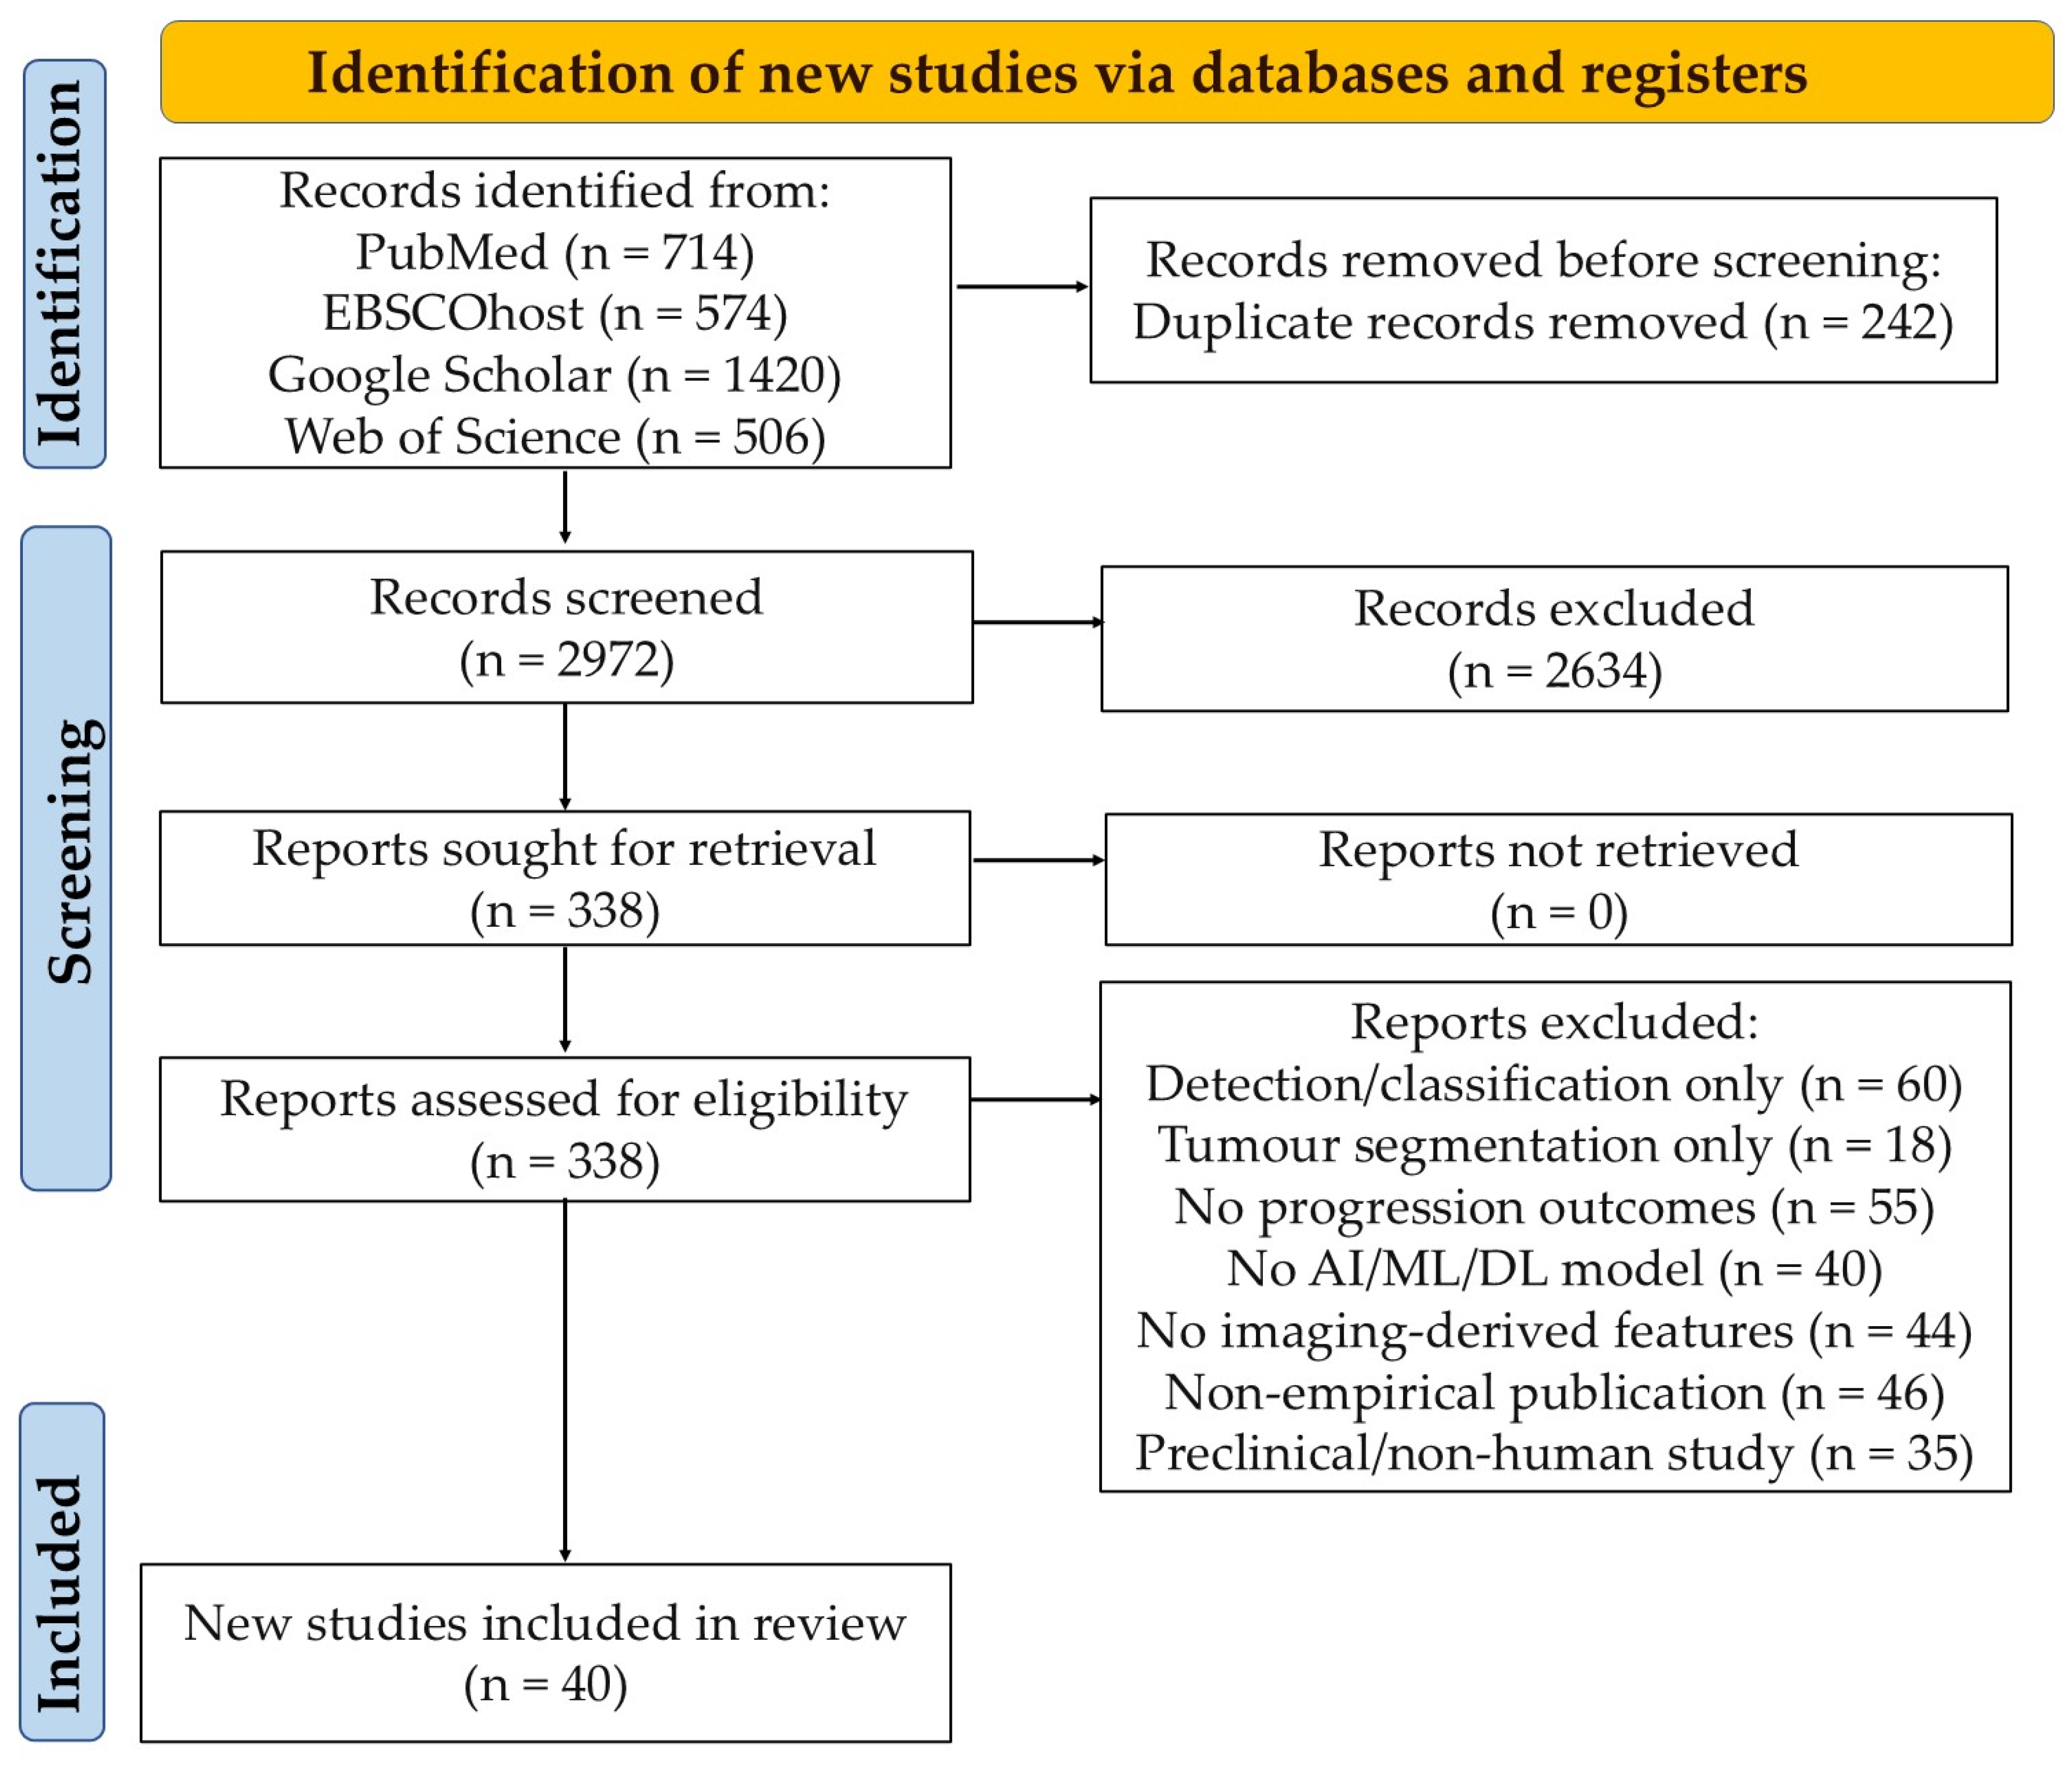
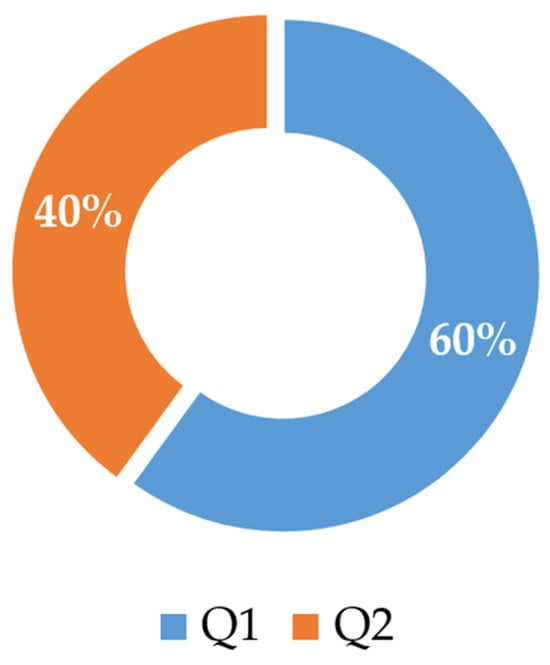
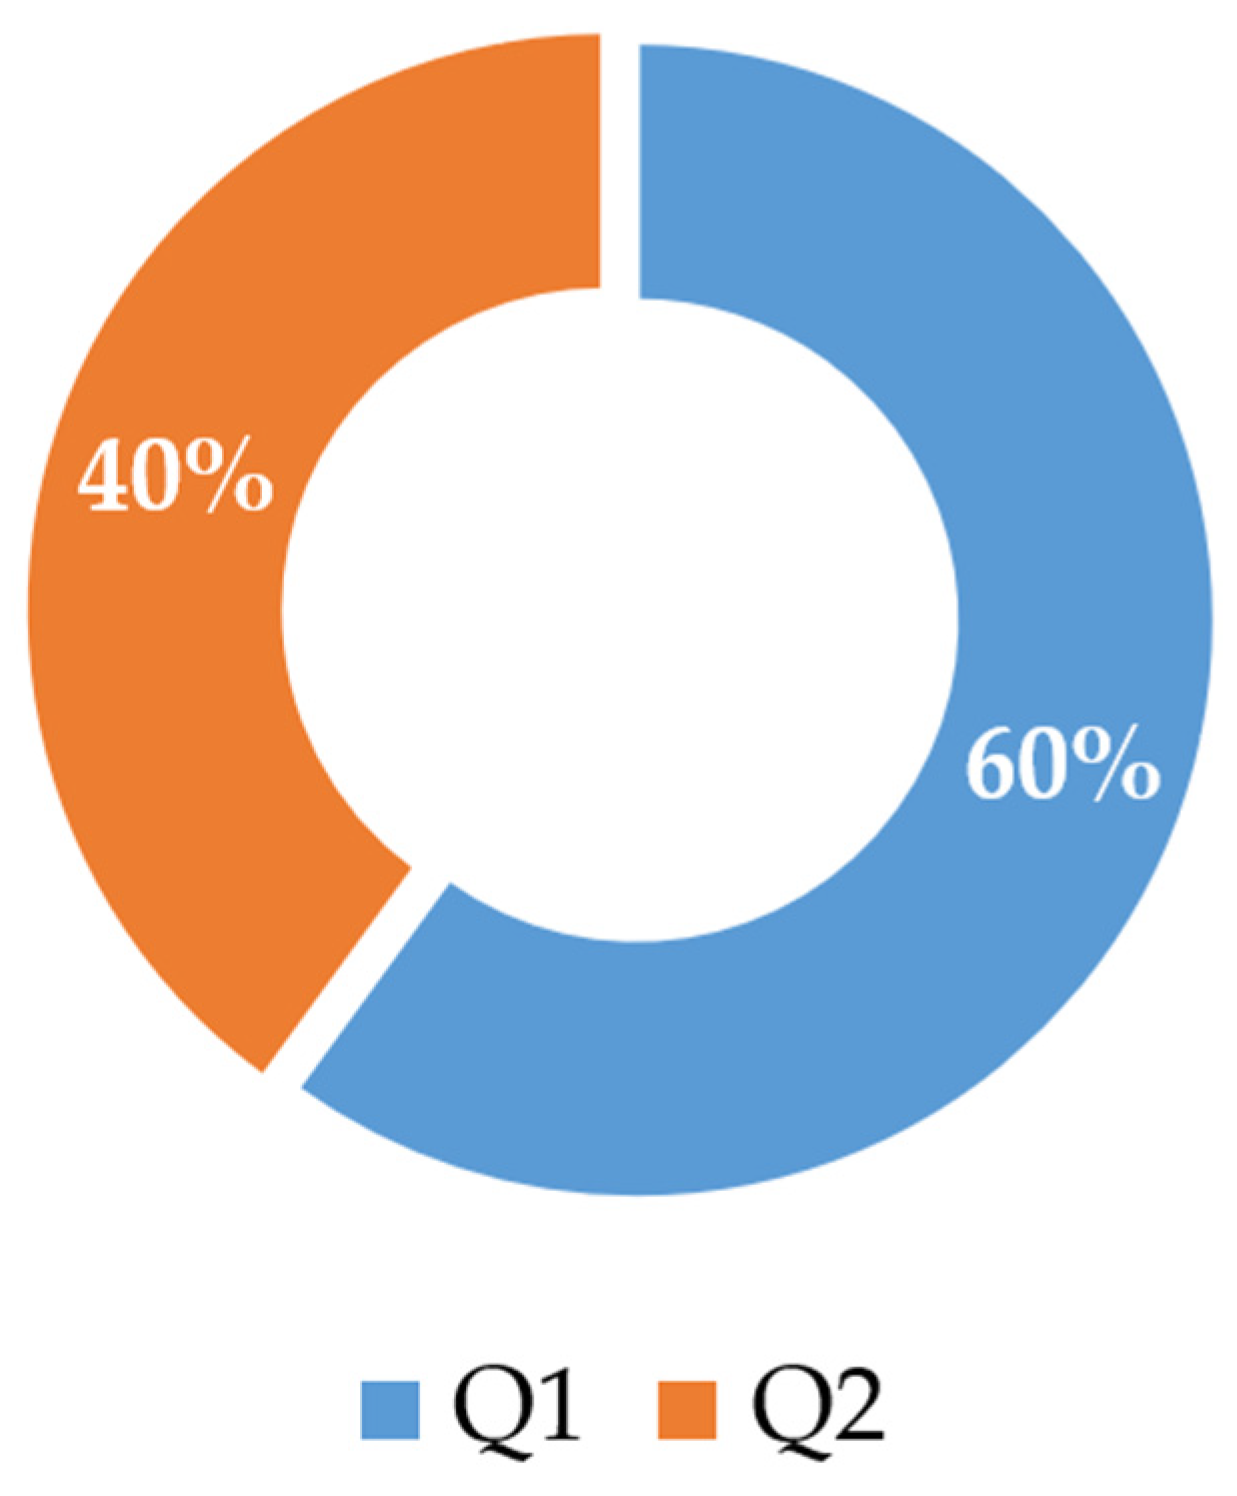
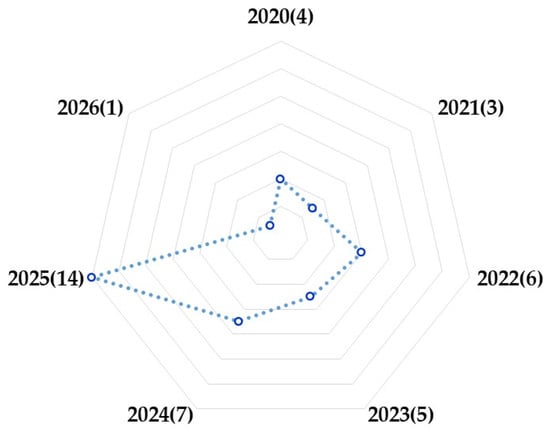
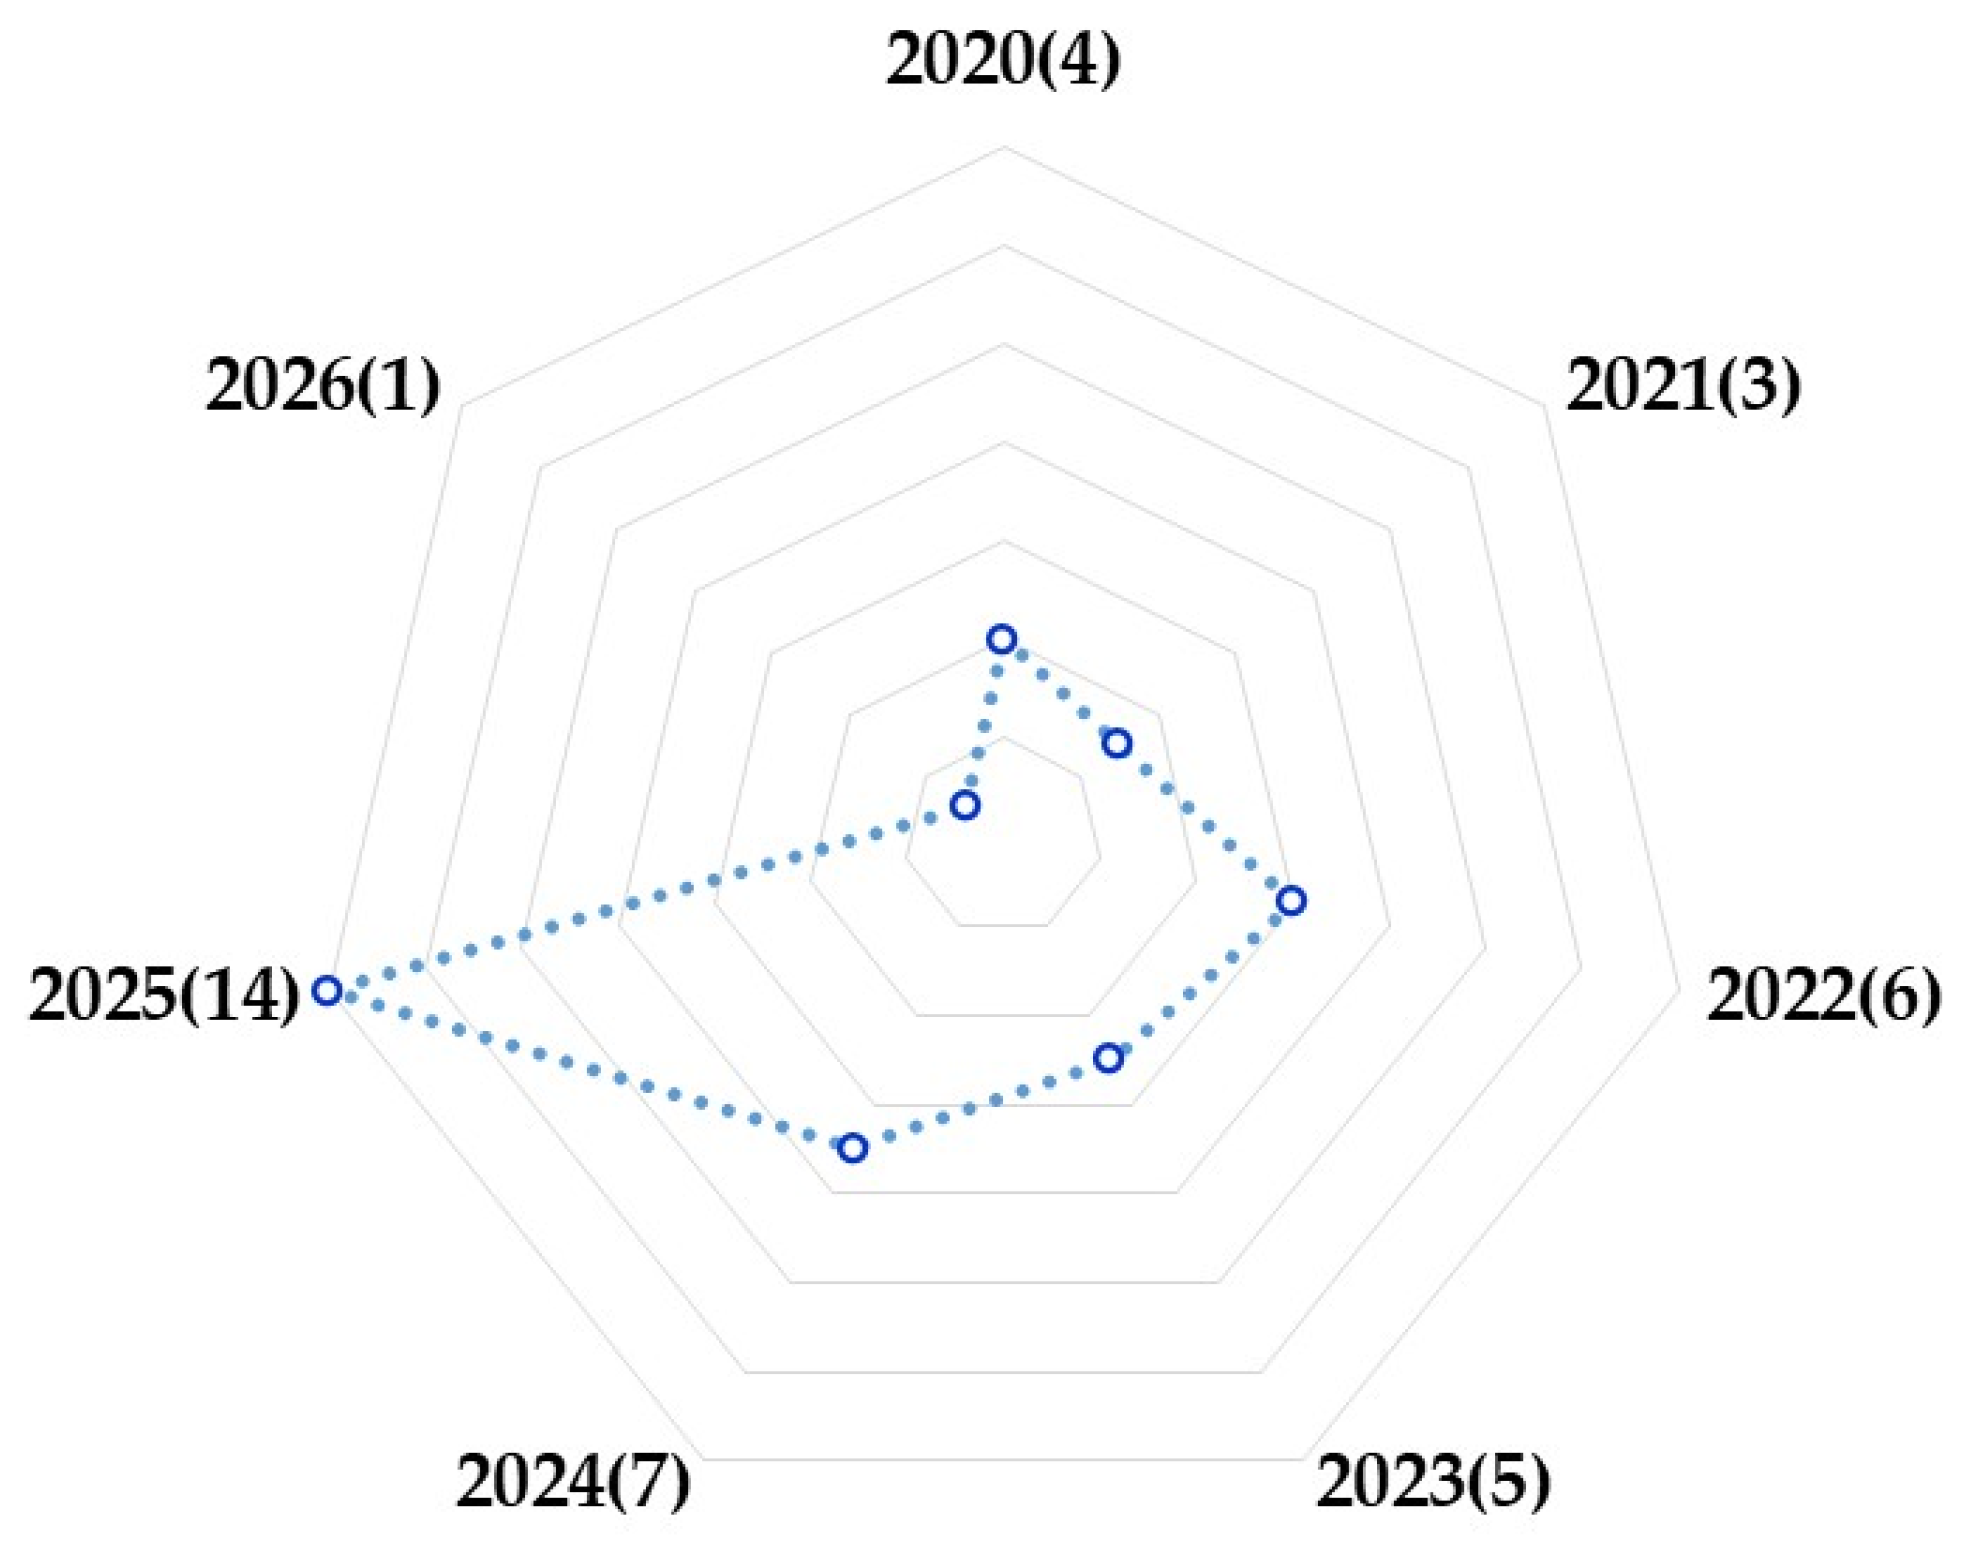
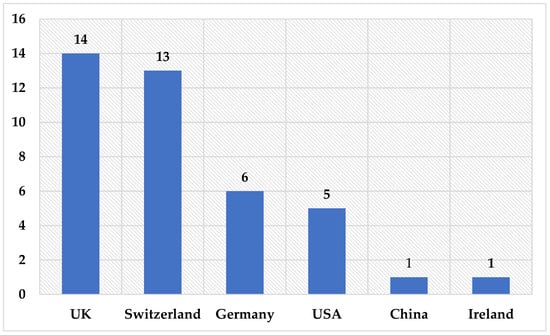
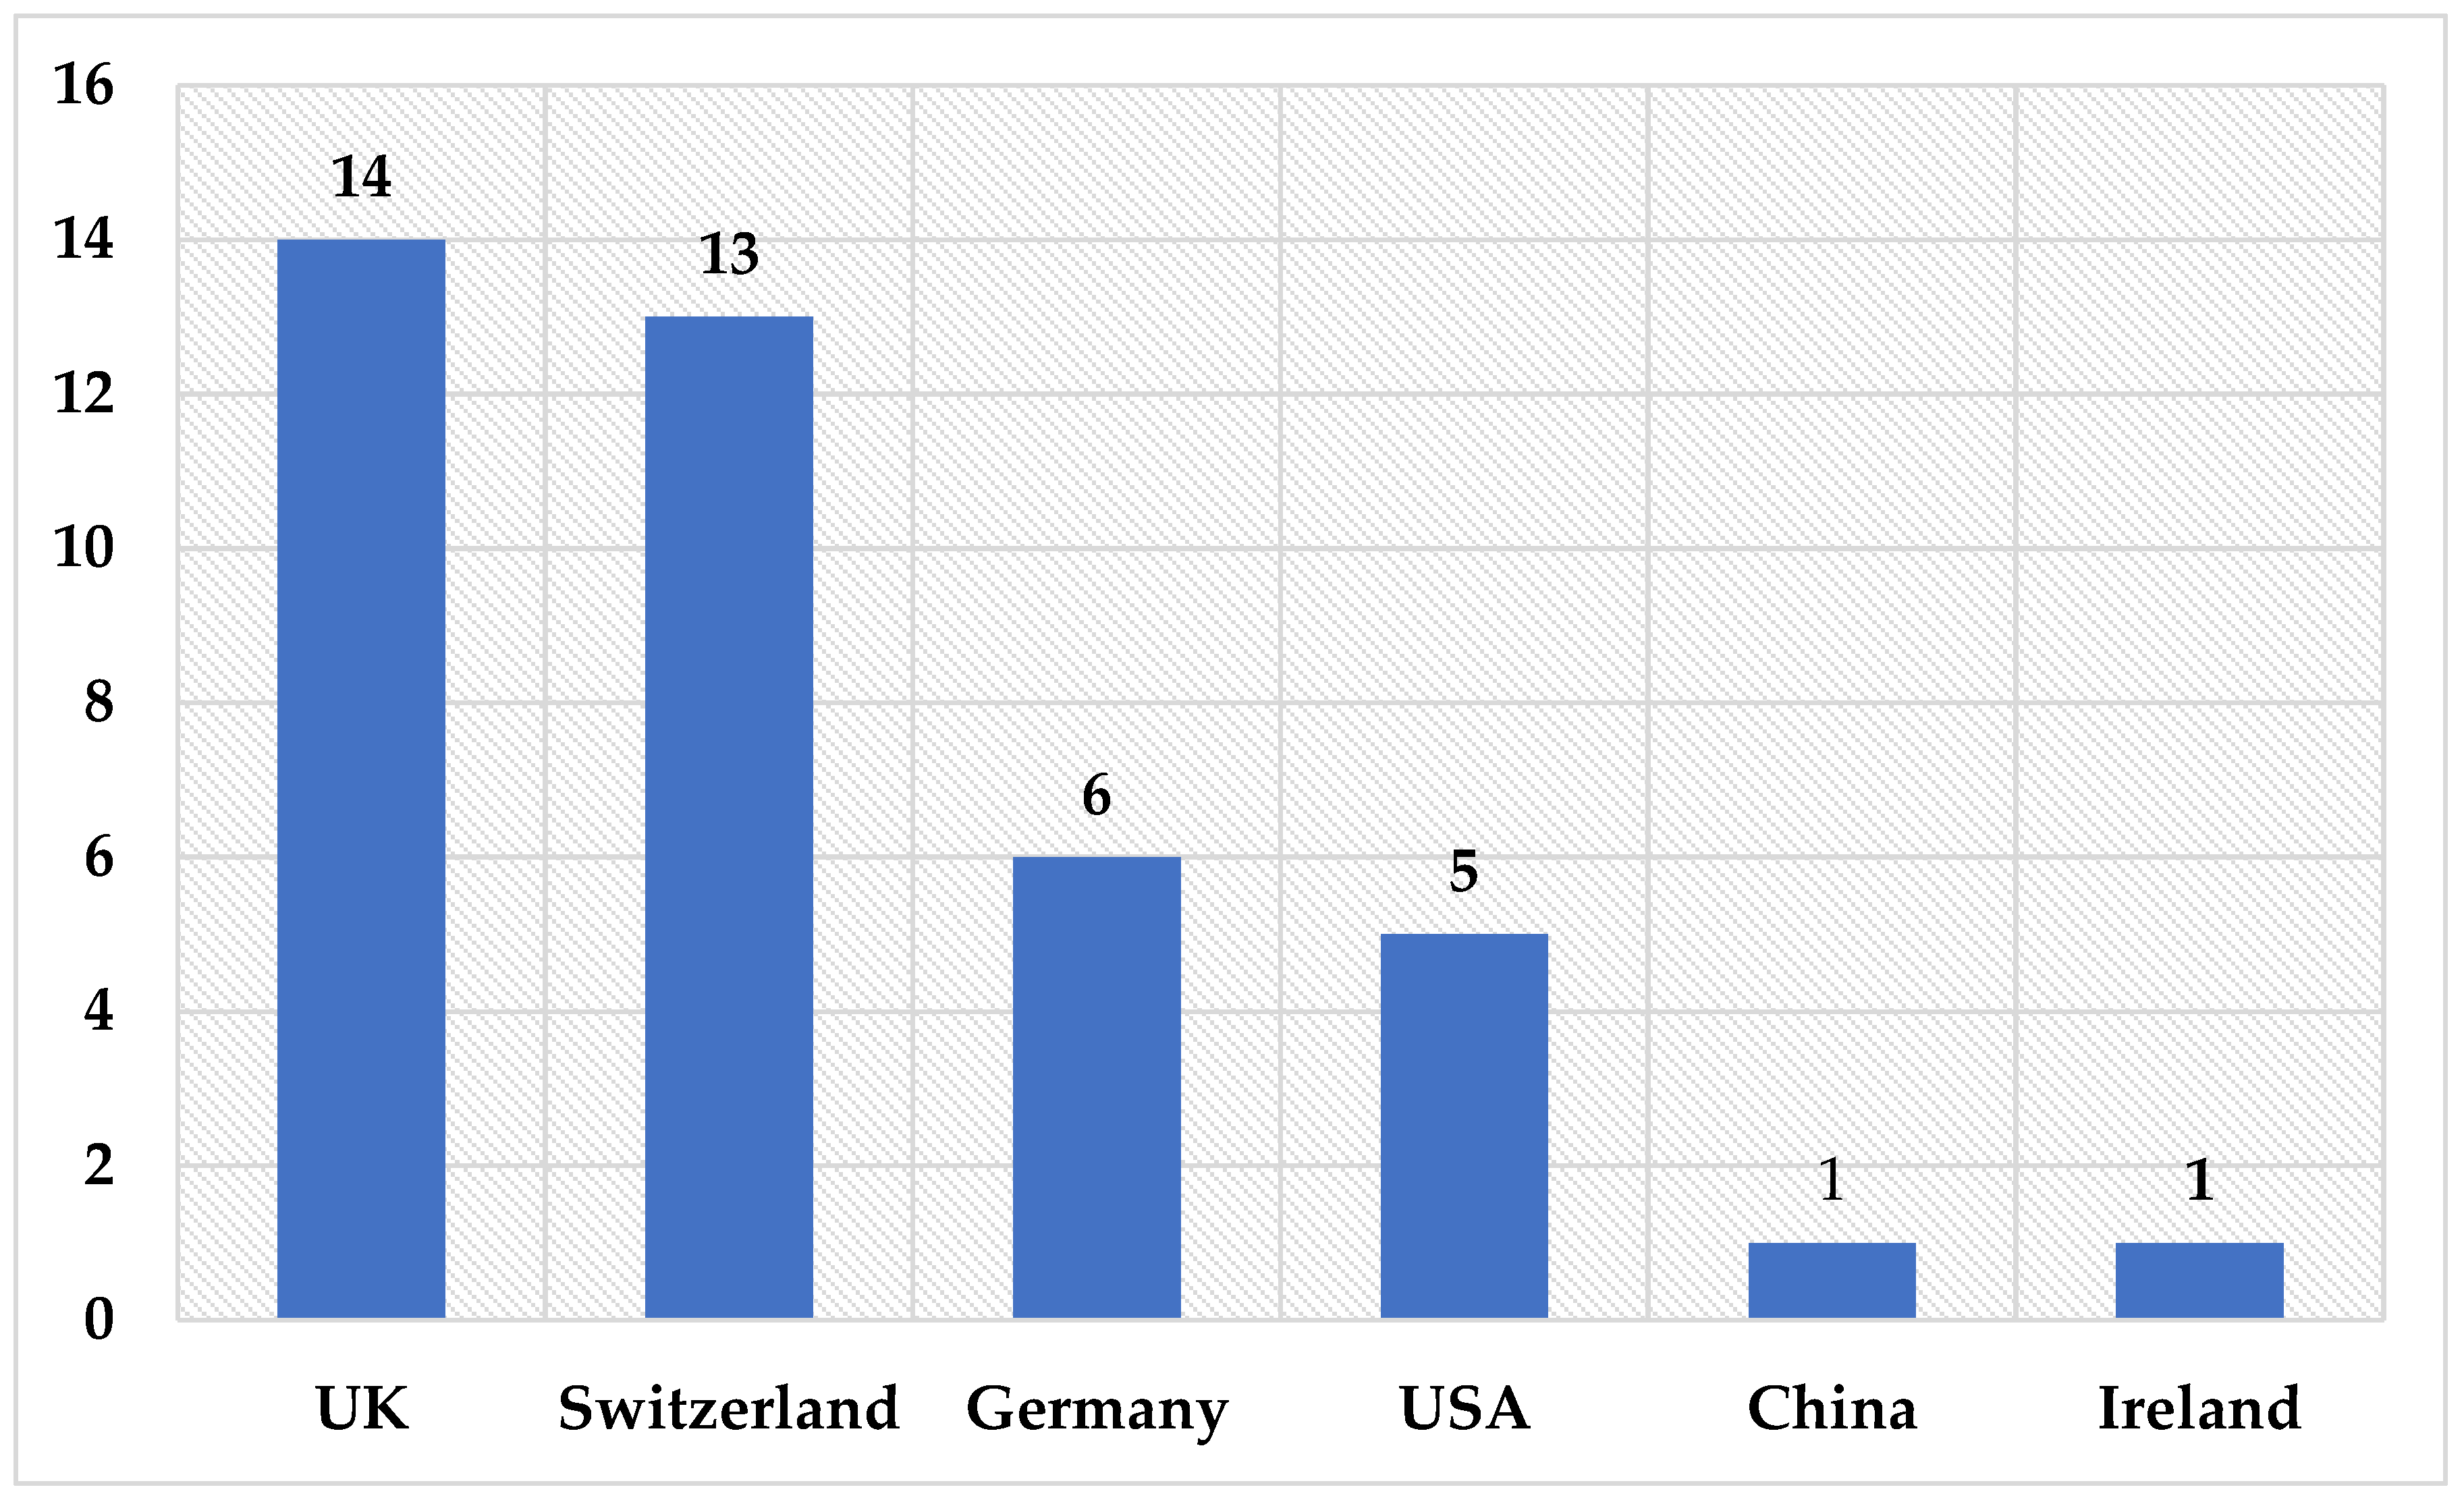
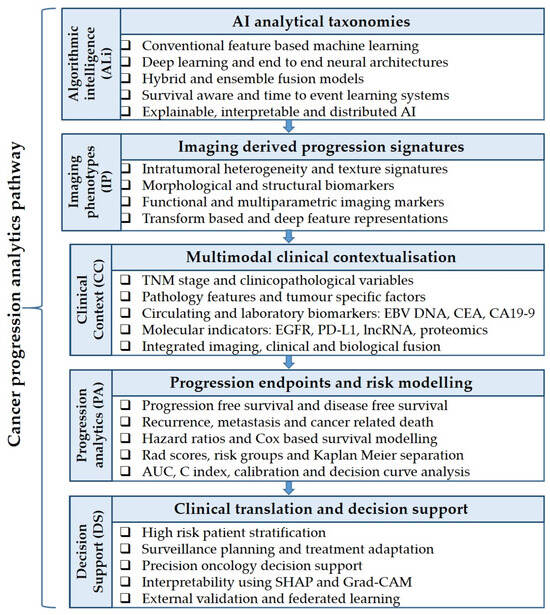
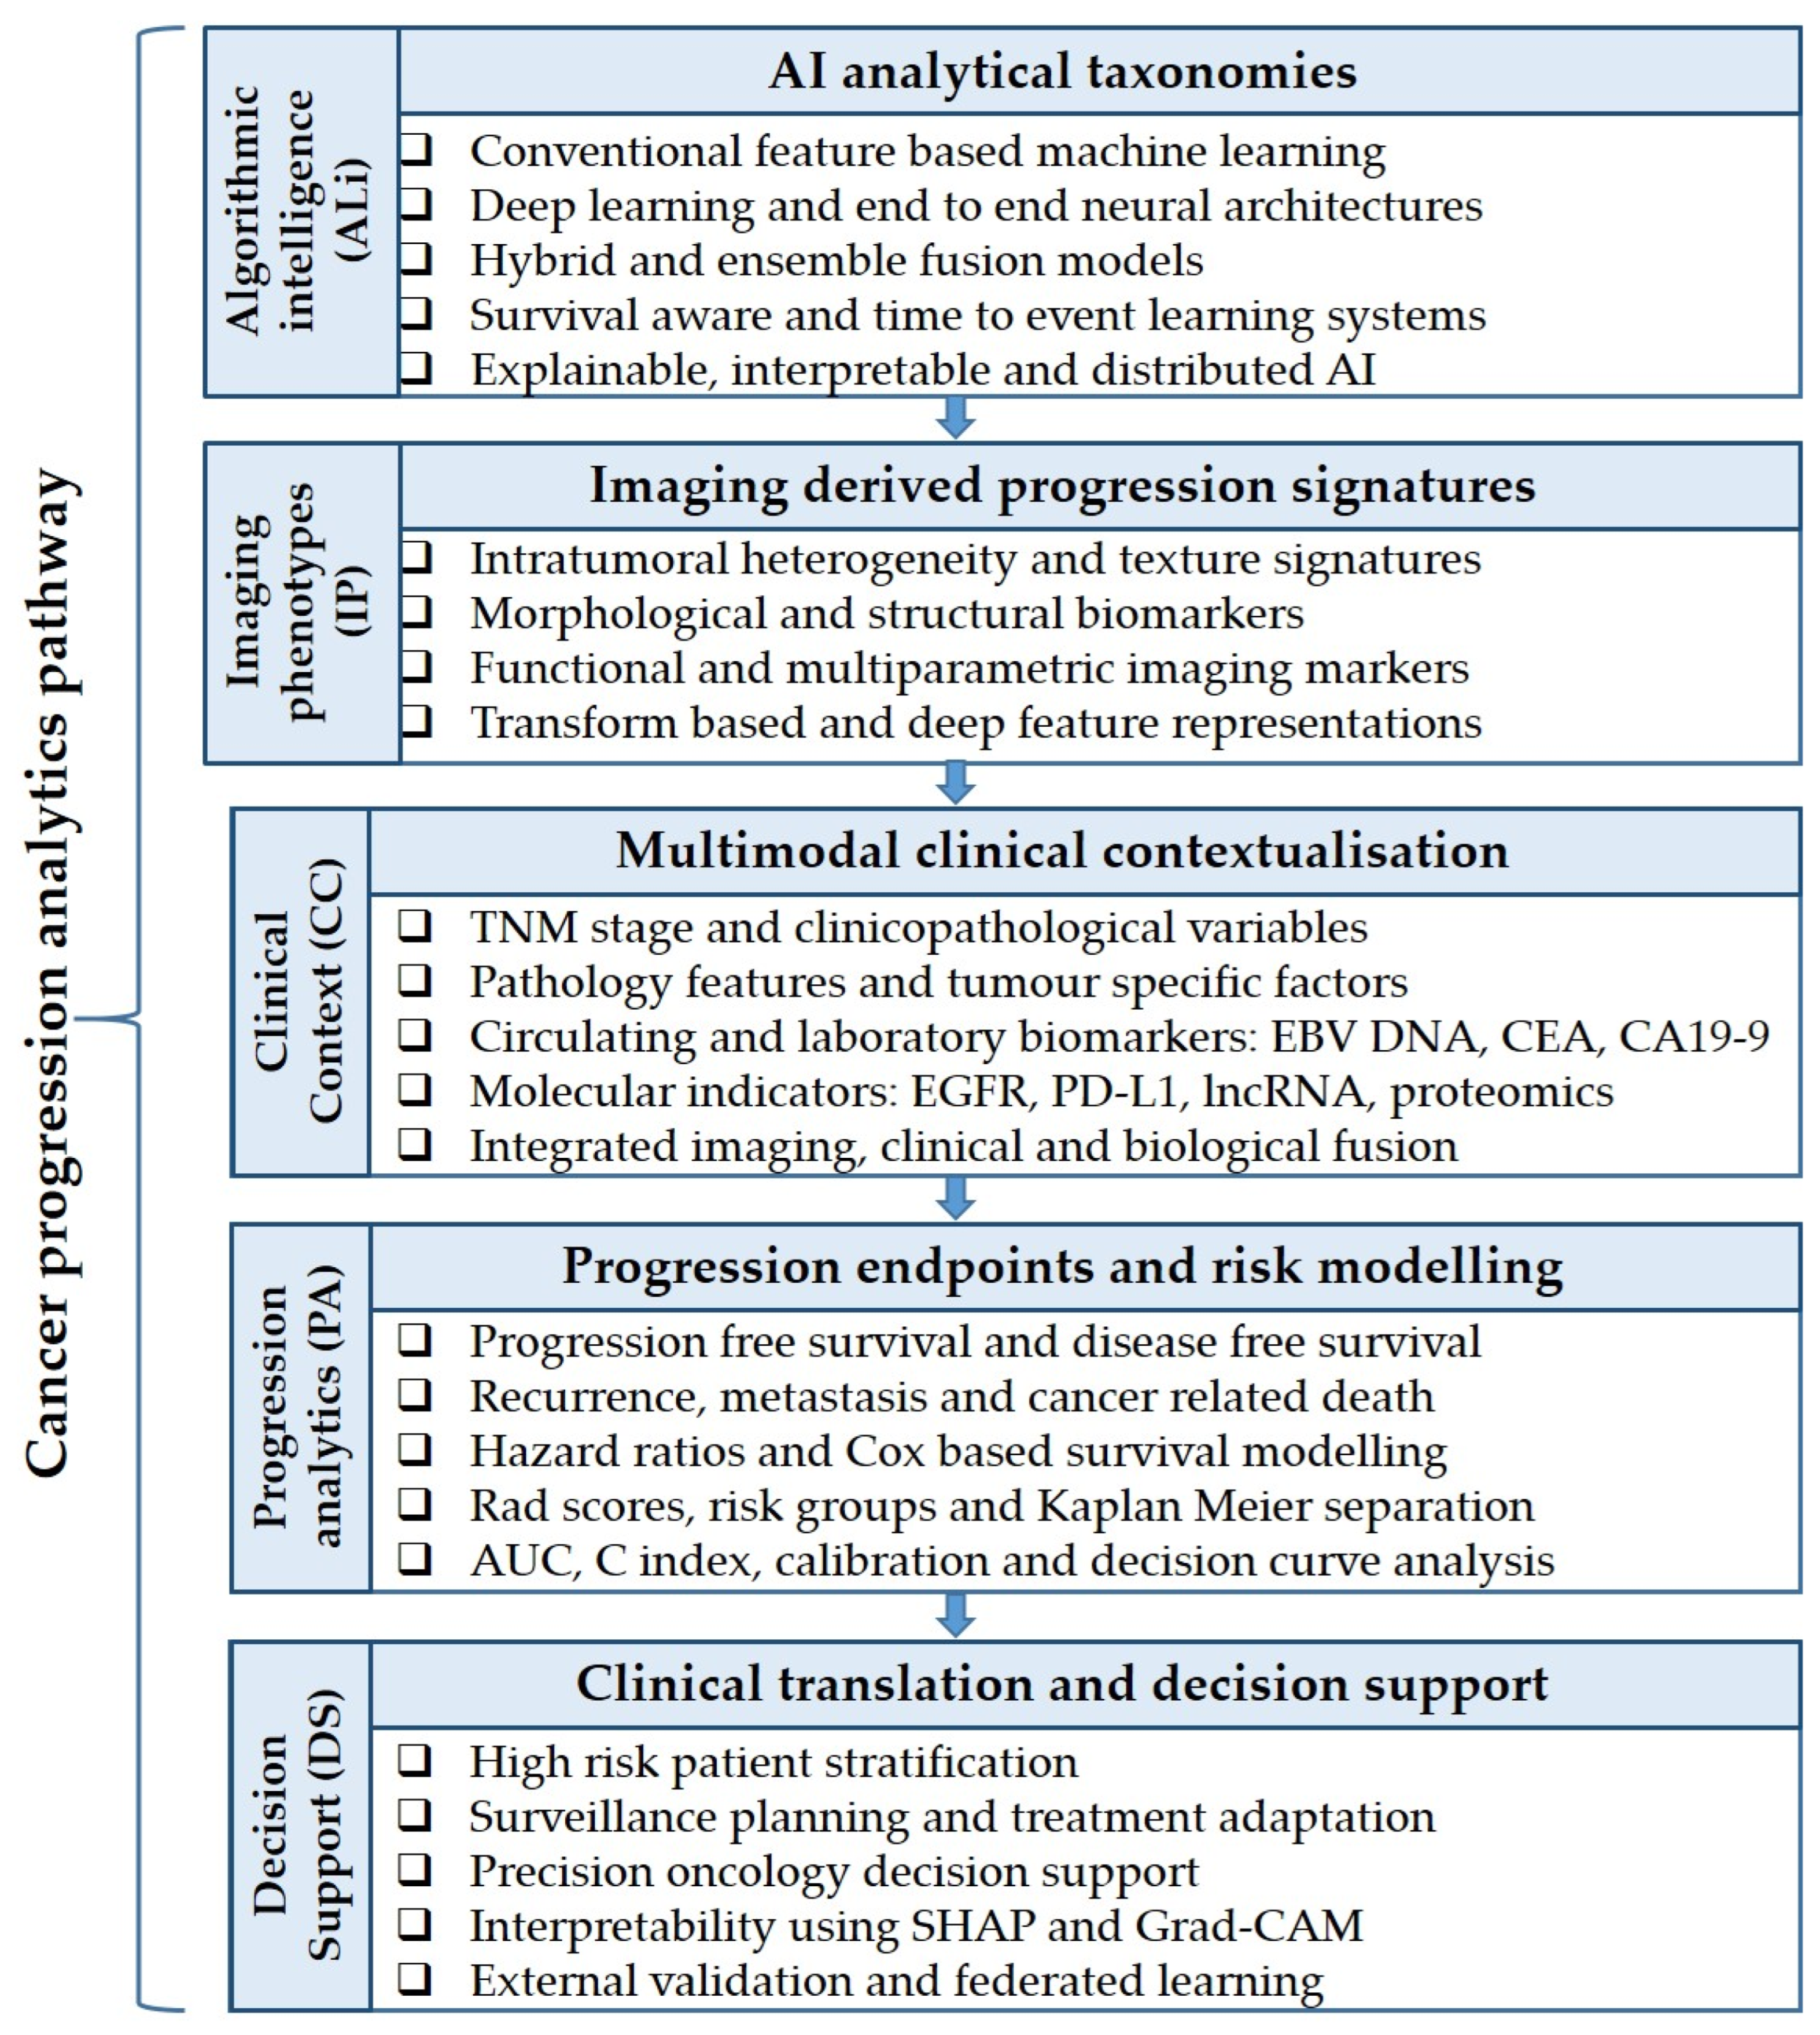

Disclaimer/Publisher’s Note: The statements, opinions and data contained in all publications are solely those of the individual author(s) and contributor(s) and not of MDPI and/or the editor(s). MDPI and/or the editor(s) disclaim responsibility for any injury to people or property resulting from any ideas, methods, instructions or products referred to in the content. |
© 2026 by the authors. Licensee MDPI, Basel, Switzerland. This article is an open access article distributed under the terms and conditions of the Creative Commons Attribution (CC BY) license.