


Abstract
Customer churn remains a significant concern in the telecommunications sector, leading to reduced profits and increased customer acquisition costs. The competitive nature of the industry allows customers the freedom to switch providers easily, necessitating effective models to predict and mitigate churn. This paper aimed to develop and compare optimal hybrid models for accurately predicting customer churn within a specified timeframe and to assess how various factors influence the time until churn. To achieve this, a dataset from an Iranian telecommunications company was utilised. The methodology involved a three-stage hybrid approach: initially, customers were segmented using K-means (KM) and Agglomerative clustering (AC) techniques. Subsequently, binary classification was performed using Logistic Regression (LR), Artificial Neural Networks (ANN), and Decision Trees (DT). Finally, the Cox proportional hazard model (CoxPH) was employed to estimate hazard rates and analyse the impact of covariates on churn time. Model performance was evaluated using metrics such as Accuracy, Precision, Recall, F1-Score, Specificity, and Area Under the Receiver Operating Characteristic Curve (AUC-ROC). The experimental results demonstrated that hybrid models generally outperformed individual Cox models across most predictive performance metrics. Specifically, the K-means + Logistic Regression + Cox (KM + LR + Cox) model was identified as the best performer, achieving an Accuracy of 88.24%, Precision of 93.18%, Specificity of 63.64%, and an F1-score of 93.01%. KM with two clusters (representing churners and non-churners) was optimal for customer segmentation. Covariate analysis revealed that factors such as ‘Cluster 1’ decreased survival length, suggesting that customers in ‘Cluster 2’ are more prone to churn. This paper successfully developed an optimal three-stage hybrid model, KM + LR + Cox, which effectively predicts customer churn and identifies key factors influencing churn duration, offering valuable insights for targeted retention strategies.
1. Introduction
The telecommunications sector is noted for its intense global competition and rapid growth, which inherently brings about significant challenges, including customer churn [1,2]. Customer churn, defined as the loss of customers to competing firms, is a prevalent issue not only in telecommunications but also across various sectors such as banking, insurance, and more [3,4]. When customers leave, businesses encounter direct revenue losses, which can significantly affect their financial performance [5]. Regular customer churn contributes to lower profit margins, as companies are obliged to continuously invest in marketing and customer acquisition efforts [5]. The cost of acquiring new customers is considerably higher than that of retaining existing ones, with estimates indicating that it can be 5 to 10 times more expensive to attract a new customer than to keep an existing one [6,7]. Beyond the immediate financial implications, a high churn rate can also lead to a decline in market share and damage a company’s brand reputation, suggesting potential underlying issues with their services. As a result, the ability to accurately predict customer churn is essential for businesses to implement timely interventions and enhance profitability.
The prediction of customer churn has thus emerged as a vital application of data mining and machine learning in the telecommunications sector. Predictive models allow companies to pinpoint customers who are at risk of leaving and to implement targeted retention strategies promptly and efficiently [8]. Most studies on churn prediction conceptualise the issue as a binary classification problem, distinguishing customers as either churners or non-churners based on historical demographic, behavioural, and service-related information [9,10]. A diverse array of predictive methodologies has been utilised in this domain, such as logistic regression (LR), decision trees (DT), artificial neural networks (ANN), support vector machines (SVM), and ensemble methods [11,12,13,14,15,16,17], each exhibiting different degrees of predictive accuracy and interpretability.
Numerous empirical studies have compared these methodologies and reported generally competitive performance across various models, with outcomes frequently influenced by the particular dataset and modelling goal. For instance, Jain et al. [18] compared logistic regression and logit boost models, showing closely matched accuracies of 85.24% and 85.18%, respectively. This highlights how simpler statistical models can rival more complex alternatives. The same researcher’s paper involving classifiers such as support vector machines, random forests, AdaBoost, CatBoost, and XGBoost found that boosting-based techniques achieved better performance, attaining area-under-the-curve (AUC) values of approximately 84%. Furthermore, research by Keramati et al. [19] suggests that artificial neural networks can outperform decision trees, k-nearest neighbours, and support vector machines on specific telecommunications datasets. Similarly, neural networks have been employed in the banking industry to identify customer churn patterns, as demonstrated by Bilal Zorić [20], who used neural network models within specialised software to predict customer attrition.
Moreover, Zhao et al. [21] notes the emerging application of SVMs in data mining and machine learning, although specific reports on their use for customer churn prediction are limited. Nonetheless, their theoretical advantages suggest they are suitable for churn modelling. Additionally, Mohamed and Al-Khalifa [22] provides an overview of various models used over the past five years, emphasising the effectiveness of machine learning techniques in capturing complex customer behaviour patterns. Building on this, Sholeha et al. [23] focuses on tree-based gradient boosting models, such as XGBoost, LightGBM, and CatBoost, to predict customer churn in online retail, illustrating the versatility and high performance of ensemble tree methods. These results underscore both the efficacy of machine learning techniques for churn prediction and the lack of a universally superior modelling strategy.
Despite the promising results of classification-based approaches, a notable limitation in much of the existing literature is its primary focus on predicting whether a customer will churn rather than when churn is likely to occur [24]. From an operational viewpoint, the timing of churn is crucial, as it directly impacts the design and execution of proactive intervention strategies. When the goal expands to modelling churn duration, survival analysis presents a natural and theoretically robust framework for time-to-event prediction [25].
For instance, Ali and Arıtürk [26] introduced a dynamic churn prediction framework that leverages customer data across multiple time periods, addressing the challenge of data rarity in valuable customer segments and underscoring the importance of temporal data. Similarly, Lembhe et al. [27] applied survival analysis to paper customer lifetime and churn probability, emphasising the role of customer-related factors. Further advancements include Baek et al. [28], who integrated hazard and distribution function network models to predict survival time, showing that combining different approaches can enhance accuracy.
Comparative studies have evaluated the effectiveness of survival models. Nurhaliza et al. [29] compared Cox Proportional Hazards (CoxPH) with Random Survival Forests, using the C-index to assess predictive quality, and found CoxPH remains a popular and effective method for right-censored churn data. Kimitei et al. [30] compared CoxPH with the Aalen Additive model, demonstrating their interpretability in identifying churn drivers to support targeted retention strategies. Bravante and Robielos [31] utilised Kaplan–Meier estimates, Log-rank tests, and CoxPH models to analyse automobile insurance customer data, highlighting their importance for understanding risk factors.
Follow-up studies have confirmed the effectiveness of Cox regression in estimating hazard rates and customer life expectancy, often outperforming traditional machine learning techniques in temporal churn modelling [32]. Overall, the literature indicates that survival analysis methods, particularly the CoxPH model, are widely used in customer churn prediction due to their ability to handle censored data and provide interpretable insights.
Beyond conventional survival models, multiple extensions have been proposed to address the heterogeneity in churn behaviour. Conditional inference survival ensembles [33] and latent class Weibull hazard models [34] have been found to improve prediction stability and provide more detailed insights into the dynamics of customer churn by considering unobserved segments within the customer base. Despite these advantages, survival-based approaches are still relatively underused in practical telecommunications research, especially in conjunction with modern machine learning techniques.
Recent studies highlight the advantages of hybrid modelling strategies that merge different analytical techniques to improve churn prediction. These models usually combine unsupervised learning methods, like clustering, with supervised classification algorithms, effectively addressing customer diversity and often outperforming single-model frameworks. For instance, Hudaib et al. [35] reported classification accuracies exceeding 97% when K-means clustering was combined with multilayer perceptron neural networks, significantly outperforming standalone neural network models. In a similar context, Tsai and Lu [36] demonstrated that hybrid frameworks including preprocessing and classification stages can achieve superior predictive performance compared to individual models.
Building on this foundation, Bose and Chen [37] employed a two-stage hybrid model that integrates unsupervised clustering techniques with decision trees enhanced by boosting. Their evaluation across different datasets and metrics, such as top decile lift, highlights the effectiveness of combining clustering with supervised learning to better capture customer churn patterns. Similarly, Zhang et al. [38] introduced a hybrid classifier combining the k-nearest neighbour (KNN) algorithm with logistic regression (LR), demonstrating how separating data into distinct subsets can improve classification performance.
Addressing data imbalance issues, Sundarkumar and Ravi [39] developed a hybrid undersampling method utilising k Reverse Nearest Neighbourhood and One-Class SVM, coupled with various classifiers, including decision trees and SVMs. Recent studies also explore deep learning-based hybrid models. Khattak et al. [40] introduced a deep learning hybrid model combining BiLSTM and CNN architectures, addressing limitations of traditional classifiers and feature encoding methods.
Despite advancements in classification and two-stage hybrid models, along with the temporal insights provided by survival analysis, the existing literature continues to be disjointed. Classification models are proficient in identifying customers likely to churn [41], yet they do not address the timing of such events. On the other hand, survival analysis models such as CoxPH excel in predicting time-to-event outcomes but often operate under the assumption of population homogeneity, which restricts their capacity to capture intricate, non-linear customer segments essential for targeted interventions [42]. Two-stage hybrid models, which generally merge clustering with classification techniques, have made strides in tackling the issue of heterogeneity to enhance prediction accuracy [37]; however, they fall short of integrating the vital temporal aspect. This results in a notable gap: the lack of a unified framework capable of simultaneously addressing customer heterogeneity, producing precise churn predictions, and modeling the exact timing of churn within a singular, cohesive process. Such a fragmented methodology constrains operational effectiveness, as businesses need not only a list of customers at risk but also a temporal guide indicating when to take action [43].
This paper directly addresses the existing gap by proposing and validating a novel three-stage hybrid framework. The main contribution of this research is its sequential and interdependent integration of three analytical pillars. First, unsupervised clustering (Stage 1) uncovers inherent customer segments, alleviating the issue of population heterogeneity. Second, a supervised classification model (Stage 2) predicts churn status, and importantly, only the correctly classified instances, those with a clear churn signal, are forwarded to the final stage, thereby minimising noise. Third, the Cox proportional hazards model (Stage 3) is utilised on this filtered and segmented data to achieve a more accurate estimation of hazard rates and the influence of key covariates on churn time. This three-stage pipeline presents a unique advantage over current models: it delivers a comprehensive output that concurrently identifies who is at risk, the segment they belong to, and the timing of their potential churn, thus providing a more effective and operationally relevant tool for proactive customer retention.
The primary objective of this paper is to develop an optimal hybrid model that can accurately pinpoint customers who are at risk of churning within a defined timeframe and to evaluate the effect of explanatory variables on the timing of churn. Multiple hybrid configurations are constructed by employing various combinations of clustering techniques (K-means (KM) and agglomerative clustering (AC)), classification algorithms (LR, ANN, and DT with boosting), along with survival analysis. Model performance will be measured using both statistical criteria and predictive metrics. By integrating predictive accuracy with time-to-event modelling, this paper provides a comprehensive and operationally relevant framework for customer churn analysis that aids in informed decision-making and proactive customer retention strategies.
2. Materials and Methods
2.1. Data Description
The dataset utilised in this paper was a random sample collected over a 12-month duration from the database of an Iranian telecommunications company. This dataset comprises a total of 3150 rows, with each row representing a distinct customer. It includes fifteen predictor variables and one target variable, which is ‘churn’. The ‘churn’ variable is binary, with two classes: ‘1’ indicating a churned customer and ‘0’ indicating a non-churned customer. A customer was considered to have churned if they had ceased their association with the company within the 12-month timeframe, meaning they had no interaction with the service provider (e.g., no phone calls, airtime recharges, or SMS messages) during that period.
A significant aspect of the dataset is the class imbalance, where the ratio of non-churners to churners is 84% to 16%. This imbalance was addressed during the preprocessing phase (Section 2.2) to prevent biased predictions from the model. The predictor variables included both numerical and categorical attributes. Descriptions of the numerical and categorical variables are provided in Table 1 and Table 2, respectively. The ‘Age’ column was removed due to redundancy with the ‘Age Group’.
Table 1.
Description of Numerical Variables.
Table 2.
Description of Categorical Variables.
2.2. Data Cleaning and Preprocessing
Data cleaning and preprocessing were performed to enhance data quality, improve model performance and interpretability, and guarantee accurate and efficient training of the models. This procedure encompassed multiple essential phases, beginning with the partitioning of data and tackling possible challenges within the dataset. The analysis was performed using R version 4.4.1.
Before any cleaning or preprocessing commenced, the dataset was divided into a training set and a test set. An 80%: 20% split ratio was applied, allocating 2520 observations to the training set and 630 observations to the test set. This division ensures that the models can generalise effectively to previously unseen data. To mitigate overfitting issues, this paper adopted a standard hold-out validation technique, allocating 20% of the data as an unseen test set for evaluating the final model’s performance. To prevent data linkage, the training set was initially cleaned and preprocessed, with the same procedures then applied to the test set.
The dataset was thoroughly checked for anomalies, missing values, and outliers. While no anomalies or missing values were found, some numerical variables did contain outliers. To manage these outliers without significant data loss, mean values from the training set were utilised for their replacement. Subsequently, all numerical variables were scaled to ensure they contributed equally to the models, given their original differing measurement scales (e.g., ‘seconds of use’ ranged from 0 to 17,090, while ‘call failure’ ranged from 0 to 36). For specific models, such as ANN, categorical variables underwent one-hot encoding, which resulted in an increase in the number of covariates to 31.
As outlined in Section 2.1, a key characteristic of the original dataset was its class imbalance, which presented a ratio of 84% non-churners to 16% churners. To avoid biased predictions from the model, this imbalance was addressed using two approaches: oversampling the minority class and the Synthetic Minority Over-sampling Technique (SMOTE). These approaches were chosen for their ability to minimise information loss [44]. Following the application of these methods, two separate training datasets were generated: Dataset 1 (from oversampling) and Dataset 2 (from SMOTE). Table 3 provides a summary of the total number of observations, including churners and non-churners, for both datasets, as well as the training dataset before the treatment of class imbalance.
Table 3.
Datasets Before and After Class Imbalance Mitigation.
Following the encoding procedure, the number of covariates increased to 31. To improve the model’s performance, feature selection was conducted using LASSO regression on both Dataset 1 and Dataset 2. This approach ultimately reduced the number of selected covariates to 26. The features selected included ‘Call Failure’, ‘Complains 0’, ‘Subscription Length’, various ‘Charge Amount’ categories (0, 1, 3–10), ‘Seconds of Use’, ‘Frequency of Use’, ‘Frequency of SMS’, ‘Distinct Called Numbers’, ‘Age Group’ categories (1, 2, 3, 5), ‘Tariff Plan 1’, ‘Status 1’, ‘Customer Value’, ‘False Positive’, and ‘False Negative’. The main reason for employing LASSO is its inherent ability to manage multicollinearity to a certain degree. In situations where features are highly correlated, LASSO typically chooses one feature while reducing the others to zero or significantly diminishing their coefficients. This feature is beneficial in addressing redundant information among predictors [45].
2.3. Hybrid Model Development
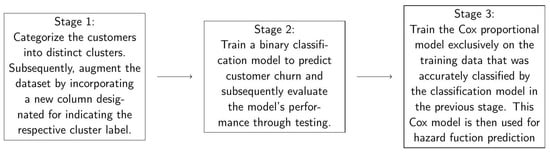
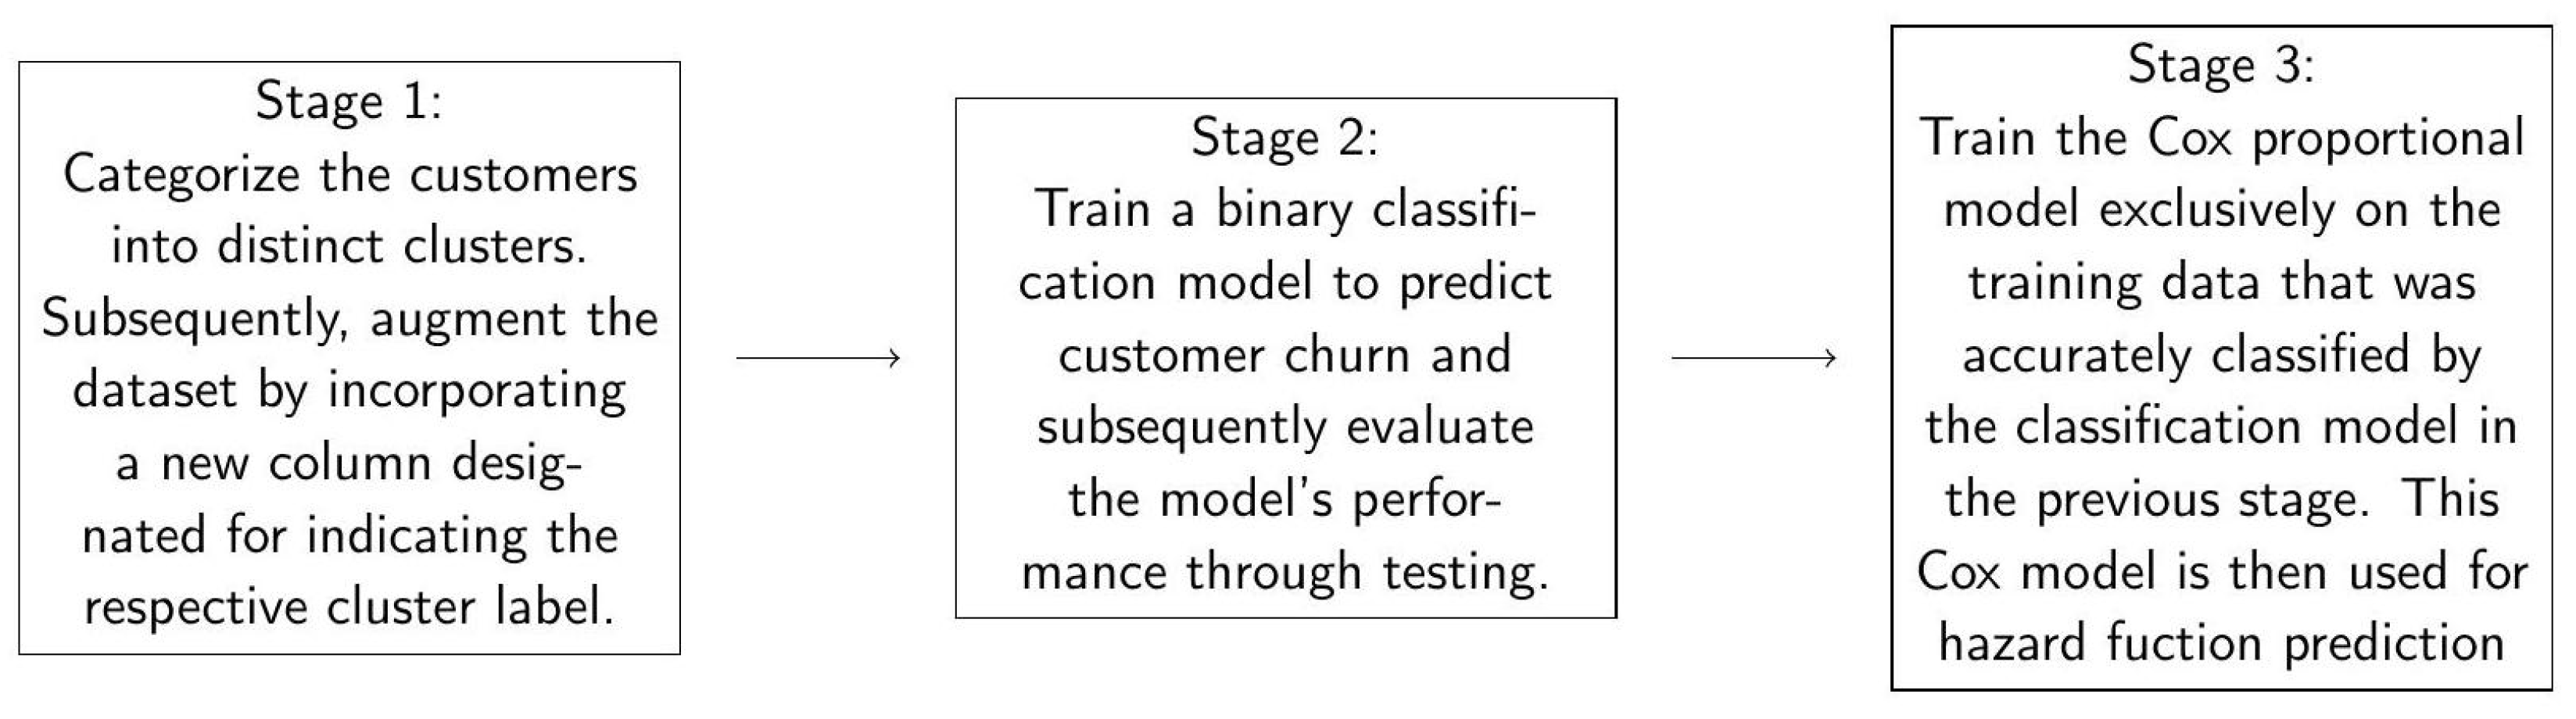
The paper executed a three-stage hybrid modelling approach to predict customer churn, as shown in Figure 1. This structured methodology aims to integrate the strengths of different techniques, starting with customer segmentation, progressing to classification, and concluding with survival analysis. Both oversampled (Dataset 1) and SMOTE-processed (Dataset 2) datasets were subjected to this analysis.
Figure 1.
The Hybrid Models Process.
The initial phase of the hybrid model’s development featured clustering to classify customers into different groups according to their common characteristics. This approach is favoured for its capability to oversee customer segments rather than individual customers. Two clustering strategies were employed:
- K-means Clustering (KM)This method partitions data into k predetermined clusters, ensuring that the observations within each cluster are similar to each other while differing from those in other clusters [46]. The algorithm locates cluster centroids by minimising the overall within-cluster variation [47]. The k -means optimisation function, which uses squared Euclidean distance for n observations and p variables, is defined as:where represents the k clusters. This process involves the random assignment of observations to ’K’ clusters, the computation of new centroids (cluster means), the calculation of distances between data points and centroids, and the reassignment of points to the nearest centroid until no additional reassignments occur [48]. For Dataset 1, K-means produced Dataset 1.1, and for Dataset 2, it generated Dataset 2.1.
- Agglomerative Clustering (AC)This is a method of hierarchical clustering in which each observation begins as its own distinct cluster [49]. In the following steps, the two closest clusters are combined until all observations are contained within a single cluster [50]. The final clustering is determined by the selection of a cut-off distance. The dissimilarity measure employed was the Euclidean distance, which is calculated as:where x and y denote two data points, and p refers to the number of covariates. The Ward.D linkage method was found to be more effective for merging clusters. In the analysis of Dataset 1, Agglomerative clustering yielded Dataset 1.2, and for Dataset 2, it produced Dataset 2.2.
After the clustering has been performed, a new column with the cluster labels was integrated into the datasets to facilitate the next phase of classification.
The second phase was centred on the development of binary classification models designed to predict customer churn. This included the application of Logistic Regression, Artificial Neural Networks, and Decision Trees enhanced by boosting, utilising the four datasets generated from the clustering phase (Datasets 1.1, 1.2, 2.1, and 2.2). This resulted in twelve two-stage hybrid models.
- Logistic Regression (LR)This is a supervised statistical model that serves classification tasks by predicting the likelihood of an event (e.g., churn) based on a set of predictor variables [18,51]. The outcome is a probability value that exists between 0 and 1 [51]. The logistic regression function for binary classification is defined as:where x is the matrix of predictors, p is the number of predictor variables, and is the vector of coefficients.
- Artificial Neural Networks (ANN)These are machine learning strategies that replicate the characteristics of biological neural networks, consisting of interconnected neurons arranged in layers: input, hidden, and output [52,53]. Information is propagated from the input layer to the output layer, with each connection assigned a weight and each neuron applying an activation function to the sum of its weighted inputs [54,55]. The equations for forward propagation are:where is the weighted sum of inputs to neuron i, is the weight connecting neuron j to neuron i, is the output of neuron i after applying the activation function f, and is the bias for neuron i. Weights are updated using backpropagation based on prediction errors.
- Decision Trees (DT)This supervised learning algorithm partitions the feature space into non-overlapping regions [56]. Classification trees predict the class an observation belongs to. The algorithm starts at a root node and recursively splits into child nodes, minimising impurity measures like Gini Index or Entropy [57,58]. Boosting was applied to enhance the performance of decision trees.
Only observations from the training datasets that were correctly classified by these models were retained for the subsequent stage, a process referred to as “instance filtering”. This filtering step aims to enhance the signal-to-noise ratio for survival analysis by training the Cox model on a cleaner subset of data, consisting of customers with a clearly defined and accurately predicted churn outcome. While this approach intentionally sacrifices data quantity for an improvement in data quality, it is applied solely to the training set to mitigate overfitting risks, with the entire pipeline later evaluated on the unseen test data.
The final stage involved conducting survival analysis using the Cox Proportional Hazard (Cox PH) model. This model is a regression survival model used to assess how covariates influence survival time [59]. It examines how specific covariates influence the hazard rate of an event (churn) at a particular point in time [60,61]. The hazard function , as introduced by Stare et al. [62], for the Cox model is represented as follows:
where t is the survival time, are the covariates, are the coefficients measuring the impact of covariates, and is the baseline hazard when all covariates are zero. The hazard ratio, , indicates the effect of a covariate on survival: a ratio greater than one means increasing the covariate increases the event’s hazard and decreases survival length. In contrast, a ratio less than one means the opposite [63]. The Cox models were applied to the test datasets to generate hazard rates, which were then used to determine if a customer had churned over 12 months.
2.4. Evaluation Methods
To assess and compare the performance of the established hybrid models, a set of evaluation metrics was employed. These metrics are categorised into two main groups: those that balance model fit with complexity (Akaike Information Criterion (AIC) and Bayesian Information Criterion (BIC)), and those that evaluate predictive accuracy (Accuracy, Precision, Recall/Sensitivity, F1-score, Specificity, and Area Under the Receiver Operating Characteristic Curve (AUC-ROC)). The formulas for these metrics are presented in Table 4 below.
Table 4.
Applied Model Performance Metrics.
Table 5.
Confusion Matrix.
3. Results
3.1. Exploratory Data Summary
The paper presents descriptive statistics for numerical variables in Table 6. For instance, the analysis of call failures indicated that a significant number of customers experienced very few failures, with an average of approximately 8, suggesting that the quality of the company’s call services was satisfactory. The subscription length revealed that customers typically had subscriptions lasting three months or longer, with a notable proportion between 30 and 38 months. Variables such as ‘seconds of use’, ‘frequency of use’, and ‘frequency of SMS’ provided insights into customer reliance on the company’s services. For example, customers averaged 4473 s on calls, and a considerable group had usage frequencies ranging from 25 to 75. The distributions of ‘distinct called numbers’, ‘customer value’, ‘false positive’, and ‘false negative’ were generally skewed to the right, as indicated by mean values that exceeded the medians. Figure A1 in the Appendix A also depicts the visual distribution of these variables.
Table 6.
Summary Statistics for Numerical Variables.
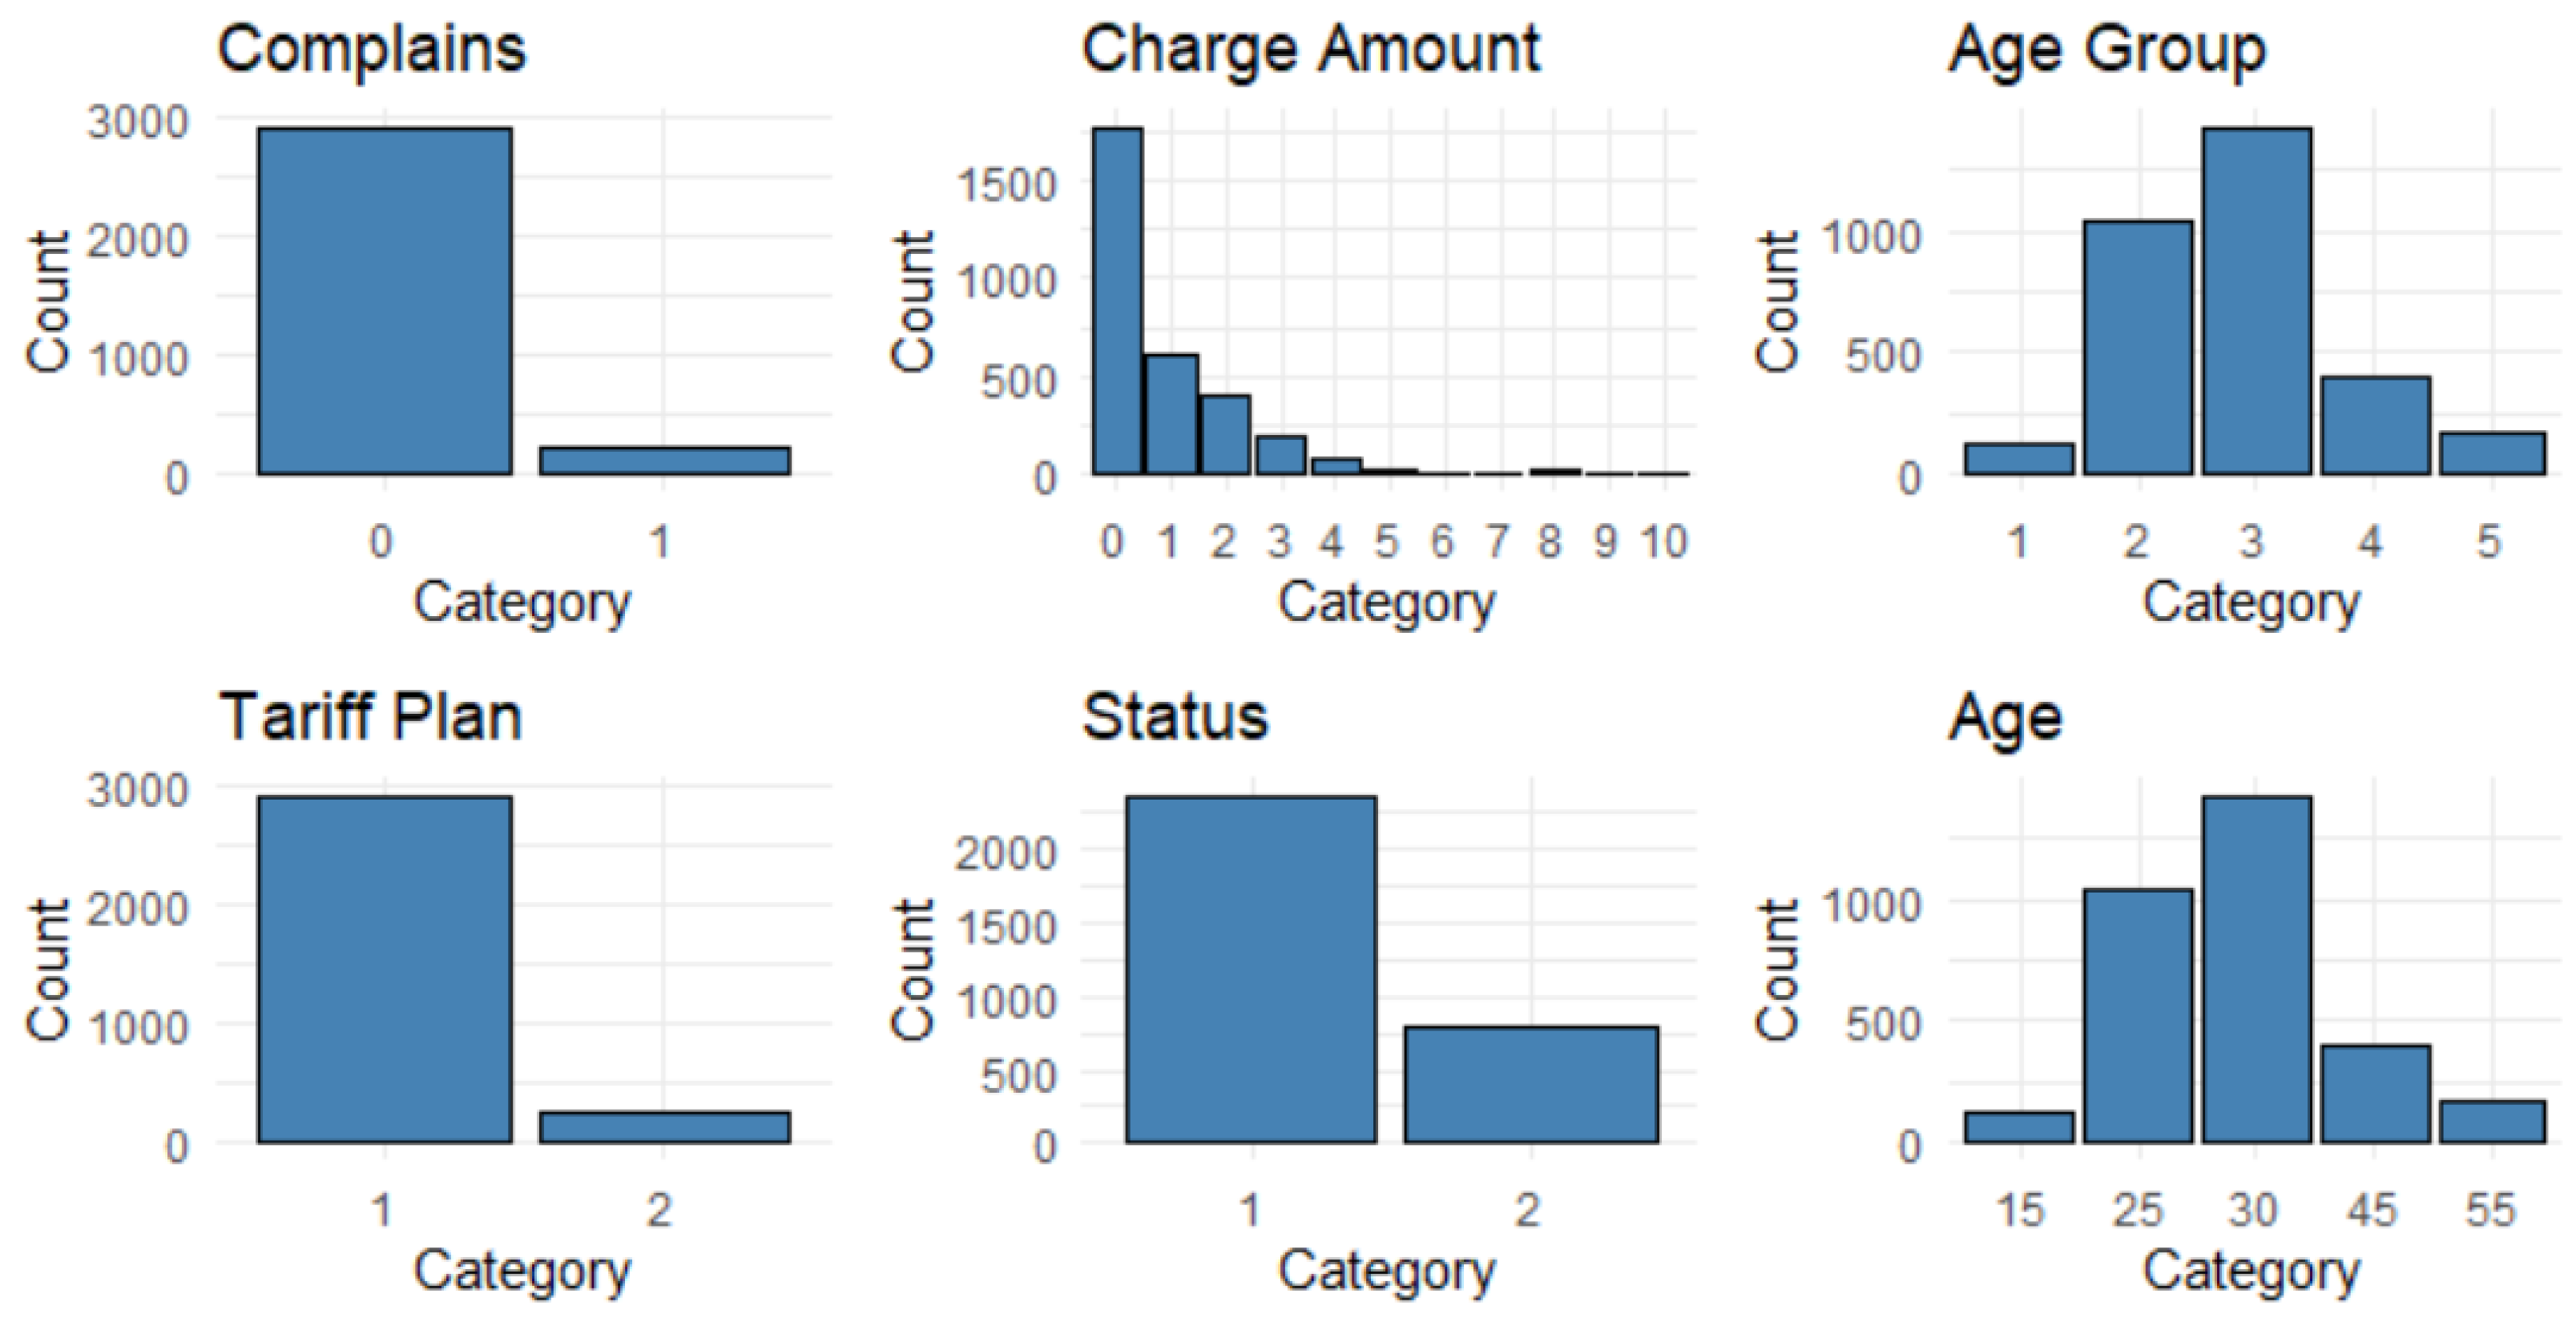
An assessment of categorical variables, as shown by the bar charts in Figure A2 (in the Appendix A), indicated that a substantial number of customers had not raised any complaints, suggesting a high level of satisfaction. A significant percentage of customers incurred relatively small charge amounts. Age group 3 included more individuals than the other groups, and many customers favoured the ‘pay as you go’ tariff plan over contractual plans. The number of active customers was greater than that of inactive ones.
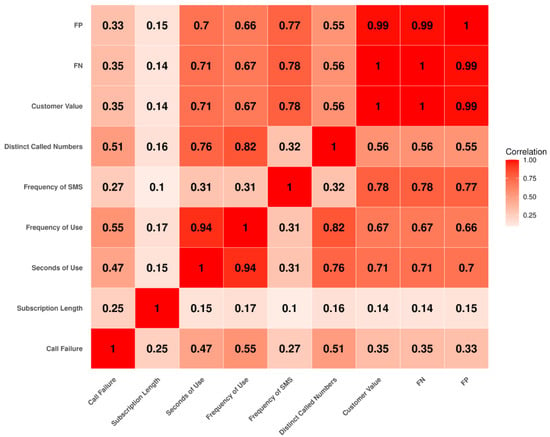
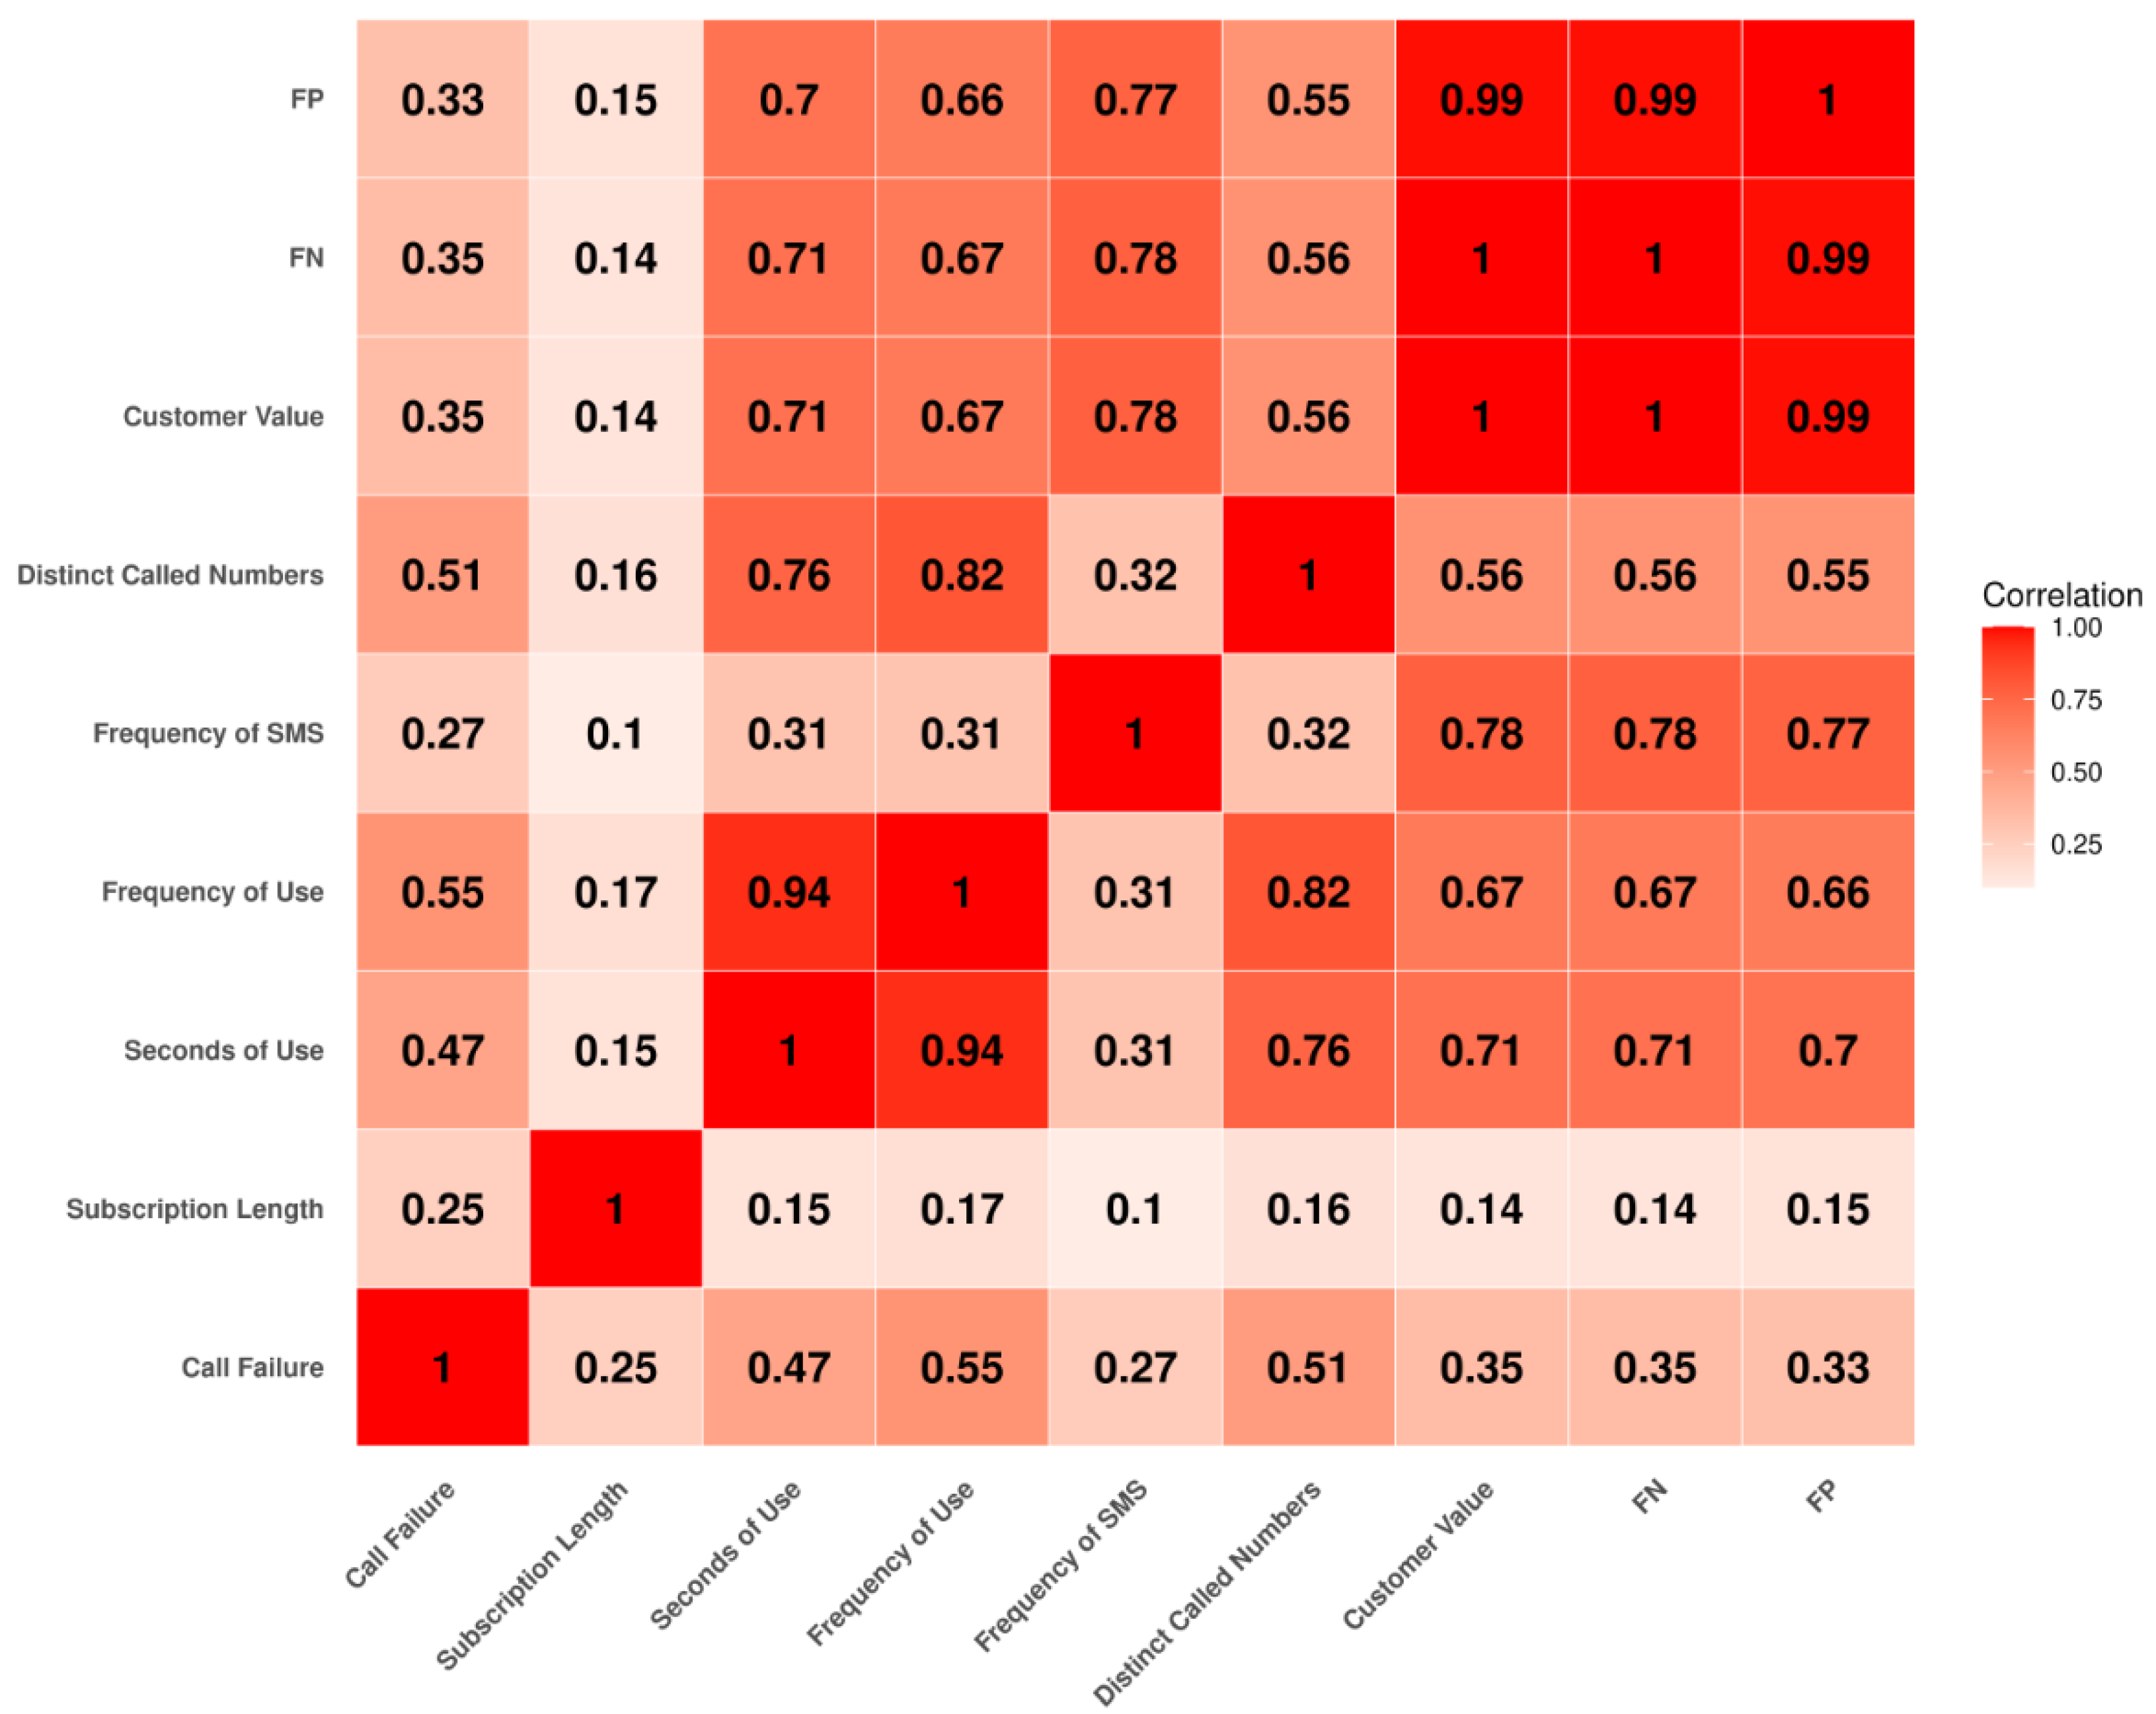
The correlation analysis performed on numerical variables showed positive correlations, with strong linear relationships observed between pairs such as ‘False Negative’ and ‘customer value’, ‘False Positive’ and ‘customer value’, and ‘frequency of use’ with ’seconds of use’ (Figure 2).
Figure 2.
Correlation of Numerical Variables.
3.2. Cox Models
Two Cox models, designated as Cox Model 1 and Cox Model 2, were constructed utilising Datasets 1 and 2, respectively. These models underwent testing with a test dataset comprising 629 observations. The assessment of goodness of fit for these models, as determined by AIC and BIC, along with prediction performance metrics such as Accuracy, Precision, Recall, F1-Score, and AUC-ROC, is presented in Table 7. In terms of model fit and complexity metrics, the AIC for Cox Model 1 was 31,441.13, while Cox Model 2 had an AIC of 17,324.98. Likewise, the BIC for Cox Model 1 was 31,588.31, and for Cox Model 2, it was 17,458.57. These findings indicate that Cox Model 2 provided a better fit to the data than Cox Model 1. For both Cox Model 1 and Cox Model 2, the prediction metrics were consistent, with Accuracy at 84.42%, Precision at 84.95%, Recall at 100%, F1-Score at 91.86%, and AUC-ROC at 80.51%.
Table 7.
Performance Metrics for Cox Models.
The findings demonstrated that the Smote-developed Cox model (Cox Model 2) provided a better fit to the data than the oversampling-developed model (Cox Model 1). Consequently, Cox Model 2 was selected as the optimal model for comparison with the three-stage hybrid models.
3.3. Hybrid Models
3.3.1. Stage 1: Clustering
K-means clustering was applied to both Dataset 1 and Dataset 2 to determine the optimal number of clusters using the Elbow method, Silhouette score, and Gap statistics. For Dataset 1, the Elbow method suggested 8 clusters, the Silhouette score recommended 2 clusters, and Gap statistics suggested 10 clusters. Dunn’s index values were computed for these suggestions, with 10 clusters having the highest Dunn’s index (0.02486025), leading to Dataset 1 being partitioned into 10 clusters (Dataset 1.1). For Dataset 2, the Elbow method suggested 2 clusters, the Silhouette score recommended 6 clusters, and Gap statistics suggested 10 clusters. Following the same decision rule, Dunn’s index was computed for 2, 6, and 10 clusters. In this instance, the configuration with 2 clusters yielded the highest Dunn’s index value (0.02572202), resulting in Dataset 2 being divided into 2 clusters to form Dataset 2.1.
Agglomerative Clustering: Agglomerative clustering was also applied to both Dataset 1 and Dataset 2, using the Euclidean distance metric and various linkage methods. The Ward.D linkage method demonstrated superior performance across both datasets. As a result, Dataset 1 was partitioned into 5 clusters (Dataset 1.2), and Dataset 2 was also clustered into 5 clusters (Dataset 2.2). Following Stage 1, four new datasets were created: Dataset 1.1 (Oversampling + K-means), Dataset 1.2 (Oversampling + Agglomerative Clustering), Dataset 2.1 (Smote + K-means), and Dataset 2.2 (Smote + Agglomerative Clustering). After stage 1, four datasets are generated; Table 8 provides a summary of these datasets.
Table 8.
Datasets Summary after Stage 1.
3.3.2. Stage 2: Classification
Stage 2 involved developing classification models using LR, ANN, and DT with boosting. These models were applied to datasets 1.1, 1.2, 2.1, and 2.2, resulting in twelve two-stage hybrid models.
The performance of two-stage hybrid models combining clustering and LR was assessed (Table 9). AC + LR (Dataset 2.2) showed a better fit to the data with lower AIC (1407.51) and BIC (1588.29) values. KM + LR (Dataset 2.1) outperformed other models in terms of prediction metrics, achieving an accuracy of 0.8537, a precision of 0.97, a recall of 0.8528, a specificity of 0.8586, and an AUC-ROC of 0.9413. This model was selected for Stage 3 development.
Table 9.
Performance Metrics for Clustering + LR.
Various combinations of activation functions and hidden layers were considered for two-stage hybrid models combining clustering with ANN. Table 10 compares the performance of these four models. The KM + ANN (Dataset 1.1) model generally outperformed other models in terms of accuracy (0.8792), recall (0.9358), F1-score (0.9288), and AUC-ROC (0.9289). Despite having lower specificity (0.5758) and precision (0.9219) compared to some others, its overall performance led to its selection for Stage 3 development.
Table 10.
Performance Metrics for Clustering + ANN.
Four hybrid models combining clustering and DT with boosting were generated from each dataset. Table 11 compares the performance metrics of these models. AC + DT (Dataset 2.2) outperformed the other models across all metrics, with an Accuracy of 0.8649, a precision of 0.9847, a recall of 0.8528, a specificity of 0.9295, an F1-score of 0.9140, and an AUC-ROC of 0.8910. This model was chosen for Stage 3 development.
Table 11.
Performance Metrics for Clustering + DT.
3.3.3. Stage 3: Survival Analysis
Three-stage hybrid models were constructed using the Cox model as the third stage, incorporating the best-performing models from Stage 2: KM + LR (Dataset 2.1), KM + ANN (Dataset 1.1), and AC + DT (Dataset 2.2). For each hybrid model, only observations correctly classified by the Stage 2 classification model were used to build the Cox model. For example, 2213 out of 2519 observations were used for KM + LR + Cox (Dataset 2.1), 3690 out of 4248 for KM + ANN + Cox (Dataset 1.1), and 2221 out of 2519 for AC + DT + Cox (Dataset 2.2).
The performance metrics for these three-stage hybrid models were evaluated (Table 12). The KM + LR + Cox model demonstrated the best goodness of fit with an AIC of 14,497 and a BIC of 14,633. In terms of predictive performance, KM + LR + Cox outperformed the other three-stage hybrid models and Cox Model 2 in Accuracy (88.24%), Precision (93.18%), Specificity (63.64%), and F1-score (93.01%). Cox Model 2, however, showed superior Recall (100%) and AUC-ROC (80.51%) compared to the hybrid models. Despite Cox Model 2’s higher Recall and AUC-ROC, all hybrid models generally surpassed the original Cox models in other performance metrics, indicating their overall superior performance. Consequently, KM + LR + Cox was identified as the best hybrid model.
Table 12.
Performance Metrics for 3-Stage Hybrid Models.
The best hybrid model, KM + LR + Cox, was used to assess the impact of each covariate on the time to churn (Table 13). An increase in a covariate’s value that leads to an increase in survival length suggests a positive effect, while a decrease in survival length indicates a negative effect. For instance, Cluster 1 showed a decrease in survival length, implying that individuals in Cluster 1 are less likely to churn (non-churners), while Cluster 2 (encoded with a value of 0) is more likely to churn (churners). The company should focus on individuals in Cluster 2 to prevent churn.
Table 13.
Covariate effect on Survival Time.
4. Discussion
This paper aimed to develop and compare various hybrid models for predicting customer churn in the telecommunications sector. The primary finding was that the three-stage hybrid models generally outperformed the standalone Cox models in most predictive performance metrics, with the K-means + Logistic Regression + Cox (KM + LR + Cox) model emerging as the best performer. Specifically, KM + LR + Cox achieved superior Accuracy (88.24%), Precision (93.18%), Specificity (63.64%), and F1-score (93.01%) compared to other models. While Cox Model 2 demonstrated higher Recall (100%) and AUC-ROC (80.51%), the overall superior performance of the hybrid models in other key metrics highlighted their effectiveness. Despite the absence of formal statistical significance testing, the consistent superior performance across both predictive and information-theoretic metrics delivers substantial empirical evidence of its effectiveness. This multi-dimensional evaluation framework serves as a robust foundation for model selection, especially in practical applications where advancements in prediction accuracy are significant for business decision-making.
Furthermore, the SMOTE technique was identified as a more effective method for handling class imbalance compared to oversampling. KM clustering with two clusters, representing churners and non-churners, proved to be the most effective for customer segmentation, and LR outperformed other machine learning models in the classification stage.
The finding that hybrid models generally outperform individual models aligns with existing literature, such as research by Liu et al. [69], He and Ding [70] and Jamalian and Foukerdi [61], who noted that combining multiple models typically yields better results. Huang and Kechadi [71] also successfully used hybrid models combining unsupervised clustering with decision trees for churn prediction, demonstrating the value of clustering in identifying churn-related features. The application of survival models, specifically the Cox proportional hazard model, for predicting churn duration and assessing covariate impact is consistent with prior research by AL-Najuar et al. [32], Larivière and Van den Poel [63], Ochola [72], and Kimitei et al. [30]. This paper further advances this area by integrating survival analysis into a multi-stage hybrid framework, providing a more comprehensive approach to churn prediction.
The primary strength of the proposed three-stage hybrid model is its enhanced interpretability and its ability to surpass simple churn classification, providing predictions on the timing of churn and the influence of particular variables on this duration. This comprehensive insight, which merges customer segmentation, classification, and survival analysis, is crucial for timely and targeted interventions, a feature that simpler classification approaches and many black box deep learning models often fail to provide.
This research makes a significant contribution to the field of customer churn prediction by developing and validating a robust three-stage hybrid modelling approach. The identified KM + LR + Cox model offers a powerful tool for telecommunications companies to accurately predict customer churn and understand the factors influencing churn time. By segmenting customers into distinct groups in Stage 1, classifying potential churners in Stage 2, and then applying survival analysis in Stage 3, the model provides actionable insights. For example, the analysis of covariate impact revealed that individuals in Cluster 2 are more likely to churn, indicating a clear target group for retention efforts. This finding has considerable business ramifications, as it empowers firms to concentrate on high-risk customers through specific retention strategies such as tailored offers, improved service support, and proactive engagement. Additionally, it promotes more efficient resource distribution by concentrating efforts where they are most required, while insights into the features of Cluster 2 can uncover possible weaknesses in pricing, service quality, or product offerings. Addressing these concerns can mitigate churn within this segment and elevate overall customer satisfaction and long-term retention.
Furthermore, this multi-faceted approach moves beyond simple churn classification to offer predictions on the time to churn and the impact of specific variables on this duration, which is crucial for timely and targeted interventions. The emphasis on SMOTE for class imbalance treatment and the superiority of LR in the classification stage also provide valuable methodological guidance for future research.
Key strengths of this paper include its comprehensive hybrid approach, which integrates clustering, classification, and survival analysis for a nuanced understanding of churn behaviour. The effective handling of class imbalance through SMOTE also enhances the reliability of the model’s performance. Furthermore, the model provides actionable insights by identifying specific customer segments and covariates influencing churn time, offering practical guidance for retention strategies. A limitation of this paper is its reliance on a dataset from an Iranian telecommunications company, which may limit the generalisability of specific findings to other regions or industries. The multi-stage nature of hybrid models, while effective, can also introduce complexity in implementation and interpretation.
5. Conclusions
This paper proposes a three-stage hybrid modelling framework that integrates clustering, classification, and survival analysis to predict customer churn and its timing in a unified manner. The findings identified the K-means + Logistic Regression + Cox (KM + LR + Cox) model as the most effective, achieving superior results in Accuracy, Precision, Recall, and F1-score. The paper also validated SMOTE’s effectiveness in addressing class imbalance and confirmed LR’s suitability for classification. Notably, the model provides actionable insights by identifying high-risk customer segments and significant churn drivers; for example, customers in Cluster 2 were identified as being more likely to churn, thus presenting a clear target for retention strategies.
Despite the significance of these contributions, the study faces limitations due to the use of a single dataset, which may hinder its generalizability. Future research should seek to validate the model across multiple datasets and explore other survival models, such as exponential or Weibull methods, to improve the accuracy of time-to-churn estimations. Additionally, further work is essential to evaluate and reduce potential overfitting and information loss resulting from the instance filtering process. Lastly, future research should delve into comparisons with other state-of-the-art methods, including deep learning models. This comparison should not solely emphasise predictive accuracy but also consider aspects such as interpretability, computational costs, and the capability to provide temporal insights.
Overall, the KM + LR + Cox framework provides a practical and effective approach for churn prediction and supports the development of targeted customer retention strategies.
Author Contributions
Conceptualization, F.F.M., M.M. and K.L.; Methodology, M.M.; Formal analysis, F.F.M., M.M. and K.L.; Investigation, F.F.M. and K.L.; Resources, F.F.M.; Data curation, M.M.; Writing—original draft, M.M.; Writing—review & editing, F.F.M. and K.L.; Visualization, M.M.; Supervision, F.F.M.; Project administration, F.F.M. All authors have read and agreed to the published version of the manuscript.
Funding
This research received no external funding.
Institutional Review Board Statement
Not applicable.
Informed Consent Statement
Not applicable.
Data Availability Statement
The datasets used and analyzed during the current study are available from the corresponding author on reasonable request.
Conflicts of Interest
The authors declare no competing interests.
Appendix A
Figure A1.
Numerical Variables Distributions.
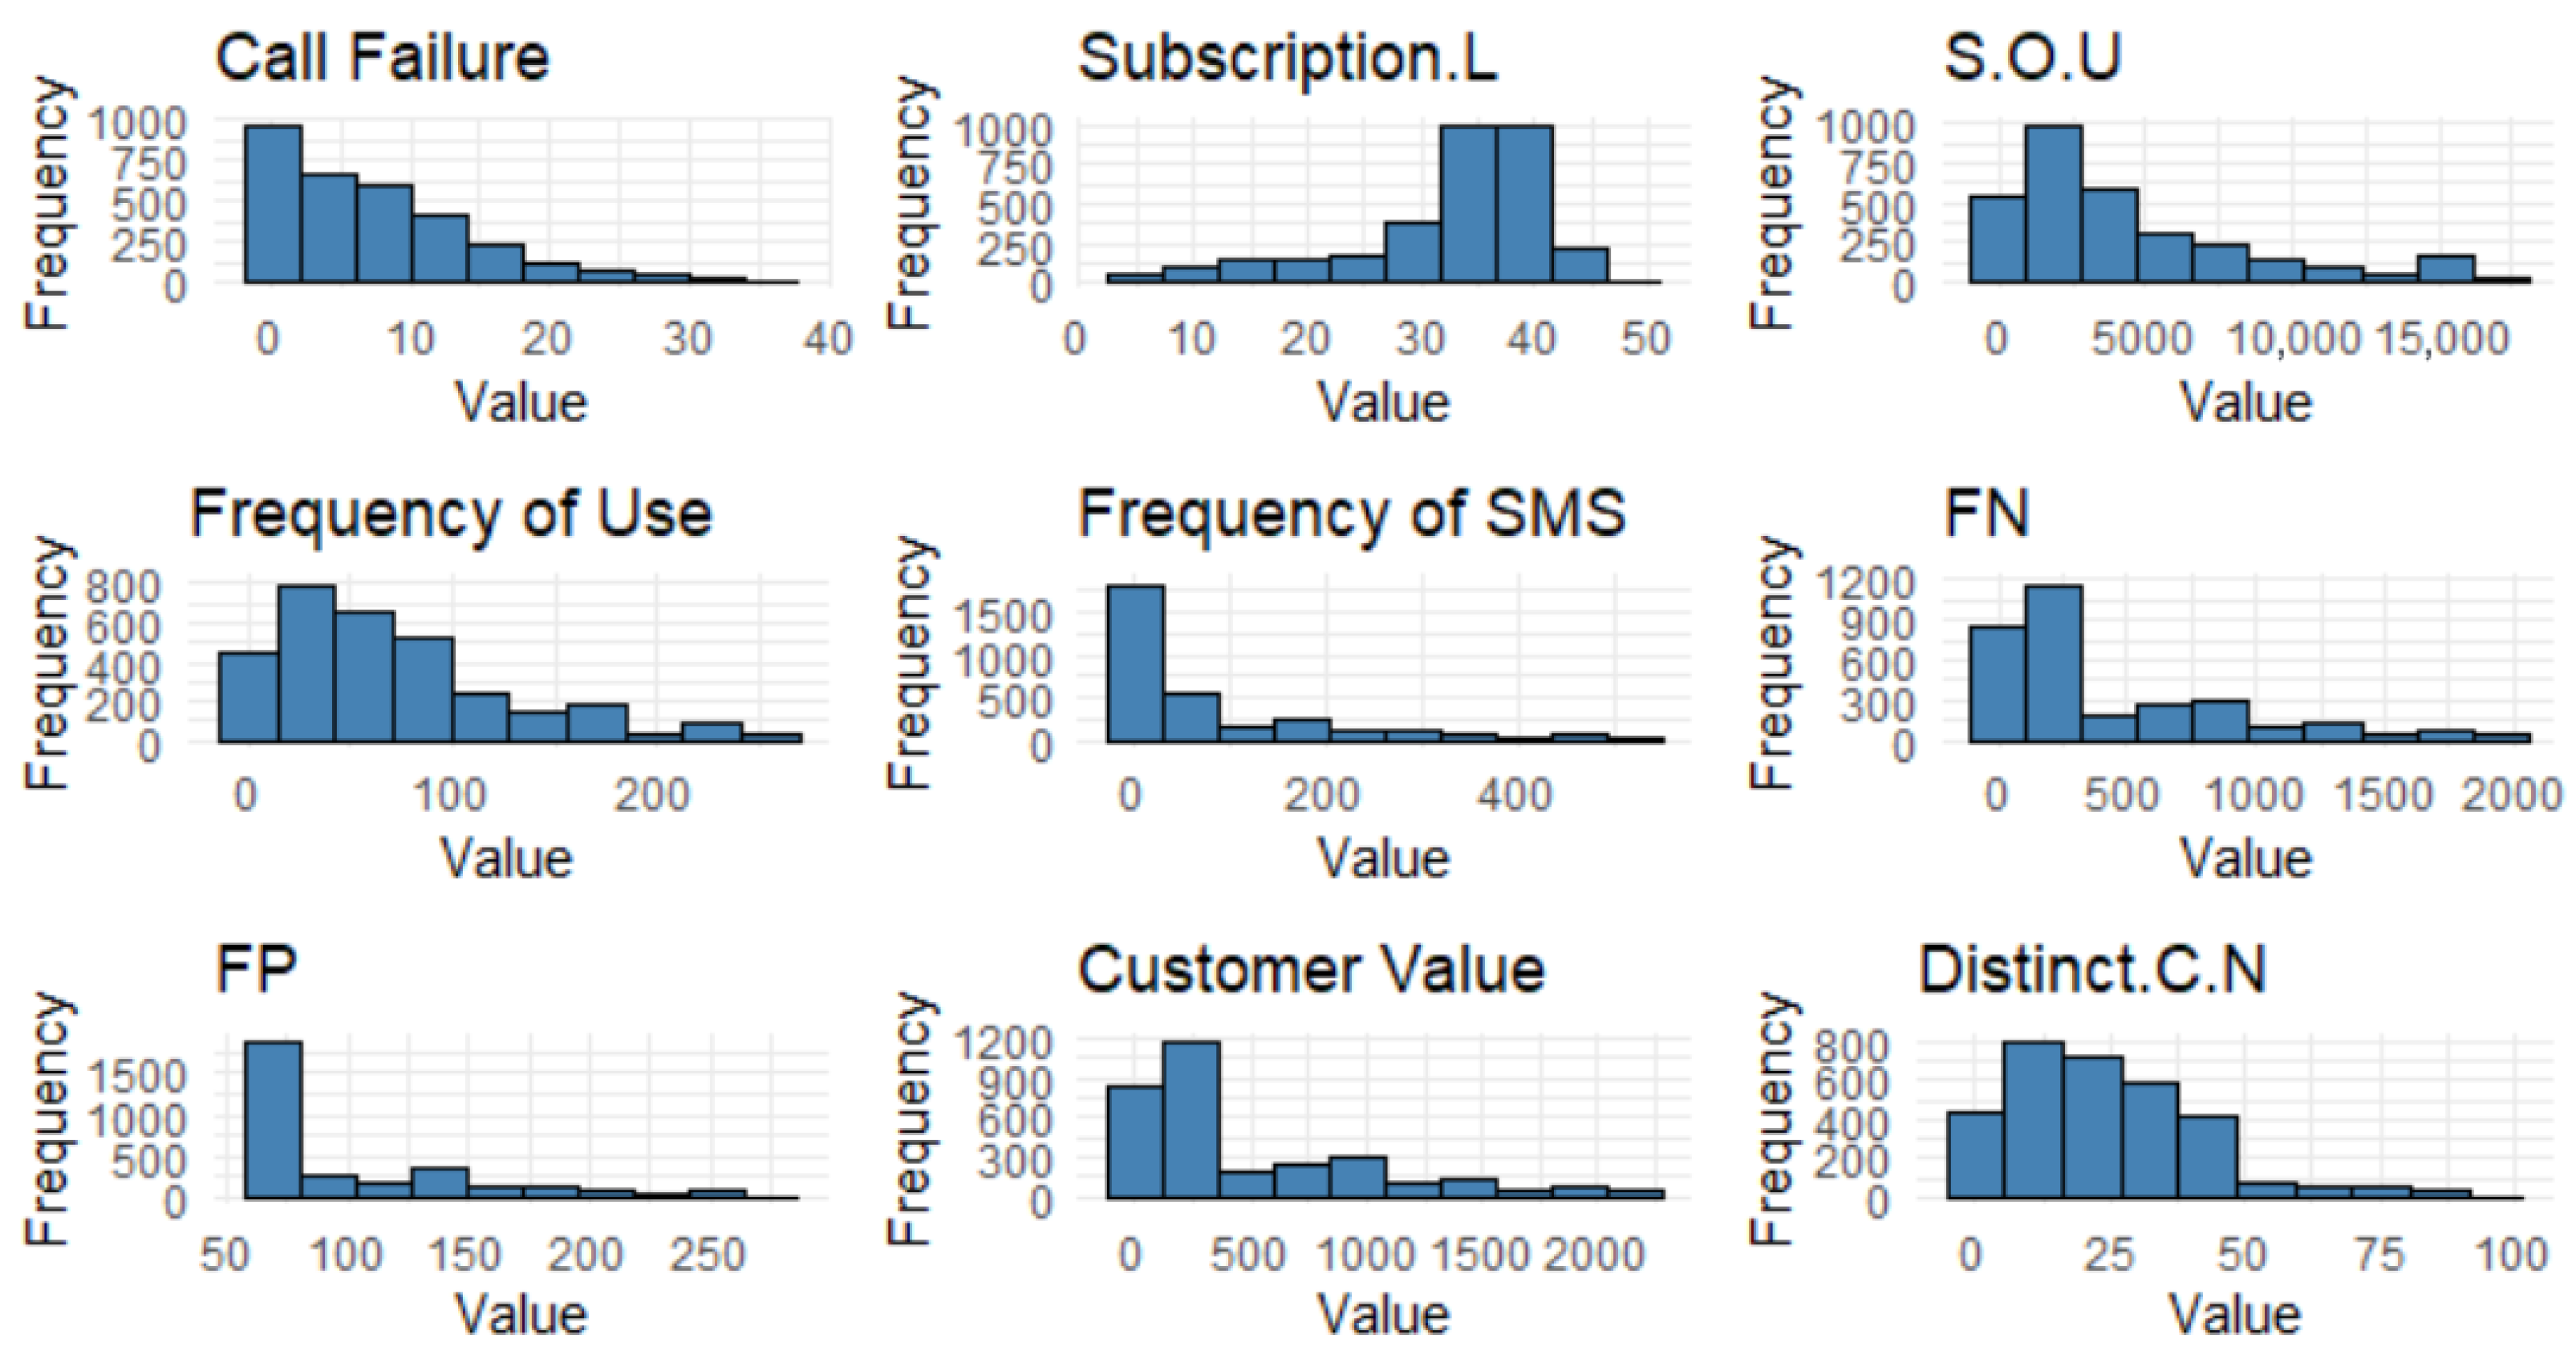
Figure A2.
Categorical Variables.
References
- Mbarek, R.; Baeshen, Y. Telecommunications Customer Churn and Loyalty Intention; Sumy State University: Sumy, Ukraine, 2019. [Google Scholar]
- Ribeiro, H.; Barbosa, B.; Moreira, A.C.; Rodrigues, R.G. Determinants of churn in telecommunication services: A systematic literature review. Manag. Rev. Q. 2024, 74, 1327–1364. [Google Scholar] [CrossRef] [Scilit]
- Bhaal, N.; Adarsh; Awasthi, P.; Usha, G. A comparative framework for Churn analysis in banking and telecom sector. AIP Conf. Proc. 2024, 3075, 020078. [Google Scholar] [CrossRef] [Scilit]
- Bhattacharyya, J.; Dash, M.K. What do we know about customer churn behaviour in the telecommunication industry? A bibliometric analysis of research trends, 1985–2019. FIIB Bus. Rev. 2022, 11, 280–302. [Google Scholar] [CrossRef] [Scilit]
- Majka, M. Understanding Churn Rate. Available online: https://www.researchgate.net/publication/382592085_Understanding_Churn_Rate (accessed on 15 January 2026).
- Maleki, M.; Anand, D. The critical success factors in customer relationship management (CRM) (ERP) implementation. J. Mark. Commun. 2008, 4, 67. [Google Scholar]
- Lu, J. Predicting customer churn in the telecommunications industry—An application of survival analysis modeling using SAS. In Proceedings of the SAS User Group International (SUGI27) Online Proceedings, Orlando, FL, USA, 14–17 April 2002; SAS Institute Inc.: Cary, NC, USA, 2002. Number 114. [Google Scholar]
- Neslin, S.A.; Gupta, S.; Kamakura, W.; Lu, J.; Mason, C.H. Defection detection: Measuring and understanding the predictive accuracy of customer churn models. J. Mark. Res. 2006, 43, 204–211. [Google Scholar] [CrossRef] [Scilit]
- den Poel, D.V.; Lariviere, B. Customer attrition analysis for financial services using proportional hazard models. Eur. J. Oper. Res. 2004, 157, 196–217. [Google Scholar] [CrossRef] [Scilit]
- Amin, A.; Anwar, S.; Adnan, A.; Nawaz, M.; Alawfi, K.; Hussain, A.; Huang, K. Customer churn prediction in the telecommunication sector using a rough set approach. Neurocomputing 2017, 237, 242–254. [Google Scholar] [CrossRef] [Scilit]
- Khan, Y.; Shafiq, S.; Naeem, A.; Ahmed, S.; Safwan, N.; Hussain, S. Customers churn prediction using artificial neural networks (ANN) in telecom industry. Int. J. Adv. Comput. Sci. Appl. 2019, 10, 132–142. [Google Scholar] [CrossRef] [Scilit]
- Lu, N.; Lin, H.; Lu, J.; Zhang, G. A customer churn prediction model in telecom industry using boosting. IEEE Trans. Ind. Inform. 2012, 10, 1659–1665. [Google Scholar] [CrossRef] [Scilit]
- Mitkees, I.M.; Badr, S.M.; ElSeddawy, A.I.B. Customer churn prediction model using data mining techniques. In Proceedings of the 2017 13th International Computer Engineering Conference (ICENCO); IEEE: New York, NY, USA, 2017; pp. 262–268. [Google Scholar]
- Sato, T.; Huang, B.Q.; Huang, Y.; Kechadi, M.T.; Buckley, B. Using PCA to predict customer churn in telecommunication dataset. In Proceedings of the Advanced Data Mining and Applications: 6th International Conference, ADMA 2010, Chongqing, China, 19–21 November 2010; Proceedings, Part II, Lecture Notes in Computer Science; Springer: Berlin/Heidelberg, Germany, 2010; Volume 6441, pp. 326–335. [Google Scholar]
- Rothenbuehler, P.; Runge, J.; Garcin, F.; Faltings, B. Hidden Markov Models for churn prediction. In Proceedings of the 2015 SAI Intelligent Systems Conference (IntelliSys); IEEE: New York, NY, USA, 2015; pp. 723–730. [Google Scholar]
- Phadke, C.; Uzunalioglu, H.; Mendiratta, V.B.; Kushnir, D.; Doran, D. Prediction of subscriber churn using social network analysis. Bell Labs Tech. J. 2013, 17, 63–76. [Google Scholar] [CrossRef] [Scilit]
- Huang, B.; Kechadi, M.T.; Buckley, B. Customer churn prediction in telecommunications. Expert Syst. Appl. 2012, 39, 1414–1425. [Google Scholar] [CrossRef] [Scilit]
- Jain, H.; Khunteta, A.; Srivastava, S. Churn prediction in telecommunication using logistic regression and logit boost. Procedia Comput. Sci. 2020, 167, 101–112. [Google Scholar] [CrossRef] [Scilit]
- Keramati, A.; Jafari-Marandi, R.; Aliannejadi, M.; Ahmadian, I.; Mozaffari, M.; Abbasi, U. Improved churn prediction in telecommunication industry using data mining techniques. Appl. Soft Comput. 2014, 24, 994–1012. [Google Scholar] [CrossRef] [Scilit]
- Bilal Zorić, A. Predicting customer churn in banking industry using neural networks. Interdiscip. Descr. Complex Syst. INDECS 2016, 14, 116–124. [Google Scholar] [CrossRef] [Scilit]
- Zhao, Y.; Li, B.; Li, X.; Liu, W.; Ren, S. Customer churn prediction using improved one-class support vector machine. In Proceedings of the International Conference on Advanced Data Mining and Applications; Springer: Berlin/Heidelberg, Germany, 2005; pp. 300–306. [Google Scholar]
- Mohamed, F.A.; Al-Khalifa, A.K. A review of machine learning methods for predicting churn in the telecom sector. In Proceedings of the 2023 International Conference On Cyber Management And Engineering (CyMaEn); IEEE: New York, NY, USA, 2023; pp. 164–170. [Google Scholar]
- Sholeha, S.; Faid, M.; Yaqin, M. Prediksi Prediksi Perpindahan Pelanggan Pada Toko Online Menggunakan Metode Tree-Based Gradient Boosted Models. J. Comput. Syst. Inform. JoSYC 2024, 5, 605–614. [Google Scholar] [CrossRef] [Scilit]
- Coussement, K.; De Bock, K.W. Customer churn prediction in the online gambling industry: The beneficial effect of ensemble learning. J. Bus. Res. 2013, 66, 1629–1636. [Google Scholar] [CrossRef] [Scilit]
- Chen, G.H. An introduction to deep survival analysis models for predicting time-to-event outcomes. Found. Trends® Mach. Learn. 2024, 17, 921–1100. [Google Scholar] [CrossRef] [Scilit]
- Ali, Ö.G.; Arıtürk, U. Dynamic churn prediction framework with more effective use of rare event data: The case of private banking. Expert Syst. Appl. 2014, 41, 7889–7903. [Google Scholar] [CrossRef] [Scilit]
- Lembhe, A.; Lagad, Y.; Statistics, D.D.; Kamthe, R.; Swami, A.; Statistics, D.D. Survival Analysis of Customer Lifetime and Churn Prediction in the Telecom Industry. Int. J. Latest Technol. Eng. Manag. Appl. Sci. 2025, 14, 201–212. [Google Scholar] [CrossRef] [Scilit]
- Baek, E.T.; Yang, H.J.; Kim, S.H.; Lee, G.S.; Oh, I.J.; Kang, S.R.; Min, J.J. Survival time prediction by integrating cox proportional hazards network and distribution function network. BMC Bioinform. 2021, 22, 192. [Google Scholar] [CrossRef] [Scilit]
- Nurhaliza, S.; Sadik, K.; Saefuddin, A. A comparison of Cox proportional hazard and random survival forest models in predicting churn of the telecommunication industry customer. BAREKENG J. Ilmu Mat. Dan Terap. 2022, 16, 1433–1440. [Google Scholar] [CrossRef] [Scilit]
- Kimitei, S.; Agiro, D.; Ni, S.; Ni, H. Predictability & explainability of survival analysis in churn prediction. J. Mark. Anal. 2025, 1–17. [Google Scholar] [CrossRef] [Scilit]
- Bravante, J.J.A.; Robielos, R.A.C. Game Over: An Application of Customer Churn Prediction using Survival Analysis Modelling in Automobile Insurance. In Proceedings of the International Conference on Industrial Engineering and Operations Management Istanbul, Turkey, 7–10 March 2022; IEOM Society International: Southfield, MI, USA, 2022. [Google Scholar]
- AL-Najuar, D.; Al-Rousan, N.; AL-NajJar, H. Machine learning to develop credit card customer churn prediction. J. Theor. Appl. Electron. Commer. Res. 2022, 17, 1529–1542. [Google Scholar] [CrossRef] [Scilit]
- Periáñez, Á.; Saas, A.; Guitart, A.; Magne, C. Churn prediction in mobile social games: Towards a complete assessment using survival ensembles. In Proceedings of the 2016 IEEE International Conference on Data Science and Advanced Analytics (DSAA); IEEE: New York, NY, USA, 2016; pp. 564–573. [Google Scholar]
- Jamal, Z.; Bucklin, R.E. Improving the diagnosis and prediction of customer churn: A heterogeneous hazard modeling approach. J. Interact. Mark. 2006, 20, 16–29. [Google Scholar] [CrossRef] [Scilit]
- Hudaib, A.; Dannoun, R.; Harfoushi, O.; Obiedat, R.; Faris, H. Hybrid data mining models for predicting customer churn. Int. J. Commun. Netw. Syst. Sci. 2015, 8, 91. [Google Scholar] [CrossRef]
- Tsai, C.F.; Lu, Y.H. Customer churn prediction by hybrid neural networks. Expert Syst. Appl. 2009, 36, 12547–12553. [Google Scholar] [CrossRef] [Scilit]
- Bose, I.; Chen, X. Hybrid models using unsupervised clustering for prediction of customer churn. J. Organ. Comput. Electron. Commer. 2009, 19, 133–151. [Google Scholar] [CrossRef] [Scilit]
- Zhang, Y.; Qi, J.; Shu, H.; Cao, J. A hybrid KNN-LR classifier and its application in customer churn prediction. In Proceedings of the 2007 IEEE International Conference on Systems, Man and Cybernetics; IEEE: New York, NY, USA, 2007; pp. 3265–3269. [Google Scholar]
- Sundarkumar, G.G.; Ravi, V. A novel hybrid undersampling method for mining unbalanced datasets in banking and insurance. Eng. Appl. Artif. Intell. 2015, 37, 368–377. [Google Scholar] [CrossRef] [Scilit]
- Khattak, A.; Mehak, Z.; Ahmad, H.; Asghar, M.U.; Asghar, M.Z.; Khan, A. Customer churn prediction using composite deep learning technique. Sci. Rep. 2023, 13, 17294. [Google Scholar] [CrossRef] [Scilit]
- Liu, R.; Ali, S.; Bilal, S.F.; Sakhawat, Z.; Imran, A.; Almuhaimeed, A.; Alzahrani, A.; Sun, G. An intelligent hybrid scheme for customer churn prediction integrating clustering and classification algorithms. Appl. Sci. 2022, 12, 9355. [Google Scholar] [CrossRef] [Scilit]
- Mouli, K.C.; Raghavendran, C.V.; Bharadwaj, V.; Vybhavi, G.; Sravani, C.; Vafaeva, K.M.; Deorari, R.; Hussein, L. An analysis on classification models for customer churn prediction. Cogent Eng. 2024, 11, 2378877. [Google Scholar] [CrossRef] [Scilit]
- Zhang, J.; Fu, J.; Zhang, C.; Ke, X.; Hu, Z. Not too late to identify potential churners: Early churn prediction in telecommunication industry. In Proceedings of the 3rd IEEE/ACM International Conference on Big Data Computing, Applications and Technologies, Shanghai, China, 6–9 December 2016; pp. 194–199. [Google Scholar]
- Chawla, N.V.; Bowyer, K.W.; Hall, L.O.; Kegelmeyer, W.P. SMOTE: Synthetic minority over-sampling technique. J. Artif. Intell. Res. 2002, 16, 321–357. [Google Scholar] [CrossRef] [Scilit]
- Saputro, D.R.S.; Wahyu, N.L.; Widyaningsih, Y. Performance of ridge regression, least absolute shrinkage and selection operator, and elastic net in overcoming multicollinearity. J. Multidiscip. Appl. Nat. Sci. 2025, 5, 370–382. [Google Scholar] [CrossRef] [Scilit]
- Sinaga, K.P.; Yang, M.S. Unsupervised K-means clustering algorithm. IEEE Access 2020, 8, 80716–80727. [Google Scholar] [CrossRef] [Scilit]
- Na, S.; Xumin, L.; Yong, G. Research on k-means clustering algorithm: An improved k-means clustering algorithm. In Proceedings of the 2010 Third International Symposium on Intelligent Information Technology and Security Informatics; IEEE: New York, NY, USA, 2010; pp. 63–67. [Google Scholar]
- Wang, J.; Su, X. An improved K-Means clustering algorithm. In Proceedings of the 2011 IEEE 3rd International Conference on Communication Software and Networks; IEEE: New York, NY, USA, 2011; pp. 44–46. [Google Scholar]
- Oti, E.; Olusola, M. Overview of agglomerative hierarchical clustering methods. Br. J. Comput. Netw. Inf. Technol. 2024, 7, 14–23. [Google Scholar] [CrossRef] [Scilit]
- Murtagh, F.; Contreras, P. Algorithms for hierarchical clustering: An overview, II. Wiley Interdiscip. Rev. Data Min. Knowl. Discov. 2017, 7, e1219. [Google Scholar] [CrossRef] [Scilit]
- Hosmer, D.W., Jr.; Lemeshow, S.; Sturdivant, R.X. Applied Logistic Regression; John Wiley & Sons: Hoboken, NJ, USA, 2013. [Google Scholar]
- Dongare, A.; Kharde, R.; Kachare, A.D. Introduction to artificial neural network. Int. J. Eng. Innov. Technol. IJEIT 2012, 2, 189–194. [Google Scholar]
- Aggarwal, C.C. Neural Networks and Deep Learning; Springer: Berlin/Heidelberg, Germany, 2018; Volume 10, p. 3. [Google Scholar]
- Wu, Y.C.; Feng, J.W. Development and application of artificial neural network. Wirel. Pers. Commun. 2018, 102, 1645–1656. [Google Scholar] [CrossRef] [Scilit]
- Sharma, S.; Sharma, S.; Athaiya, A. Activation functions in neural networks. Towards Data Sci. 2017, 6, 310–316. [Google Scholar] [CrossRef] [Scilit]
- Kotsiantis, S.B. Decision trees: A recent overview. Artif. Intell. Rev. 2013, 39, 261–283. [Google Scholar] [CrossRef] [Scilit]
- Song, Y.Y.; Lu, Y. Decision tree methods: Applications for classification and prediction. Shanghai Arch. Psychiatry 2015, 27, 130. [Google Scholar]
- Charbuty, B.; Abdulazeez, A. Classification based on decision tree algorithm for machine learning. J. Appl. Sci. Technol. Trends 2021, 2, 20–28. [Google Scholar] [CrossRef] [Scilit]
- Abdelaal, M.M.A.; Zakria, S.H.E.A. Modeling survival data by using Cox Regression Model. Am. J. Theor. Appl. Stat. 2015, 4, 504–512. [Google Scholar] [CrossRef] [Scilit]
- Mohammadi, G.; Tavakkoli-Moghaddam, R.; Mohammadi, M. Hierarchical neural regression models for customer churn prediction. J. Eng. 2013, 2013, 543940. [Google Scholar] [CrossRef] [Scilit]
- Jamalian, E.; Foukerdi, R. A hybrid data mining method for customer churn prediction. Eng. Technol. Appl. Sci. Res. 2018, 8, 2991–2997. [Google Scholar] [CrossRef] [Scilit]
- Stare, J.; Harrell, F.E., Jr.; Heinzl, H. BJ: An S-plus program to fit linear regression models to censored data using the Buckley–James method. Comput. Methods Programs Biomed. 2001, 64, 45–52. [Google Scholar] [CrossRef] [Scilit] [PubMed]
- Larivière, B.; Van den Poel, D. Investigating the role of product features in preventing customer churn, by using survival analysis and choice modeling: The case of financial services. Expert Syst. Appl. 2004, 27, 277–285. [Google Scholar] [CrossRef] [Scilit]
- Vrieze, S.I. Model selection and psychological theory: A discussion of the differences between the Akaike information criterion (AIC) and the Bayesian information criterion (BIC). Psychol. Methods 2012, 17, 228. [Google Scholar] [CrossRef] [Scilit] [PubMed]
- Chicco, D.; Jurman, G. The advantages of the Matthews correlation coefficient (MCC) over F1 score and accuracy in binary classification evaluation. BMC Genom. 2020, 21, 6. [Google Scholar] [CrossRef] [Scilit]
- Sathyanarayanan, S.; Tantri, B.R. Confusion matrix-based performance evaluation metrics. Afr. J. Biomed. Res. 2024, 27, 4023–4031. [Google Scholar] [CrossRef] [Scilit]
- Chicco, D.; Tötsch, N.; Jurman, G. The Matthews correlation coefficient (MCC) is more reliable than balanced accuracy, bookmaker informedness, and markedness in two-class confusion matrix evaluation. BioData Min. 2021, 14, 13. [Google Scholar] [CrossRef] [Scilit] [PubMed]
- Chicco, D.; Jurman, G. The Matthews correlation coefficient (MCC) should replace the ROC AUC as the standard metric for assessing binary classification. BioData Min. 2023, 16, 4. [Google Scholar] [CrossRef] [Scilit] [PubMed]
- Liu, X.; Xia, G.; Zhang, X.; Ma, W.; Yu, C. Customer churn prediction model based on hybrid neural networks. Sci. Rep. 2024, 14, 30707. [Google Scholar] [CrossRef] [Scilit]
- He, C.; Ding, C.H. A novel classification algorithm for customer churn prediction based on hybrid Ensemble-Fusion model. Sci. Rep. 2024, 14, 20179. [Google Scholar] [CrossRef] [Scilit]
- Huang, Y.; Kechadi, T. An effective hybrid learning system for telecommunication churn prediction. Expert Syst. Appl. 2013, 40, 5635–5647. [Google Scholar] [CrossRef] [Scilit]
- Ochola, M.O. Attrition Modelling for Online Media Users by Cox Proportional Hazards. Ph.D. Thesis, University of Nairobi, Nairobi, Kenya, 2019. [Google Scholar]

Disclaimer/Publisher’s Note: The statements, opinions and data contained in all publications are solely those of the individual author(s) and contributor(s) and not of MDPI and/or the editor(s). MDPI and/or the editor(s) disclaim responsibility for any injury to people or property resulting from any ideas, methods, instructions or products referred to in the content. |
© 2026 by the authors. Licensee MDPI, Basel, Switzerland. This article is an open access article distributed under the terms and conditions of the Creative Commons Attribution (CC BY) license.