A Hybrid Machine Learning and Survival Analysis Framework for Churn Prediction in the Telecom Sector



Abstract
1. Introduction
2. Materials and Methods
2.1. Data Description
2.2. Data Cleaning and Preprocessing
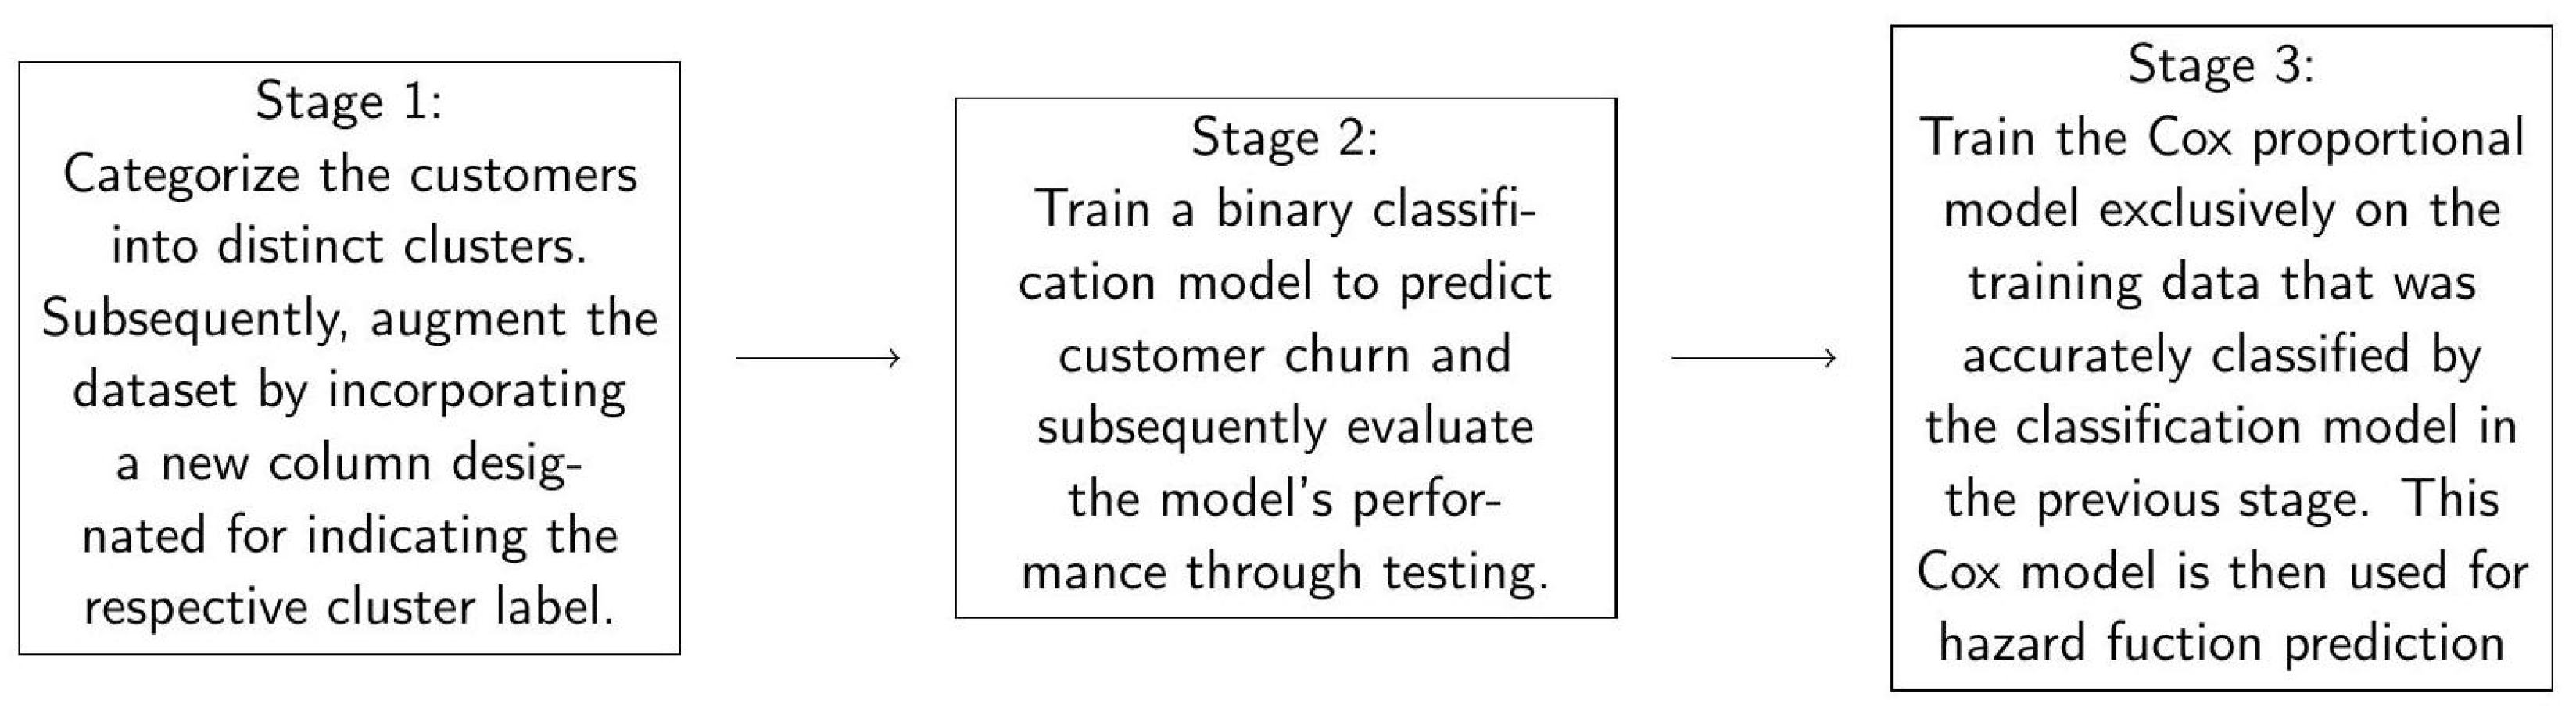
2.3. Hybrid Model Development
- K-means Clustering (KM)This method partitions data into k predetermined clusters, ensuring that the observations within each cluster are similar to each other while differing from those in other clusters [46]. The algorithm locates cluster centroids by minimising the overall within-cluster variation [47]. The k -means optimisation function, which uses squared Euclidean distance for n observations and p variables, is defined as:where represents the k clusters. This process involves the random assignment of observations to ’K’ clusters, the computation of new centroids (cluster means), the calculation of distances between data points and centroids, and the reassignment of points to the nearest centroid until no additional reassignments occur [48]. For Dataset 1, K-means produced Dataset 1.1, and for Dataset 2, it generated Dataset 2.1.
- Agglomerative Clustering (AC)This is a method of hierarchical clustering in which each observation begins as its own distinct cluster [49]. In the following steps, the two closest clusters are combined until all observations are contained within a single cluster [50]. The final clustering is determined by the selection of a cut-off distance. The dissimilarity measure employed was the Euclidean distance, which is calculated as:where x and y denote two data points, and p refers to the number of covariates. The Ward.D linkage method was found to be more effective for merging clusters. In the analysis of Dataset 1, Agglomerative clustering yielded Dataset 1.2, and for Dataset 2, it produced Dataset 2.2.
- Logistic Regression (LR)This is a supervised statistical model that serves classification tasks by predicting the likelihood of an event (e.g., churn) based on a set of predictor variables [18,51]. The outcome is a probability value that exists between 0 and 1 [51]. The logistic regression function for binary classification is defined as:where x is the matrix of predictors, p is the number of predictor variables, and is the vector of coefficients.
- Artificial Neural Networks (ANN)These are machine learning strategies that replicate the characteristics of biological neural networks, consisting of interconnected neurons arranged in layers: input, hidden, and output [52,53]. Information is propagated from the input layer to the output layer, with each connection assigned a weight and each neuron applying an activation function to the sum of its weighted inputs [54,55]. The equations for forward propagation are:where is the weighted sum of inputs to neuron i, is the weight connecting neuron j to neuron i, is the output of neuron i after applying the activation function f, and is the bias for neuron i. Weights are updated using backpropagation based on prediction errors.
- Decision Trees (DT)This supervised learning algorithm partitions the feature space into non-overlapping regions [56]. Classification trees predict the class an observation belongs to. The algorithm starts at a root node and recursively splits into child nodes, minimising impurity measures like Gini Index or Entropy [57,58]. Boosting was applied to enhance the performance of decision trees.
2.4. Evaluation Methods

| Category | Metric | Definition | Formula | |
|---|---|---|---|---|
| Model Fit and Complexity | The balances model fit with the number of parameters, aiming to find the model that best explains the data while penalising complex models [64]. | (7) | ||
| The places a stronger penalty on model complexity compared to , especially for larger datasets [64]. | (8) | |||
| Predictive Accuracy | This measures the proportion of correctly classified instances out of the total instances [65,66]. | (9) | ||
| This indicates the proportion of true positive predictions among all positive predictions [66,67]. | (10) | |||
| Also known as sensitivity, recall measures the proportion of actual positive instances that were correctly identified [66,67]. | (11) | |||
| The F1-Score is the harmonic mean of precision and recall, providing a balanced measure of a model’s accuracy [65,66]. | (12) | |||
| This measures the proportion of actual negative instances that were correctly identified [66,67]. | (13) | |||
| This metric measures the area under the ROC curve, quantifying the overall performance of the model [66,68]. | − |
| Actual | Predicted | |
|---|---|---|
| Non-Churners | Churners | |
| Non-Churners | a | b |
| Churners | c | d |
3. Results
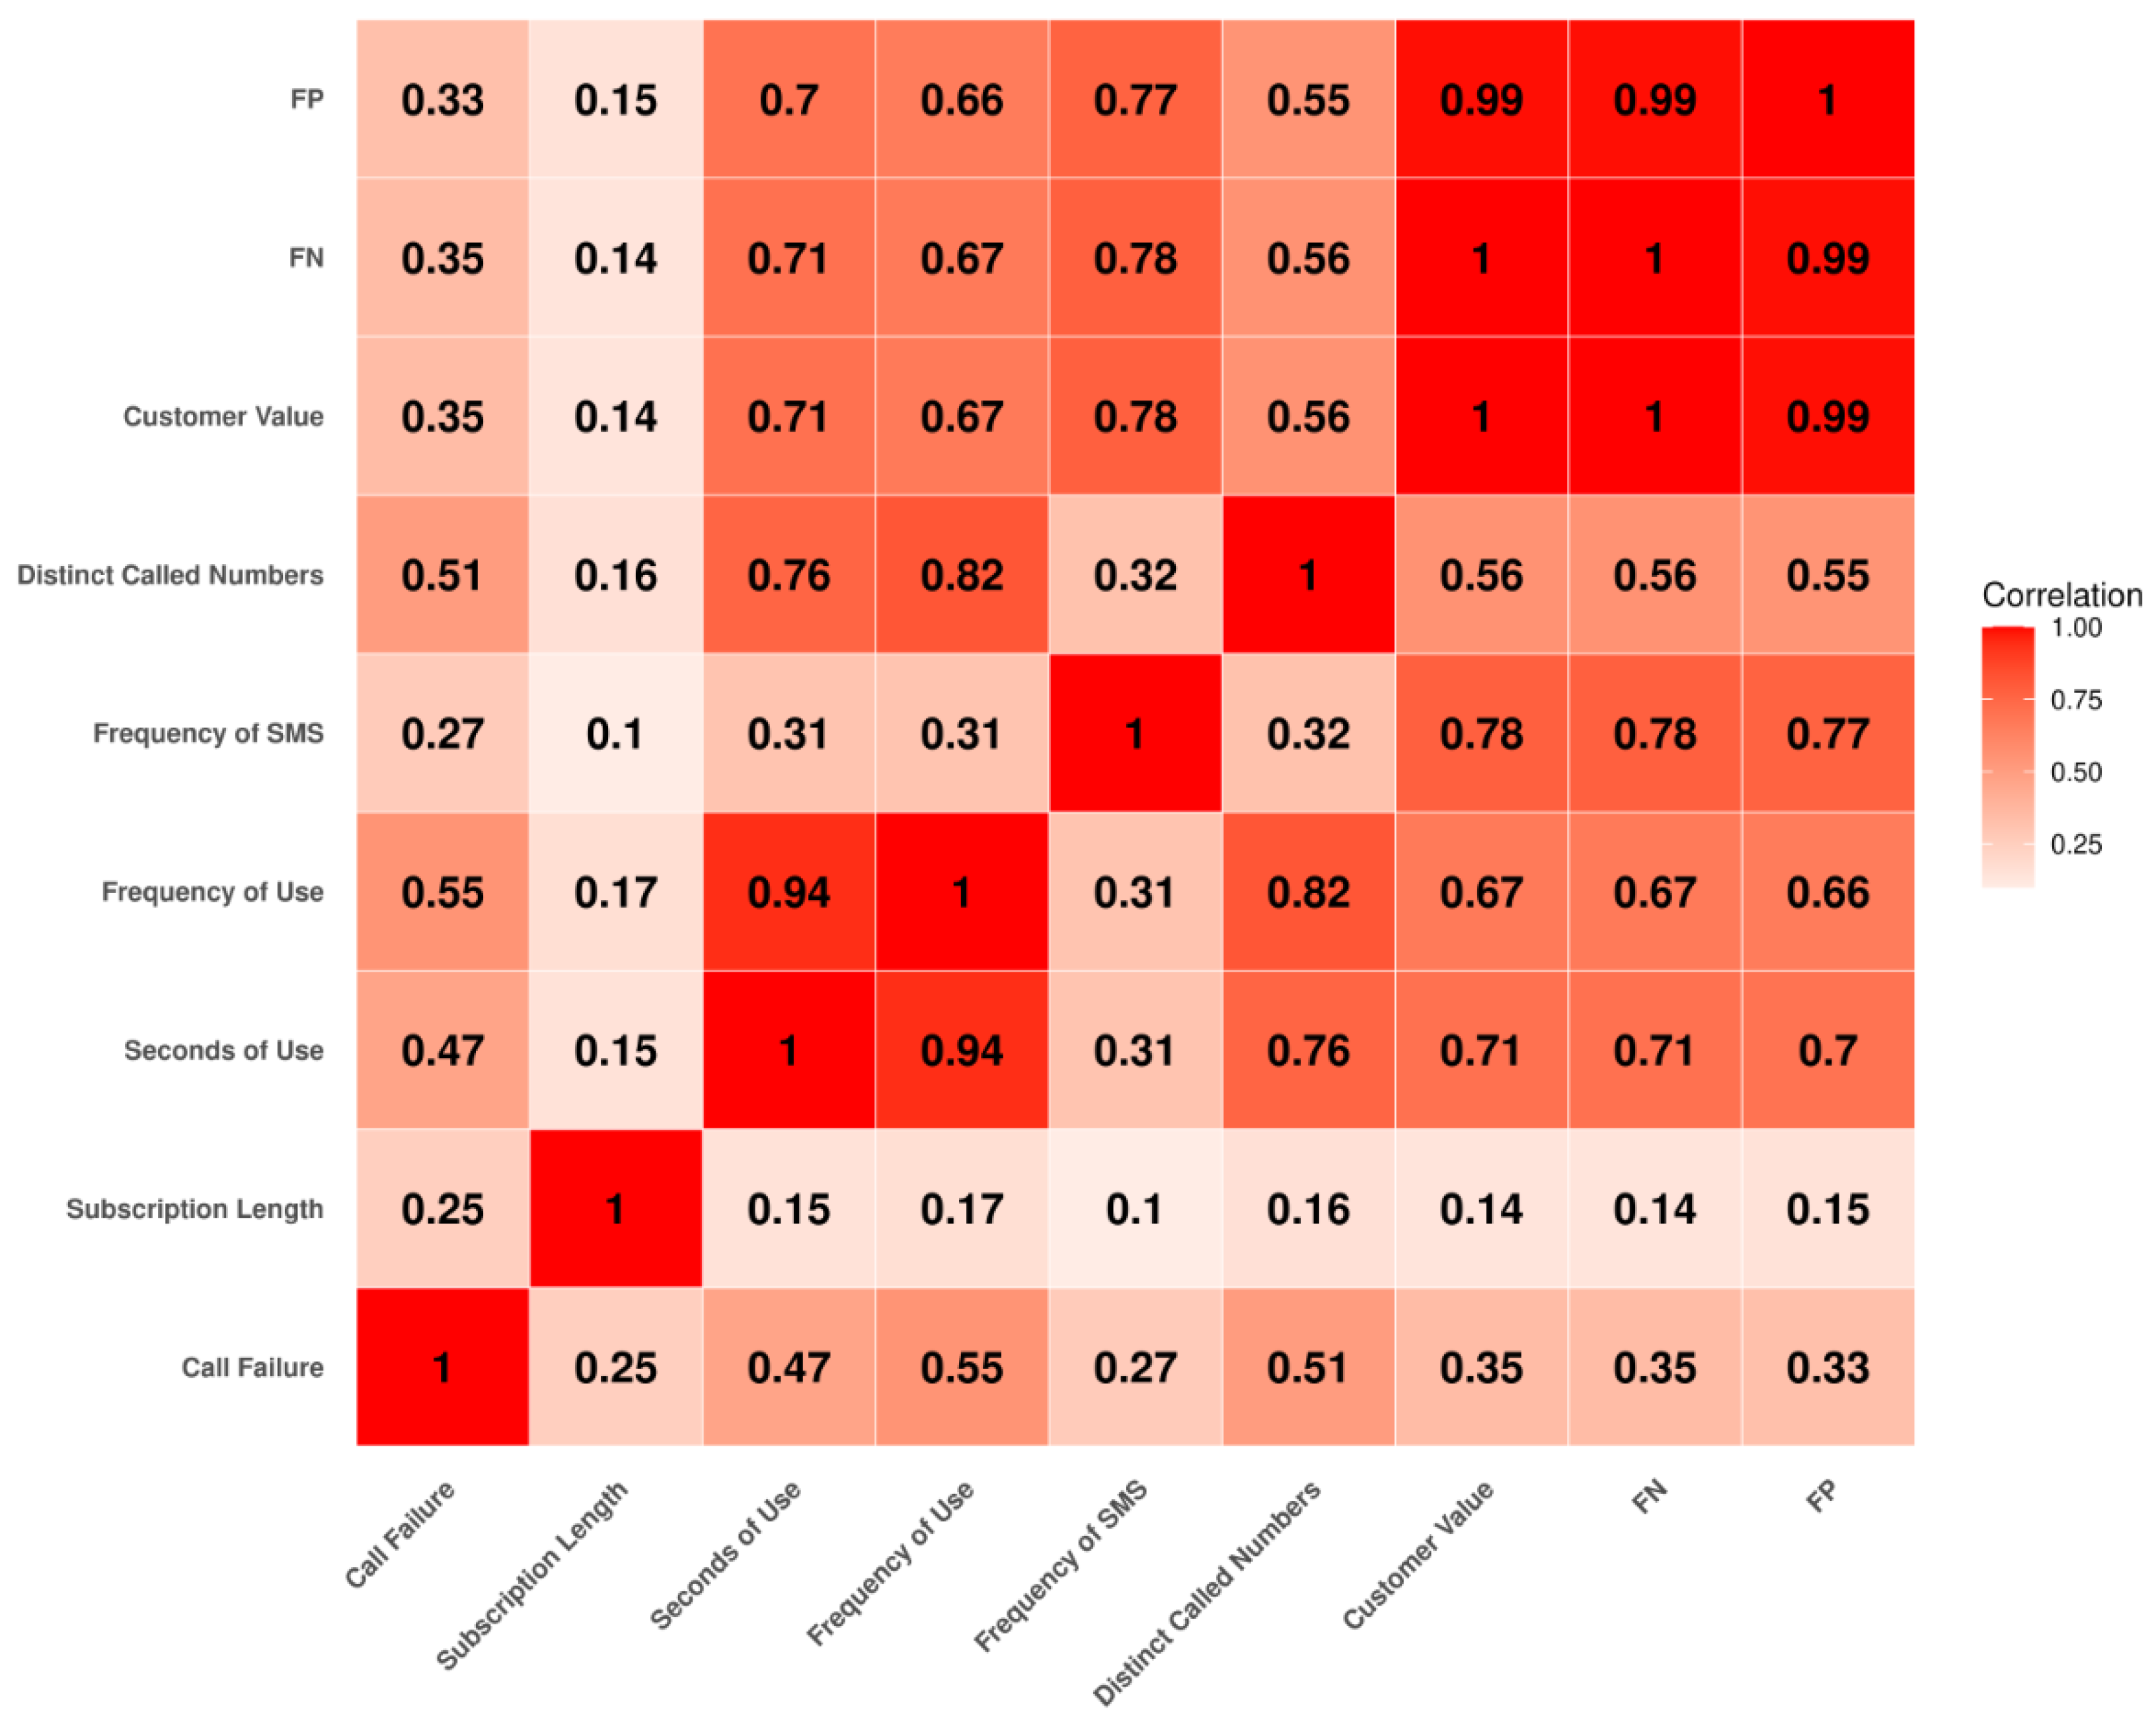
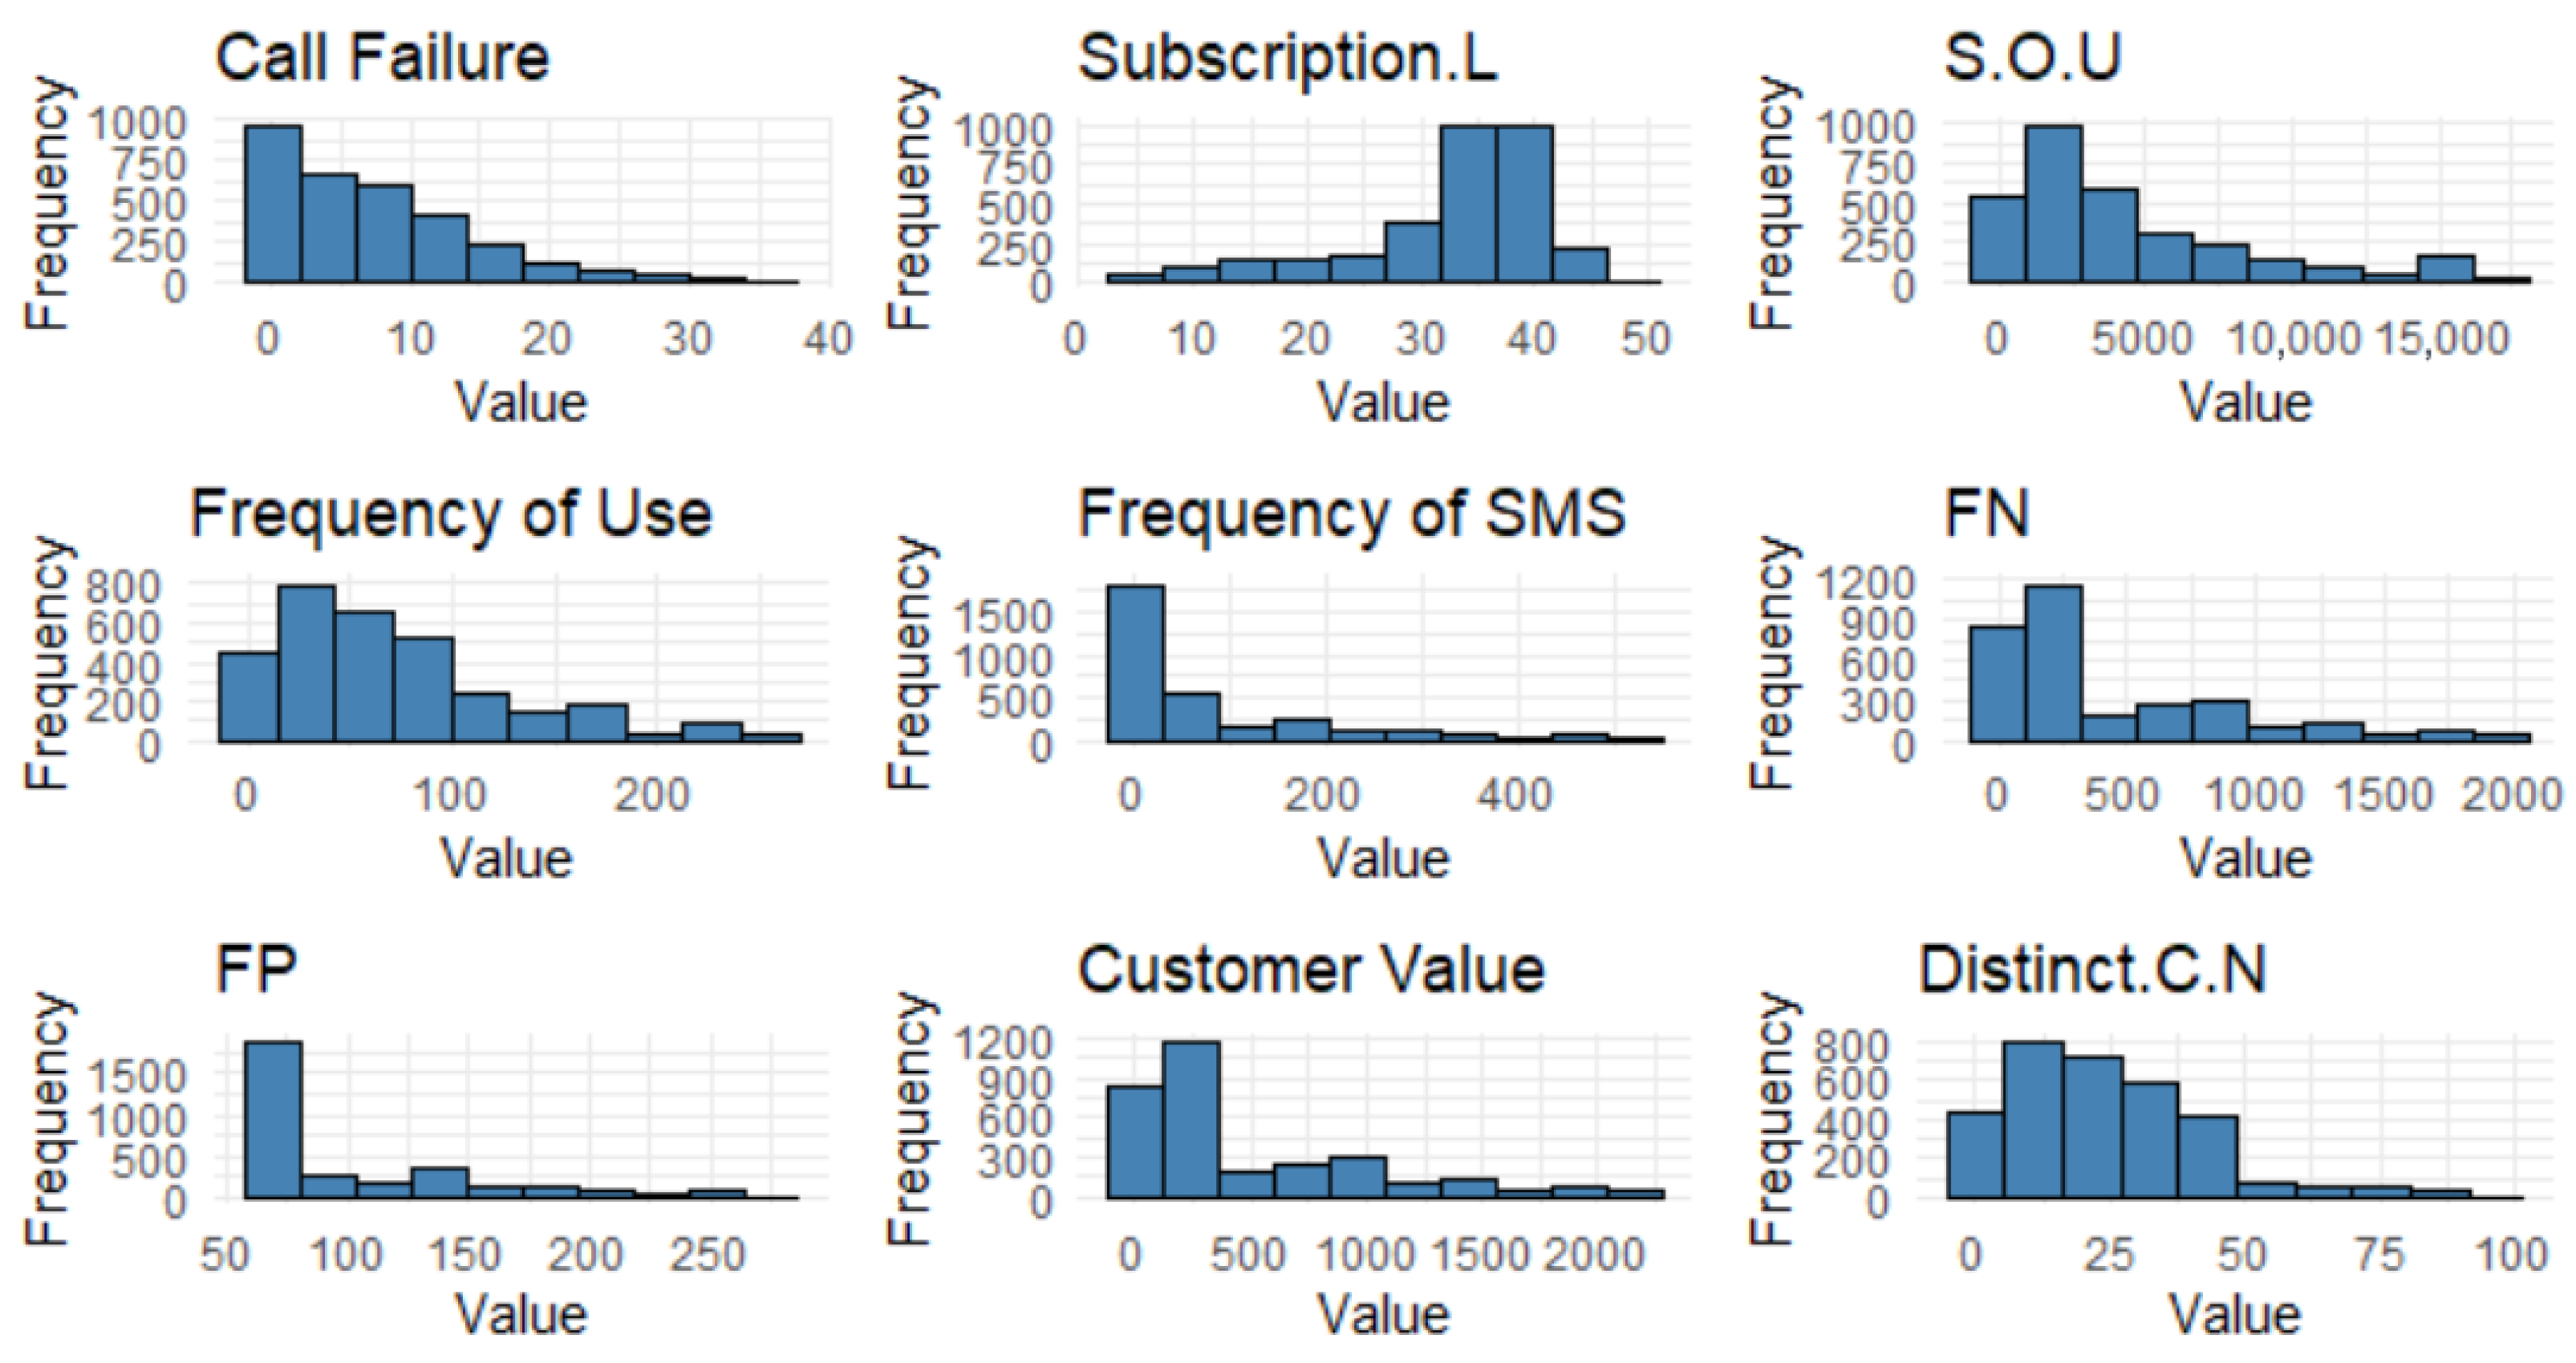
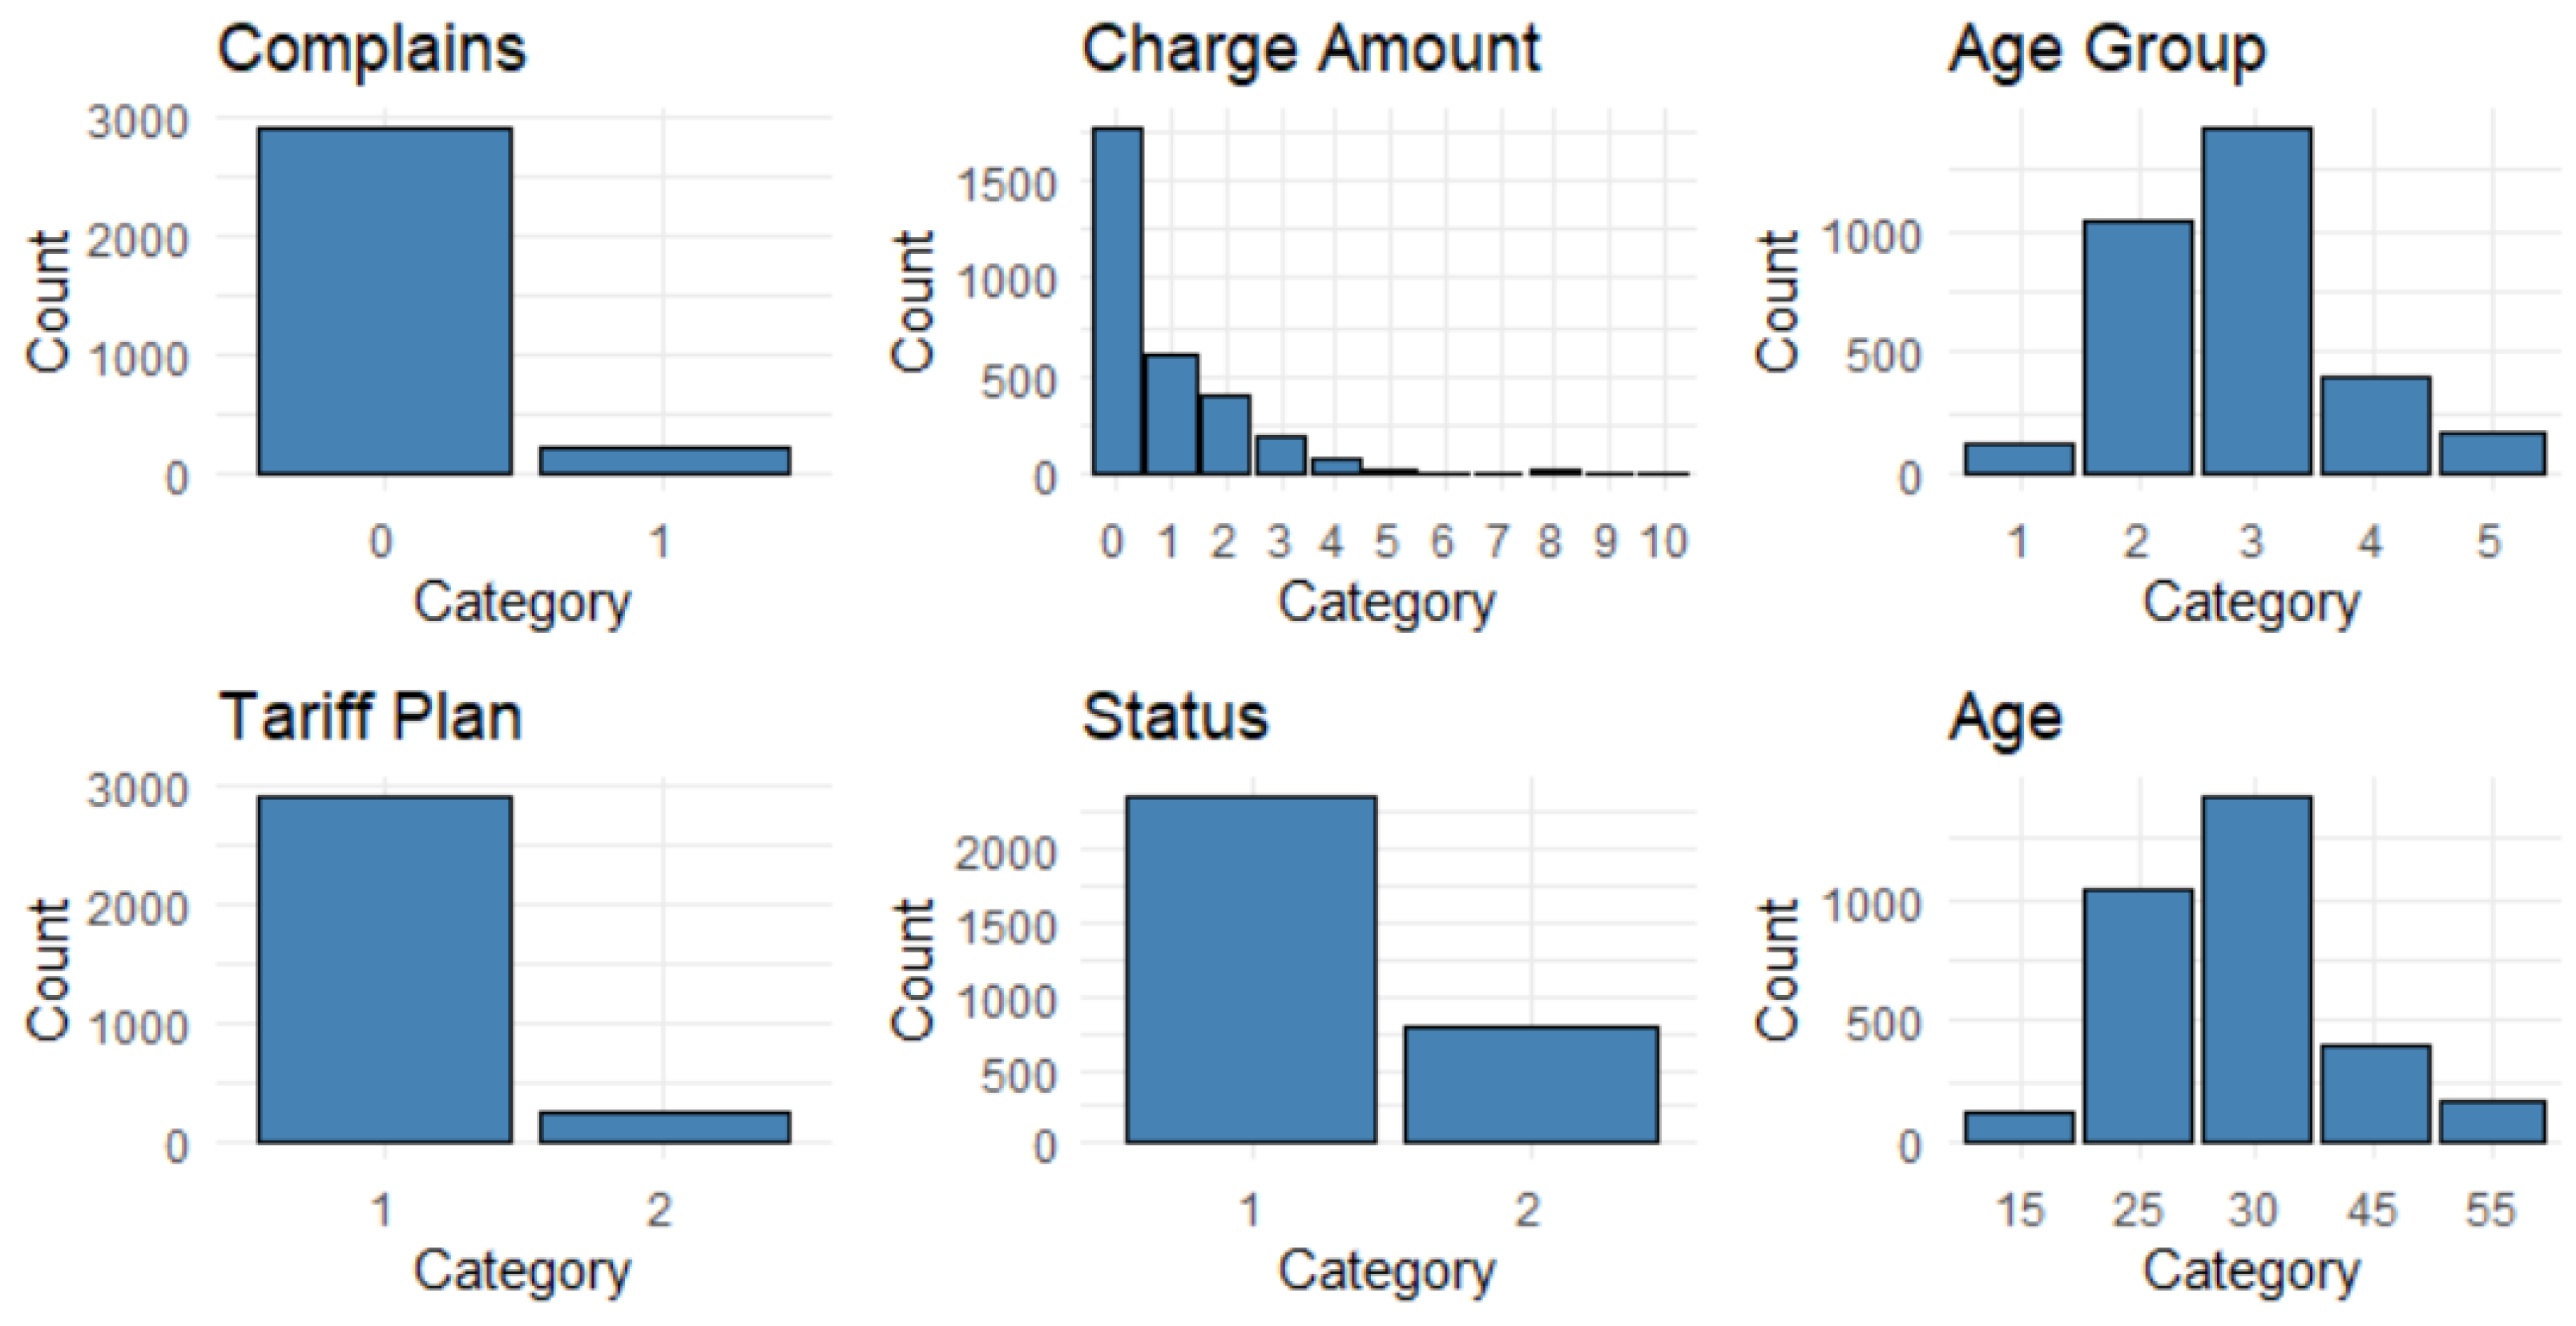
3.1. Exploratory Data Summary
3.2. Cox Models
3.3. Hybrid Models
3.3.1. Stage 1: Clustering
3.3.2. Stage 2: Classification
3.3.3. Stage 3: Survival Analysis
4. Discussion
5. Conclusions
Author Contributions
Funding
Institutional Review Board Statement
Informed Consent Statement
Data Availability Statement
Conflicts of Interest
Appendix A
References
- Mbarek, R.; Baeshen, Y. Telecommunications Customer Churn and Loyalty Intention; Sumy State University: Sumy, Ukraine, 2019. [Google Scholar]
- Ribeiro, H.; Barbosa, B.; Moreira, A.C.; Rodrigues, R.G. Determinants of churn in telecommunication services: A systematic literature review. Manag. Rev. Q. 2024, 74, 1327–1364. [Google Scholar] [CrossRef] [Scilit]
- Bhaal, N.; Adarsh; Awasthi, P.; Usha, G. A comparative framework for Churn analysis in banking and telecom sector. AIP Conf. Proc. 2024, 3075, 020078. [Google Scholar] [CrossRef] [Scilit]
- Bhattacharyya, J.; Dash, M.K. What do we know about customer churn behaviour in the telecommunication industry? A bibliometric analysis of research trends, 1985–2019. FIIB Bus. Rev. 2022, 11, 280–302. [Google Scholar] [CrossRef] [Scilit]
- Majka, M. Understanding Churn Rate. Available online: https://www.researchgate.net/publication/382592085_Understanding_Churn_Rate (accessed on 15 January 2026).
- Maleki, M.; Anand, D. The critical success factors in customer relationship management (CRM) (ERP) implementation. J. Mark. Commun. 2008, 4, 67. [Google Scholar]
- Lu, J. Predicting customer churn in the telecommunications industry—An application of survival analysis modeling using SAS. In Proceedings of the SAS User Group International (SUGI27) Online Proceedings, Orlando, FL, USA, 14–17 April 2002; SAS Institute Inc.: Cary, NC, USA, 2002. Number 114. [Google Scholar]
- Neslin, S.A.; Gupta, S.; Kamakura, W.; Lu, J.; Mason, C.H. Defection detection: Measuring and understanding the predictive accuracy of customer churn models. J. Mark. Res. 2006, 43, 204–211. [Google Scholar] [CrossRef] [Scilit]
- den Poel, D.V.; Lariviere, B. Customer attrition analysis for financial services using proportional hazard models. Eur. J. Oper. Res. 2004, 157, 196–217. [Google Scholar] [CrossRef] [Scilit]
- Amin, A.; Anwar, S.; Adnan, A.; Nawaz, M.; Alawfi, K.; Hussain, A.; Huang, K. Customer churn prediction in the telecommunication sector using a rough set approach. Neurocomputing 2017, 237, 242–254. [Google Scholar] [CrossRef] [Scilit]
- Khan, Y.; Shafiq, S.; Naeem, A.; Ahmed, S.; Safwan, N.; Hussain, S. Customers churn prediction using artificial neural networks (ANN) in telecom industry. Int. J. Adv. Comput. Sci. Appl. 2019, 10, 132–142. [Google Scholar] [CrossRef] [Scilit]
- Lu, N.; Lin, H.; Lu, J.; Zhang, G. A customer churn prediction model in telecom industry using boosting. IEEE Trans. Ind. Inform. 2012, 10, 1659–1665. [Google Scholar] [CrossRef] [Scilit]
- Mitkees, I.M.; Badr, S.M.; ElSeddawy, A.I.B. Customer churn prediction model using data mining techniques. In Proceedings of the 2017 13th International Computer Engineering Conference (ICENCO); IEEE: New York, NY, USA, 2017; pp. 262–268. [Google Scholar]
- Sato, T.; Huang, B.Q.; Huang, Y.; Kechadi, M.T.; Buckley, B. Using PCA to predict customer churn in telecommunication dataset. In Proceedings of the Advanced Data Mining and Applications: 6th International Conference, ADMA 2010, Chongqing, China, 19–21 November 2010; Proceedings, Part II, Lecture Notes in Computer Science; Springer: Berlin/Heidelberg, Germany, 2010; Volume 6441, pp. 326–335. [Google Scholar]
- Rothenbuehler, P.; Runge, J.; Garcin, F.; Faltings, B. Hidden Markov Models for churn prediction. In Proceedings of the 2015 SAI Intelligent Systems Conference (IntelliSys); IEEE: New York, NY, USA, 2015; pp. 723–730. [Google Scholar]
- Phadke, C.; Uzunalioglu, H.; Mendiratta, V.B.; Kushnir, D.; Doran, D. Prediction of subscriber churn using social network analysis. Bell Labs Tech. J. 2013, 17, 63–76. [Google Scholar] [CrossRef] [Scilit]
- Huang, B.; Kechadi, M.T.; Buckley, B. Customer churn prediction in telecommunications. Expert Syst. Appl. 2012, 39, 1414–1425. [Google Scholar] [CrossRef] [Scilit]
- Jain, H.; Khunteta, A.; Srivastava, S. Churn prediction in telecommunication using logistic regression and logit boost. Procedia Comput. Sci. 2020, 167, 101–112. [Google Scholar] [CrossRef] [Scilit]
- Keramati, A.; Jafari-Marandi, R.; Aliannejadi, M.; Ahmadian, I.; Mozaffari, M.; Abbasi, U. Improved churn prediction in telecommunication industry using data mining techniques. Appl. Soft Comput. 2014, 24, 994–1012. [Google Scholar] [CrossRef] [Scilit]
- Bilal Zorić, A. Predicting customer churn in banking industry using neural networks. Interdiscip. Descr. Complex Syst. INDECS 2016, 14, 116–124. [Google Scholar] [CrossRef] [Scilit]
- Zhao, Y.; Li, B.; Li, X.; Liu, W.; Ren, S. Customer churn prediction using improved one-class support vector machine. In Proceedings of the International Conference on Advanced Data Mining and Applications; Springer: Berlin/Heidelberg, Germany, 2005; pp. 300–306. [Google Scholar]
- Mohamed, F.A.; Al-Khalifa, A.K. A review of machine learning methods for predicting churn in the telecom sector. In Proceedings of the 2023 International Conference On Cyber Management And Engineering (CyMaEn); IEEE: New York, NY, USA, 2023; pp. 164–170. [Google Scholar]
- Sholeha, S.; Faid, M.; Yaqin, M. Prediksi Prediksi Perpindahan Pelanggan Pada Toko Online Menggunakan Metode Tree-Based Gradient Boosted Models. J. Comput. Syst. Inform. JoSYC 2024, 5, 605–614. [Google Scholar] [CrossRef] [Scilit]
- Coussement, K.; De Bock, K.W. Customer churn prediction in the online gambling industry: The beneficial effect of ensemble learning. J. Bus. Res. 2013, 66, 1629–1636. [Google Scholar] [CrossRef] [Scilit]
- Chen, G.H. An introduction to deep survival analysis models for predicting time-to-event outcomes. Found. Trends® Mach. Learn. 2024, 17, 921–1100. [Google Scholar] [CrossRef] [Scilit]
- Ali, Ö.G.; Arıtürk, U. Dynamic churn prediction framework with more effective use of rare event data: The case of private banking. Expert Syst. Appl. 2014, 41, 7889–7903. [Google Scholar] [CrossRef] [Scilit]
- Lembhe, A.; Lagad, Y.; Statistics, D.D.; Kamthe, R.; Swami, A.; Statistics, D.D. Survival Analysis of Customer Lifetime and Churn Prediction in the Telecom Industry. Int. J. Latest Technol. Eng. Manag. Appl. Sci. 2025, 14, 201–212. [Google Scholar] [CrossRef] [Scilit]
- Baek, E.T.; Yang, H.J.; Kim, S.H.; Lee, G.S.; Oh, I.J.; Kang, S.R.; Min, J.J. Survival time prediction by integrating cox proportional hazards network and distribution function network. BMC Bioinform. 2021, 22, 192. [Google Scholar] [CrossRef] [Scilit]
- Nurhaliza, S.; Sadik, K.; Saefuddin, A. A comparison of Cox proportional hazard and random survival forest models in predicting churn of the telecommunication industry customer. BAREKENG J. Ilmu Mat. Dan Terap. 2022, 16, 1433–1440. [Google Scholar] [CrossRef] [Scilit]
- Kimitei, S.; Agiro, D.; Ni, S.; Ni, H. Predictability & explainability of survival analysis in churn prediction. J. Mark. Anal. 2025, 1–17. [Google Scholar] [CrossRef] [Scilit]
- Bravante, J.J.A.; Robielos, R.A.C. Game Over: An Application of Customer Churn Prediction using Survival Analysis Modelling in Automobile Insurance. In Proceedings of the International Conference on Industrial Engineering and Operations Management Istanbul, Turkey, 7–10 March 2022; IEOM Society International: Southfield, MI, USA, 2022. [Google Scholar]
- AL-Najuar, D.; Al-Rousan, N.; AL-NajJar, H. Machine learning to develop credit card customer churn prediction. J. Theor. Appl. Electron. Commer. Res. 2022, 17, 1529–1542. [Google Scholar] [CrossRef] [Scilit]
- Periáñez, Á.; Saas, A.; Guitart, A.; Magne, C. Churn prediction in mobile social games: Towards a complete assessment using survival ensembles. In Proceedings of the 2016 IEEE International Conference on Data Science and Advanced Analytics (DSAA); IEEE: New York, NY, USA, 2016; pp. 564–573. [Google Scholar]
- Jamal, Z.; Bucklin, R.E. Improving the diagnosis and prediction of customer churn: A heterogeneous hazard modeling approach. J. Interact. Mark. 2006, 20, 16–29. [Google Scholar] [CrossRef] [Scilit]
- Hudaib, A.; Dannoun, R.; Harfoushi, O.; Obiedat, R.; Faris, H. Hybrid data mining models for predicting customer churn. Int. J. Commun. Netw. Syst. Sci. 2015, 8, 91. [Google Scholar] [CrossRef]
- Tsai, C.F.; Lu, Y.H. Customer churn prediction by hybrid neural networks. Expert Syst. Appl. 2009, 36, 12547–12553. [Google Scholar] [CrossRef] [Scilit]
- Bose, I.; Chen, X. Hybrid models using unsupervised clustering for prediction of customer churn. J. Organ. Comput. Electron. Commer. 2009, 19, 133–151. [Google Scholar] [CrossRef] [Scilit]
- Zhang, Y.; Qi, J.; Shu, H.; Cao, J. A hybrid KNN-LR classifier and its application in customer churn prediction. In Proceedings of the 2007 IEEE International Conference on Systems, Man and Cybernetics; IEEE: New York, NY, USA, 2007; pp. 3265–3269. [Google Scholar]
- Sundarkumar, G.G.; Ravi, V. A novel hybrid undersampling method for mining unbalanced datasets in banking and insurance. Eng. Appl. Artif. Intell. 2015, 37, 368–377. [Google Scholar] [CrossRef] [Scilit]
- Khattak, A.; Mehak, Z.; Ahmad, H.; Asghar, M.U.; Asghar, M.Z.; Khan, A. Customer churn prediction using composite deep learning technique. Sci. Rep. 2023, 13, 17294. [Google Scholar] [CrossRef] [Scilit]
- Liu, R.; Ali, S.; Bilal, S.F.; Sakhawat, Z.; Imran, A.; Almuhaimeed, A.; Alzahrani, A.; Sun, G. An intelligent hybrid scheme for customer churn prediction integrating clustering and classification algorithms. Appl. Sci. 2022, 12, 9355. [Google Scholar] [CrossRef] [Scilit]
- Mouli, K.C.; Raghavendran, C.V.; Bharadwaj, V.; Vybhavi, G.; Sravani, C.; Vafaeva, K.M.; Deorari, R.; Hussein, L. An analysis on classification models for customer churn prediction. Cogent Eng. 2024, 11, 2378877. [Google Scholar] [CrossRef] [Scilit]
- Zhang, J.; Fu, J.; Zhang, C.; Ke, X.; Hu, Z. Not too late to identify potential churners: Early churn prediction in telecommunication industry. In Proceedings of the 3rd IEEE/ACM International Conference on Big Data Computing, Applications and Technologies, Shanghai, China, 6–9 December 2016; pp. 194–199. [Google Scholar]
- Chawla, N.V.; Bowyer, K.W.; Hall, L.O.; Kegelmeyer, W.P. SMOTE: Synthetic minority over-sampling technique. J. Artif. Intell. Res. 2002, 16, 321–357. [Google Scholar] [CrossRef] [Scilit]
- Saputro, D.R.S.; Wahyu, N.L.; Widyaningsih, Y. Performance of ridge regression, least absolute shrinkage and selection operator, and elastic net in overcoming multicollinearity. J. Multidiscip. Appl. Nat. Sci. 2025, 5, 370–382. [Google Scholar] [CrossRef] [Scilit]
- Sinaga, K.P.; Yang, M.S. Unsupervised K-means clustering algorithm. IEEE Access 2020, 8, 80716–80727. [Google Scholar] [CrossRef] [Scilit]
- Na, S.; Xumin, L.; Yong, G. Research on k-means clustering algorithm: An improved k-means clustering algorithm. In Proceedings of the 2010 Third International Symposium on Intelligent Information Technology and Security Informatics; IEEE: New York, NY, USA, 2010; pp. 63–67. [Google Scholar]
- Wang, J.; Su, X. An improved K-Means clustering algorithm. In Proceedings of the 2011 IEEE 3rd International Conference on Communication Software and Networks; IEEE: New York, NY, USA, 2011; pp. 44–46. [Google Scholar]
- Oti, E.; Olusola, M. Overview of agglomerative hierarchical clustering methods. Br. J. Comput. Netw. Inf. Technol. 2024, 7, 14–23. [Google Scholar] [CrossRef] [Scilit]
- Murtagh, F.; Contreras, P. Algorithms for hierarchical clustering: An overview, II. Wiley Interdiscip. Rev. Data Min. Knowl. Discov. 2017, 7, e1219. [Google Scholar] [CrossRef] [Scilit]
- Hosmer, D.W., Jr.; Lemeshow, S.; Sturdivant, R.X. Applied Logistic Regression; John Wiley & Sons: Hoboken, NJ, USA, 2013. [Google Scholar]
- Dongare, A.; Kharde, R.; Kachare, A.D. Introduction to artificial neural network. Int. J. Eng. Innov. Technol. IJEIT 2012, 2, 189–194. [Google Scholar]
- Aggarwal, C.C. Neural Networks and Deep Learning; Springer: Berlin/Heidelberg, Germany, 2018; Volume 10, p. 3. [Google Scholar]
- Wu, Y.C.; Feng, J.W. Development and application of artificial neural network. Wirel. Pers. Commun. 2018, 102, 1645–1656. [Google Scholar] [CrossRef] [Scilit]
- Sharma, S.; Sharma, S.; Athaiya, A. Activation functions in neural networks. Towards Data Sci. 2017, 6, 310–316. [Google Scholar] [CrossRef] [Scilit]
- Kotsiantis, S.B. Decision trees: A recent overview. Artif. Intell. Rev. 2013, 39, 261–283. [Google Scholar] [CrossRef] [Scilit]
- Song, Y.Y.; Lu, Y. Decision tree methods: Applications for classification and prediction. Shanghai Arch. Psychiatry 2015, 27, 130. [Google Scholar]
- Charbuty, B.; Abdulazeez, A. Classification based on decision tree algorithm for machine learning. J. Appl. Sci. Technol. Trends 2021, 2, 20–28. [Google Scholar] [CrossRef] [Scilit]
- Abdelaal, M.M.A.; Zakria, S.H.E.A. Modeling survival data by using Cox Regression Model. Am. J. Theor. Appl. Stat. 2015, 4, 504–512. [Google Scholar] [CrossRef] [Scilit]
- Mohammadi, G.; Tavakkoli-Moghaddam, R.; Mohammadi, M. Hierarchical neural regression models for customer churn prediction. J. Eng. 2013, 2013, 543940. [Google Scholar] [CrossRef] [Scilit]
- Jamalian, E.; Foukerdi, R. A hybrid data mining method for customer churn prediction. Eng. Technol. Appl. Sci. Res. 2018, 8, 2991–2997. [Google Scholar] [CrossRef] [Scilit]
- Stare, J.; Harrell, F.E., Jr.; Heinzl, H. BJ: An S-plus program to fit linear regression models to censored data using the Buckley–James method. Comput. Methods Programs Biomed. 2001, 64, 45–52. [Google Scholar] [CrossRef] [Scilit] [PubMed]
- Larivière, B.; Van den Poel, D. Investigating the role of product features in preventing customer churn, by using survival analysis and choice modeling: The case of financial services. Expert Syst. Appl. 2004, 27, 277–285. [Google Scholar] [CrossRef] [Scilit]
- Vrieze, S.I. Model selection and psychological theory: A discussion of the differences between the Akaike information criterion (AIC) and the Bayesian information criterion (BIC). Psychol. Methods 2012, 17, 228. [Google Scholar] [CrossRef] [Scilit] [PubMed]
- Chicco, D.; Jurman, G. The advantages of the Matthews correlation coefficient (MCC) over F1 score and accuracy in binary classification evaluation. BMC Genom. 2020, 21, 6. [Google Scholar] [CrossRef] [Scilit]
- Sathyanarayanan, S.; Tantri, B.R. Confusion matrix-based performance evaluation metrics. Afr. J. Biomed. Res. 2024, 27, 4023–4031. [Google Scholar] [CrossRef] [Scilit]
- Chicco, D.; Tötsch, N.; Jurman, G. The Matthews correlation coefficient (MCC) is more reliable than balanced accuracy, bookmaker informedness, and markedness in two-class confusion matrix evaluation. BioData Min. 2021, 14, 13. [Google Scholar] [CrossRef] [Scilit] [PubMed]
- Chicco, D.; Jurman, G. The Matthews correlation coefficient (MCC) should replace the ROC AUC as the standard metric for assessing binary classification. BioData Min. 2023, 16, 4. [Google Scholar] [CrossRef] [Scilit] [PubMed]
- Liu, X.; Xia, G.; Zhang, X.; Ma, W.; Yu, C. Customer churn prediction model based on hybrid neural networks. Sci. Rep. 2024, 14, 30707. [Google Scholar] [CrossRef] [Scilit]
- He, C.; Ding, C.H. A novel classification algorithm for customer churn prediction based on hybrid Ensemble-Fusion model. Sci. Rep. 2024, 14, 20179. [Google Scholar] [CrossRef] [Scilit]
- Huang, Y.; Kechadi, T. An effective hybrid learning system for telecommunication churn prediction. Expert Syst. Appl. 2013, 40, 5635–5647. [Google Scholar] [CrossRef] [Scilit]
- Ochola, M.O. Attrition Modelling for Online Media Users by Cox Proportional Hazards. Ph.D. Thesis, University of Nairobi, Nairobi, Kenya, 2019. [Google Scholar]

| Numerical Variables | Description |
|---|---|
| Call Failure | The number of call failures experienced by the customer. |
| Subscription Length | The number of months a customer has used the company’s services. |
| Seconds of Use | Total number of seconds spent on a phone call by the customer. |
| Frequency of Use | The number of times a customer has made phone calls. |
| Frequency of SMS | The total number of messages sent or received by a customer. |
| Distinct Called Number | The total number of unique phone numbers dialled by a customer since their subscription began. |
| Customer Value | The worth of a customer to the company. |
| False positive | The expenses incurred as a result of false positive classifications. |
| False Negative | The expenses incurred as a result of false negative classifications. |
| Categorical Variables | Description |
|---|---|
| Complaints | Indicates whether or not a customer filed a complaint, with 0 indicating that the customer has never filed a complaint and 1 indicating that the customer has previously filed a complaint. |
| Charge Amounts | The total amount of airtime recharged by a customer. There are 11 classes, with the charge amounts ranging from 0 to 10, with 10 being the class with the highest charge amounts. |
| Age Group | There are five age groups, with group 1 consisting of the youngest customers and group 5 consisting of the oldest customers. |
| Tariff Plan | Tariff plans are classified into two types: 1 represents pay-as-you-go, and 2 represents contractual plans. |
| Status | Represents the customer’s active or inactive status, with 1 indicating an active customer and 2 indicating an inactive customer. |
| Dataset | Total No. of Observations | No. of Churners | No. of Non-Churners |
|---|---|---|---|
| Original train dataset | 2520 | 396 | 2124 |
| Dataset 1 | 4248 | 2124 | 2124 |
| Dataset 2 | 2519 | 1259 | 1260 |
| Numerical Variables | Mean | Standard Deviation | Min | Q1 | Median | Q3 | Max |
|---|---|---|---|---|---|---|---|
| Call Failure | 7.63 | 7.26 | 0 | 1 | 6 | 12 | 36 |
| Subscription Length | 32.54 | 8.57 | 3 | 30 | 35 | 38 | 47 |
| Seconds of Use | 4472.46 | 4197.91 | 0 | 1390 | 2990 | 6480 | 17,090 |
| Frequency of Use | 69.46 | 57.41 | 0 | 27 | 54 | 95 | 255 |
| Frequency of SMS | 73.17 | 112.24 | 0 | 6 | 21 | 87 | 522 |
| Distinct Called Number | 23.51 | 17.22 | 0 | 10 | 21 | 34 | 97 |
| Customer Value | 470.97 | 517.02 | 0 | 113.8 | 228.48 | 788.49 | 2165.28 |
| False Negative | 423.88 | 465.31 | 0 | 102.42 | 205.63 | 709.64 | 1948.75 |
| False Positive | 98.3 | 50.72 | 60 | 61.38 | 72.85 | 128.85 | 266.53 |
| Metric | Cox Model 1 | Cox Model 2 |
|---|---|---|
| AIC | 31,441.13 | 17,324.98 |
| BIC | 31,588.31 | 17,458.57 |
| Accuracy | 0.8442 | 0.8442 |
| Precision | 0.8495 | 0.8495 |
| Recall | 1 | 1 |
| Specificity | 0.0101 | 0.0101 |
| F1-Score | 0.9186 | 0.9186 |
| AUC-ROC | 0.8051 | 0.8051 |
| Datasets | Imbalance Technique | Clustering Type | Number of Clusters |
|---|---|---|---|
| Dataset 1.1 | Oversampling | Kmeans (KM) | 10 |
| Dataset 1.2 | Oversampling | Agglomerative Clustering (AC) | 5 |
| Dataset 2.1 | SMOTE | Kmeans (KM) | 2 |
| Dataset 2.2 | SMOTE | Agglomerative Clustering (AC) | 5 |
| Metric | KM + LR (Dataset 1.1) | AC + LR (Dataset 1.2) | KM + LR (Dataset 2.1) | AC + LR (Dataset 2.2) |
|---|---|---|---|---|
| AIC | 2469 | 2212 | 1500 | 1408 |
| BIC | 2704 | 2409 | 1663 | 1588 |
| Accuracy | 0.78 | 0.60 | 0.85 | 0.80 |
| Precision | 0.94 | 0.81 | 0.97 | 0.93 |
| Recall | 0.79 | 0.68 | 0.85 | 0.83 |
| Specificity | 0.74 | 0.16 | 0.86 | 0.65 |
| F1-Score | 0.86 | 0.74 | 0.91 | 0.88 |
| AUC-ROC | 0.82 | 0.60 | 0.94 | 0.76 |
| Metric | KM + ANN (Dataset 1.1) | AC + ANN (Dataset 1.2) | KM + ANN (Dataset 2.1) | AC + ANN (Dataset 2.2) |
|---|---|---|---|---|
| Accuracy | 0.8792 | 0.8474 | 0.8424 | 0.8469 |
| Precision | 0.9219 | 0.9465 | 0.9821 | 0.9681 |
| Recall | 0.9358 | 0.8679 | 0.8283 | 0.8585 |
| Specificity | 0.5758 | 0.7374 | 0.9192 | 0.8485 |
| F1-Score | 0.9288 | 0.9055 | 0.8987 | 0.9100 |
| AUC-ROC | 0.9289 | 0.9102 | 0.9289 | 0.9285 |
| Metric | KM + DT (Dataset 1.1) | AC + DT (Dataset 1.2) | KM + DT (Dataset 2.1) | AC + DT (Dataset 2.2) |
|---|---|---|---|---|
| Accuracy | 0.8601 | 0.8410 | 0.8585 | 0.8649 |
| Precision | 0.9846 | 0.9842 | 0.9846 | 0.9847 |
| Recall | 0.8472 | 0.8245 | 0.8453 | 0.8528 |
| Specificity | 0.9293 | 0.9293 | 0.9293 | 0.9295 |
| F1-Score | 0.9108 | 0.8973 | 0.9097 | 0.9140 |
| AUC-ROC | 0.8882 | 0.8769 | 0.8873 | 0.8910 |
| Metric | KM + LR + Cox | KM + ANN + Cox | AC + DT + Cox | Cox Model 2 |
|---|---|---|---|---|
| AIC | 14,497 | 26,604 | 14,697 | 17,594 |
| BIC | 14,633 | 27,799 | 14,849 | 17,526 |
| Accuracy | 0.8824 | 0.8537 | 0.8442 | 0.8442 |
| Precision | 0.9318 | 0.9148 | 0.9091 | 0.9318 |
| Recall | 0.9283 | 0.9113 | 0.9057 | 1 |
| Specificity | 0.6364 | 0.5455 | 0.5152 | 0.01 |
| F1-Score | 0.9301 | 0.9130 | 0.9074 | 0.9186 |
| AUC-ROC | 0.7823 | 0.7284 | 0.7104 | 0.8051 |
| Covariate | Hazard Ratio | Effect on Survival Length |
|---|---|---|
| Cluster. 1 | 33.25 | Decrease |
| Call Failure | 1.802 | Decrease |
| Complains. 1 | 1.835 | Decrease |
| Subscription Length | 0.7972 | Increase |
| Charge Amount 0 | 0.6902 | Increase |
| Charge Amount 1 | 2.178 | Deecrease |
| Charge Amount 3 | 0.9404 | Increase |
| Charge Amount 4 | 0.5036 | Increase |
| Charge Amount 5 | 0 | No effect |
| Charge Amount 6 | 0 | No effect |
| Charge Amount 7 | 0 | No effect |
| Charge Amount 8 | 0 | No effect |
| Charge Amount 9 | 0 | No effect |
| Charge Amount 10 | 0 | No effect |
| Seconds of Use | 8.078 | Decrease |
| Frequency of Use | 0.04710 | Increase |
| Frequency of SMS | 0.6606 | Increase |
| Distinct Called Numbers | 1.085 | Decrease |
| Age Group 1 | 0 | No effect |
| Age Group 2 | 1.185 | Decrease |
| Age Group 3 | 0.8624 | Increase |
| Age Group 5 | 0.072587 | Increase |
| Tariff Plan 1 | 0.1782 | Increase |
| Status 1 | 0.1414 | Increase |
| Customer Value | 0.01596 | Increase |
| False Negative | 3.323 | Decrease |
| False Positive | 40.56 | Decrease |
Disclaimer/Publisher’s Note: The statements, opinions and data contained in all publications are solely those of the individual author(s) and contributor(s) and not of MDPI and/or the editor(s). MDPI and/or the editor(s) disclaim responsibility for any injury to people or property resulting from any ideas, methods, instructions or products referred to in the content. |
© 2026 by the authors. Licensee MDPI, Basel, Switzerland. This article is an open access article distributed under the terms and conditions of the Creative Commons Attribution (CC BY) license.
Share and Cite
Mlambo, F.F.; Musuphi, M.; Letsela, K. A Hybrid Machine Learning and Survival Analysis Framework for Churn Prediction in the Telecom Sector. Information 2026, 17, 680. https://doi.org/10.3390/info17070680
Mlambo FF, Musuphi M, Letsela K. A Hybrid Machine Learning and Survival Analysis Framework for Churn Prediction in the Telecom Sector. Information. 2026; 17(7):680. https://doi.org/10.3390/info17070680
Chicago/Turabian StyleMlambo, Farai Fredric, Mpho Musuphi, and Kopano Letsela. 2026. "A Hybrid Machine Learning and Survival Analysis Framework for Churn Prediction in the Telecom Sector" Information 17, no. 7: 680. https://doi.org/10.3390/info17070680
APA StyleMlambo, F. F., Musuphi, M., & Letsela, K. (2026). A Hybrid Machine Learning and Survival Analysis Framework for Churn Prediction in the Telecom Sector. Information, 17(7), 680. https://doi.org/10.3390/info17070680