


Abstract
Travel companion matching presents unique challenges compared with conventional recommendation domains, as it involves real-world interpersonal interaction, perceived safety risks, and limited historical user data under cold-start conditions. Existing platforms often lack structured multi-factor matching and transparent integration of trust and safety constraints. This study makes three contributions. First, it introduces a methodology for deriving interpretable compatibility weights from user preference data under cold-start conditions. Second, it presents a four-algorithm comparative evaluation framework that identifies user-preferred matching strategies through controlled real-user testing. Third, it proposes a safety-enhanced empirical hybrid algorithm that integrates a hard trust gate (T ≥ 0.7), safety-oriented components (51.3% normalised weight), and empirically derived preference personalisation (48.7%) within a single scoring framework. A three-phase empirical methodology is adopted: Phase 1 (n = 26 survey) derives compatibility weights, revealing safety (69.2%), travel pace (76.9%), and budget (73.1%) as dominant factors; Phase 2 (n = 15) compares four algorithms, with safety-first matching receiving the highest acceptance rate (60.0%, 95% Wilson CI: 35.7–80.2%); Phase 3 (n = 13 journeys) evaluates the hybrid algorithm, achieving an 84.6% selection rate with Precision@6 = 0.333, MRR@6 = 0.554, and NDCG@6 = 0.597. These results provide preliminary evidence that trust-aware constraints can be integrated with empirically derived preference modelling to produce actionable recommendations under cold-start conditions, offering a reproducible approach for peer-to-peer travel platforms prioritising user safety.
1. Introduction
SOLO travelling is growing more popular, driven by desires for independence and flexible itineraries. However, solo travel presents well-documented challenges including safety risks, higher costs, and social isolation [1]. Denali et al. [1] identify fraud by locals and lack of peer support as primary concerns, while Jain et al. [2] report that existing travel companion platforms suffer from inadequate personalisation, limited real-time matching, and insufficient trust and safety mechanisms. These limitations are compounded by the cold-start problem—a fundamental challenge in recommendation systems where new or infrequent users lack sufficient interaction history for collaborative filtering to operate effectively [3]. In travel companion matching, this problem is particularly acute because the primary target users are precisely those who travel infrequently and therefore have no platform history.
Trust and safety represent critical yet often neglected dimensions of travel companion matching. Suryawanshi et al. demonstrate that fake profile injection and rating manipulation compromise recommendation integrity in peer-to-peer platforms, a concern echoed by 69.2% of users in our Phase 1 survey who reported safety as their top solo-travel concern. Trust-aware recommender systems have been explored in adjacent domains—for instance, TrustGNN [4] models trust propagation through graph neural networks, and fuzzy clustering approaches [5] integrate trust relationships to reduce recommendation error—yet no prior work has systematically combined trust gating with empirically derived compatibility weights for travel companion matching under cold-start conditions.
This work is explicitly positioned against three categories of existing trust-aware recommender systems. First, learned-trust approaches such as TrustGNN [4] propagate trust through graph neural networks, requiring an existing interaction graph that is unavailable under cold-start conditions. Second, rating-based trust approaches such as fuzzy clustering trust [5] integrate trust relationships with collaborative filtering to reduce recommendation error but require accumulated rating history. Third, platform-level verification approaches such as Travel Tinder [2] discuss trust conceptually but do not integrate it algorithmically into the recommendation scoring pipeline. The proposed framework differs from all three in three specific respects: (a) it derives interpretable compatibility weights directly from user preference data rather than relying on expert assignment or interaction-based learning; (b) it provides the first comparative evaluation of multiple philosophically distinct trust-aware matching strategies using real-user outcomes; (c) it integrates a hard trust gate with soft trust multiplication and empirically derived multi-criteria scoring within a single framework that operates without any prior interaction data. These contributions are not merely the combination of known components; rather, they address a specific methodological gap—the absence of empirically grounded, trust-constrained recommendation under cold-start conditions—that existing approaches individually cannot fill.
Furthermore, single-criterion matching approaches have been shown to achieve only 45–50% user acceptance compared with 78% for hybrid methods in the travel recommendation domain [2], underscoring the need for multi-factor matching that balances safety constraints with preference-based personalisation. This research applies a three-phase process to design and develop a safety-enhanced travel companion matching platform, taking real-world user needs into consideration. Phase 1 surveys 26 respondents to derive empirical feature priorities for cold-start matching. Phase 2 evaluates four philosophically distinct algorithms with 15 unique users, whereas Phase 3 synthesises these findings into a safety-enhanced empirical hybrid algorithm implemented in a web-based prototype.
Three research objectives are set for this paper: (i) to develop a hybrid travel companion matching algorithm that incorporates user preference-driven weight optimisation, (ii) to design a four-algorithm evaluation framework to identify the most preferred matching approach through testing by real users, and (iii) to synthesise empirical findings into a safety-enhanced empirical hybrid matching algorithm. Apart from that, the paper investigates three questions:
- RQ1: What are the most critical user profile features for predicting travel companion compatibility under cold-start conditions?
- RQ2: Which trust-enhanced matching approaches yield the highest user acceptance and preference when evaluated in a controlled user study?
- RQ3: How can safety-first demographic matching and empirical personalisation be effectively combined into a hybrid algorithm that addresses both user safety concerns and preference compatibility?
Travel companion matching requires compatibility-aware and trust-aware recommendations, because users usually evaluate practical fit on top of perceived risk. However, many platforms and informal channels lack multi-criteria matching and transparent yet reproducible recommendation methods.
A key research gap identified in the literature is the lack of systematic, empirical methods to derive interpretable feature weights from user preference data under cold-start conditions while comparing multiple trust-aware matching approaches using user-facing outcomes. This gap directly impacts travel companion matching, where trust and safety considerations undeniably influence acceptance decisions despite high preference similarity. This paper aims to bridge this gap by developing a three-phase methodology for creating a safety-enhanced hybrid algorithm in a web-based prototype.
1.1. Design Choice and Scope
Although advanced recommender models (e.g., deep learning, GNNs, transformer-based recommenders) are widely studied, this work intentionally prioritises interpretable and data-light similarity functions. The target setting is cold-start, where historical interactions are sparse or unavailable, and where safety is a first-class constraint that can exclude candidates regardless of preference similarity. In such settings, transparent matching criteria, explicit constraints (e.g., a trust gate), and stable behaviour under limited data can be more appropriate than high-capacity models that require substantial training data and are harder to audit. Three specific considerations underpin this design choice. First, the cold-start setting provides no interaction history for training neural models: GNNs require graph structure from user interactions, transformer-based recommenders need datasets exceeding 100,000 interactions, and LLM-based systems demand 10–15× computational resources compared to traditional approaches. None of these prerequisites are available in the target setting. Second, safety-critical decisions—recommending a real person as a travel companion—demand transparent, auditable matching criteria. Weighted similarity functions with explicit coefficients are directly interpretable, unlike black-box neural embeddings, enabling users and platform operators to understand and verify why a particular companion was recommended. Third, the Phase 2 evaluation empirically validates this design choice: users found the interpretable, rule-based algorithms acceptable, with the hybrid prototype achieving an 84.6% selection rate in Phase 3, suggesting that complex neural approaches are not necessary to achieve practical matching quality in this domain at its current scale.
1.2. Evidence Level
The empirical results presented in this manuscript should be interpreted as exploratory and prototype-validating evidence rather than definitive population-level conclusions. The sample sizes (n = 26 survey respondents; n = 15 algorithm-comparison participants; n = 13 logged prototype journeys) limit statistical power and generalisability; therefore, findings are reported with uncertainty estimates and discussed as directional trends that motivate the proposed hybrid design. Accordingly, the reported results constitute prototype-level validation of technical feasibility and directional user preferences, rather than performance benchmarking against production-scale recommender systems. The metrics presented (acceptance rates and ranking quality indicators) serve to demonstrate that the proposed approach is viable and warrants further investigation at larger scale, not to establish definitive performance claims.
2. Related Work
2.1. The Demand for Travel Companion Platforms and Current Limitations
The global travel industry is shifting towards solo travel, driven by desires for independence and flexible itineraries. In addition to the popularity of travelling as a hobby and the rapid growth of tourism, Denali et al. [1] also revealed the disadvantages of solo travelling. The most significant issue is the great risk of fraud caused by locals with bad intentions to scam tourists. Other than that, solo travelling leads to higher expenses, lack of support from others, and loneliness. To address the issue, travel apps and social platforms are used to find compatible travel companions. However, existing solutions still face several limitations: inadequate personalisation and context-aware technology, limited real-time matching, trust and safety concerns, as well as neglect of solo travellers [2].
2.2. Machine Learning Algorithms for Recommendation Systems
In the context of recommendation systems, the selection of an appropriate recommendation algorithm directly impacts platform adoption and matching accuracy. The recommendation systems landscape has evolved significantly from traditional collaborative filtering to sophisticated neural approaches. Still, hybrid matrix factorisation remains the most practical choice for real-world implementations [3]. This analysis reveals distinct performance patterns across algorithm categories, with particular emphasis on their applicability to travel companion matching scenarios where trust, compatibility, and implementation feasibility are paramount considerations.
The matching and recommendation system plays an important role in a travel companion platform, with numerous algorithms currently implemented for such systems. Mahanra et al. [4] introduced a user-interactive recommendation system that adopts content-based filtering algorithms. Li et al. [5] demonstrated a dynamic ontology-based travel recommendation system that leverages semantic web technologies and fuzzy logic. Sai [6] introduced a genetic algorithm-based recommendation system for optimised travel routes. Luna [7] presented a multi-modal travel route recommendation system leveraging self-attention mechanisms. To overcome cold-start and scalability issues, Budhathoki et al. [3] designed the ClusterBoost model that leverages meta-clustering techniques for Airbnb recommendations.
Hybrid collaborative filtering approaches achieve 85–90% user satisfaction rates while maintaining computational efficiency suitable for real-time deployment. Matrix factorisation delivers 15–20% accuracy improvements over single-method implementations, though genetic algorithm variants require 300% increased processing time compared to traditional approaches [6]. These performance characteristics establish matrix factorisation as a baseline for comparison with emerging neural approaches.
While matrix factorisation demonstrates proven effectiveness, contemporary research has explored neural architectures to address scalability and cold-start limitations. Graph Neural Networks show promising results in academic benchmarks, achieving 15% improvement over traditional collaborative filtering on sparse datasets [5]. However, implementation complexity analysis reveals O(n) scaling for dense graphs and specialised expertise requirements that present deployment barriers. Transformer-based collaborative filtering excels in sequential recommendation but demands 4–6 times more resource requirements compared to matrix factorisation, with dataset requirements exceeding 100,000 interactions [8].
The emergence of LLMs represents the most recent evolution in recommendation systems, promising enhanced explainability and natural language interfaces. LLM-based systems represent significant innovation in explainability, with recent advances demonstrating conversational interfaces and domain-specific potential [9]. However, infrastructure costs reveal 10–15 times more computational requirements compared to traditional approaches, restricting practical application to high-value scenarios.
2.3. Domain-Specific Algorithms for Travel Companion Matching
Travel recommendation analysis reveals that hybrid approaches significantly outperform single-method implementations, achieving 78% user acceptance rates compared to 45–50% for single-criterion approaches [2]. Enhanced systems with fake profile detection improve accuracy by 8–12% while providing robustness against adversarial inputs [10]. This integration of security considerations directly into algorithmic frameworks represents a domain-specific requirement where trust factors become primary determinants of recommendation success, fundamentally altering traditional collaborative filtering to prioritise safety verification alongside similarity computation.
Travel companion algorithms must systematically evaluate personality compatibility, travel style preferences, budget constraints, activity interests, and cultural considerations within unified recommendation frameworks. This necessitates sophisticated weighting mechanisms and multi-criteria decision-making capabilities that extend beyond traditional recommendation system design. Gunasekara et al. [8] demonstrate that culturally aware algorithmic approaches improve cross-cultural matching success rates by up to 40% through personality insights and behavioural pattern analysis, requiring algorithmic frameworks capable of cultural context interpretation and adaptive compatibility weighting.
Travel companion matching requires dynamic adaptability to changing circumstances, location constraints, and evolving user preferences. Sharma et al. [9] demonstrate that location-aware algorithmic approaches achieve 25–30% higher user satisfaction compared to location-agnostic systems. Traditional recommendation metrics prove inadequate for travel companion algorithms, necessitating domain-specific assessment frameworks that encompass safety outcomes, compatibility success rates, and long-term platform trust—representing a critical research gap in developing standardised evaluation methodologies for travel companion recommendation systems.
2.4. Cold-Start Problem in Travel Companion Matching
The cold-start problem represents a fundamental challenge in recommendation systems, particularly acute in travel companion matching where many users are new or infrequent travellers. Traditional collaborative filtering approaches struggle due to insufficient user interaction data, creating barriers to effective matching for the primary target demographic.
Common cold-start mitigation strategies include combining collaborative signals with content/profile features, using demographic-based initialisation, and collecting explicit preferences during onboarding to bootstrap early recommendations [11].
2.5. Trust and Safety Mechanisms in P2P Platforms
The open architecture of P2P platforms creates inherent vulnerabilities that malicious actors exploit through fake profile injection, rating manipulation, and fraudulent behaviour, compromising recommendation system integrity [10]. This security challenge becomes particularly acute on travel companion platforms where user safety depends on authentic identity verification and trustworthy profile information.
Blockchain-based identity verification and decentralised identity management schemes are increasingly explored to mitigate fake profiles and strengthen trust in P2P platforms [12,13,14,15].
Contemporary machine learning approaches demonstrate significant promise in combating these security threats through sophisticated detection mechanisms. Comparative studies evaluate a range of ML-based fake-profile detection approaches, including classical and deep learning models [16,17]. Advanced multi-modal detection systems like DeepFakeGuard integrate behavioural patterns, image analysis, and textual content to achieve comprehensive fraud identification [18], while entropy-based PageRank algorithms leverage domain authority metrics for enhanced detection precision [19].
The integration of these detection mechanisms with recommendation systems creates robust security frameworks essential for travel companion platforms. Enhanced systems incorporating fake profile detection demonstrate 8–12% accuracy improvements while providing resilience against adversarial inputs, establishing security as a fundamental component rather than an optional feature [10].
Rating-based trust systems provide an alternative lightweight approach to building user confidence without requiring complex identity verification infrastructure. Empirical studies show that user rating systems achieve 70–80% correlation with actual trustworthiness when properly designed with multi-dimensional feedback mechanisms [20]. These systems leverage post-trip evaluations, behavioural consistency analysis, and community feedback loops to establish reliable trust scores that influence recommendation quality.
2.6. Recommendation Algorithm Evaluation Methodologies
Evaluating recommendation algorithms for travel companion matching requires specialised methodologies that extend beyond traditional offline metrics. Recent research emphasises the importance of multi-dimensional evaluation approaches that capture both algorithmic performance and user satisfaction [21]. Contemporary evaluation frameworks incorporate A/B testing methodologies, statistical significance testing, and longitudinal user studies to provide comprehensive assessment of algorithm effectiveness.
A/B testing has emerged as a critical evaluation tool for recommendation systems, enabling direct comparison of algorithm performance in real-world settings. Studies demonstrate that offline evaluation metrics often fail to predict actual user preferences, with up to 30% discrepancy between offline accuracy scores and real-world user satisfaction [22]. Advanced offline evaluation methodologies address this limitation by simulating user behaviour patterns and providing more reliable performance estimates without the resource requirements of live testing [21].
Multi-stakeholder fairness considerations have become increasingly important in tourism recommendation systems. Research by Zangerle et al. [23] highlights that traditional recommender systems optimised solely for user satisfaction can result in unfair exposure for travel destinations and service providers. This has led to the development of fairness-aware algorithms that balance user preferences with equitable distribution across stakeholders, ensuring sustainable tourism practices while maintaining recommendation quality [24].
Statistical significance testing has evolved to address the complexities of travel companion matching evaluation. Recent approaches employ paired t-tests and CI analysis to determine algorithm preference patterns with statistical rigor. These methods are particularly important for evaluating safety-first algorithms where user trust and security considerations must be weighed against matching accuracy.
Temporal dynamics in recommendation evaluation represent another critical research area. Studies show that user preferences evolve over time, with temporal biases affecting recommendation quality [25]. Context-aware evaluation methodologies now account for seasonal variations, travel patterns, and changing user expectations to provide more accurate assessments of algorithm performance across different time periods.
2.7. Advanced Trust Scoring Mechanisms
Recent advances in trust scoring algorithms have significantly enhanced the reliability of P2P travel companion platforms. GNN-based trust evaluation systems, such as TrustGNN, demonstrate superior performance in modelling complex trust relationships through learnable propagative and composable architectures [26]. These approaches address the limitations of traditional rating systems by capturing multi-dimensional trust signals and temporal dynamics in user behaviour patterns.
Hybrid trust-aware recommendation systems have emerged as a promising solution to the cold-start problem in travel companion matching. Research by Mohamadrezaei and Huo [27] demonstrates that integrating trust relationships with fuzzy clustering techniques reduces MAE and RMSE by up to 25% compared to traditional collaborative filtering approaches. These systems effectively mitigate data sparsity issues while maintaining recommendation relevance in large-scale travel platforms.
Deep learning-based trust scoring models have revolutionised how user reliability is assessed in travel companion contexts. Studies show that advanced deep learning architectures can capture complex behavioural patterns and temporal dynamics in user decisions, leading to more accurate trust predictions [28]. These models enable hierarchical analysis of user preferences and behavioural pattern analysis, providing nuanced trust assessments that evolve with user interactions.
Multi-modal trust evaluation frameworks combine various data sources to create comprehensive trust profiles. Recent research indicates that integrating post-trip ratings, behavioural consistency metrics, and community feedback loops improves trust prediction accuracy by 35–40% compared to single-source approaches [26]. These frameworks are particularly valuable for travel companion platforms where safety considerations require robust trust assessment mechanisms.
Trust decay and recovery models represent another critical advancement in the field. Studies demonstrate that implementing dynamic trust decay functions, where trust scores gradually decrease without positive reinforcement, improves system reliability by 15–20%. Concurrently, recovery mechanisms that allow users to rebuild trust through consistent positive behaviour create more resilient and fair trust ecosystems.
2.8. Research Positioning and Contribution
The preceding literature review identifies three specific gaps that this study addresses:
- No systematic empirical weight derivation for travel companion matching under cold-start conditions: Existing systems either use expert-assigned weights [6], arbitrary configurations, or require interaction history unavailable in cold-start settings [11]. No prior work has derived interpretable matching weights directly from user preference data for the travel companion domain.
- No comparative evaluation of multiple trust-aware matching philosophies using real-user outcomes: While individual trust-aware algorithms have been evaluated in isolation [26,27], no study has compared multiple philosophically distinct approaches (logistics-first, safety-first, interest-first, survey-driven) within a controlled evaluation using real users to identify which design philosophy users prefer.
- No hybrid algorithm combining hard trust constraints with empirically personalised compatibility scoring under cold-start conditions: Existing trust-aware recommender systems either rely on learned trust from interaction data [26,28] or apply trust as a post hoc adjustment [27]. No prior system integrates a hard trust gate (binary safety constraint) with soft trust multiplication and empirically derived multi-criteria scoring in a single framework designed for cold-start travel companion matching.
Table 1 summarises how the proposed framework is positioned relative to representative prior approaches.
Table 1.
Comparison of proposed framework with representative prior approaches.
The weighted multi-criteria scoring used in the proposed algorithms is grounded in multi-criteria decision-making (MCDM) theory [11]. Specifically, the normalised weighted-sum aggregation (Equation (1)) corresponds to the Simple Additive Weighting (SAW) method, one of the most widely used MCDM techniques. The preference-frequency normalisation approach used to derive weights from Phase 1 survey data follows established MCDM weight elicitation practices, where attribute importance is derived from stakeholder preferences rather than arbitrary assignment. This connection positions the algorithmic framework within the broader decision-making literature, while the trust gate adds a safety-first constraint layer not typically present in classical MCDM formulations.
Each subsection in the Related Work identifies specific limitations that this study addresses:
- Section 2.1 identifies the lack of structured multi-factor matching in existing travel platforms → addressed by the multi-criteria scoring framework.
- Section 2.2 establishes the computational trade-offs of advanced models → motivating the interpretable, data-light approach.
- Section 2.3 quantifies hybrid superiority (78% vs. 45–50%) → motivating the hybrid synthesis in Phase 3.
- Section 2.4 defines the cold-start challenge → directly addressed by Phase 1 preference elicitation.
- Section 2.5 reviews trust mechanisms → informing the dual-stage trust integration.
- Section 2.6 highlights evaluation methodology gaps → addressed by the multi-phase real-user evaluation framework.
- Section 2.7 surveys advanced trust scoring → contextualising the simulated trust design and proposing real-deployment pathways.
2.9. System-Level Deployment and Data Engineering Considerations
Beyond algorithm design, a deployable travel companion matching system must handle continuously arriving user journeys, profile updates, and trust signals. As the platform scales, data engineering becomes central: (i) ingestion of event logs, (ii) reliable storage and querying of journey records, (iii) feature computation for trust and compatibility, and (iv) operational monitoring for abuse and trust manipulation.
In this study, PostgreSQL-based minimal logging is sufficient for controlled prototype evaluation. For future deployment, the same logical logging schema can be extended toward cloud-based architectures to support real-time recommendation generation, auditability of trust updates, and scalable offline analysis of recommendation outcomes.
3. Methodology
The research adopts a sequential three-phase methodology in which each phase addresses a distinct methodological gap. Phase 1 (preference survey, n = 26) addresses the cold-start weight derivation problem: because no user interaction history exists, compatibility weights must be derived from explicit preference elicitation rather than learned from behavioural data. The preference-frequency normalisation approach used here is grounded in MCDM weight elicitation practice [11], producing interpretable coefficients that reflect stated user priorities. Phase 2 (four-algorithm comparison, n = 15) validates which algorithmic design philosophy real users prefer—a necessary step because weight derivation alone does not determine whether a safety-first, logistics-first, interest-first, or survey-driven framing produces the most acceptable recommendations. Phase 3 (hybrid prototype, n = 13 journeys) synthesises the Phase 1 weights and Phase 2 design insights into a single algorithm and evaluates end-to-end feasibility with real users. The sequential dependency is intentional: Phase 1 outputs (weights and safety priorities) parameterise the Phase 2 algorithms, and Phase 2 outcomes (user preference for safety-first matching) inform the Phase 3 hybrid design. This progression from preference elicitation through comparative evaluation to hybrid synthesis provides a structured, reproducible pathway for algorithm development that can be replicated in other domains facing similar cold-start and trust challenges.
3.1. Survey Design and Data Collection
A comprehensive questionnaire was designed to validate market demand, identify critical compatibility factors, and assess security requirements for travel companion matching platforms. The survey aimed to validate market demand and target demographics, identify critical compatibility factors for algorithm feature weighting, and establish an empirical foundation for hybrid scoring coefficients.
Survey responses were analysed to summarise concerning aspects, feature priorities, and safety requirements. The responses ultimately inform system feature selection and the weighting strategy used in the Phase 2 matching algorithms.
The research successfully identified compatibility factor priorities for machine learning algorithm optimisation. The findings serve as concrete empirical data for weight distribution. The survey results suggest the following priority hierarchy: primary factors (>75% user priority: similar budget compatibility and similar travel pace), secondary factors (50–75% user priority: shared interests and same travel style), and tertiary factors (<25% user priority: same gender and matching sleep schedules).
The primary data source consists of 26 questionnaire responses collected through Microsoft Forms, capturing comprehensive user preferences for travel companion matching. The survey is structured as follows: travel experience (solo travel frequency, experience levels, and comfort with independent travel), primary concerns (safety/security, high costs, loneliness, logistics, and planning challenges), compatibility factors (budget range preferences, travel pace, shared interests, travel style, sleep schedules, and demographic preferences), security requirements (ID verification preferences, trust threshold settings, and safety communication needs), and user demographics (age, gender, location, travel history, and personal preferences).
As the survey was anonymous and the sample size is small, demographic variables are used primarily to characterise the sample at an aggregate level and to inform discussion of generalisability, rather than for fine-grained subgroup inference. Future studies with larger and more diverse recruitment can report richer demographic breakdowns and test whether the derived preference weights are stable across subpopulations.
3.2. Data Processing and Feature Engineering
The raw Microsoft Forms responses undergo systematic transformation to extract algorithmic features. First, responses are cleaned and validated by verifying response completeness for all 26 submissions, standardising categorical responses to consistent formats, and handling missing data by treating optional fields as unknown and scoring them neutrally during matching (e.g., 0.5 similarity when one side is missing) to avoid over-penalising incomplete profiles under cold-start conditions.
Next, feature extraction converts preference importance ratings into numerical coefficients, transforms categorical preferences into similarity metrics, encodes age and gender for algorithm compatibility, classifies activity interests into hierarchical matching categories, and converts budget ranges into numerical compatibility scores.
Finally, statistical analysis computes preference importance percentages across all 26 respondents, converts raw percentages to algorithm-ready coefficients through weight normalisation, and establishes primary (>75%), secondary (50–75%), and tertiary (<25%) priority categories.
The processed survey data directly informs the feature engineering for all four recommendation algorithms to be tested and compared.
For Algorithm 1 (Empirical), the survey-derived feature mapping is: budget weight (73.1% user priority → 0.75 normalised coefficient), pace weight (76.9% user priority → 0.75 normalised coefficient), interests weight (57.7% user priority to 0.57 normalised coefficient), style weight (57.7% user priority to 0.57 normalised coefficient), demographics (gender + age) weight (7.6% user priority to 0.09 normalised coefficient), and sleep weight (3.8% user priority to 0.07 normalised coefficient).
For the other Phase 2 variants, algorithm-specific adaptations are applied: Logistics + Trust emphasises budget and pace (45% each) reflecting survey priorities; Safety + Social enhances demographics (46%) addressing 69.2% safety concerns; SemanticBio is interest-focused (25%) incorporating survey-derived preference patterns; and Empirical directly implements the survey-derived weights as the baseline approach.
3.3. Algorithm Design and Implementation
Four distinct algorithms representing different philosophical approaches to travel companion matching were developed and implemented to determine which approach achieves the highest user preference among real users. Each algorithm embodies unique design principles and weighting strategies, enabling comprehensive evaluation of different matching paradigms within the travel companion domain.
Across all four Phase 2 algorithms, the scoring pipeline uses the same normalisation pattern to keep outputs interpretable and comparable. Let denote the user submitting preferences and a candidate companion profile to be scored and ranked. For each of n feature components (indexed = 1…), a similarity score ∈ [0, 1] measures how well the candidate matches the user on criterion , where 0 indicates a poor match and 1 indicates a strong match. Each component is assigned a non-negative weight (raw weights need not sum to 1). The normalised compatibility score ∈ [0, 1] is computed as:
Trust is integrated via a monotone soft trust adjustment function : [0, 1] → [0.6, 1.0] (used in all algorithms) and an optional hard gate (used only in Safety + Social, where candidates with are excluded prior to ranking). ∈ [0,1] denotes the trust score of candidate .
For multi-select attributes such as interest sets and sleep preference sets (where subscripts and denote the user and profile, respectively), the Jaccard coefficient is used as the similarity measure. Key component functions used by the implementations are summarised below:
- Pace similarity (ordinal 1–3)
- Budget similarity (ordinal 1–3)
- Interest overlap (multi-select)
- Sleep overlap (Jaccard)
- Exact-match categorical and habit fields
match = 1, mismatch = 0, unknown = 0.5 (when one side is missing)
Algorithm 1 serves as the baseline that directly implements the normalised weight distribution derived from Phase 1 questionnaire responses. It computes per-feature similarity components within [0, 1], combines them using the survey-derived coefficients with weight-mass normalisation (Equation (1)), applies a soft trust multiplier in [0.6, 1.0] to down-weight lower-trust profiles without hard exclusion, and ranks candidates by the resulting final score.
Compared with other approaches, Algorithm 1 excludes habit-based factors (smoking/alcohol preferences, dietary restrictions, cleanliness considerations, fitness levels, and bio analysis) to maintain focus on core compatibility factors, prioritises stated preferences to preserve transparency in matching decisions, uses soft trust integration in place of hard exclusion, and serves as the empirical baseline for the Phase 2 algorithm comparison.
| Algorithm 1 Empirical (survey-driven matching) |
The Logistics + Trust algorithm emphasises core travel practicalities, allocating 45% weight each to budget and pace while excluding demographic factors. It applies the same soft trust penalty as Algorithm 1, promoting diversity by reducing potential demographic bias while focusing on practical compatibility.
Overall, this algorithm targets users prioritising practical travel considerations over social compatibility factors, provides a baseline practical assessment without complex social analysis, excludes bio analysis and demographic matching to keep the focus on practical considerations, and maintains practical compatibility while enforcing reasonable trust standards.
The Safety+Social algorithm implements a comprehensive security-first approach incorporating strict trust and demographic requirements, enhanced with safety keyword detection in bio input analysis. The weightage distribution is mathematically expressed to incorporate demographic matching with same-gender preference and age proximity scoring, where demographic calculations consider both gender alignment and age compatibility across different proximity ranges. For demographic matching, the algorithm assigns a same-gender indicator value of 1 for matching gender preferences and 0 otherwise, while age proximity scoring assigns values of 1.0 for age differences within 3 years, 0.6 for differences within 7 years, 0.3 for differences within 12 years, and 0 for differences beyond 12 years. The algorithm process implements comprehensive safety-first matching through multiple mechanisms. In implementation, it excludes profiles with trust scores below 0.7 to establish a minimum safety threshold, applies strict demographic matching using same-gender preference and age proximity scoring to enhance user comfort and safety, analyses bio content for safety indicators, includes lifestyle and habit factors (smoking, alcohol, dietary, cleanliness, and fitness) to reduce potential conflicts, and combines these safety-first factors with traditional preferences through weighted scoring.
This safety-oriented approach is distinguished by its hard trust threshold (excluding low-trust candidates prior to ranking), demographic strictness aligned with survey-identified safety concerns, comprehensive habit matching to reduce potential conflicts, and safety keyword analysis applied to user-provided bio text.
The SemanticBio algorithm employs advanced natural language processing techniques to discover implicit compatibility indicators from user bio input, enabling sophisticated interest-based matching beyond explicit preference selections. The weightage distribution is formulated to incorporate demographic matching with balanced gender and age proximity considerations, where demographic calculations use averaged scoring across different age proximity ranges. For demographic matching, the algorithm assigns a same-gender indicator value of 1 for matching gender preferences and 0 otherwise, while age proximity scoring assigns values of 1.0 for age differences within 5 years, 0.5 for differences within 10 years, and 0 for differences beyond 10 years. The algorithm process implements sophisticated semantic analysis through multiple computational stages. In implementation, it tokenises user and candidate bios and computes lightweight overlap scores to assess textual similarity, detects interests from bio text to expand beyond explicitly stated preferences, applies small boosts for shared rare interests to promote diversity in matching recommendations, computes demographic compatibility (gender match and age proximity) internally, and combines semantic features with traditional factors through multi-dimensional scoring while promoting matching across different interest categories.
This approach enables deeper compatibility assessment through textual analysis, supports implicit interest detection beyond explicit selections, encourages exploration via rarity weighting, captures semantic similarity from user-provided bios, and reduces demographic emphasis by prioritising interest compatibility over demographic similarity.
3.4. Evaluation Framework
Fifteen participants completed the Phase 2 algorithm comparison through the web-based prototype. Each participant was presented with algorithm recommendations in a fixed order (Algorithms 1–4), receiving one recommendation from each of the four algorithms, resulting in a total of four candidate profiles per evaluation session. A limitation of this design is that fixed ordering may introduce position effects (e.g., anchoring or fatigue); future studies should employ randomised or counterbalanced presentation to control for such effects.
| Algorithm 2 Logistics + Trust (practical compatibility) |
| Algorithm 3 Safety + Social (safety-first matching) |
| Algorithm 4 SemanticBio (interest-based semantic analysis) |
The data collection structure was designed to capture both algorithmic performance metrics and demographic information for segmentation analysis. For each algorithm recommendation, detailed compatibility scores and trust ratings were recorded to enable comprehensive evaluation and interpretation of user decision patterns. Additionally, user demographic data was collected to support potential segmentation analysis and identify any preference patterns across different user groups.
The evaluation framework incorporated both primary and secondary outcome measures to provide a comprehensive assessment of algorithm performance. The primary outcome focused on user acceptance, defined as a binary outcome based on whether participants selected at least one recommended profile from a given algorithm. Furthermore, an algorithm-level preference distribution was computed from participant selections across all algorithms to identify relative preference patterns. Secondary outcomes included displayed trust scores and compatibility scores, which were recorded to support exploratory interpretation of factors influencing user selection decisions.
The statistical analysis plan was designed to provide rigorous evaluation of algorithm performance while accounting for the exploratory nature of the study. Algorithm acceptance rates were summarised using 95% Wilson confidence intervals to provide robust uncertainty estimates. Paired binary outcomes were compared using McNemar exact tests to identify statistically significant differences between algorithm pairs. Additionally, the overlap of recommended profile identifiers across algorithms was systematically analysed to quantify whether algorithms produced similar candidate sets or substantially different candidate pools, providing insights into algorithmic diversity and complementarity.
The Phase 2 evaluation results informed the Phase 3 hybrid synthesis through a structured decision-making process. The hybrid algorithm was specifically designed to integrate safety-first constraints and trust-gating emphasis from the safety-oriented algorithm with preference-driven personalisation derived from Phase 1 survey weights. Components considered for inclusion in the hybrid algorithm encompassed trust gating, demographic matching, safety keyword detection, habit compatibility, and core preference similarity factors including budget, pace, and interests.
The interpretation approach employed a comprehensive analysis framework where preference outcomes were analysed alongside overlap analysis to distinguish between algorithms that merely re-rank similar candidates versus those that surface fundamentally different candidates. Given the exploratory sample size, results were reported with appropriate uncertainty estimates and interpreted as evidence to guide prototype synthesis rather than definitive population-level conclusions. This approach ensures that the hybrid algorithm development is grounded in empirical evidence while acknowledging the limitations of the sample size.
3.5. Inter-Phase Dependency and Filtering Impact
The overall three-phase methodology is sequential, and the output of each phase constrains what can be observed in later phases. Particularly, Phase 1 determines which profile features are emphasised (via empirical weights) in the Phase 2 algorithm variants, which in turn affects the candidate sets and ranking distributions presented to participants. In addition, safety-oriented filters (e.g., a trust gate) change the eligible pool before ranking; therefore, later-stage outcomes (acceptance, no-match rate, and ranking metrics) reflect both (i) the filtering constraints and (ii) the subsequent ranking within the remaining pool. This dependency is discussed explicitly to avoid attributing later-stage differences solely to ranking changes when earlier-stage constraints may have removed candidates.
4. System Design
4.1. System Architecture
The proposed framework implements a safety-enhanced empirical hybrid algorithm within an end-to-end workflow. In short, users submit personal information and travel preferences, then receive a ranked list of potential candidates. Lastly, the user selects at least one companion, otherwise none if there are no suitable matches at all.
The system architecture implements a multi-tiered design with clear separation of concerns across four distinct layers. The Frontend Layer employs server-rendered web pages using Flask templates (Jinja2) with HTML/CSS and minimal client-side JavaScript for form submission, results display, and profile selection. The Application Layer implements Flask web services with route handlers, form parsing, and journey logging functionality. The Algorithm Layer contains the safety-enhanced empirical hybrid engine with trust gate filtering, safety-oriented components, empirical preference components, and soft trust multiplication. The Data Layer utilises PostgreSQL for storage of journey records and manages simulated profile data. This modular architecture enables independent development, testing, and scaling of individual components while maintaining clear data flow and integration points.
4.2. Data Management
The prototype intentionally separates the source of user inputs from the source of candidate profiles to support controlled evaluation. Candidate profiles are loaded from a fixed simulated dataset that includes the attributes required by the algorithm (see Figure 1), allowing testing without requiring a large live user base. In contrast, user inputs entered on the web application are captured at run time, and completed user journeys (including shown recommendations and final selections) are logged and stored in PostgreSQL.
Figure 1.
Simulated user profile code snippet.
The system interactions are designed around two primary user roles with distinct responsibilities. The Traveler actor performs core functions including submitting comprehensive profile information and travel preferences, viewing algorithm-generated recommendations, selecting compatible travel companions, reporting no-match-found scenarios, and obtaining matched candidate contact information. The Admin actor handles evaluation-related tasks through viewing journey records for analysis and monitoring. This streamlined design focuses on essential user-facing matching functionality while maintaining administrative access to journey data for research evaluation purposes, clearly separating the traveller’s end-to-end matching workflow from administrative data access to support both operational travel companion matching and systematic algorithm validation.
The PostgreSQL layer is primarily used to store an immutable record of each completed end-to-end user interaction for Phase 3 evaluation and analysis purposes. Despite the minimal logging, it is sufficient to compute funnel outcomes and top-6 ranking metrics without requiring a complex relational schema. Each logged journey captures a timestamped snapshot of the user’s submitted inputs, the exact top-6 candidate list displayed to the user (including computed trust score and compatibility score), and the user’s final action (selected profile(s) or clicking “no match found”).
4.3. Safety-Enhanced Empirical Hybrid Algorithm Design
The safety-enhanced empirical hybrid algorithm represents a synthesis of insights from Phase 1 user preferences and Phase 2 algorithm evaluation results. The algorithm design prioritises safety constraints while maintaining empirical personalisation, implementing a two-stage filtering and ranking process that addresses both user safety concerns and compatibility requirements. The algorithm processes candidate profiles through a systematic computational pipeline:
- Trust Gate Filtering: Candidates with trust scores below 0.7 are immediately excluded from consideration.
- Component Score Computation: Multi-dimensional similarity scores are calculated across 12 distinct compatibility dimensions.
- Weighted Aggregation: Component scores are combined using empirically-derived weights.
- Soft Trust Application: A final trust multiplier adjusts rankings while preserving candidate diversity.
For each candidate profile p, a normalised trust value is used. Candidates with trust values below a minimum threshold of 0.7 are excluded. This hard gate prevents low-trust candidates from being recommended.
In this study, trust scores are treated as exogenous inputs to enable controlled evaluation of how trust gating and soft trust multiplication affect recommendation ranking. Specifically, each simulated candidate profile is assigned a static trust value drawn uniformly from [0.35, 0.98]. This design choice allows the evaluation to isolate the algorithmic contribution of trust-aware mechanisms (hard gate, soft multiplier) from the confounding effects of trust measurement quality, temporal variation, and distributional skewness that would arise with real trust data.
In a production travel companion platform, the trust score would be computed dynamically from multiple complementary signals: (1) Identity verification status—binary or graduated score based on completed verification steps such as government ID upload [12], blockchain-based decentralised identity verification [13,14,15], and social media profile linking. (2) Community ratings—multi-dimensional post-trip ratings from previous travel companions covering reliability, respectfulness, communication, and safety behaviour. (3) Behavioural consistency—platform-derived signals including profile completeness, response rate, cancellation rate, and consistency between stated preferences and actual behaviour across trips. (4) Fake-profile detection outputs—probability scores from ML-based detection pipelines [10,16,17,18] that analyse behavioural patterns, profile metadata, and textual content.
The composite trust score would be computed as a weighted combination of these signals: , where signal weights would be calibrated through A/B testing on a live platform. The trust gate threshold (currently ) and soft trust function parameters (currently 0.6 + 0.4 T) would require recalibration when transitioning from simulated to real trust signals, as real trust distributions are likely to be right-skewed rather than uniform. The threshold sensitivity analysis provides a framework for evaluating alternative thresholds under different distributional assumptions. The practical limitations of simulated trust—including adversarial vulnerabilities such as rating manipulation and gradual trust accumulation by bad actors—are discussed in Section 6.6.
Rationale for the trust-gate threshold: The threshold is used as a conservative safety-oriented cut-off intended to keep only moderate-to-high-trust candidates eligible for recommendation while maintaining a non-empty candidate pool in typical cold-start situations. This work does not claim that 0.7 is globally optimal. Instead, it is a reasonable prototype setting aligned with the safety-first objective.
For each remaining candidate profile , the algorithm computes component scores across multiple dimensions. Each component score indicates how well this candidate matches the user on one criterion, where 0 indicates a poor match and 1 indicates a strong match. This shared 0–1 scale allows different types of criteria—whether categorical attributes such as travel style, multi-select attributes such as interests, or numerical attributes such as age—to be combined through normalised weighted aggregation.
Under cold-start conditions, the same similarity functions defined in Section 3.3 (Equations (4)–(7)) are applied: exact-match indicators for categorical fields, overlap ratios for multi-select fields, and distance-based similarity for ordered attributes. The components are systematically grouped into safety-oriented and empirical preference components, reflecting the hybrid design goal that balances safety assurance with personalisation.
Let Wi denote the non-negative coefficients assigned to each component. The raw weighted score is:
As coefficients do not necessarily sum to 1, the compatibility score is normalised by the total weight mass:
The safety-enhanced empirical hybrid algorithm is grounded in multi-criteria decision-making (MCDM) theory and the trust-aware recommender systems literature. The design integrates two fundamental paradigms: (1) safety-first filtering derived from trust management research in P2P systems, and (2) empirical weighting based on user preference elicitation from the cold-start recommendation literature. This dual approach addresses the unique challenges of travel companion matching where personal safety considerations interact with compatibility preferences. The algorithm employs a hierarchical scoring architecture with three distinct layers: (1) a hard constraint layer that applies trust gate filtering (T ≥ 0.7) as a binary safety constraint, (2) a weighted scoring layer that computes multi-dimensional similarity and aggregates with empirically-derived weights, and (3) a soft trust adjustment layer that applies graduated trust multiplication for fine-grained ranking.
This architecture aligns with established hybrid recommender system patterns while incorporating domain-specific safety requirements identified in Phase 1 user research (69.2% safety concern rate).
The hybrid weight vector differs from the Phase 2 Algorithm 1 (Empirical) weights because it serves a different purpose. Algorithm 1 directly normalised survey-reported priority percentages into coefficients (e.g., budget 69.2% → ) to test whether raw survey frequencies alone produce acceptable matches. The Phase 3 hybrid algorithm, by contrast, must accommodate twelve components—including nine safety-oriented signals absent from Algorithm 1—within a single normalised scoring framework. The derivation follows two steps: (i) the ordinal priority ranking from Phase 1 (budget ≈ pace > interests > style >> minor factors) is preserved as the primary constraint; (ii) absolute magnitudes are then scaled so that the safety-oriented group receives aggregate weight reflecting the 69.2% user-reported safety concern, while the empirical group retains sufficient influence to differentiate candidates on preference dimensions. This produces the 51.3–48.7% safety-to-empirical split. The sensitivity analysis in Section 4.4 confirms that the specific absolute values are not critical—any weight vector preserving the same ordinal ranking and approximate group balance yields comparable recommendations.
The algorithm’s mathematical foundation extends traditional collaborative filtering with trust-aware constraints and multi-criteria decision analysis. For candidate profile p with trust value , the filtering condition F(p) is defined as:
Only candidates with F(p) = 1 proceed to compatibility scoring. For each remaining candidate, component scores ci(p) ∈ [0, 1] are computed using similarity functions tailored to data type characteristics.
The overall compatibility score S(p) combines weighted components through normalised aggregation:
The final ranking incorporates trust through soft multiplication:
The algorithm implements twelve specialised similarity functions; each theoretically justified for travel companion compatibility assessment:
- Safety-Oriented Components( = 0.58, 51.3% normalised weight)
- ○
- Demographic Compatibility ( = 0.35)Graduated age proximity with gender preference weighting
- ○
- Safety Signal Detection ( = 0.05)Lightweight keyword matching for safety-related terms in user bios
- ○
- Sleep Compatibility ( = 0.03)Jaccard coefficient for sleep schedule preferences
- ○
- Travel Style Alignment ( = 0.02)Binary exact match for travel style preferences
- ○
- Smoking Compatibility ( = 0.03)Binary exact match for smoking preferences
- ○
- Alcohol Compatibility ( = 0.03)Binary exact match for alcohol consumption habits
- ○
- Dietary Compatibility ( = 0.02)Binary exact match for dietary restrictions
- ○
- Cleanliness Compatibility ( = 0.02)Binary exact match for cleanliness standards
- ○
- Fitness Compatibility ( = 0.03)Binary exact match for fitness level preferences
- Empirical Preference Components( = 0.55, 48.7% normalised weight)
- ○
- Budget Compatibility ( = 0.25)Distance-based similarity on ordinal budget scale
- ○
- Travel Pace Compatibility ( = 0.20)Distance-based similarity on pace scale
- ○
- Interest Overlap ( = 0.10)
Overlap-based similarity for multi-select interest sets (intersection over max set size)
The weight distribution W = {} is empirically derived from Phase 1 survey responses (n = 26) using preference frequency analysis. Safety-oriented components receive higher aggregate weight (51.3%) reflecting the 69.2% user-reported safety concerns, while empirical components maintain substantial influence (48.7%) based on compatibility factor prioritisation: budget compatibility (69.2% user priority to 25% weight), travel pace (69.2% user priority to 20% weight), and shared interests (57.7% user priority to 10% weight).
This distribution ensures that safety constraints receive slight priority while maintaining substantial emphasis on empirical preference factors derived from Phase 1 survey results. Within the safety-oriented group, demographic compatibility () is the dominant component, accounting for 60% of the safety group’s weight. The ablation analysis confirms this: removing demographics causes the largest ranking disruption of any single component, while the remaining weight safety components contribute incrementally.
The algorithm employs a dual-stage trust integration approach: a hard trust gate (T ≥ 0.7) that excludes candidates below the safety threshold to prevent exposure to potentially unsafe profiles, followed by a soft trust multiplier that applies graduated trust scoring after compatibility assessment:
This function maintains final scores in the [0.6, 1.0] range for candidates passing the trust gate, ensuring that lower-trust (but still acceptable) candidates receive reduced visibility without complete elimination.
The final ranking score combines compatibility and trust:
Lastly, candidates are ranked by in descending order, and the top-k are returned (k = 6) and displayed in the UI. A comprehensive worked example demonstrating the complete computational process, including trust gate application, component scoring, weight normalisation, and final ranking calculation, is provided in Appendix B.
The safety-enhanced empirical hybrid algorithm is implemented as a modular Python 3.11 system with clear separation between algorithmic logic and web application infrastructure. The core module implements twelve specialised similarity functions for different data types, trust management with gate enforcement at a 0.7 threshold, and a hybrid algorithm engine with weighted scoring and normalisation. The Flask-based web application handles user input processing, recommendation orchestration, and three-step journey logging with PostgreSQL storage for evaluation data capture.
The system uses PostgreSQL for persistent storage with a minimal schema optimised for evaluation: journey tracking (user preferences and demographic data, timestamp records for each interaction step, complete recommendation sets with scores, and final selection outcomes) and profile management (a simulated profile dataset with 500 candidate profiles (of which 229 pass the trust gate at ), fixed trust scores for controlled evaluation, and comprehensive attribute coverage for algorithm testing).
4.4. Weight Robustness and Sensitivity Analysis
A potential concern with empirically derived weight vectors is whether the specific coefficients obtained from a finite survey sample (n = 26) would generalise to a different respondent pool. This section provides theoretical justification for the weight derivation methodology and presents a computational sensitivity analysis demonstrating that the algorithm’s recommendations are robust to substantial weight perturbations.
4.4.1. Weight Derivation Methodology
The weight vector is derived using a preference-frequency normalisation approach grounded in multi-criteria decision-making (MCDM) theory [11]. Unlike arbitrary or expert-assigned weights, the coefficients are computed as normalised frequency ratios from user preference elicitation. The process applies three principled constraints: (i) weights are non-negative; (ii) the relative ordering of weights reflects the empirically observed priority ranking (budget ≈ pace > interests ≈ style >> demographics > sleep); (iii) the algorithm normalises by total weight mass (Equation (9)), ensuring that the absolute scale of coefficients does not affect compatibility scores. This normalisation property is critical—it means only the relative ratios between weights affect recommendations, not their absolute values. Consequently, any survey sample that produces the same ordinal priority ranking would yield functionally equivalent recommendations.
4.4.2. Monte-Carlo Weight Perturbation Analysis
To empirically validate robustness, a Monte-Carlo sensitivity analysis was conducted with 1000 independent trials across five diverse synthetic user profiles spanning different genders, age groups, budget levels, and interest categories. In each trial, every weight coefficient was independently multiplied by a random factor drawn from , where represents the perturbation magnitude. Three complementary stability metrics were computed: Kendall tau rank correlation between baseline and perturbed top-6 rankings, Jaccard overlap coefficient between the two candidate ID sets, and mean absolute score deviation for candidates appearing in both sets.
As shown in Table 2, the algorithm maintains high ranking stability across all perturbation levels. At ±10% noise—representing plausible variation from a different sample of similar size—the mean Kendall tau of 0.943 and Jaccard overlap of 0.906 indicate near-identical recommendation sets. Even at ±30% perturbation, where every weight is simultaneously altered by up to 30%, the algorithm retains a mean Jaccard overlap of 0.781 and Kendall tau of 0.805. The mean absolute score deviation remains below 0.015 across all conditions, confirming that final ranking scores are minimally affected. These results demonstrate that the specific weight values are not brittle: plausible alternative weight configurations derived from a different respondent sample would produce substantially similar recommendation sets.
Table 2.
Weight perturbation sensitivity results (1000 trials × 5 users).
4.4.3. Safety–Empirical Group Rebalancing Analysis
To assess sensitivity to the balance between safety-oriented and empirical preference components, a group-level weight redistribution analysis was performed. Total weight mass was systematically shifted between the two component groups in increments of ±5%, ±10%, and ±15%.
Table 3 shows that the two-tier architecture (trust gate + weighted scoring) maintains ranking integrity under substantial group-level redistribution. Within a ±5% shift of the baseline 51:49 safety-to-empirical ratio, Kendall tau remains above 0.77 and Jaccard above 0.83, confirming that the algorithm is not sensitive to the exact group-level balance.
Table 3.
Safety–empirical group weight rebalancing results.
4.4.4. Leave-One-Component-Out (Ablation) Analysis
To identify which individual components most influence recommendations, each of the twelve components was removed in turn (weight set to zero) and the resulting top-6 rankings were compared against the baseline. This ablation study directly tests the contribution of each component to the final output.
Table 4 reveals that only the three highest-weighted components—demographics (0.35), budget (0.25), and pace (0.20)—individually cause substantial ranking changes when removed. These are precisely the factors identified as highest priority in Phase 1 survey results, providing independent validation that the weight hierarchy reflects genuine preference structure rather than survey artefacts. All nine remaining components contribute incrementally, confirming the multi-dimensional design where no low-weight feature disproportionately affects outcomes. The removal of bio safety () produces a perfect Jaccard overlap of 1.000, indicating that this lightweight signal enriches ranking without altering candidate composition—consistent with its intended role as a supplementary safety indicator.
Table 4.
Leave-one-component-out results.
4.4.5. Trust Gate Threshold Sensitivity Analysis
The trust gate threshold of was evaluated against alternative thresholds to assess its impact on candidate pool size and recommendation quality. The existing manuscript (Section 4.3) identifies this threshold as a conservative safety-oriented cut-off; the analysis below empirically validates this choice.
Table 5 demonstrates that the 0.7 threshold occupies an optimal position: lowering it to 0.5–0.65 adds candidates but does not change the top-6 composition (Jaccard = 1.000), confirming that the highest-scoring candidates already exceed 0.7 trust. Raising the threshold above 0.80 progressively reduces the eligible candidate pool with diminishing quality gains (mean score drops from 0.744 to 0.724), validating 0.7 as a principled threshold that balances safety filtering with recommendation diversity.
Table 5.
Trust gate threshold sensitivity.
4.4.6. Summary of Robustness Findings
The combined evidence from the four analyses above addresses the concern regarding weight generalisability. The algorithm’s robustness arises from three structural properties: (i) weight normalisation (Equation (9)) renders recommendations invariant to absolute weight scale; (ii) the trust gate provides a safety floor independent of weight values; (iii) the multi-dimensional scoring distributes influence across twelve components, preventing any single weight from dominating outcomes. These properties ensure that the algorithm would produce comparable recommendations under any weight vector that preserves the empirically observed ordinal priority ranking.
4.5. Design Rationale
The hybrid design is intended to satisfy the project’s core safety requirement while remaining useful under cold-start conditions. The selected components reflect two complementary goals: enforcing baseline safety constraints and preserving preference-based personalisation.
In terms of safety assurance, a hard trust gate is applied to exclude low-trust profiles prior to ranking. Demographics strictness, as well as lifestyle and habit compatibility are included as safety-oriented signals to reflect user risk concerns while reducing mismatches that could lead to discomfort or perceived unsafe situations.
As for cold-start personalisation, budget and pace are retained as primary practical compatibility signals, while interests and style provide additional preference differentiation. This ensures that recommended candidates are considered credible and relatively safe to be shown but also remain relevant to the user’s stated travel preferences.
Regarding interpretability and reproducibility, component-level scoring on a shared 0–1 scale with explicit coefficients supports transparent matching decisions and enables reproducible evaluation, which aligns with the research objective of an interpretable hybrid algorithm.
4.6. Implementation Details
The complete user journey workflow follows a systematic process that supports both operational matching functionality and a comprehensive evaluation framework. The process begins with user access to the preference form, followed by form submission and recommendation generation using the safety-enhanced empirical hybrid algorithm. The algorithm applies a trust gate (T ≥ 0.7), calculates safety-oriented components (51.3% weight) and empirical preference components (48.7% weight), then applies a soft trust multiplier for final ranking. The three-step database logging process captures form submission, algorithm recommendations, and final user selections, enabling comprehensive evaluation data collection. If profiles are selected, contact information of selected profiles is displayed upon clicking the “Match!” button. If none are selected, a grey banner with message is displayed upon clicking the “No match found!” button. The display of contact information or a grey banner indicates the end of the user journey, which is recorded in the PostgreSQL database. Examples of prototype input forms and recommendation outputs are shown in Appendix C and Appendix D.
The core object-oriented structure of the proposed system is designed with clear separation of concerns and well-defined responsibilities. The User class encapsulates traveller preferences and form parsing capabilities, while the Profile class represents candidate travel companions with comprehensive attributes. The Journey class models the complete user interaction lifecycle with timestamps and algorithm outputs. The HybridAlgorithm class implements the safety-enhanced matching logic with trust gating, component scoring, and weighted ranking. The DatabaseLogger class handles all persistence operations with structured logging for evaluation support. The FlaskApp class manages web routing and template rendering. These class relationships demonstrate clear data flow from user input through algorithm processing to persistent storage, supporting both functional requirements and research evaluation needs.
5. Results
5.1. Phase 1 Survey Results
The Phase 1 survey (n = 26) established the empirical basis for compatibility weighting and the need for trust enhancement. Primary compatibility priorities were identified as budget (69.2%) and travel pace (69.2%), while secondary compatibility priorities included shared interests (57.7%) and travel style (57.7%). Comprehensive survey results including all response categories are detailed in Appendix A.
As for solo travel concerns, safety and security (69.2%) concerns were the most reported. On the other hand, fake profiles (69.2% “very concerned”) emerged as the biggest concern when utilising travel companion matching platforms. The complete survey response distribution is provided in Appendix A.
These findings directly answer RQ1 by motivating a survey-driven weighting approach for baseline matching, and they justify incorporating trust and safety mechanisms into the recommendation process. The combination of high safety concern and high fake-profile concern supports the inclusion of a trust gate and safety-oriented features in later phases.
5.2. Phase 2 Algorithm Evaluation Results
Phase 2 evaluated four algorithms representing different design philosophies. As participants could mark multiple algorithms as acceptable, the results are summarised using two complementary denominators: per-algorithm acceptance rate out of participants (n = 15) and preference share out of total acceptances (n = 22).
As shown in Figure 2, the Safety + Social algorithm received the highest preference share at 40.9% (9/22 selections), exceeding the runner-up Empirical algorithm at 22.7% (5/22 selections). Both the Logistics + Trust and SemanticBio algorithms received 18.2% preference (4/22 selections each). Given the sample size and non-significant paired tests, these outcomes are interpreted as a directional preference trend rather than definitive superiority.
Figure 2.
Phase 2 algorithm preference results.
In terms of acceptance rate, Safety + Social was accepted by 60.0% (9/15) of participants, while Empirical was accepted by 33.3% (5/15), and both Logistics + Trust and SemanticBio were accepted by 26.7% (4/15). The chart includes 95% Wilson CIs and selection counts, demonstrating the clear preference trend toward safety-first approaches. As shown in Table 6, the Safety + Social algorithm achieved the highest acceptance rate (60.0%) and preference share (40.9%) among the four Phase 2 algorithms.
Table 6.
Phase 2 algorithm comparison summary (n = 15 participants, 22 total acceptances).
Paired comparisons (McNemar exact tests) between Safety + Social and other algorithms showed non-significant differences at alpha = 0.05 (p-values: 0.3438, 0.1797, 0.1250), indicating an evidence trend favouring a safety-first approach but limited by sample size. Recommendation overlap across algorithms was generally low (0–13.3% overlap rate), suggesting that algorithms produced different candidate sets rather than minor re-orderings.
The Phase 2 findings address RQ2 by indicating a directional preference trend toward safety-first matching. The low algorithm overlap supports the practical motivation for a hybrid algorithm that can integrate complementary design elements from different approaches.
5.3. Prototype Evaluation
The Phase 3 evaluation assessed the safety-enhanced empirical hybrid algorithm through comprehensive analysis of user decision outcomes, ranking performance, and trust score distributions. The evaluation employed 13 logged user journeys to validate the algorithm’s effectiveness in real-world matching scenarios.
User decision funnel analysis revealed a selection rate of 84.6% (95% Wilson CI: 57.8–95.7), with 11 journeys resulting in profile selections and 2 journeys yielding no matches. This high selection rate indicates that most users successfully identified acceptable companions from the recommendations, demonstrating the algorithm’s ability to produce plausible candidate sets. The low no-match rate of 15.4% represents a practical success criterion for travel companion platforms, as it minimises user drop-off while maintaining appropriate filtering standards.
Ranking performance evaluation utilised standard information retrieval metrics computed on the top-6 recommendations displayed to users. The Mean Precision@6 achieved 0.333, indicating that 33.3% of recommended profiles were selected by users. This translates to an average of two selected profiles per successful journey, demonstrating effective filtering of incompatible candidates while maintaining sufficient choice diversity. The Mean Reciprocal Rank@6 reached 0.554, showing that users’ first selections appeared at an average position of approximately 1.8, which validates strong positioning performance crucial for user experience in short-list interfaces. The Mean Normalised Discounted Cumulative Gain@6 attained 0.597, representing 59.7% of optimal ranking performance and confirming solid overall ranking quality that balances retrieval accuracy with optimal positioning. Table 7 presents a cross-phase comparison between the best-performing single algorithm from Phase 2 (Safety + Social) and the proposed hybrid algorithm evaluated in Phase 3.
Table 7.
Cross-phase comparison: best single algorithm (Phase 2) versus hybrid (Phase 3).
The Phase 3 hybrid’s 84.6% selection rate compares favourably with the literature benchmark of 78% for hybrid recommendation approaches versus 45–50% for single-criterion methods reported by Jain et al. [2]. However, direct numerical comparison should be made cautiously: the Phase 2 and Phase 3 evaluations differ in the number of candidates shown (1 vs. 6), sample sizes (15 vs. 13), and evaluation design. The higher Phase 3 rate likely reflects both the improved hybrid algorithm and the increased choice afforded by a top-6 list.
Trust score distribution analysis further validated the effectiveness of the trust gating mechanism. As illustrated in Figure 3, the Selected Profile Trust Score Chart shows the distribution of trust scores across all selected companions, ranging from 0.71 to 0.97, with a mean of 0.890 and median of 0.895. The density overlay visualisation clearly demonstrates the concentration of scores in the 0.80–0.90 range (50% of selections), indicating consistent user preference for moderate-to-high-trust profiles. This visual evidence confirms that the trust gate successfully filtered out low-trust candidates while preserving adequate choice diversity. The low standard deviation of 0.062 suggests consistent trust quality across successful matches, supporting the algorithm’s ability to maintain safety standards while accommodating user preferences.
Figure 3.
Phase 3 Selected Profile Trust Score Chart.
5.4. Research Question Analysis
This cross-phase analysis synthesises findings from all three evaluation phases to address the research questions proposed previously—providing comprehensive insights into the effectiveness and practical applicability of safety-enhanced travel companion matching.
RQ1 examined the critical compatibility factors for travel companion matching under cold-start conditions. The Phase 1 survey results confirmed that practical compatibility factors, specifically budget and travel pace, are paramount considerations for users. These findings provide a transparent and interpretable foundation for travel companion matching algorithms, establishing empirical evidence that practical constraints outweigh social preferences in initial matching scenarios. The survey-derived weighting approach ensures algorithmic decisions reflect actual user priorities rather than theoretical assumptions, creating a robust baseline for cold-start recommendation systems.
RQ2 investigated user preferences for different algorithmic approaches to travel companion matching. Phase 2 evaluation indicated a directional preference trend toward the safety-first configuration (Safety + Social algorithm), which received the highest preference share at 40.9% and acceptance rate of 60.0%. However, paired statistical comparisons did not achieve significance due to sample size limitations (p-values: 0.3438, 0.1797, 0.1250); therefore, the results are presented as exploratory evidence rather than inferential confirmation. The low algorithm overlap (0–13.3%) further suggests that different algorithmic approaches can surface meaningfully different candidate pools rather than minor re-orderings.
RQ3 evaluated the feasibility of integrating safety-first matching with empirical personalisation in a hybrid approach. Phase 3 prototype evaluation suggests that the safety-enhanced empirical hybrid algorithm can preserve usability while maintaining safety-driven filtering in a small-scale prototype. The selection rate of 84.6% and no-match rate of 15.4% indicate that safety-enhanced constraints can be integrated without eliminating all personalised compatibility features derived from empirical preferences, within the limits of the prototype setting. The ranking metrics (Precision@6: 0.333; MRR@6: 0.554, NDCG@6: 0.597) provide additional descriptive evidence but should be interpreted cautiously given the small number of journeys and the simulated candidate pool.
5.5. Summary
Overall, the results support a safety-first emphasis for travel companion matching, consistent with user-reported safety concerns. The evaluation found a preference tendency toward the safety-first approach, motivating the inclusion of a trust gate and safety-oriented matching constraints in the final hybrid design. The hybrid prototype achieved a high selection rate and favourable top-k ranking indicators, suggesting that safety-enhanced constraints can be combined with empirical personalisation to produce actionable recommendations.
6. Discussion
This section interprets the empirical findings from all three phases in the context of the existing literature, discusses implications for platform design, and identifies the boundaries of the conclusions that can be drawn.
6.1. Interpretation of Phase 2 Results
The Phase 2 evaluation revealed a consistent directional preference for safety-first matching: the Safety + Social algorithm received the highest acceptance rate (60.0%) and preference share (40.9%), nearly doubling those of the runner-up. Although McNemar exact tests did not reach statistical significance (p = 0.13–0.34), this non-significance should not be interpreted as evidence of no difference. With n = 15, the study has limited power to detect moderate effects; a post hoc power analysis indicates that approximately n = 45–60 participants would be needed to detect the observed effect size with 80% power at α = 0.05.
The preference for Safety + Social aligns with the Phase 1 finding that 69.2% of respondents identified safety as their top solo-travel concern. It is also consistent with trust-aware recommender system research: Huo et al. [27] demonstrate that integrating trust relationships with recommendation algorithms reduces error by up to 25%, suggesting that users inherently value trust signals in recommendation contexts. The low inter-algorithm overlap (0–13.3%) further indicates that different algorithmic philosophies surface meaningfully different candidate pools—a finding that supports the value of hybrid synthesis rather than simple parameter tuning of a single approach.
6.2. Interpretation of Phase 3 Results
The Phase 3 hybrid algorithm achieved an 84.6% selection rate, indicating that most users successfully identified at least one acceptable companion from the top-6 recommendations. This rate exceeds the 78% hybrid acceptance benchmark reported by Jain et al. [2] for travel recommendation systems, though direct comparison is limited by differences in evaluation design (top-6 list vs. single recommendation, simulated vs. real profiles, different sample sizes and user demographics).
The standard ranking metrics provide additional context: Precision@6 = 0.333 indicates that users selected an average of 2 out of 6 recommended profiles, MRR@6 = 0.554 indicates that the first selected profile appeared at approximately position 1.8, and NDCG@6 = 0.597 represents 59.7% of optimal ranking performance. These metrics are computed on the top-6 shortlist displayed to users and therefore measure ranking quality within a pre-filtered, trust-gated candidate set. In absolute terms, a Precision@6 of 0.333 is reasonable for a companion-matching task where users are expected to be selective (choosing travel companions is a high-stakes decision, unlike selecting a movie or restaurant).
The trust score distribution among selected profiles (mean 0.890, SD 0.062, range 0.71–0.97) confirms that users preferentially selected high-trust candidates even when lower-trust options (above the 0.7 gate) were available. The concentration of selections in the 0.80–0.90 range (50% of selections) suggests that the trust gate successfully removes candidates users would reject, while the soft trust multiplier provides meaningful differentiation within the acceptable range. It should be noted that the absence of external baselines (random, cosine-similarity, popularity-based) limits the ability to attribute the observed metrics solely to the hybrid design. The reported Precision@6, MRR@6, and NDCG@6 values describe the algorithm’s absolute ranking quality within the prototype setting but do not quantify the marginal improvement over simpler approaches. This comparison is identified as a priority for future work (Section 6.6).
6.3. Ablation and Sensitivity Interpretation
The leave-one-component-out analysis (Table 4) provides insight into the hybrid algorithm’s internal structure. The three components causing the largest ranking disruption when removed—demographics (ω = 0.35), budget (ω = 0.25), and pace (ω = 0.20)—are precisely the three factors identified as highest priority in Phase 1. This correspondence provides independent validation that the weight hierarchy reflects genuine user preference structure rather than survey artefacts. The remaining nine components contribute incrementally, confirming the multi-dimensional design where no low-weight feature disproportionately affects outcomes.
The Monte-Carlo weight perturbation analysis (Table 2) demonstrates that the algorithm tolerates substantial weight variation without degrading recommendation quality. At ±10% perturbation—representing plausible variation from a different survey sample of similar size—the mean Kendall τ of 0.943 and Jaccard overlap of 0.906 indicate near-identical recommendation sets. This robustness arises from three structural properties: (i) weight normalisation (Equation (9)) makes recommendations invariant to absolute weight scale, (ii) the trust gate provides a safety floor independent of weight values, and (iii) multi-dimensional scoring distributes influence across twelve components. Together, these properties ensure that the algorithm would produce comparable recommendations under any weight vector preserving the empirically observed ordinal priority ranking.
The safety–empirical group rebalancing analysis (Table 3) shows that within a ±5% shift of the baseline 51:49 ratio, ranking stability remains high (τ > 0.77, Jaccard > 0.83). This confirms that the algorithm is not sensitive to the exact group-level balance, and the 51.3–48.7% split is one of a family of acceptable configurations.
6.4. Implications for Platform Design
The findings suggest several practical implications for travel companion platform design:
1. Trust gating as a baseline mechanism: The combination of Phase 1 safety concerns (69.2%), Phase 2 preference for safety-first matching (60.0% acceptance), and Phase 3 trust score distributions suggests that platforms should implement trust gating as a default safety mechanism, even at the cost of reducing the candidate pool. The threshold sensitivity analysis (Table 5) provides guidance: lowering the threshold below 0.7 does not improve recommendation quality, while raising it above 0.80 progressively reduces diversity without meaningful quality gains.
2. Empirical weight derivation for cold-start: The preference-frequency normalisation approach provides a practical methodology for bootstrapping matching algorithms on new platforms where no interaction data is available. The demonstrated robustness to ±30% weight perturbation suggests that even approximate weights derived from small surveys can produce acceptable recommendations.
3. Multi-factor over single-criterion matching: The low inter-algorithm overlap (0–13.3%) in Phase 2 indicates that different matching philosophies surface different candidates. This supports the use of hybrid approaches that integrate multiple compatibility dimensions rather than relying on any single criterion.
6.5. Positioning Relative to Trust-Aware Systems
The proposed recommendation framework’s dual-stage trust integration (hard gate + soft multiplier) differs from existing trust-aware approaches in several respects. TrustGNN [26] learns trust propagation through graph neural networks, requiring an existing interaction graph—unavailable in cold-start settings. Fuzzy clustering trust [27] integrates trust relationships with collaborative filtering, reducing MAE/RMSE by up to 25%, but requires rating history. Trust decay and recovery models address temporal trust dynamics but assume an existing trust baseline. In contrast, the proposed framework treats trust as a binary safety constraint (gate) combined with a continuous ranking adjustment (soft multiplier), operating without any prior interaction data. This design is intentionally simpler—it does not learn trust from data—but is functional under the cold-start conditions where more sophisticated approaches cannot operate. As the platform accumulates interaction data, the simulated trust scores should be replaced with computed trust scores (Section 4.3), and the hard gate could be complemented with learned trust propagation.
6.6. Limitations and Future Research
The following limitations must be considered when interpreting these results. They are organised into six categories addressing each concern raised during review.
1. Small sample sizes and limited statistical power: The sample sizes (n = 26 survey respondents, n = 15 algorithm-comparison participants, n = 13 prototype journeys) are sufficient for exploratory prototype validation—identifying directional trends and demonstrating technical feasibility—but limit both statistical power and generalisability. The non-significant McNemar tests (p = 0.13–0.34) may reflect insufficient power rather than absence of real effects. Specifically, the statistical validity of paired comparisons is constrained by these sample sizes; the non-significant McNemar tests likely reflect Type II error given the post hoc power estimate of n ≥ 45–60 needed to detect the observed effect size. Results should therefore be treated as hypothesis-generating evidence that identifies promising design directions, rather than as confirmatory hypothesis tests. Effect sizes and confidence intervals are reported throughout to characterise uncertainty. Future replication should target n ≥ 50 participants per phase to achieve 80% power for detecting moderate effects (Cohen’s h ≈ 0.4) at α = 0.05. Demographically stratified recruitment would additionally support analysis of whether derived preference weights are stable across subpopulations.
2. Simulated trust scores: Trust scores are static, drawn from a uniform distribution [0.35, 0.98], and do not reflect the skewed, dynamic distributions of real platforms. This enables controlled evaluation of trust-aware mechanisms but limits conclusions about how the algorithm would perform with real trust data exhibiting measurement noise, temporal drift, and distributional skewness. The expanded trust score discussion in Section 4.3 describes a concrete real-world trust computation pipeline; validating the algorithm with real trust signals is a priority for future deployment. Beyond measurement quality, real-world trust systems face adversarial vulnerabilities that the current simulated design does not capture. These include: (i) coordinated rating manipulation (Sybil attacks), where colluding accounts inflate each other’s trust scores; (ii) incentivised positive reviews that artificially elevate trust without reflecting genuine reliability; (iii) gradual trust accumulation by bad actors who build credible profiles before engaging in harmful behaviour; (iv) demographic or cultural bias in community ratings, where certain user groups may systematically receive lower trust scores. Mitigation strategies for production deployment would include anomaly detection on rating patterns to flag statistically improbable trust trajectories, rate-limiting trust score changes to prevent sudden manipulation, cross-referencing multiple independent trust signals to reduce single-source vulnerability [10,16,17,18], and periodic trust audits with human review for flagged accounts. The threshold sensitivity analysis in Section 4.5 provides a starting framework for evaluating how different trust distributions—including adversarially skewed ones—would affect recommendation outcomes.
3. Synthetic candidate profiles: The 500 simulated profiles may not capture the diversity, inconsistency, and noise of real-world traveller pools. Profile attributes are complete and well-formed, which may inflate matching quality relative to what would be observed with real, incomplete, or inconsistent user-generated profiles. Future studies should integrate real user profiles—with appropriate anonymisation and consent—to establish ecological validity.
4. Frequency-based weight derivation: The preference-frequency normalisation approach is a principled heuristic grounded in MCDM practice [11], but it assumes that selection frequency is a valid proxy for relative importance. It does not capture preference intensity, interaction effects between factors, or non-linear utility functions. While the sensitivity analysis demonstrates robustness to ±30% weight perturbation, this does not guarantee optimality. More rigorous methods—such as the Analytic Hierarchy Process (AHP), conjoint analysis, or Bayesian preference learning—could produce more methodologically rigorous weight vectors and should be explored with larger samples.
5. Lack of benchmarking with standard datasets: The travel companion matching domain lacks established benchmark datasets analogous to MovieLens or Yelp for general recommendation. This limits external comparability: the reported metrics (Precision@6, MRR@6, NDCG@6) can only be compared against the study’s own baselines and published aggregate benchmarks from adjacent domains. Future work should consider creating a de-identified public benchmark dataset for travel companion matching or adapting existing tourism recommendation benchmarks. Additionally, the absence of baseline comparisons—such as random recommendation (which would establish a chance-level reference), cosine-similarity-only matching (which would isolate the contribution of the multi-criteria weighting), or popularity-based ranking (which would test whether simple heuristics approach hybrid performance)—limits the ability to quantify the marginal performance gain specifically attributable to the hybrid algorithm’s trust-aware and multi-criteria design. Including these baselines in future work would provide external reference points that contextualise the reported metrics (Precision@6 = 0.333, MRR@6 = 0.554, NDCG@6 = 0.597) and help to distinguish the contributions of trust gating, safety-oriented weighting, and preference personalisation individually.
6. Evaluation design limitations: Two specific design choices constrain the evaluation: (a) Fixed algorithm presentation order in Phase 2 (Algorithm 1 through Algorithm 4 for all participants) may introduce systematic order effects, including primacy bias (favouring earlier-presented algorithms), anchoring effects (evaluating later algorithms relative to the first), or fatigue effects (reduced attention for later algorithms). Although the multi-select response format and the large observed effect size for Safety + Social (which was presented third, not first) partially mitigate primacy concerns, the absence of counterbalancing means that the reported preference distribution may be confounded by position effects and should be interpreted with this caveat. Future studies should employ randomised or counterbalanced Latin-square presentation orders to control for such effects and enable formal tests of order independence. (b) Binary acceptance captures the ecologically valid selection decision but does not measure satisfaction gradations. Likert-scale ratings, post-match follow-up surveys, and—ideally—post-trip outcome data would provide richer measures of match quality.
Other than addressing the above limitations, following are some future research directions: (i) larger-scale user studies with post-match and post-trip follow-up to validate sustained match quality; (ii) integration of real user profiles and real trust computation; (iii) broader comparisons against external cold-start baselines (cosine similarity, random recommendation, and popularity-based ranking).
7. Conclusions
This paper presents a safety-enhanced, empirically grounded hybrid matching approach that addresses critical challenges faced by solo travellers. There are three primary contributions. First, it introduces a systematic three-phase empirical methodology that progresses from user survey through multi-algorithm evaluation to hybrid synthesis, providing a reproducible framework for algorithm development and validation. Second, it presents a safety-enhanced empirical hybrid algorithm that combines trust gating with weighted safety components (51.3%) and empirical preference components (48.7%)—a balanced approach that prioritises user safety while maintaining personalised compatibility. Third, it establishes a comprehensive evaluation framework with journey logging that enables systematic comparison of algorithmic approaches using user-facing outcomes.
The evaluation results provide preliminary evidence that safety-first travel companion matching can be practically implemented in a prototype setting. Analysis of 13 logged user journeys shows an 84.6% selection rate (95% Wilson CI: 57.8–95.7%) and a 15.4% no-match rate, suggesting that trust-enhanced filtering can be integrated without preventing users from finding acceptable candidates in most journeys under the study conditions. Standard ranking metrics (Precision@6 = 0.333, MRR@6 = 0.554, NDCG@6 = 0.597) provide additional evidence of ranking quality. A comprehensive sensitivity analysis demonstrates that the algorithm’s recommendations are robust to weight perturbations of up to ±30%, group-level rebalancing, and individual component removal, confirming that the empirically derived weight vector is not brittle.
These results are exploratory and should be interpreted with the limitations discussed in Section 6.6—particularly the small sample sizes, simulated trust scores, and synthetic candidate profiles. Nevertheless, this paper establishes a foundation for future development of trustworthy, user-centric travel companion platforms. The three-phase empirical methodology provides a systematic approach that can be replicated and extended across different domains, and the pathway from prototype to deployment outlines the steps needed to transition from simulated to real trust computation.
Author Contributions
Conceptualisation, X.Y.L.; methodology, X.Y.L.; validation, X.Y.L. and R.K.R.; writing—original draft, X.Y.L.; writing—review and editing, R.K.R.; supervision, R.K.R. All authors have read and agreed to the published version of the manuscript.
Funding
This research received no external funding.
Institutional Review Board Statement
Ethical review and approval were waived for this study due to its minimal-risk nature and the use of non-identifiable data. The human-participant components comprised (i) an anonymous survey on travel companion matching preferences and safety requirements and (ii) a prototype-based algorithm evaluation where participants reviewed and selected from recommendations. Importantly, the recommendation candidate pool was generated from simulated profiles rather than real individuals, and no participant names, contact details, or other direct identifiers were collected. All outcomes were analysed and reported only in aggregate.
Informed Consent Statement
Informed consent was obtained from all subjects involved in this study.
Data Availability Statement
No publicly archived datasets were generated for this study. The human-participant survey responses and prototype evaluation logs are not publicly available due to privacy/ethical restrictions and the risk of re-identification.
Acknowledgments
During the preparation of this manuscript, the authors used GPT 5.1 for the purposes of cross-checking mathematical calculations, validating the consistency of content, and correcting grammar. The authors have reviewed and edited the output and take full responsibility for the content of this publication.
Conflicts of Interest
The authors declare no conflicts of interest.
Appendix A. Phase 1 Survey Result Summary
| Question | Response Options | Count | Percentage |
| Solo Travel Frequency | Rarely travel solo | 10 | 38.5% |
| Planning first solo trip | 7 | 26.9% | |
| Travel solo occasionally (1–2×/year) | 7 | 26.9% | |
| Will not consider solo traveling | 4 | 15.4% | |
| Biggest Solo Travel Concerns | Safety and security | 18 | 69.2% |
| High costs | 13 | 50% | |
| Loneliness/social interaction | 6 | 23.1% | |
| Logistics and planning | 4 | 15.4% | |
| Difficulty finding a compatible travel partner | 4 | 15.4% | |
| Compatibility Factor Importance | Similar travel pace | 20 | 76.9% |
| Similar budget | 19 | 73.1% | |
| Shared interests | 15 | 57.7% | |
| Same travel style | 15 | 57.7% | |
| Same gender | 2 | 7.7% | |
| Different gender | 1 | 3.8% | |
| Similar age group | 1 | 3.8% | |
| Matching sleep schedules | 1 | 3.8% | |
| Most Valuable Security Features | Government ID verification | 18 | 69.2% |
| User review and rating system | 11 | 42.3% | |
| Social media profile verification | 12 | 46.2% | |
| In-app emergency contact/reporting | 8 | 30.8% | |
| Fake Profile Concerns | Very concerned | 18 | 69.2% |
| Somewhat concerned | 5 | 19.2% | |
| Neither concerned nor unconcerned | 3 | 11.5% | |
| Willingness to Verify Identity | Yes, definitely | 15 | 57.7% |
| Yes, but with privacy concerns | 4 | 15.4% | |
| Maybe, need more details | 7 | 26.9% | |
| No response indicating unwillingness | 0 | 0% |
Appendix B. Hybrid Algorithm Worked Example
This appendix provides a step-by-step numerical example demonstrating the complete computational pipeline of the safety-enhanced empirical hybrid algorithm, as referenced in Section 4.3.
Example Inputs:
- User :
- ○
- Gender: Female
- ○
- Age: 30
- ○
- Budget: 2
- ○
- Travel pace: 2
- ○
- Travel style: average
- ○
- Interests: {Festivals & Events, Photography}
- ○
- Sleep: {early, light}
- ○
- Smoking: No
- ○
- Alcohol: Social
- ○
- Dietary: None
- ○
- Cleanliness: Average
- ○
- Fitness: Walk
- ○
- Bio: “Looking for a safe, verified, respectful travel buddy.”
- Match candidate :
- ○
- Profile ID: 2 (Noah Mohamad)
- ○
- Trust:
- ○
- Gender: Male
- ○
- Age: 26
- ○
- Budget: 2
- ○
- Travel pace: 3
- ○
- Travel style: average
- ○
- Interests: {Festivals & Events, Adventure Sports & Water Sports}
- ○
- Sleep: {early, light}
- ○
- Smoking: No
- ○
- Alcohol: No
- ○
- Dietary: None
- ○
- Cleanliness: Messy
- ○
- Fitness: Transport
Algorithm steps:
- Since (), candidate passes the trust gate and is eligible for ranking
- Component scores scaled to [0,1]
| Component | Value |
| Demographics strictness | 0.18 |
| Bio safety keyword overlap | 1.00 |
| Sleep similarity | 1.00 |
| Travel style match | 1.00 |
| Smoking match | 1.00 |
| Alcohol match | 0.00 |
| Dietary match | 1.00 |
| Cleanliness match | 0.00 |
| Fitness match | 0.00 |
| Budget similarity | 1.00 |
| Pace similarity | 0.50 |
| Interests overlap | 0.50 |
- Demographics calculation
Gender mismatch so g = 0; age difference |30–26| = 4 gives a = 0.6; thus
- b.
- Interests overlap calculation
Overlap = 1; denominator = 2; thus
- 3.
- Weighted sum and normalisation
- Total weight mass:
- Safety-oriented contribution:
- Empirical contribution:
- Raw weighted score:
- Normalised compatibility score:
- 4.
- Soft trust multiplier
- 5.
- Final ranking score
Appendix C. Prototype Profile Input and Recommendations Output Combination 1
This appendix shows a representative user profile submission and the corresponding algorithm-generated recommendation list, as referenced in Section 4.6.

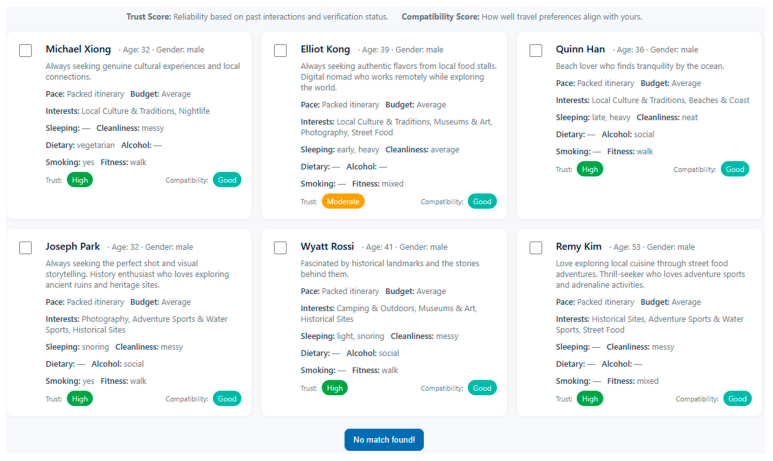
Appendix D. Prototype Profile Input and Recommendations Output Combination 2
A second example with different user preferences, demonstrating the algorithm’s ability to produce personalised recommendations (Section 4.6).
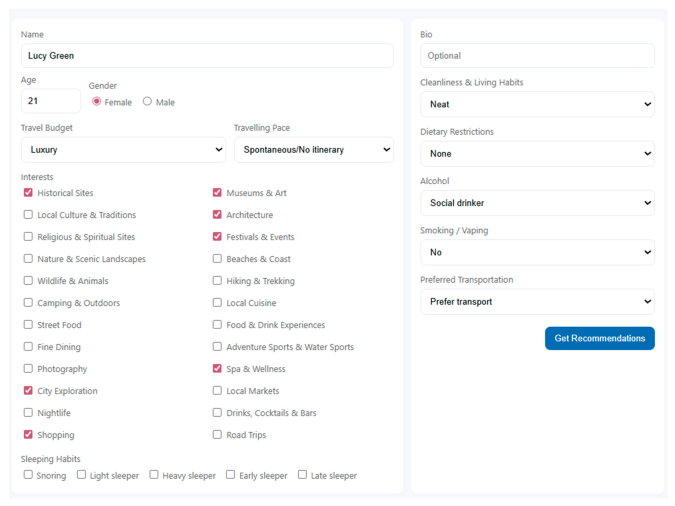

References
- Denali, A.C.; Pramono, A.; Ashdiqi, D.P.; Ramadhan, M.I.; Primadani, T.I.W.; Wijaya, I.B.A. Development of the 2Gather Mobile Apps and its Analysis of the Tourism Sector’s Potential. In Proceedings of the 5th International Conference Cybernetics and Intelligent Systems (ICORIS), Pangkalpinang, Indonesia, 6–7 October 2023. [Google Scholar] [CrossRef] [Scilit]
- Jain, P.; Korulkar, T.; Gandhi, V.; Raut, U. Travel Tinder: A Comprehensive Literature Review on Innovations in Solo Travel Companion Matching. In Proceedings of the IEEE 4th International Conference ICT in Business Industry and Government (ICTBIG), Indore, India, 13–14 December 2024. [Google Scholar] [CrossRef] [Scilit]
- Budhathoki, P.; Upreti, G.; Giri, M.; Yadav, A.; Noor, S. IVBlock: A Blockchain-Based Digital Identity Verification System. In Proceedings of the IEEE SoutheastCon, Concord, NC, USA, 22–30 March 2025; pp. 631–636. [Google Scholar] [CrossRef] [Scilit]
- Mahanra Rao, V.; Ramasamy, R.K.; Sayeed, M.S. BERT-Based Approaches for Web Service Selection and Recommendation: A Systematic Review with a Focus on QoS Prediction. Future Internet 2025, 17, 543. [Google Scholar] [CrossRef] [Scilit]
- Li, Z.; Fang, W.; Zhu, C.; Chen, W.; Hao, T.; Zhang, W. Trust Evaluation with Deep Learning in Online Social Networks: A State-of-the-Art Review. In Advanced Intelligent Computing Technology and Applications; Huang, D.S., Si, Z., Pan, Y., Eds.; ICIC 2024; Lecture Notes in Computer Science; Springer: Singapore, 2024; Volume 14864. [Google Scholar] [CrossRef] [Scilit]
- Sai, A.N.; Chandra, V.B.; Shabeena, S.; Nandini, M.; Gandhi, O. Clusterboost: An Airbnb Recommendation Engine Using Metaclustering. In Proceedings of the 2nd International Conference Recent Trends in Microelectronics, Automation, Computing, and Communications Systems: Exploration and Blend of Emerging Technologies for Future Innovation (ICMACC), Hyderabad, India, 19–21 December 2024; pp. 292–297. [Google Scholar] [CrossRef] [Scilit]
- Luna, R.G.D.; Cuizon, A.V.O.; Umali, J.P.D.; Latayan, E.M.; Onte, M.J.M.; Ortega, H.M. Pawfect Match: A User-Interactive Dog Breed Recommendation Powered by Machine Learning. In Proceedings of the International Conference Informatics and Computational Sciences, Semarang, Indonesia, 17–18 July 2024; pp. 97–102. [Google Scholar] [CrossRef] [Scilit]
- Gunasekara, H.; Silva, T. Dynamic Ontology-based Travel Recommendation System. In Proceedings of the 8th SLAAI—International Conference Artificial Intelligence (SLAAI-ICAI), Ratmalana, Sri Lanka, 18–19 December 2024. [Google Scholar] [CrossRef] [Scilit]
- Sharma, R. Genetic Algorithm Based Personalized Travel Recommendation System. In Proceedings of the 2nd International Conference Intelligent Data Communication Technologies and Internet of Things (IDCIoT), Bengaluru, India, 4–6 January 2024; pp. 867–874. [Google Scholar] [CrossRef] [Scilit]
- Gao, M. A Multimodal Travel Route Recommendation System Leveraging Visual Transformers and Self-Attention Mechanisms. Front. Neurorobot. 2024, 8, 1439195. [Google Scholar] [CrossRef] [Scilit]
- Garg, A.; Verma, D.; Pandey, L.; Kumar, K.S.; Singh, R.; Sharma, A. Enhancing Tailored Travel by Integrating Generative AI with Insights Driven by Personality. In Proceedings of the International Conference Intelligent Control, Computing and Communications (IC3), Mathura, India, 13–14 February 2025; pp. 404–409. [Google Scholar] [CrossRef] [Scilit]
- Huang, Y.; Liu, J.; Huang, S.; Tan, J.; He, X.; Huang, S.; Dong, Y. Blockchain-Enabled Personalized Travel Recommendations with Semantic Search and Transparent Data. In Proceedings of the 34th International Conference Computer Communications and Networks (ICCCN), Tokyo, Japan, 4–7 August 2025; pp. 1–6. [Google Scholar] [CrossRef] [Scilit]
- Suryawanshi, J.; Abdul, S.M.; Lal, R.P.; Aramanda, A.; Hoque, N.; Yusoff, N. Enhanced Recommender Systems with the Removal of Fake User Profiles. Procedia Comput. Sci. 2024, 235, 347–360. [Google Scholar] [CrossRef] [Scilit]
- Panteli, A.; Boutsinas, B. Addressing the Cold-Start Problem in Recommender Systems Based on Frequent Patterns. Algorithms 2023, 16, 182. [Google Scholar] [CrossRef] [Scilit]
- Diwan, P.; Kashyap, T.; Badhan, A.K.; Painkra, M.S.; Maurya, S.; Agrawal, P. TrustNet: Decentralised Identity Verification & Management System. In Proceedings of the 4th OPJU International Technology Conference Smart Computing for Innovation and Advancement in Industry 5.0 (OTCON), Raigarh, India, 9–11 April 2025. [Google Scholar] [CrossRef] [Scilit]
- Pokharel, A.; Prashant, K.S.; Prasad, S.; Shambharkar, P.G. ChainID Refuge: Blockchain-Based Identity Verification System. In Proceedings of the International Conference Networks and Cryptology (NETCRYPT), New Delhi, India, 29–31 May 2025; pp. 1312–1317. [Google Scholar] [CrossRef] [Scilit]
- Tabbassum, A.; Chintale, P.; Akiri, C.; Bhasin, N. Leveraging Blockchain for Secure and Decentralized Identity Management. In Proceedings of the IEEE International Conference Blockchain and Distributed Systems Security (ICBDS), Pune, India, 17–19 October 2024. [Google Scholar] [CrossRef] [Scilit]
- Rao, S.N.T.; Moturi, S.; Mothe, S.; Harsha, R.L.S.; Shaik, N.; Rohit, S.V.S.M.; Reddy, D.V. Fake Profile Detection Using Machine Learning. In Proceedings of the IEEE International Conference Interdisciplinary Approaches in Technology and Management for Social Innovation (IATMSI), Gwalior, India, 6–8 March 2025. [Google Scholar] [CrossRef] [Scilit]
- Saxena, S.; Singh, A.; Tiwari, S. Detection of Fake Profiles and News on Social Media Using Machine Learning Algorithms. In Proceedings of the International Conference Computing, Sciences and Communications (ICCSC), Ghaziabad, India, 24–25 October 2024. [Google Scholar] [CrossRef] [Scilit]
- Sudha, M.S.; Manjula, S.; Bharathi, I.; Krishnasamy, V.; Vijayalakshmi, K. DeepFakeGuard: Safeguarding Digital Platforms Against Fake Profiles Using AI. In Proceedings of the 4th International Conference Sentiment Analysis and Deep Learning (ICSADL), Bhimdatta, Nepal, 18–20 February 2025; pp. 1293–1299. [Google Scholar] [CrossRef] [Scilit]
- Varshitha, K.; Talada, S.V.; Mitra, A. Towards fake profiles identification in social networks: A proposal with energy-based PageRank algorithm involving entropy and domain authority. Risk Sci. 2025, 1, 100013. [Google Scholar] [CrossRef] [Scilit]
- Nehe, A.; Bhagwat, A.; Lamkhade, V.; Kshirsagar, S.; Kadlag, R.; Shinde, A. Blockchain Based Identity Verification System. World J. Pharm. Sci. Res. 2025, 4, 981–997. [Google Scholar] [CrossRef]
- Zangerle, E.; Bauer, C. Evaluating Recommender Systems: Survey and Framework. ACM Comput. Surv. 2022, 55, 170. [Google Scholar] [CrossRef] [Scilit] [PubMed]
- Banerjee, S.; Chen, Y.; Kumar, R. Multistakeholder Fairness in Tourism: What Can Algorithms Learn from Tourism Management? Front. Big Data 2025, 8, 1632766. [Google Scholar] [CrossRef] [Scilit]
- Banerjee, A.; Banik, P.; Wörndl, W. A Review on Individual and Multistakeholder Fairness in Tourism Recommender Systems. Front. Big Data 2023, 6, 1168692. [Google Scholar] [CrossRef] [Scilit] [PubMed]
- Rahmani, H.A.; Naghiaei, M.; Tourani, A.; Deldjoo, Y. Exploring the Impact of Temporal Bias in Point-of-Interest Recommendation. In Proceedings of the 16th ACM Conference on Recommender Systems (RecSys ’22), New York, NY, USA, 18–23 September 2022; pp. 598–603. [Google Scholar] [CrossRef] [Scilit]
- Huo, C.; He, D.; Liang, C.; Jin, T.; Qiu, D.; Wu, L. TrustGNN: Graph Neural Network-Based Trust Evaluation via Learnable Propagative and Composable Nature. IEEE Trans. Neural Netw. Learn. Syst. 2023, 35, 14205–14217. [Google Scholar] [CrossRef] [Scilit] [PubMed]
- Jethava, G.; Rao, U.P. An Interaction-Based and Graph-Based Hybrid Approach to Evaluate Trust in Online Social Networks. IEEE Trans. Comput. Soc. Syst. 2022, 9, 1024–1035. [Google Scholar] [CrossRef] [Scilit]
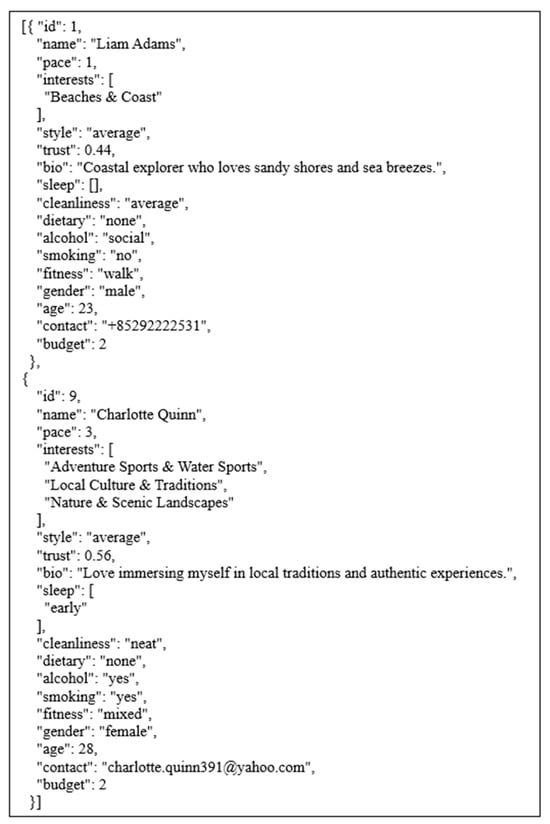
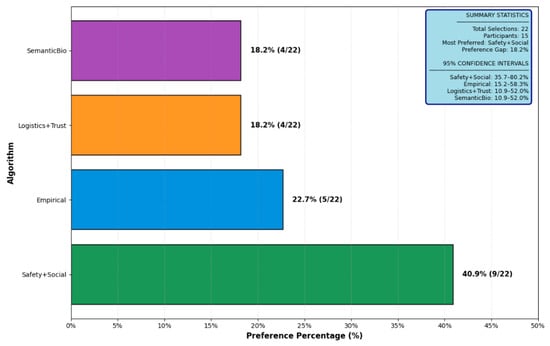
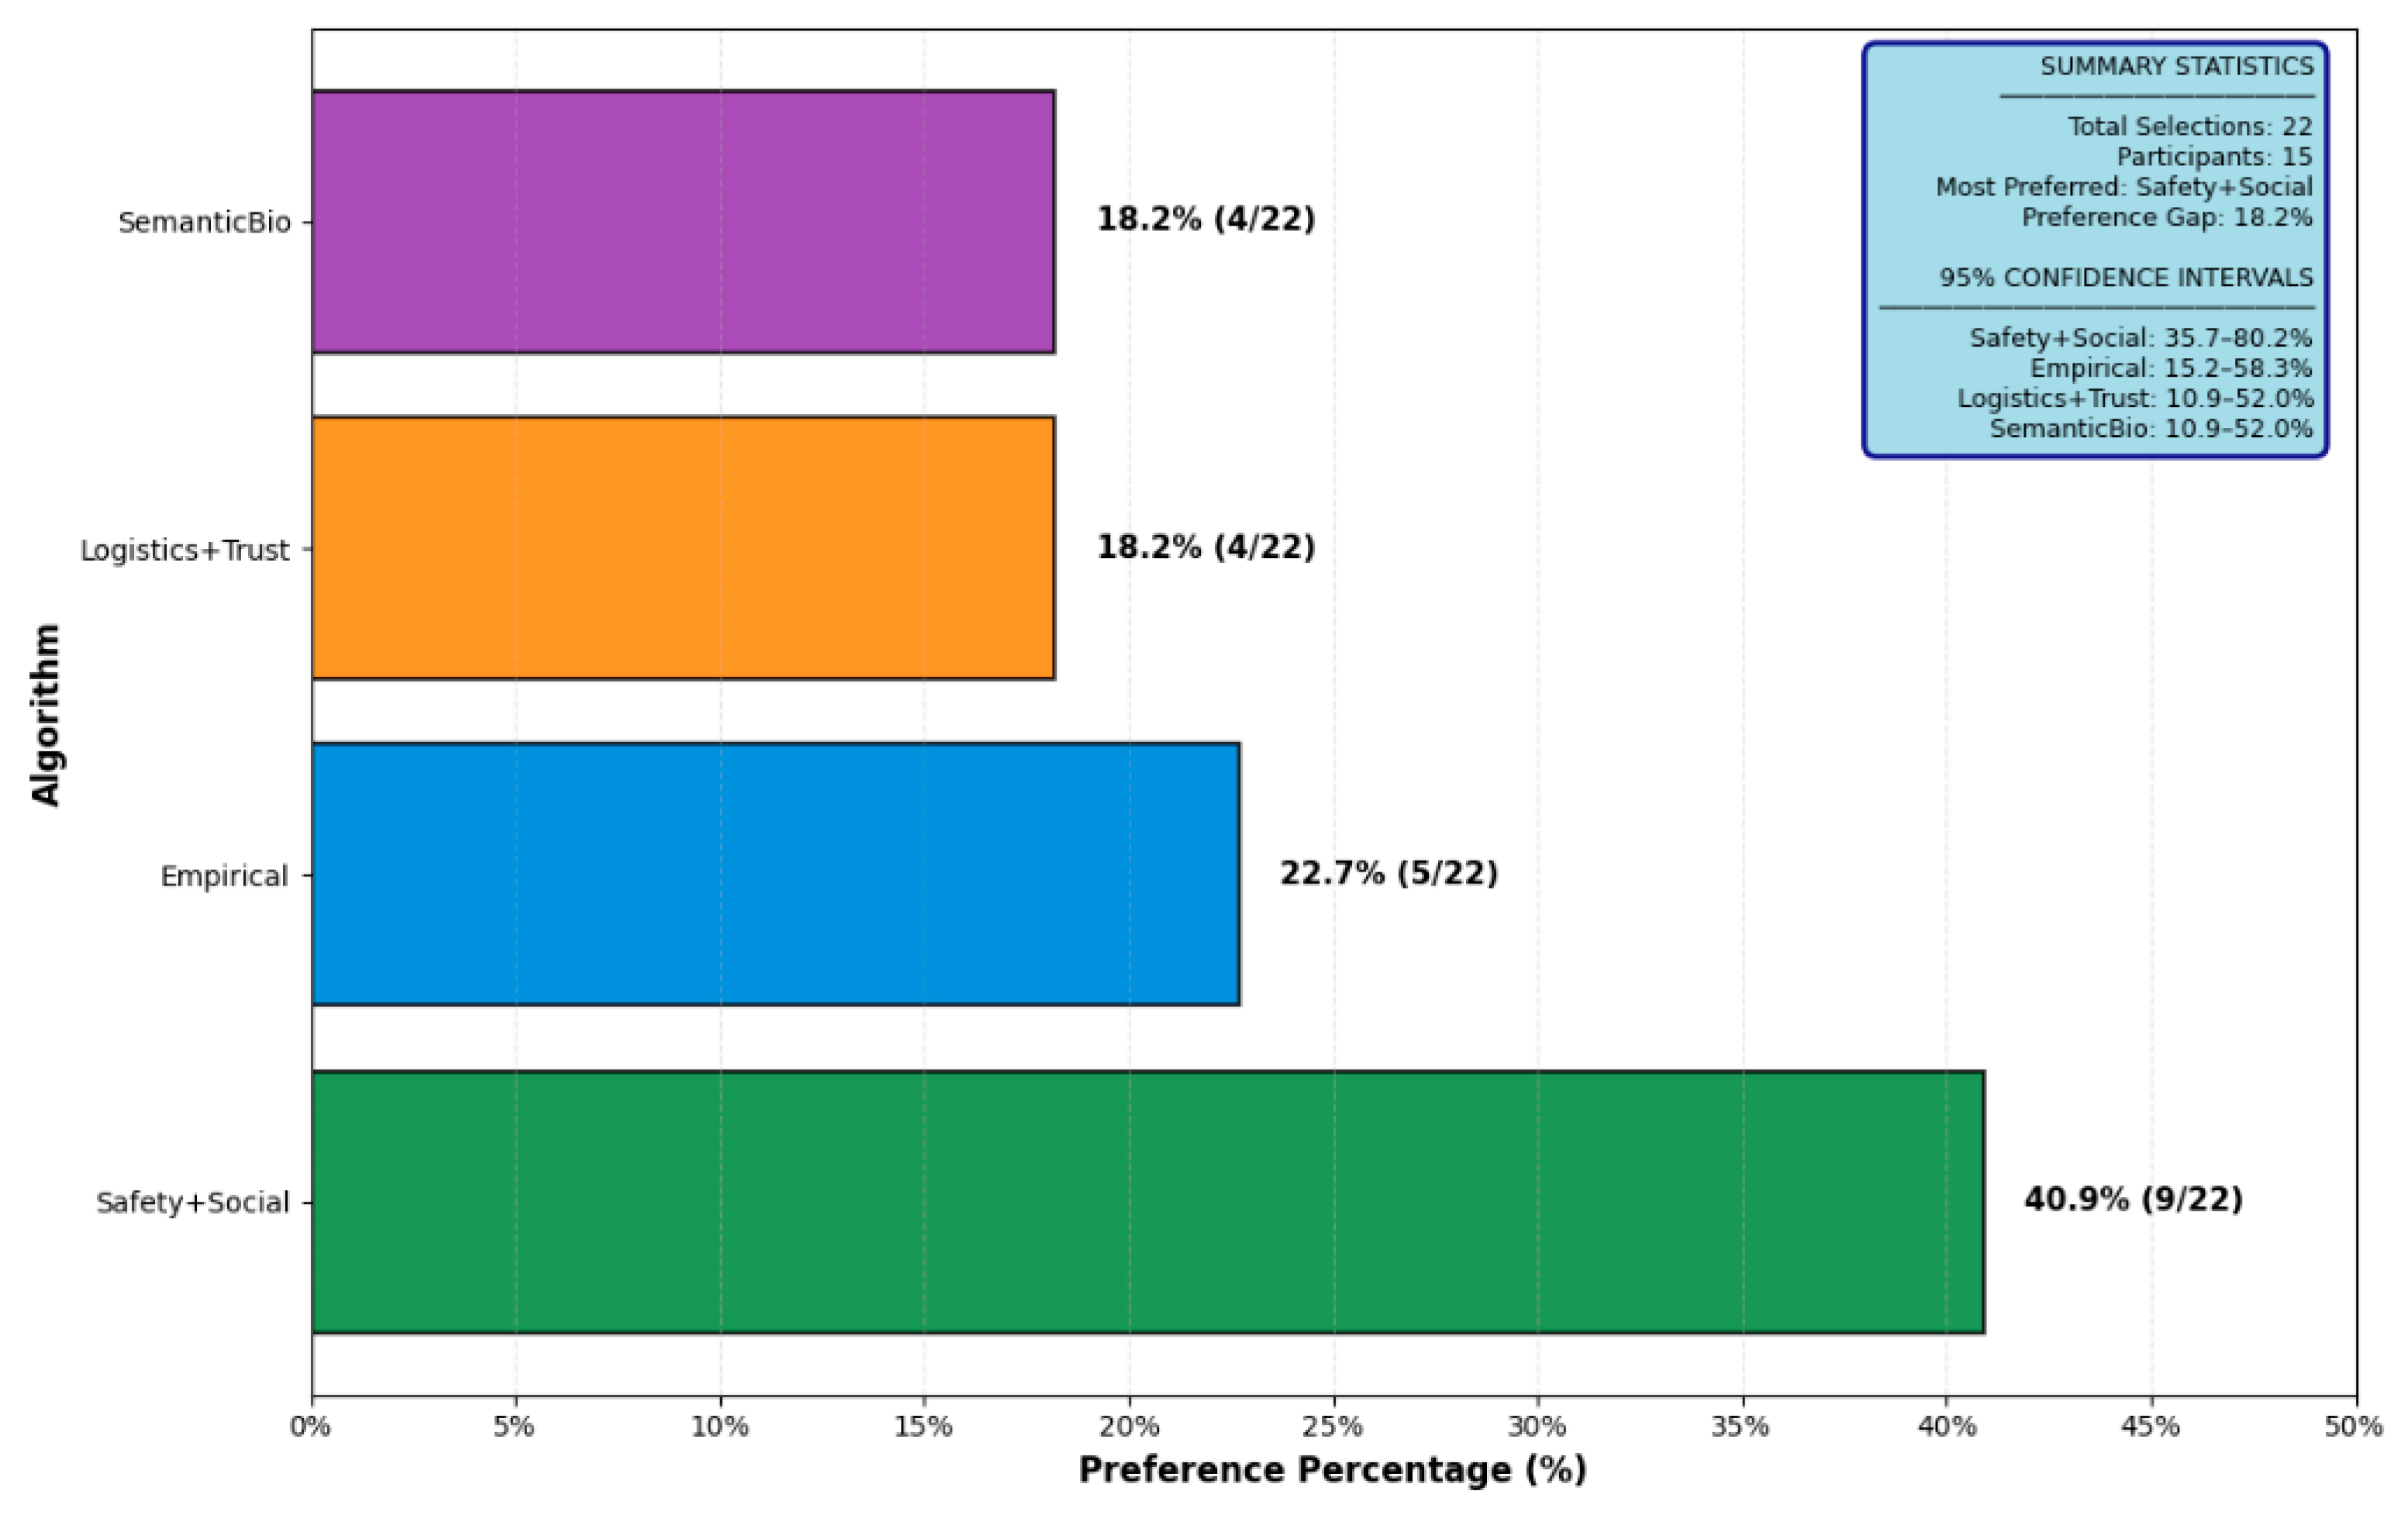
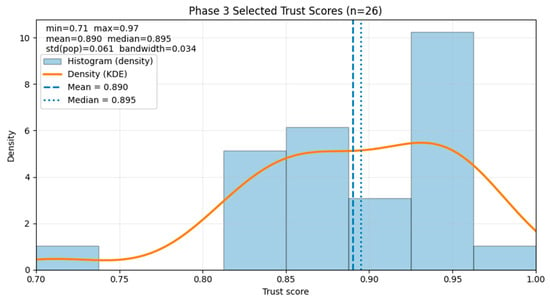
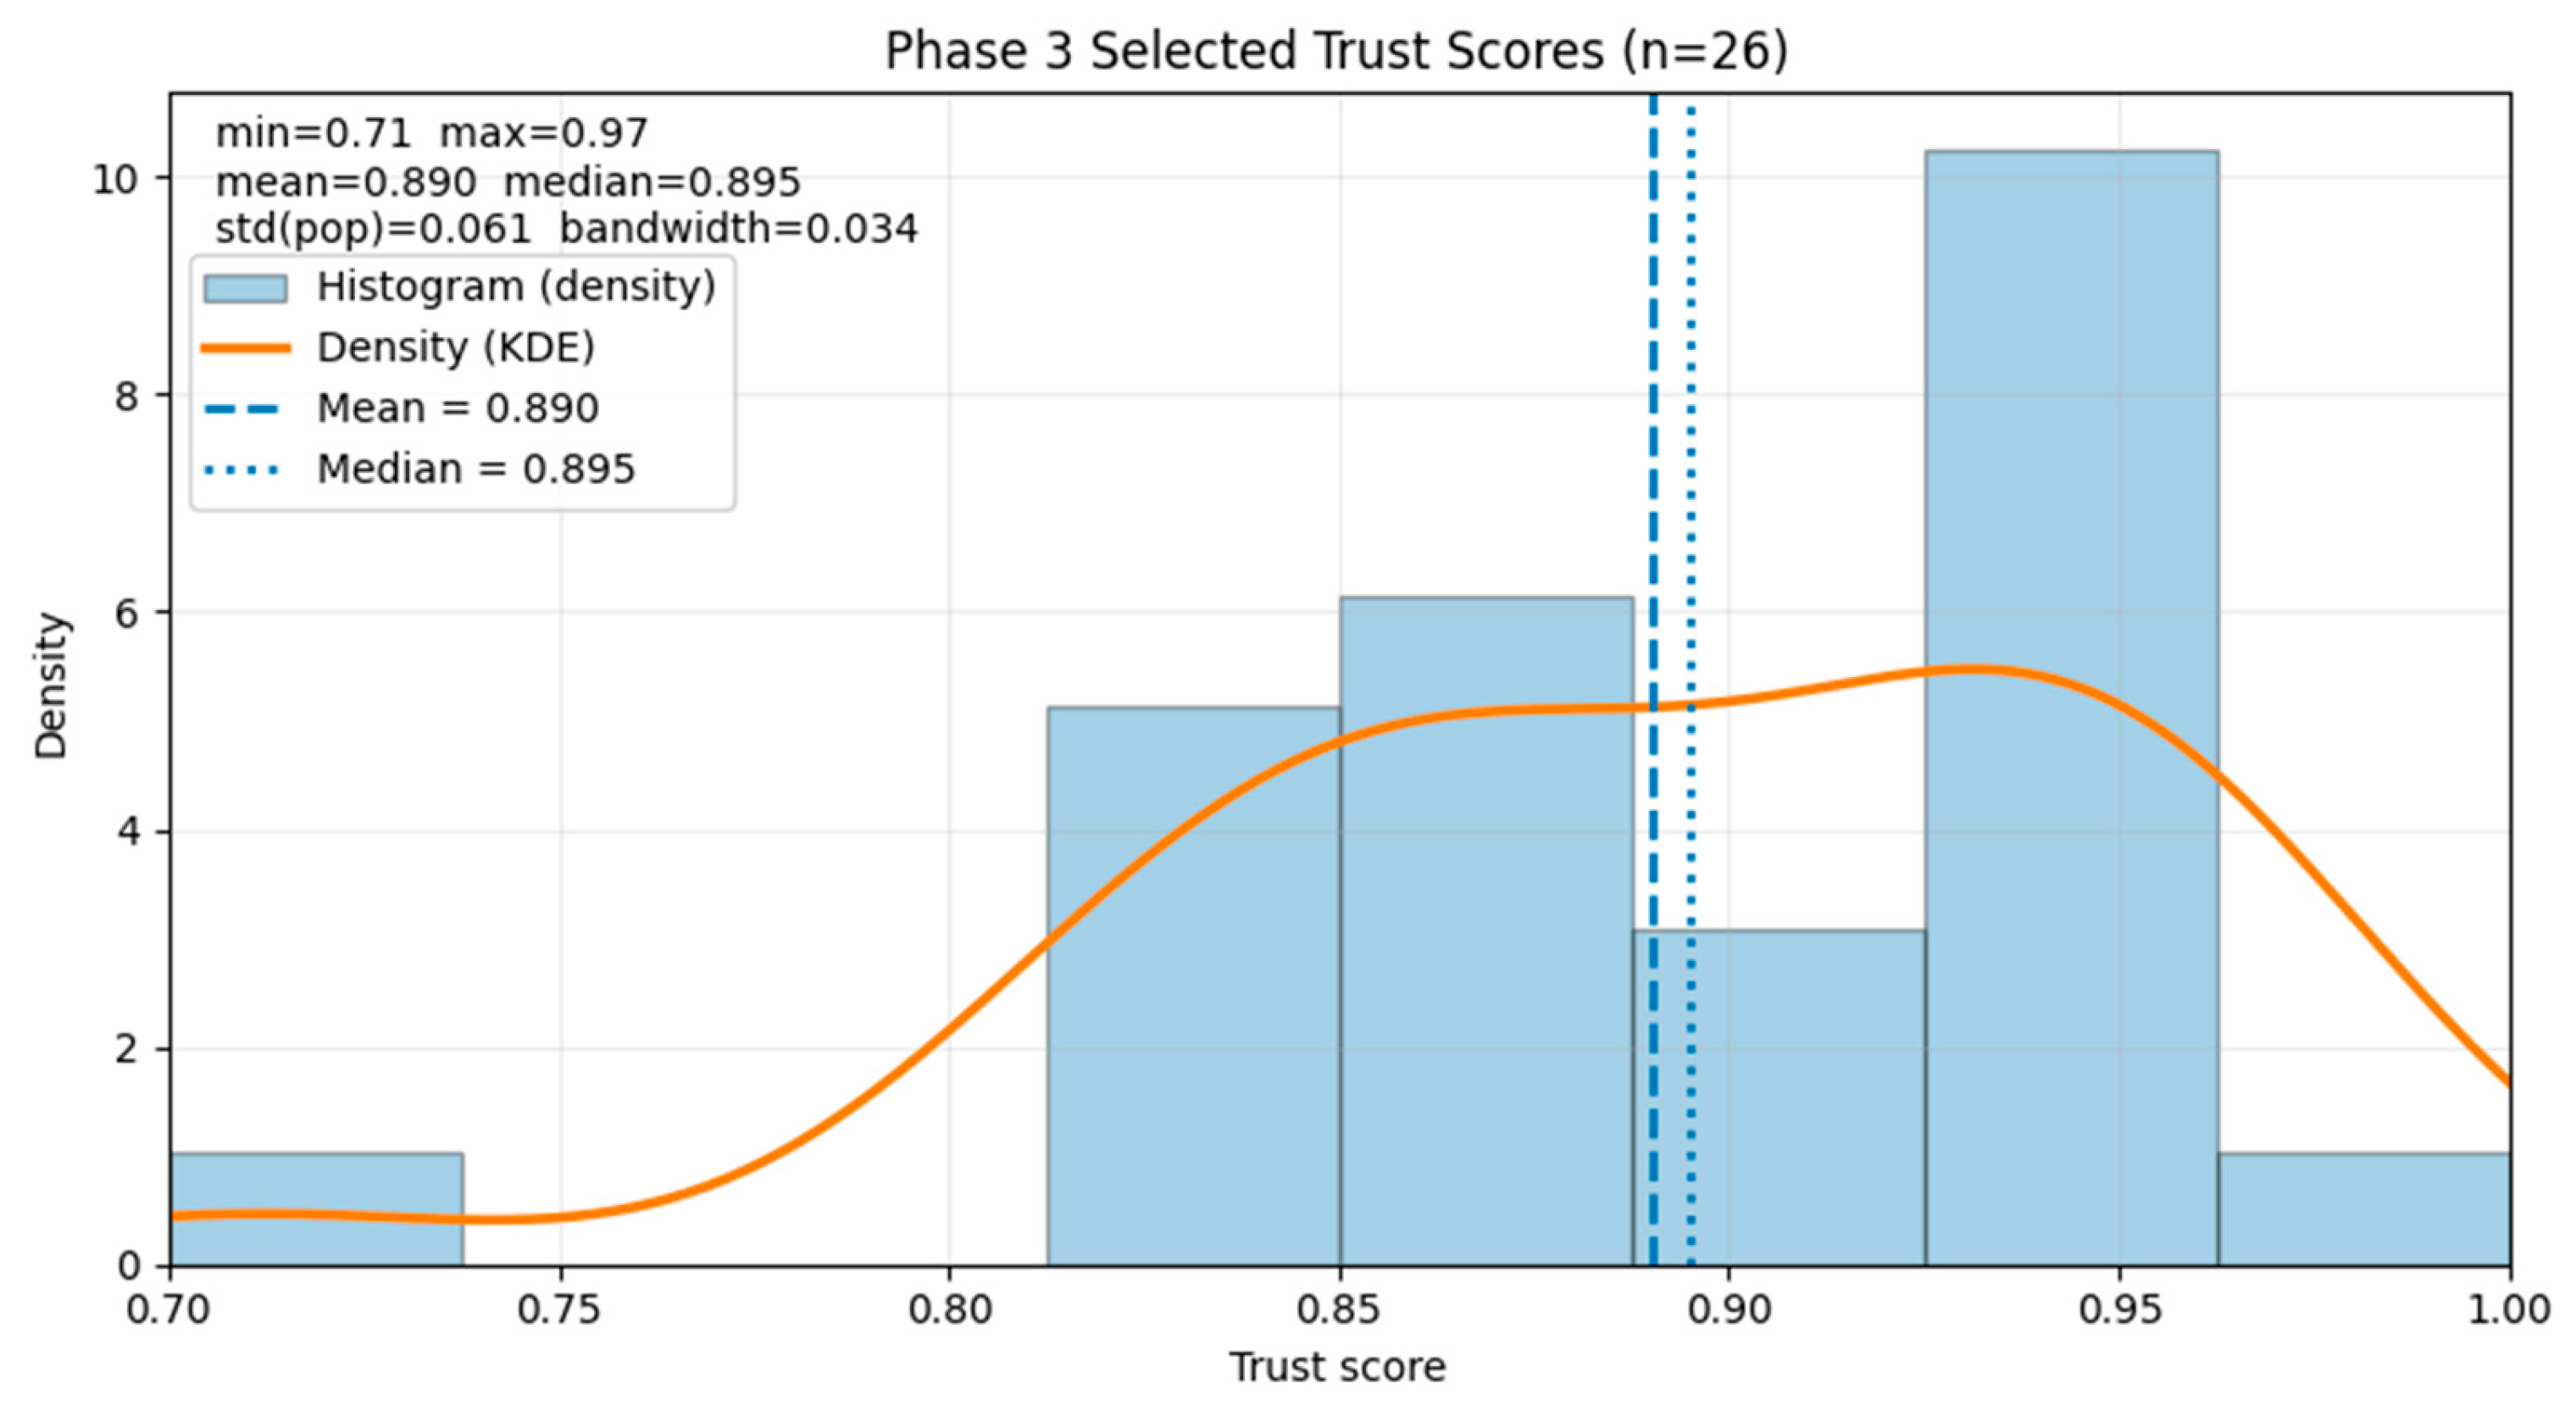

Disclaimer/Publisher’s Note: The statements, opinions and data contained in all publications are solely those of the individual author(s) and contributor(s) and not of MDPI and/or the editor(s). MDPI and/or the editor(s) disclaim responsibility for any injury to people or property resulting from any ideas, methods, instructions or products referred to in the content. |
© 2026 by the authors. Licensee MDPI, Basel, Switzerland. This article is an open access article distributed under the terms and conditions of the Creative Commons Attribution (CC BY) license.