


Abstract
New approaches to improve organisational performance in firms are evolving in this data-driven age. However, there is lack of studies in examining the relationship between revenue, net profit, cash flow per share, and earnings per share. The energy sector remains under-researched regarding the multi-dimensional drivers of profitability. Existing research shows inconclusive evidence with studies predominantly examining revenue—performance relationship limiting to a single factor and not guiding potential investors regarding future earnings per share in the energy industry. This paper aims to bridge the gap in literature by proposing a data-driven approach to analyse the relationships between revenue, net profit, cash flow per share, and earnings per share. We examine these relationships by conducting an empirical analysis using secondary data derived from published annual reports of the energy firms listed on the Australian Securities Exchange (ASX). Our empirical study uses Pearson correlations and regression techniques to test the hypotheses on the relationships between revenue, net profit, cash flow per share, and earnings per share. Also, we use market capitalisation as a control variable and predictor of earnings per share in the energy industry. The data analysis results in four findings: (i) revenue positively influences earnings per share because higher revenue expands the firm’s earnings capacity within the financial performance, (ii) net profit has a strong positive effect on earnings per share, consistent with profitability theory and the direct derivation of EPS from net income, (iii) cash flow per share influences earnings per share because liquidity supports operational stability, investment decisions, and earnings sustainability (e.g., heavy capital expenditure contexts), and (iv) the combined effects of revenue, net profit, and cash flow per share provide a stronger and more holistic prediction of earnings per share than any single variable, consistent with multidimensional organisational performance theory (a more holistic valuation model than looking at single factors). In addition, the results indicate that market capitalisation (control variable) has both strong prediction of earnings per share and strong association with earnings per share. The results of this study can offer practitioners and investors in Australia and other countries for a better understanding of the relationships between revenue, net profit, cash flow per share, and earnings per share from energy companies. The data will help investors to make good investment data-driven decisions in the energy industry or other industries. It also motivates researchers to conduct similar studies in different contexts. We further provide recommendations, including a closed-loop Artificial Intelligence (AI) data-driven approach integrated into energy accounting and operational processes to enhance profitability. This approach operationalises the revenue and earnings-per-share (EPS) strategies identified in our empirical analysis, offering practical value for industry practitioners and guiding future research in this direction.
1. Introduction
Revenue, net profit, and cash flow per share each influence a company’s earnings per share (EPS), but they do so through different financial pathways and with varying strengths of association. Studies were performed on the relationships between revenue, net profit, cash flow per share and earnings per share in various countries. Few studies were carried out on such relationships in Australian firms, particularly the energy firms. The research aims to re-examine the organisational performance in relations to the revenue, net profit, cash flow per share and earnings per share of the Australian energy firms.
With inventory playing the crucial role in supply chain management, especially in relation to sales revenue, research studies in the past decades focused on examining the relationships between ending inventory and organisational performance [1,2,3,4,5,6,7]. Sales revenue performance has been predominantly studied in the past [8,9,10,11] with recent emphasis more on salesforce performance and customer satisfaction [12]. While some studies have reported positive relationship between profit and organisational performance, other studies have performed a more complete evaluation of the overall financial performance of an organisation [13,14,15,16,17]. However, most of the studies have concentrated on studying single factor relationships only and there is scarcity of literature examining the relationships between revenue, net profit, cash flow per share, and earnings per share. New approaches are warranted to sustain in this data-driven age. This has been the main motivation of our research in re-examining organisational performance by studying the relationships between revenue, net profit, cash flow per share, and earnings using a data-driven approach.
We consider firms from an Australian context for this study. In Australia, companies listed on the Australian Securities Exchange (ASX 200) are required to present their financial performance by publishing the total comprehensive income statement showing the result in sales, inventories and profit [18]. This information will help users of financial statements to assess the performance of companies and make their investment or lending decisions (AASB 101). Although Australia adopts the International Accounting Standards (IAS) and International Financial Reporting Standards (IFRS) since 2005, still some companies listed on the ASX use different reporting formats. The Australian government requires all registered companies to meet the compliance and disclosure conditions regarding reporting systems (Corporation Act 2001 s 295) [19]. It is not easy to extract companies’ data from these reports and collate due to the complexity of the companies’ annual reporting formats/designs when they publish their financial statements. The ASX 200 provides data on firm’s revenue, net profit, cash flow per share, and earnings per share in Australian firms [20,21].
Sales reporting is important as it helps users of financial statements to be updated on the current sales performance of companies and prepare forecast of future performance. Information on reporting on breakdown of sales by location, product, customer, price, method of sale, payment method is vital for planning and controlling sales performance [12,22].
Reporting on ending inventory is important as it gives information on the units of goods purchased or produced that are unsold or not used. This information shows the inventory management policies of companies as a standard practice for many decades [18,23]. Excessive inventory will increase costs of holding stock and may lead to obsolescence of stock. Insufficient stock will lead to loss of sales. Inventory management is important in companies to maintain competitive advantage over the long run. In order to maximise profits, companies need to minimise inventory-related costs such as carrying costs, ordering costs, set-up costs, stock out costs. Inventory control techniques such as the Just In Time (JIT) management of inventory would be ideal to optimise the quantity of inventories required by the companies. However, in some companies, inventories are required to be stocked because of the uncertainties in supply and production.
Reporting on profit is important to help with assessment of the financial performance of companies [6]. Information on profit for the year shows the trading result of companies. Information on other comprehensive income shows non-trading income such as gain on revaluation of properties, gains on translation of foreign currency [19,24].
Few studies in the literature had investigated some of the relationships between sales, inventory, and profit of a mix of companies, but not listed as top companies on the countries’ stock exchanges. Most researchers argue that inventory is important in the organisation because it adds value of sales revenue [25,26,27], but little is known or no previous study regarding the relationships between sales, ending inventory, and profit performance of the top companies listed on the stock exchange, especially in Australia. Understanding the relationships between sales, ending inventory and profit performance is important for managing the performance of an organisation. Prior research [6,28,29] concentrated on the importance of working capital and its effects on the firm’s profitability and risk, and its value. The main focus has been on sales, profit and organisational performance. The study in [28] emphasises that high levels of current assets can result in a firm achieving high return on investment. Another study [29] investigated the determinants of working capital management in a developing country, which provide vital information required in formulating an effective working capital strategy to improve profitability. The results show a positive relationship between sales growth and working capital, and that sales growth leads to an increase in working capital requirements. However, in [27], the study on the effect of inventory management on organisational performance revealed that the company not using economic order quantity (EOQ) model of controlling inventory ended up keeping high levels of inventory. They found that if the company uses EOQ method could reduce inventory costs by 43.75% in the warehouse of the plant.
The remaining part of this paper is set out as follows: Section 2 reviews the literature on organisational performance and the relationships between revenue, net profit, cash flow per share, and earnings per share, and hypotheses development. Section 3 describes the research methodology. Section 4 discusses the data analysis and Section 5 discusses the findings. Section 6 provides our proposed recommendations, Section 7 gives the conclusions and implications of the research. Section 8 provides the limitations of study and future research.
2. Literature Review and Hypotheses Development
We conducted a literature review of research articles published a couple of decades back to have insights into the relationships between revenue, net profit, cash flow per share, earnings per share, and organisational performance. We summarise the findings from various literature studies from different perspectives and contexts. Our detailed literature review has served as the foundation of our research hypothesis development which is described later in this section.
2.1. Organisational Performance
Organisational performance reflects how effective and efficiently a company achieves its goals and objectives. A company’s performance can be measured by how well it generates revenue, achieves its net profit objective, maintaining a sound cash flow and market capitalisation which is the current market value of its shares in issue.
To strengthen the conceptual foundation of this study, we now position revenue, net profit, cash flow per share, and earnings per share (EPS) within a coherent financial performance theoretical framework. This framework draws on organisational performance theory, which views financial outcomes as the combined result of top line revenue generation, bottom line profitability, and liquidity based cash flow strength.
Firstly, revenue represents the firm’s capacity to generate economic inflows and is widely recognised as a primary driver of future earnings potential. Prior studies emphasise that sales performance and revenue growth influence organisational performance through demand stimulation, pricing strategies, and operational efficiency.
Secondly, net profit reflects the firm’s ability to convert revenue into distributable earnings after accounting for expenses, taxes, and financing costs. Because EPS is derived directly from net profit, profitability theory predicts a strong and direct relationship between the two.
Thirdly, cash flow per share captures the liquidity dimension of performance. Studies show that cash flow affects profitability, investment capacity, and financial stability, suggesting a theoretically grounded link between cash flow strength and EPS outcomes.
Finally, organisational performance literature highlights that firms rarely rely on a single indicator; instead, combined financial measures provide a more holistic assessment of value creation. This supports the expectation that revenue, net profit, and cash flow per share jointly influence EPS more strongly than any single variable alone.
Company performance can be measured by the sales per employee [30] (Keep et al. 2002), the growth of sales [31] (Batt 2002), return on sales [32] (Storey 2002) and operating expenses to sales [33] (Hutchinson, Kinnie and Purcell 2002), return on assets [34] (Miller and Lee, 2001), return on equity [35] (Richard and Johnson, 2001), profit per employee [36] (Guest, 2001). Company performance can also be measured by the profitability affected by the cash flow of the company [37] (Chukwunwike et al. 2018), the influence of cost of production and administration on market capitalisation [38] (Adebayo Olaoye, S. et al. 2022).
There are different ways to maximise revenue (e.g., sales) and profit and minimise costs of inventories to optimise organisational performance. Decentralisation helps to improve revenue (e.g., sales), profit and organisational performance [39]. Divisional managers have information on local operations such as sales, profit and inventories, and are able to make better decisions that affect performance of the company. Responsibility centres are established to improve companies’ performance. Many authors [26,40,41,42] emphasise on the importance of inventory management in any organisation. In the study [41] on the effect of inventory management on firm performance revealed that “the higher the level of inventories preserved (departing from lean operations) by a firm, the lower its rate of returns,” (p. 355). A recent study [42] confirms that there is a significant direct effect of inventory management practices on enterprise performance in support of the findings reported earlier [40,41].
Cost centre managers such as production managers are responsible for controlling inventory and other costs in production. Revenue centre managers such as marketing department managers are responsible for maximising sales performance. Profit centre managers such as plant managers are responsible for minimising production costs and maximising sales to maximise operating profit. Sometimes managers focus on short-term performance of the organisation and take actions such as redundancy, cutting costs of promotions, and maintenance which may affect the long-term sales and profit performance of the company [39]. Transfer pricing can be used to maximise the firm’s profit. The division selling products in a country with a low tax rate can transfer goods to another division within the firm at a high price to maximise profits. The buying division’s profit will be decreased due to high transfer price being charged. This will lead to a lower tax charged on profits for the firm. In [43], the need to define and introduce performance measures to streamline and improve the quality of logistics services has been emphasised.
Balanced scorecard is used to achieve an organisation’s mission of maximising profit by formulating and implementing strategies and operational plans [39]. There are four perspectives that need to be considered: financial, customer, internal process and learning and growth. Concerning the financial perspective, sales revenue and profits may be increased by launching new products and diversifying into new markets. Costs of inventories (which are main component of costs), can be monitored by budgetary control or activity-based costing. In relation to customer perspective, reduction of price and costs after purchase, and raising the quality and reliability of delivery of products can improve customer satisfaction and sales revenue. Relating to internal perspective, the turnover of employees should be lowered by improving remuneration and working conditions to increase productivity. Finally, with respect to learning and growth, employees should receive ongoing training to improve their skills and knowledge in bringing in more sales and profits for the company.
2.2. Relationship Between Revenue, Net Profit and Earnings per Share
Recent studies have been carried out to explore the effect of sales growth, firm size and profitability on earnings per share [44]. The data for the research was extracted from the manufacturing companies listed on the Indonesian Stock Exchange and path analysis was used to analyse the data collected. The study discovered that profitability was affected by the growth in sales and earnings per share were affected by profitability.
There is a need to examine relationship between sales revenue and inventory (which affects the growth in sales). Literature reviews discovered that the research studies on inventories could be divided into three areas: (i) methods such as JIT to improve the performance of inventories, (ii) trends of inventories, and (iii) correlation of inventory performance and its drivers [3]. It was reported that inventories between 1993 and 2005 of the retail industries in U.S.A., increased significantly over the period under survey. The correlation between inventories and gross profit dollars was positive while there was a negative relationship between inventories and the gross margin return on inventory. Further, inventory negatively correlated with purchases and application of information technology in supply chain management was warranted for a more effective organisational performance. The study [45] reports similar results that there is a strong relationship (correlation) of lean inventory management system and inventory replenishment frequency on financial performance (profit). Their findings support the results of [3,40] that show inventory has a positive relationship with profit. JIT reduces waste by eliminating excess raw materials and finished goods, which directly lowers the cost of goods sold. It also lowers holding costs. Minimising stock levels reduces expenses for storage, insurance, and obsolescence, thereby widening net profit margins.
In [46], the authors studied the inventory turnover in the industries in Belgium and found that there was no significant difference in raw material inventory ratios between the manufacturing industries, and the work in process inventory ratio was influenced by the type of production process adopted. Their result showed a high inventory ratio existed under a discrete production system. Furthermore, they discovered that the finished goods inventory ratio was affected by the export performance of the companies. Concerning research into the wholesale and retail industries, they concluded that the variety of goods and skill in managing inventories are more important factors than the frequency of supply in inventory performance. Finally, they found that inventory ratio did correlate negatively with financial performance. Furthermore, the study [14] found no correlation between inventory management efficiency and financial performance. Similar result was found in the study [47] that there was no significant correlation between inventory turnover and financial performance. The finding of [48] corresponds to the result of [46], which showed that inventory conversion period days increases, the profitability of the company decreases, and vice versa. The study [49] produced a similar result that there is a positive relationship between increased in profit return and improvement in inventory days.
The study [50] investigated the relationship between inventory management and financial performance of construction firms in Malaysia between 2006 and 2010. They compared return on assets with inventory days and found that there was a significantly positive relationship between the two. The research on inventory performance carried out by [14] showed opposite result. Cannon (2008) [14] compared the change in inventory turnover with return on assets and found a little or no relationship between the two. The study [51] investigated 938 manufacturers and compared the performance of the inventory turnover with the operational performance. Their results showed that there was no relationship between the two supporting the results of [14]. However, the study [52] stresses that “inventory management function needs a balance between fulfilling the demands of customers and keeping sufficient supply of merchandises”.
Research studies on inventory management and Just-in-Time (JIT) investigate the theoretical and empirical link between operational efficiency and financial metrics. Efficient JIT systems can improve responsiveness to customer demand, allowing for faster product turnaround and shorter lead times. This agility could lead to higher sales and a competitive edge in volatile markets. However, the results were quite different in some studies where the authors researched the annual reports of 46 companies using JIT and 46 organisations not using JIT [53,54]. They compared the performance of the work-in-process turnover and total inventory turnover with the return on assets and found that the reduction of inventory bore no relationship with financial performance. Fullerton et al. (2003) [25] studied firms that either applied or did not apply JIT and compared the inventory to net sales with return on sales and discovered that the improvement of the inventory to net sales ratio significantly improved the return on sale. An improvement in inventory turnover results in a correlated improvement in EPS. SCMI and JIT often involve leaner asset bases (fewer current assets on the balance sheet), and so they can improve overall return on assets which supports higher earnings relative to the organisation’s capital structure. Huson and Nanda (1995) [54] investigated into firms adopting the JIT technology and found the reduction of inventory turnover positively affected the performance of earnings per share.
JIT can significantly reduce the amount of working capital tied up in non-productive inventory and can cause an upward trend in cash as inventory values decrease and cash is released for other productive investments. The study [55] on 52 Japanese automobile companies on how work-in-process to sales affected productivity of labour and concluded that the correlation between the two was small to medium. Kolias, Dimelis and Filios [56] discovered that inventory turnover negatively correlated with gross margin. The research of 7433 manufacturing firms into the influence of inventory days on the price of stock performed by [57] in U.S. showed that the exceptional inventory stocked by companies would adversely affect their stock price. Demeter [58] investigated 444 firms producing machinery and assessed the effect of inventory turnover on the return on sales and found a positive relationship between the two. The results of Roumianiantsev and Netessine’s research [2] showed new insights into inventory performance. They found that the uncertainty of demand, the length of lead times and the level of gross margin had a positive relationship with the level of inventories. Hise, Kelly and Gable [59] used linear regression analysis in their study and found a strong relationship between sales, income and inventory. Optimum amount of stock should be maintained to meet sales demand and generate profit.
The research conducted by McGahan and Porter [60] on the relationship between inventory and profitability revealed that new entry into market and the expansion undertaken by companies would require inventory to be acquired. In [61], the issue of decrease of sale leading to the drop in inventory turnover that affected adversely current assets was discussed. Shah and Shin [41] researched into the link between information technology, inventory turnover, and financial performance and discovered a positive link among the three. Choudhary and Tripathi [62] highlighted in their research on technologies such as quick response, efficient consumer response, vendor managed inventory, enterprise resource planning, just-in-time, value stream mapping, and economic order quantity had led to increase in inventory turnover.
Eroglu and Hofer [63] researched into the leanness of inventory on the performance of manufacturing companies in U.S. based on the industry by industry-by-industry analysis, considering the effect of the size of the firm on its performance. They found that the leanness of inventory on the performance of firms differ from one industry to another due to various reasons such as product type, the technology of production and supply and demand behaviour. They further discovered a positive and non-linear and concave relationship between leanness of inventory and performance of companies, which suggested that there is an optimum point of the curve beyond which the performance of companies would deteriorate. The research by Jayaram, Vickery and Droge [64] showed opposite results. They sampled 57 manufacturers dealing in auto parts and studied the effect of lean production on return on assets and found no significant relationship between the two.
2.3. Relationship Between Cash Flow per Share and Earnings per Share
Saleh [65] performed research into the effect of cash flow from operating activities on earnings per share. The author collected data from industrial companies listed on the Palestine Exchange and found that cash flow from operating activities had no influencet on earnings per share. However, opposite result was concluded by the study by Taani and Banykhaled [66]. They extracted data from the Amman Stock Market and used multiple regression and stepwise regression to see the association of operating cash flow on earnings per share and found that the former had a significant influence on the latter.
2.4. Relationship Between the Combined Variables Revenue, Net Profit, and Cash Flow per Share with Earnings per Share
Martani et al. (2009) [67] performed research on the combined variables of revenue, net profit and cash flow from operation on return on shares of the manufacturing companies on the Indonesian Stock Exchange and found that revenue and net profit significantly influence the performance of return on shares.
Regarding sales (a subset of total revenue) and inventory affecting net profit, Larson and Demarais [68] researched into the retail industry and discovered that demand for products is stimulated by offering wider variety of products and higher levels of inventory. However, Huffmand and Kahn [69] found out that customers might be confused by the variety of products offered. Fisher and Ittner [70] showed from their research result that the higher variety of products would result in higher rate of rework of goods. Dubelaar, Chow and Larson’s study [8] on the relationships between inventory and sales found a significant positive relationship. Grubor, Milicevik, and Djokic’s study [71] on the effect of inventory level on product availability and sales, found similar results that inventory has positive effect on sales. Ton and Raman [72] commented that increasing product variety and inventory levels might lead to errors in shelving and replenishing products and resulted in phantom products which existed only in the warehouses but not on the shelves. Nnamdi’s study [73] on managing excess and dead inventories in the elevator industry found that the root cause of excess inventories are: “data errors in inventory planning parameters, not applying appropriate demand forecasting methods, lack of ownership, lack of part life-cycle management and pricing as well as internal practices within the organisations that create functional silos to satisfy a specific function/team performance” (p. 137).
The research done by Ocana and Zemel [74] showed that higher inventory level offered less opportunities for workers to learn in the operational environment. DeHortius and Raman [75] discovered that higher variety and level of inventory would lead to higher inaccuracy in inventory record. The study [76] supported the argument that high level of inventory had adverse effect on quality issue based on the concept of JIT and lean production systems. Ton and Raman [72] applied regression analysis on Border stores’ operational data from 1999 to 2002 to investigate the relationship of the increase in variety of product with increase in phantom products, the increase in levels of inventory with increase in phantom products and the increase in phantom products with decrease in sales. The results showed that increasing the variety of product and levels of inventory increased phantom products, which negatively affected sales. The authors discovered that one standard improvement in the percentage of phantom products brought about one per cent increase in sales. The study conducted in [5] supports the findings of [11], which found that although inventory to sales ratio affected the organisation’s performance negatively in the initial growth stage and maturity stage, it showed a positive and significant coefficient on performance in either the rapid growth stage or the revival stage.
Recent studies reveal that organisation capital strengthens the positive relation between inventory efficiency and firm performance [73,74,75]. While some studies show that firms reduce capacity investment with risk aversion [6]. In this data-driven age, many studies have been employing Machine Learning (ML) techniques for modelling performance measures. Some studies have applied ML to enhance the accuracy of retail sales forecasting during crisis periods [76,77]. Recent studies have also critically reviewed the use of other edge technologies such as blockchain that promotes traceability and transparency in agri-food supply management [78].
2.5. Market Capitalisation as a Predictor of Earnings per Share
Market capitalisation measures the current market value of the shares in issue of a company. It can reflect the potential of the company’s earning capacity and hence may affect the earnings per share of the company.
Johnson and Schmitt [79] on their research on the effectiveness of the prediction of the performance of earnings per share suggested that various factors such as the demand for the products, operating costs, fluctuation in interest rates and the current market value of shares had an influence on the performance of earnings per share.
Overall, we find that previous studies provide only some evidence (and sometimes mixed result evidence) on the relationships between revenue (or sales part of revenue), net profit, cash flow per share, and earnings per share and profit or financial performance of companies. There is little evidence in the literature that show comprehensive coverage of the relationships between revenue, net profit, cash flow per share, and earnings per share of the top registered energy companies on the stock exchange of a country, in this case Australia. Further, there is lack of direction in the use of data-driven innovation for effective decision-making in achieving efficiency in organisational performance.
2.6. Research Model and Development of Research Hypotheses
The current literature does not indicate previous study that investigated the relationships between revenue, net profit, cash flow per share, and earnings per share in Australian energy firms. There is little information on this issue. Based on the literature review on previous studies highlighted in the Section 2.1, Section 2.2, Section 2.3, Section 2.4 and Section 2.5 their findings and arguments led us to the formulation of the following five hypotheses as shown in Figure 1:
Figure 1.
Conceptual Hypotheses Model of the study (with a control variable). NOTE: The predictor variables (or independent variables) are the main focus of a study. These are the variables we believe predict changes in the outcome (dependent variable). The control variable is included in isolating the effects of the predictors by holding other factors constant to ensure the independent variables’ influence on the outcome is accurate.
H1.
Revenue positively influences earnings per share.
H2.
Net profit has a strong positive effect on earnings per share.
H3.
Cash flow per share influences earnings per share.
H4.
The combined effects of revenue, net profit, and cash flow per share provide a stronger and more holistic prediction of earnings per share than any single variable.
H5.
Market capitalisation has positive prediction of earnings per share.
The variables we used in this study were drawn from the same financial statements listed on the ASX. Explanations of the variables are as follows:
Revenue refers to the total amount of income generated by a business from the sale of goods and services over a period.
Net profit refers to the profit a business keeps after substracing all operating expenses from total revenue.
Earnings per share (EPS) refers to fundamental financial metrics indicating a company’s profitability by dividing net income by outstanding shares. A higher EPS signifies greater value.
Cash flow per share (CFPS) refers to a financial metric measuring a company’s financial strength by determining the cash generated from operations, on a per share basis.
We have aligned the hypotheses explicitly with this integrated financial performance framework, ensuring that each hypothesis is grounded in established theoretical reasoning and the multidimensional nature of organisational performance. Figure 2 provides the pictorial representation of the conceptual model of our study with the following four hypotheses excluding the control variable:
Figure 2.
Conceptual Hypotheses Model of the study (without a control variable).
H1.
Revenue positively influences earnings per share.
H2.
Net profit has a strong positive effect on earnings per share.
H3.
Cash flow per share influences earnings per share.
H4.
The combined effects of revenue, net profit, and cash flow per share provide a stronger and more holistic prediction of earnings per share than any single variable.
3. Research Methodology
3.1. Sample Selection and Data Collection
We used secondary data collection method for this study to test the conceptual model and the hypotheses developed. We extracted the sample data from the energy companies’ annual reports of industries listed on the Australian Securities Exchange (ASX 200) company directory and published on the Internet and summarised the industry profile in Table 1 (Market Capitalisation). The following steps adopted show how the ASX data were sourced, extracted, cleaned, and matched across firms and years:
Table 1.
Characteristics of energy industry—firms profile distribution of sample data.
- Clear identification of firms:Energy firms were selected using the ASX GICS Energy classification, with explicit inclusion/exclusion criteria to ensure consistency across reporting years.
- Transparent data extraction process:Financial variables (revenue, net profit, CFPS, EPS, market capitalisation) were manually extracted from annual reports downloaded from each firm’s ASX announcements page. Two researchers independently extracted and cross-checked all values.
- Detailed data cleaning procedures:The revision explains how the authors handled inconsistent reporting formats, standardised units, verified EPS/CFPS calculations, screened outliers, and removed incomplete observations.
- Reproducible data-matching process:All variables were matched by firm, financial year, and reporting period end date. Firms with non-comparable reporting periods were excluded to maintain dataset integrity.
- Clear explanation of statistical analysis:Pearson correlations and multiple regression were used. Market capitalisation was initially included but removed due to multicollinearity, with justification provided.
The initial aim was to conduct a longitudinal study, but due to lack of published data on the companies’ websites on the Internet, it made it difficult to consider all the required top 100 companies and data. To have a valid purposive sample, we selected all 124 energy companies. After examining the sample, we did not select 5 energy companies because of missing data and the ASX suspended the companies. Table 2, Table 3, Table 4 and Table 5 provide the frequency distribution of revenue, net profit, cash flow per share, and earnings per share respectively based on the sample data showing the profile of the energy companies. Among the 124 energy companies studied, only sample size of 119 had complete set of data we needed. We studied the whole population of energy companies registered at ASX as of July 2025.
Table 2.
Revenue (119 companies) energy industry profile distribution of sample data.
Table 3.
Frequency distribution of net profit (net loss)–July 2025.
Table 4.
Frequency distribution of cash flow per share (A$)–July 2025.
Table 5.
Frequency distribution of earnings per share–July 2025.
Overall, this research employed a cross-sectional study design, analysing financial data from a specific fiscal period to provide a snapshot of the relationships between revenue, profit, cash flow, and EPS across the Australian energy sector. This approach allows for the identification of immediate performance drivers but does not account for temporal shifts or the cyclical nature of energy investments.
The model we used identifies significant predictors of EPS, these findings should be interpreted as associat ions within the context of the Australian energy sector rather than causal mechanisms.
3.2. Quantitative Measures of Data
After collecting secondary data, we used the commonly used quantitative techniques to analyse the data as follows: descriptive statistics, Pearson’s correlation, and regression analysis. We conducted diagnostic tests for key regression assumptions (normality of residuals, homoscedasticity, and multicollinearity). These checks are crucial to ensure the robustness and validity of the regression models.
4. Data Analysis
4.1. Profile of Industry and Distribution of Measures of Sample Data
We provide a summary of energy industry profile of various companies used in the study in Table 1 (characteristics of energy companies—market capitalisation). Most of the companies fall into industries with market capitalisation up to A$100 million (75.63%), market capitalisation between A$100 million and $1 billion (12.61%), market capitalisation between A$1 billion and A$10 billion (10.08%), market capitalisation greater than A$10 billion (1.68%). Market capitalisation indicates the size of the companies we studied.
4.2. Distribution of Measures of Sample Data
The profiles of the companies under investigation in relation to their revenue, net profit, cash flow per share, and earnings per share are given in Table 2, Table 3, Table 4 and Table 5 respectively.
Most companies (34.45%) have revenue up to A$100,000 and only 2 companies (or 1.68%) earn revenue between A$30 billion and A$40 billion.
Concerning net loss, 47.06% of the energy companies fall into the range of A$1,000,001–10,000,000. 14.29% of them are in the range of A$100,001–1,000,000. 10.09% of them are in the range of A$10,000,001–30,000,000, etc. Regarding net profit, 7.56% of the companies fall into the range of A$1,000,001–10,000,000. 5.88% of them are in the range of A$10,000,001–100,000,000, etc. There is no company in the range of A$500,000,001–1,000,000,000. Only 2.52% of the energy companies generated net profit between A$1,000,000,001 and 10,000,000,000.
More than half of the companies (56.3%) are in the range of A$(0.10)–(10.00) loss in relation to cash flow per share. 13 companies or 10.93% have cash flow per share in the range between A$0.05 and A$10.00. Only 3 companies or 2.52% have cash flow per share between A$ 601.00 and A$1200.00.
As for earnings per share, 36.97% 36.97% of the companies are in the range of negative 0.001–0.01. 16.81% of the companies have earnings per share in the range of negative 0.011–0.04. 28.58% of the companies have earnings per share in the range of positive 0.000–0.100. Only one company (0.84% of the companies) has earnings per share between A$5.001 and A$12.000.
4.3. Assessing the Validity of Secondary Data for Correlation and Regression Analysis in IBM SPSS Statistics Version 31.0.0.0
4.3.1. Assumptions Testing
The data we used meet the assumptions of the correlation tests (e.g., Pearson’s correlation and linear regression analysis). The assumptions tests used are indicated below with linearity shown in Figure 3, normalityof resduals in Figure 4, the histogram in Figure 5 and Homoscedasticity in Figure 6. The scatterplot of standardized residuals against standardized predicted values in Figure 3 shows mostly random dispersion with a few outliers. Figure 4 shows standardised residual plots where each observed cumulative probability diverges from its expected probability under perfect normality. In Figure 5, the residuals appear normally distributed around zero, supporting the model’s normality assumption. Figure 6 shows that the residuals are mostly random with a few high-value outliers.
Figure 3.
Linearity.
Figure 4.
Normality of residuals.
Figure 5.
Histogram with normal distribution.
Figure 6.
Homoscedasticity.
Overall, the scatterplots of independent variables against the dependent variable in SPSS indicate a roughly straight line pattern in the scatterplot. The regression assumes that the residuals (the differences between predicted and actual values) are normally distributed. The histogram and the P-P plot of the residuals meet the assumption.
Examining the scatterplot of residuals against predicted values indicate that the variance of the residuals are constant across all levels of the independent variables. The points are randomly scattered and do not form a funnel shape.
Multicollinearity occurs when independent variables (predictors) are highly correlated with each other, and it can be difficult to interpret the individual effects of the variables. The Variance Inflation Factor (VIF) greater than 10 generally indicates a problem (i.e., high correlation indicates significant multicollinearity). Net profit has VIF of 13.944 (Table 6) which is fair for our model and is acceptable to meet the requirement of our study. The market capitalisation control variable (predictor) has a VIF of 18.457 (Table 6) which is higher than 10 and should be removed from the study model for further analysis (see Figure 2). In addition, the control variable is not part of our key hypotheses for this study. After removing the control variable: “market capitalisation” which is a highly correlated predictor in the model, the new revised test of absence of multicollinearity is as follows:
Table 6.
Cefficients.
4.3.2. Absence of Multicollinearity
Multicollinearity occurs when independent variables (predictors) are highly correlated with each other, and it can be difficult to interpret the individual effects of the variables. The Variance Inflation Factor (VIF) greater than 10 generally indicates a problem (i.e., high correlation indicates significant multicollinearity). Net profit has VIF of 13.944 (Table 6) which is fair for our model and is acceptable to meet the requirement of our study. The market capitalisation control variable (predictor) has a VIF of 18.457 (Table 6) which is higher than 10 and should be removed from the study model for further analysis (see Figure 2). In addition, the control variable is not part of our key hypotheses for this study. After removing the control variable: “market capitalisation” which is a highly correlated independent variable (predictor) in the model, the new revised test of absence of multicollinearityis as follows (with statistical results given in Table 7, Table 8, Table 9, Table 10, Table 11 and Table 12).
Table 7.
Colinearity diagnostics.
Table 8.
Residuals statistics.
Table 9.
Model Summary.
Table 10.
ANOVA.
Table 11.
Coefficients.
Table 12.
Colinearity diagnostics.
4.3.3. Absence of Multicollinearity (Without a Control Variable)
After removing the control variable: “market capitalisation” which is a highly correlated predictor in the model Figure 1, the current VIFs for variables in the model Figure 1 are as follows: Revenue (VIF = 1.242), Net profit (VIF = 3.084) and Cash flow per share (VIF = 3.026) (Table 11).
The Variance Inflation Factor (VIF) greater than 5 or 10 generally indicates a problem (i.e., high correlation indicates significant multicollinearity). The independent variables (predictors) in the study model Figure 2 have VIFs less than 5. The VIF values for independent variables indicate that multicollinearity will not be a problem in the regression model.
4.4. Variables Relationships and Hypotheses Testing
We used descriptive statistics to assess the characteristics of the variables, and Pearson correlation to test the hypotheses for this study. Table 6, Table 7, Table 8, Table 9, Table 10, Table 11, Table 12, Table 13, Table 14, Table 15, Table 16, Table 17, Table 18, Table 19, Table 20, Table 21, Table 22, Table 23, Table 24, Table 25, Table 26 and Table 27.
Table 13.
Descriptive statistics.
Table 14.
Pearson correlations.
Table 15.
Model summary.
Table 16.
Relationship between revenue and earnings per share: ANOVA.
Table 17.
Relationship between revenue and earnings per share: Coefficients.
Table 18.
Descriptive statistics.
Table 19.
Pearson correlations.
Table 20.
Model summary.
Table 21.
Relationship between net profit and earnings per share: ANOVA.
Table 22.
Relationship between net profit and earnings per share: Coefficients.
Table 23.
Descriptive statistics.
Table 24.
Pearson correlations.
Table 25.
Model summary.
Table 26.
Relationship between cash flow per share and earnings per share: ANOVA.
Table 27.
Relationship between cash flow per share and earnings per share: Coefficients.
4.4.1. Relationship Between Revenue and Earnings per Share (H1)
The profiles of the companies under investigation in relation to their sales revenue and earnings per share are given in Table 13, Table 14, Table 15, Table 16 and Table 17 as follows:
The variable revenue (Table 13) exhibits extremely large standard deviation. The sample is composed of 80% of companies with revenue less than A$2 million per year. The data is heavily skewed in one direction, values are not concentrated around the centre, which normally causes a higher standard deviation than a symmetrical distribution.
We did not winsorise or trim the data to avoid removing meaningful extreme values. Robustness checks confirmed that these values did not materially change the direction or significance of the results.
The results in Table 14 and Table 15 show that there is statistically weak relationship between revenue and earnings per share (r = 0.161, p = 0.040; significant at p < 0.05 level). Table 16 and Table 17 show that there is no statistically significant relationship between revenue and earnings per share (p = 0.080, not significant at p < 0.05 level), and correlation coefficients = 0.161), and revenue correlates positively with earnings per share i.e., the linear association between revenue and earnings per share is positive, but not statistically significant at p < 0.05. When correlation has a p-value of 0.040 and linear regression has a p-value of 0.080, it indicates that there is a statistically significant correlation (at the 0.05 level) between the two variables, the linear model does not adequately show the association between variables.
4.4.2. Relationship Between Net Profit and Earnings per Share (H2)
The variable net profit (Table 18) exhibits extremely large standard deviation. The sample is composed of 81.5% of companies had net loss. The data is heavily skewed in one direction, values are not concentrated around the centre, which normally causes a higher standard deviation than a symmetrical distribution.
We did not winsorise or trim the secondary data because they alter the distribution of data and destroys genuine information regarding extreme values.
The results in Table 19 and Table 20 show that there is strong statistically significant relationship between net profit and earnings per share (r = 0.318, p ≤ 0.001; significant at p < 0.05 level). Table 21 and Table 22 show that there is strong statistically significant relationship between net profit and earnings per share (p ≤ 0.001 and correlation coefficients = 0.318), and net profit correlates positively with earnings per share i.e., the linear association between net profit and earnings per share is positive, and strong statistically significant at p < 0.05.
4.4.3. Relationship Between Cash Flow per Share and Earnings per Share (H3)
The profiles of the companies under investigation in relation to their cash flow per share and earnings per share are as follows:
The results in Table 23 and Table 24 show that there is strong statistically negative significant relationship between cash flow per share and earnings per share (r = −0.270, p = 0.001; significant at p < 0.05 level). The results in Table 25 show that there is positive statistically significant relationship between cash flow per share and earnings per share (r = 0.270, p = 0.001; significant at p < 0.05 level. Table 26 and Table 27 show that there is statistically significant relationship between cash flow per share and earnings per share (p = 0.003 and correlation coefficients = −0.270), and cash flow per share correlates negatively with earnings per share i.e., the linear association between cash flow per share and earnings per share is negative, and statistically significant at p < 0.05.
4.4.4. Relationship Between the Combined Performance Variables: Revenue, Net Profit, and Cash Flow per Share with Earnings per Share (H4)
The profiles of the companies under investigation in relation to their combined performance variable of revenue, net profit, and cash flow per share with earnings per share are given in Table 28, Table 29, Table 30, Table 31 and Table 32 as follows:
Table 28.
Descriptive statistics.
Table 29.
Pearson correlations.
Table 30.
Model summary.
Table 31.
Relationship between the combined performance variables: revenue, net profit, and cash flow per share with earnings per share: ANOVA.
Table 32.
Relationship between the combined performance variables: revenue, net profit, and cash flow per share with earnings per share: Coefficients.
The results in Table 28 and Table 29 show that there is strong statistically significant relationship between combined performance variables: revenue, net profit, and cash flow per share with earnings per share (r = 0.318, p ≤ 0.001; significant at p < 0.05 level). The results in Table 30 show that there is strong statistically significant relationship between combined performance variables: revenue, net profit, and cash flow per share with earnings per share (r = 0.319, p ≤ 0.001; significant at p < 0.05 level). Table 31 and Table 32 show that there is strong statistically significant relationship between combined performance variables: revenue, net profit, and cash flow per share with earnings per share (p = 0.006) and correlation coefficients: cash flow per share = −0.027, revenue = 0.028, and net profit = 0.284. The correlation is positive with earnings per share i.e., the linear association between combined performance variables: revenue, net profit, and cash flow per share with earnings per share is positive, and strong statistically significant at p < 0.05.
Although the inclusion of the control variable market capitalisation (predictor) in the analysis provides positive correlation (r = 0.437) and strong statistical significance (p ≤ 0.001) (Table 33 and Table 34), the control variable was removed from the hypotheses testing because it has high VIF = 18.457 greater than normally acceptable VIF = 10 for regression analysis. Apart from high VIF, market capitalisation has positive prediction of earnings per share support the findings of the study conducted by [79] Johnson and Schmitt (1974).
Table 33.
Control variable: Market Capitalisation in the model: Model summary.
Table 34.
Control variable: Market Capitalisation in the model: ANOVA.
Further, the analysis of Hypothesis 1 revealed a positive correlation between Revenue and Earnings Per Share (EPS) (r = 0.437 and p ≤ 0.001). While the result is statistically significant at the level, the correlation coefficient is categorised as weak within the standard conventions of social science and business research. Consequently, H1 is only weakly supported (Table 35). This suggests that while top-line growth contributes to share-level earnings, its association is secondary to other factors. In the context of Australian energy firms, this weak relationship likely reflects the sector’s high operating leverage and capital intensity, where substantial increases in revenue do not always flow through linearly to earnings due to the high costs associated with production and infrastructure.
Table 35.
Results of Hypotheses Testing.
We conducted further analysis of the hypotheses testing including the control variable: market capitalisation. We decided to keep the control variable in the analysis because it is crucial for identifying the main association with other variables. It is essential for reducing bias and our primary concern is the association of the key independent variables. The VIF of 18.457 suggests high multicollinearity, indicating the variable is strongly correlated with other independent variables (predictors). The coefficient of 1.284 for the high VIF variable may be highly unstable and difficult to interpret. Therefore, the results of the Pearson correlations (including a control variable) indicated in Table 36 must be considered cautiously.
Table 36.
Pearson correlations (including a control variable).
The results of hypotheses testing (including a control variable) are indicated in Table 37. The results are similar to that of hypotheses testing (without a control variable). Therefore, the predictor variables’ association with EPS are accurate.
Table 37.
Results of Hypotheses Testing (including a control variable).
5. Discussion of Empirical Findings and Conclusions
5.1. Discussion of Empirical Findings
This study investigated the nature of the relationships between revenue, net profit, cash flow per share, and earnings per share of the 119 energy companies listed on the Australian Securities Exchange (ASX 200). The empirical findings of this study are new in Australia because the information regarding relationships between revenue, net profit, cash flow per share, and earnings per share of top energy companies in Australia are little known in the literature. Some findings enhance or support the findings of previous studies.
The sample distribution (Table 2, Table 3, Table 4 and Table 5) reflects the dual nature of the ASX energy sector, which comprises both established producers and a high proportion of mid-to-small cap exploration firms. The presence of 47% loss-making firms and 56% with negative cash flow is representative of an industry currently in a heavy investment phase. This skew significantly influences the findings; specifically, the negative correlation between CFPS and EPS (r = −0.270) likely captures the ‘burn rate’ of exploration-stage firms where capital is deployed into infrastructure and drilling long before earnings are realised. Consequently, while the findings are highly generalisable to the ASX energy ecosystem, they may over-represent the financial characteristics of speculative firms compared to mature, stable-yield utilities.
The hypothesis H1 (r = 0.161, p = 0.040, significant at p < 0.05) was weakly supported that there is a positive relationship between revenue and earnings per share. The result supports the findings reported in a previous study [44]. Revenue has positive influence on earnings per share. This study found the relationship between revenue and earnings per share is not strong and statistically significant at p < 0.05. One of the possible reasons for this outcome may be that the Australian energy companies though generate more revenue, they do not increase earnings per share in most cases.
The hypothesis H2 (r = 0.318, p ≤ 0.001, significant at p < 0.05) was supported by the fact that there is a strong positive relationship between net profit and earnings per share. Net profit has positive influence on earnings per share. This study found the relationship between net profit and earnings per share is strong and statistically significant. The result supports the findings in the previous study that had reported a significant relationship between net profit and earnings per share [44]. Therefore, this study emphasises that energy companies must increase net profit to improve earnings per share.
The hypothesis H3 (r = −0.270, p = 0.001, significant at p < 0.05) was not supported that there is a strong negative relationship between cash flow per share and earnings per share. Cash flow per share does not have positive influence on earnings per share. This study found the negative relationship between cash flow per share and earnings per share is strong and statistically significant. The result contradicts the hypothesised direction of positive relationship.
The result supports previous findings that cash flow from operating activities had no influence on earnings per share [65]. However, our study does not support another study reporting a strong relationship between cash flow per share and earnings per share [66]. Therefore, this study emphasises that energy companies must increase cash flow per share to improve earnings per share.
The hypothesis H4 (r = 0.318, p < 0.001, significant at p < 0.05) was supported that there is a strong positive relationship between the combined variables (predictors): revenue, net profit, and cash flow per share with earnings per share, and it is statistically significant at p < 0.05. The combined variables have a strong positive influence on earnings per share. The result supports the findings of Martani et al. (2009) [67] who found in their study of manufacturing companies listed on the Indonesian stock exchange that revenue and net profit significantly influence the return on shares.
Contrary to Hypothesis 3, the empirical analysis revealed a significant negative correlation between Cash Flow Per Share and EPS (r = −0.270, p = 0.013). This counterintuitive result suggests that in the Australian energy sector, higher earnings are currently associated with lower contemporaneous cash flows. This ‘decoupling’ is likely a reflection of the industry’s capital-intensive transition phase. Firms reporting strong accounting profits (EPS) are simultaneously engaged in extensive Capital Expenditure (CapEx) to fund decarbonisation and new infrastructure, leading to a temporary cash drain. Furthermore, the high proportion of exploration-stage firms in the ASX sample, which typically exhibit high ‘burn rates’ (negative cash flow) alongside negative earnings—further strengthens this inverse statistical relationship. The finding highlights that for energy investors, liquidity and earnings are currently non-synchronous performance indicators.
The only data available on ASX concerning investment activity in the energy sector is indicated in Table 1 (Market capitalization). Most companies (75.63) have invested in the energy sector up to A$100 million, 12.63% invested between A$101 million and A$1 billion, 10.08 of companies have invested between A$1.1 billion and A$10 billion, and 2% of the energy companies have invested over A$10 billion in the energy sector. Although energy companies have made investments, 84.03% of companies made losses.
The findings of further hypotheses analysis including the control variable market capitalisation (H5) with high VIF indicate that market capitalisation has positive prediction of earnings per share. The finding supports the results by [79] Johnson and Schmitt (1974). The hypothesis H5 is supported.
5.2. Conclusions
The purpose of this study was to analyse the relationships between revenue, net profit, cash flow per share, and earnings per share in Australian 124 energy firms registered on the Australian Securities Exchange (ASX 200). Final data used were obtained from 119 companies due to non-availability of some companies’ data on the Internet due to cancelation of their services (delisted). The key contribution from this study is that revenue, net profit, cash flow per share can improve an organisation’s performance on earnings per share in the energy industry.
The results of the linear regression and Pearson correlation analyses provide selective validation of the proposed organisational performance predictors. While the study verifies a strong and statistically significant positive relationship between Net Profit and Earnings Per Share (H2), the relationship for Revenue (H1) was found to be weak, despite its statistical significance (p = 0.040). Furthermore, the study falsified the hypothesised positive relationship for Cash Flow (H3), identifying instead a significant negative correlation (r = −0.270).
Despite these varied results, the study makes a significant theoretical contribution to the literature by providing an integrated model specifically for the Australian energy industry. This model demonstrates that while top-line revenue is a secondary driver, bottom-line profitability remains the most critical and robust predictor of Earnings Per Share, offering a clear framework for evaluating firm performance during periods of high capital intensity.
The unstandardised coefficient for Revenue (B = 7.408 × 10⁻¹²) indicates that for every One billion dollar (1,000,000,000) increase in total revenue, Earnings Per Share (EPS) is expected to increase by approximately 0.74 cents (0.0074), holding other variables constant. This extremely marginal increase reinforces the finding of a weak correlation (r = 0.161), suggesting that top-line expansion in the Australian energy sector yields negligible direct benefits to per-share earnings without corresponding improvements in margin efficiency.
While the combined model (H4) yielded a relatively low coefficient of determination (r2 = 0.102), this is not uncommon in empirical studies of the energy sector, which is characterised by high external volatility and non-linear market drivers. Although the model explains only 10.2% of the variance in EPS, the F-test and p-values confirm that the relationship between the chosen predictors (Net Profit, Revenue, and CF) and EPS is statistically significant and not due to random chance. This suggests that while internal financial metrics are critical foundational drivers of performance, a substantial portion of EPS variance in Australian energy firms is likely influenced by exogenous factors such as global commodity price fluctuations and regulatory shift.
This study makes a theoretical contribution in literature by providing a model which shows performance predictors (e.g., revenue and net profit) in the energy industry with strong positive statistical significance in earnings per share. The results of this study can offer practitioners and investors in Australia and other countries for a better understanding of the relationships between revenue, net profit, cash flow per share, and earnings per share from energy companies. In addition, the data will help investors to make good investment data-driven decisions in the energy industry or other industries. It also motivates researchers to conduct similar studies in different contexts.
6. Recommendations
6.1. Specific Recommendations Related to the Study
Based on the empirical findings of this study, we provide the following evidence based recommendations tailored to the performance drivers identified in Australian energy firms:
6.1.1. Strengthen Net Profit Margins (Derived from Strong Net Profit–EPS Relationship)
Our results show a strong statistically significant positive relationship between net profit and earnings per share. Therefore, firms should prioritise strategies that directly enhance net profit margins rather than relying solely on revenue expansion. Recommended actions include:
- cost efficiency programs in production and operations,
- optimisation of asset utilisation, and
- renegotiation of long term supply contracts to stabilise input costs.
6.1.2. Avoid over Reliance on Revenue Growth Alone (Derived from Weak Revenue–EPS Relationship)
Although revenue and EPS are positively related, the relationship is weak. This indicates that revenue growth alone does not reliably translate into higher EPS in the energy sector. Firms should therefore emphasise margin enhancing revenue strategies, such as selective pricing improvements and product mix optimisation, rather than volume driven expansion.
6.1.3. Manage Cash Flow Carefully During High CapEx Cycles (Derived from Negative CFPS–EPS Relationship)
The study found a strong negative relationship between cash flow per share and EPS, reflecting the capital intensive nature of the sector where high EPS firms often experience temporarily reduced cash flows due to reinvestment. Firms should:
- improve transparency around CapEx cycles,
- adopt staged investment or joint venture financing, and
- maintain adequate liquidity buffers.
6.1.4. Use Combined Performance Metrics for Decision Making (Derived from Strong Combined Model Results)
Because the combined model of revenue, net profit, and cash flow per share shows a strong relationship with EPS, firms should adopt integrated performance dashboards and align executive incentives with multi factor performance indicators rather than single metric KPIs.
6.1.5. Technology Enabled Improvements (Reframed to Be Evidence Linked)
Technology adoption should be targeted toward improving the specific variables shown to influence EPS:
- AI driven predictive maintenance to reduce operating costs and increase net profit;
- AI based cash flow forecasting to manage the negative CFPS–EPS dynamics during CapEx cycles;
- ERP and JIT systems only where they demonstrably reduce working capital requirements or operational costs, thereby improving net profit or cash flow.
6.1.6. Market Capitalisation as a Contextual Indicator
Although excluded from regression due to multicollinearity, market capitalisation showed a strong positive association with EPS. Firms should therefore use market capitalisation as a contextual indicator of investor expectations and communicate EPS relevant drivers clearly to reduce valuation volatility.
- Investors can use the results of this study to make investment decision for the energy industry firms or other industries’ firms. It is important to invest in firms that have higher earnings per share and taking into consideration the firm’s revenue, net profit, and cash flow per share. Revenue and net profit are the best predictors of earnings per share revealed in our current empirical study.
- AI can be used to collect and process data on firm’s revenue, net profit, and cash flow per share fast, and enable potential investors to make investments decisions efficiently and effectively.
- Use AI predictive analytics to forecast firm’s revenue, net profit, cash flow per share, and earnings per share in Australian energy firms. The data will be useful to investors in energy companies to improve investment decisions.
- The above specific recommendations can be used in other business firms of different industries in the global competitive market.
6.2. General Recommendations
6.2.1. Recommendations to Increase Profit Using Proposed Sales Strategies
- Shift the focus on strategic margin optimisation from volume expansion. Traditionally, sales growth is pursued by lowering selling prices to stimulate volume. However, in the context of the Australian energy sector, this study suggests such a strategy may be sub-optimal for enhancing shareholder value. Our empirical findings indicate that Net Profit (r = 0.318, p < 0.001) is a significantly stronger predictor of Earnings Per Share (EPS) than Revenue (r = 0.161, p = 0.040). Because the correlation between revenue and EPS is weak, “top-line” growth through price discounting does not efficiently translate into shareholder value. Furthermore, given that energy demand is often price-inelastic, a decrease in selling price may fail to generate sufficient volume to offset the reduction in unit margins. Consequently, management should shift focus from aggressive volume-based competition to margin preservation and yield management. By prioritising operational cost-efficiency and protecting the net margins of existing contracts, firms can more effectively drive the bottom-line performance as the primary driver of organisational success.
- Increase the competitive selling price to increase the profit margin. Improvement will need to be made to product features, packaging and after-sales service to justify the increase in the selling price. Sales volume may decrease, remain unchanged or increase depending on the success in the improvement of the product.
- Data-driven ML and AI can be used to address dynamic changes in consumer behavior and other business challenges such as COVID-19 pandemic situations by employing accurate sales forecasting models [77]. Predictions of future sales volume and product pricing can be determined more optimally by combining past data and market trends to refine forecasting models.
- Efforts should be focused on satisfying customer needs such as after-sales service while achieving profit maximisation.
- Strategies for the diversification of products and markets should be evaluated and implemented to improve profit performance.
- Marketing strategies should be adjusted according to the change in profitability due to the change in the life cycle of products.
6.2.2. Recommendations to Increase Profit Using Proposed Inventory Control Strategies
- Applying the traditional inventory model of economic order quantity to determine the amount and timing of inventory ordering would help firms to have the optimum amount of inventory in the warehouse in ideal situations. Implementation of inventory optimisation models can help to maintain reasonable inventory levels necessary to meet customers’ demand. Nnamdi [73] stresses that “managing excess inventory must be a strategic focus of inventory planning or supply chain optimisation function in the global distribution chain” (p. 138).
- Using JIT inventory management system is efficient where amount of goods manufactured are based on the current rather than expected demand, and materials purchased are delivered just in time to meet production needs. This will reduce the set-up time and carrying costs of inventory.
- The use of Enterprise Resource Planning (ERP), where sales, inventory, and profit performance can be improved by integrating the suppliers and customers in the supply chain [80]. Supply chain management integration (SCMI) is directly linked to performance metrics as it serves as a primary driver of both top-line growth and bottom-line efficiency. In general, for companies to improve their profit performance, they need to have sustainable service supply chain management in the organisations.
- To control spending on sales and inventories, managers should categorise spend and analyse data to determine if the performance is according to the company’s sales. It is important to balance inventory with sales volume. Using ML algorithms such as Gradient Boosting and Multi-Layer Perceptron (MLP) can optimise inventory management and improve demand forecasting accuracy [77].
- Using lean procurement techniques, such as material requirements planning (MRP) systems, i.e., procuring required goods and avoiding waste inventories can enhance sustainability.
- Strengthening supplier and buyer relationships, with emphasis on effective procurement contract management and trust to solve some of the inventory problems and improve reciprocal customer experience dealing with procurement function (i.e., all suppliers and buyers are customers to each other).
6.2.3. Recommendations to Increase Sales (Part of Revenue) and Profit Using Organisation Restructuring Strategies
- Companies can restructure and decentralise their operations to improve sales and profit performance.
- Applying performance evaluation systems such as balanced scorecard can be useful to arrive at a balanced measurement of financial, non-financial, internal and external performance.
- Data-driven techniques of AI and ML technologies can aid in the digital transformation of business operations that would result in rapid reshaping of organisational structures. AI and ML have profound influence on organisational hierarchies, job roles, decision-making processes, and the overall strategic orientation of companies [81].
Overall, statistical techniques and ML combined with AI in business practices can enhance evaluation of relationships between revenue, net profit, cash flow per share, and earnings per share, and the overall organisational performance. Several studies show the use of artificial neural networks and other ML techniques for stock market prediction, modelling purchase intentions of customers, asset price forecasting, and detecting accounting fraud can ensure that metrics like Revenue, Net Profit, Cash Flow per Share, and Earnings per Share (EPS) accurately reflect economic reality [82,83,84,85,86,87,88]. Advanced data mining techniques for predictive, preventive as well as descriptive analytics can be employed for smart decision making in several business operations including plant maintenance, farming and financial returns [18,89,90,91,92]. While ML and AI show prospects of business innovation and profitability in various industry sectors such as banking, retail, supply chain, manufacturing, logistics, healthcare, etc. there are associated ethical concerns and challenges related to privacy, bias, and transparency that require organisations to cultivate a culture of ethical responsibility [80,93]. Studies show that adopting ML and AI as comprehensive strategies for social inclusion to minimise disparities between individuals can have competitive business advantage in the digital transformation of organisations [94,95].
To capitalise on our research findings, we recommend integrating AI into energy accounting and operations to achieve the benefits stated below:
- Profit & Revenue Optimisation through smart trading with the use of deep neural networks to forecast renewable output and optimise energy trading. Also, adopting Dynamic Pricing strategies by implementing machine learning algorithms to adjust pricing in real-time based on supply-demand fluctuations, protecting profit margins.
- Operational Efficiency through predictive maintenance by using AI to monitor infrastructure (e.g., wind turbines, grids) to identify faults early. This can reduce grid outages and lower maintenance costs significantly. In addition, cost reduction through AI applications is practically possible in specific energy use cases with increase in productivity.
- Strategic Accounting principles of transparency and disclosure can be adopted using AI-powered platforms for real-time carbon accounting and fraud detection to ensure financial reporting remains transparent and free from “earnings management” bias. AI can automate bookkeeping of routine tasks such as invoice processing and bank reconciliations to free up professionals for strategic analysis.
The above-mentioned key recommendations to adopt AI for accounting practices play an important role in bridging the gap between traditional financial analysis and modern “Industry 4.0” trends. We recommend a closed-loop AI data-driven approach and evaluation pipeline that incorporates a feedback mechanism to regulate and refine system outputs across different AI platforms (Figure 7). In this process, the AI-generated output is continuously compared for accuracy, consistency, interpretability, and alignment with the validated statistical results enabling iterative correction and performance improvement. Theprocess concludes with selecting the best-performing AI platform for operational use.
Figure 7.
Proposed closed-loop AI data-driven approach and evaluation pipeline.
Future research can extend our data driven approach by incorporating advanced deep learning architectures such as Long Short Term Memory (LSTM) networks enhanced with later temporal attention mechanisms. Later temporal attention enables models to selectively weight the most informative time steps in sequential data. Inspired by this, future studies could apply LSTM models with later temporal attention to financial time series from energy firms, allowing the model to learn how revenue, net profit, and cash flow per share contribute to earnings per share (EPS) at different temporal lags. This would enable the detection of delayed effects, nonlinear dependencies, and dynamic interactions that traditional regression cannot capture. Such an approach could yield more accurate EPS forecasting, uncover hidden temporal patterns in financial performance, and provide practitioners with a more robust predictive framework for strategic decision making in the energy sector.
7. Implications of This Research
The results of this comprehensive research study provide new insights into the relationships between revenue, net profit, cash flow per share, and earnings per share in companies, which are scarce in the literature. In addition, little information is available on how the energy companies listed on the Australian Securities Exchange can address the issues associated with performance factors to improve their organisational performance and improve earnings per share. Our empirical study addresses this gap and adds value to literature.
The study offers benefits to the energy industry by providing data to investors investing in energy and determining investment goals and risks policy on cash flow per share, earnings per share (EPS), revenue, and net profit. The study can offer practitioners who manage products and services, operations, and supply chains of companies in Australia and other countries, to have a better understanding of the relationships between revenue, net profit, cash flow per share, and market capitalisation of top companies in the country, and how they affect the company’s earnings per share performance. Practitioners will be able to address these issues required to improve net revenue, profit, earnings per share or the organisational performance of the company. For example, implementation of inventory optimisation models, such as economic order quantity models and using JIT inventory and procurement management can help to maintain reasonable inventory levels to support sales and increase revenue. This study also provides suggested recommendations, which can assist practitioners in rational decision making to increase net profit using proposed sales and inventory control strategies. Further, our practical recommendations on each contributing performance factor along with AI and ML adoption strategies for digital transformation will pave way for data-driven improvement in organisational performance. The results and recommendations will help researchers to advance theory in this area using the ideas and issues identified in this study. Several successful adoptions of AI and ML in different business sectors are motivating to conduct further research in this direction [96,97].
8. Limitations of the Study and Future Research
The main limitation of our study is the energy industry which has only 119 active firms listed on the Australian Securities Exchange (ASX 200). There are 12 industries listed on the ASX directory, but only the energy industry has more than 100 firms. The limitation is validity and generalisation of the results to other industries. The findings of this study on the energy industry reflect the Australian business environment and may not be similar results in other industries or countries.
Our study has some limitations due to data availability. The findings and generalisations from a sample of this study (i.e., few companies listed on the ASX 200 are limited due to lack of sufficient data and the complexity of the companies’ annual report formats/designs. Lack of sufficient data in each industry forced us to use data from the whole population of 119 firms in the energy industry represented on the ASX 200 company directory. A primary limitation of this study is its cross-sectional nature, which captures only a single-period snapshot of the ASX energy market. Consequently, the findings do not reflect how these relationships evolve over time. For instance, the observed negative correlation between Cash Flow and EPS (r = −0.270) may be a temporary result of heavy capital expenditure cycles that would potentially normalise in a longitudinal analysis. Future research should utilise panel data to track these variables over multiple business cycles. The result cannot be generalised to all industries listed on ASX. We chose energy industry because it has not been studied extensively regarding the variables we considered.
Our paper provides insights into the relationships between revenue, net profit, cash flow per share, and earnings per share of energy companies, which are scarce in the literature. Our empirical results and practical recommendations would be useful to design good systems adopting AI and ML as a successful digital transformation strategy to manage relationships efficiently.
Future research can use a large sample for financial secondary data collection and conduct a survey of top listed companies on the stock exchange in the country to determine how the companies manage these key performance factors or variables and their relationships: revenue, net profit, cash flow per share, and earnings per share, and their influence on the overall performance of the organisations. By showing that revenue, net profit, and cash flow work better as a combined measure, we provide investors with a more holistic valuation model than looking at single factors. Future research can examine the relationships of these variables in the companies at other industries to understand the nature of the relationships. It would benefit organisations in conducting the longitudinal study of the performance of these variables to determine the nature of the relationships for both short and long-term planning.
Future studies can adopt a longitudinal approach to capture the cyclical nature of energy investments, potentially explaining the negative correlation of Cash Flow (H3). In the capital-intensive energy industry, the negative correlation of cash flow often suggests that high reinvestment (which lowers immediate cash flow) is driving future earnings growth. Integrating macroeconomic indicators, such as carbon pricing and commodity indices, would significantly enhance the model’s predictive accuracy and account for the high external “noise” characteristic of the energy industry. In addition, the results can help investors to make effective AI data-driven decisions regarding investments in different industries.
Finally, inspired by recent advances in deep learning, future research can incorporate Long Short Term Memory (LSTM) models with later temporal attention. Applying this architecture to financial time series would allow researchers to uncover delayed effects, nonlinear dependencies, and dynamic interactions among revenue, net profit, cash flow per share, and EPS. Such models could significantly enhance EPS forecasting, support closed loop AI decision systems, and provide practitioners with more robust, data driven tools for strategic financial planning.
Author Contributions
Conceptualization, K.A.B.M. and S.V.; methodology, K.A.B.M. and S.W.; resources, K.A.B.M., S.W. and S.V.; software, K.A.B.M.; validation, K.A.B.M. and S.V.; writing—original draft preparation, K.A.B.M. and S.W.; writing—review and editing, K.A.B.M. and S.V.; and supervision, K.A.B.M. All authors have read and agreed to the published version of the manuscript.
Funding
This research received no external funding.
Institutional Review Board Statement
Not applicable.
Informed Consent Statement
Not applicable.
Data Availability Statement
The original data presented in the study are openly available at https://www.asx.com.au or https://www.asx.com.au/markets/trade-our-cash-market/directory (Accessed on 15 July 2025). Click on “Industries” and select “Energy”.
Conflicts of Interest
The authors declare no conflicts of interest.
References
- Carpenter, R.E.; Fazzari, S.M.; Petersen, B.C. Financing Constraints and Inventory Investment: A Comparative Study with High-Frequency Panel Data. Rev. Econ. Stat. 1998, 80, 513–519. [Google Scholar] [CrossRef] [Scilit]
- Roumiantsev, S.; Netessine, S. Should Inventory Policy be Lean or Responsive? Evidence for US Public Companies. SSRN Electron. J. 2007, 9, 1–31. [Google Scholar] [CrossRef] [Scilit]
- Dedeke, A.; Watson, N. Exploring Inventory Trends in Six U.S. Retail Segments; Harvard Business School: Boston, MA, USA, 2008. [Google Scholar]
- Obermaier, R.; Donhauser, A. Zero inventory and firm performance: A management paradigm revisited. Int. J. Prod. Res. 2012, 50, 4543–4555. [Google Scholar] [CrossRef] [Scilit]
- Elsayed, K.; Wahba, H. Reexamining the relationship between inventory management and firm performance: An organizational life cycle perspective. Future Bus. J. 2016, 2, 65–80. [Google Scholar] [CrossRef] [Scilit]
- Egging-Bratseth, R.; Siddiqui, A.S. Stochastic equilibria with capacity expansion: Increasing expected profit with risk aversion. Decis. Anal. J. 2023, 7, 100234. [Google Scholar] [CrossRef] [Scilit]
- Guo, S.; Gu, J.W.; Ching, W.K. Adaptive online portfolio selection with transaction costs. Eur. J. Oper. Res. 2021, 295, 1074–1086. [Google Scholar] [CrossRef] [Scilit]
- Dubelaar, C.; Chow, G.; Larson, P.D. Relationships between inventory, sales and service in a retail chain store operation. Int. J. Phys. Distrib. Logist. Manag. 2001, 31, 96–108. [Google Scholar] [CrossRef] [Scilit]
- Gaur, V.; Kesavan, S. The effects of firm size and sales growth rate on inventory turnover performance in the US retail sector. In Retail Supply Chain Management: Quantitative Models and Empirical Studies; Agrawal, N., Smith, S., Eds.; Springer: New York, NY, USA, 2009; pp. 25–52. [Google Scholar]
- Obermaier, R.; Donhauser, A. Disaggregate and aggregate inventory to sales ratios overtime: The case of German corporations 1993. Logist. Res. 2009, 1, 95–111. [Google Scholar] [CrossRef] [Scilit]
- Ton, Z.; Raman, A. The Effect of Product Variety and Inventory Levels on Retail Store Sales: A Longitudinal Study. Prod. Oper. Manag. 2010, 19, 546–560. [Google Scholar] [CrossRef] [Scilit]
- Tan, C. Sales Performance assessment: A theoretical overview. Int. J. Adv. Multidiscip. Res. Stud. 2023, 3, 1274–1281. [Google Scholar]
- Voulgaris, F.; Doumpos, M.; Zopounidis, C. On the Evaluation of Greek Industrial SME’s Performance via Multicriteria Analysis of Financial Ratios. Small Bus. Econ. 2000, 15, 127–136. [Google Scholar] [CrossRef] [Scilit]
- Cannon, A.R. Inventory improvement and financial performance. Int. J. Prod. Econ. 2008, 115, 581–593. [Google Scholar] [CrossRef] [Scilit]
- Nguyen, D.T.; Pham, T.D. Determinant of Profitability: An Empirical Investigation of the Role of Financial Structure, Technological Innovation, and Managerial Attributes. Economies 2026, 14, 85. [Google Scholar] [CrossRef] [Scilit]
- Hofer, C.; Eroglu, C.; Hofer, A.R. The effect of lean production on financial performance: The mediating role of inventory leanness. Int. J. Prod. Econ. 2012, 138, 242–253. [Google Scholar] [CrossRef] [Scilit]
- Gajamannage, K.; Park, Y.; Jayathilake, D.I. Real-time forecasting of time series in financial markets using sequentially trained dual-LSTMs. Expert Syst. Appl. 2023, 223, 119879. [Google Scholar] [CrossRef] [Scilit]
- Li, T.; Lu, C.; Xu, L. The impact of organisation capital on inventory efficiency. Account. Financ. 2024, 64, 3751–3779. [Google Scholar] [CrossRef] [Scilit]
- Australian Accounting Standards Board. AASB1027 Earnings Per Share. 2001. Available online: https://aasb.gov.au/admin/file/content102/c3/AASB1027_06-01.pdf (accessed on 15 July 2025).
- Australian Accounting Standards Board. AASB1026 Statement of Cash Flows. 1997. Available online: https://aasb.gov.au/admin/file/content102/c3/AASB1026_10-97.pdf (accessed on 15 July 2025).
- Australian Securities Exchange (ASX 200). Company Directory. 2025. Available online: https://www.asx.com.au/ (accessed on 15 July 2025).
- Quester, P.; Mcguiggan, R.; Perreault, W., Jr.; McCarthy, J. Marketing: Creating and Delivering Value; McGraw-Hill: New York, NY, USA, 2007. [Google Scholar]
- Bazley, M.; Hancock, P. Contemporary Accounting; Cengage Learning Pty. Ltd.: Melbourne, VIC, Australia, 2010. [Google Scholar]
- Dai, L.; Fu, R.; Kang, J.-K.; Lee, I. Corporate governance and the profitability of insider trading. J. Corp. Financ. 2016, 40, 235–253. [Google Scholar] [CrossRef] [Scilit]
- Fullerton, R.R.; McWatters, C.S.; Fawson, C. An examination of the relationships between JIT and financial performance. J. Oper. Manag. 2003, 21, 383–404. [Google Scholar] [CrossRef] [Scilit]
- Graman, G.A.; Magazine, M.J. Implementation issues influencing the decision to adopt postponement. Int. J. Oper. Prod. Manag. 2006, 26, 1068–1083. [Google Scholar] [CrossRef] [Scilit]
- Kumar, P.; Bahl, R.N. The effect of inventory management on organizational performance. Int. J. Innov. Sci. Eng. Technol. 2014, 1, 453–459. [Google Scholar]
- Smith, K.V. Profitability versus liquidity trade-offs in working capital management. In Readings on the Management of Working Capital; Smith, K.V., Ed.; West Publishing: St. Paul, MN, USA, 1980; pp. 549–562. [Google Scholar]
- Akinlo, O.O. Determinants of Working Capital Requirements in Selected Quoted Companies in Nigeria. J. Afr. Bus. 2012, 13, 40–50. [Google Scholar] [CrossRef] [Scilit]
- Keep, E.; Mayhew, K.; Corney, M. Review of the Evidence on the Rate of Return to Employers of Investment in Training and Employer Training Measures; SKOPE Research Paper No. 34; Department of Trade and Industry: Washington, DC, USA, 2002. [Google Scholar]
- Batt, R. Managing Customer Services: Human Resource Practices, Quit Rates, and Sales Growth. Acad. Manag. J. 2002, 45, 587–597. [Google Scholar] [CrossRef] [Scilit]
- Storey, D. Education, training and development policies and practices in medium-sized companies in the UK: Do they really influence firm performance? Omega 2002, 30, 249–264. [Google Scholar] [CrossRef] [Scilit]
- Hutchinson, S.; Kinnie, N.; Purcell, J. Bringing Policies to Life: Discretionary Behaviour and the Impact on Business Performance. In Proceedings of the Bath Conference, University of Bath School of Management, Bath, UK, 10–11 April 2002. [Google Scholar]
- Miller, D.; Lee, J. The people make the process: Commitment to employees, decision making, and performance. J. Manag. 2001, 27, 163–189. [Google Scholar] [CrossRef]
- Richard, O.C.; Johnson, N.B. Strategic Human Resource Management Effectiveness and Firm Performance. Int. J. Hum. Resour. Manag. 2001, 12, 299–310. [Google Scholar] [CrossRef]
- Guest, D. CIPD Research Report: Voice from the Boardroom; CIPD: London, UK, 2001. [Google Scholar]
- Chukwunwike, O.D.; Ofoegbu, G.N.; Okoroiwu, K.L.; Okafor, R.G. The Potency of Cash Flow in Predicting Corporate Performance. Acc. Financ. Manag. 2018, 3, 1591–1601. [Google Scholar]
- Olaoye, S.A.; Arise, O.; Akintoye, I.R. Performance Management and Market Capitalisation of Listed Oil and Gas Companies in Nigeria. Int. J. Innov. Res. Dev. 2022, 7, 34–41. [Google Scholar] [CrossRef] [Scilit]
- Mowen, M.; Hansen, D.; Heitger, D.; Sands, J.; Winata, L.; Su, S. Management Accounting; Cengage Learning: Melbourne, VIC, Australia, 2016. [Google Scholar]
- Shah, R.; Shin, H. Relationships among information technology, inventory, and profitability: An investigation of level invariance using sector level data. J. Oper. Manag. 2007, 25, 768–784. [Google Scholar] [CrossRef] [Scilit]
- Koumanakos, D.P. The effect of inventory management on firm performance. Int. J. Prod. Perform. Manag. 2008, 57, 355–369. [Google Scholar] [CrossRef] [Scilit]
- Ahmad, K.; Zabri, S.M. The mediating effect of knowledge of inventory management in the relationship between inventory management practices and performance: The case of micro retailing enterprises. J. Bus. Retail Manag. Res. 2018, 12, 83–93. [Google Scholar] [CrossRef] [Scilit]
- Gupta, A.; Singh, R.; Suri, P. Analysis of Challenges Faced by Indian Logistics Service Providers. Oper. Supply Chain Manag. 2018, 11, 214–225. [Google Scholar] [CrossRef] [Scilit]
- Rachmawati, R.; Sherlita, E. Effect of Sales Growth, Firm Size, Profitability on Earning Per share. Turk. J. Comput. Math. Educ. (TURCOMAT) 2021, 12, 675–680. [Google Scholar]
- Mulindabigwi, J.N.; Mulyungi, P. Effect of inventory management on financial performance in manufacturing firms in Rwanda: A case study of Bralirwa. Int. J. Sci. Res. 2017, 6, 1366–1371. [Google Scholar]
- Boute, R.; Lambrecht, M.; Lambrecht, D.; Sterckx, P. An Analysis of Inventory Turnover in the Belgian Manufacturing Industry, Wholesale and Retail and the Financial Impact on Inventory Reduction; Katholieke Universitieit: Leuven, Belgium, 2006. [Google Scholar]
- Folinas, D.; Shen, C.Y. Exploring links among inventory and financial performance in the agricultural machinery industry. Int. J. Food Agric. Econ. 2014, 2, 1–12. [Google Scholar]
- Panigrahi, A. Relationship between inventory management and profitability: An empirical analysis of Indian cement companies. Asia Pac. J. Mark. Manag. Rev. 2013, 2, 107–120. [Google Scholar]
- Pong, C.K.; Mitchell, F. Inventory investment & control: How have UK companies been doing? Br. Account. Rev. 2012, 44, 173–188. [Google Scholar]
- Sahari, S.; Tinggi, M.; Kadri, N. Inventory Management in Malaysian Construction Firms: Impact on Performance. SIU J. Manag. 2012, 2, 59–72. [Google Scholar]
- Vastag, G.; Whybark, D.C. Inventory Management: Is There a Knock-On Effect? Int. J. Prod. Econ. 2005, 93, 129–138. [Google Scholar] [CrossRef] [Scilit]
- Heizer, J.; Render, B. Operations Management, Sustainability and Supply Chain Management, 11th ed.; Pearson Education: London, UK, 2014. [Google Scholar]
- Balakrishman, R.R.; Linsmeier, J.; Venkatachalam, M. Financial benefits from JIT adoption: Effects of customer concentration and cost structure. Account. Rev. 1996, 71, 43. [Google Scholar] [CrossRef] [Scilit]
- Huson, M.; Nanda, D. The Impact of Just-In-Time Manufacturing on Firm Performance. J. Oper. Manag. 1995, 12, 297–310. [Google Scholar] [CrossRef] [Scilit]
- Lieberman, M.B.; Demeester, L. Inventory Reduction and Productivity Growth: Linkages in the Japanese Automotive Industry. Manag. Sci. 1999, 45, 466–485. [Google Scholar] [CrossRef] [Scilit]
- Kolias, G.D.; Dimelis, S.P.; Filios, V.P. An empirical analysis of inventory turnover behaviour in Greek retail sector: 2000. Int. J. Prod. Econ. 2011, 133, 143–153. [Google Scholar] [CrossRef] [Scilit]
- Chen, H.; Frank, M.Z.; Wu, O.Q. What Actually Happened to the Inventories of American Companies? Manag. Sci. 2005, 51, 1015–1031. [Google Scholar] [CrossRef] [Scilit]
- Demeter, K. Manufacturing Strategy and Competitiveness. Int. J. Prod. Econ. 2003, 31, 205–213. [Google Scholar] [CrossRef] [Scilit]
- Hise, R.; Kelly, J.P.; Gable, M. Factors Affecting the Performance of Individual Chain Store Units: An Empirical Analysis. J. Retail. 1983, 59, 22–39. [Google Scholar]
- McGahan, A.M.; Porter, M.E. How much does industry matter, really? Strateg. Manag. J. 1997, 18, 15–30. [Google Scholar]
- Vidyakala, K.; Madhuvanthi, S.; Poornima, S. Recession in Indian Retail Industry. SSRN Electron. J. 2009. [Google Scholar] [CrossRef] [Scilit]
- Choudhary, H.; Tripathi, G. An Analysis of Inventory Turnover and Its Impact on Financial Performance in Indian Organised Retail Industry. J. Serv. Res. 2012, 12, 43–60. [Google Scholar]
- Eroglu, C.; Hofer, C. Lean, leaner, too lean? The inventory-performance link revisited. J. Oper. Manag. 2011, 29, 356–369. [Google Scholar] [CrossRef] [Scilit]
- Jayaram, J.; Vickery, S.; Droge, C. Relationship building, lean strategy and firm performance: An exploratory study in the automotive supplier industry. Int. J. Prod. Res. 2008, 46, 5633–5649. [Google Scholar] [CrossRef] [Scilit]
- Saleh, B.A. The Effect of Financial Ratios, Firm Size, and Cash Flows from Operating Activities on Earnings per Share. Int. J. Prof. Bus. Rev. 2023, 8, e03317. [Google Scholar] [CrossRef] [Scilit]
- Taani, K.; Banykhaled, M. The effect of financial ratios, firm size and cash flow from operating activities on earnings per share (an applied study on Jordanian industrial sector). Int. J. Soc. Sci. Humanit. Stud. 2011, 3, 197–205. [Google Scholar]
- Martani, D.; Khairurizka, R. The effect of financial ratios, firm size, and cash flow from operating activities in the interim report to the stock return. Chin. Bus. Rev. 2009, 8, 6. [Google Scholar] [CrossRef] [Scilit]
- Larson, P.D.; DeMarais, R.A. Psychic Stock: An Independent Variable Category of Inventory. Int. J. Phys. Distrib. Logist. Manag. 1990, 20, 28–34. [Google Scholar] [CrossRef] [Scilit]
- Huffman, C.; Kahn, B.E. Variety for sale: Mass customization or mass confusion? J. Retail. 1998, 74, 491–513. [Google Scholar] [CrossRef] [Scilit]
- Fisher, M.L.; Ittner, C.D. The Impact of Product Variety on Automobile Assembly Operations: Empirical Evidence and Simulation Analysis. Manag. Sci. 1999, 45, 771–786. [Google Scholar] [CrossRef] [Scilit]
- Grubor, A.; Milicevic, N.; Djokic, N. The Effect of Inventory Level on Product Availability and Sale. Prague Econ. Pap. 2016, 25, 221–233. [Google Scholar] [CrossRef] [Scilit]
- Ton, Z.; Raman, A. Cross-Sectional Analysis of Phantom Products at Retail Stores; Working Paper; Harvard University: Cambridge, MA, USA, 2005. [Google Scholar]
- Nnamdi, O. Strategies for Managing Excess and Dead Inventories: A Case Study of Spare Parts Inventories in the Elevator Equipment Industry. Oper. Supply Chain Manag. 2018, 11, 128–139. [Google Scholar] [CrossRef] [Scilit]
- Ocaña, C.; Zemel, E. Learning from Mistakes: A Note on Just-in-Time Systems. Oper. Res. 1996, 44, 206–214. [Google Scholar] [CrossRef] [Scilit]
- DeHoratius, N.; Raman, A. Inventory Record Inaccuracy: An Empirical Analysis. Manag. Sci. 2008, 45, 771–786. [Google Scholar] [CrossRef] [Scilit]
- Krafcik, J.F. Triumph of the Lean Production System. Sloan Manag. Rev. 1988, 30, 41–51. [Google Scholar]
- Kizgin, K.T.; Alp, S.; Aydin, N.; Yu, H. Machine learning-based sales forecasting during crises: Evidence from a Turkish women’s clothing retailer. Sci. Prog. 2025, 108, 368504241307719. [Google Scholar] [CrossRef] [Scilit]
- Araballi, S.; Devaki, P. A critical review of agri-food supply management with traceability and transparency using block-chain technology. In Intelligent Cyber Physical Systems and Internet of Things: ICoICI; Springer: Cham, Switzerland, 2023; pp. 239–250. [Google Scholar]
- Johnson, T.E.; Schmitt, T.G. Effectiveness of Earnings Per Share Forecasts. Financ. Manag. 1974, 3, 64. [Google Scholar] [CrossRef] [Scilit]
- Msimangira, K.A.; Venkatraman, S. Supply Chain Management Integration: Critical Problems and Solutions. Oper. Supply Chain Manag. Int. J. 2014, 7, 23–31. [Google Scholar] [CrossRef] [Scilit]
- Bhuvan, S. The Impact of AI and ML on Organizational Structure. ShodhKosh J. Vis. Perform. Arts 2024, 5, 1787–1800. [Google Scholar] [CrossRef] [Scilit]
- Wong, S.; Venkatraman, S. Financial Accounting Fraud Detection Using Business Intelligence. Asian Econ. Financ. Rev. 2015, 5, 1187–1207. [Google Scholar] [CrossRef] [Scilit]
- Chhajer, P.; Shah, M.; Kshirsagar, A. The applications of artificial neural networks, support vector machines, and long–short term memory for stock market prediction. Decis. Anal. J. 2022, 2, 100015. [Google Scholar] [CrossRef] [Scilit]
- Bhattacharjee, D.; Ramesh, K.; Jayaram, E.S.; Mathad, M.S.; Puhan, D. An integrated machine learning and DEMATEL approach for feature preference and purchase intention modelling. Decis. Anal. J. 2023, 6, 100171. [Google Scholar] [CrossRef] [Scilit]
- Aygün, B.; Kabakçı Günay, E. Comparison of Statistical and Machine Learning Algorithms for Forecasting Daily Bitcoin Returns. Eur. J. Sci. Technol. 2021, 21, 444–454. [Google Scholar]
- Afriyie, J.K.; Tawiah, K.; Pels, W.A.; Addai-Henne, S.; Dwamena, H.A.; Owiredu, E.O.; Ayeh, S.A.; Eshun, J. A supervised machine learning algorithm for detecting and predicting fraud in credit card transactions. Decis. Anal. J. 2023, 6, 100163. [Google Scholar] [CrossRef] [Scilit]
- Amin, E. Financial fraud detection of the Egyptian companies’ annual reports using artificial bee colony algorithm. Int. J. Bus. Data Anal. 2019, 1, 184–201. [Google Scholar] [CrossRef] [Scilit]
- Rakshit, S.; Aslani, B.; Rajah, E.; Vajjhala, N.R. Exploring the role of artificial intelligence and machine learning for financial intelligence in Nigeria. In Proceedings of the International Conference on Innovative Computing & Communication (ICICC), Delhi, India, 20–21 February 2021. [Google Scholar]
- Durai, S.K.S.; Shamili, M.D. Smart farming using Machine Learning and Deep Learning techniques. Decis. Anal. J. 2022, 3, 100041. [Google Scholar] [CrossRef] [Scilit]
- Pagano, D. A predictive maintenance model using Long Short-Term Memory Neural Networks and Bayesian inference. Decis. Anal. J. 2023, 6, 100174. [Google Scholar] [CrossRef] [Scilit]
- Das, D.; Kayal, P.; Maiti, M. A K-means clustering model for analyzing the Bitcoin extreme value returns. Decis. Anal. J. 2023, 6, 100152. [Google Scholar] [CrossRef] [Scilit]
- Chan, K.C.; Li, K.; Li, T.; Zhang, W. Brand capital and corporate investment efficiency. Eur. Financ. Manag. 2024, 31, 909–951. [Google Scholar] [CrossRef] [Scilit]
- Dwivedi, Y.K.; Hughes, L.; Ismagilova, E.; Aarts, G.; Coombs, C.; Crick, T.; Duan, Y.; Dwivedi, R.; Edwards, J.; Eirug, A.; et al. Artificial Intelligence (AI): Multidisciplinary perspectives on emerging challenges, opportunities, and agenda for research, practice and policy. Int. J. Inf. Manag. 2021, 57, 101994. [Google Scholar] [CrossRef] [Scilit]
- Hassan, Z.; Khreich, W.; Osman, I.H. An international social inclusion index with application in the organization for economic co-operation and development countries. Decis. Anal. J. 2022, 3, 100047. [Google Scholar] [CrossRef] [Scilit]
- Luo, Y.; Cui, H.; Zhong, H.; Wei, C. Business environment and enterprise digital transformation. Financ. Res. Lett. 2023, 57, 104250. [Google Scholar] [CrossRef] [Scilit]
- Chakri, P.; Pratap, S.; Lakshay; Gouda, S.K. An exploratory data analysis approach for analyzing financial accounting data using machine learning. Decis. Anal. J. 2023, 7, 100212. [Google Scholar] [CrossRef] [Scilit]
- Gupta, S.; Chatterjee, P.; Rastogi, R.; Gonzalez, E.D.S. A Delphi fuzzy analytic hierarchy process framework for criteria classification and prioritization in food supply chains under uncertainty. Decis. Anal. J. 2023, 7, 100217. [Google Scholar] [CrossRef] [Scilit]
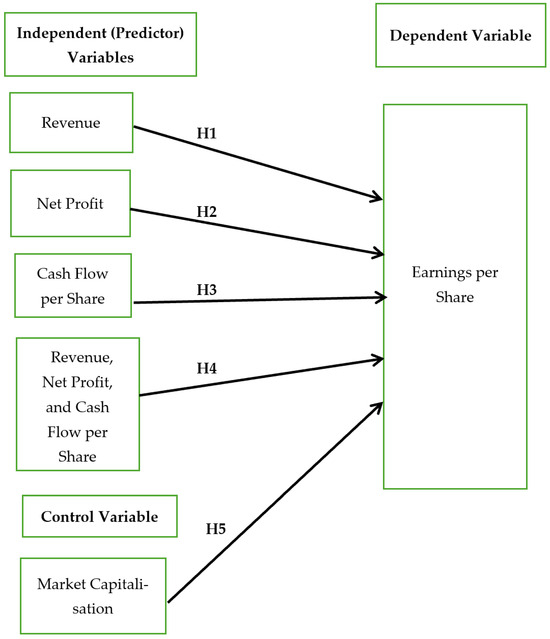
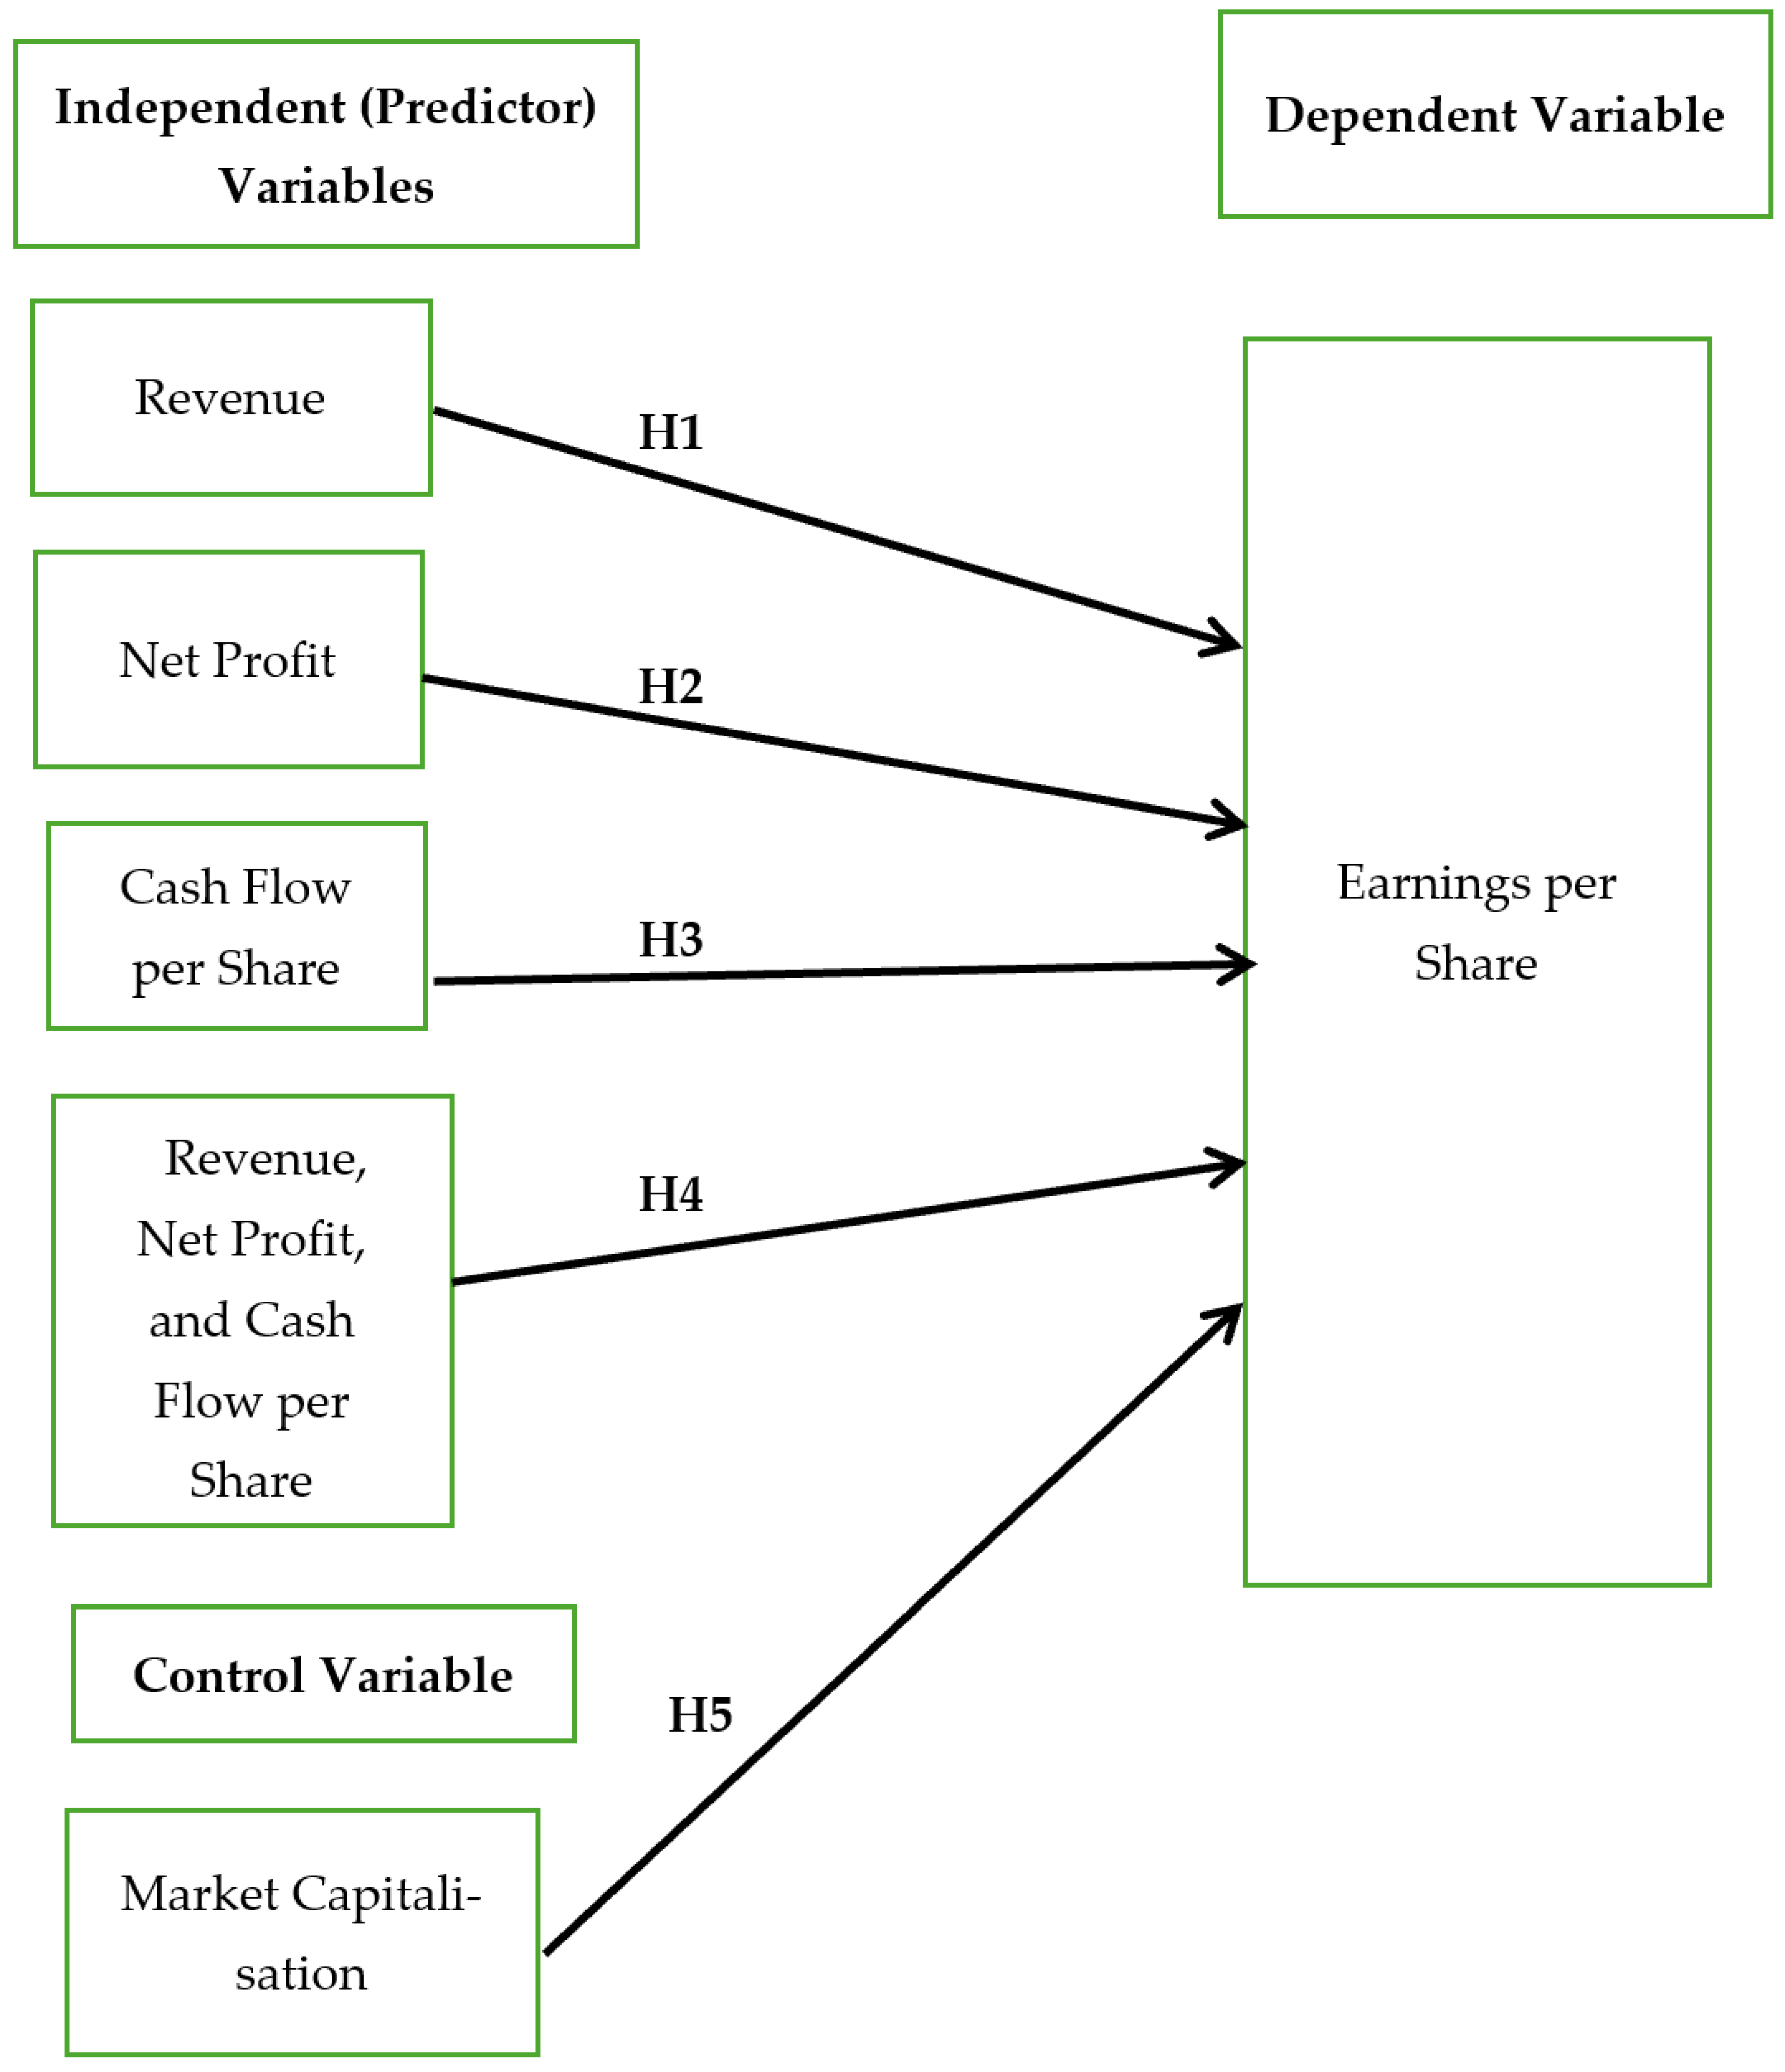
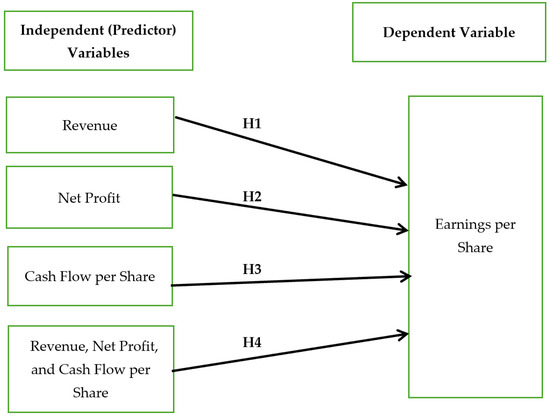
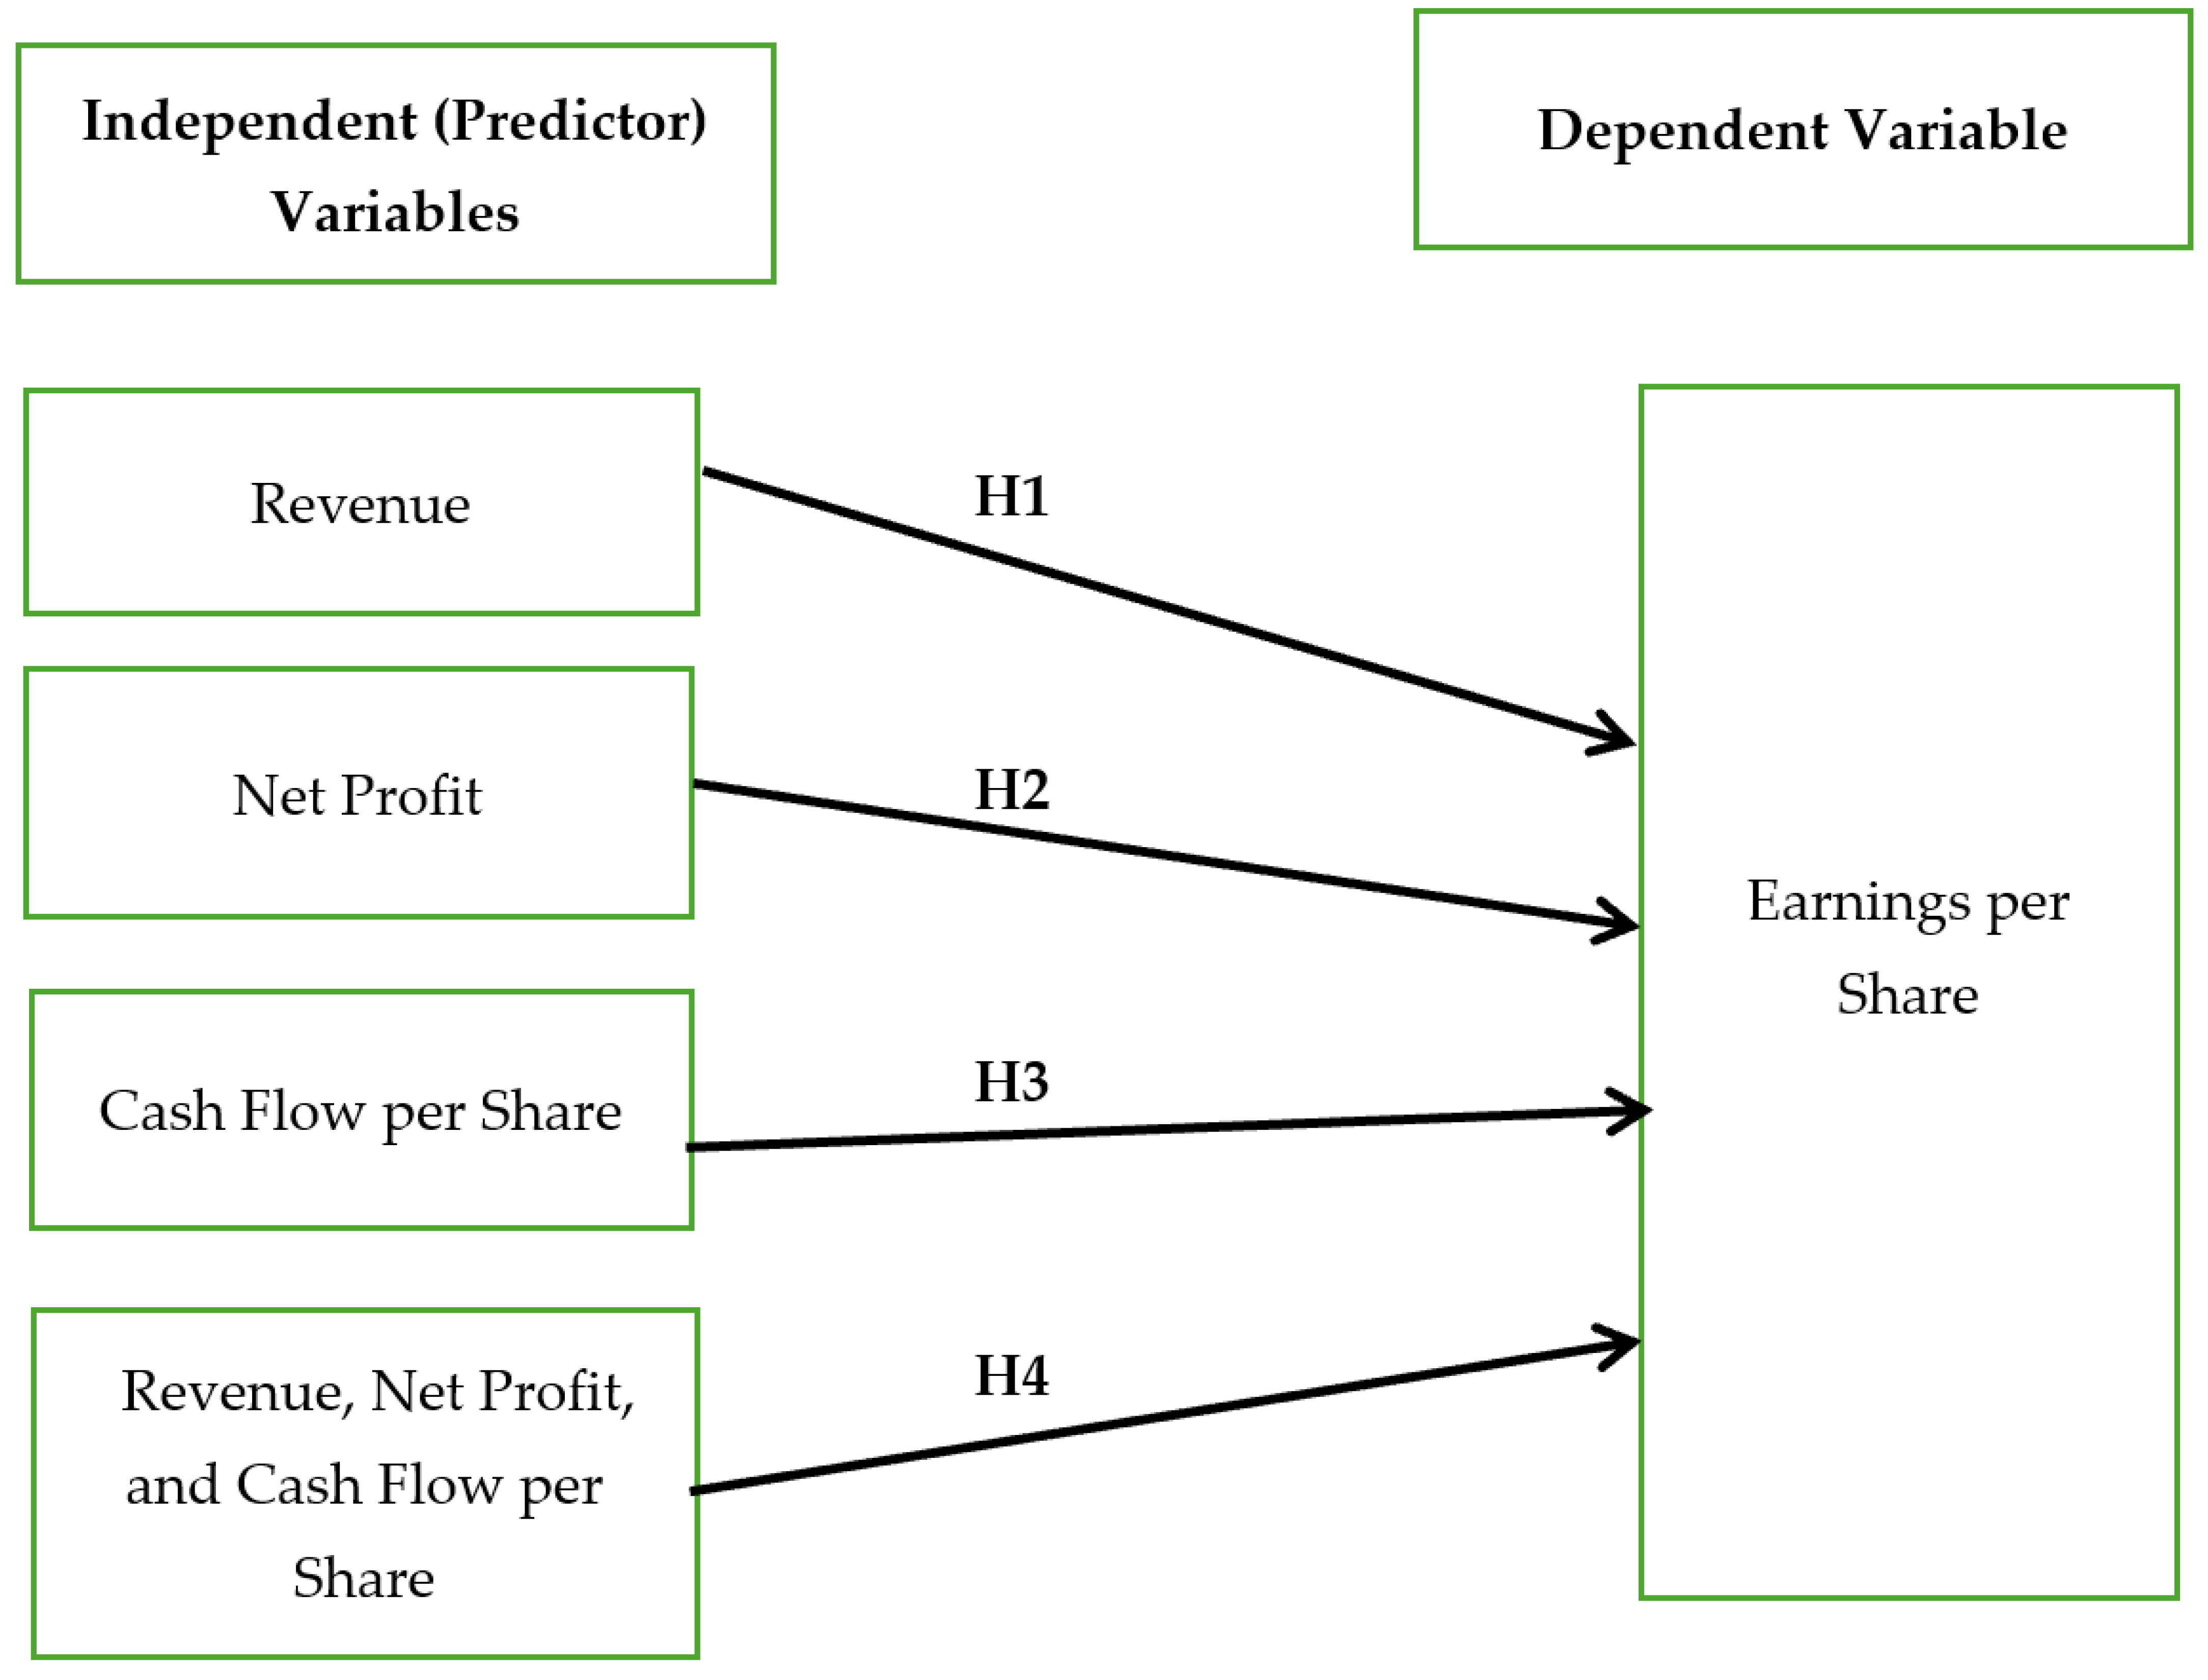
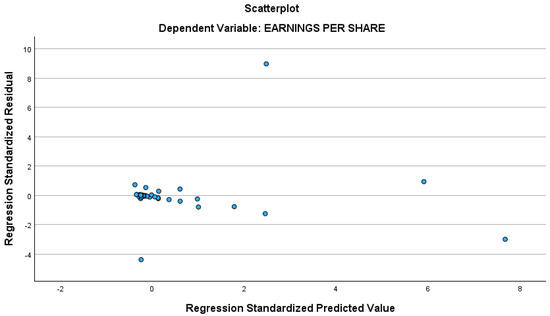
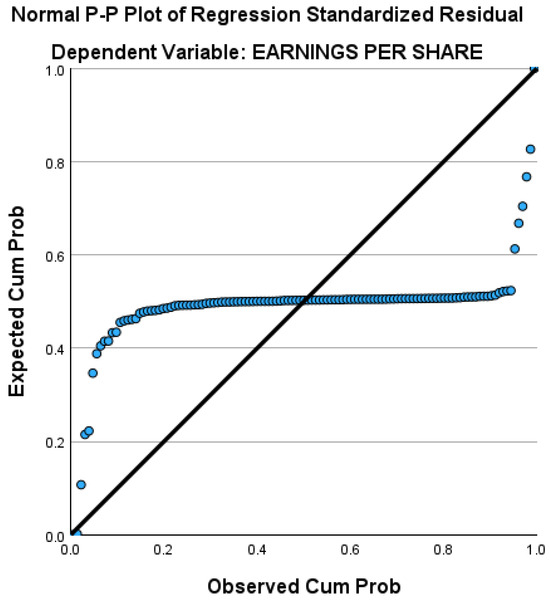
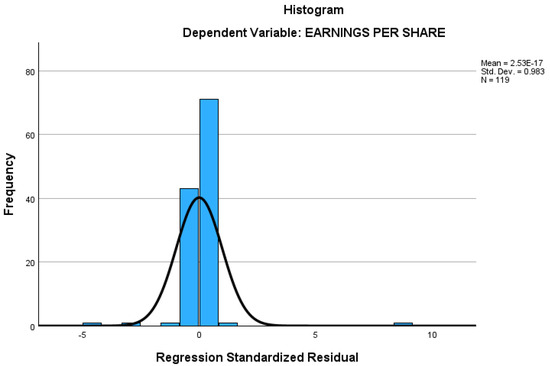
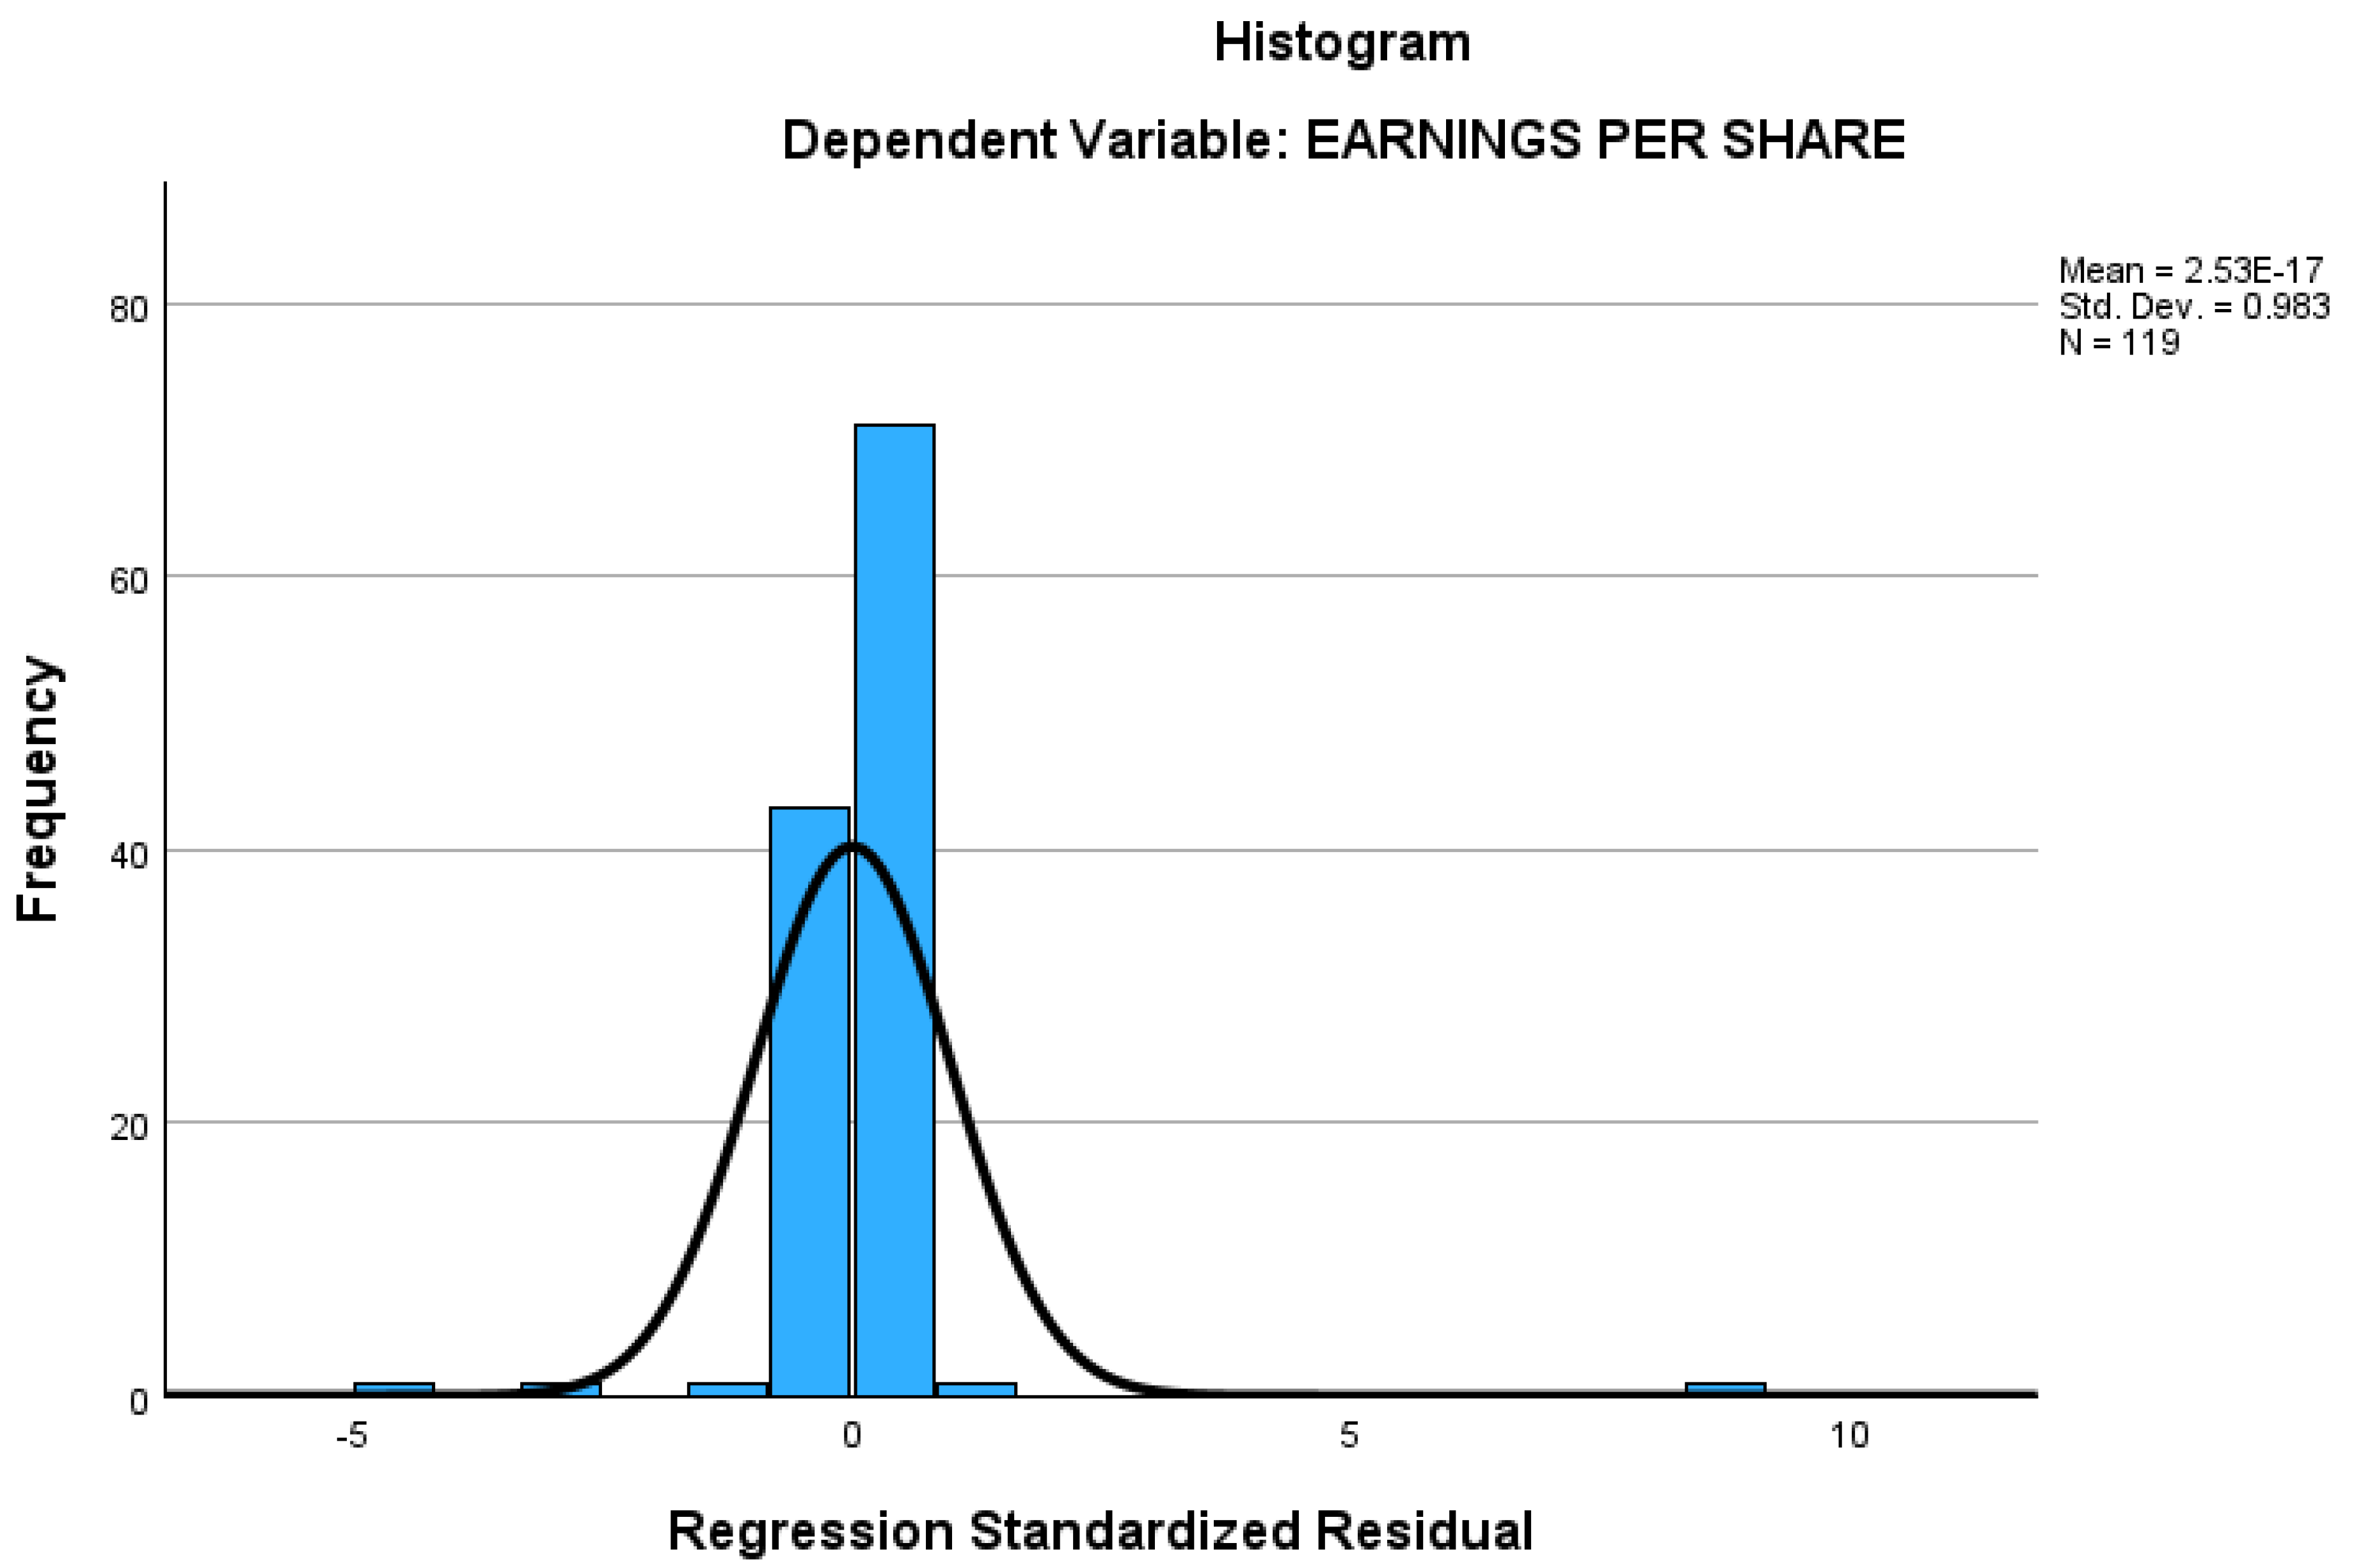
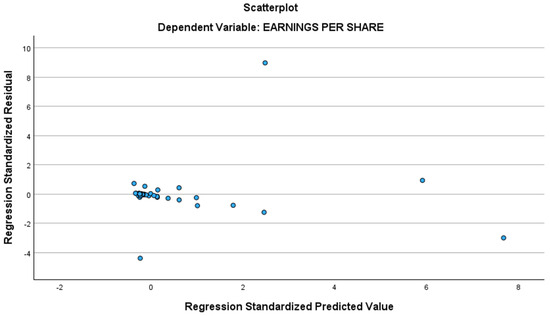
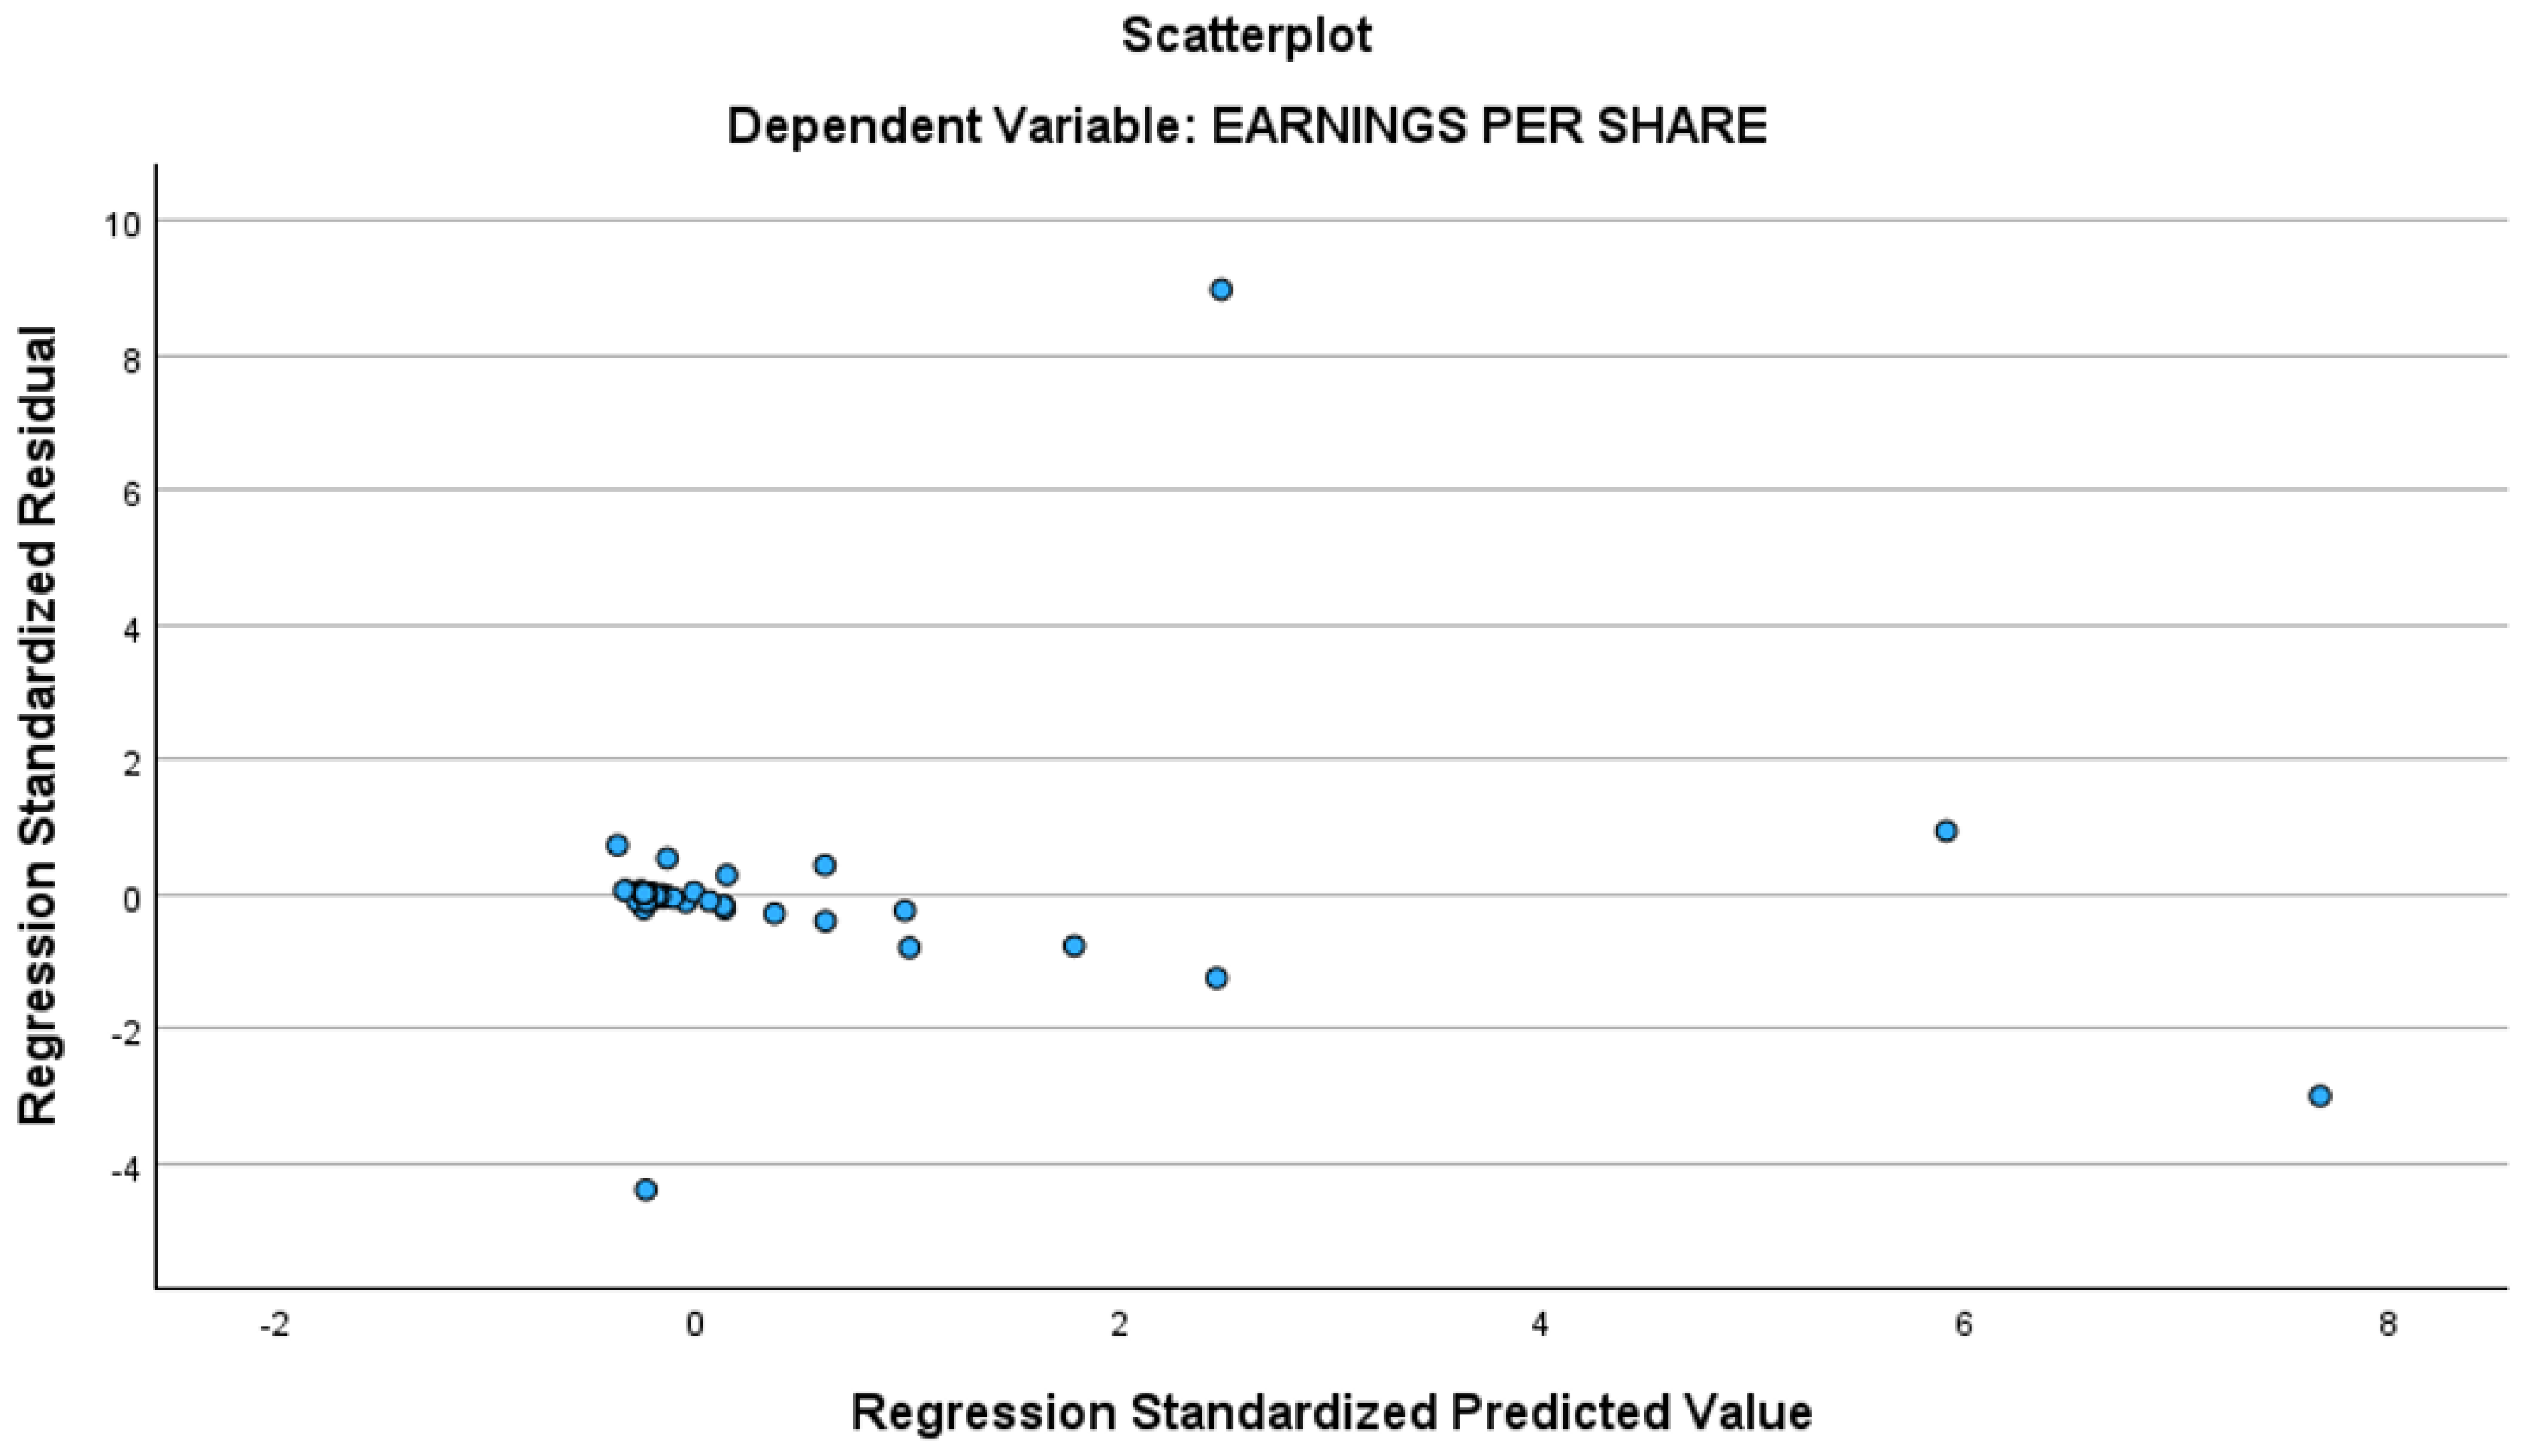
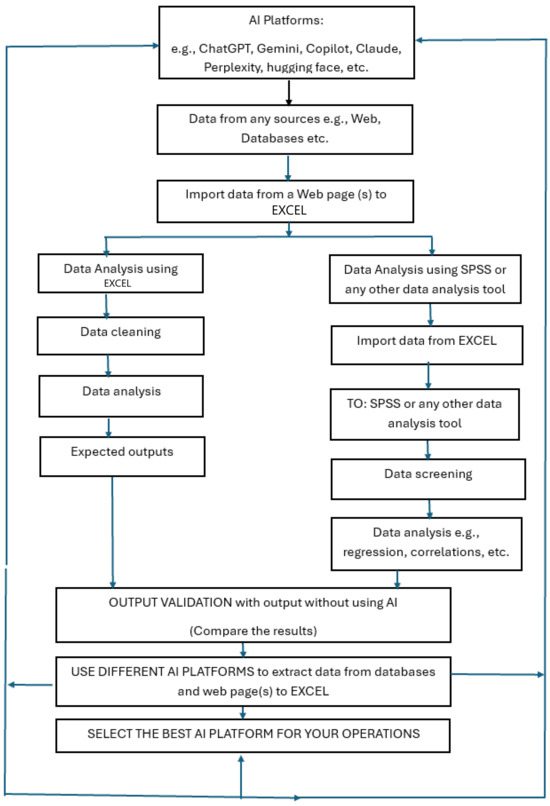
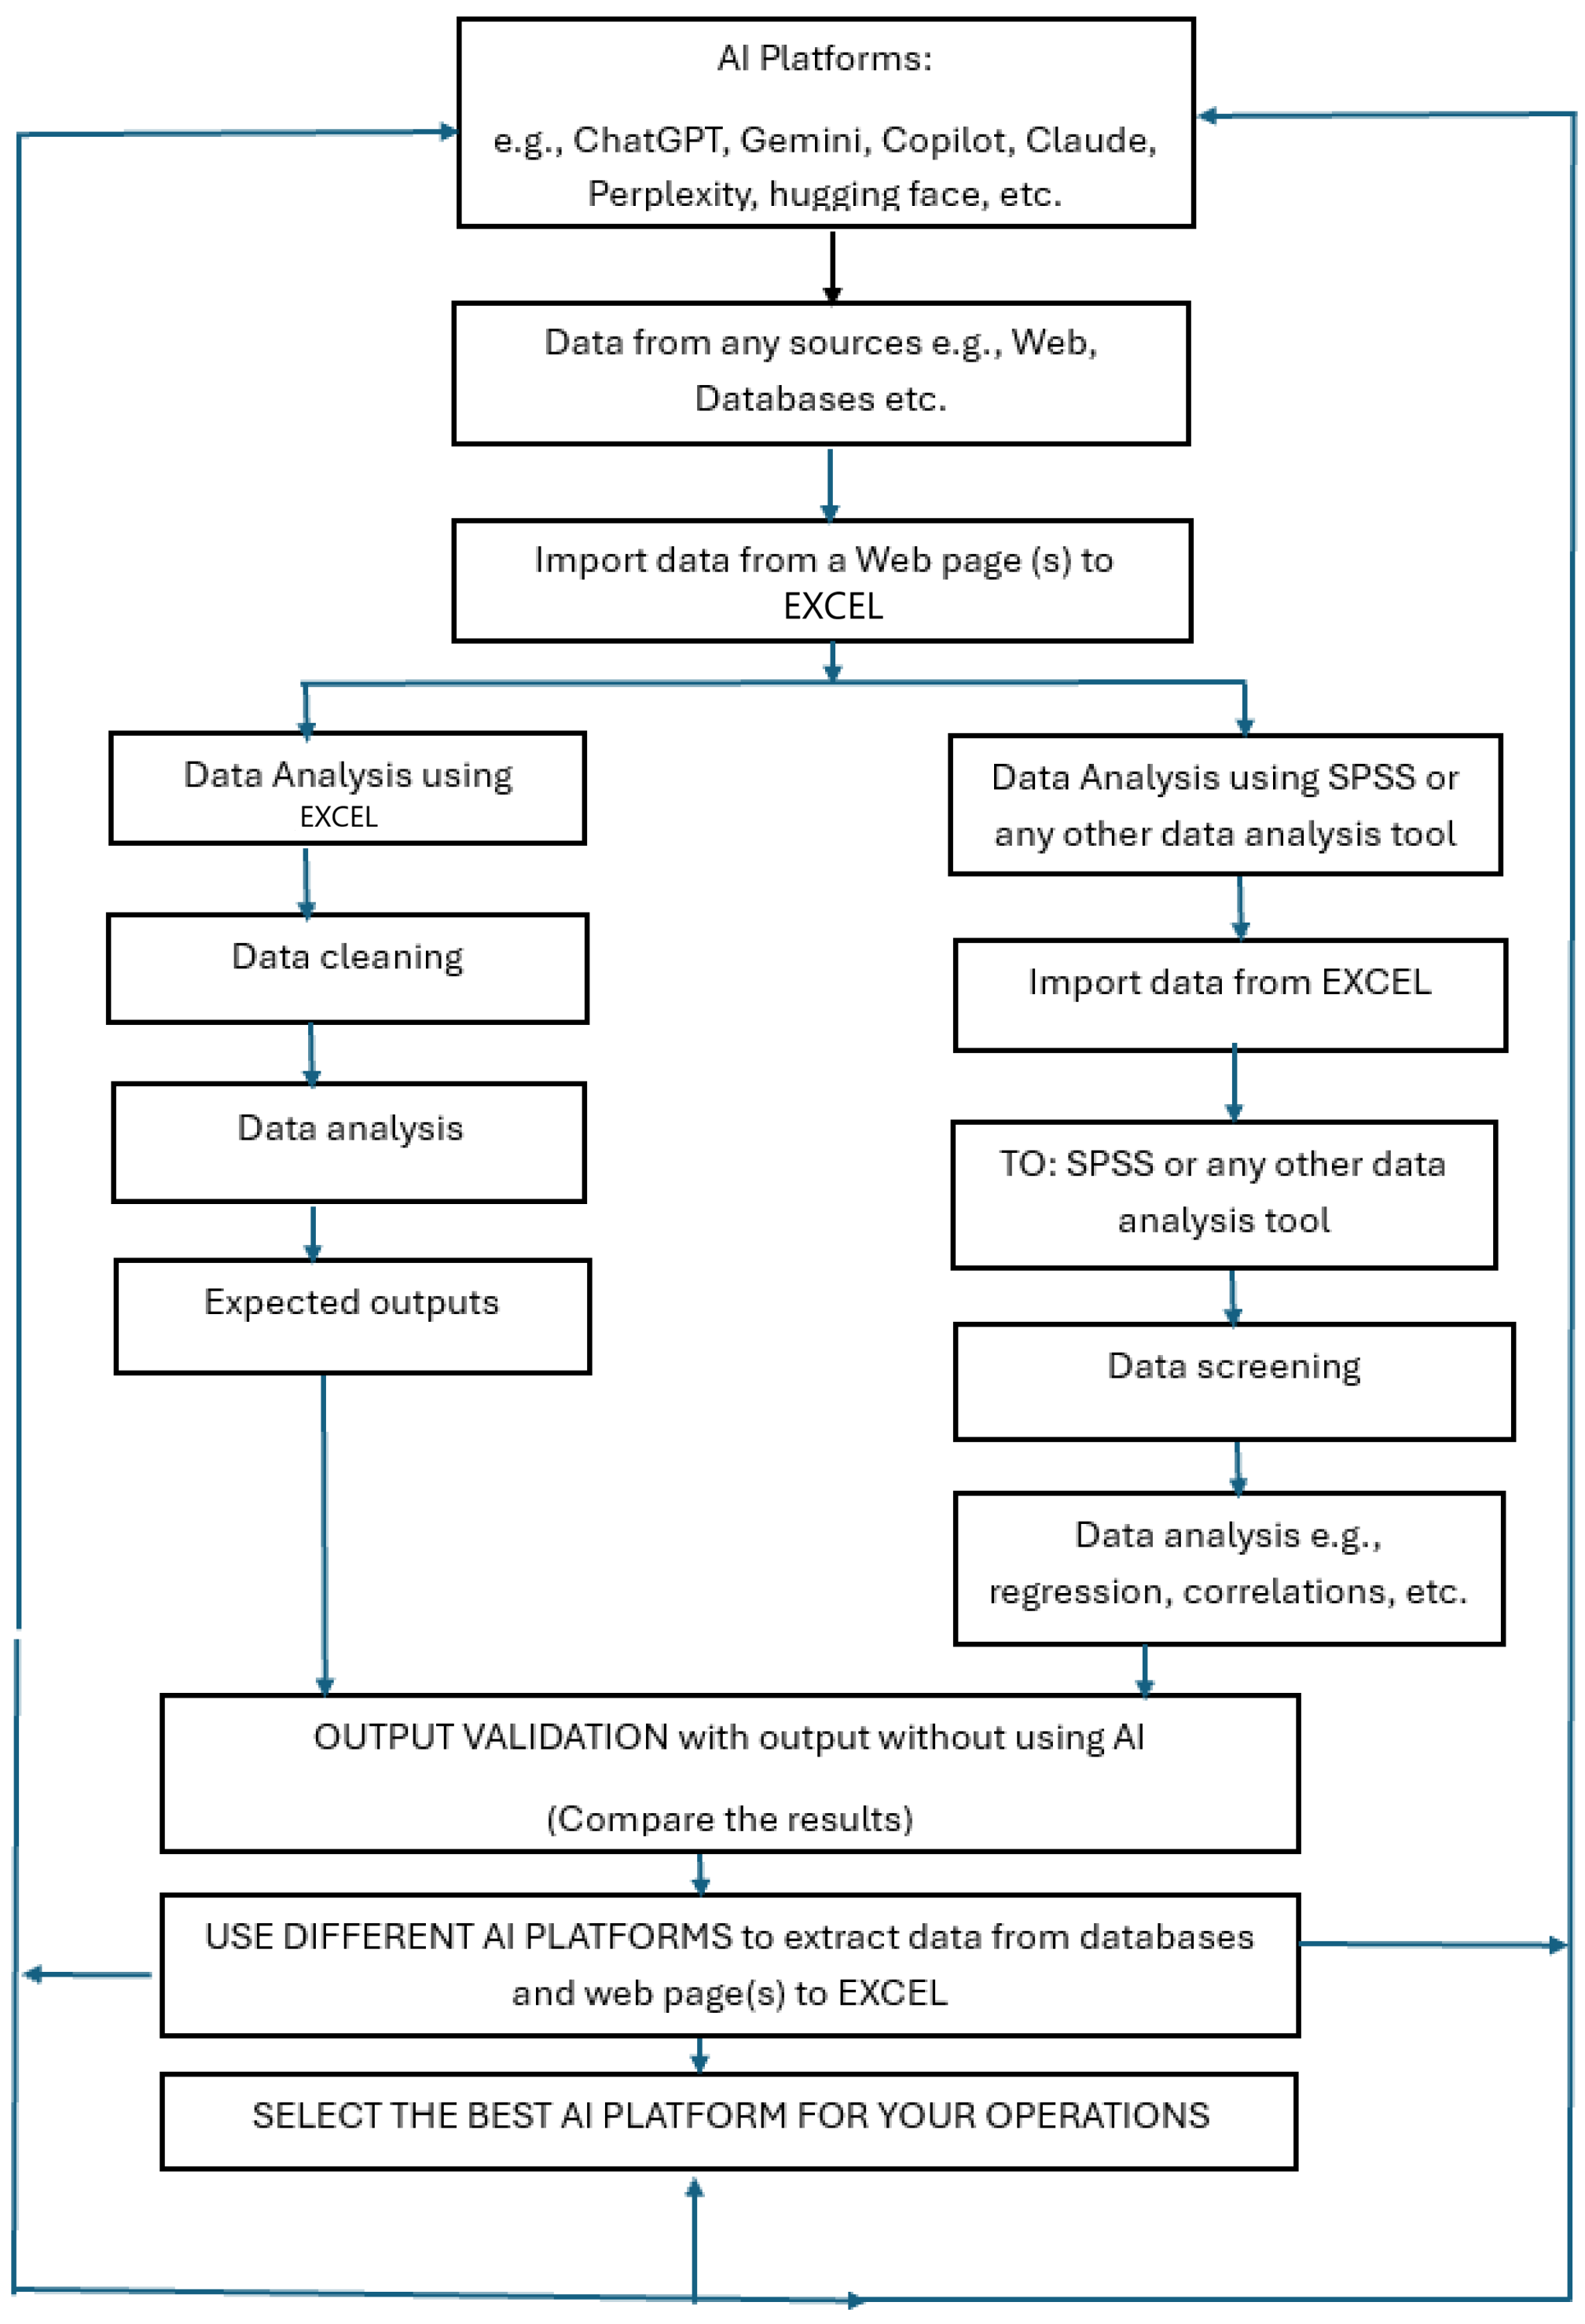

Disclaimer/Publisher’s Note: The statements, opinions and data contained in all publications are solely those of the individual author(s) and contributor(s) and not of MDPI and/or the editor(s). MDPI and/or the editor(s) disclaim responsibility for any injury to people or property resulting from any ideas, methods, instructions or products referred to in the content. |
© 2026 by the authors. Licensee MDPI, Basel, Switzerland. This article is an open access article distributed under the terms and conditions of the Creative Commons Attribution (CC BY) license.