


Abstract
This article introduces the CoLiRa (Computational Literature Review & Analysis) framework, a novel integration of established computational algorithms designed to quantitatively analyze and map the evolution of scientific fields. Employing a human-in-the-loop epistemological approach, CoLiRa combines the scalability of automated algorithms with the semantic coherence of expert-driven qualitative research. The multi-stage pipeline incorporates Latent Dirichlet Allocation (LDA) for thematic discovery, cluster analysis (K-Means and Multidimensional Scaling) for conceptual mapping, and Ordinary Least Squares (OLS) regression to monitor temporal trends. Algorithmic outputs are structurally validated by domain experts using quantitative metrics. The framework’s end-to-end capabilities are demonstrated through a proof-of-concept case study on the semantic enrichment of tabular data, encompassing studies up to 2024 that utilize Semantic Web ontologies, Linked Data, and knowledge graphs. The analysis identifies three core research topics and finds no statistically significant linear trends, suggesting thematic coexistence. This work provides a validated, hybrid computational approach for conducting robust literature reviews and mapping research trajectories.
1. Introduction
Tabular datasets, understood as datasets composed of semi-structured data tables, are typically available on the web in formats such as CSV, JSON, or XML. Semantically enriching this kind of data source is a potentially beneficial task. Its applicability extends beyond simple decentralized data management through integration with existing datasets to specific data mining activities such as feature selection and data cleaning.
In this context, recent years have seen a rise in popularity of competitions aimed at generating knowledge graphs from tabular datasets from the web, such as SemTab (Semantic Web Challenge on Tabular Data to Knowledge Graph Matching). These competitions typically focus on three specific data table-knowledge graph mapping tasks: (1) assigning semantic types to columns, (2) assigning knowledge graph entities to cells, and (3) assigning properties to relationships between columns. These tasks are generally conceptualized as semantic annotation, formally defined as the process of identifying concepts and relationships within documents [1].
This article introduces the CoLiRa (Computational Literature Review & Analysis) framework, a replicable methodology for analyzing scientific literature. CoLiRa is structured as a multi-stage, human-in-the-loop pipeline that incorporates topic modeling to identify core themes, cluster analysis to map conceptual structures from key terms, and linear regression to quantitatively assess evolutionary research trends. To demonstrate the framework’s end-to-end capabilities, a proof-of-concept study is presented on semantic enrichment approaches, focusing on research employing Semantic Web ontologies, Linked Data, and knowledge graphs up to 2024. This controlled case study illustrates how domain experts systematically audit the probabilistic outputs of computational models to generate theoretically robust and semantically coherent conceptual taxonomies.
The main motivation of this work is multifactorial. First, manual literature reviews become increasingly impractical as the bodies of literature grow exponentially [2]. Second, these traditional literature reviews are susceptible to selection biases [3], emphasizing the need for reproducible methods [4]. Third, the literature reviews are primarily qualitative and therefore do not focus on quantitatively assessing research trends [5], revealing the need for approaches to understand the evolution of scientific fields [6].
The methodological innovation of the CoLiRa framework lies in its architectural integration and its adoption of a “human-in-the-loop” epistemological approach, rather than the introduction of new standalone algorithms. Existing literature analysis methods are characterized by a clear dichotomy. Traditional Systematic Literature Reviews (SLRs) provide in-depth qualitative insights but are limited by human processing capacity and are susceptible to manual heuristic bias. In contrast, fully automated bibliometric techniques, such as isolated topic modeling, offer high scalability but frequently exhibit “semantic blindness”, resulting in mathematically optimized clusters that lack theoretical coherence.
CoLiRa overcomes these limitations by implementing a continuous, end-to-end analytical pipeline in which the probabilistic output from thematic discovery (Latent Dirichlet Allocation, LDA) forms the multidimensional feature space for both conceptual mapping (K-Means clustering) and evolutionary tracking (Ordinary Least Squares, OLS, regression). This integrated process is intentionally structured with expert consensus layers at critical junctures. The resulting hybrid architecture yields improved analytical outcomes by generating conceptual taxonomies that combine the computational scalability of automated algorithms with the semantic coherence and theoretical rigor required for qualitative research.
2. Theoretical Background
SLRs are designed to comprehensively, transparently, and reproducibly synthesize all relevant research on a defined question, following structured protocols like PRISMA. However, this rigor comes at enormous cost. As Antons et al. [7] note in their influential CLR roadmap in Organizational Research Methods, the cumulative scholarly corpus now exceeds 50 million articles with roughly 2.5 million added annually—making it “increasingly resource-intensive” to conduct reviews, and at worst “infeasible” given “the natural limits of human researchers’ information-processing capabilities”. The LiRA framework [8] frames the same constraint from the medical domain: the estimated time to complete an SLR has increased significantly in recent decades, compounded by the necessity of expert labor. Meanwhile, multiple sources of bias permeate even well-conducted SLRs—publication bias (trials with significant results are more likely published, published in English, cited, and published repeatedly), pipeline bias, indexing bias, search strategy biases, and eligibility biases that can exclude non-English reports and small studies from regions with less-developed research infrastructure [9]. A semi-automation study of screening noted that SVM classifiers achieved perfect sensitivity but that “the model had the tendency to predict using less relevant or misinterpreted variables”, demonstrating the model’s “inability to extract semantic meaning from text” [10].
Computational literature review (CLR) methods were developed to address scalability constraints in traditional literature reviews. According to Antons et al. [7], CLRs are defined as “a structured process intended to augment human researchers’ information processing capabilities through the use of machine learning algorithms that help analyze the content of a comprehensive text corpus in a specific knowledge domain… in a way that is scalable and real-time capable”. Key computational bibliometric techniques include co-citation analysis, bibliographic coupling, co-authorship networks, and topic modeling, particularly Latent Dirichlet Allocation (LDA), which algorithmically identifies latent thematic structures [11,12]. Tools such as VOSviewer, CiteSpace, and Bibliometrix have contributed to the accessibility and widespread adoption of these methods [13].
The literature recognizes the problem that computationally optimized outputs lack theoretical coherence and qualitative depth. Klarin [14], in a guide on co-word analysis, emphasizes that algorithmic outputs necessitate significant interpretive effort to achieve authentic integrative reviews. Antons et al. [7] present a comparable argument: while unsupervised techniques such as Latent Dirichlet Allocation (LDA) uncover latent patterns, “the human researcher’s task, then, is to interpret and make sense of the patterns revealed by the machine”. They further caution that users of computational literature reviews (CLR) must balance “what is technically feasible, with what is directly useful in terms of new knowledge produced”.
A concrete challenge in topic modeling is that Latent Dirichlet Allocation (LDA) and related algorithms generate clusters of co-occurring words, yet these clusters often lack alignment with theoretically meaningful constructs. Although a cluster may achieve high scores on coherence metrics such as normalized pointwise mutual information (NPMI), it can remain semantically ambiguous or span multiple theoretical concepts. Recent research on integrative topic modeling addresses this limitation by integrating BERTopic, CorEx, and GPT-based methods to generate topics with greater contextual relevance [15]. The widely cited “Smart Literature Review” framework by Asmussen and Møller [11] also recognizes that LDA outputs require substantial post-processing to become analytically valuable.
The evolution of these methods is progressing in three primary directions. First, hybrid approaches integrate computational scalability with human interpretive depth, as described by Antons et al. as “human-centered” CLRs, in which machines automate labor-intensive preprocessing and pattern detection, while humans retain responsibility for interpretation [7]. Second, NLP-enhanced review frameworks extend beyond bag-of-words bibliometrics by leveraging contextual embeddings and large language models (LLMs) for more semantically rich analysis [16]. Third, agentic multi-agent systems such as LiRA seek to automate the synthesis and writing stages, while preserving citation fidelity and structural coherence.
This study is situated within the first trajectory of human-centered hybrid approaches. By integrating automated thematic discovery with formalized expert consensus, the proposed framework addresses the semantic limitations of purely algorithmic outputs and overcomes the scalability constraints of traditional systematic literature reviews (SLRs).
3. Materials and Methods
3.1. Overview of the CoLiRa Framework Architecture
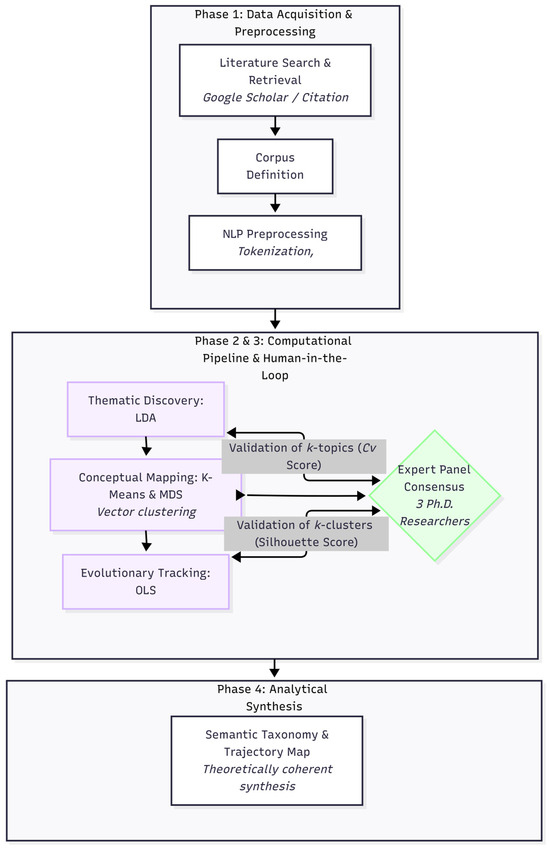
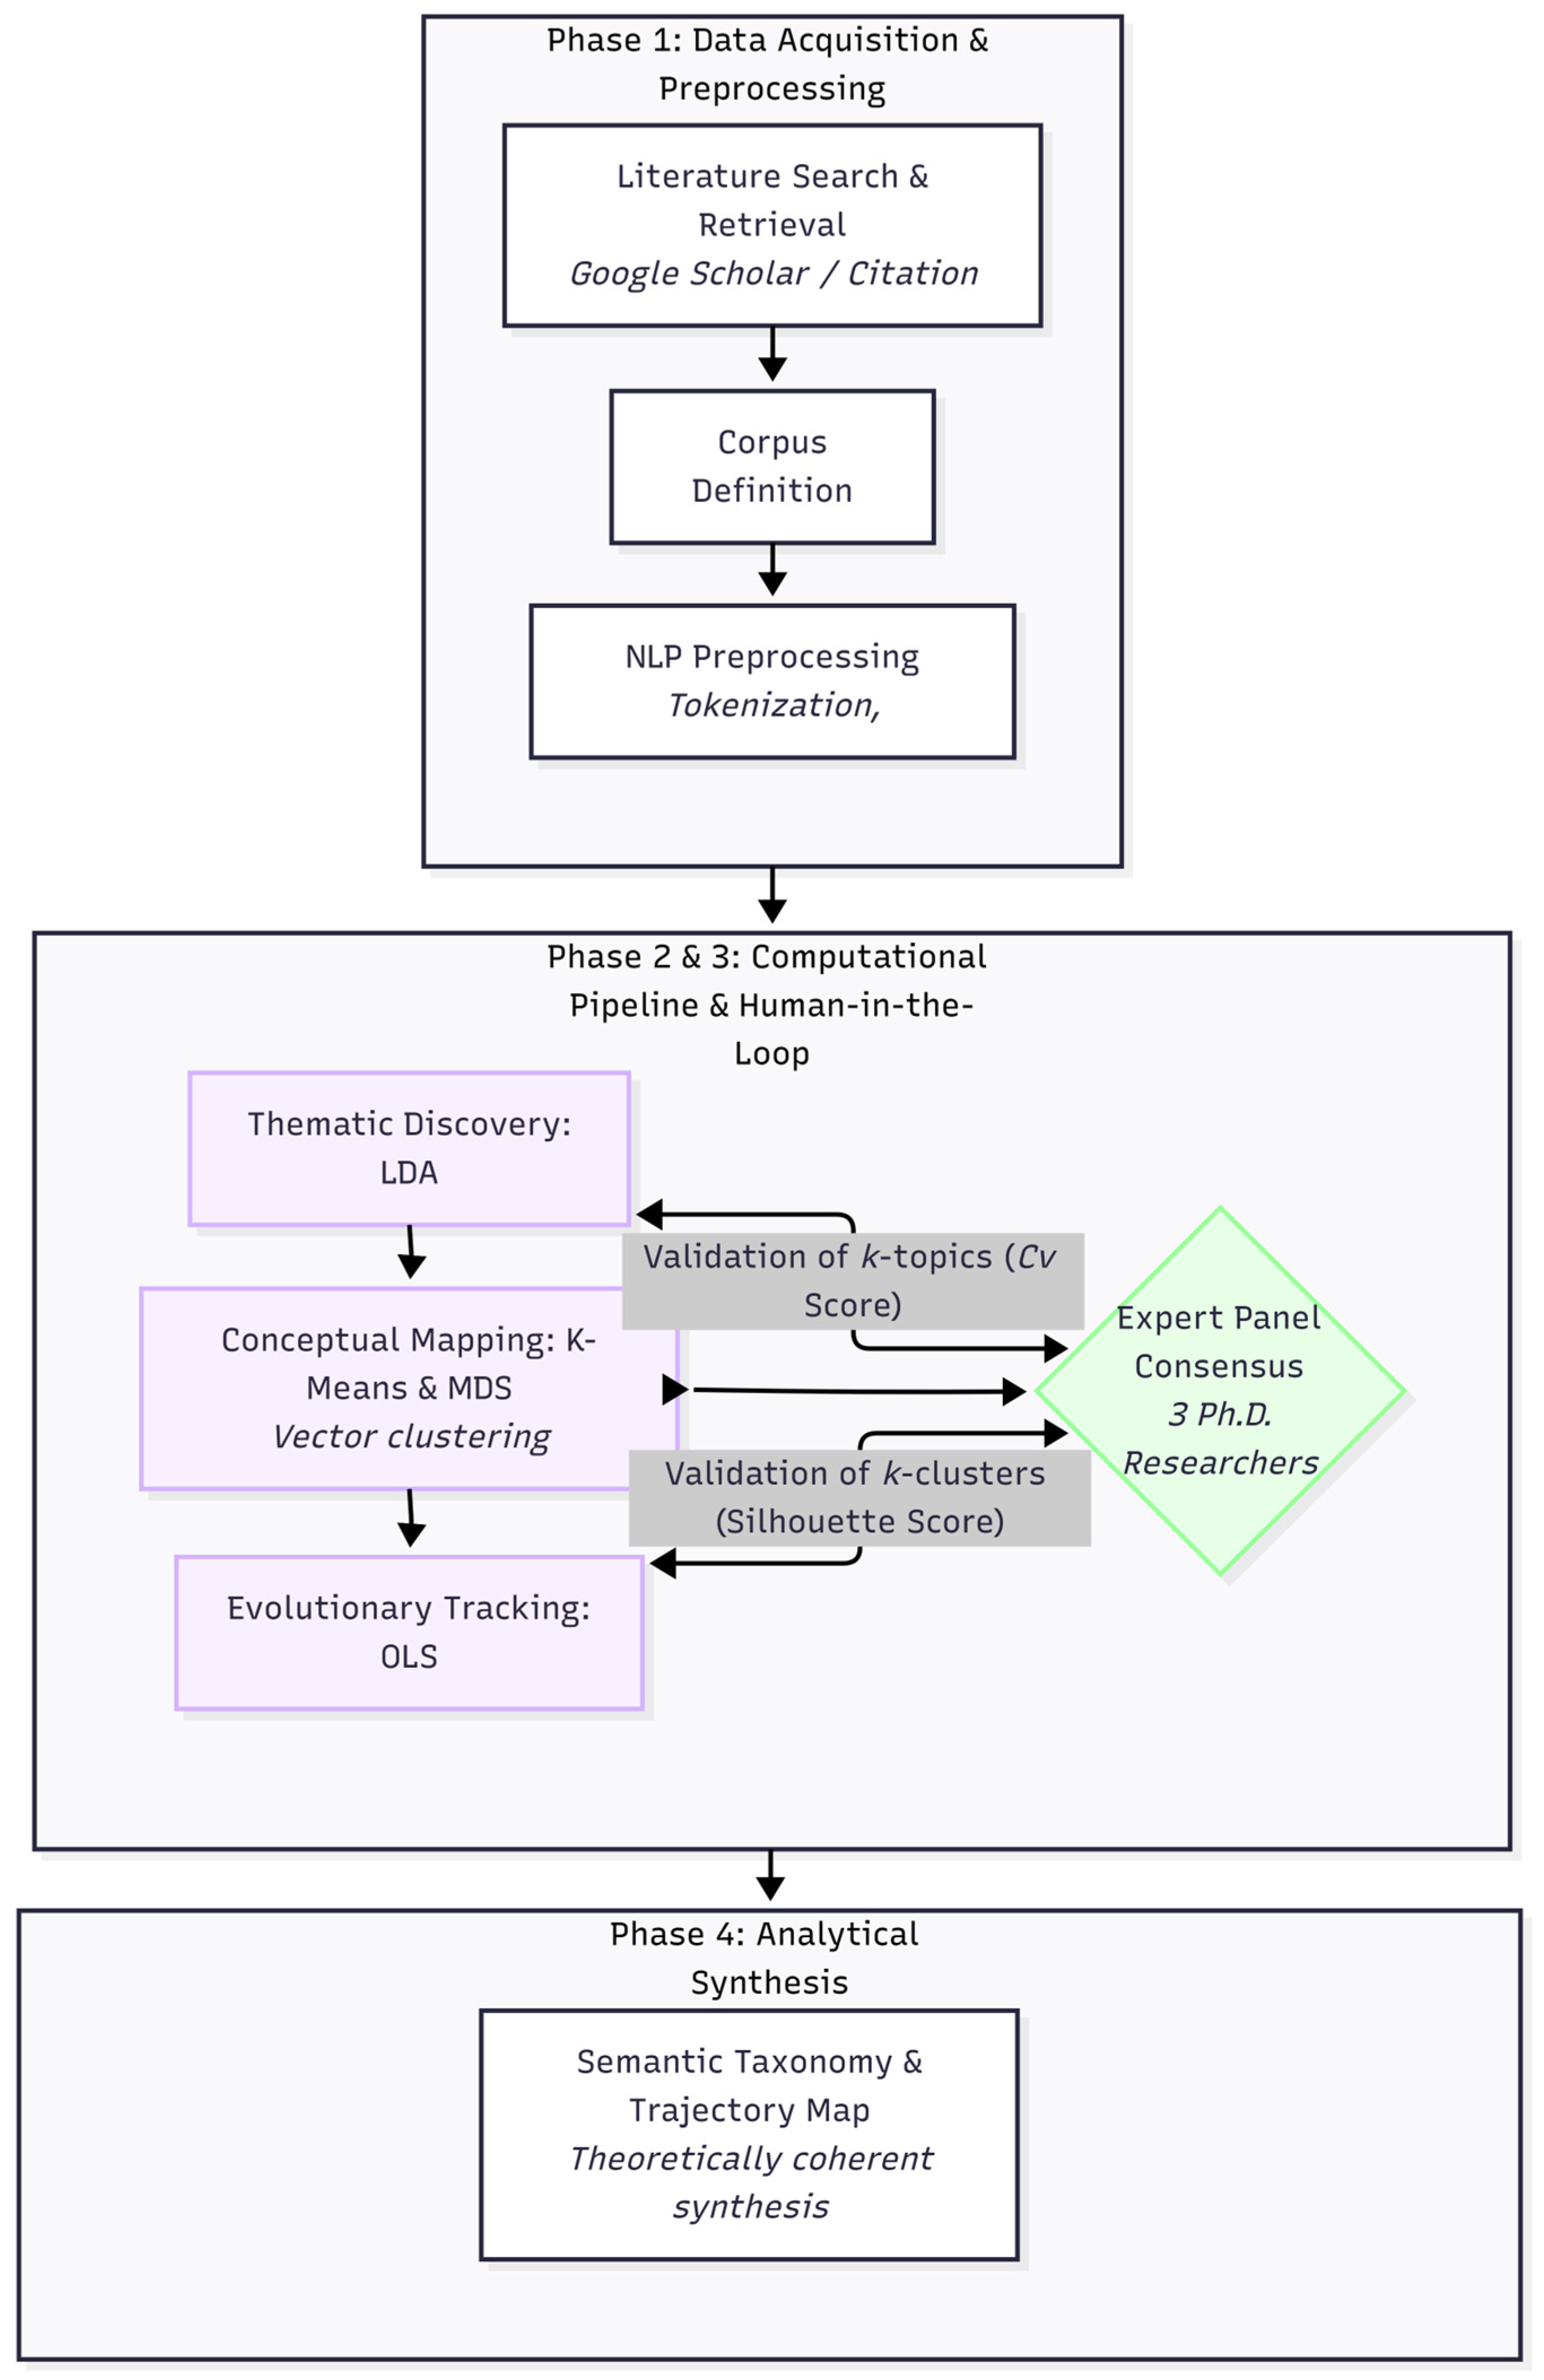
Figure 1 presents the high-level architecture of the CoLiRa framework. The methodology is depicted as a continuous, end-to-end analytical pipeline organized into three core phases: (1) Data Acquisition and Preprocessing, (2) the Computational Pipeline, which includes Latent Dirichlet Allocation (LDA), K-Means clustering, and Ordinary Least Squares (OLS) regression, (3) the Human-in-the-Loop Validation layer, and (4) Analytical Synthesis. The diagram emphasizes that the probabilistic outputs of the machine learning models are systematically audited by a panel of domain experts using quantitative metrics (Cv and Silhouette Score).
Figure 1.
CoLiRa Framework Architecture. The diagram presents the complete computational pipeline and emphasizes the human-in-the-loop validation layer, in which domain experts apply quantitative metrics to establish semantic consensus.
3.2. Literature Review
The literature review in this study was conducted using the methodology presented in [17], which essentially consists of the activities described below. This methodology was extended with some features of systematic literature reviews as outlined in [18].
3.2.1. Key Terms Definitions
A list of relevant terms within the scope of the literature review was established. Two key terms representing the objectives of the studies under consideration were identified: “semantic enrichment” and “semantic interpretation”. Additionally, two key terms related to the technologies employed for these objectives were specified: “semantic web” and “ontology”. Finally, the term “tabular data” was selected to denote the subject of the studies of interest.
3.2.2. Search String Definition
Once the key terms were established, they were combined using the Boolean operators AND and OR to define a search string. In this combination, some search criteria were considered synonyms of others, leading to the use of the logical operator OR. The result of this activity was the following search string:
“tabular data” AND (“semantic enrichment” OR “semantic interpretation”) AND (“semantic web” OR “ontology”).
3.2.3. Definition of Inclusion/Exclusion Criteria
A set of inclusion and exclusion criteria was established to filter the studies identified through the search process. These criteria excluded studies that: (1) were not published in English as journal articles or conference proceedings in scientific research between 2015 and 2025 (inclusive); (2) did not fully align with the objective of this review; or (3) had a focus differing from that of this review. The criteria pertaining to the objective and focus of the review are detailed in Table 1.
Table 1.
Initial revision Inclusion/Exclusion criteria.
3.2.4. Search and Inclusion/Exclusion of Initial Studies
The resulting search string was used in the academic search engine Google Scholar to manually retrieve relevant studies for this review, yielding a total of 444 results. These search results were filtered by selecting only those that corresponded to the 10 most-cited articles that strictly met the previously defined inclusion/exclusion criteria, thus establishing the set of initial studies for the review. For this purpose, each article was manually reviewed, starting with the abstract and introduction and, when necessary, proceeding to the content, results, and conclusions in cases where a decision could not be reached during the initial reading stage.
3.2.5. Expansion of the Initial Set of Studies
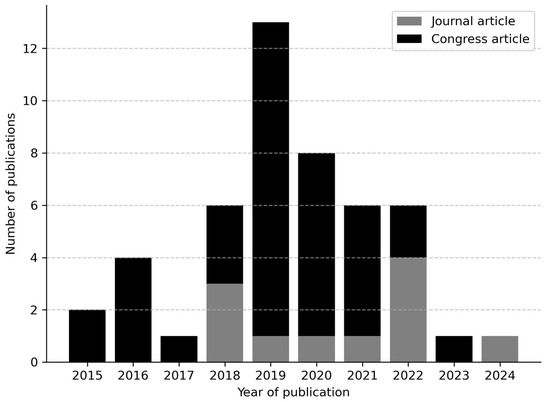
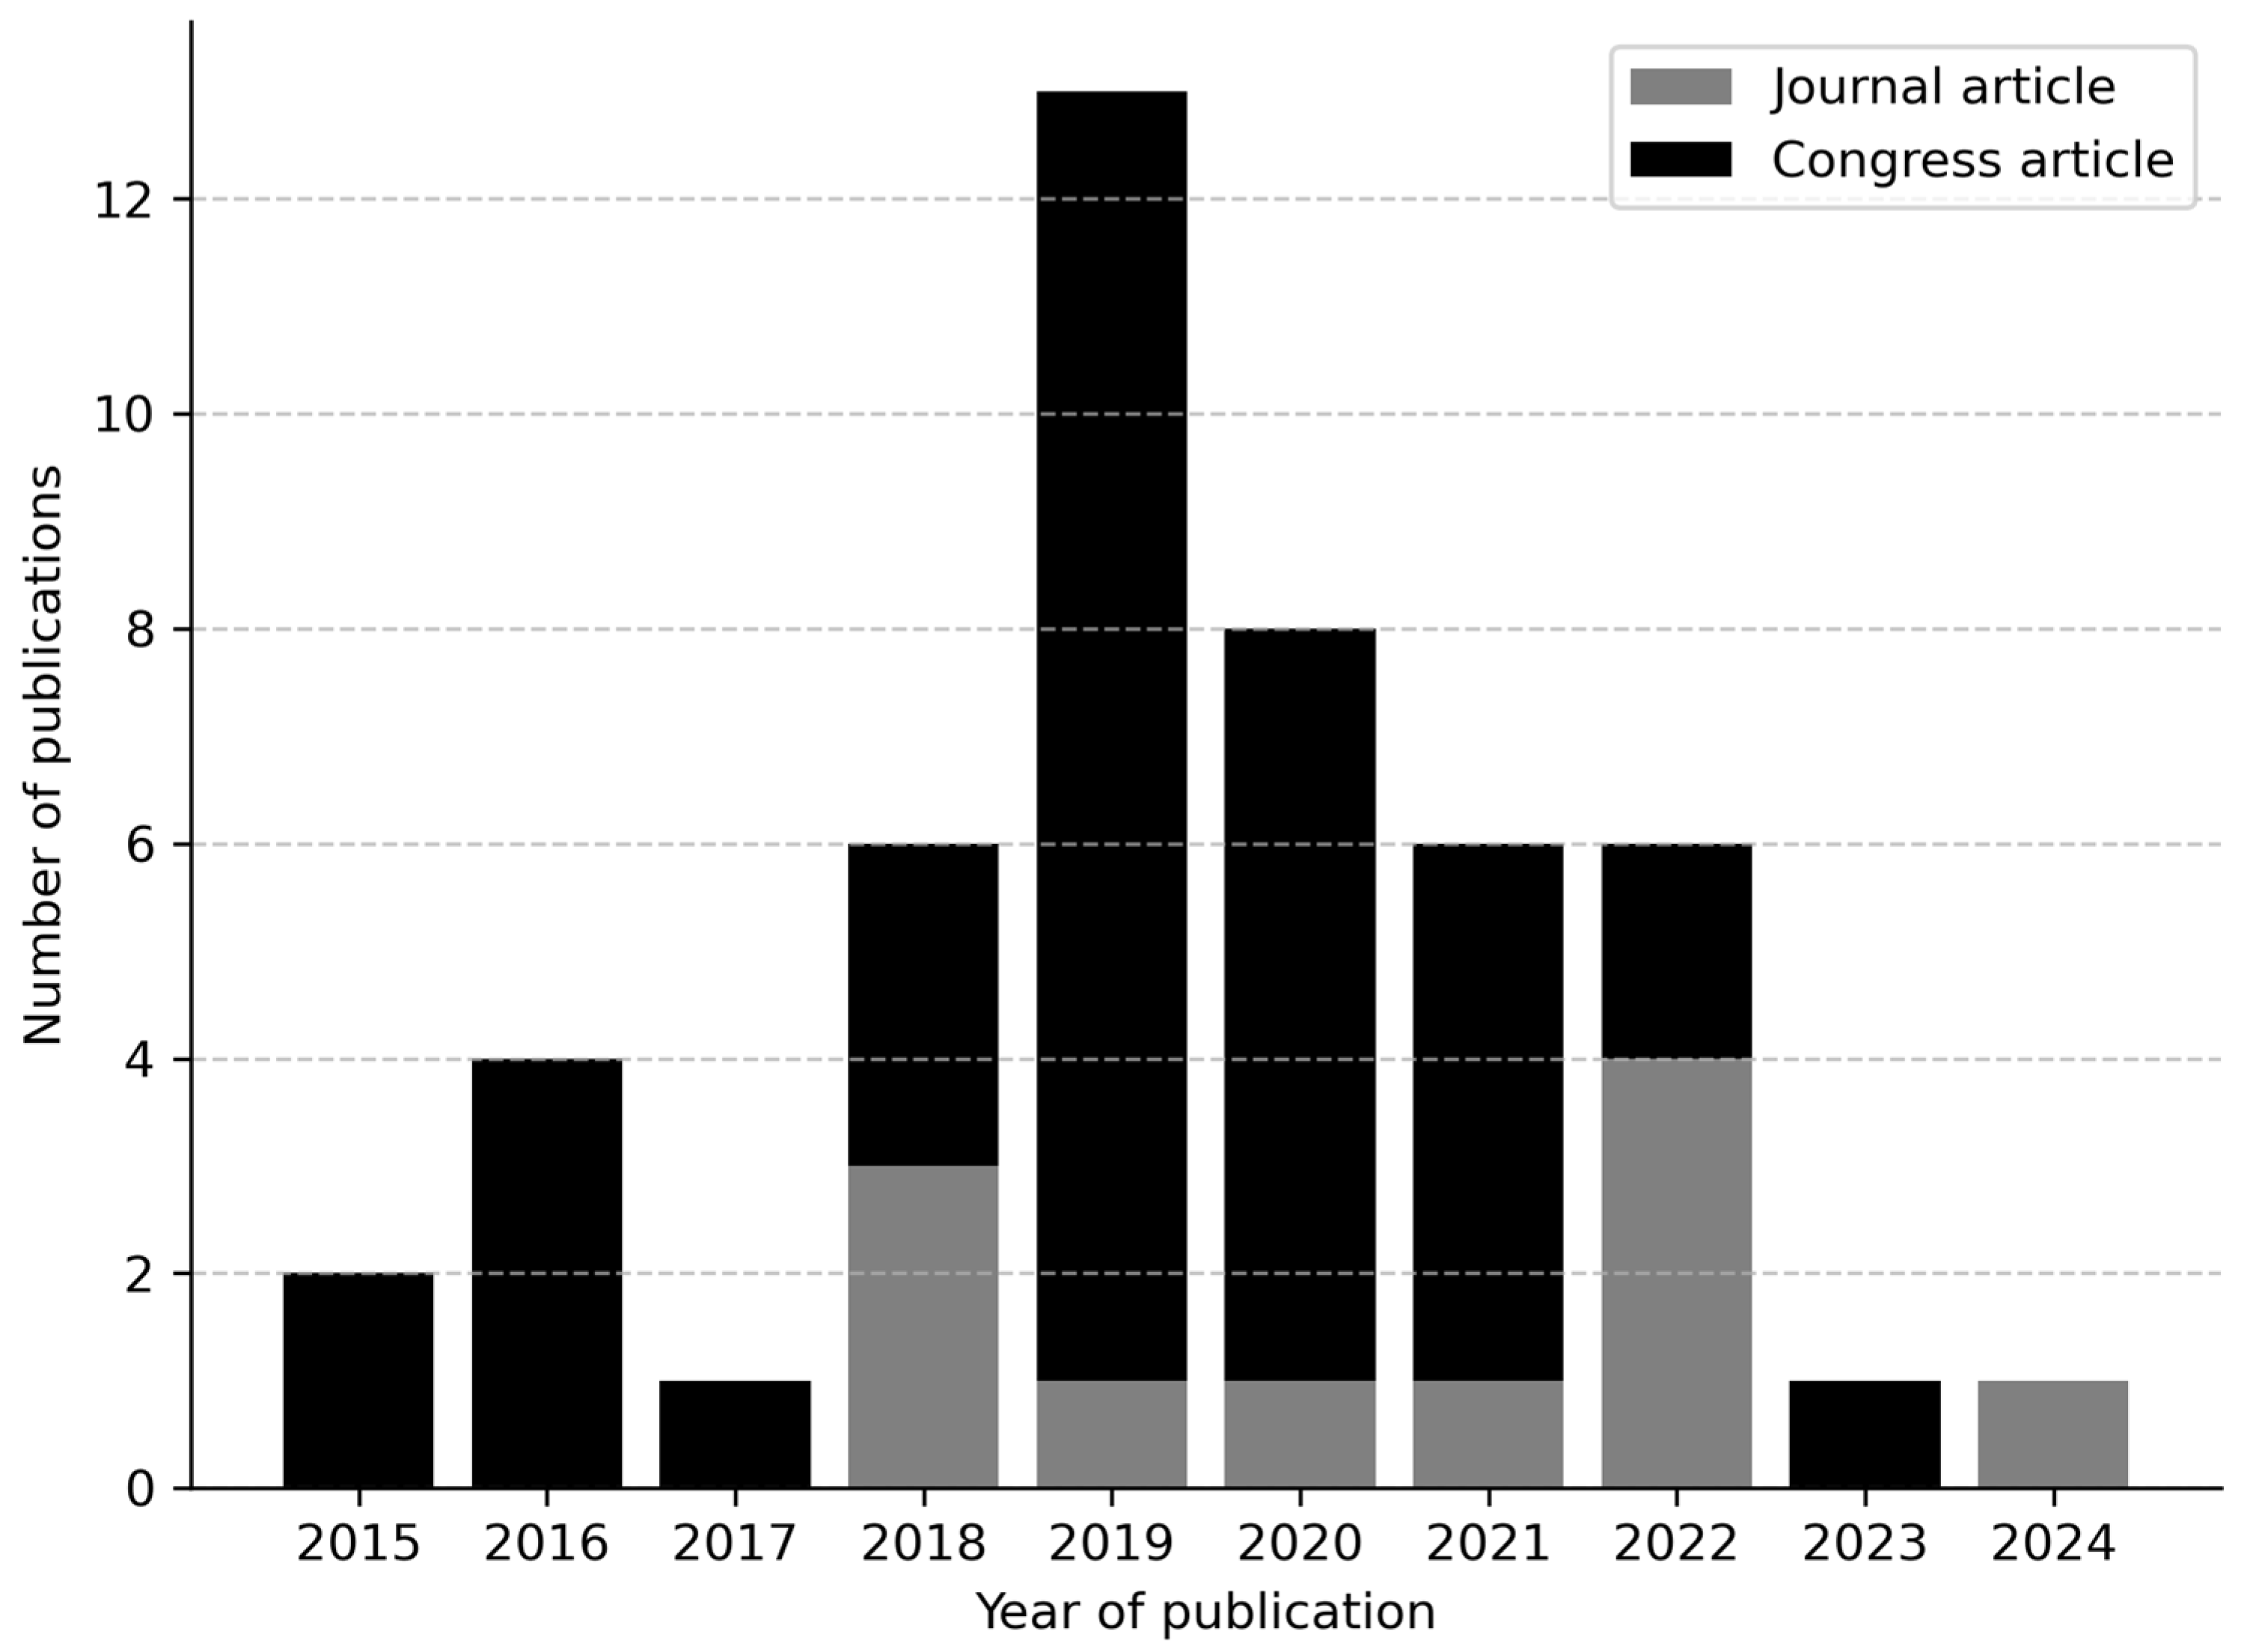
The initial set of studies was expanded using the same procedure as in the previous stage of the review. Specifically, the ten most-cited studies among those referenced by each initial study were selected, provided they met the review’s inclusion and exclusion criteria. This process yielded a total of 48 studies, comprising 11 journal articles and 37 conference papers. Figure 2 presents the distribution of publication years for all selected studies, categorized as either journal articles or conference papers.
Figure 2.
Distribution of publication years and document types for the selected corpus (n = 48). The bar chart illustrates the chronological progression of research, categorized by journal articles and conference proceedings, highlighting the increased scholarly activity from 2018 onwards.
Figure 2 demonstrates that the selected corpus (n = 48) exhibits a significant concentration of publications from 2018 onwards, with a pronounced peak in 2021 and 2022. This trend indicates that the CoLiRa framework assesses a period characterized by heightened activity and recent consolidation in advancements related to the semantic enrichment of tabular data. Furthermore, the distribution reveals a predominant focus on conference proceedings, a pattern typical of rapidly evolving computer science disciplines, complemented by peer-reviewed journal articles. This combination ensures both the relevance and the quality of the literature underpinning the framework.
3.3. Topic Modeling
The initial phase of the computational analysis methodology applied a topic modeling approach using the Latent Dirichlet Allocation (LDA) technique to automatically analyze the selected studies [19]. A Python (version 3.11.3) script was developed for this purpose (File S1), primarily employing the Scikit-learn machine-learning library (version 1.2.2), the Matplotlib visualization library (version 3.7.1), and the Natural Language Toolkit (NLTK, version 3.7); all required libraries are listed in File S2. The analysis was restricted to the abstracts of the articles, which were manually collected and supplied as input documents for the script (File S3).
Specifically, from this corpus of documents, an LDA model was trained, enabling the identification of three abstract topics within the abstracts of the analyzed articles by calculating the probabilities of words belonging to one of the three topics. In this study, the number of topics (k) was experimentally set to three and corroborated by domain experts: different parameters were tested, and the coherence of the resulting topics in each case was analyzed, determined by their 10 most representative words. Additionally, the balance in the classification of abstracts across the resulting topics was taken into account.
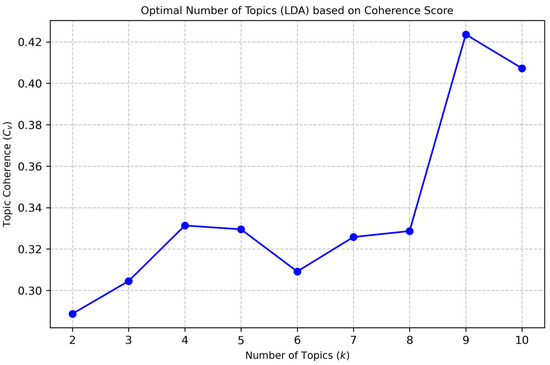
To address subjectivity in parameter selection, the Topic Coherence score (Cv) was computed for the Latent Dirichlet Allocation (LDA) model. The quantitative results (Figure 3) indicated a peak at k = 9 (Cv ≈ 0.425). However, parameter selection was ultimately guided by a rigorous, two-step qualitative validation protocol conducted by a panel of three domain experts (one holding a Ph.D. in Engineering Sciences and two holding Ph.D. degrees in Informatics). Initially, each expert independently reviewed the algorithmic outputs and quantitative metrics (e.g., Cv and Silhouette scores). They then convened in a joint session to address interpretative discrepancies and refine thematic boundaries.
Figure 3.
Topic Coherence (Cv) score across different numbers of latent topics (k) for the LDA model. While the absolute mathematical peak occurs at k = 9, the parameter was set to k = 3 based on expert consensus to capture macro-level theoretical streams and avoid semantic hyper-fragmentation.
During this consensus-based discussion, the panel concluded that nine topics resulted in excessive granularity, fragmenting the literature into micro-themes rather than representing the primary structural pillars of the field. The experts reached full consensus that k = 3 more effectively captured the core macro-level theoretical streams of the research domain without unnecessary subdivisions. Consequently, k = 3 was selected. This outcome underscores the importance of CoLiRa’s human-in-the-loop architecture: while quantitative metrics inform parameter exploration, final decisions depend on domain expertise to ensure theoretical interpretability takes precedence over algorithmic granularity.
It is worth noting that the implementation of the LDA technique in the Scikit-learn package is based on the Online Variational Bayes algorithm [20]. For the doc_topic_prior (alpha) and topic_word_prior (beta) parameters the library’s default values were used; similarly, the random_state parameter was set to 42 for reproducibility.
Once the LDA model was trained, it was possible to classify the abstracts of the articles in the final set of studies for this review, estimating a document-topic distribution.
The literature was limited to articles published up to December 2024 to ensure statistical consistency across complete annual cycles, which is essential for the linear regression analysis of historical development trends. The CoLiRa framework relies on unsupervised machine learning algorithms such as LDA and K-Means to map the conceptual structure. Consequently, the dataset must represent a fixed and consolidated snapshot of the field. Including the literature from 2025 onward would alter the mathematical vector space and shift cluster centroids, thereby complicating methodological validation. The primary contribution of this study is the introduction and reproducibility of the computational framework, with the semantic enrichment of tabular data serving as a case study.
3.4. Cluster Analysis
Furthermore, to analyze the conceptual structure of the research field, a cluster analysis was performed on the most frequent key terms from the document corpus using the Scikit-learn and Matplotlib libraries. For this purpose, a dissimilarity matrix (1—cosine similarity) was constructed between the most frequent terms.
Subsequently, Multidimensional Scaling (MDS) was employed to project each key term into a 2D space, setting the random_state parameter to 0 for reproducibility. Then, the K-Means algorithm was applied to group these points into clusters.
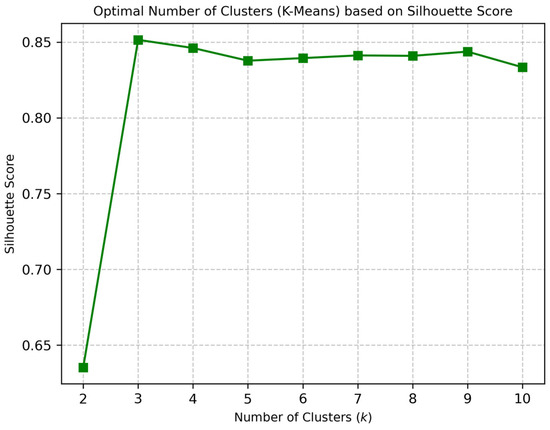
To establish a quantitative basis for K-Means clustering parameter selection, the Silhouette Score was calculated for k values ranging from 2 to 10 (Figure 4). Quantitative analysis revealed a mathematical peak at k = 3 (Silhouette Score > 0.85). However, qualitative validation by domain experts indicated that a three-cluster division resulted in overly broad macro-categories, obscuring critical theoretical sub-fields within the literature. Consequently, k = 5 was identified as the optimal configuration. At k = 5, the model maintains an exceptionally high Silhouette Score (≈0.83), reflecting well-separated and cohesive clusters while providing the necessary theoretical granularity to accurately represent the research ecosystem. This outcome highlights CoLiRa’s hybrid methodology, which employs algorithmic cohesion metrics as a baseline and incorporates human-in-the-loop validation to ensure theoretical interpretability.
Figure 4.
Silhouette Score evaluation for K-Means clustering across various values of k. A highly robust score (≈0.83) is maintained at k = 5, which was selected over the mathematical peak (k = 3) to provide the necessary conceptual granularity for mapping distinct thematic neighborhoods.
Additionally, for the n_init and max_iter parameters, the values 10 and the library’s default were used, respectively. Similarly, the random_state parameter was set to 0 for reproducibility.
3.5. Analysis of Development Trends
To identify development trends in the modeled topics, an ordinary least squares (OLS) linear regression model was fitted to each topic. The years under study were used as the independent variable, while the dependent variable was the log-transformed topic prevalence (log(y+1)), which stabilized variance and addressed heteroscedasticity observed in the initial model residuals. Model validity was assessed by examining residual versus fitted value plots for homoscedasticity, Q-Q plots for normality, and the Durbin-Watson statistic for autocorrelation. All analyses were conducted using the statsmodels library in Python.
4. Results
The results of the document-topic distribution estimation are summarized in Table 2, which classifies the 48 final studies across the three identified topics.
Table 2.
Classification of the final studies in the revealed topics.
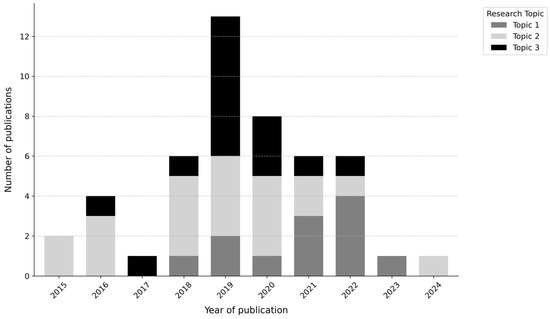
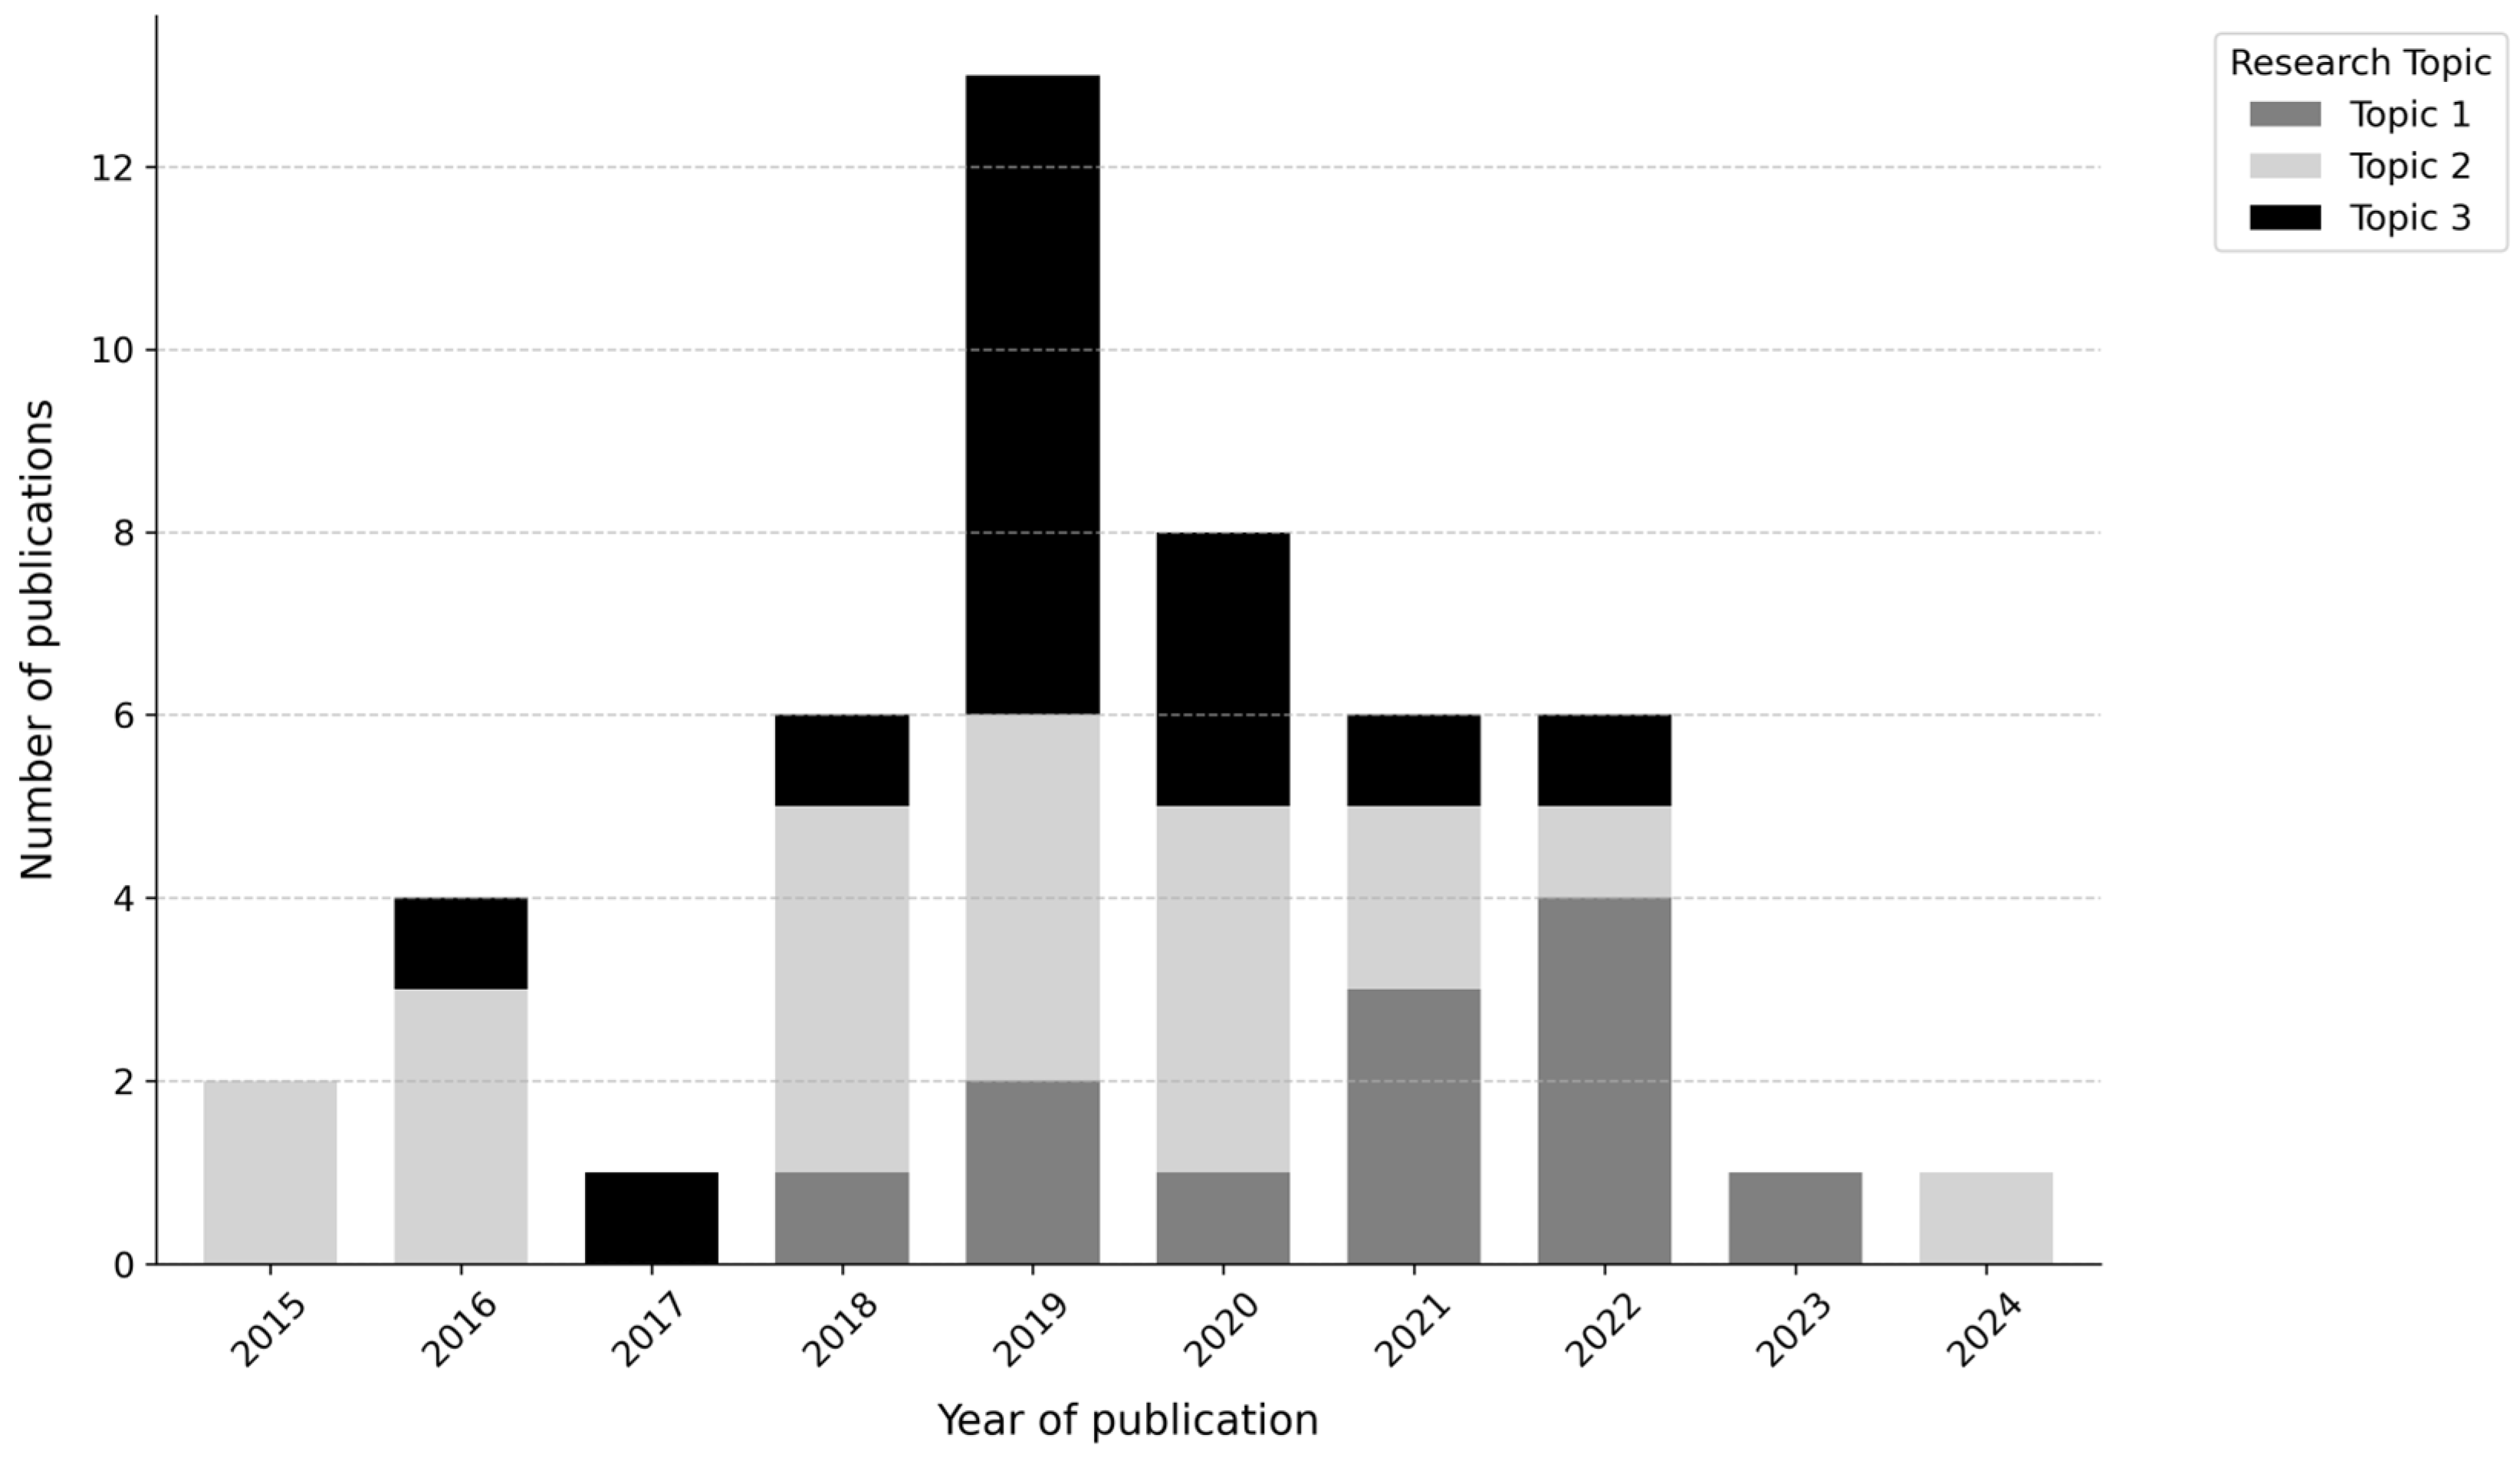
To visualize the temporal development of these themes—a key component of our trend analysis—a stacked bar chart illustrating the annual distribution of topics is presented in Figure 5. This chart plots the number of publications per year, segmented by the corresponding topic.
Figure 5.
Temporal distribution of research topics. The stacked bar chart shows the absolute number of publications (Y-axis) for each of the three identified research topics (Topic 1, Topic 2, and Topic 3) per year of publication (X-axis).
It can be observed that the total volume of publications changed over time, peaking in 2019 (consistent with the data in Figure 2). However, the relative prevalence of the three topics remains visibly stable throughout the period analyzed. This visualization clearly supports the findings of the OLS regression (Table 3), which found no statistically significant shift in research focus.
Table 3.
Trend analysis of the revealed topics.
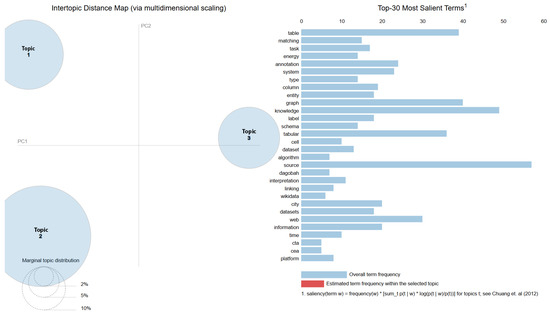
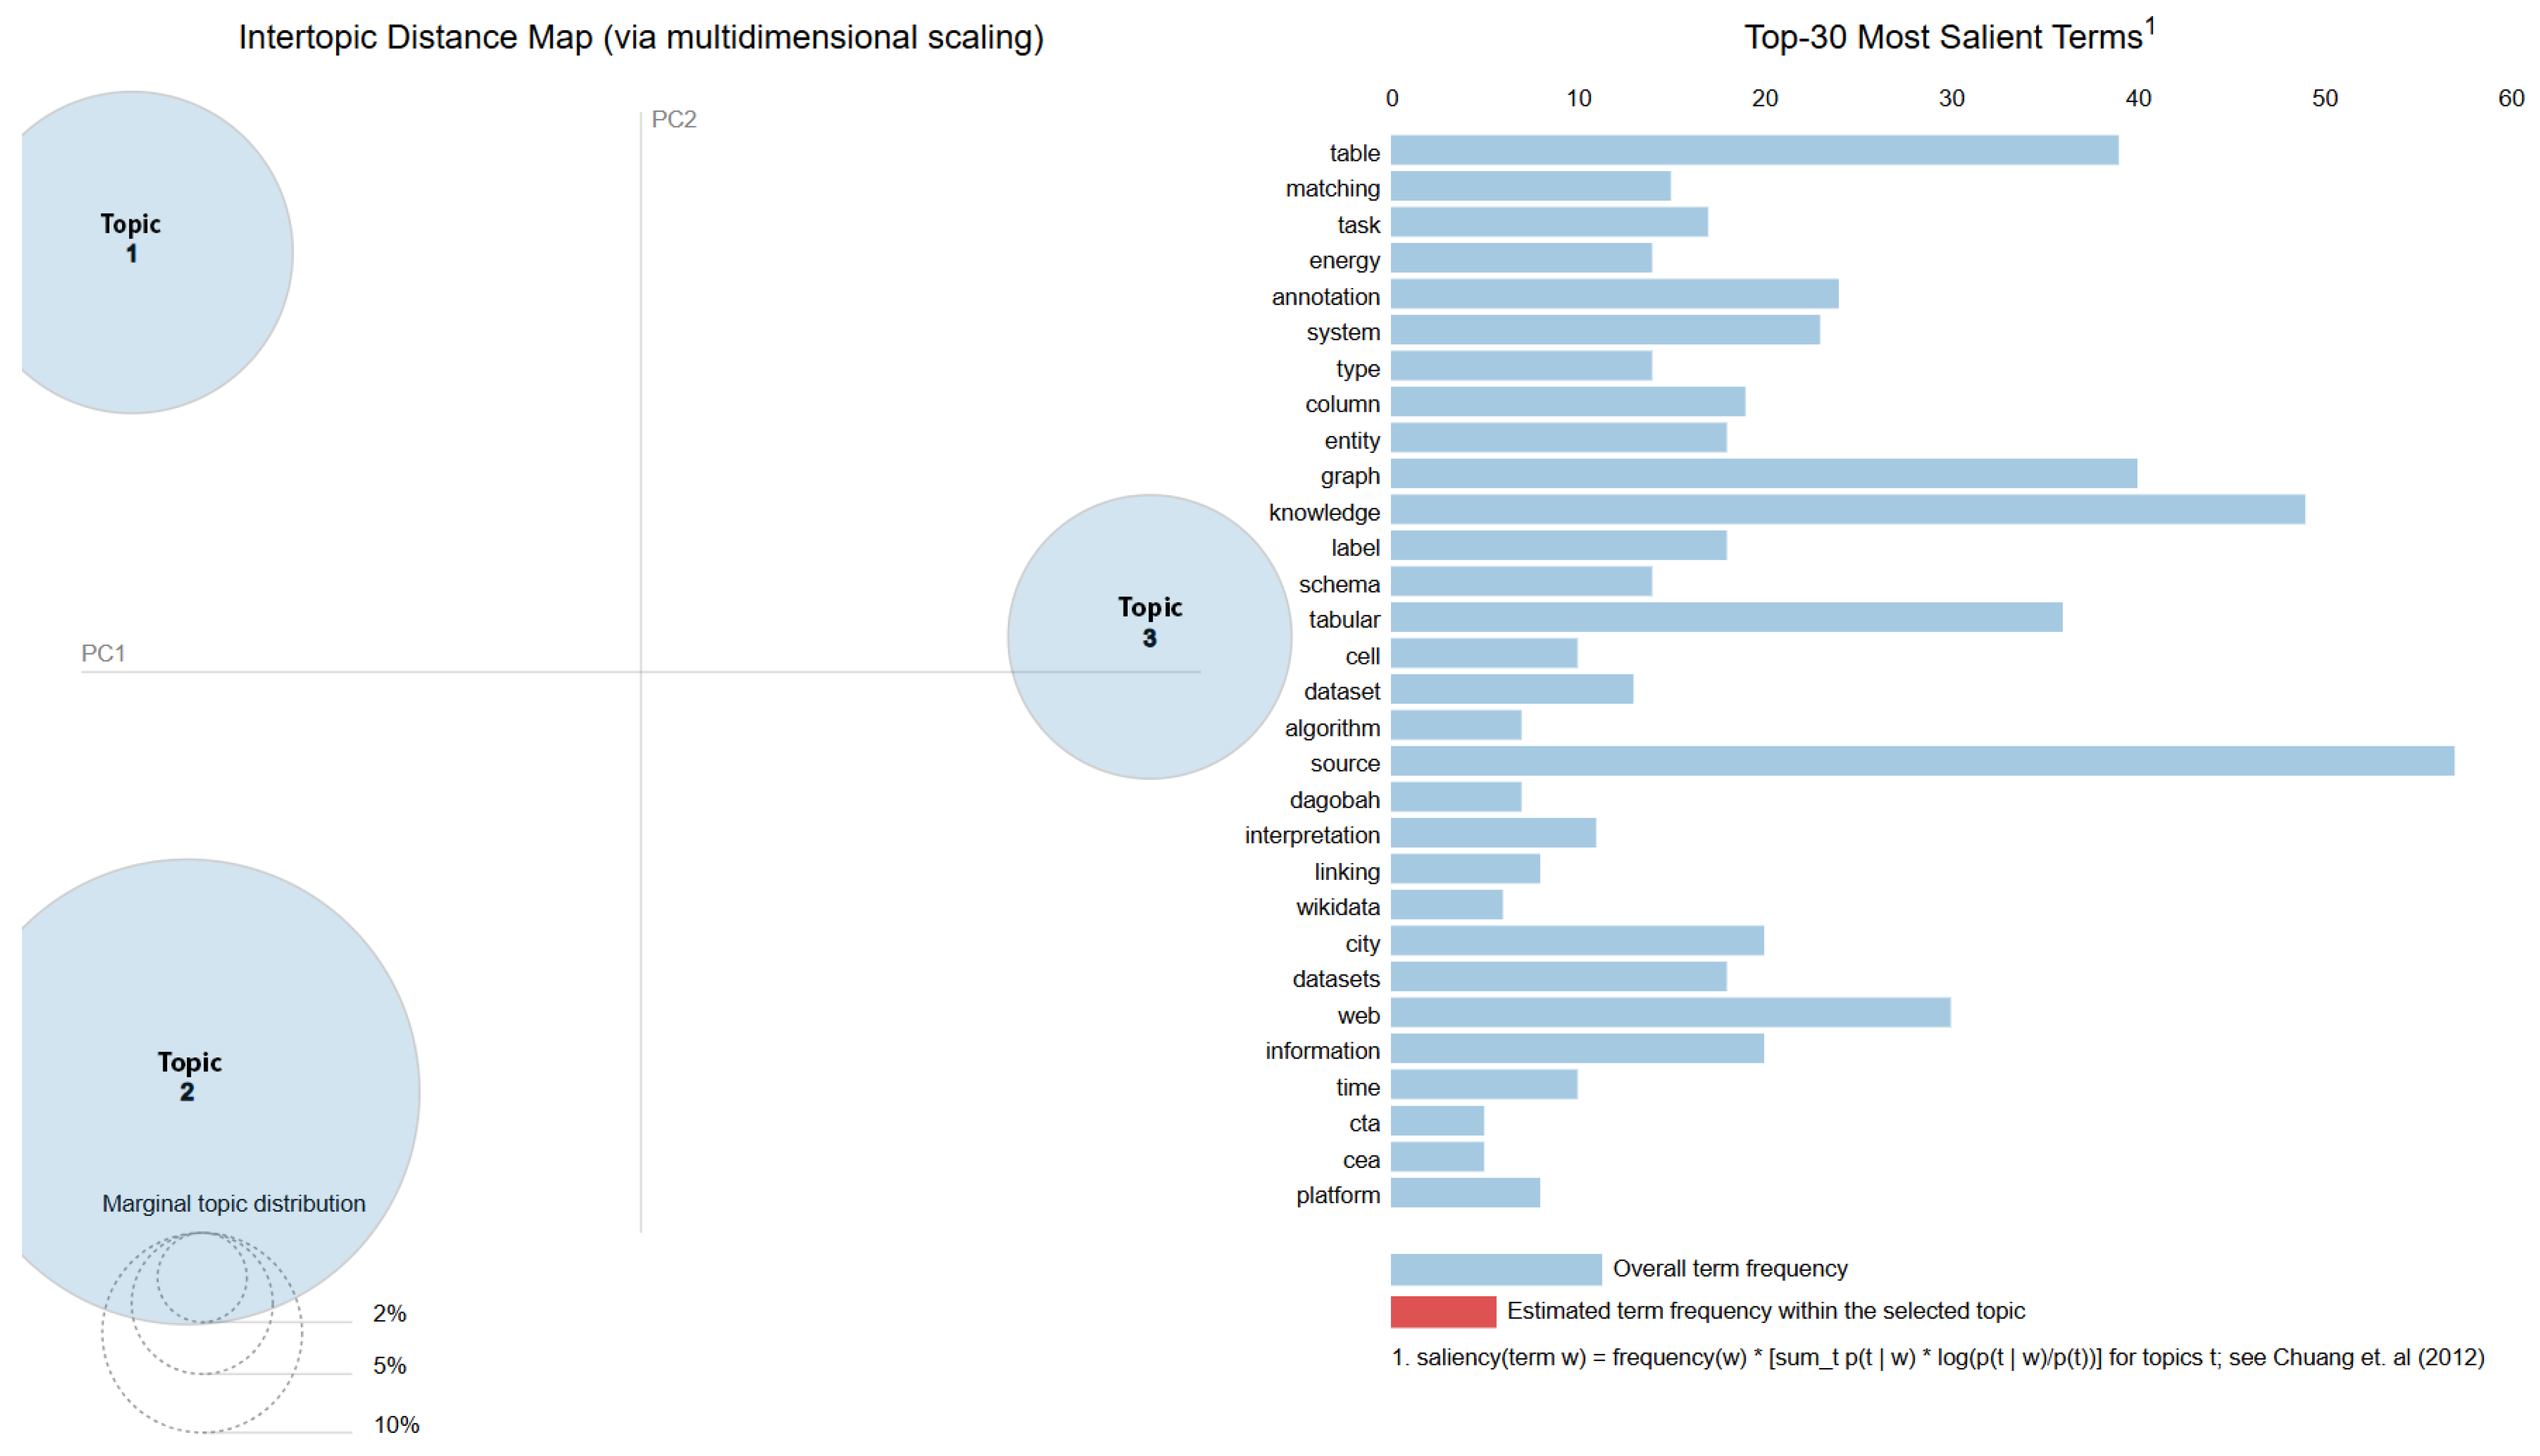
To provide a holistic view of the field’s conceptual topology and assess the independence of the identified research themes, we generated an Inter-topic Distance Map (see Figure 6).
Figure 6.
Inter-topic distance map. The left panel visualizes the semantic relationship between the identified topics in a two-dimensional space using MDS. The size of each bubble represents the marginal topic distribution (prevalence) within the corpus. The distance between bubbles indicates semantic dissimilarity. The right panel displays the top 30 most relevant terms for the entire corpus, ranked by their saliency, providing an overview of the field’s aggregate vocabulary before topic-specific segmentation. The superscript ‘1’ and the subsequent label ‘1’ in the lower-right corner denote the mathematical formula used for calculating the saliency of the terms. See Chuang et al. (2012) [69] for more information regarding this formula.
As illustrated in the Inter-topic Distance Map (Figure 6), the analysis identified three distinct research topics. The spatial separation between the bubbles in the left panel shows that these topics are semantically distinct (with minimal conceptual overlap). Topic 2 represented by the largest bubble dominates the corpus and makes up 54% of the tokens. Topic 1 and Topic 3 show strong independence, accounting for 25.9% and 20.1% of the tokens, respectively.
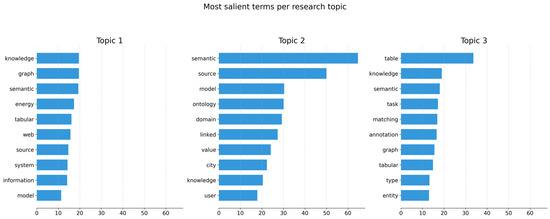
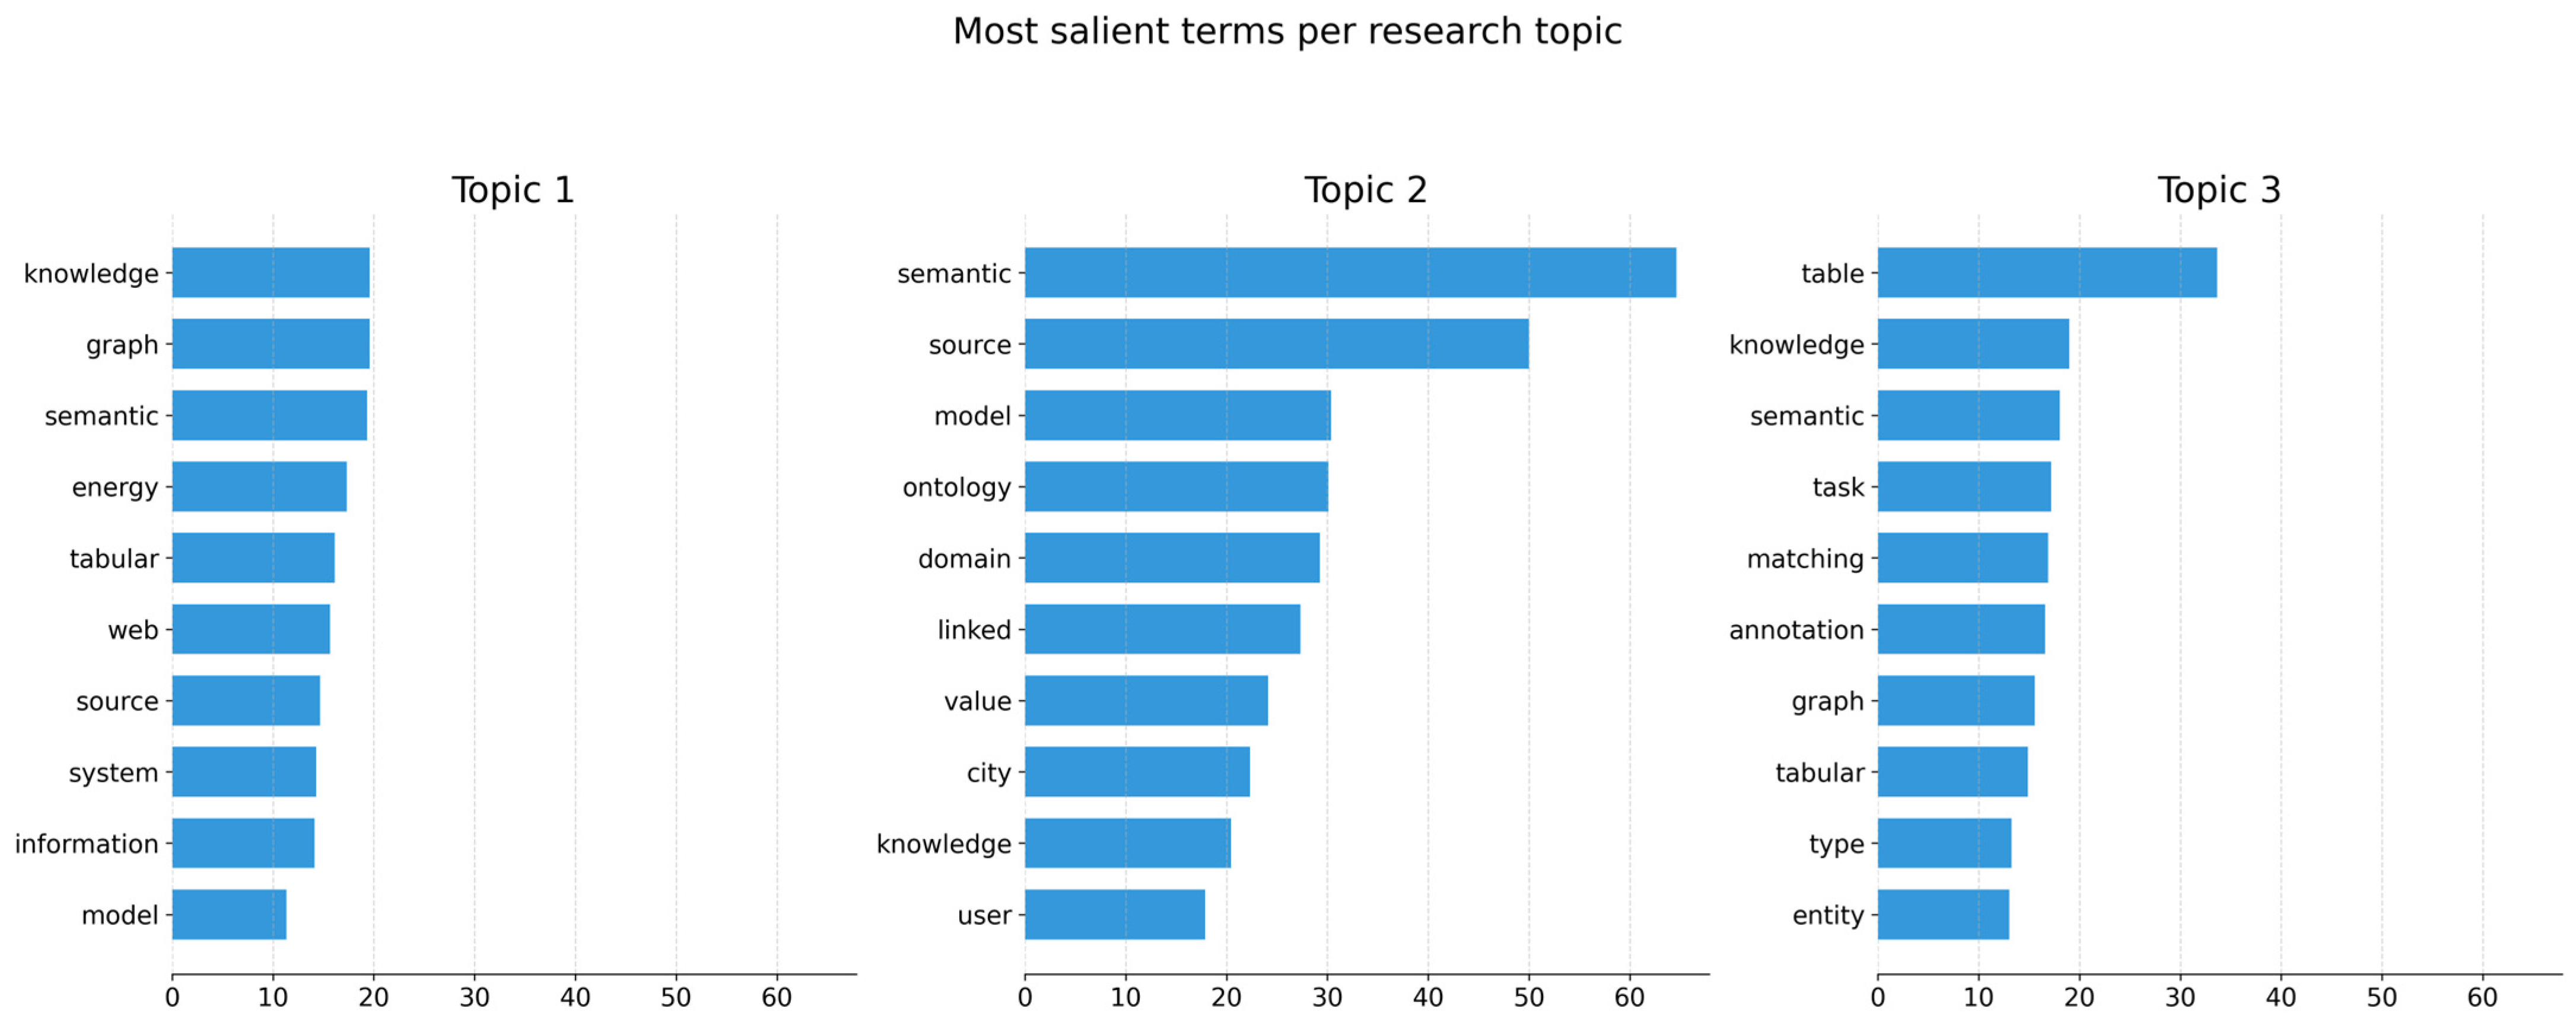
Additionally, Figure 7 shows the 10 most representative words selected for each topic found by the trained LDA model, specifically, the 10 words with the highest probabilities of belonging to each of the three topics identified.
Figure 7.
Top-10 most salient terms for each research topic. Horizontal bars represent the importance weight of each term within its respective topic.
It can be observed that “Topic 1” (left) is mainly characterized by terms like “knowledge”, “graph” and “semantic”, “Topic 2” (center) is built upon terms such as “source”, “model” and “ontology”, and “Topic 3” (right) is characterized by terms like “table”, “knowledge” and “task”.
Based on the domain experts’ interpretation of the key terms presented in Figure 7, the following conclusions were reached:
- The core concepts and systems for information modeling appear to be represented by the first category of studies, labeled as “Topic 1”. Key terms such as “model”, “information”, “system”, “semantic”, “graph” and “knowledge” point to the foundational elements of representing and managing structured data. The inclusion of key terms like “source”, “web” and “tabular” places these concepts within the context of web and tabular data sources. The appearance of the key term “energy” is particularly notable, since it indicates that a significant piece of these studies applies these concepts to a specific domain, namely, the energy sector. In essence, this topic captures the foundational aspects of semantic enrichment.
- The second category of studies, labeled as “Topic 2”, is clearly focused on domain-specific applications and value generation. The inclusion of key terms like “user”, “city” and “value” indicates a strong emphasis on the practical utility and the end-user of these technologies, often in contexts like smart cities. The combination of key terms like “linked”, “ontology” and “domain” suggests that this topic encompasses research that uses Linked Data principles and domain-specific ontologies to create tangible value for users. Thus, this topic highlights the applied aspect of semantic enrichment and shows its direct impact in specific areas.
- The technical processes and tasks of tabular data annotation appear to be represented by the third category of studies, labeled as “Topic 3”. The key terms “entity”, “type”, “annotation”, “matching”, “task”, “table” and “tabular” form a cohesive and highly specialized body of literature that describes the “how-to” of the semantic enrichment process. In essence, this topic is about the specific and granular operations involved in linking entities and assigning types to data within data tables, often with the goal of mapping them to some knowledge “graph”.
Thus, while Topic 1 lays the conceptual groundwork and Topic 2 explores practical applications, Topic 3 provides a detailed view of the methodological and algorithmic challenges of implementing semantic annotation.
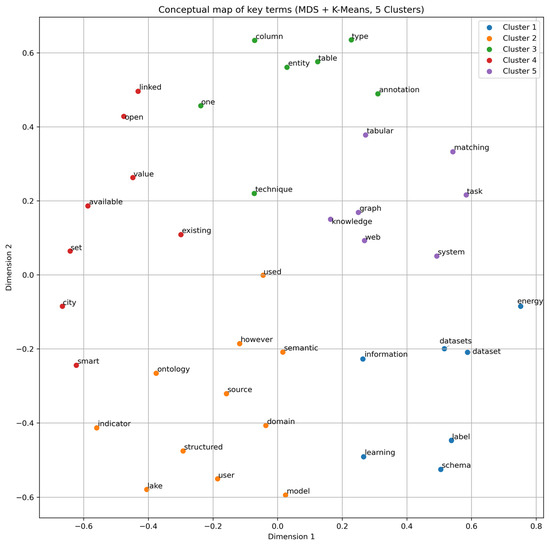
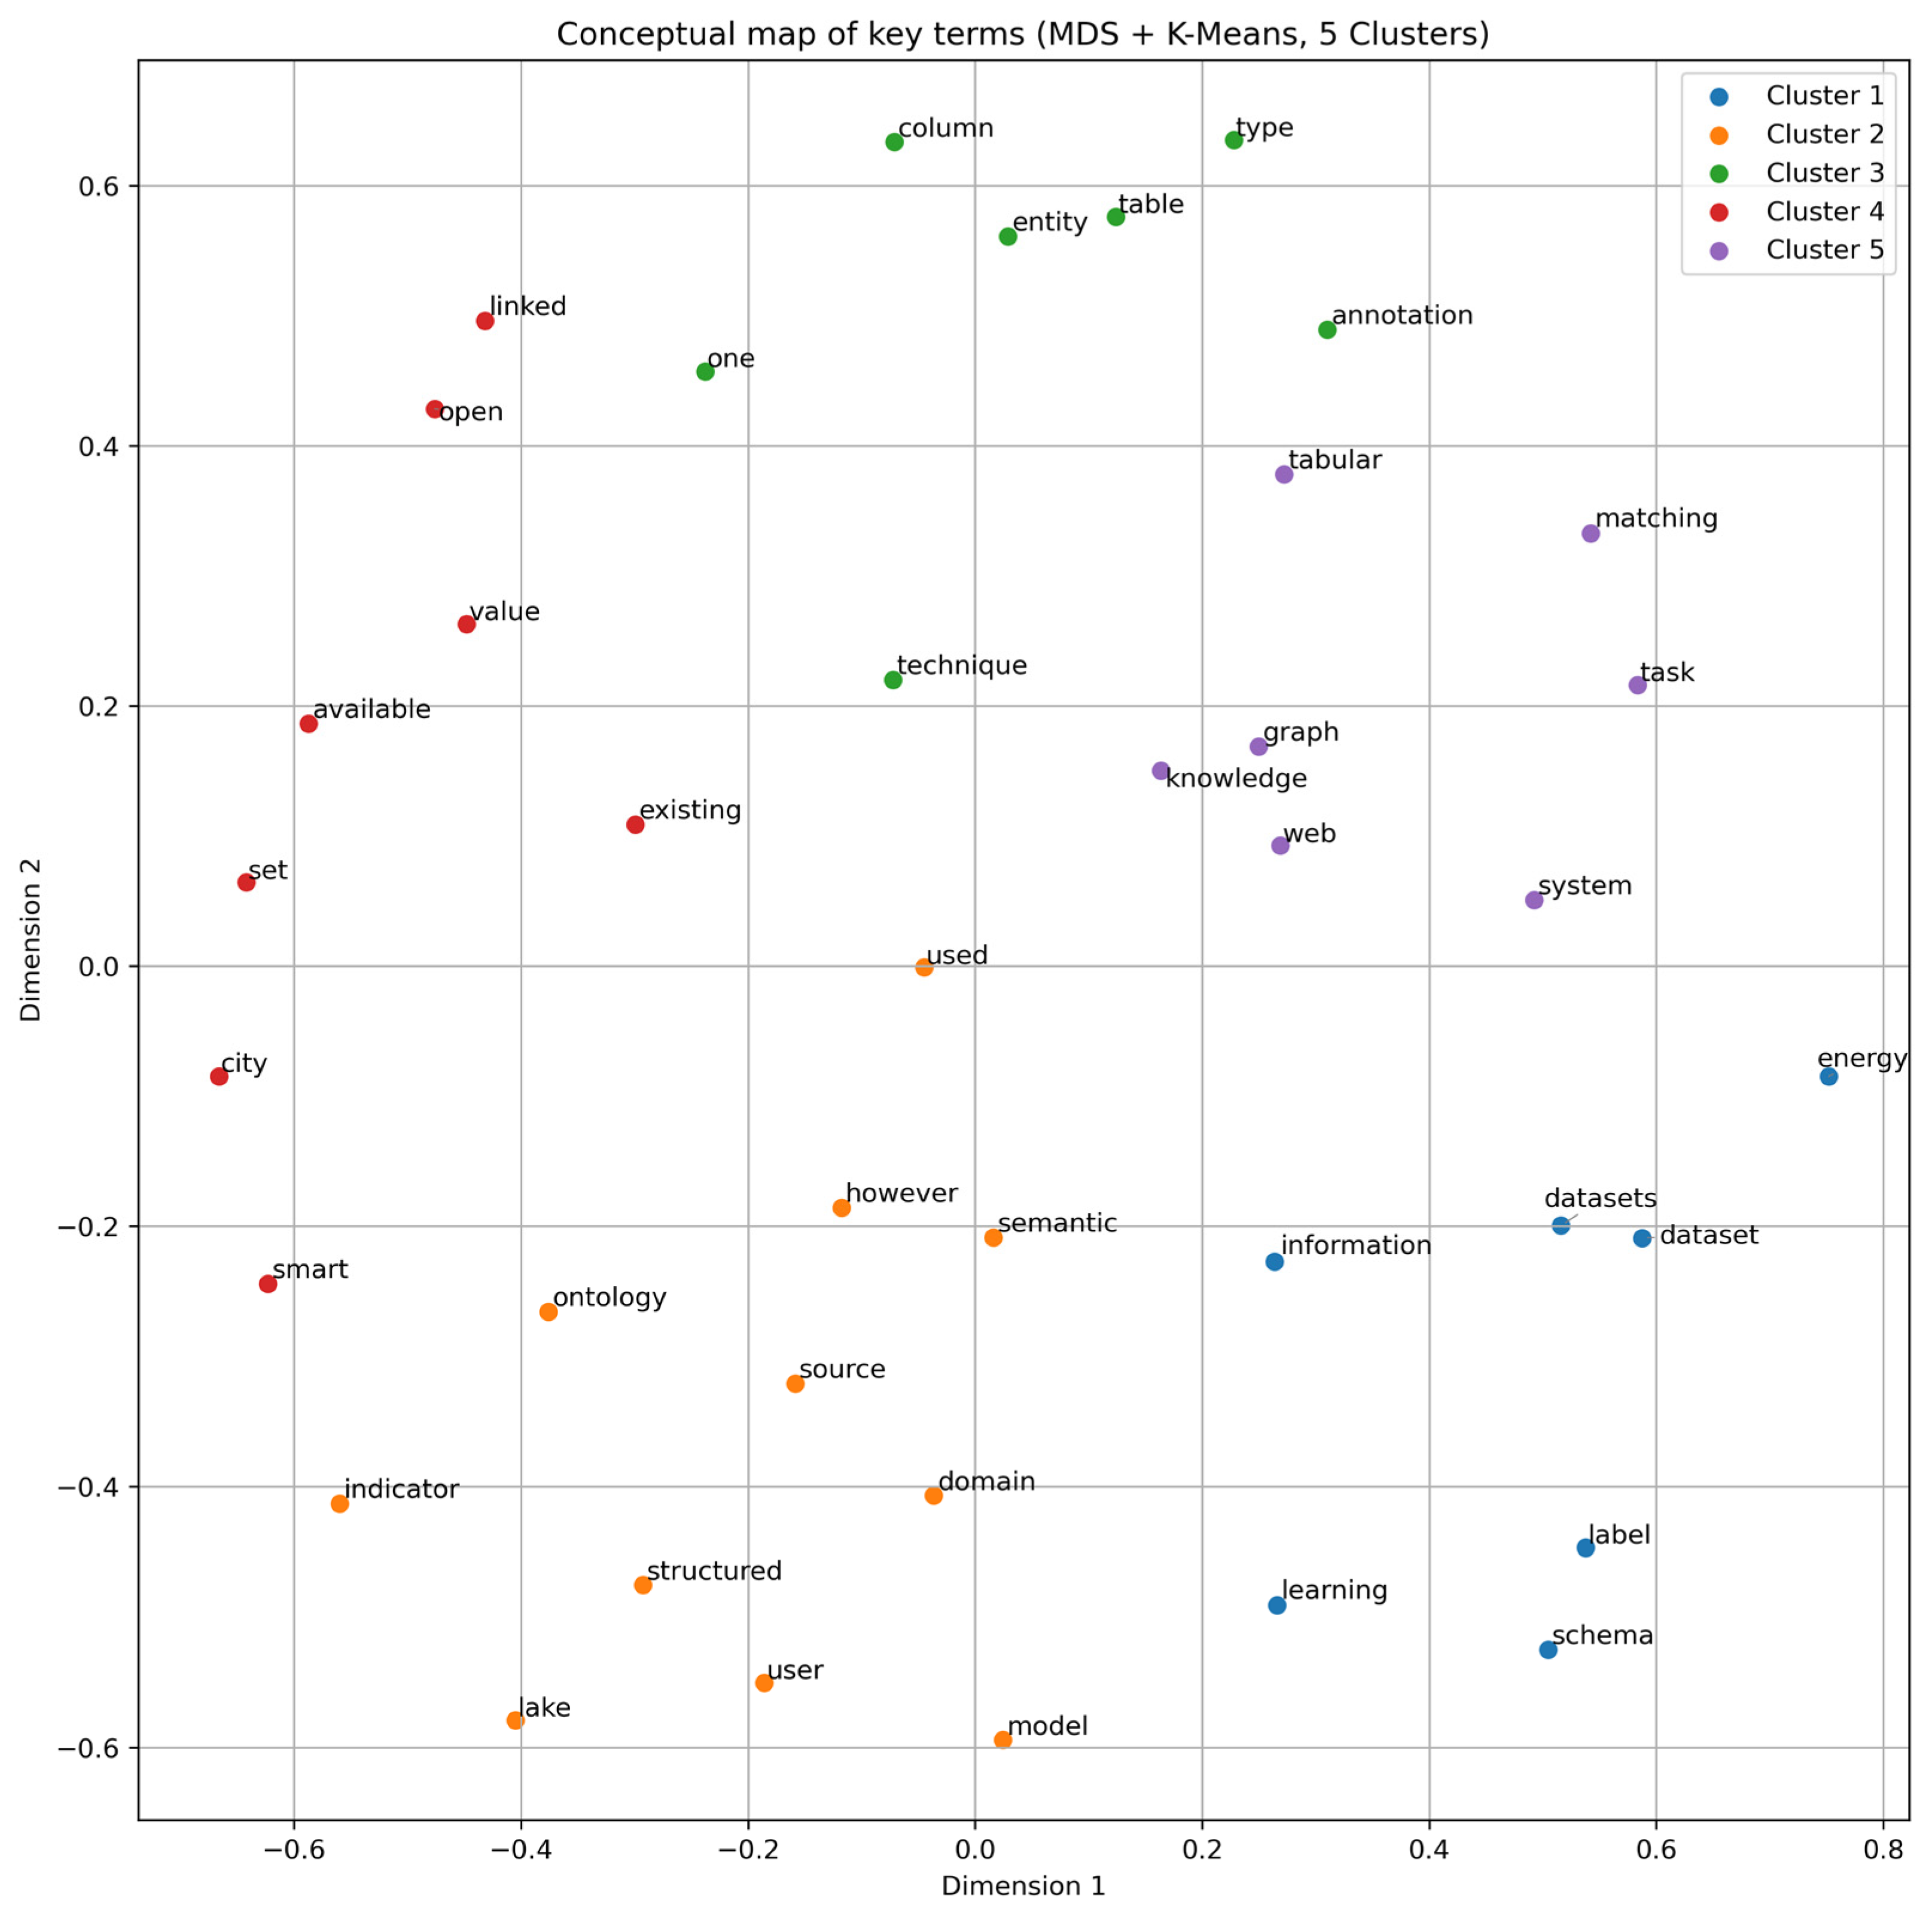
In addition to the topic modeling analysis, a conceptual map was generated to visualize the relationships among individual key terms. While LDA identified broad thematic categories, the cluster analysis, mapped using multidimensional scaling (MDS) in Figure 8, reveals greater granularity within the field’s vocabulary. This representation enables the identification of specific “thematic neighborhoods” where semantically related terms cluster, thereby verifying the coherence of terminology across the analyzed literature.
Figure 8.
Conceptual map of key cluster terms generated by K-Means and MDS. Each point represents a key term. The spatial distance reflects semantic dissimilarity (1—cosine similarity), meaning closer terms appear in similar zones. Colors indicate the cluster membership (k = 5), depicting the field into distinct conceptual zones.
Based on the domain experts’ interpretation of the resulting conceptual map, the following conclusions were reached:
- Cluster 1 strongly points to the practical application and utilization of Open and Linked Data. The key terms “linked”, “open”, “smart”, and “city” suggest applications in the context of smart cities and linked open data ecosystems. The key terms “value”, “used” and “available” reinforce the idea of data exploitation and utility, connecting this conceptual structure to practical infrastructure, data publication, and its socio-economic impact.
- Cluster 2 appears to be focused on data preparation and machine learning for information and data systems. Key terms like “datasets”, “dataset”, “information” and “label” are central to the preparation of data for analysis. The key term “learning” is a clear indicator of the use of algorithms, while “schema” relates to the structure of the data. The presence of the key term “energy” suggests a notable application domain related to these concepts.
- Cluster 3 is a clear indicator of research on Knowledge Representation and Linking, especially concerning Knowledge Graphs. The key terms “knowledge”, “graph”, “web”, “system” and “table” (as a source for tabular data) are central. The key terms “matching” and “technique” point to the specific methods for constructing or utilizing these graphs, standing this as a foundational pillar of semantic enrichment and the Semantic Web.
- Cluster 4 represents the conceptual core of semantic enrichment and data modeling. The key terms “semantic”, “model”, “ontology”, “domain” and “structured” are fundamental concepts. The terms “source” and “lake” likely refer to data sources or data lakes where enrichment is applied, while the key terms “user” and “indicator” suggest the purpose of this enrichment is to generate value for end-users or to create meaningful indicators.
- Cluster 5, which includes the key terms “tabular”, “annotation”, “column”, “entity and “type” is a highly specific cluster focused on the nature of tabular data and its annotation. These key terms precisely refer to the technical process of adding semantic information to tabular data by identifying data types and linking values to known entities. This conceptual structure is very specific to the core techniques of tabular data enrichment.
The integrated analysis of topics and clusters revealed a strong coherence, with clusters both validating and providing a more detailed view of the LDA topics. Topic 1 (concepts and modeling) broadly overlaps with Cluster 4 and Cluster 3, representing the foundational concepts of the field. Topic 2 (applications and value) strongly aligns with Cluster 1, thereby confirming the focus on practical application and Linked Data. Finally, Topic 3 (annotation techniques) corresponds directly to the combination of Cluster 5 (the specific process of annotation) and Cluster 3 (the techniques for constructing knowledge graphs).
The results of the OLS regression analysis on the log-transformed topic prevalence are summarized in Table 3. These models, which were validated for statistical assumptions (see Section 3.5), were used to assess the development trend of each topic.
Furthermore, the Durbin-Watson statistics for all models fell within the acceptable range (1.5–2.5), indicating that temporal autocorrelation was not a confounding factor.
Although Topic 1 (foundational concepts) showed a slight positive slope (0.049) and Topics 2 and 3 showed slight negative slopes (–0.022 and –0.027, respectively), these observed trends are not statistically distinguishable from random fluctuation. A Bonferroni correction was applied to control the family-wise error rate across multiple comparisons. As indicated in Table 3, the unadjusted p-values for all three topics were compared to the adjusted significance threshold of p < 0.0167 (calculated as α = 0.05 divided by 3 topics). Since all unadjusted p-values (Topic 1: p = 0.066; Topic 2: p = 0.466; Topic 3: p = 0.301) exceeded this threshold, none of the topics exhibited a statistically significant development trend over the past decade.
It is important to note that these trend results are not contradictory to the distribution of publications shown in Figure 2. While Figure 2 illustrates the absolute volume of publications per year, the regression analysis was designed to measure the trend of the relative prevalence of each topic over time. Therefore, the combined findings tell a more complete story: although the overall interest in semantic enrichment has fluctuated, the statistical analysis found no evidence of a significant shift in the research focus. The observed directional trends—a slight rise in foundational modeling (Topic 1) and slight declines in applications (Topic 2) and techniques (Topic 3)—were not statistically distinguishable from random fluctuation (all p-values > 0.05, see Table 3).
Importantly, non-significant p-values do not confirm complete stability within the research ecosystem. Rather, they reflect an absence of detectable linear trends in topic prominence, given the constraints of sample size and timeframe. Consequently, during the analyzed period, no theoretical stream exhibited a statistically significant disproportionate increase or decrease relative to others. However, variations may exist that remain undetected due to the limited statistical power of this dataset.
5. Discussion
In this study, we demonstrated the utility of the CoLiRa (Computational Literature Review & Analysis) Framework, a multi-stage computational methodology for analyzing literature. We achieved a comprehensive and robust analysis by combining topic modeling (LDA) to identify broad research themes, cluster analysis (K-Means) to map the underlying conceptual structure of the field, and linear regression to map temporal trends.
Specifically, this study confirmed that research on semantic enrichment predominantly addresses three areas: Topic 1 (core concepts and systems), Topic 2 (domain-specific applications), and Topic 3 (technical annotation processes). Beyond this finding, the quantitative analysis of temporal trends found no statistically significant evidence of a shift in focus in this scientific field. We observed slight directional trends (a positive slope for Topic 1 and negative slopes for Topics 2 and 3), which were not statistically distinguishable from random fluctuation when evaluated against the Bonferroni-adjusted significance threshold.
These results do not indicate that one research area is entirely replacing another. Instead, there is an absence of detectable linear trends in topic prominence within the sample size and timeframe analyzed. The data therefore suggest that foundational principles, specific techniques, and domain applications currently coexist. No single theoretical stream exhibited a statistically significant disproportionate growth or decline during the evaluated period. However, it is possible that more complex or undetected variations exist beyond the statistical power of this dataset.
A comprehensive interpretation of the conceptual mapping within this field requires a clear articulation of the mathematical distinctions between the outputs of the Latent Dirichlet Allocation (LDA) and K-Means algorithms as implemented in the CoLiRa framework. Although both models analyze a largely overlapping vocabulary, their underlying logic for structural division is fundamentally different. LDA, as a generative probabilistic model, performs soft clustering by allowing terms to be distributed across multiple topics simultaneously, thereby capturing broad, macro-level thematic discourse and yielding three overarching topics. In contrast, K-Means, when applied to a cosine similarity matrix, performs deterministic, spatial hard clustering by assigning each term to a single, mutually exclusive geometric neighborhood based on strict co-occurrence patterns, resulting in the identification of five granular, operational sub-communities. The alignment of a single probabilistic LDA topic with multiple spatial K-Means clusters (for example, mapping Topic 3 to Clusters 3 and 5) illustrates a natural nesting of features. This relationship indicates that a broad theoretical theme is operationally composed of distinct, specialized sub-vocabularies, thereby enabling a multi-resolution mapping of the literature rather than imposing a forced structural equivalence.
When interpreted from the perspective of previous scientometric studies and systematic literature reviews (SLRs), these results highlight a major improvement in methods. Traditional SLRs offer detailed qualitative insights, but their dependence on entirely manual coding introduces heuristic bias and restricts their capacity to manage the rapidly expanding volume of literature. CoLiRa does not claim to eliminate human subjectivity entirely; instead, it functions as a “human-in-the-loop” framework. This approach reduces manual coding bias during data processing and clustering, while fundamentally depending on domain experts to translate algorithmic outputs into accurate, semantically coherent, and theoretically meaningful conceptual trajectories.
A critical consideration for the practical adoption of the CoLiRa framework is its approach to integrating future knowledge. In the present study, the corpus was truncated at 2024 to validate the static baseline of the ‘human-in-the-loop’ pipeline, raising the question of whether the framework necessitates complete retraining or can rely on incremental updates as new literature emerges. Methodologically, CoLiRa supports periodic complete retraining. Although incremental algorithms such as Online LDA offer computational efficiency, scientometric analysis aims to identify conceptual evolutions and paradigm shifts. The introduction of disruptive literature should naturally alter the mathematical vector space and shift K-Means cluster centroids to represent new theoretical developments. Incremental updates may anchor new publications to historical distributions, potentially obscuring disruptive innovations. Therefore, periodic retraining, followed by a renewed cycle of expert panel consensus, is the preferred mechanism to ensure that the framework’s semantic taxonomies accurately reflect the evolving scientific landscape.
The CoLiRa framework delineates the macro-level conceptual boundaries of the field, such as distinguishing core semantic systems (Topic 1) from domain-specific applications (Topic 2). However, the limitations of this scientometric approach must be acknowledged. The current methodology addresses latent thematic structures rather than technical specifications. As a result, the study maps the prevalence and theoretical focus of these topics but does not examine their micro-level engineering implementations. Critical operational details, including the deployment of specific graph databases, integration with modern distributed backend frameworks, and algorithmic scalability for large datasets, remain abstracted within this macro-level perspective. Future systematic technical surveys, potentially utilizing full-text data extraction, are required to synthesize the architectural and engineering deployment strategies that operationalize these semantic models in practical scenarios.
6. Limitations and Future Work
Although this study demonstrates the utility of the CoLiRa framework, several limitations are evident, particularly in the data acquisition phase. The dependence on Google Scholar and citation chaining (snowballing) introduces methodological constraints. Google Scholar’s proprietary ranking algorithms and the citation chaining process are susceptible to popularity bias, which favors older or highly cited publications and may exclude emerging, niche, or recently published research. Additionally, the dynamic and opaque nature of Google Scholar’s indexing hinders the reproducibility of search queries over time.
Therefore, the bibliometric corpus analyzed in this study should be regarded as a proof-of-concept intended to validate the technical and collaborative stages of the CoLiRa pipeline, specifically the integration of algorithmic topic modeling with human-in-the-loop consensus. It does not represent an exhaustive or definitive systematic mapping of the entire field. The principal contribution of this work is the methodological framework itself.
To address these data collection constraints, future implementations of the CoLiRa framework will utilize curated, highly structured, and reproducible bibliographic databases, such as Web of Science (WoS) or Scopus, instead of Google Scholar. Employing these standardized repositories will mitigate popularity bias during the retrieval phase and ensure that the rigorous computational and expert-driven analysis provided by CoLiRa is applied to comprehensive and reproducible systematic literature reviews.
A secondary limitation concerns the corpus size and the reliance on abstracts rather than full-text articles. From a computational standpoint, probabilistic models such as Latent Dirichlet Allocation (LDA) require large datasets to optimize their distributions. In this study, the dataset was intentionally limited to 48 foundational abstracts, forming a controlled micro-corpus. This restricted scale was a methodological requirement to rigorously validate the framework’s primary innovation: the human-in-the-loop architecture. Utilizing a dataset of thousands of full-text articles would have prevented the expert panel from manually auditing and verifying the semantic coherence of each algorithmic assignment. By limiting the corpus, the experts could cross-reference all algorithmic outputs, demonstrating that the computational pipeline can be translated into theoretically sound taxonomies through expert consensus. Although this controlled setup was necessary for baseline methodological validation, future empirical applications of the CoLiRa framework will utilize its automated scalability to process large-scale, full-text records.
A final methodological limitation pertains to the temporal trend analysis. The Ordinary Least Squares (OLS) regression was applied to a relatively short time span (2015–2024), resulting in a limited number of data points. Therefore, the absence of statistical significance in topic prevalence shifts should be interpreted with caution. In this study, the regression module primarily serves to illustrate the end-to-end functionality of the CoLiRa pipeline, specifically its capacity to progress from thematic clustering to longitudinal tracking. Future research utilizing the CoLiRa framework with more extensive longitudinal datasets, such as several decades of literature, will have the statistical power necessary to conduct robust time-series analyses and identify subtle evolutionary trends.
Supplementary Materials
The following supporting information can be downloaded at: https://www.mdpi.com/article/10.3390/info17040367/s1, File S1: Jupyter Notebook: contains the complete Python code used for the corpus preprocessing, topic modeling, cluster analysis, and regression analysis: the CoLiRa framework code; File S2: Requirements file: contains the list of all Python libraries required to execute the code in S1 File and reproduce the analysis; File S3: Corpus CSV file: contains the titles, years of publication and abstracts of the studies included in the literature review realized as a case study for the CoLiRa framework. The last material is the input dataset for the Python code in File S1.
Author Contributions
Conceptualization, L.O.C.-M.; methodology, L.O.C.-M.; software, L.O.C.-M.; validation, J.d.C.V.-E.; formal analysis, J.d.C.V.-E.; investigation, M.E.E.-V.; supervision, M.E.E.-V.; resources, E.B.-N.; data curation, E.B.-N.; writing—original draft preparation, L.O.C.-M.; writing—review and editing, J.d.C.V.-E.; visualization, E.B.-N. All authors have read and agreed to the published version of the manuscript.
Funding
This research received no external funding.
Data Availability Statement
All relevant data and code underlying the findings of this study are fully available without restriction. The dataset containing the bibliographic information of the analyzed literature, as well as the Python scripts used for the Latent Dirichlet Allocation (LDA), K-Means clustering, and regression analysis, are available in the GitHub repository at https://github.com/Colombator/CoLiRa (accessed on 5 March 2026).
Acknowledgments
During the preparation of this work, the authors used Gemini 3.1 Pro (https://gemini.google.com/app; accessed on 5 March 2026) in order to improve the readability, grammatical style, and structural flow of the Abstract, Introduction, and Discussion sections. The authors reviewed and edited the content generated by this tool and take full responsibility for the content of the publication. The specific computational methods used for the data analysis (LDA, K-Means, and Linear Regression) were implemented using standard Python libraries (scikit-learn, statsmodels) as detailed in the Methodology section, and did not involve generative AI.
Conflicts of Interest
The authors declare no conflicts of interest.
References
- Uren, V.; Buckingham Shum, S.; Bachler, M.; Li, G.; Domingue, J. Semantic annotation for knowledge management: Requirements and a survey of the state of the art. J. Web Semant. 2006, 4, 14–28. [Google Scholar] [CrossRef] [Scilit]
- Chen, C.; Song, M. Visualizing a field of research: A methodology of systematic scientometric reviews. PLoS ONE 2019, 14, e0223994. [Google Scholar]
- Gusenbauer, M.; Haddaway, N.R. Which academic search systems are suitable for systematic reviews or meta-analyses? Evaluating retrieval qualities of Google Scholar, PubMed, and 26 other resources. Res. Synth. Methods 2020, 11, 181–217. [Google Scholar]
- Nakagawa, S.; Koricheva, J.; Macleod, M.; Viechtbauer, W. Introducing our series: Research synthesis and meta-research in biology. BMC Biol. 2020, 18, 20. [Google Scholar] [CrossRef] [Scilit] [PubMed]
- Börner, K.; Chen, C.; Boyack, K.W. Visualizing knowledge domains. Annu. Rev. Inf. Sci. Technol. 2003, 37, 179–255. [Google Scholar] [CrossRef] [Scilit]
- Fortunato, S.; Bergstrom, C.T.; Börner, K.; Evans, J.A.; Helbing, D.; Milojević, S.; Petersen, A.M.; Radicchi, F.; Sinatra, R.; Uzzi, B.; et al. Science of science. Science 2018, 359, eaao0185. [Google Scholar] [CrossRef] [Scilit]
- Antons, D.; Breidbach, C.F.; Joshi, A.M.; Salge, T.O. Computational literature reviews: Method, algorithms, and roadmap. Organ. Res. Methods 2023, 26, 107–138. [Google Scholar]
- Go, G.H.T.; Ly, K.; Søgaard, A.; Tabatabaei, S.A.; de Rijke, M.; Chen, X. LiRA: A multi-agent framework for reliable and readable literature review generation. In Proceedings of the AAAI Conference on Artificial Intelligence, Singapore, 20–27 January 2026; Volume 40, pp. 40456–40464. [Google Scholar]
- Egger, M.; Dickersin, K.; Smith, G.D. Problems and limitations in conducting systematic reviews. In Systematic Reviews in Health Care; John Wiley & Sons, Ltd.: Hoboken, NJ, USA, 2001; pp. 43–68. [Google Scholar]
- Morgan, C.; Carey, N.; White, A. PD173 Semi-automation of systematic literature review title and abstract screening using text mining and classification techniques. Int. J. Technol. Assess. Health Care 2025, 40, S159. [Google Scholar]
- Asmussen, C.B.; Møller, C. Smart literature review: A practical topic modelling approach to exploratory literature review. J. Big Data 2019, 6, 93. [Google Scholar] [CrossRef] [Scilit]
- Uršic, D.; Cater, T. Digital innovation in management and business literature: A bibliometric and topic modeling review. In Academy of Management Proceedings; Academy of Management: Valhalla, NY, USA, 2024; p. 19358. [Google Scholar]
- Kumar, R. Bibliometric analysis: Comprehensive insights into tools, techniques, applications, and solutions for research excellence. Spectr. Eng. Manag. Sci. 2025, 3, 45–62. [Google Scholar] [CrossRef] [Scilit]
- Klarin, A. How to conduct a bibliometric content analysis: Guidelines and contributions of content co-occurrence or co-word literature reviews. Int. J. Consum. Stud. 2024, 48, e13031. [Google Scholar] [CrossRef] [Scilit]
- Weinhold, M.; Faems, D. Developing an integrated topic modeling approach for text-based knowledge accumulation. In Academy of Management Proceedings; Academy of Management: Valhalla, NY, USA, 2024; p. 15127. [Google Scholar]
- Liu, D.; Thomas, M.A.; Li, Y. Natural language processing enhanced literature reviews. J. Inf. Technol. 2025, 40, 414–440. [Google Scholar] [CrossRef] [Scilit]
- Liu, J.; Chabot, Y.; Troncy, R.; Huynh, V.-P.; Labbé, T.; Monnin, P. From tabular data to knowledge graphs: A survey of semantic table interpretation tasks and methods. J. Web Semant. 2023, 76, 100761. [Google Scholar] [CrossRef] [Scilit]
- Kitchenham, B. Procedures for Performing Systematic Reviews; Joint Technical Report TR/SE-0401; Keele University: Keele, UK, 2004. [Google Scholar]
- Blei, D.M.; Ng, A.Y.; Jordan, M.I. Latent dirichlet allocation. J. Mach. Learn. Res. 2003, 3, 993–1022. [Google Scholar]
- Hoffman, M.D.; Blei, D.M.; Bach, F. Online learning for Latent Dirichlet Allocation. In Proceedings of the 23rd International Conference on Neural Information Processing Systems—Volume 1; Curran Associates Inc.: Red Hook, NY, USA, 2010; pp. 856–864. [Google Scholar]
- Wu, J.; Orlandi, F.; AlSkaif, T.; O’Sullivan, D.; Dev, S. A semantic web approach to uplift decentralized household energy data. Sustain. Energy Grids Netw. 2022, 32, 100891. [Google Scholar] [CrossRef] [Scilit]
- Chen, Z.; Jia, H.; Heflin, J.; Davison, B.D. Generating Schema Labels through Dataset Content Analysis. In Companion Proceedings of the The Web Conference 2018; International World Wide Web Conferences Steering Committee: Geneva, Switzerland, 2018; pp. 1515–1522. [Google Scholar]
- Özcan, F.; Lei, C.; Quamar, A.; Efthymiou, V. Semantic enrichment of data for AI applications. In Proceedings of the Fifth Workshop on Data Management for End-To-End Machine Learning; Association for Computing Machinery: New York, NY, USA, 2021; pp. 1–7. [Google Scholar]
- Ciavotta, M.; Cutrona, V.; De Paoli, F.; Nikolov, N.; Palmonari, M.; Roman, D. Supporting Semantic Data Enrichment at Scale. In Technologies and Applications for Big Data Value; Springer International Publishing: Cham, Switzerland, 2022; pp. 19–39. [Google Scholar]
- Nguyen, P.; Kertkeidkachorn, N.; Ichise, R.; Takeda, H. MTab: Matching Tabular Data to Knowledge Graph Using Probability Models. 2019, pp. 7–14. Available online: https://ceur-ws.org/Vol-2553/paper2.pdf (accessed on 6 January 2025).
- Bonfitto, S.; Perlasca, P.; Mesiti, M. Easy-to-Use Interfaces for Supporting the Semantic Annotation of Web Tables. 2023, pp. 1–10. Available online: https://ceur-ws.org/Vol-3379/DataPlat_2023_601.pdf (accessed on 7 January 2025).
- Takeoka, K.; Oyamada, M.; Nakadai, S.; Okadome, T. Meimei: An efficient probabilistic approach for semantically annotating tables. In Proceedings of the Thirty-Third AAAI Conference on Artificial Intelligence and Thirty-First Innovative Applications of Artificial Intelligence Conference and Ninth AAAI Symposium on Educational Advances in Artificial Intelligence; AAAI Press: Honolulu, HI, USA, 2019; pp. 281–288. [Google Scholar]
- Chen, S.; Karaoglu, A.; Negreanu, C.; Ma, T.; Yao, J.-G.; Williams, J.; Gordon, A.; Lin, C.-Y. LinkingPark: An Integrated Approach for Semantic Table Interpretation. 2020, pp. 65–74. Available online: https://ceur-ws.org/Vol-2775/paper7.pdf (accessed on 7 January 2025).
- Bonfitto, S.; Cappelletti, L.; Trovato, F.; Valentini, G.; Mesiti, M. Semi-automatic Column Type Inference for CSV Table Understanding. In SOFSEM 2021: Theory and Practice of Computer Science; Springer: Berlin/Heidelberg, Germany, 2021; pp. 535–549. [Google Scholar]
- Diamantini, C.; Lo Giudice, P.; Potena, D.; Storti, E.; Ursino, D. An Approach to Extracting Topic-guided Views from the Sources of a Data Lake. Inf. Syst. Front. 2021, 23, 243–262. [Google Scholar] [CrossRef] [Scilit]
- Pingos, M.; Andreou, A.S. A Data Lake Metadata Enrichment Mechanism via Semantic Blueprints. In Proceedings of the International Conference on Evaluation of Novel Approaches to Software Engineering (ENASE), Virtual, 25–26 April 2022. [Google Scholar]
- Sarramia, D.; Claude, A.; Ogereau, F.; Mezhoud, J.; Mailhot, G. CEBA: A Data Lake for Data Sharing and Environmental Monitoring. Sensors 2022, 22, 2733. [Google Scholar] [CrossRef] [Scilit]
- An, J.; Kumar, S.; Lee, J.; Jeong, S.; Song, J. Synapse: Towards Linked Data for Smart Cities using a Semantic Annotation Framework. In Proceedings of the 2020 IEEE 6th World Forum on Internet of Things (WF-IoT); IEEE: New York, NY, USA, 2020; pp. 1–6. [Google Scholar]
- Wu, J.; Orlandi, F.; Lee, Y.H.; O’Sullivan, D.; Dev, S. Organizing Decentralized Energy Data Using Semantic Approach. In Proceedings of the 2021 Photonics & Electromagnetics Research Symposium (PIERS); IEEE: New York, NY, USA, 2021; pp. 2213–2216. [Google Scholar]
- Rümmele, N. Evaluating Approaches for Supervised Semantic Labeling. 2018, pp. 4–13. Available online: https://ceur-ws.org/Vol-2073/article-04.pdf (accessed on 7 January 2025).
- Ramnandan, S.K.; Mittal, A.; Knoblock, C.A.; Szekely, P. Assigning Semantic Labels to Data Sources. In The Semantic Web. Latest Advances and New Domains; Springer International Publishing: Cham, Switzerland, 2015; pp. 403–417. [Google Scholar]
- Knap, T. Increasing Quality of Austrian Open Data by Linking Them to Linked Data Sources: Lessons Learned. In The Semantic Web; Springer International Publishing: Cham, Switzerland, 2016; pp. 243–254. [Google Scholar]
- Neumaier, S.; Umbrich, J.; Parreira, J.X.; Polleres, A. Multi-level Semantic Labelling of Numerical Values. In The Semantic Web–ISWC 2016; Springer International Publishing: Cham, Switzerland, 2016; pp. 428–445. [Google Scholar]
- Azzi, R.; Diallo, G. AMALGAM: A Matching Approach to Fairfy TabuLar Data with KnowledGe GrAph Model. In Trends and Applications in Information Systems and Technologies; Springer International Publishing: Cham, Switzerland, 2021; pp. 76–86. [Google Scholar]
- Bischof, S.; Harth, A.; Kämpgen, B.; Polleres, A.; Schneider, P. Enriching integrated statistical open city data by combining equational knowledge and missing value imputation. J. Web Semant. 2018, 48, 22–47. [Google Scholar] [CrossRef] [Scilit]
- Nguyen, P.; Nguyen, K.; Ichise, R.; Takeda, H. EmbNum+: Effective, Efficient, and Robust Semantic Labeling for Numerical Values. New Gener. Comput. 2019, 37, 393–427. [Google Scholar] [CrossRef] [Scilit]
- Pomp, A.; Paulus, A.; Kirmse, A.; Kraus, V.; Meisen, T. Applying Semantics to Reduce the Time to Analytics within Complex Heterogeneous Infrastructures. Technologies 2018, 6, 86. [Google Scholar] [CrossRef] [Scilit]
- Nikolov, N.; Ciavotta, M.; De Paoli, F. Data wrangling at scale: The experience of EW-shopp. In Proceedings of the 12th European Conference on Software Architecture: Companion Proceedings; Association for Computing Machinery: New York, NY, USA, 2018; pp. 1–4. [Google Scholar]
- Alam, M.; Buscaldi, D.; Cochez, M.; Osborne, F.; Recupero, D.R.; Sack, H.; Simon, G.; Elena, D.; Diego, R.R. Tab2KG: Semantic table interpretation with lightweight semantic profiles. Semant. Web 2022, 13, 571–597. [Google Scholar]
- Chen, J.; Jiménez-Ruiz, E.; Horrocks, I.; Sutton, C. Learning semantic annotations for tabular data. In Proceedings of the 28th International Joint Conference on Artificial Intelligence; AAAI Press: Macao, China, 2019; pp. 2088–2094. [Google Scholar]
- Huynh, V.-P.; Liu, J.; Chabot, Y.; Labbe, T.; Monnin, P.; Troncy, R. DAGOBAH: Enhanced Scoring Algorithms for Scalable Annotations of Tabular Data. 2020, pp. 27–39. Available online: https://ceur-ws.org/Vol-2775/paper3.pdf (accessed on 8 January 2025).
- Nguyen, P.; Yamada, I.; Kertkeidkachorn, N.; Ichise, R.; Takeda, H. MTab4Wikidata at SemTab 2020: Tabular Data Annotation with Wikidata. 2020, pp. 86–95. Available online: https://ceur-ws.org/Vol-2775/paper9.pdf (accessed on 8 January 2025).
- Taheriyan, M.; Knoblock, C.A.; Szekely, P.; Ambite, J.L. Leveraging Linked Data to Discover Semantic Relations Within Data Sources. In The Semantic Web–ISWC 2016; Springer: Berlin/Heidelberg, Germany, 2016; pp. 549–565. [Google Scholar]
- Cutrona, V.; Bianchi, F.; Jiménez-Ruiz, E.; Palmonari, M. Tough Tables: Carefully Evaluating Entity Linking for Tabular Data. In The Semantic Web–ISWC 2020; Springer: Berlin/Heidelberg, Germany, 2020; pp. 328–343. [Google Scholar]
- Bischof, S.; Martin, C.; Polleres, A.; Schneider, P. Collecting, Integrating, Enriching and Republishing Open City Data as Linked Data. In The Semantic Web–ISWC 2015; Springer International Publishing: Cham, Switzerland, 2015; pp. 57–75. [Google Scholar]
- Bianchini, D.; De Antonellis, V.; Garda, M. A semantics-enabled approach for personalised Data Lake exploration. Knowl. Inf. Syst. 2024, 66, 1469–1502. [Google Scholar] [CrossRef] [Scilit]
- Mami, M.N.; Graux, D.; Scerri, S.; Jabeen, H.; Auer, S.; Lehmann, J. Squerall: Virtual Ontology-Based Access to Heterogeneous and Large Data Sources. In The Semantic Web–ISWC 2019; Ghidini, C., Hartig, O., Maleshkova, M., Svátek, V., Cruz, I., Hogan, A., Song, J., Lefrançois, M., Gandon, F., Eds.; Springer International Publishing: Cham, Switzerland, 2019; pp. 229–245. [Google Scholar]
- Bagozi, A.; Bianchini, D.; De Antonellis, V.; Garda, M.; Melchiori, M. Personalised Exploration Graphs on Semantic Data Lakes. In On the Move to Meaningful Internet Systems: OTM 2019 Conferences; Panetto, H., Debruyne, C., Hepp, M., Lewis, D., Ardagna, C.A., Meersman, R., Eds.; Springer International Publishing: Cham, Switzerland, 2019; pp. 22–39. [Google Scholar]
- Knap, T. Towards Odalic, a Semantic Table Interpretation Tool in the ADEQUATE Project. 2017, pp. 26–37. Available online: http://ceur-ws.org/Vol-1946/#paper-04 (accessed on 5 January 2025).
- Orlandi, F.; Debattista, J.; Hassan, I.A.; Conran, C.; Latifi, M.; Nicholson, M.; Salim, F.A.; Turner, D.; Conlan, O.; O’Sullivan, D.; et al. Leveraging Knowledge Graphs of Movies and Their Content for Web-Scale Analysis. In Proceedings of the 2018 14th International Conference on Signal-Image Technology & Internet-Based Systems (SITIS); IEEE: New York, NY, USA, 2018; pp. 609–616. [Google Scholar]
- Wu, J.; Orlandi, F.; O’Sullivan, D.; Pisoni, E.; Dev, S. Boosting Climate Analysis With Semantically Uplifted Knowledge Graphs. IEEE J. Sel. Top. Appl. Earth Obs. Remote Sens. 2022, 15, 4708–4718. [Google Scholar] [CrossRef] [Scilit]
- Taheriyan, M.; Knoblock, C.A.; Szekely, P.; Ambite, J.L. Learning the semantics of structured data sources. J. Web Semant. 2016, 37, 152–169. [Google Scholar] [CrossRef] [Scilit]
- Oliveira, D. ADOG—Annotating Data with Ontologies and Graphs. 2019, pp. 1–6. Available online: https://ceur-ws.org/Vol-2553/paper1.pdf (accessed on 6 January 2025).
- Thawani, A.; Hu, M.; Hu, E. Entity Linking to Knowledge Graphs to Infer Column Types and Properties. 2019, p. 22. Available online: https://ceur-ws.org/Vol-2553/paper4.pdf (accessed on 6 January 2025).
- Shigapov, R.; Zumstein, P.; Kamlah, J.; Oberlander, L.; Mechnich, J.; Schumm, I. bbw: Matching CSV to Wikidata via Meta-lookup. 2020, pp. 17–26. Available online: https://ceur-ws.org/Vol-2775/paper2.pdf (accessed on 6 January 2025).
- Cremaschi, M.; Avogadro, R.; Barazzetti, A. MantisTable SE: An Efficient Approach for the Semantic Table Interpretation. 2020, pp. 75–85. Available online: https://ceur-ws.org/Vol-2775/paper8.pdf (accessed on 6 January 2025).
- Vu, B.; Knoblock, C.; Pujara, J. Learning Semantic Models of Data Sources Using Probabilistic Graphical Models. In Proceedings of the World Wide Web Conference; Association for Computing Machinery: New York, NY, USA, 2019; pp. 1944–1953. [Google Scholar]
- Steenwinckel, B.; Vandewiele, G.; Turck, F.D.; Ongenae, F. CSV2KG: Transforming Tabular Data into Semantic Knowledge. 2019, pp. 33–40. Available online: https://ceur-ws.org/Vol-2553/paper5.pdf (accessed on 6 January 2025).
- Morikawa, H. Semantic Table Interpretation Using LOD4ALL. 2019, pp. 49–56. Available online: https://ceur-ws.org/Vol-2553/paper7.pdf (accessed on 6 January 2025).
- Alobaid, A.; Kacprzak, E.; Corcho, O. Typology-based semantic labeling of numeric tabular data. Semant. Web 2020, 12, 5–20. [Google Scholar] [CrossRef] [Scilit]
- Huynh, V.-P.; Liu, J.; Chabot, Y.; Deuzé, F.; Labbé, T.; Monnin, P.; Troncy, R. DAGOBAH: Table and Graph Contexts for Efficient Semantic Annotation of Tabular Data. In CEUR Workshop Proceedings; En Ligne, Unknown Region. 2021, p. 2. Available online: https://hal.science/hal-04170864 (accessed on 7 January 2025).
- Chabot, Y.; Labbé, T.; Liu, J.; Troncy, R. Dagobah: An End-To-End Context-Free Tabular Data Semantic Annotation System. In Proceedings of the SemTab@ISWC. 2019, pp. 41–48. Available online: https://ceur-ws.org/Vol-2553/paper6.pdf (accessed on 8 January 2025).
- Gottschalk, S.; Tempelmeier, N.; Kniesel, G.; Iosifidis, V.; Fetahu, B.; Demidova, E. Simple-ML: Towards a Framework for Semantic Data Analytics Workflows. In Semantic Systems. The Power of AI and Knowledge Graphs; Springer International Publishing: Cham, Switzerland, 2019; pp. 359–366. [Google Scholar]
- Chuang, J.; Manning, C.D.; Heer, J. Termite: Visualization techniques for assessing textual topic models. In Proceedings of the International Working Conference on Advanced Visual Interfaces (AVI ’12); Association for Computing Machinery: New York, NY, USA, 2012; pp. 74–77. [Google Scholar] [CrossRef] [Scilit]

Disclaimer/Publisher’s Note: The statements, opinions and data contained in all publications are solely those of the individual author(s) and contributor(s) and not of MDPI and/or the editor(s). MDPI and/or the editor(s) disclaim responsibility for any injury to people or property resulting from any ideas, methods, instructions or products referred to in the content. |
© 2026 by the authors. Licensee MDPI, Basel, Switzerland. This article is an open access article distributed under the terms and conditions of the Creative Commons Attribution (CC BY) license.