


Abstract
Traditional Agent-based Models (ABMs) often struggle to capture the nuance of adaptive human decision-making during complex crises due to their reliance on static, predefined rules. Large Language Models (LLMs) offer a transformative solution by acting as cognitive engines that empower agents with human-like common-sense reasoning. In this paper, we introduce an LLM-driven Multi-Agent Simulation framework to investigate coupled epidemic–economic dynamics, incorporating a Perception-Deliberation-Action (PDA) loop. Agents, acting as heterogeneous cognitive entities, utilize Chain-of-Thought processes to autonomously balance health risks against economic necessities. This approach endogenously generates adaptive behaviors without explicit scripting. Extensive experiment results across diverse LLM backends confirm the framework’s robustness, revealing divergent socio-economic trajectories under distinct macroscopic conditions and effectively quantifying the trade-offs between public health and economic stability. This approach establishes a high-fidelity computational laboratory for investigating complex scenarios under distinct macroscopic conditions, effectively bridging the gap between micro-level cognition and macro-level societal outcomes.
1. Introduction
The outbreak of infectious diseases poses a dual challenge to modern society: managing the biological propagation of the virus while mitigating the socio-economic shockwaves caused by containment measures. Since the foundational work of Kermack and McKendrick [1], mathematical models have been the bedrock of epidemiological forecasting. However, as highlighted during the COVID-19 pandemic, the interplay between public health policies and individual economic behaviors creates a complex adaptive system that often defies the predictions of aggregate equation-based models [2].
To understand these non-linear dynamics, computational social science has increasingly turned to in silico experiments, with Agent-based Models (ABMs) emerging as a powerful paradigm for growing macroscopic social phenomena from the bottom up [3,4]. By modeling heterogeneous agents interacting in a shared environment, ABMs allows researchers to explore how individual decisions accumulate into systemic outcomes. Yet, traditional ABMs face a critical challenge: they predominantly rely on pre-defined, static rules to govern agent behavior.
Recently, LLMs have demonstrated impressive capabilities in human-level intelligence [5]. Unlike rule-based scripts, it can offers a transformative solution to this bottleneck by leveraging their vast internalized knowledge and common-sense reasoning capabilities [6]. Building upon these advances, Large Language Model-based Multi-Agent Systems (MASs) have further extended the power of LLMs into multi-agent interactions and simulation, injecting new vitality into the field of ABMs. And the recent studies have demonstrated that LLM-based MASs has achieved great success in ABMs for various applications [7,8]. However, LLM-based MASs for epidemiological ABMs remain under-explored.
In this paper, we propose an LLM-driven Multi-Agent Simulation framework specifically designed to investigate the coupled epidemic–economic dynamics. In our system, each agent is not merely a data point but a cognitive entity that perceives its infection status and financial pressure, deliberates on the risks of going to work versus the safety of staying home, and makes autonomous decisions that feed back into the macroscopic system. This approach allows us to build a high-fidelity “Computational Policy Laboratory”, where the impact of NPIs (Non-Pharmaceutical Interventions) can be evaluated not just by infection curves, but by the emergent behavioral responses of a diverse population.
The contributions of this paper are listed below:
- Framework Proposal: We propose a novel LLM-driven Multi-Agent Simulation framework for coupled epidemic–economic dynamics, enabling agents to exhibit human-level reasoning and adaptive behaviors, thus overcoming the rigidity of traditional rule-based models.
- Cognitive Architecture: We design a Perception-Deliberation-Action (PDA) loop with a Chain-of-Thought-Action (CoTA) mechanism, effectively translating complex environmental states into natural language prompts and mapping LLM reasoning back into executable simulation actions.
- High-Fidelity Simulation: We demonstrate the framework’s capability to achieve high-fidelity simulation of real-world epidemic dynamics, effectively capturing the complex, non-linear evolution of virus propagation driven by adaptive human behaviors, offering a valuable reference for managing public health crises.
- Robustness & Generalization Validation: Through comprehensive experiments, we substantiate the system’s robustness across diverse Large Language Model backends and population scales, quantifying the divergent socio-economic trajectories that emerge under distinct macroscopic conditions.
2. Related Work
This research intersects three domains: Agent-Based Modeling (ABM), coupled epidemic–economic dynamics, and LLM-based Multi-Agent Systems.
2.1. ABM in Social Science
ABM is a core tool for simulating bottom-up social phenomena, enabling the exploration of emergent macro-patterns from micro-level interactions [3,9]. This paradigm has been applied across domains from urban dynamics to financial markets [4,10]. However, traditional ABMs, often governed by rigid heuristics, face challenges in behavioral realism and adaptability, particularly in crisis scenarios [11]. Recent advances aim to bridge this gap by calibrating ABMs with large-scale empirical data to create “digital twins” of society and by integrating formal causal inference methods to enhance policy evaluation capabilities [12]. Furthermore, as ABMs increasingly incorporate complex AI, new research is exploring the emergent ethical dilemmas within these simulated societies [13].
2.2. Coupled Epidemic–Economic Models
Epidemic–economic interactions are studied via two main approaches. Macro-level models [14,15,16] couple epidemiological equations with representative agent optimization, excelling at policy trade-off analysis but overlooking heterogeneity crucial for targeted interventions. Micro-level ABMs offer granularity but traditionally rely on static rules. For instance, while influential models like COVID-ABS [17] successfully capture basic transmission mechanics, their agents act on rigid heuristics (e.g., fixed compliance rates) that fail to reflect the adaptive, nuanced, and often irrational trade-offs humans make when facing the dilemma of “health versus livelihood.”
2.3. LLM-Based Multi-Agent Systems
Integrating LLMs into MAS enables agents to act as sophisticated “computational social entities” [5,18]. Pioneering works [8] demonstrated LLM agents’ capacity for memory and reflection, while advances in cognitive architectures [19] enhance their reasoning. This has spurred a new wave of large-scale simulations, from evolving social networks to complex legal systems [20]. While LLM agents have been applied to economic competition [7,11] and domain-specific challenges like climate change [21] and geospatial analysis [22], their application to coupled epidemic–economic crisis management remains nascent. Our work addresses this gap, leveraging LLMs to simulate adaptive decision-making in high-stakes policy scenarios.
3. Materials and Methods
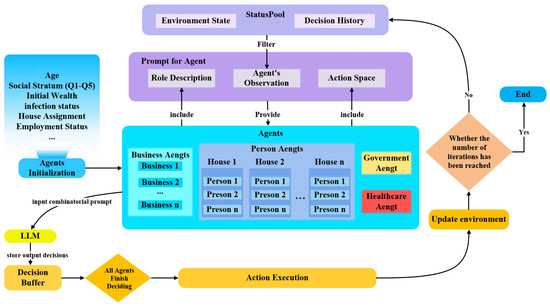
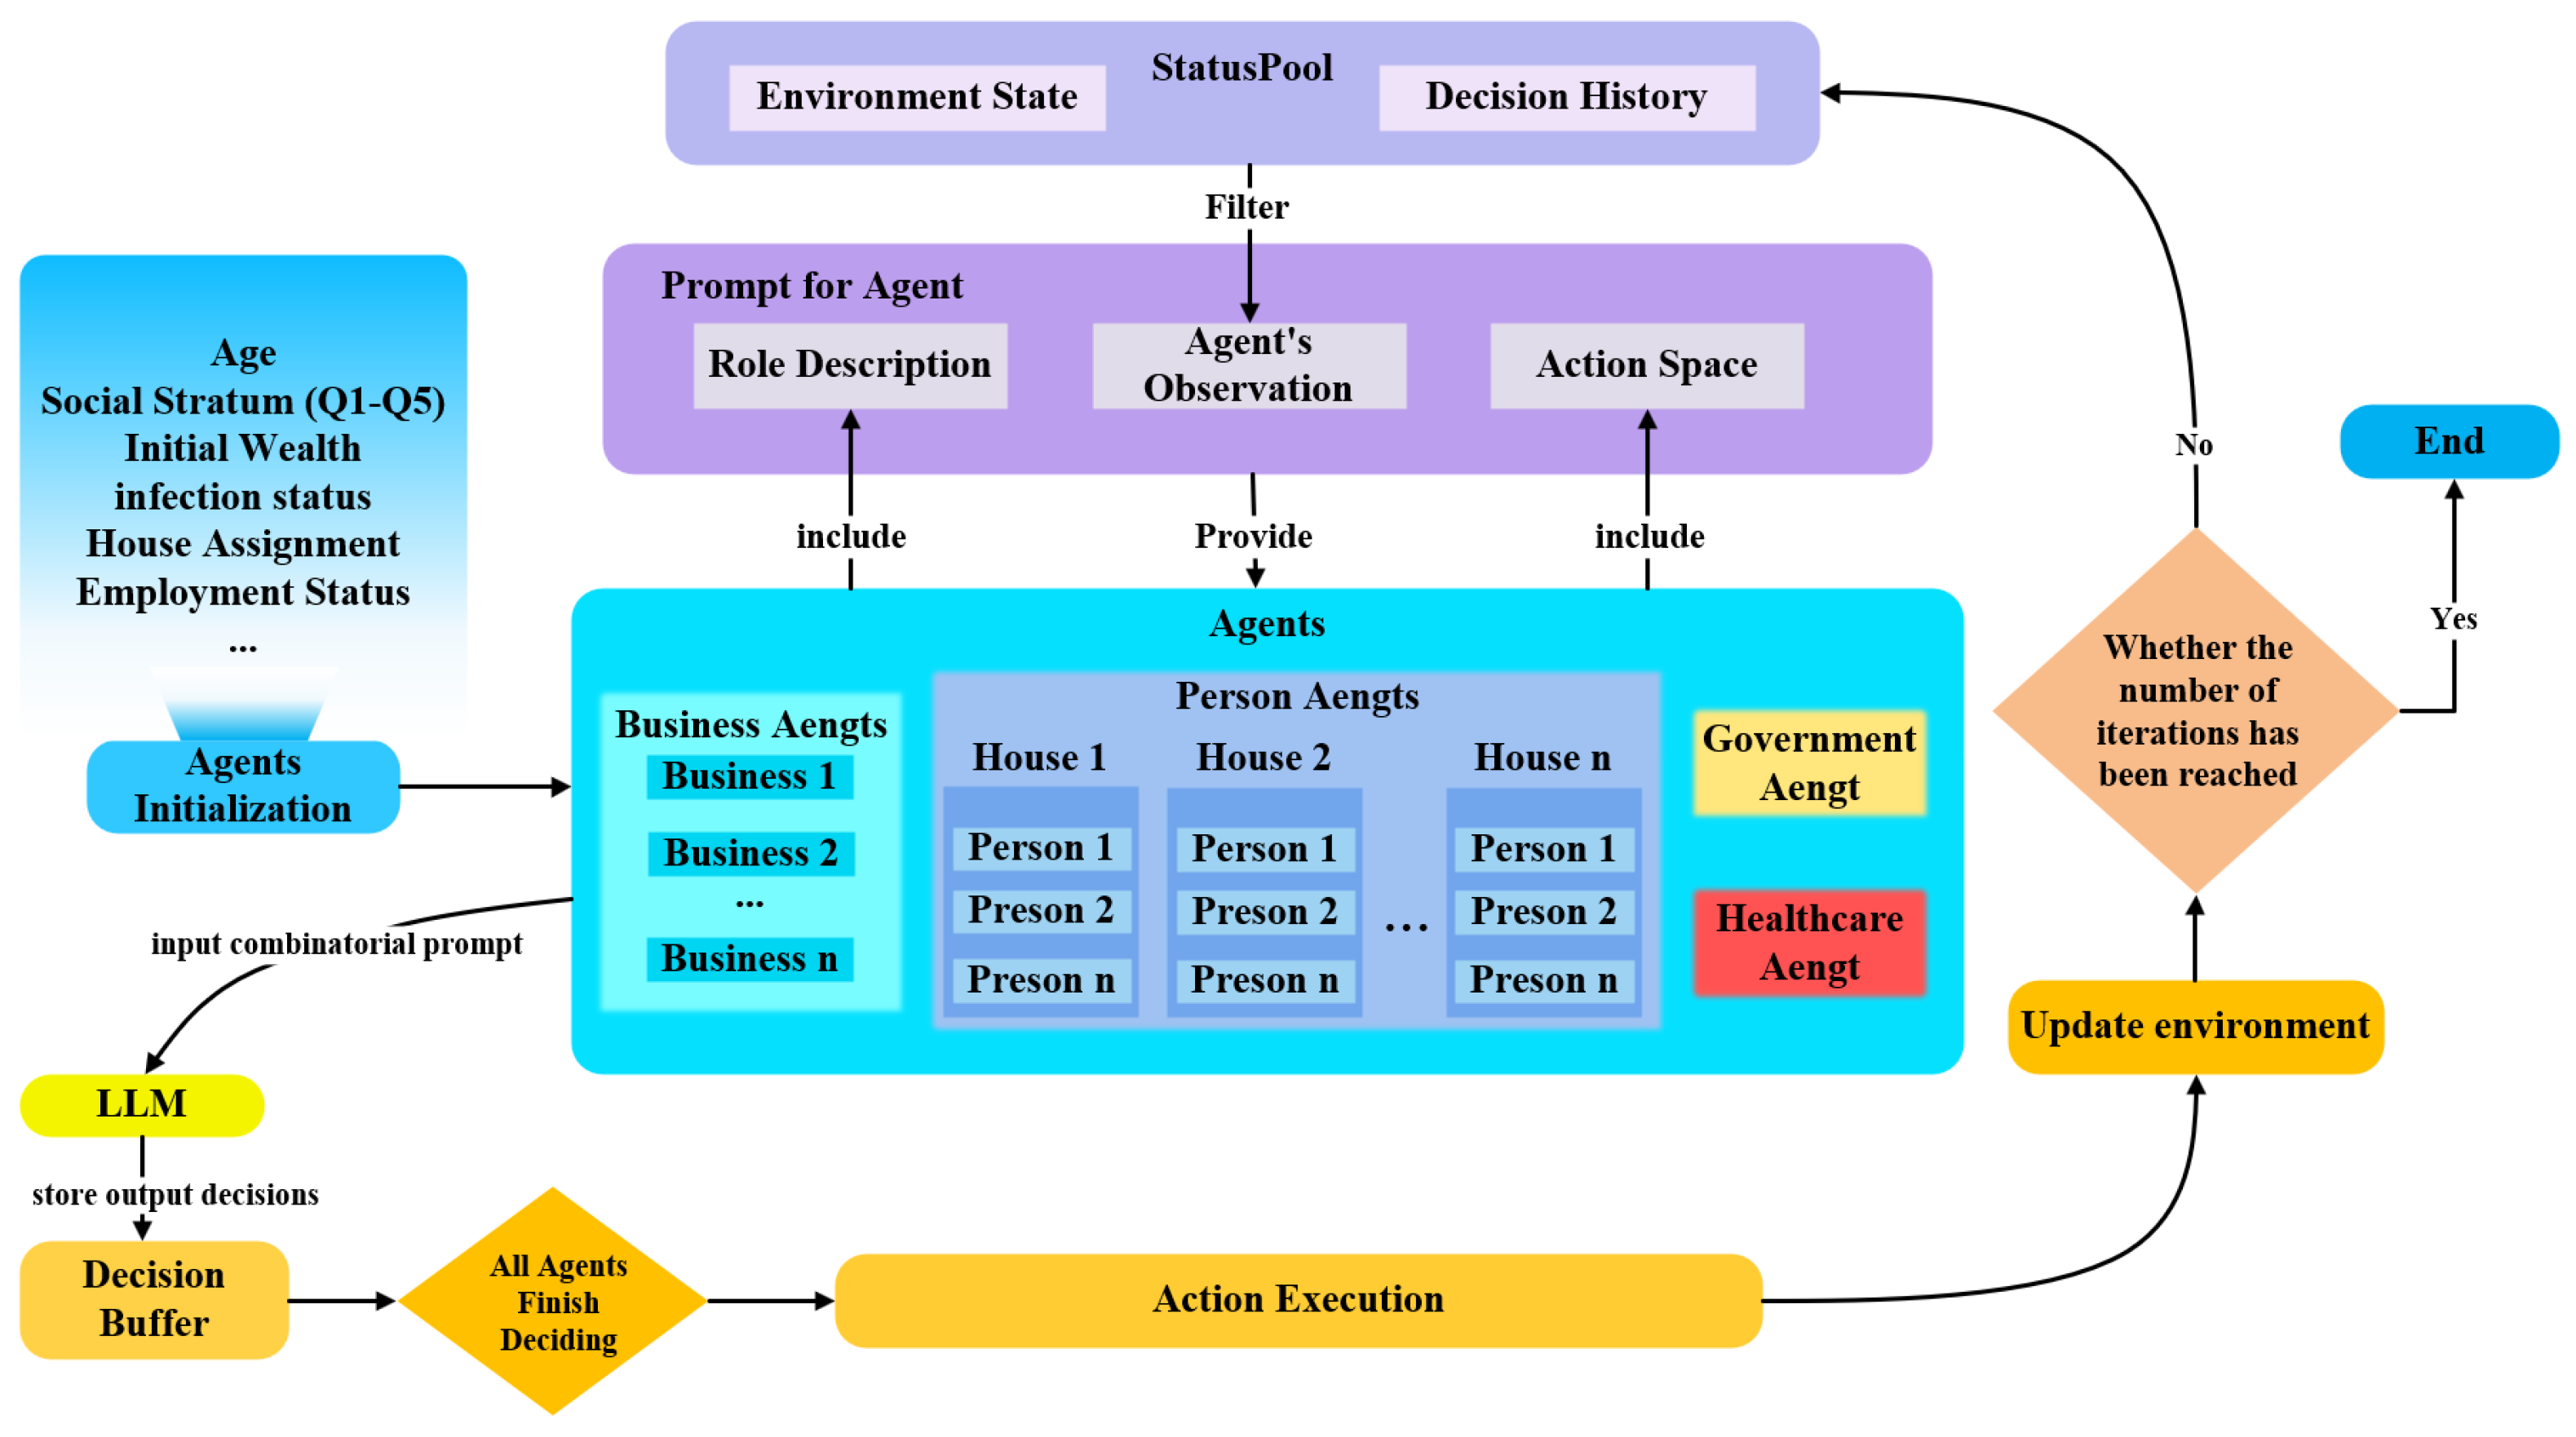
To investigate the behavior and consequences of LLM-driven agents in a coupled socio-economic–epidemiological system, we designed and implemented an LLM-MAS simulation platform. This section details its core components: the simulation environment, agent design, and the LLM interaction mechanism that serves as the agent’s cognitive core (Figure 1).
Figure 1.
System Architecture of the LLM-Driven Multi-Agent Simulation Framework. The diagram illustrates the core feedback loop: The Dynamic Simulation Environment provides perceptual state to the Multi-level Agent Population. Agents, governed by the LLM Cognitive Engine via a PDA loop, make decisions and execute actions that, in turn, modify the environment.
3.1. Simulation Environment
Our simulation environment is a rectangular 2D grid world, representing an abstract city. The environment contains three types of entities: Persons, Businesses, and Government. Individuals move, work, and consume in the environment; businesses serve as workplaces and providers of goods/services; the government acts as the formulator and enforcer of macro policies. Time progresses in discrete “iterations” (hours).
The epidemic spread follows the classic SEIR model framework, but adapted for agent-based execution using biological timers rather than explicit state bins.
- Exposure and Latency (E-phase): Upon successful transmission (probability within contact distance ), an agent enters the latent phase. While their internal status is flagged as infected, they remain non-infectious until their infection timer exceeds the incubation period ( days).
- Infectiousness (I-phase): Agents become contagious only during the window . During this phase, they can transmit the virus to Susceptible neighbors.
- Disease Progression: Clinical severity (Asymptomatic → Hospitalization → Critical → Death) is probabilistically determined daily based on age-stratified risk tables, as detailed in Table 1.
- Recovery: If an agent survives beyond the recovery threshold ( days), they transition to the Recovered state, gaining permanent immunity.
This granular temporal modeling allows for the emergence of realistic transmission chains, including pre-symptomatic spread and variable viral shedding windows.
Table 1.
Epidemiological parameters stratified by age group. Projections adapted from [2].
To rigorously define the interaction topology, the simulation is structured as a multi-layered network connecting the State, Businesses, and Population:
- Government-State Layer: The State is modeled as a centralized singleton entity (Government Agent) that functions as the macro-regulator. It is fully connected to the entire population network through two vertical channels: a policy channel for broadcasting mandates (e.g., Lockdowns) and a fiscal channel for collecting taxes and distributing stimulus.
- Socio-Economic Layer: The population is embedded in a dual-network structure. Socially, agents are grouped into distinct Household Units representing co-living networks. Economically, agents are linked to Business Entities via employment contracts, forming a bipartite graph that governs labor flows and income generation.
- Physical Contact Layer: Superimposed on these structural links is a dynamic spatial network. Disease transmission occurs not through static edges but through physical proximity within the continuous 2D grid, allowing for emergent transmission chains that respect both social clustering and stochastic encounters.
3.2. Agent Design
The platform defines three distinct agent types: Persons, Businesses, and Government, each characterized by specific states, objectives, and action spaces.
Person Agent. As the fundamental decision-making unit, each individual maintains a dynamic state encompassing health (SEIR status), wealth, and occupation. Their primary objective is to balance economic survival with health preservation. Their action space includes: Move (selecting destinations), Work (earning income), Consume (purchasing essentials), along with additional actions that simulate common human behaviors in real-world environments.
Business Agent. Representing commercial enterprises, these agents manage wealth and workforce with the goal of profit maximization. Key actions include Hire or Fire (adjusting workforce) and setting the Operational Mode (e.g., remote work policies).
Government Agent. Acting as the macro-regulator, this agent manages fiscal reserves to control the epidemic while maintaining economic stability. Its interventions include issuing Lockdown Orders and distributing Economic Stimulus to unemployed agents.
3.3. LLM-Driven Cognitive Architecture
The core of our framework is a Perception–Deliberation–Action (PDA) cycle that bridges micro-level cognition with macro-level simulation. To emulate humans’ reasoning capability and maintain rigorous simulation logic, we enforce a strict separation between global state evolution and individual decision-making.
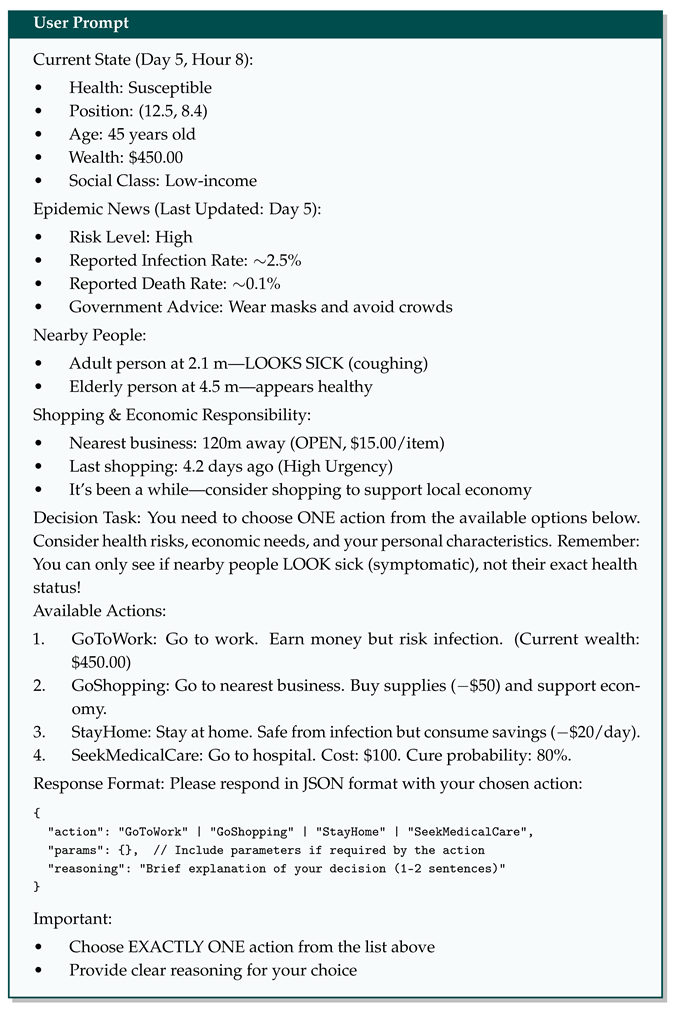
Perception and Information Filtering. Agent actions are driven by a filtered perception layer that constrains observability across biological and spatial dimensions. Biologically, observability is partial: agents scan their immediate locality but can only detect infection based on visible symptoms; exposed or asymptomatic carriers appear indistinguishable from healthy individuals, forcing agents to act under uncertainty. Informationally, we enforce strict temporal causality: agents base their decisions on the global state frozen at the start of the current iteration. This design is not merely for computational convenience but is critical to creating realistic concurrency. It ensures that all agents deliberate simultaneously based on the same snapshot of reality, preventing “look-ahead bias” where agents acting later in the loop could artificially react to the decisions of earlier agents within the same time step. (Detailed prompts can be found in Appendix A).
Reasoning and Execution. These constrained observations are synthesized into dynamic prompts using a Chain-of-Thought–Action (CoTA) strategy. The LLM explicitly deliberates on trade-offs—such as weighing income stability against infection risk—before generating a structured decision. To ensure that agent interactions remain fair and realistic, we implement a Concurrent Execution Mechanism. Instead of processing agents one by one, the system works in two distinct phases: first, all agents independently “think” and submit their decisions based on the same frozen snapshot of the world; only after everyone has decided are these actions applied to the environment together. This prevents early-acting agents from altering the world for those acting later in the same moment, strictly preserving the simultaneous nature of real-world behavior.
3.4. Implementation Architecture
To operationalize the theoretical PDA loop, we developed a multi-layered architecture centered on a Status Pool. This component acts as a centralized repository for environmental states and agent memories, implementing strict protocols to enforce realistic information asymmetry. The simulation proceeds through a three-phase pipeline: (1) State Aggregation, computing global epidemiological and economic indicators; (2) Cognitive Processing, where the system constructs prompts by integrating environmental context, agent profiles, and decision histories prior to dispatching batched LLM queries; and (3) Action Execution, where an Action Registry validates and maps natural language decisions to executable primitives. To ensure behavioral concurrency, a buffering mechanism temporarily holds all decisions for the current iteration. This prevents early actors from prematurely altering the environment state seen by others, thereby simulating the simultaneous nature of real-world human decision-making. Additionally, periodic economic activities (e.g., payrolls) are triggered by fixed timers, operating independently of the cognitive loop to authentically simulate universally accepted real-world economic cycles.
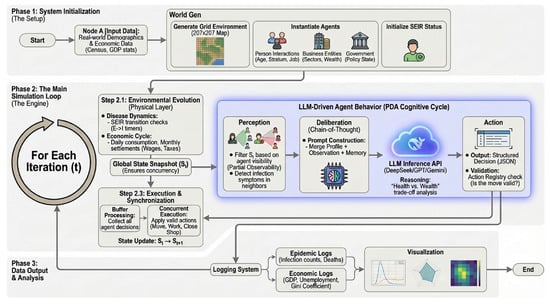
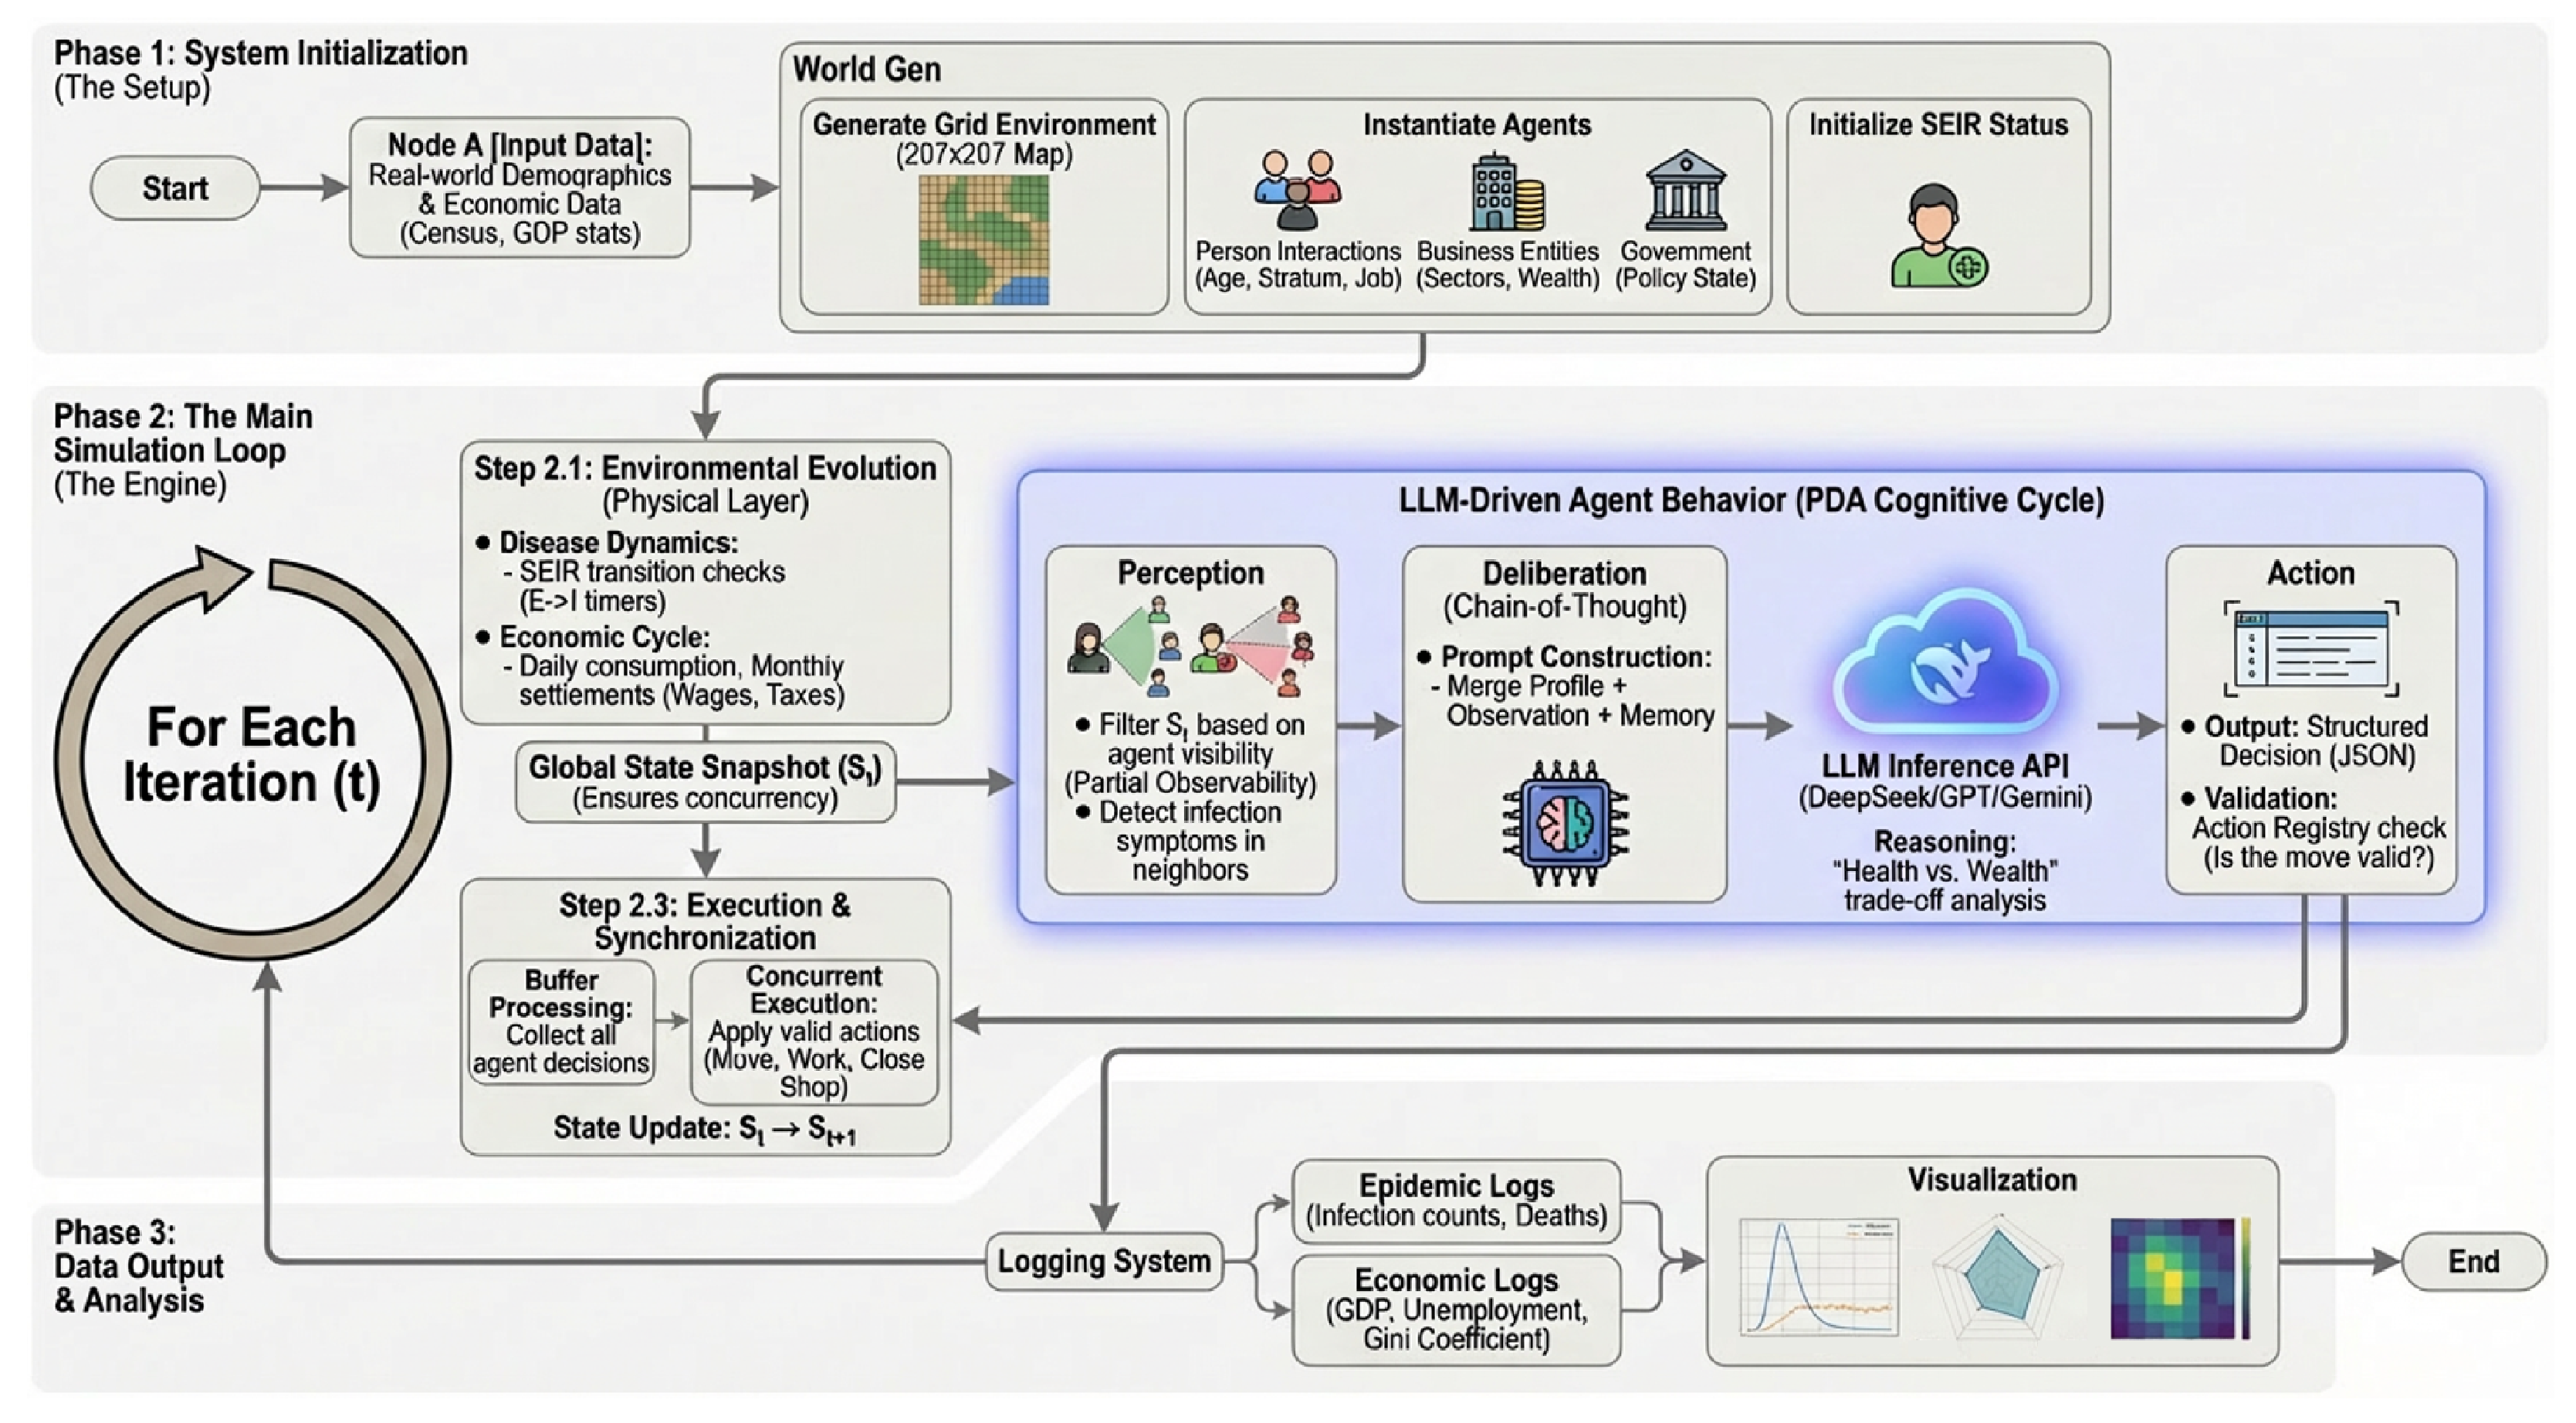
Figure 2 provides a comprehensive visual overview of this execution pipeline. It delineates the sequential flow from system initialization, through the cyclic iteration of the main simulation loop (encompassing environmental evolution, the LLM-driven PDA cycle, and action synchronization), to the final data analysis phase. This structural mapping ensures that the theoretical cognitive model is rigorously translated into executable procedural logic.
Figure 2.
Operational Workflow of the Simulation Platform. The flowchart details the Three-Phase Pipeline: (1) Initialization establishes the demographic and economic baseline; (2) Main Loop orchestrates the concurrent PDA cycle, where environmental evolution and agent deliberation occur in synchronized steps; (3) Output and Analysis logs multi-dimensional data for post hoc visualization.
3.5. Model Parameter Configuration
To ensure reproducibility and real-world alignment, this section details the key parameters. We referenced and expanded upon the parameter settings from the baseline paper [17], leveraging publicly available data from highly credible third-party organizations as the fundamental configuration parameters, while incorporating empirical data to ensure high realism. Specifically, the synthetic population () is generated to mirror real-world demographic structures. Age assignments follow a Beta distribution () scaled to to reflect a realistic age pyramid [23], while household composition and vulnerability layers are initialized based on official census and homeless population reports [24,25]. Furthermore, initial wealth is allocated according to Lorenz curve principles (Table 2), ensuring a representative wealth inequality distribution (Table 3).
Table 2.
Income stratification based on World Bank quintile data () [26].
Table 3.
Simulation configuration: Economic structure and Agent dynamics.
4. Experimental Design
To rigorously assess the validity and heuristic power of the proposed framework, we structured the experimental evaluation into two distinct phases: (1) Core Scenario Exploration, which functions as a “computational policy laboratory” to investigate emergent socio-economic dynamics under distinct macroscopic conditions; and (2) Model Robustness Validation, which scrutinizes the internal consistency of the LLM-driven cognitive architecture across different parameter scales and backend models.
4.1. Stage One: Core Scenario Exploration
We designed three representative scenarios to explore the non-linear coupling between epidemic control and economic sustainability. To ensure statistical reliability and mitigate the impact of stochasticity, each scenario was repeated five times using the DeepSeek-V3 model in the standard experimental environment (, see Table 4). Crucially, to eliminate bias from specific initialization artifacts, the population is resampled for each run using independent random seeds. This ensures that the aggregated results reflect robust systemic dynamics valid across diverse demographic configurations, rather than accumulating from a single fixed population structure.
Table 4.
Simulation configuration: Environmental and Epidemiological parameters ().
4.1.1. Scenario A: The Baseline (Laissez-Faire)
This control scenario simulates the system’s natural evolution without centralized intervention. The Government agent is passive, issuing no NPIs or fiscal stimulus, simulating a government that imposes no restrictions during the pandemic, allowing agents to act freely as they would during non-pandemic periods. Individual agents rely entirely on their autonomous risk-reward assessments to navigate the crisis. The objective is to establish the baseline trajectory of the epidemic–economic system, isolating the endogenous interaction dynamics between viral spread and spontaneous agent behavior.
4.1.2. Scenario B: Health-Priority Intervention (Lockdown + Stimulus)
This scenario simulates an aggressive, health-centric government strategy implementing the following approaches to model a government that prioritizes citizens’ lives as its primary protection goal: (1) Dynamic circuit breaker mechanism, triggering mandatory stay-at-home orders when infection rates exceed 5% and lifting them when transmission falls to safe levels; (2) Targeted economic relief, with the government automatically distributing fiscal stimulus to unemployed agents; (3) Reinforced government intervention, emphasizing in the prompts to government agents their governing style—willing to protect public health at all costs, regardless of economic consequences. Our objective is to assess the trade-offs of suppression strategies, specifically quantifying the extent to which strict containment flattens the infection curve and whether parallel fiscal aid buffers economic volatility.
4.1.3. Scenario C: Decentralized Adaptation (Remote Work)
This scenario differs from top-down mandates by introducing labor market flexibility. The Work From Home Action (WFH) mechanism is activated, allowing agents to autonomously switch to remote work based on risk perception. We model a modern digital economy where remote work is fully efficient, enabling agents to maintain full income without physical presence. We investigate whether decentralized autonomous adaptation can serve as a viable soft containment strategy, balancing public health and economic continuity.
4.2. Stage Two: Model Robustness Validation
This stage addresses a fundamental epistemological question in LLM-based simulation: To what extent are the observed macroscopic phenomena attributable to the system’s structural design rather than stochastic artifacts, parameter scale, or model-specific biases?
4.2.1. Parameter Scale Setup
We conducted comparative experiments using the DeepSeek-V3 model at a larger scale () to verify if the macroscopic trends observed in the standard environment () hold true. The experiments were repeated twice due to higher computational costs. Table 5 summarizes the scaling logic.
Table 5.
Parameter configuration for the robustness experiments.
4.2.2. LLM Generalization Setup
We deployed four distinct commercial and open-source LLMs (DeepSeek-V3, GPT-4o-mini, Qwen2.5, Gemini2.0-flash) to drive the agent population in the standard environment (). The simulation parameters mirrored the Baseline Scenario (Scenario A), allowing for a direct comparison of time-series outputs across key macroscopic indicators.
5. Results
This section presents the results of our computational experiments. We first detail the socio-economic dynamics revealed by the core scenarios, then provide a microscopic analysis of agent behaviors to demonstrate high fidelity, and finally confirm the system’s robustness.
5.1. Core Scenario Exploration Results
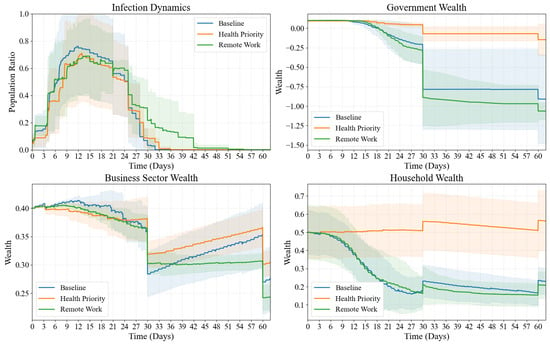
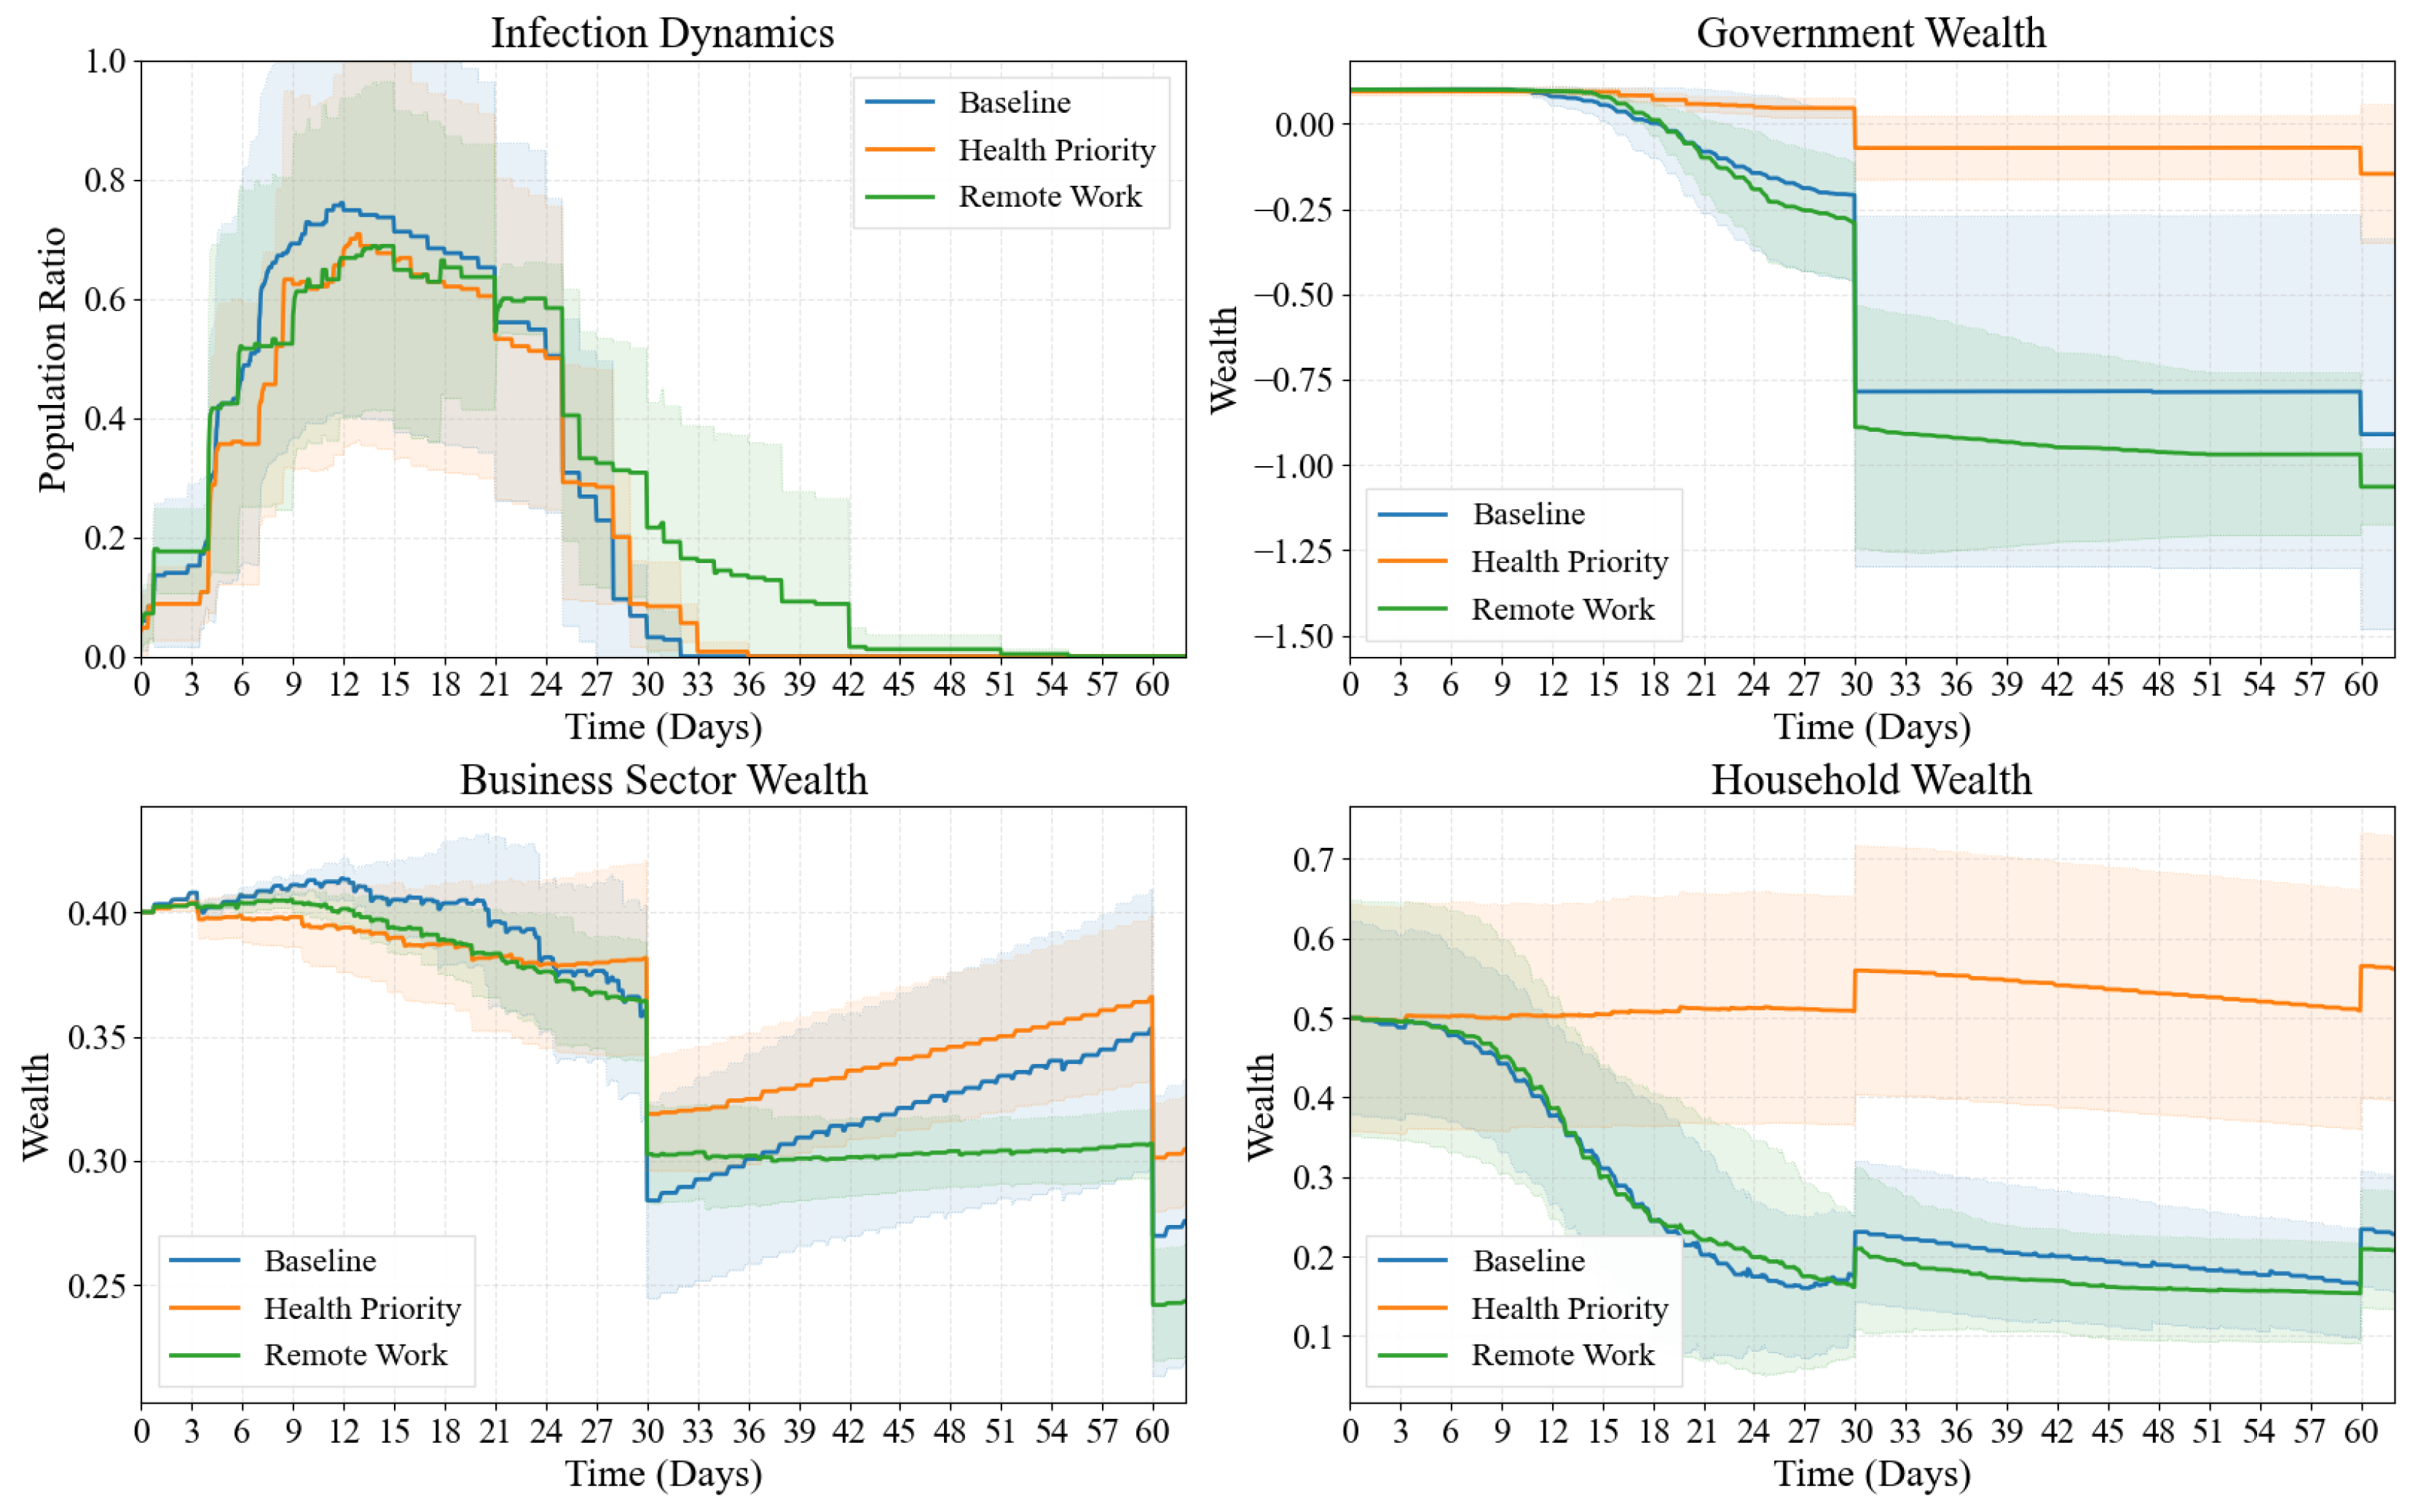
We simulated the three core scenarios, and the comparison of their macroscopic results reveals profound differences under distinct macroscopic conditions. Figure 3 provides an overall comparison of key metrics, while Figure 4, Figure 5 and Figure 6 present detailed dynamics.
Figure 3.
Macroscopic Dynamics Comparison across Core Scenarios. This figure contrasts the infection curves and economic indicators (such as unemployment and GDP loss) across the distinct macroscopic conditions, highlighting the trade-offs between health and economy.
Figure 4.
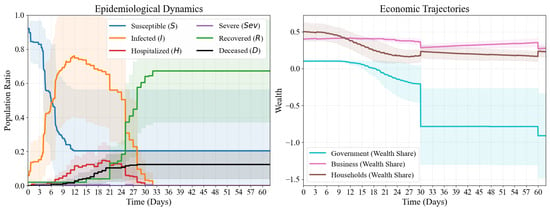
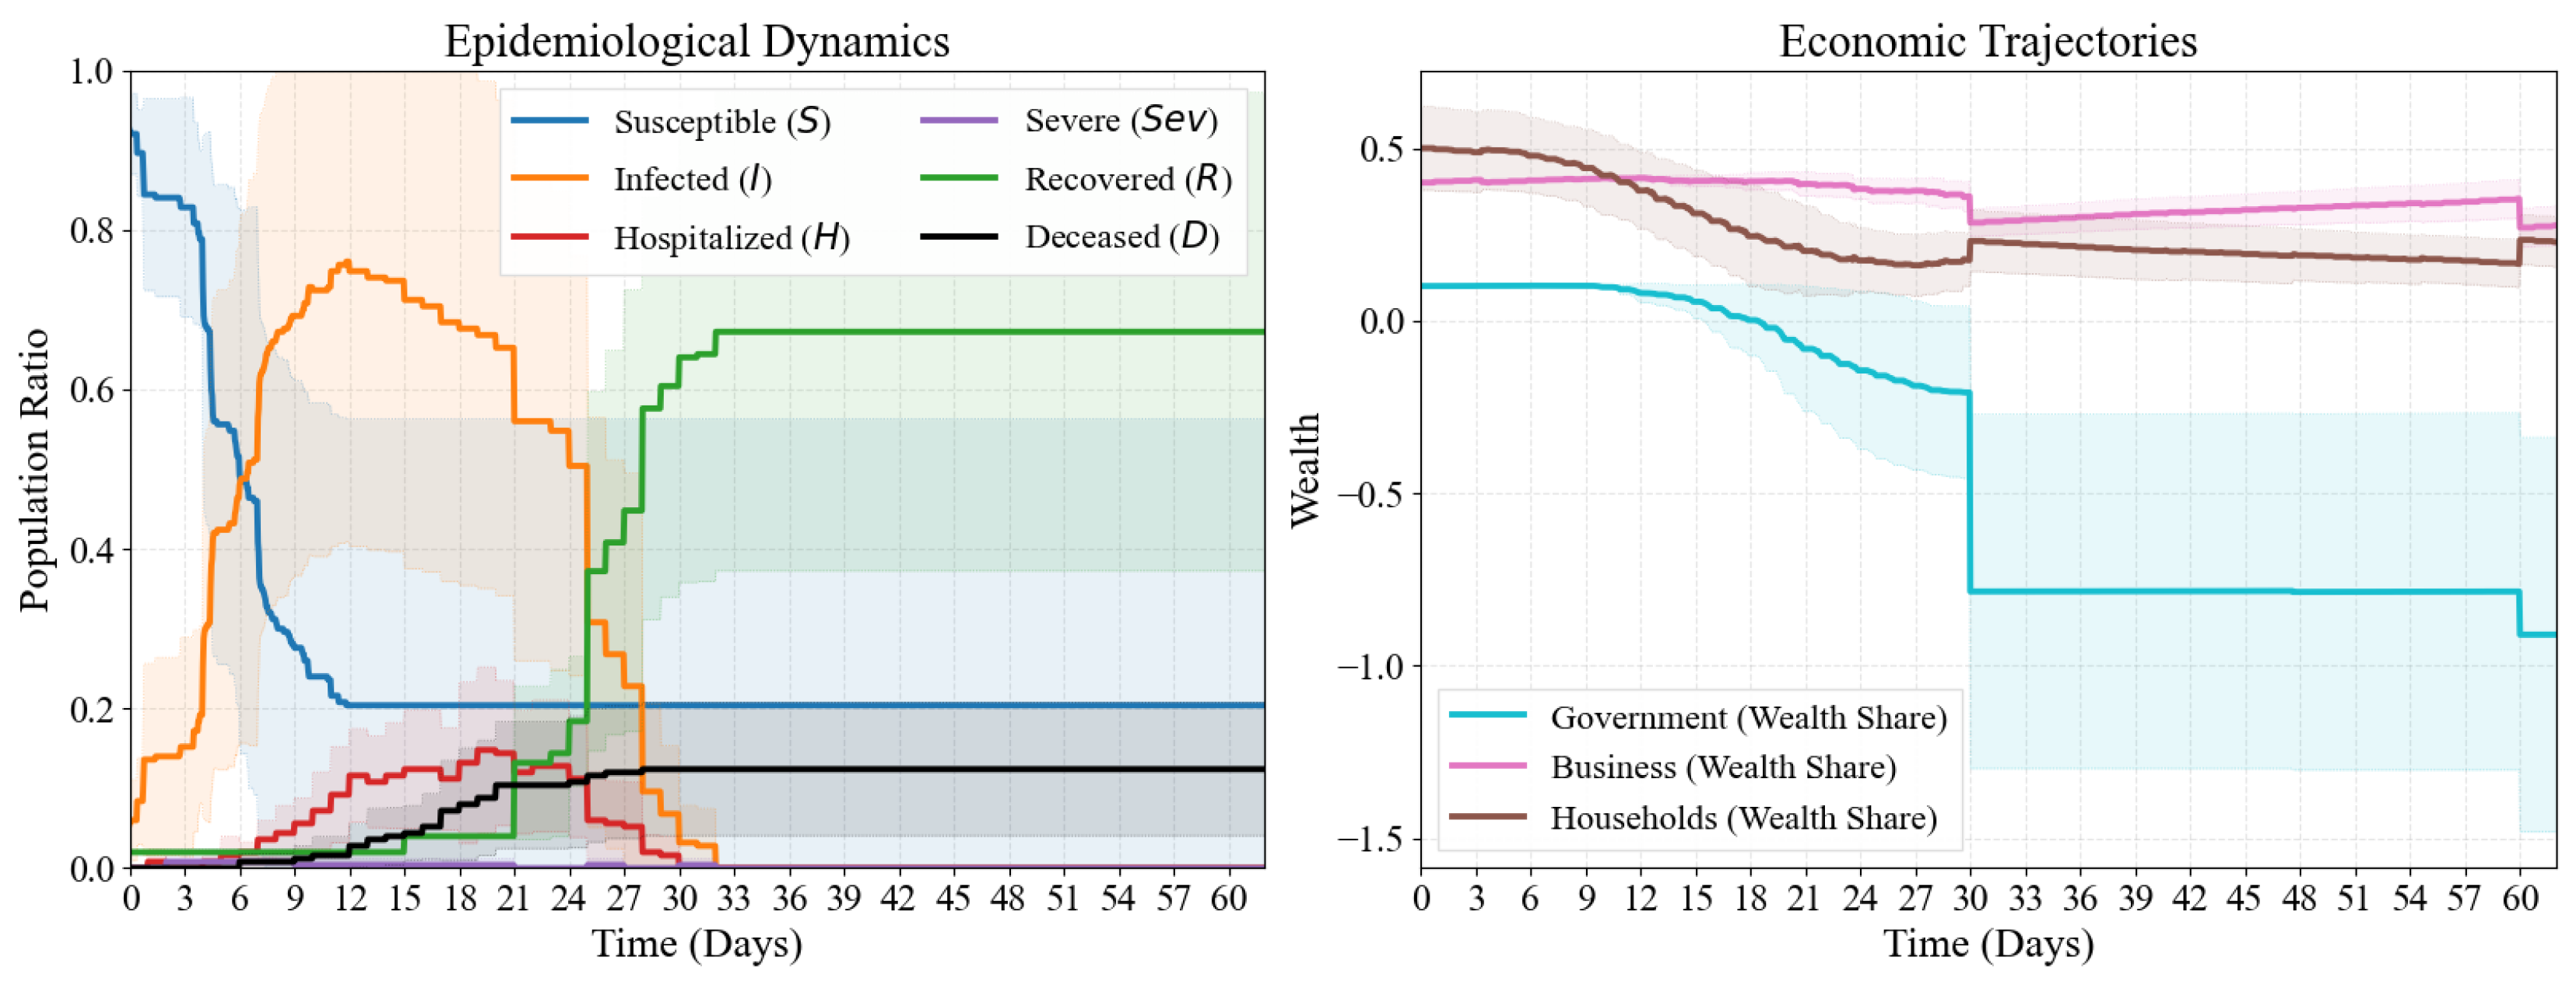
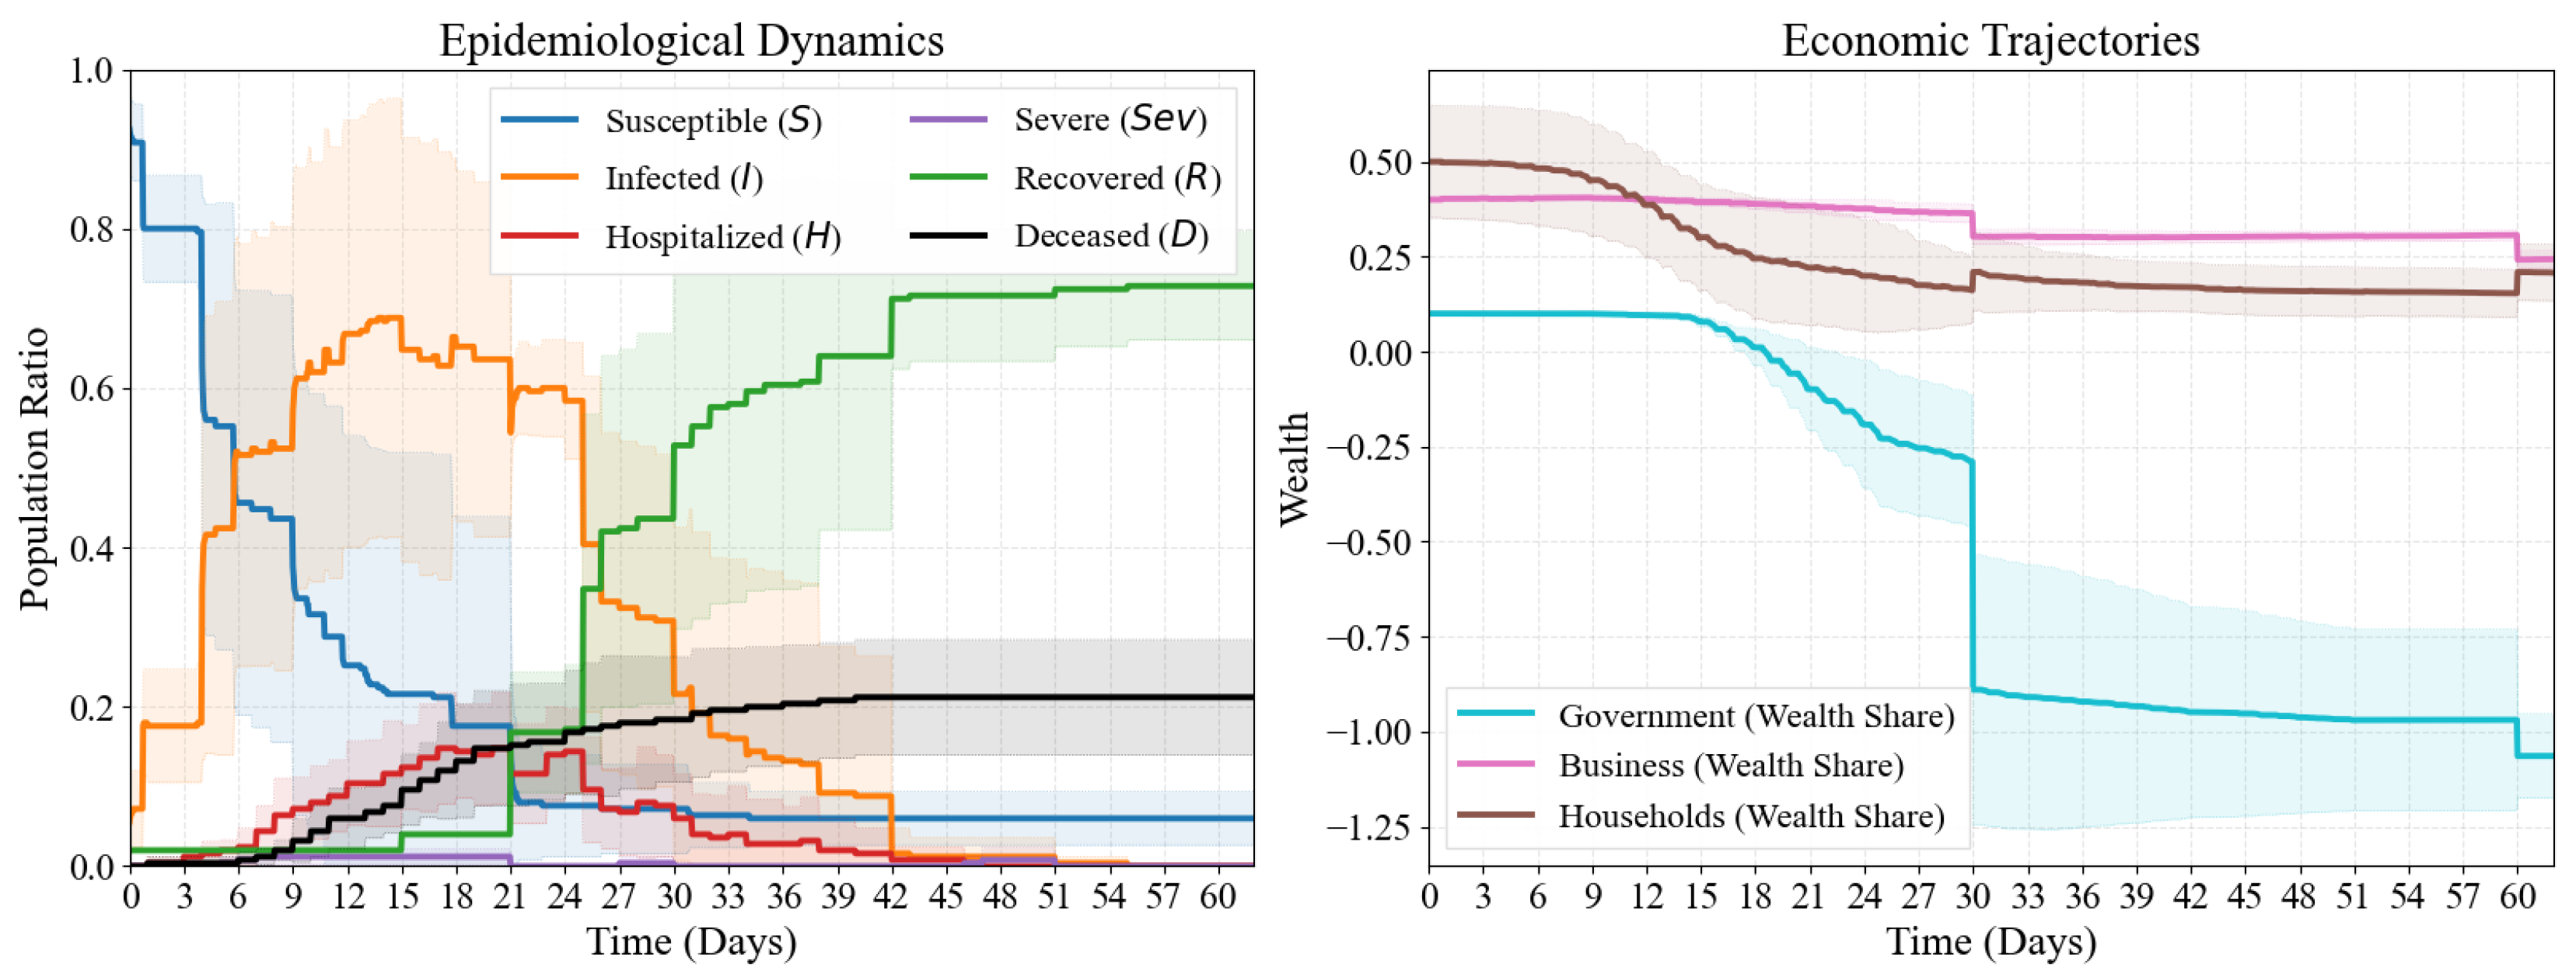
Detailed Dynamics of Scenario A (Baseline). The panels show the time evolution of the epidemic (SEIR states) and economic status (wealth, unemployment) under a laissez-faire policy.
Figure 5.
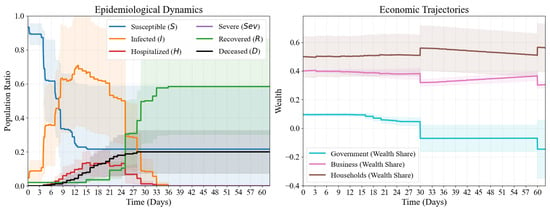
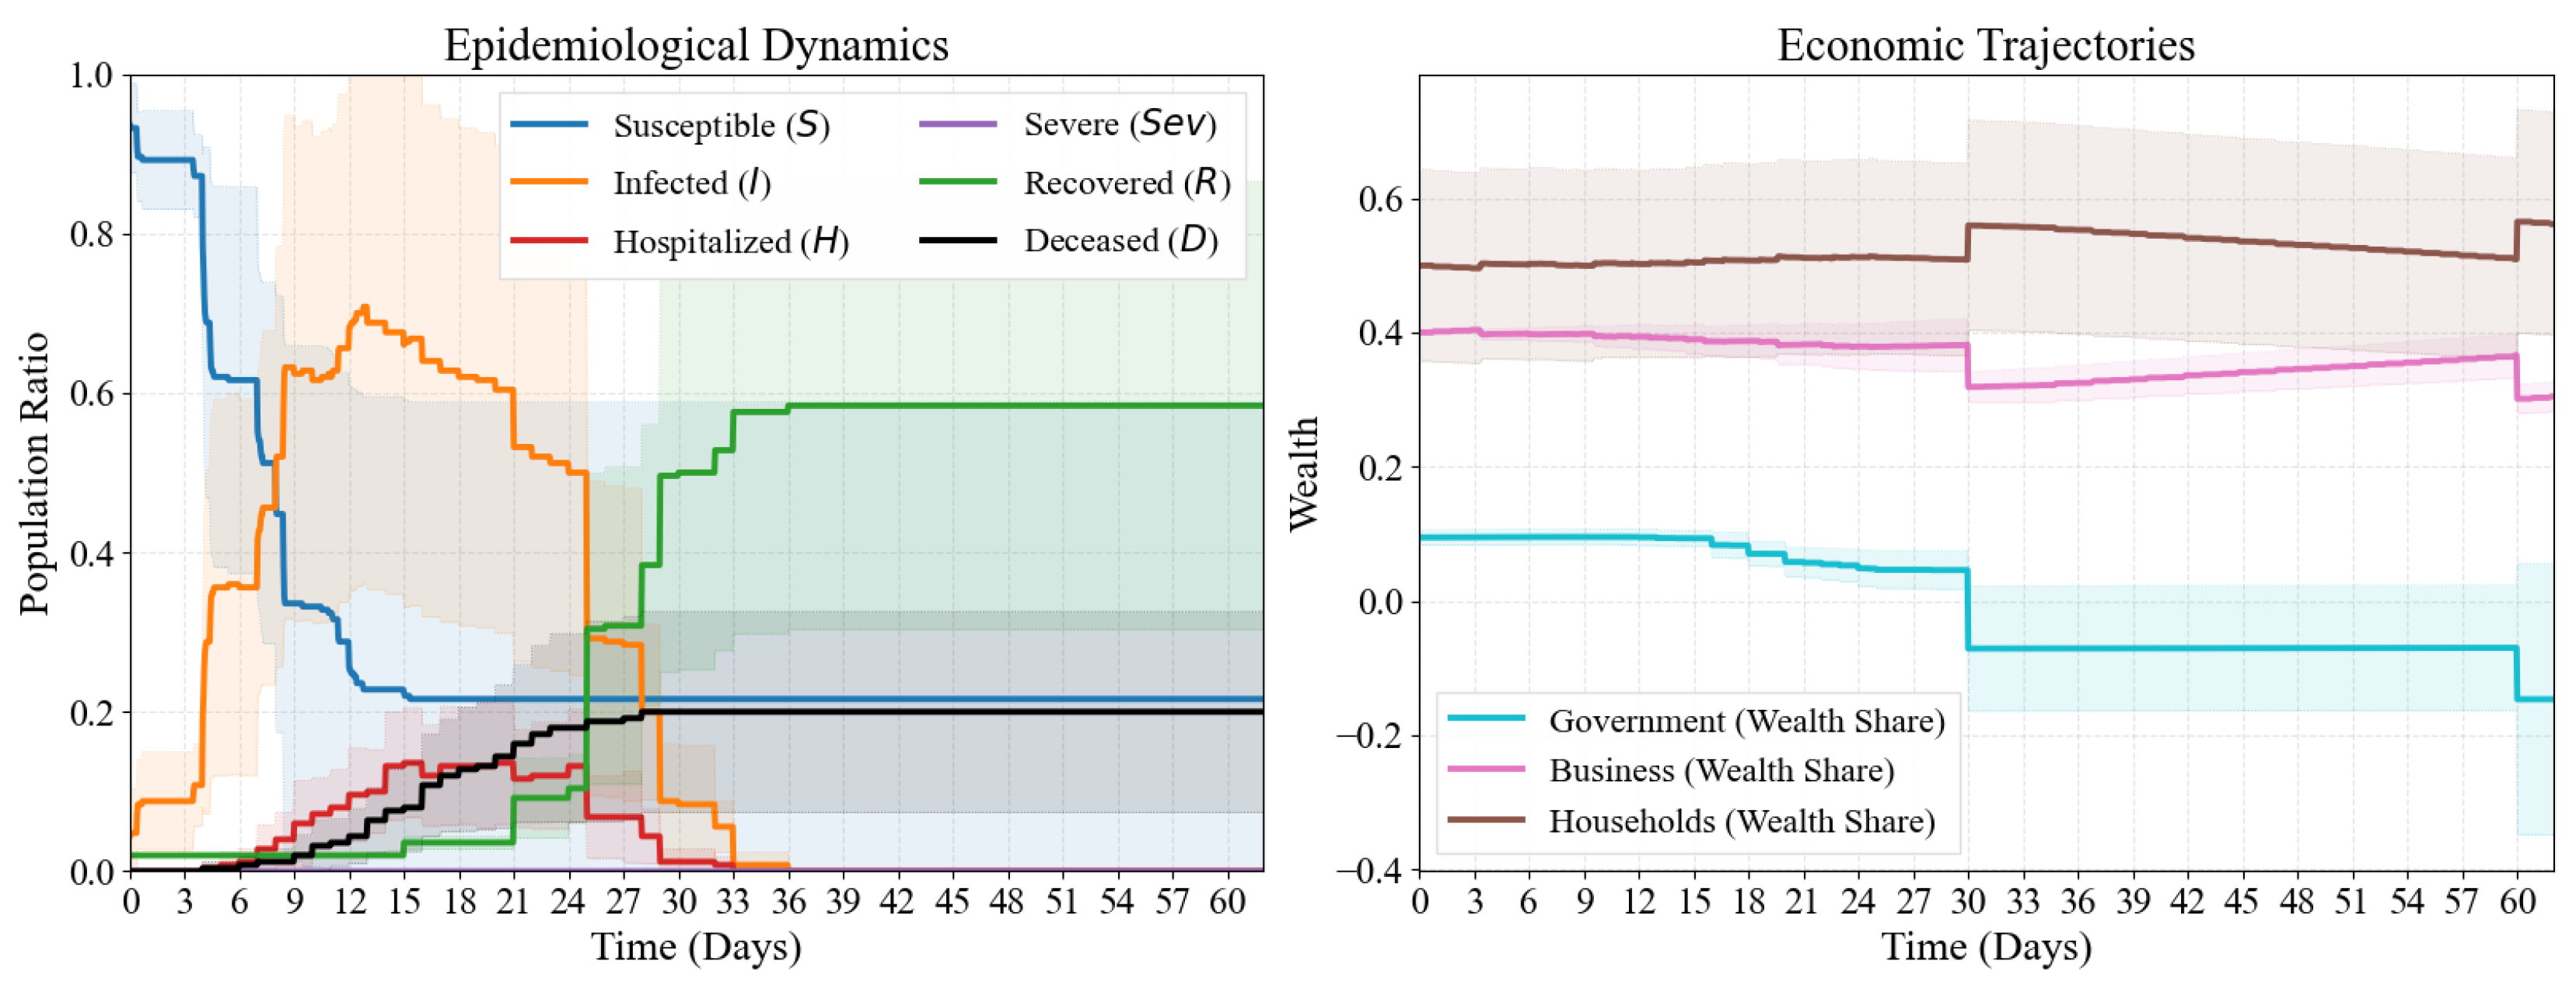
Detailed Dynamics of Scenario B (Health Priority). The panels illustrate the impact of dynamic lockdown policies, showing “flattened” infection curves but significant fluctuations in economic activity.
Figure 6.
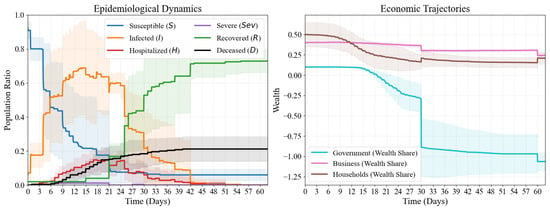
Detailed Dynamics of Scenario C (Remote Work). The panels show the outcomes of the WFH mechanism, highlighting a “Soft Landing” effect on both health and economy.
5.1.1. Scenario A: Baseline
The results of the baseline scenario (Figure 4) reveal the natural evolutionary trajectory of the system without external intervention. Epidemiologically, the system experienced dramatic exponential growth, with the infected population peaking around day 24 and leading to rapid depletion of susceptible individuals. Deaths continued to rise, stabilizing at approximately 12% of the population. Economically, while wealth interaction remained stable initially, the rapid epidemic spread caused a healthcare system collapse and excessive medical expenses. These results demonstrate that a laissez-faire strategy in the face of a highly contagious epidemic inevitably leads to a dual crisis in public health and the economy.
5.1.2. Scenario B: Dynamic Health Priority
In Scenario B (Figure 5), the dynamic lockdown strategy successfully flattened the curve, delaying the infection peak and reducing total fatalities. However, this success came at a steep economic price. The stop-and-go nature of lockdowns caused severe fluctuations in business operations, leading to cyclical spikes in unemployment. This illustrates the classic trade-off: strict containment preserves life but induces deep, intermittent economic recessions disproportionately affecting lower-income agents.
5.1.3. Scenario C: Decentralized Adaptation
Scenario C (Figure 6) demonstrates the Soft Landing effect of the decentralized WFH mechanism. As infection rates rose, agents spontaneously shifted to remote work, reducing contact density without government coercion. This autonomous adaptation significantly lowered the peak infection rate. Economically, as the simulation models a digital economy where remote productivity is fully preserved, the system avoided the deep recession seen in Scenario B. This suggests that empowering individual flexibility can be a superior strategy to rigid top-down mandates.
5.2. Deep Mechanism Analysis
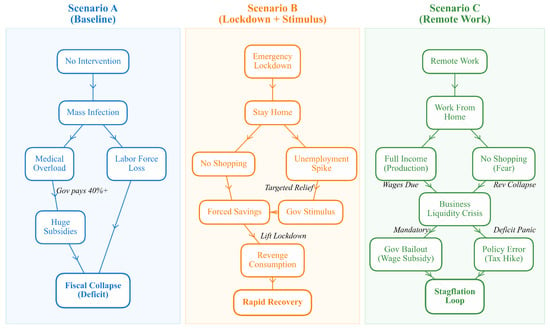
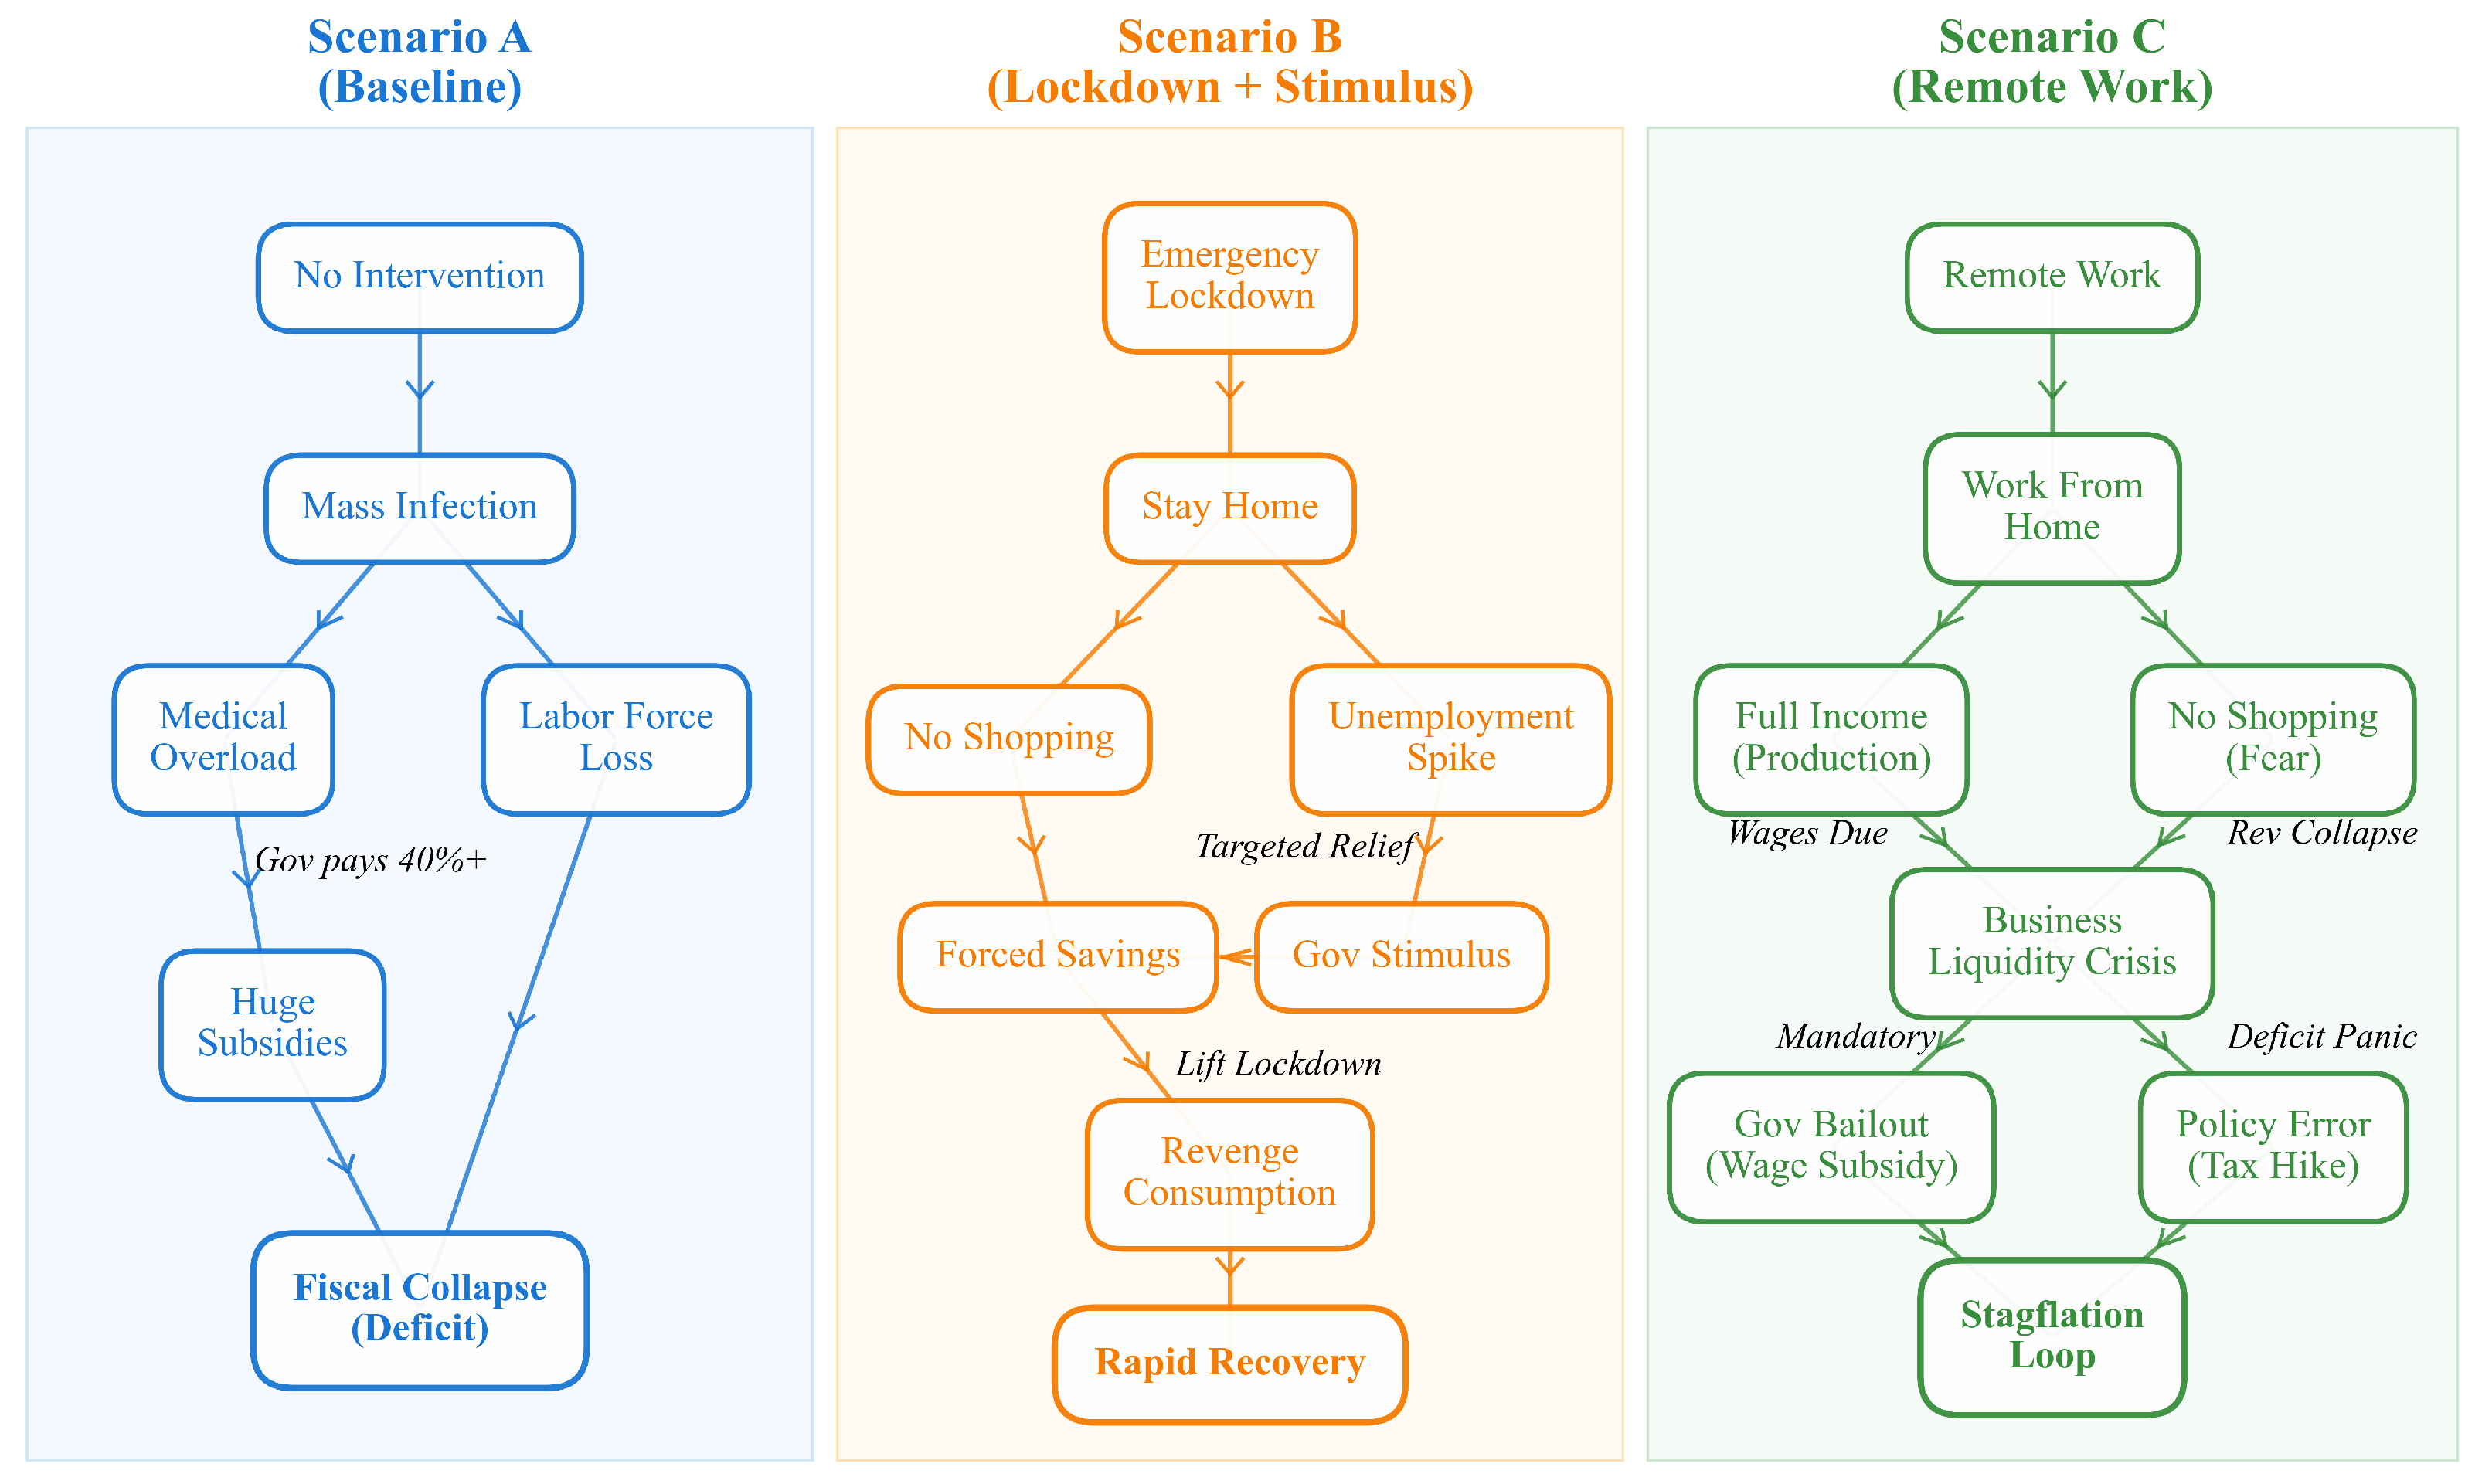
Beyond verifying basic rationality, our deep analysis of the simulation logs reveals complex causal chains that drive the divergent outcomes. To systematically explain these emergent phenomena, we constructed a Causal Loop Diagram (Figure 7) based on the agent interaction traces.
Figure 7.
Causal Influence Diagram of Pandemic Economics. This figure maps the distinct logic chains for each scenario, derived from the simulation’s execution traces. It illustrates how micro-level behaviors (e.g., WFH, Lockdown) propagate through the economic network to produce macro-level outcomes (e.g., Deficit, Recovery). Arrows indicate causal direction.
In the Baseline scenario, the economic collapse is driven by a passive drain mechanism. The exponential infection rate leads to a surge in medical expenses. The model design specifies that medical costs are shared: 50% is paid by the individual (depleting household savings) and the remainder is subsidized by the government (via the healthcare system). This creates a Cost-Push Deficit where the government, despite having no active fiscal policy, is drained by the massive healthcare bill, leading to the dual bankruptcy of both households and the state.
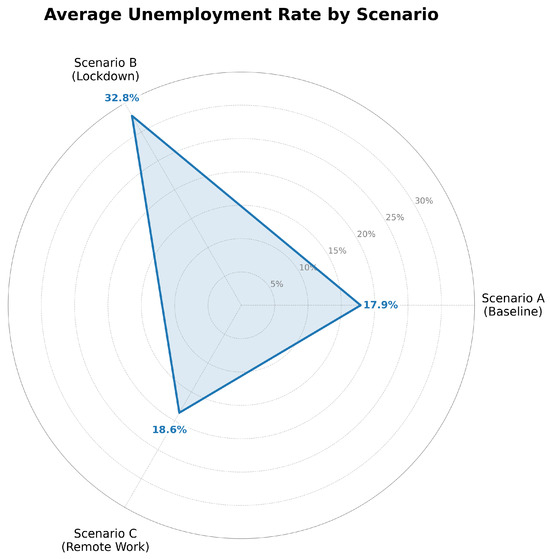
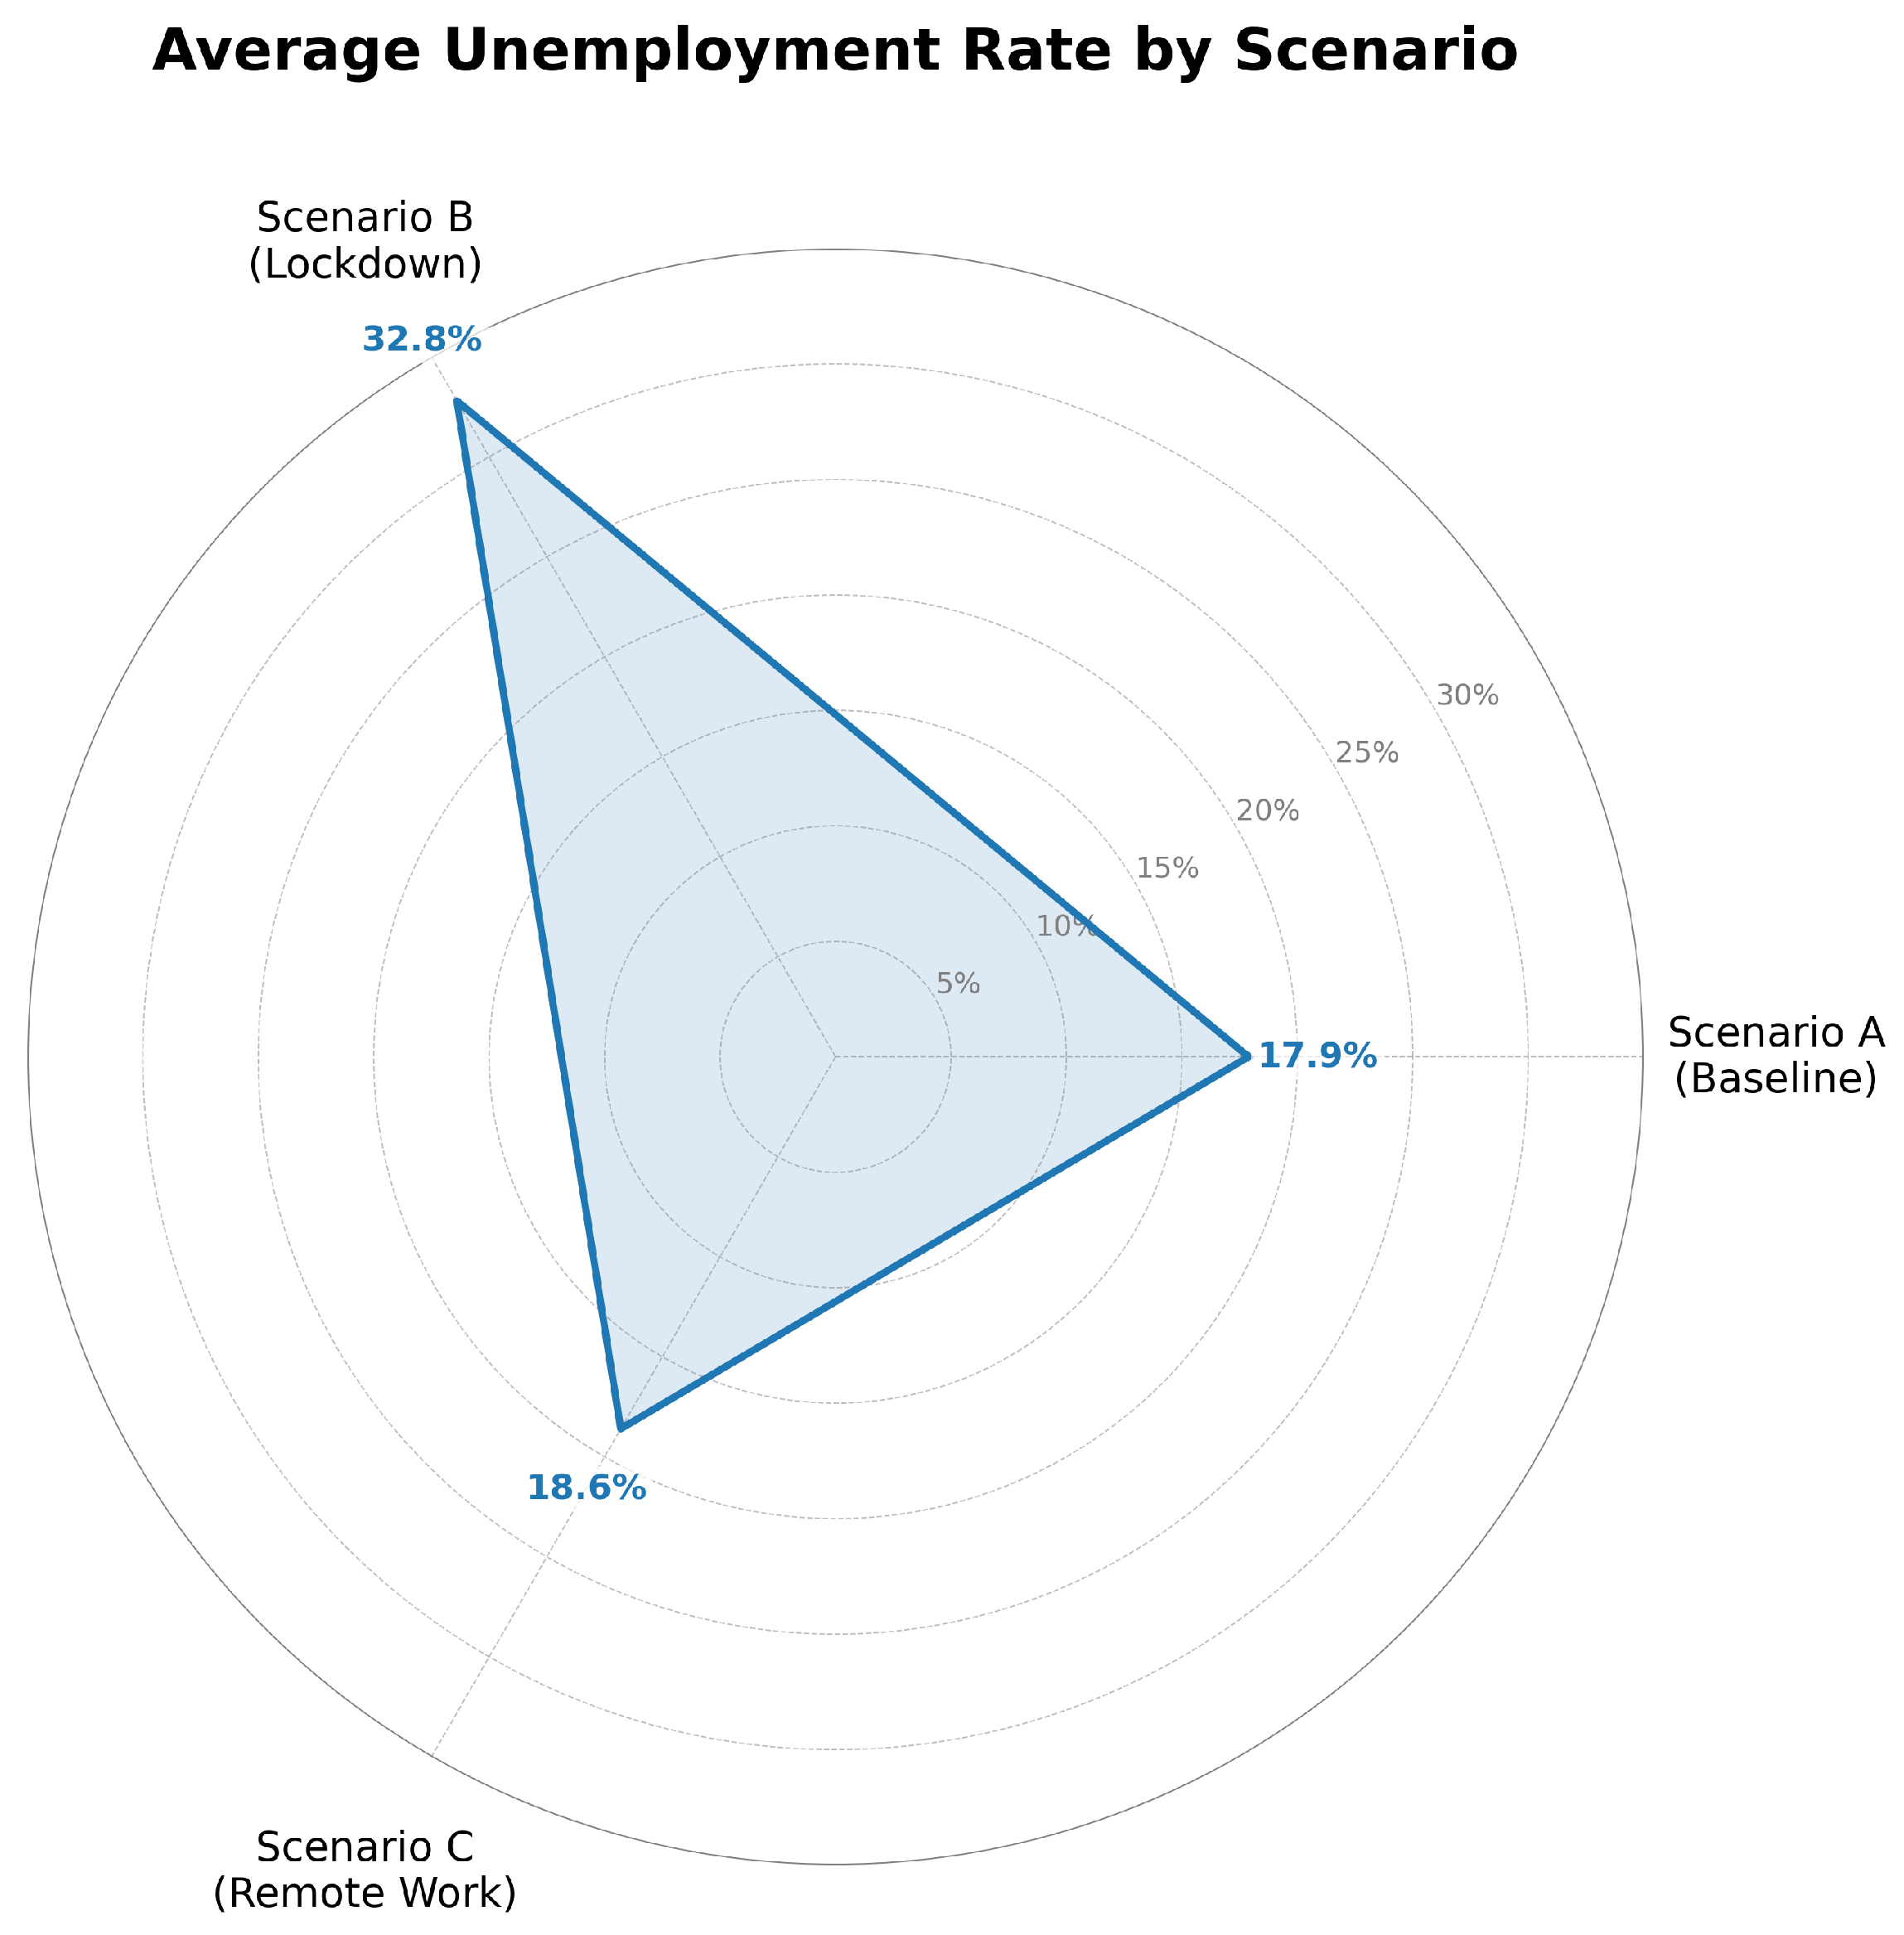
Scenario B reveals the hidden economic costs of strict containment. While the lockdown effectively curbed transmission by restricting mobility, it induced a dual stagnation in both consumption and production. On the demand side, confined individuals drastically reduced shopping, causing business revenues to decline significantly. On the supply side, businesses continued to incur fixed operational costs despite workforce absence. To balance their books, firms were forced to execute mass layoffs, leading to a sharp spike in unemployment (as shown in Figure 8).
Figure 8.
Comparison of Unemployment Metrics across Scenarios. The radar chart highlights the structural damage to the labor market in Scenario B compared to the resilience observed in Scenario C.
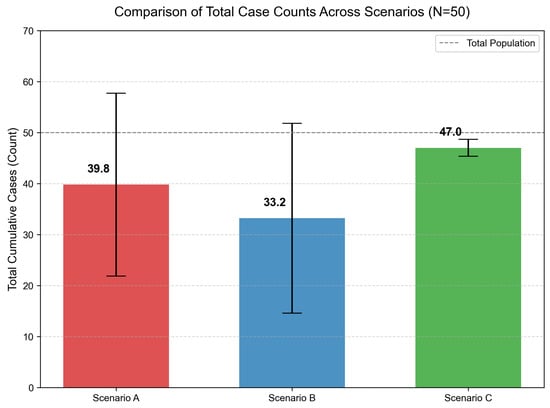
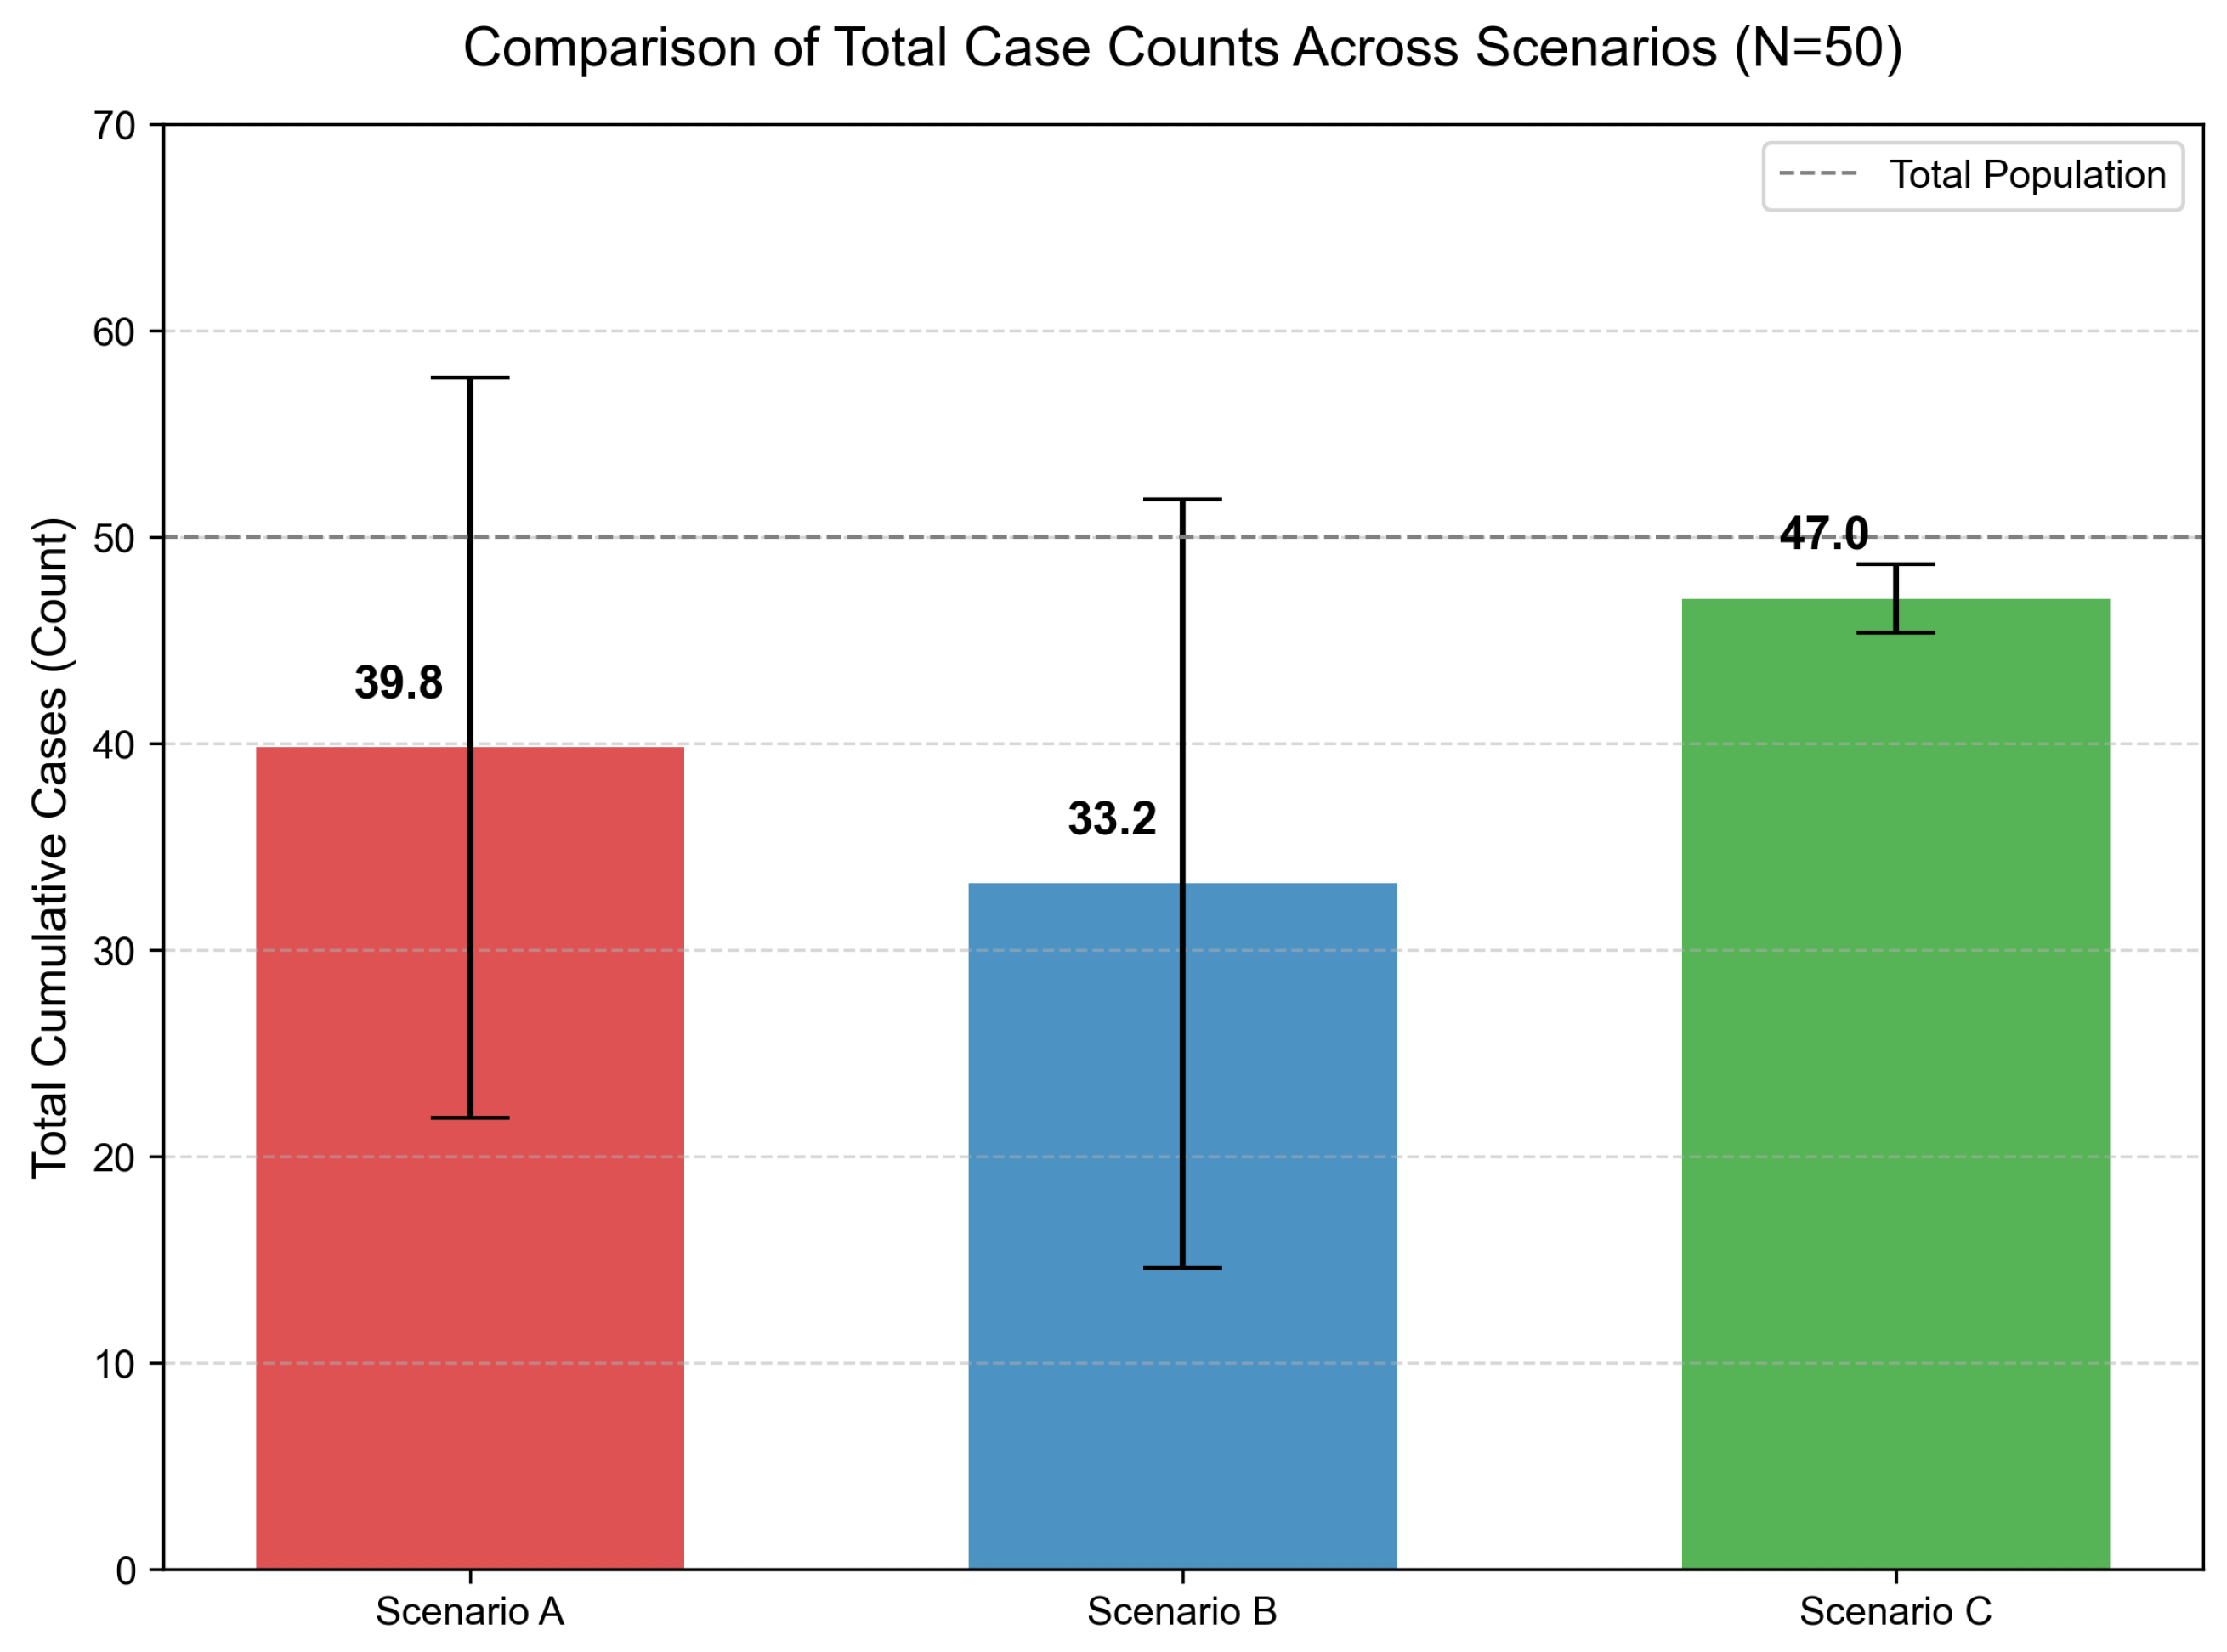
However, this economic resilience comes at an epidemiological cost. Figure 9 presents the total cumulative case counts across the three scenarios. While Scenario C avoids economic collapse, it results in a higher average total infection count () compared to Scenarios A () and B (). The remarkably low variance in Scenario C reflects the “Soft Landing” mechanism, where decentralized adaptation flattens the curve but prolongs the epidemic duration, leading to a stable, deterministic progression. In contrast, Scenarios A and B exhibit high volatility due to their reliance on extreme strategies—either complete laissez-faire or rigid blocking. Particularly in Scenario B, the outcome is hypersensitive to intervention timing; slight variations in the government’s decision window can lead to vastly different trajectories, causing the system to bifurcate between successful suppression and full-scale outbreak.
Figure 9.
Comparison of Total Cumulative Cases across Scenarios. The bar chart displays the final infected population count (Mean ± Std). Scenario C shows higher total infections but with minimal variance, reflecting a consistent “flattening” strategy that prolongs the outbreak, whereas A and B show high outcome uncertainty.
Scenario C presents a complex trade-off between epidemic duration and economic resilience. The remote work mechanism functioned as a “soft isolation,” successfully lowering the infection peak but significantly extending the epidemic’s tail. Unlike the other scenarios which concluded within a month, Scenario C persisted into the second month. However, the critical advantage of this strategy lies in its preservation of the labor market: by maintaining core productivity through remote work, businesses avoided the mass layoffs seen in Scenario B.
Fine-Grained Analysis of Macro-Economic Mechanisms. A detailed decomposition of the experimental results reveals that Scenario B (Health-Priority Intervention), despite imposing strict limitations on economic activity, preserves the highest level of Government Wealth among the explored scenarios. This phenomenon stems from the distinct interaction patterns between epidemiological loads and fiscal trigger mechanisms in each setting.
In the Baseline Scenario (A), the unmitigated transmission of the virus generates a substantial medical financial burden. Under the model’s mechanism where healthcare costs are shared between individuals and the government, the high infection rate translates into an accumulation of medical liabilities. At the end of the monthly billing cycle, the government is required to settle these extensive costs, resulting in a direct and severe reduction in fiscal reserves.
In Scenario C (Decentralized Adaptation), although remote work strategies maintain infection rates closer to Scenario B levels, a discordance emerges between continued payroll obligations and reduced consumption. Analysis of the agent decision logs (specifically the consumption frequency audit) indicates that while agents secure income via telework, their risk-averse behavior leads to a marked decline in physical shopping activities. Consequently, business revenues fall significantly below the wage obligations required to be paid at month-end. To ensure the survival of economic entities, the government is triggered to provide financial aid to cover these wage deficits, thereby transferring the private sector’s operating losses to the public fiscal balance.
Furthermore, the sharp economic volatility observed near Day 30 across all scenarios is driven by the system’s synchronized financial cycle. At the end of each month, a compound settlement event occurs where businesses disburse wages, households and firms pay taxes, and the government clears accumulated medical subsidies while distributing unemployment stimulus. This simultaneous liquidity clearing creates a distinct “pulse” in the wealth trajectories (visible in Figure 4), physically modeling the periodic nature of real-world macroeconomic flows.
In contrast, Scenario B effectively minimizes both expenditure vectors. Epidemiologically, the dynamic circuit breaker keeps infection rates significantly below those of Scenario A. Critically, given the substantial disparity in financial implications across different income strata (referencing Table 2), even moderate reductions in infection prevalence prevent the disproportionate accumulation of medical costs associated with widespread transmission, thereby significantly amplifying the fiscal advantages of low infection rates. Economically, the mandatory business closures in Scenario B suspend not only revenue generation but also the immediate pressure of wage payment obligations. Unlike Scenario C, where the government must intervene to bridge the revenue-wage gap, the suspended economic state of Scenario B alleviates the need for emergency fiscal stimulus. Thus, by simultaneously mitigating the medical expenditure shock observed in Scenario A and avoiding the subsidy burdens activated in Scenario C, Scenario B demonstrates superior performance in preserving government fiscal solvency.
5.3. Model Robustness Validation Results
5.3.1. Parameter Scale Results
We compared the macroscopic infection and economic curves between the and experiments (both using DeepSeek-V3). The results indicate that while the absolute values scale proportionally, the key structural features—such as the timing of the infection peak (Day 24 vs. Day 26), the final infection rate (≈98%), and the shape of the recession curve—remain highly consistent. This confirms that our findings are robust to population scale and that the experimental setup is a valid proxy for larger-scale dynamics.
5.3.2. LLM Generalization Results
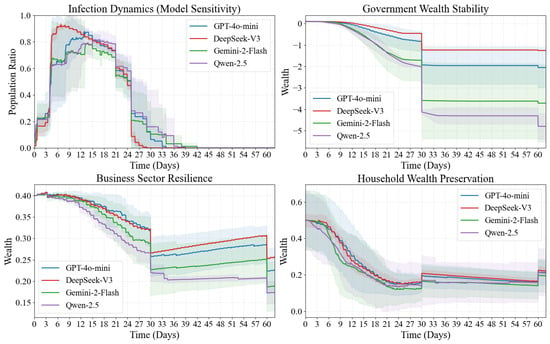
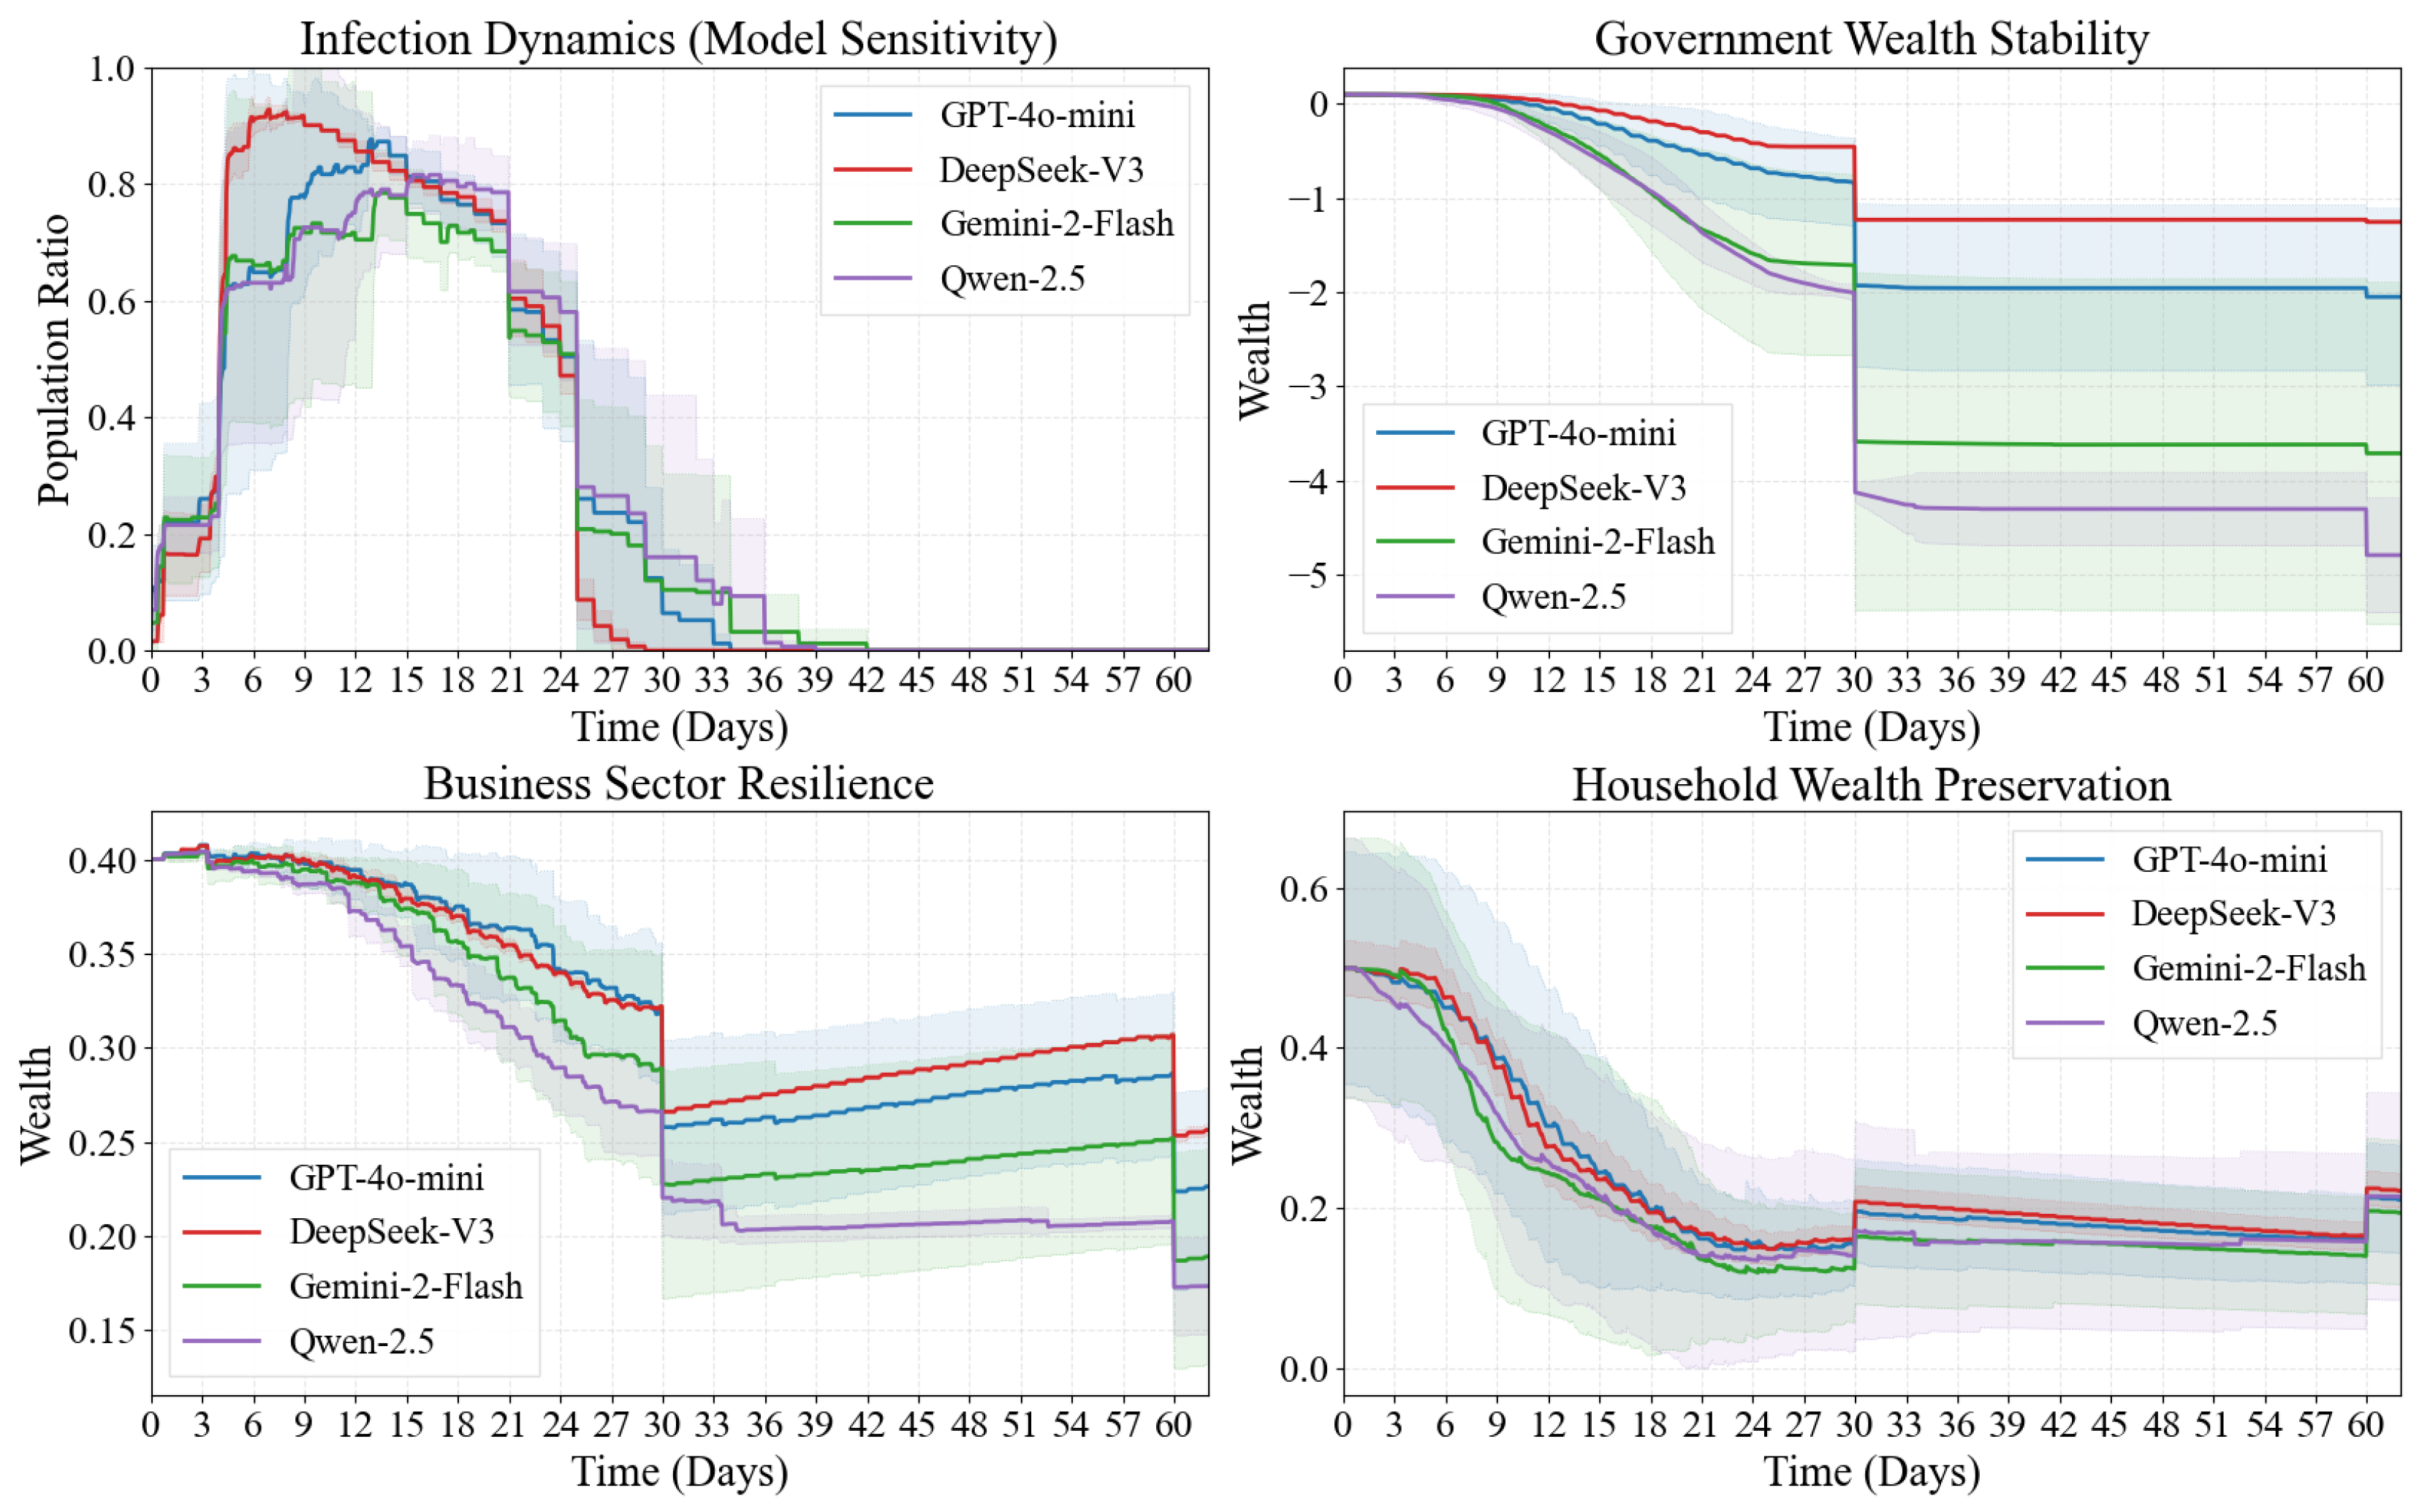
The experimental results (Figure 10) clearly indicate that simulations driven by the four models converge to highly similar social dynamics at the macroscopic level. Specifically, the peak of the infection curve is reached around day 25 for all, and the final mortality rate and magnitude of economic recession are also of the same order. This cross-model consistency strongly demonstrates that the socio-economic–epidemiological interaction patterns revealed by our simulation framework are a universal feature of the LLM-driven, common-sense-based agent architecture, rather than an artifact of any specific LLM.
Figure 10.
LLM Generalization Comparison. The figure demonstrates the robustness of our framework across four different LLM backends (DeepSeek-V3, GPT-4o-mini, Qwen2.5, Gemini2.0-flash). Despite differences in underlying architectures, the macroscopic socio-economic dynamics—including infection peaks and economic recession trends—remain qualitatively consistent.
5.4. Sensitivity Analysis
To validate the model’s responsiveness to critical parameters and ensure its reliability as a policy laboratory, we performed sensitivity analyses on both epidemiological and economic dimensions. In these analyses, the baseline metrics are derived from the averaged experimental results of Scenario A.
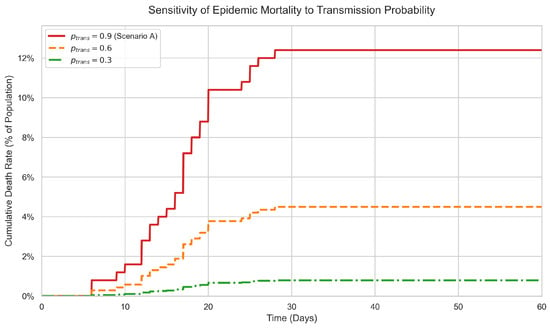
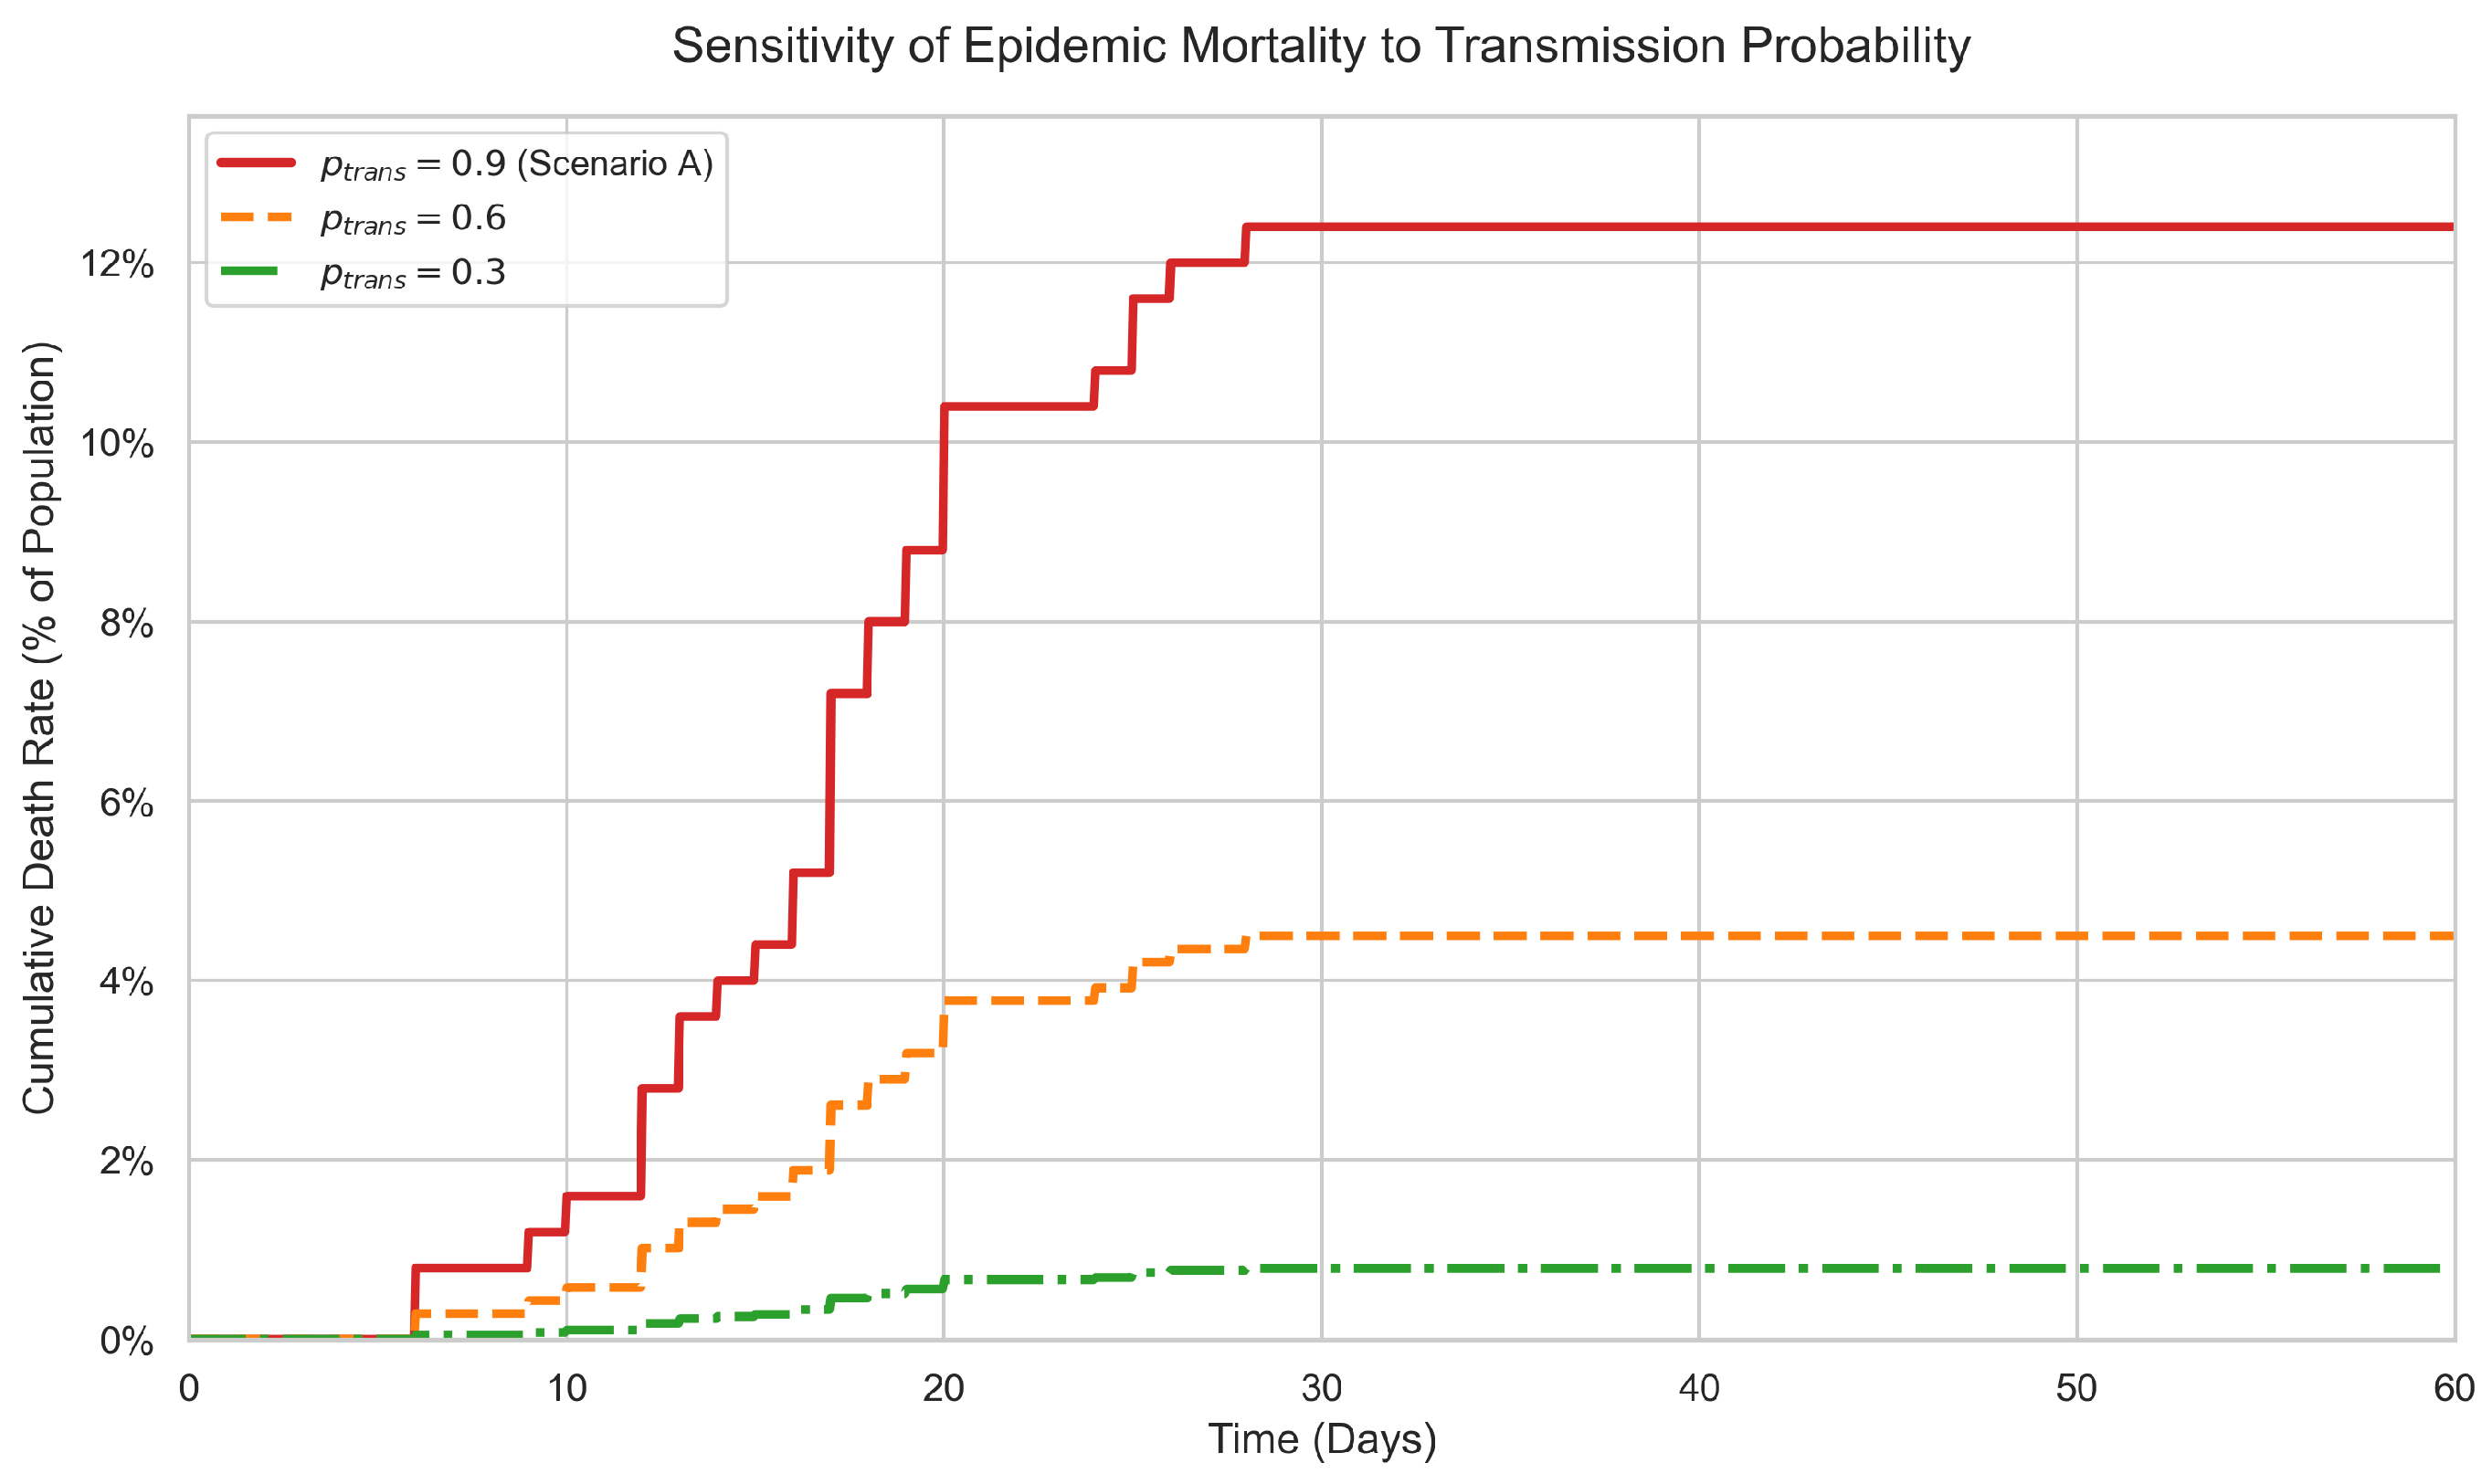
Impact of Transmission Probability. Figure 11 illustrates the system’s response to varying viral transmission probabilities (), with the curve representing the baseline data from Scenario A. The results demonstrate a clear and significant sensitivity: as decreases to 0.6 and 0.3, the cumulative mortality rate drops disproportionately, and the curve’s growth trajectory flattens markedly. This non-linear response confirms that the model correctly captures the mechanical sensitivity of infection dynamics to changes in contact parameters.
Figure 11.
Sensitivity of Epidemic Mortality to Transmission Probability (). The solid red line represents the baseline data from Scenario A (). The dashed lines simulate lower transmission scenarios (), showing a non-linear reduction in cumulative deaths and flattened growth curves, demonstrating the model’s epidemiological responsiveness.
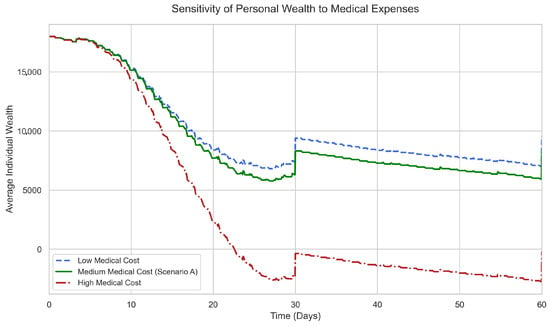
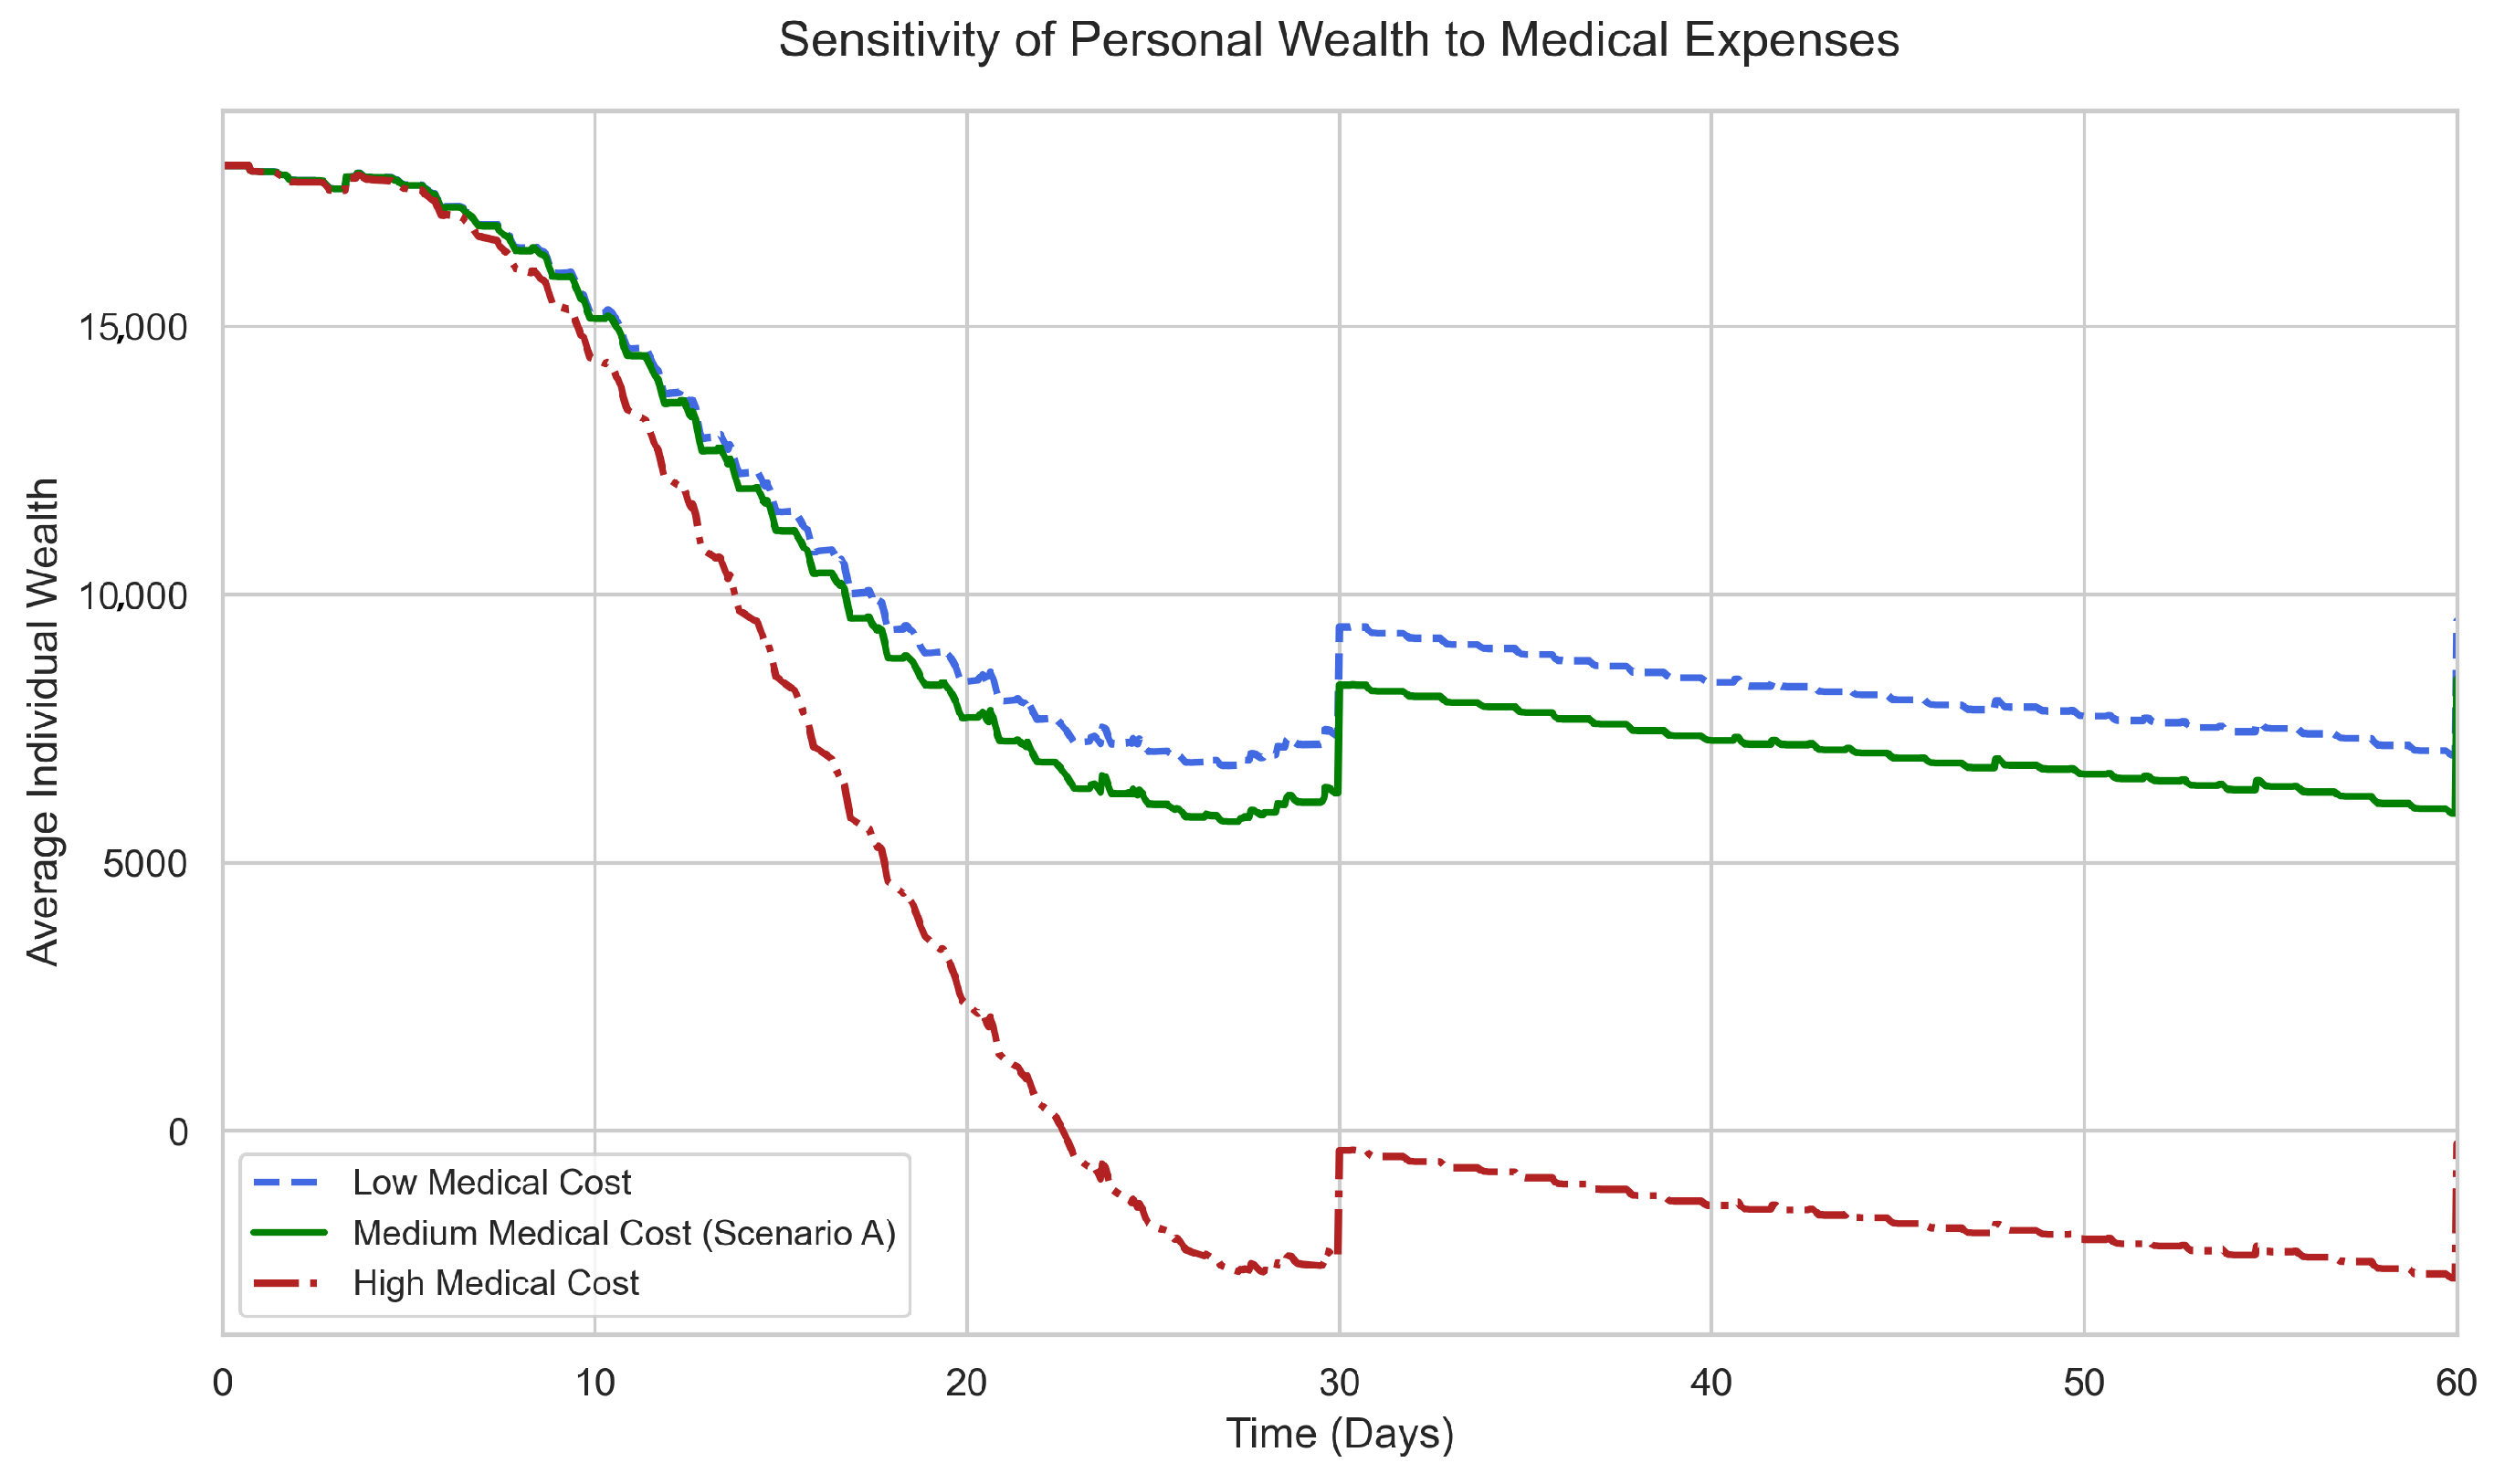
Impact of Medical Costs on Household Wealth. We further examined the model’s sensitivity to economic variables by varying the daily medical expense parameter. Figure 12 compares the wealth trajectories under Low, Medium (Scenario A baseline), and High cost conditions. The model exhibits distinct behavioral responses to these parameter shifts: during the outbreak phase (Days 0–30), the High Cost scenario triggers a drastic depletion of household wealth compared to the baseline, while the Low Cost scenario demonstrates significant economic preservation. This sharp, phase-dependent divergence highlights the model’s capability to sensitively reflect how economic shock parameters interact with epidemiological states, confirming its efficacy in quantifying the granular impact of economic variables within coupled dynamics.
Figure 12.
Sensitivity of Personal Wealth to Medical Expenses. The Green line represents the baseline wealth trajectory from Scenario A (Medium Cost). The significant deviation of the Red (High Cost) and Blue (Low Cost) lines during Month 1 illustrates the distinct economic shocks caused by varying medical costs during the infection peak, followed by parallel recovery trends.
5.5. External Validation Against Empirical Epidemic Data
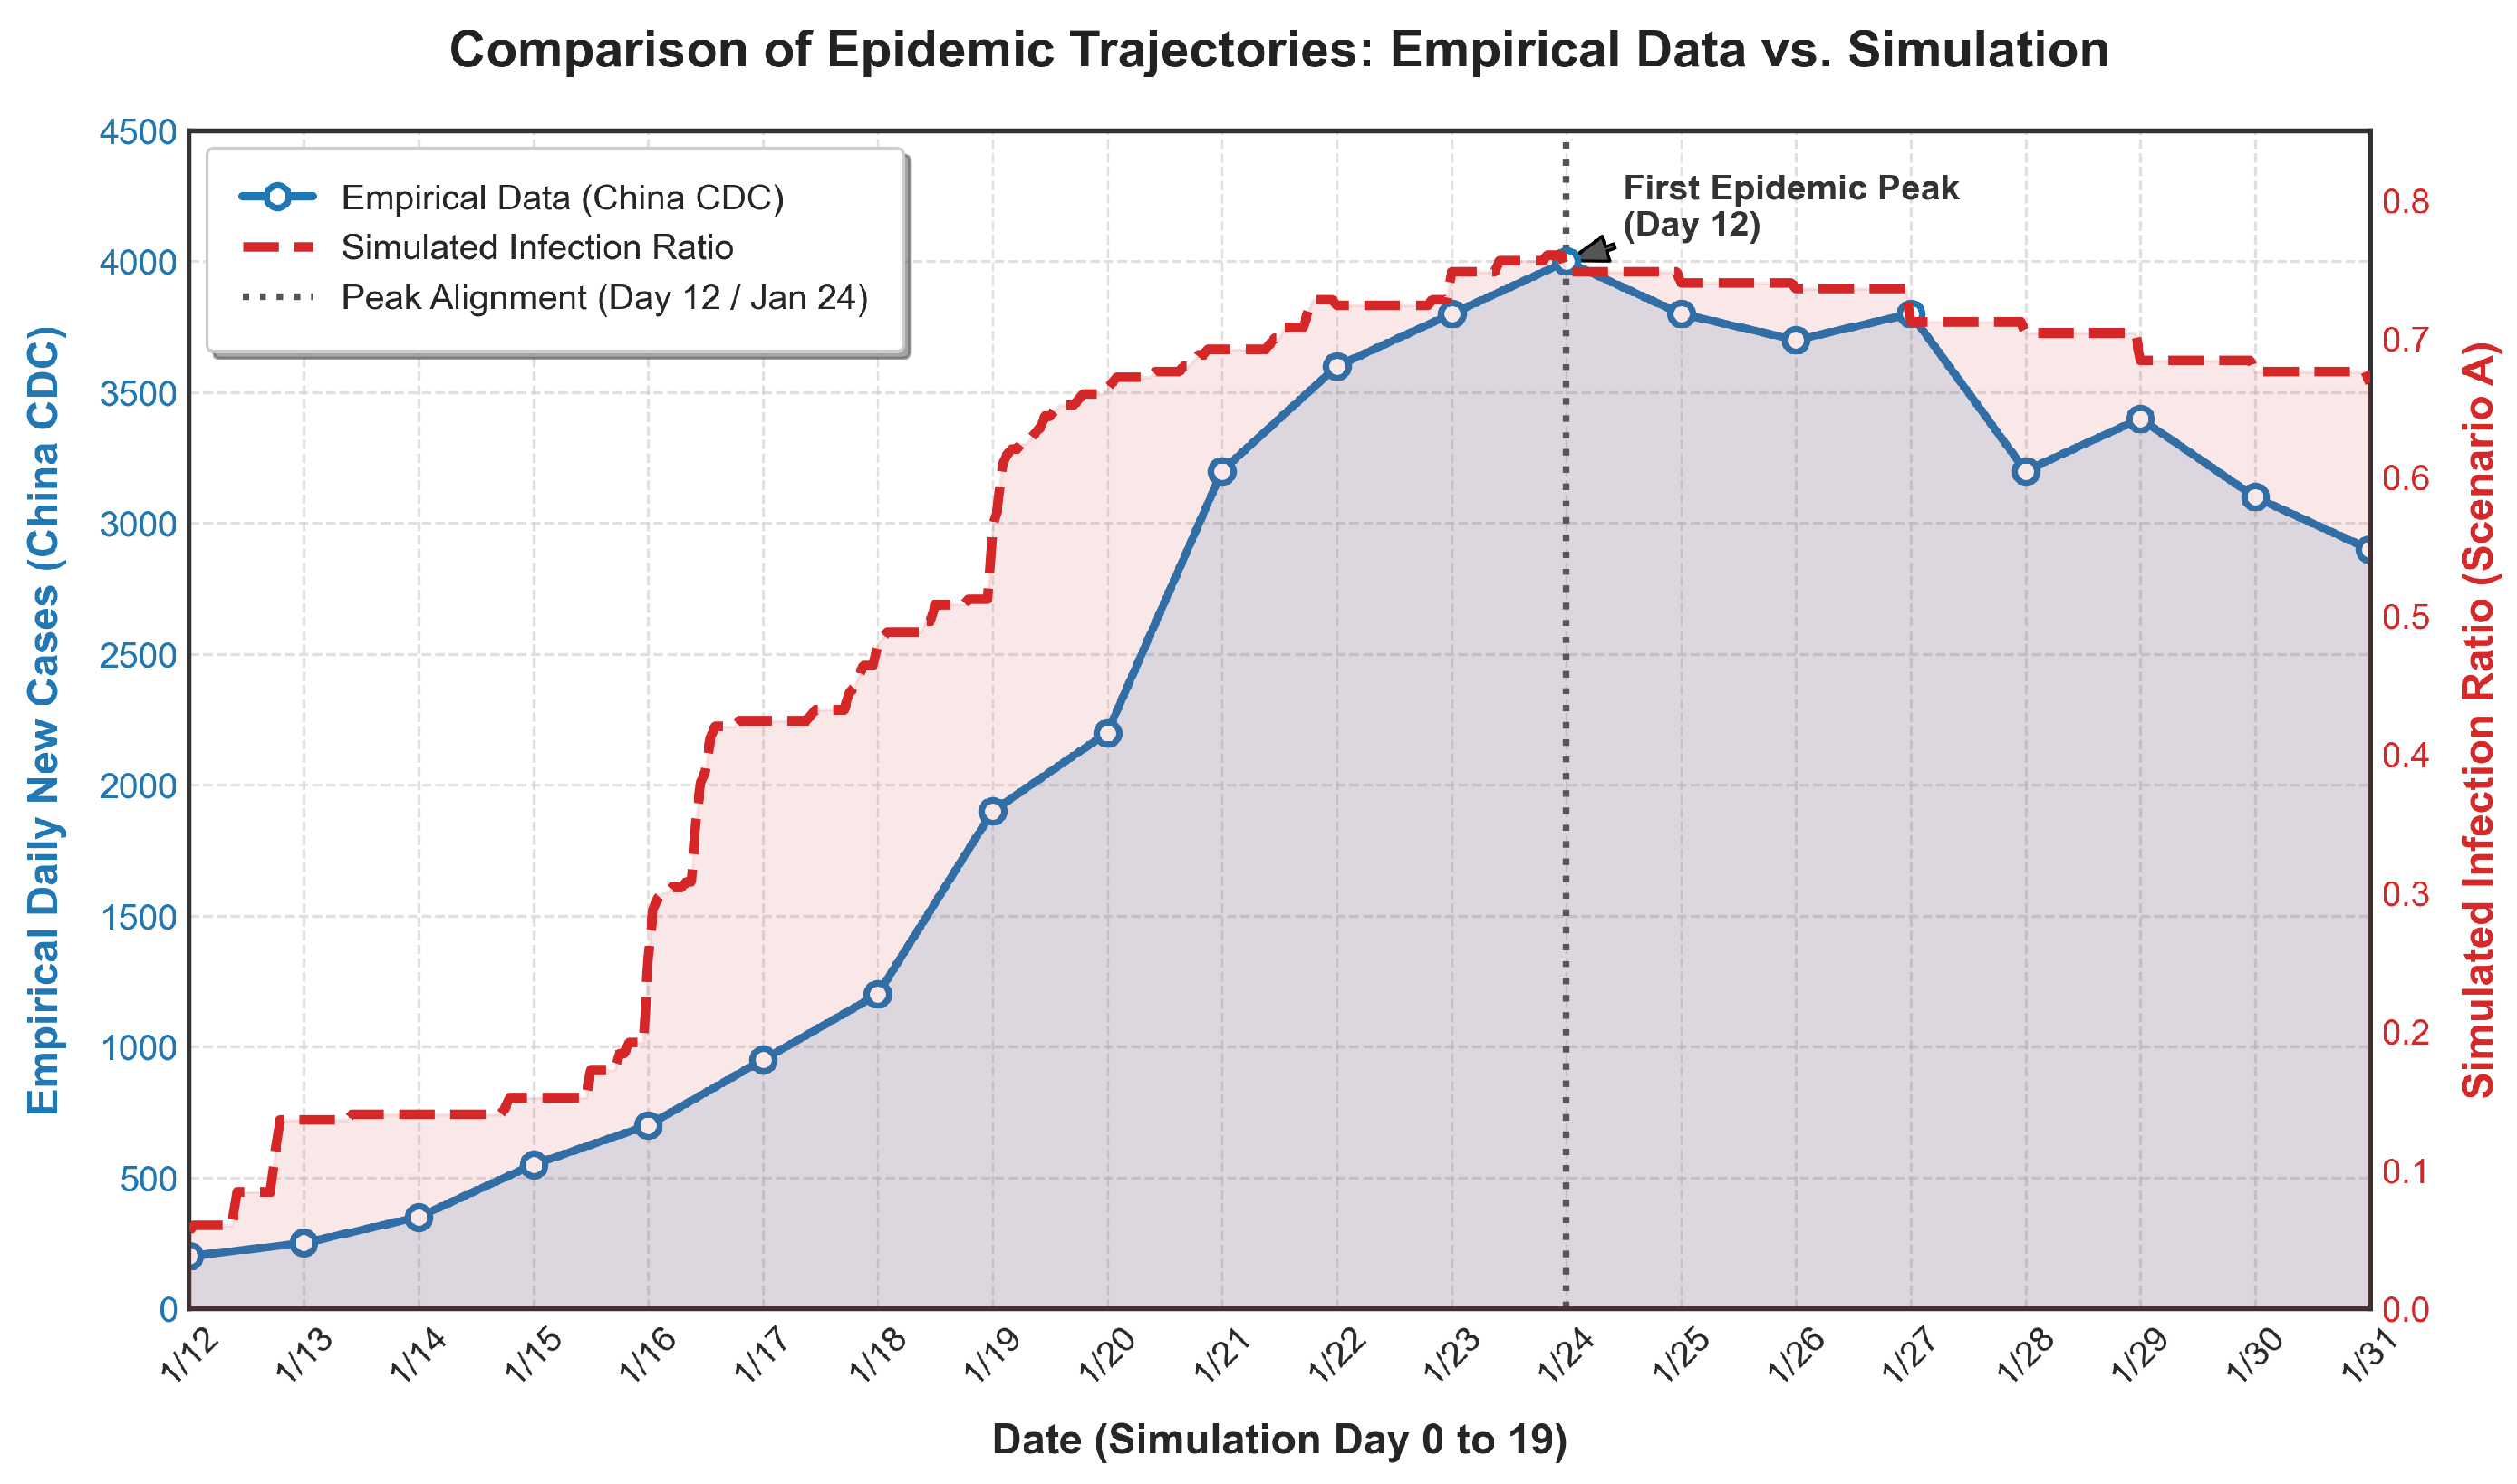
To validate the macroscopic emergent behaviors of our LLM-based multi-agent simulation and enhance the persuasiveness of our results, we conducted an external validation by comparing our baseline temporal trajectories with real-world epidemiological data from the early stages of the COVID-19 outbreak. According to the comprehensive epidemiological characteristics report of 72,314 cases published by the Chinese Center for Disease Control and Prevention (China CDC) [34], the real-world epidemic curve exhibited an initial exponential growth phase around 12 January 2020, which subsequently reached its first major incidence peak on 24 January 2020. This represents a natural evolution period of approximately 12 days from the early outbreak stage to the first epidemic peak.
It is crucial to note that the infection status on 12 January in the empirical data closely mirrors the initial state of our simulation. Remarkably, the temporal dynamics generated by our simulation align closely with these empirical observations. In our unmitigated baseline scenario (Scenario A), starting from this comparable initial infection state, the simulation demonstrated that the infection rate peaked at Tick 284. Given that each tick in our model represents one hour of simulated time, this translates to exactly 11.83 days. The near-perfect alignment between the simulated time-to-peak (11.83 days) and the real-world time-to-peak (12 days) from similar starting conditions provides strong evidence that our LLM-driven agents, despite operating on individual behavioral prompts, collectively generate macroscopic epidemiological trajectories that are highly consistent with real-world infectious disease dynamics. As illustrated in Figure 13, the simulated infection ratio curve closely tracks the exponential growth and peak timing of the empirical daily new cases, visually confirming the temporal validity of our model.
Figure 13.
Comparison of Epidemic Trajectories: Empirical Data vs. Simulation. The blue line (left axis) represents the empirical daily new cases from the China CDC report, starting from 12 January (Day 0). The red dashed line (right axis) represents the simulated infection ratio from our baseline Scenario A. Both curves exhibit a highly synchronized exponential growth phase, reaching their respective peaks at approximately Day 12 (24 January in the empirical timeline), demonstrating the model’s temporal validity.
6. Discussion
The core contribution of this study is the proposal and validation of a multi-agent simulation framework driven by LLMs for exploring complex socio-economic–epidemiological systems. In this section, we delve into the theoretical and practical implications of the experimental results, compare our work with existing research, and candidly discuss its limitations and future directions.
6.1. Theoretical Implications
Our experiments demonstrate that LLMs can effectively serve as the “cognitive engine” for computational social agents. The high fidelity observed in the Micro-Behavioral Analysis suggests that LLMs successfully internalize human-like risk assessment and decision-making logic. This offers a theoretical bridge between micro-level cognitive psychology and macro-level social dynamics, supporting the generative social science paradigm.
6.2. Practical Implications
The Core Scenario Exploration vividly demonstrates the wicked nature of policymaking. Our “Computational Policy Laboratory” reveals that there are no perfect solutions, only trade-offs. The health-priority strategy saves lives but inflicts economic pain, while the decentralized adaptation strategy offers a promising middle path. Crucially, our deep mechanism analysis uncovered hidden liabilities—such as the government’s role as the payer of last resort—that are often invisible in standard aggregate models. These findings provide policymakers with a quantifiable reference for anticipating the complex, non-linear consequences of their interventions before implementation.
6.3. Comparison with Related Work
Our framework offers distinct advantages over existing paradigms. Unlike Equation-Based Models that rely on homogeneous mixing assumptions, our approach connects macro-phenomena to micro-behavioral foundations. Compared to Rule-Based ABMs, it enables the endogenous emergence of heterogeneous behaviors without pre-scripted rules. Furthermore, while recent LLM-based simulations often focus on general social interactions [8], our work rigorously targets the high-stakes domain of epidemic–economic coupling, providing a specialized testbed for policy evaluation.
7. Conclusions
This paper introduces a novel LLM-driven multi-agent simulation framework for coupled epidemic–economic dynamics. Our experiments demonstrate that this approach can generate high-fidelity, emergent social behaviors and provide a powerful computational laboratory for policy analysis. By replacing rigid heuristics with the nuanced reasoning of LLMs, we offer a new paradigm for building more realistic and adaptive models in computational social science, bridging the gap between micro-level cognition and macro-level societal outcomes.
7.1. Limitations and Future Perspectives
7.1.1. Limitations of Model Simplification
The current model simplifies real-world complexities such as detailed contact networks and supply chains; incorporating richer empirical structures would improve realism. In terms of epidemiological fidelity, while the SEIR framework captures fundamental transmission dynamics, it currently abstracts away complex pharmaceutical interventions. The system does not yet account for vaccinated compartments, immune waning, or variant-specific reinfection pathways, limiting its applicability to long-term endemic scenarios. Furthermore, the economic module approximates healthcare impacts through aggregate government subsidies, simplifying the granular financial shocks of hospitalization on diverse household strata.
7.1.2. Computational Feasibility and Scalability Analysis
Regarding the computational and financial costs of large-scale simulations, we acknowledge that using LLM inference for every agent at every time step constitutes a significant resource bottleneck. In our experimental configuration (using the DeepSeek-V3 model), the average inference time for a single agent’s decision step is approximately 1.2 s. For a simulation scale of , the parallel processing mechanism implemented via ThreadPoolExecutor keeps the total computational time per update cycle (simulation hour) within 10 s. However, costs grow linearly with scale, posing a barrier to direct expansion to city-level populations ( > 10,000).
To mitigate this issue, we have adopted the following optimization strategies in our engineering implementation and future planning:
Parallel Execution and Context Storage Optimization: Our system employs a ThreadPoolExecutor-based concurrent inference architecture to mask network latency. Simultaneously, we implement context storage optimization during the ecosystem Prompt construction phase to strictly control Token consumption, preventing costs from growing exponentially with environmental complexity.
Model Compatibility and Cost Optimization: The LLM generalization analysis in this paper (see Section 4.2.2) confirms that our multi-agent framework exhibits highly consistent macroscopic socio-economic dynamics across different LLM backends (including DeepSeek-V3, GPT-4o-mini, Qwen2.5, and Gemini2.0-flash). This finding indicates the framework’s robustness regarding the choice of “cognitive engine.” The experimental results establish a clear path for low-cost scaling: researchers can safely switch to lightweight models with fewer parameters and lower inference costs (such as GPT-4o-mini or open-source models) to significantly reduce the computational and financial costs of large-scale simulations without sacrificing the validity and fidelity of the results.
Future work will focus on enriching the model with finer-grained empirical data, supported by the aforementioned computational optimization techniques to enable larger-scale simulations. Specifically, we will pursue three key directions: (1) Epidemiological Extension, incorporating vaccination, immune decay, and detailed hospitalization cost models; (2) Cognitive Enhancement, enriching agents with long-term memory and communication protocols to simulate collective behaviors like rumor propagation; and (3) Scale and Efficiency, leveraging low-cost lightweight models to scale simulations to city-level populations while exploring model distillation techniques.
Author Contributions
Conceptualization, S.W. and H.L.; methodology, S.W.; software, S.W. and Q.Y.; validation, S.W., S.Z. and Q.Y.; formal analysis, S.W.; investigation, S.Z.; resources, H.L.; data curation, S.W.; writing—original draft preparation, S.W.; writing—review and editing, H.L.; visualization, S.W.; supervision, H.L.; project administration, H.L. All authors have read and agreed to the published version of the manuscript.
Funding
This research received no external funding.
Institutional Review Board Statement
Not applicable.
Informed Consent Statement
Not applicable.
Data Availability Statement
The original contributions presented in this study are included in the article. Further inquiries can be directed to the corresponding author.
Conflicts of Interest
The authors declare no conflicts of interest.
Appendix A. LLM Prompt Templates
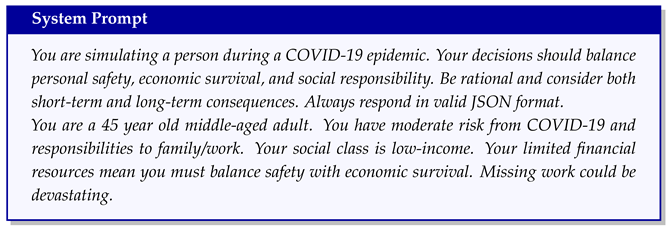
To ensure reproducibility, this appendix provides the complete prompt templates sent to the Large Language Models (LLMs). Our system uses a dynamic prompt construction mechanism that generates prompts based on the agent’s immediate state (Perception Layer) and static attributes (Role Layer).
- Computational Environment: This framework was implemented in Python (version 3.12, https://www.python.org/). The following boxes present the core prompt templates used to guide the LLM agents’ behavior during the simulation.
Appendix A.1. System Prompt
The system prompt sets the basic role and simulation constraints for the agent.
Appendix A.2. User Context Prompt
The user prompt provides current observation state, environmental information, and available action space.
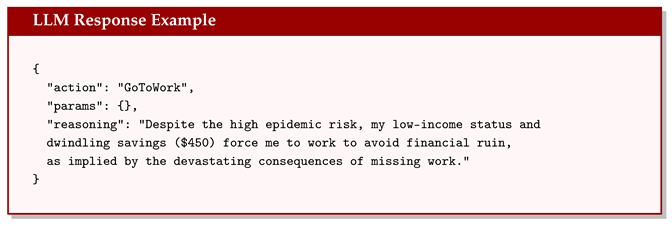
Appendix A.3. Sample Output
The LLM returns a decision compliant with the JSON format:
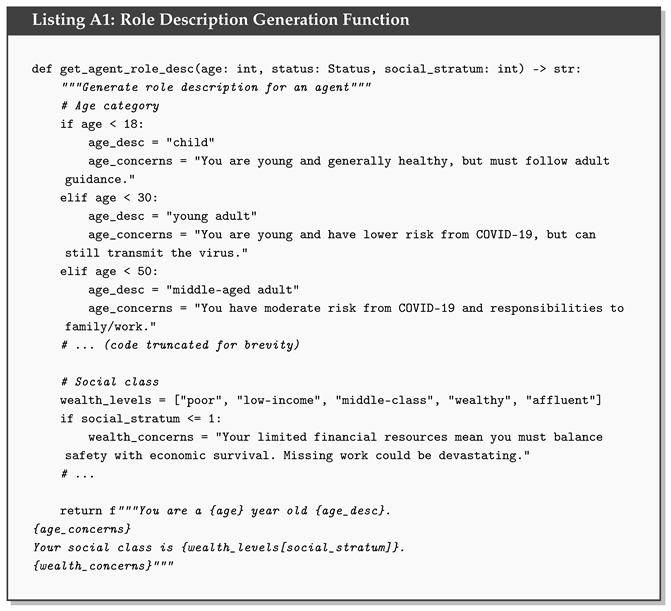
Appendix A.4. Core Logic Implementation
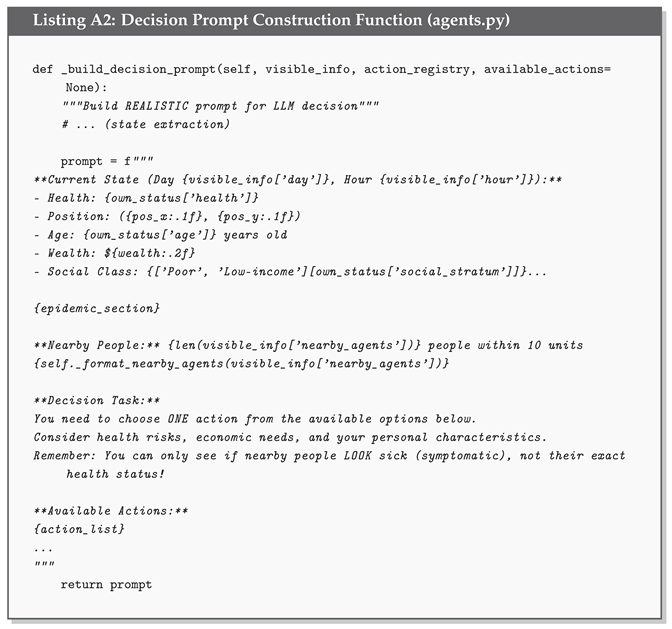
To further increase transparency, we provide the core Python function logic used to generate the above prompts (Listings A1 and A2).
Appendix A.5. Action Descriptions
Each option in the action space has a specific description informing the LLM of potential consequences.
Table A1.
Action Descriptions used in Prompts.
References
- Kermack, W.O.; McKendrick, A.G. A contribution to the mathematical theory of epidemics. Proc. R. Soc. Lond. Ser. A Contain. Pap. Math. Phys. Character 1927, 115, 700–721. [Google Scholar] [CrossRef] [Scilit]
- Ferguson, N.M.; Laydon, D.; Nedjati-Gilani, G.; Imai, N.; Ainslie, K.; Baguelin, M.; Bhatia, S.; Boonyasiri, A.; Cucunuba, Z.; Cuomo-Dannenburg, G.; et al. Report 9: Impact of Non-Pharmaceutical Interventions (NPIs) to Reduce COVID-19 Mortality and Healthcare Demand; Report 9; Imperial College London: London, UK, 2020. [Google Scholar] [CrossRef]
- Epstein, J.M. Generative Social Science: Studies in Agent-Based Computational Modeling; Princeton University Press: Princeton, NJ, USA, 2006. [Google Scholar]
- Helbing, D.; Balietti, S. Agent-based modeling. In Social Self-Organization: Agent-Based Simulations and Experiments to Study Emergent Social Behavior; Springer: Berlin/Heidelberg, Germany, 2012; pp. 25–70. [Google Scholar]
- Wang, L.; Ma, C.; Feng, X.; Zhang, Z.; Yang, H.; Zhang, J.; Chen, Z.; Tang, J.; Chen, X.; Lin, Y.; et al. A survey on large language model based autonomous agents. Front. Comput. Sci. 2024, 18, 186345. [Google Scholar] [CrossRef] [Scilit]
- Bommasani, R.; Hudson, D.A.; Adeli, E.; Altman, R.; Arora, S.; von Arx, S.; Bernstein, M.S.; Bohg, J.; Bosselut, A.; Brunskill, E.; et al. On the Opportunities and Risks of Foundation Models. arXiv 2021, arXiv:2108.07258. [Google Scholar]
- Zhao, Q.; Wang, J.; Zhang, Y.; Jin, Y.; Zhu, K.; Chen, H.; Xie, X. Competeai: Understanding the competition dynamics in large language model-based agents. arXiv 2023, arXiv:2310.17512. [Google Scholar]
- Park, J.S.; O’Brien, J.C.; Cai, C.J.; Morris, M.R.; Liang, P.; Bernstein, M.S. Generative agents: Interactive simulacra of human behavior. arXiv 2023, arXiv:2304.03442. [Google Scholar]
- De Marchi, S.; Page, S.E. Agent-based models. Annu. Rev. Political Sci. 2014, 17, 1–20. [Google Scholar] [CrossRef] [Scilit]
- Farmer, J.D.; Foley, D. The economy needs agent-based modelling. Nature 2009, 460, 685–686. [Google Scholar] [CrossRef] [Scilit]
- Filippas, A.; Horton, J.J.; Manning, B.S. Large language models as simulated economic agents: What can we learn from homo silicus? In Proceedings of the 25th ACM Conference on Economics and Computation, New Haven, CT, USA, 8–11 July 2024; pp. 614–615. [Google Scholar]
- Pearl, J.; Glymour, M.; Jewell, N.P. Causal Inference in Statistics: A Primer; John Wiley & Sons: Hoboken, NJ, USA, 2016. [Google Scholar]
- Hornyak, T. Agentic AI Is Here—But Are We Ready? Res. Technol. Manag. 2025, 68, 59–60. [Google Scholar] [CrossRef] [Scilit]
- Eichenbaum, M.S.; Rebelo, S.; Trabandt, M. The macroeconomics of epidemics. Rev. Financ. Stud. 2021, 34, 5149–5187. [Google Scholar] [CrossRef] [Scilit]
- Acemoglu, D.; Chernozhukov, V.; Werning, I.; Whinston, M.D. Optimal targeted lockdowns in a multigroup SIR model. Am. Econ. Rev. Insights 2021, 3, 487–502. [Google Scholar] [CrossRef] [Scilit]
- Alvarez, F.; Argente, D.; Lippi, F. A simple planning problem for COVID-19 lock-down, testing, and tracing. Am. Econ. Rev. Insights 2021, 3, 367–382. [Google Scholar] [CrossRef] [Scilit]
- Silva, P.C.; Batista, P.V.; Lima, H.S.; Alves, M.A.; Guimarães, F.G.; Silva, R.C. COVID-ABS: An agent-based model of COVID-19 epidemic to simulate health and economic effects of social distancing interventions. Chaos Solitons Fractals 2020, 139, 110088. [Google Scholar] [CrossRef] [Scilit]
- Xi, Z.; Chen, W.; Guo, X.; He, W.; Ding, Y.; Hong, B.; Zhang, M.; Wang, J.; Jin, S.; Zhou, E.; et al. The rise and potential of large language model based agents: A survey. Sci. China Inf. Sci. 2025, 68, 121101. [Google Scholar] [CrossRef] [Scilit]
- Sumers, T.; Yao, S.; Narasimhan, K.; Griffiths, T. Cognitive architectures for language agents. Trans. Mach. Learn. Res. 2023. [Google Scholar]
- Tao, L.; Liu, H.; Ning, G.; Cao, W.; Huang, B.; Lu, C. LLM-based framework for bearing fault diagnosis. Mech. Syst. Signal Process. 2025, 224, 112127. [Google Scholar] [CrossRef] [Scilit]
- Wang, L.; He, X.; Luo, D. Deep reinforcement learning for greenhouse climate control. In Proceedings of the 2020 IEEE International Conference on Knowledge Graph (ICKG), Nanjing, China, 9–11 August 2020; pp. 474–480. [Google Scholar]
- Zhang, Y.; Wei, C.; Wu, S.; He, Z.; Yu, W. Geogpt: Understanding and processing geospatial tasks through an autonomous GPT. arXiv 2023, arXiv:2307.07930. [Google Scholar]
- IBGE. Pirâmide Etária. 2020. Available online: https://educa.ibge.gov.br/jovens/conheca-o-brasil/populacao/18318-piramide-etaria.html (accessed on 2 June 2020).
- IBGE. Censo demográfico: Tabela 2019—Moradores em Domicílios Particulares Permanentes por Densidade de Moradores por Cômodo e Número de Banheiros. 2020. Available online: https://sidra.ibge.gov.br/tabela/2019 (accessed on 2 June 2020).
- IPEA. Estimativa da População em Situação de Rua no Brasil; Texto para Discussão 2246; Instituto de Pesquisa Econômica Aplicada: Brasília, Brazil, 2020.
- World Bank. Lac Equity Lab: Income Inequality—Composition by Quintile. 2020. Available online: https://www.worldbank.org/en/topic/poverty/lac-equity-lab1/income-inequality/composition-by-quintile (accessed on 3 June 2020).
- IBGE. Demografia das Empresas e Empreendedorismo 2017: Taxa de Sobrevivência foi de 84.8%. IBGE Agência de Notícias, Release 25738, 2017. Available online: https://agenciadenoticias.ibge.gov.br/ (accessed on 2 June 2020).
- World Bank. Business Density and the Number of New Business Registrations. 2020. Available online: https://data.worldbank.org/indicator/IC.BUS.NREG (accessed on 1 December 2024).
- Exame. Desemprego Atinge 12.2% No 1º Trimestre, diz IBGE. 2020. Available online: https://exame.com/economia/brasil-tem-desemprego-de-122-no-primeiro-trimestre-diz-ibge/ (accessed on 3 June 2020).
- Lima, C.M.A.d.O. Informações sobre o novo coronavírus (COVID-19). Radiol. Bras. 2020, 53, V–VI. [Google Scholar] [CrossRef] [Scilit]
- Li, Q.; Guan, X.; Wu, P.; Wang, X.; Zhou, L.; Tong, Y.; Ren, R.; Leung, K.S.; Lau, E.H.; Wong, J.Y.; et al. Early transmission dynamics in Wuhan, China, of novel coronavirus–infected pneumonia. N. Engl. J. Med. 2020, 382, 1199–1207. [Google Scholar] [CrossRef] [Scilit] [PubMed]
- Lauer, S.A.; Grantz, K.H.; Bi, Q.; Jones, F.K.; Zheng, Q.; Meredith, H.R.; Azman, A.S.; Reich, N.G.; Lessler, J. The incubation period of coronavirus disease 2019 (COVID-19) from publicly reported confirmed cases: Estimation and application. Ann. Intern. Med. 2020, 172, 577–582. [Google Scholar] [CrossRef] [Scilit]
- Housen, T.; Parry, A.E.; Sheel, M. How Long Are You Infectious When you Have Coronavirus? Conversation 2020, 135295. Available online: https://theconversation.com/ (accessed on 2 June 2020).
- Epidemiology Working Group for NCIP Epidemic Response, Chinese Center for Disease Control and Prevention. The epidemiological characteristics of an outbreak of 2019 novel coronavirus diseases (COVID-19) in China. Zhonghua Liu Xing Bing Xue Za Zhi = Zhonghua Liuxingbingxue Zazhi 2020, 41, 145–151. [Google Scholar] [CrossRef]

Disclaimer/Publisher’s Note: The statements, opinions and data contained in all publications are solely those of the individual author(s) and contributor(s) and not of MDPI and/or the editor(s). MDPI and/or the editor(s) disclaim responsibility for any injury to people or property resulting from any ideas, methods, instructions or products referred to in the content. |
© 2026 by the authors. Licensee MDPI, Basel, Switzerland. This article is an open access article distributed under the terms and conditions of the Creative Commons Attribution (CC BY) license.