


Abstract
The accurate detection of electricity theft is crucial for reducing non-technical losses in smart grids. However, many existing data-driven methods rely on a single data modality, such as either the raw 1D consumption sequence or its transformed 2D image. This single-modality approach may not fully capture the complex spatio-temporal patterns associated with fraudulent behavior. To address this limitation, this paper proposes a novel detection method that integrates Markov Transition Fields (MTFs) with a hybrid neural network. First, this approach uses MTF to convert 1D time-series consumption data into 2D feature images, which enhances state-transition patterns. A parallel Residual Network and Long Short-Term Memory (ResNet-LSTM) architecture is then designed to simultaneously extract global temporal features from the original 1D data and local spatial features from the MTF images, with their fused representation used for classification. Experimental validation on a real-world dataset from the State Grid Corporation of China (SGCC)—comprising 6000 users over 304 days—demonstrates the effectiveness of our approach. The proposed model achieves a detection accuracy of 94.0% on an independent test set of 1200 users, significantly outperforming several state-of-the-art single-modality benchmarks. This work provides a new technical method for intelligent electricity theft prevention system.
1. Introduction
User electricity theft refers to deceptive practices that involve tampering with metering devices to underreport or completely omit energy consumption. As a primary cause of non-technical line losses in distribution networks, this fraud not only leads to financial losses for power companies but also threatens grid safety. Traditional anti-theft measures primarily rely on manual inspections and basic meter monitoring. They suffer from low efficiency and are often ineffective against increasingly sophisticated theft methods. Consequently, their success in combating electricity theft is limited [1]. Therefore, timely and accurate detection of electricity theft is crucial for reducing non-technical losses and ensuring power system safety and efficiency. In recent years, big data technologies and deep learning algorithms have offered innovative solutions for theft detection.
Current research on electricity theft detection primarily focuses on two aspects: identification methods and detection devices [2]. This paper specifically investigates user-based identification methods that utilize daily consumption patterns. Data-driven theft detection approaches can be categorized into three main strands according to their methodology:
Traditional Machine Learning and Statistical Methods: Early approaches often employed classical algorithms to analyze consumption patterns. For example, a hybrid model combining the K-nearest neighbor algorithm with Dynamic Time Warping was used to identify anomalous patterns [3]. Another method based on Fuzzy C-Means clustering aimed to reduce false alarms from legitimate temporary low consumption [4]. Statistical process control techniques, such as control charts, have also been adapted to detect deviations [5]. Additionally, an optimal path forest classifier was developed for large-scale fraud detection [6]. Recent unsupervised approaches have attempted to incorporate richer feature sets; For example, some studies integrate spatial topological features (e.g., node centrality, electrical coupling) with temporal electrical features for clustering-based detection [7]. Although interpretable, these methods have limitations: they depend on hand-crafted features, struggle to capture complex non-linear dependencies in high-dimensional data, and often overlook factors like seasonal variations [4].
Deep Learning-based Sequential Models: To automate feature learning, deep neural networks specifically designed for sequential data have been widely adopted. These include models based on ConvLSTM networks [8], Temporal Convolutional Networks (TCN) [9], and standard LSTM autoencoders [10] to capture temporal dynamics. More recently, advanced architectures like Transformers [11] and Generative Adversarial Networks with Transformer encoders (TGAN) [12] have been introduced to model long-range dependencies and generate more robust feature representations. Notably, to better capture the inherent periodicity in consumption patterns, periodicity-enhanced Transformer encoders with specialized attention mechanisms have been proposed for unsupervised one-class classification [13]. Huang et al. proposed a strategy that uses an LSTM-TCN module to extract daily-scale features from 1D sequences and a Deep CNN to extract weekly-scale features from reshaped 2D data, followed by feature fusion for classification [14]. This approach highlights the potential of integrating multi-scale temporal information within a deep learning framework. Furthermore, researchers have begun to utilize multidimensional power state data (e.g., voltage, current, power factor) from smart grids to better characterize consumption behavior, moving beyond single metrics like electricity consumption alone. For example, methods such as Catch22-Conv-Transformer detect specific types of electricity theft by extracting multidimensional features [15]. Although such approaches enrich the feature set, they impose specific requirements on data structure and type, often accompanied by a significant increase in computational complexity, and may face limitations in generalizing to different grid structures or data dimensions. Additionally, metric learning approaches such as Siamese networks with Triplet Loss have been utilized to distinguish between honest and fraudulent consumption patterns through similarity comparison, achieving enhanced detection precision [16]. However, such models primarily focus on learning relative distances in the embedding space and may still underutilize the explicit multi-scale and state-transition characteristics inherent in consumption sequences, potentially limiting their ability to capture comprehensive behavioral signatures. Although powerful, these models primarily process the original 1D time series and may fail to fully leverage the rich state-transition information inherent in consumption behavior. Furthermore, some complex models face challenges regarding interpretability and computational cost [11], which may hinder their practical deployment.
Time-Series-to-Image Encoding Combined with Deep Learning: A promising direction involves transforming 1D electricity consumption sequences into 2D feature images and then applying image-based deep learning models, such as Convolutional Neural Networks (CNNs), for classification [17]. This preserves temporal transitions as spatial patterns, allowing CNNs to extract discriminative features. However, a key limitation is the sole reliance on images, which may discard the global, continuous temporal context from the original sequences, leading to potential information loss. In summary, despite significant the progress made in the existing methods, key challenges remain:
- Traditional models lack sufficient representational capacity for complex patterns;
- Deep sequential models may not fully exploit the multi-dimensional characteristics of electricity consumption data;
- Image-encoding methods might neglect original temporal dependencies.
The aforementioned challenges collectively point to a fundamental limitation in the prevailing research paradigm: the predominant reliance on a single data modality—either the raw 1D time series or a derived 2D image—for feature extraction and model learning. While this simplifies model design, it inherently restricts the representational capacity, as each modality captures only specific aspects of the complex consumption behavior. Temporal models may overlook fine-grained state transition patterns, while image-based models might dilute the global temporal context. Therefore, a deliberate integration of complementary modalities presents a promising yet underexplored avenue to construct a more holistic behavioral profile for electricity theft detection. Departing from the single-modality convention, this paper proposes a novel framework that synergistically combines the original 1D consumption sequence with a specially designed 2D Markov Transition Field image. Unlike simply using an alternative image encoding, our approach is unique in two key aspects: (1) the use of MTF is specifically motivated by its aptitude for visualizing anomalous state transition dynamics, which are central to fraudulent consumption patterns; and (2) we design a parallel hybrid neural network to process these two modalities concurrently, allowing dedicated sub-networks (LSTM and ResNet) to extract optimal features from each without premature or lossy fusion. This multi-modal, dual-branch architecture is the core distinction of our work from previous studies.
To address these gaps, this paper proposes a novel electricity theft detection method based on the MTF and a hybrid neural network. Our main contributions are as follows:
- Utilizing MTF to convert 1D sequences into 2D images, enhancing state-transition features while preserving temporal order;
- Designing a parallel ResNet-LSTM architecture capable of simultaneously extracting spatial features from the MTF images and global temporal features from the original 1D sequences;
- Fusing these multi-modal features to form a more comprehensive representation. This hybrid approach aims to overcome the limitations of single-modality models, thereby achieving higher detection accuracy and robustness, which has been validated by our experiments.
The remainder of this paper is organized as follows. Section 2 (Methodology) elaborates on the proposed electricity theft detection method based on MTF and the hybrid neural network, including the principles of MTF transformation, the architecture of the ResNet-LSTM hybrid model, and its feature fusion mechanism. Section 3 (Results) describes the experimental dataset, preprocessing procedures, evaluation metrics, and presents a comparative analysis of the results between the proposed model and several baseline models. Section 4 (Discussion) provides an in-depth interpretation of the experimental results, analyzes the reasons for the model’s performance advantages, compares the findings with the existing research, and acknowledges the limitations of this work along with future directions. Finally, Section 5 (Conclusions) summarizes the entire study, highlighting the main findings and contributions.
2. Methodology
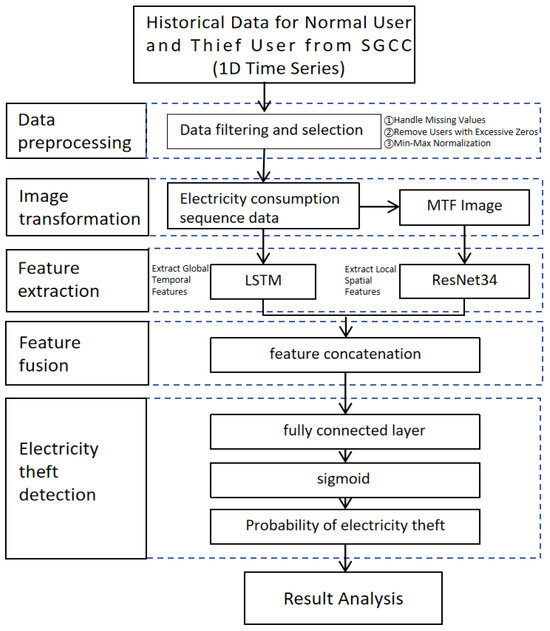
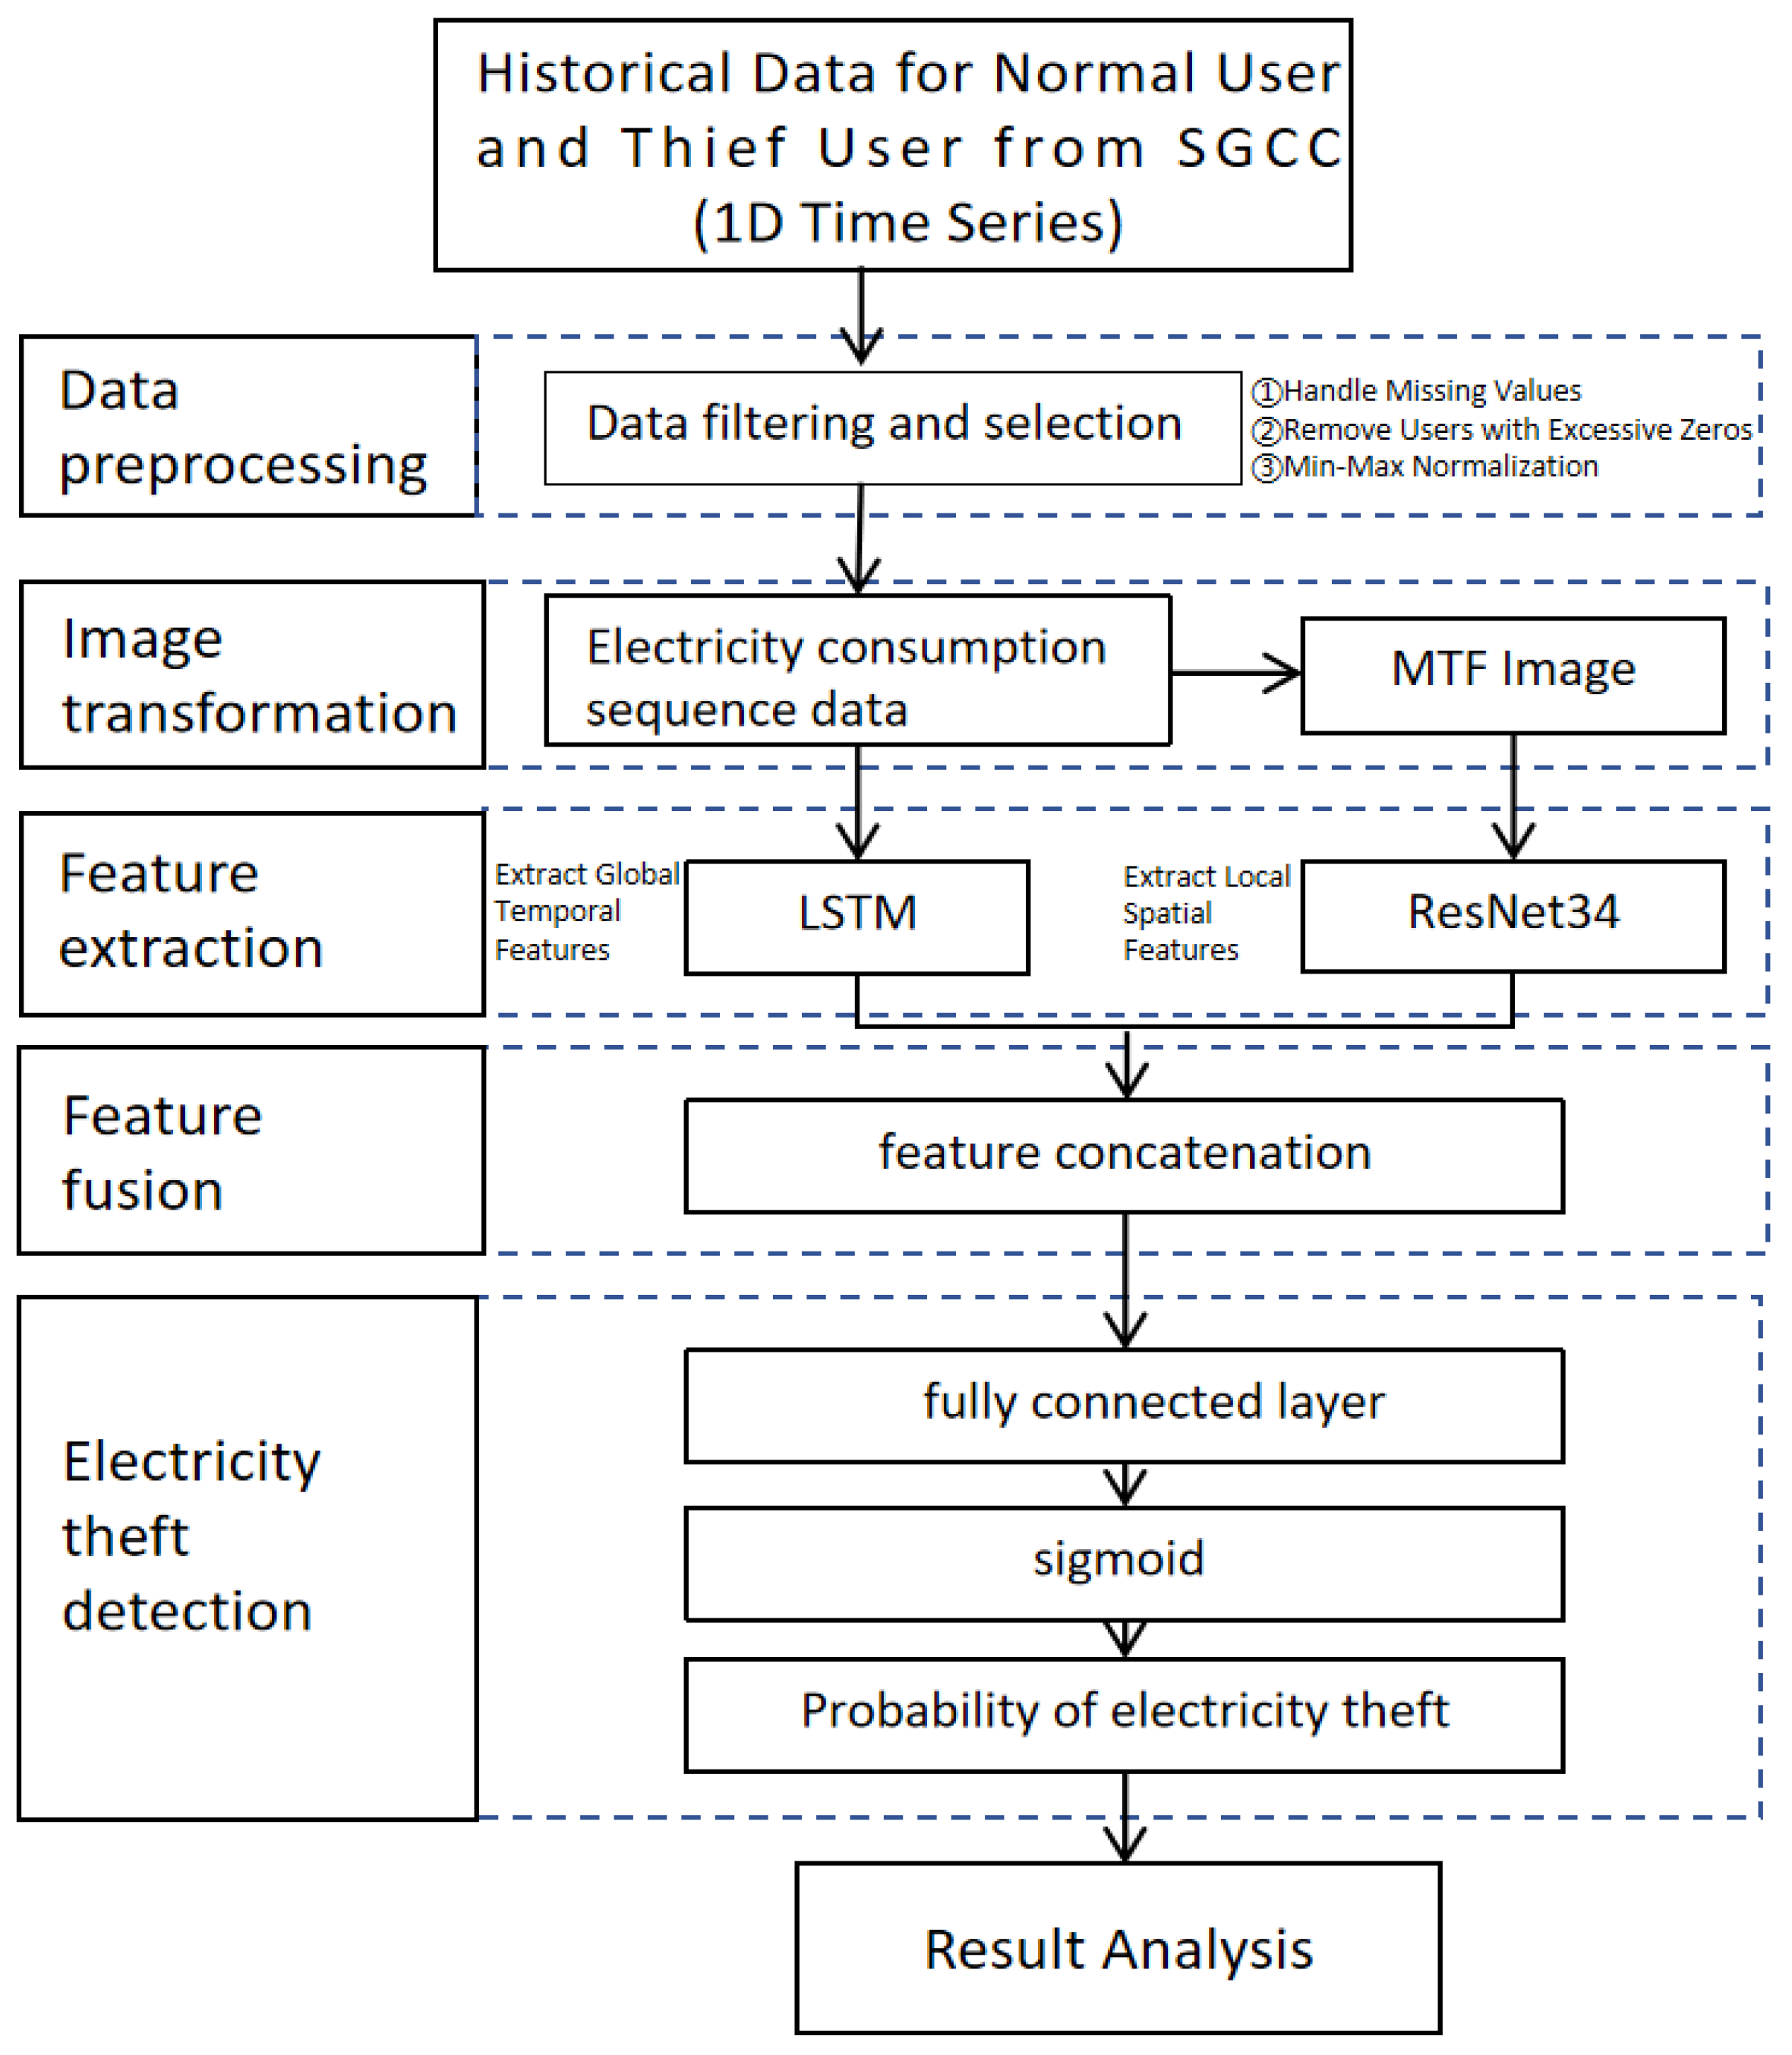
The detailed flow chart of this research method is shown in Figure 1.
Figure 1.
Power theft detection flow chart.
In the initial phase, raw consumption data undergoes preprocessing to filter relevant datasets, followed by conversion of 1D data into 2D images using MTF methods techniques that will be elaborated in subsequent sections. The proposed MTF-based hybrid neural network method for electricity theft detection then processes both datasets simultaneously to identify underlying patterns. The cleaned 1D sequences are then fed in parallel: directly into an LSTM network to model temporal dependencies, and into an MTF transformation module to generate 2D images for spatial feature extraction via ResNet. The extracted features are concatenated, passed through fully connected layers, and finally classified to identify normal or theft users. Experimental results are evaluated against machine learning algorithms including Support Vector Machines (SVMs), ResNet Plus (RP-ResNet), and Generalized Active-Spatial-Frequency ResNet (GASF-ResNet) using classical performance metrics such as accuracy and precision. The following sections will detail the implementation stages of this task.
2.1. Data Preprocessing
The source dataset [18] was provided by the SGCC, containing daily electricity load data from 1 January 2014, to 31 October 2016, spanning 1034 consecutive days for 42,372 users. Among these, 3615 users were labeled as electricity theft users, while the remaining were designated as normal users (with normal users marked as 0 and electricity theft users as 1). Moreover, the dataset contained a significant number of missing values. To address this issue, we used the msno module in Python 3.9 to plot data distribution matrices and bar charts, which revealed that the majority of the data exhibited severe missingness. To ensure data reliability, we extracted a high-quality continuous 304-day data segment, removed users with missing data, and eliminated users with more than 160 zero values. The final preprocessed dataset is summarized in Table 1.
Table 1.
Data Information after Preprocessing.
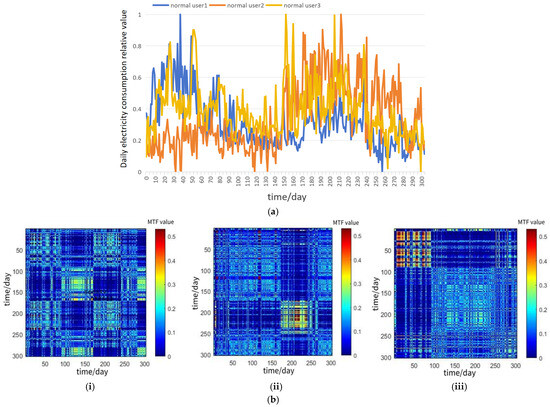
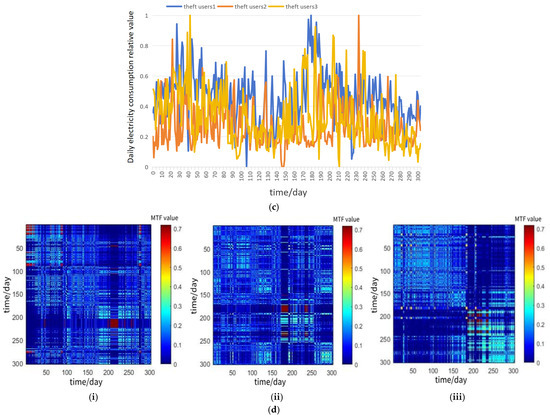
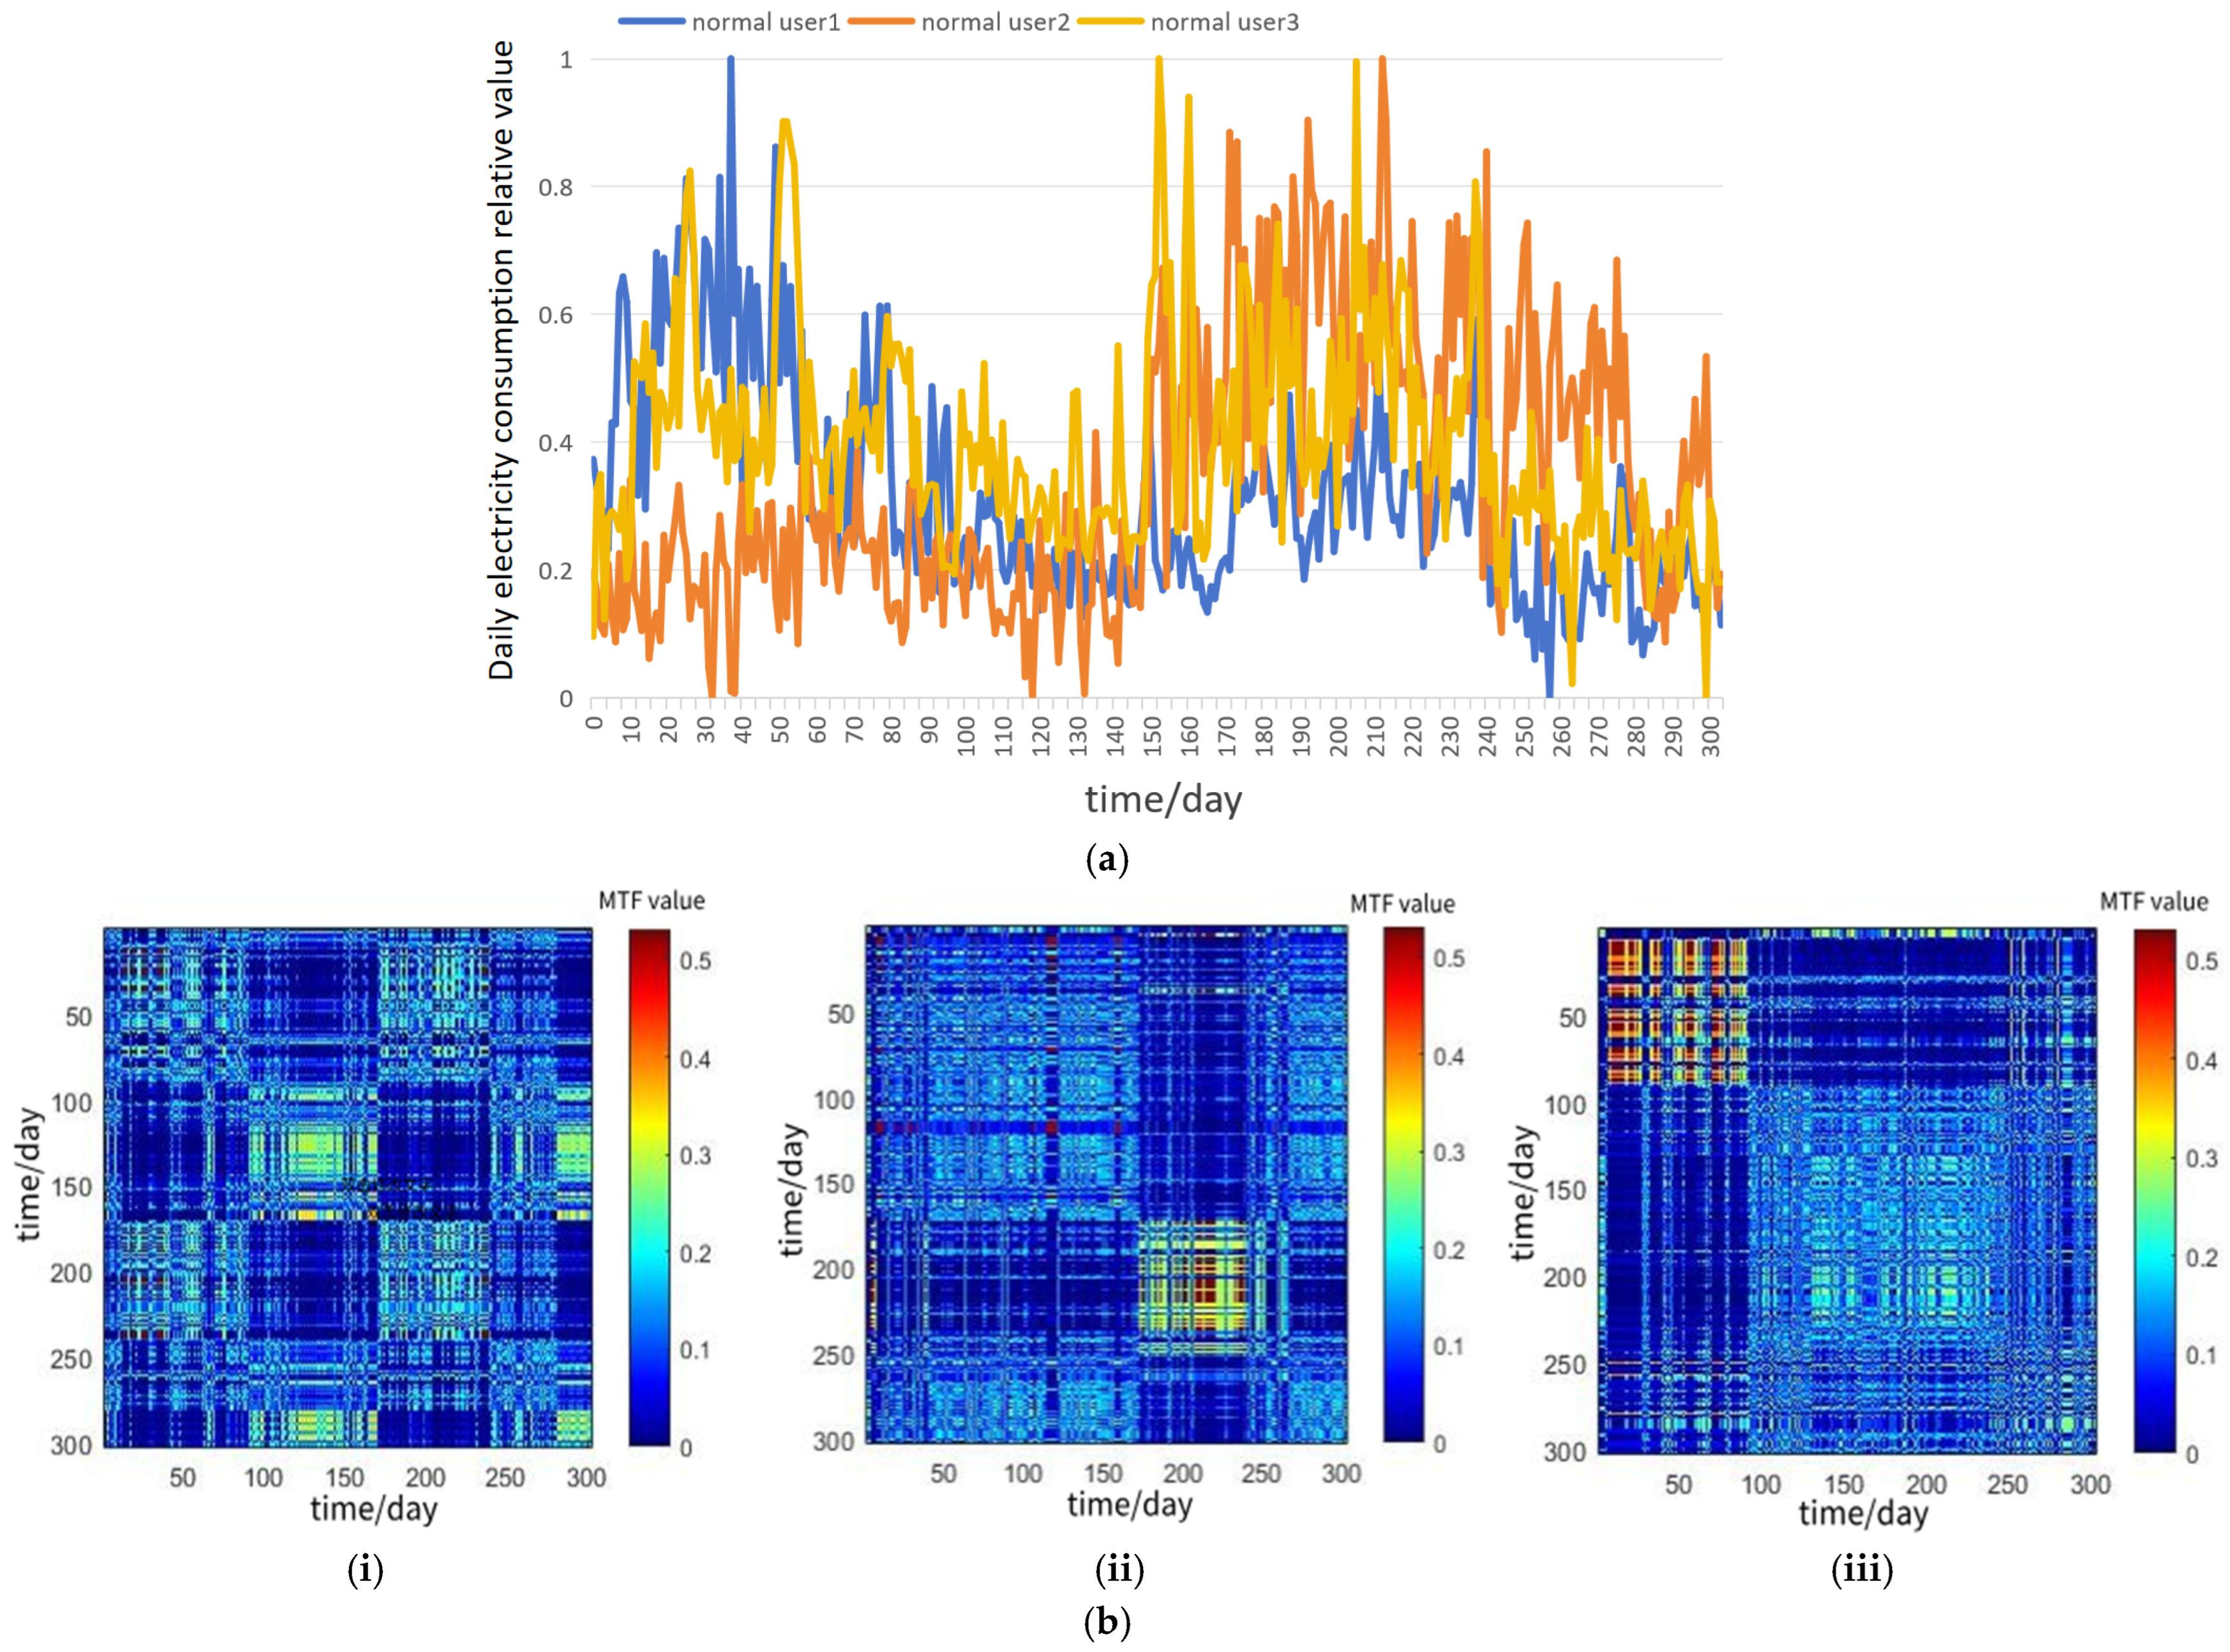
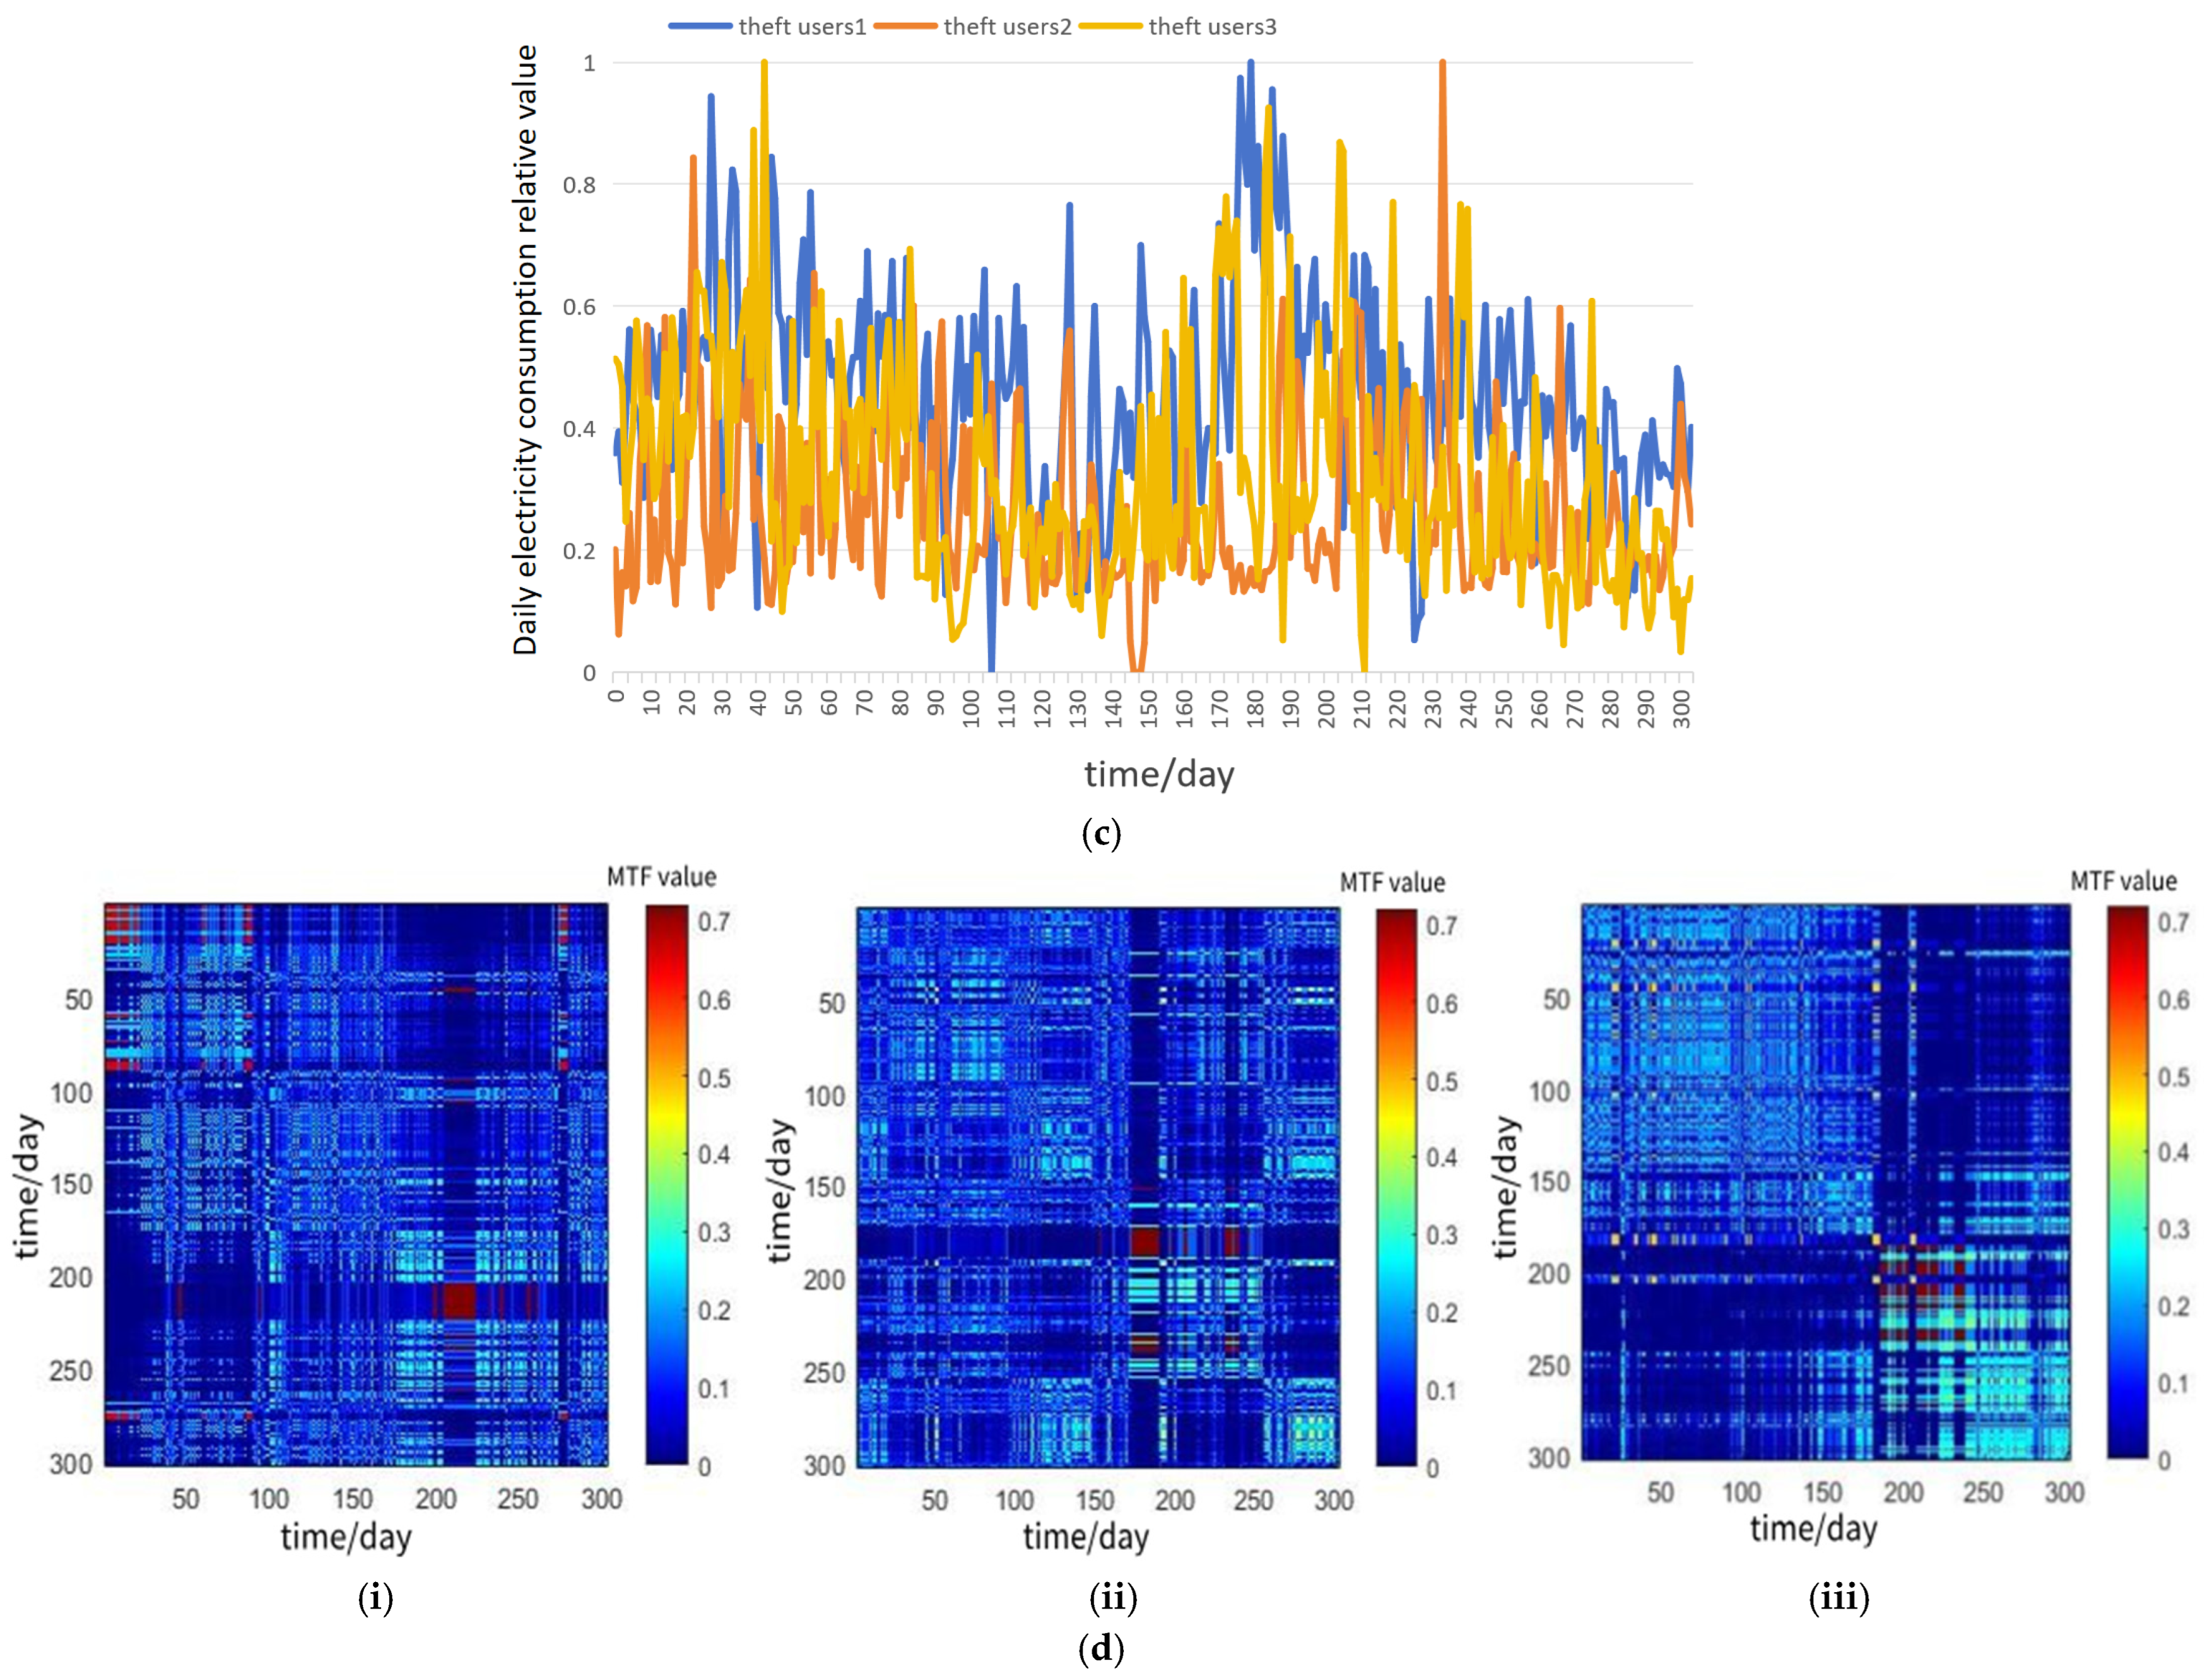
In the source SGCC dataset, the classification of users as normal or electricity theft is not determined by our algorithm but is provided as ground-truth labels. These labels were originally established and verified by the State Grid Corporation through a combination of field inspections, meter audits, and historical conviction records. A user is labeled as electricity theft (marked as 1) only after being officially confirmed as having engaged in fraudulent activities. The remaining users, without any confirmed theft record, are labeled as normal (marked as 0). Our study adopts these labels as the definitive basis for supervised learning. Following data cleaning (removing users with excessive missing/zero values), the preprocessed dataset contained 19,391 normal users and 1636 theft users, as shown in Table 1. To construct a balanced and representative experimental sample while mitigating the impact of class imbalance, we randomly selected 4500 users from the normal pool and all 1500 available users from the smaller theft pool (after ensuring data quality) to form our final working dataset. This random selection ensures that our sample is unbiased and representative of the underlying distribution within each class. To visually analyze consumption patterns, we randomly selected three normal users and three electricity theft users as examples. Their consumption curves and MTF images are plotted in Figure 2. These examples are shown to demonstrate typical patterns, not for statistical analysis.
Figure 2.
1D and 2D representations of user electricity consumption. (a). 1D electricity consumption sequences of normal users. (b). 2D MTF images of normal users corresponding to the sequences in Figure 2a: (i) Normal User 1, (ii) Normal User 2, (iii) Normal User 3. (c). 1D electricity consumption sequences of electricity theft users. (d). 2D MTF images of electricity theft users corresponding to the sequences in Figure 2c: (i) Electricity Theft User 1, (ii) Electricity Theft User 2, (iii) Electricity Theft User 3.
An experimental sample was constructed by selecting 4500 normal users and 1500 electricity theft users with high-quality preprocessed data, which were then normalized as follows. For a user X with an electricity consumption sequence denoted as = {, , …, }, the sequence is normalized using Equation (1):
where X is the daily electricity consumption; is the relative value of daily electricity consumption; is the maximum daily electricity consumption; and is the minimum daily electricity consumption.
2.2. A 2D Method Based on MTF
Converting 1D time-series into 2D images is an effective strategy for leveraging powerful image-based deep learning models. Among various encoding techniques (e.g., Gramian Angular Summation Field (GASF), Recurrence Plot (RP)), we specifically select the MTF for its distinct advantages in capturing the behavioral dynamics pertinent to electricity theft detection. Unlike GASF, which focuses on polar coordinate representation of temporal correlation, or RP, which highlights recurrence states, MTF explicitly models the probability of transitioning from one consumption state to another over time. This is critical because electricity theft often manifests as anomalous state transition patterns (e.g., abrupt drops from normal to persistent low consumption, or erratic jumps between states), rather than just anomalous absolute values. By constructing a matrix of transition probabilities and arranging them in temporal order, MTF uniquely preserves both the Markovian dynamics (state-to-state transitions) and the temporal evolution of the consumption sequence in a single 2D image. This representation provides a richer and more direct visual signature of the stochastic process underlying user behavior, making it exceptionally well-suited for our task of differentiating between regular and fraudulent consumption patterns.
MTF is a time series image encoding method based on Markov transition matrices. This approach treats time shifts in time series as Markov processes, incorporating temporal and spatial dimensions into traditional Markov chain models. By constructing Markov transition matrices, it transforms 1D time-domain signals into 2D feature maps while preserving the original signal’s temporal correlations. In this study, MTF is employed to convert 1D electricity consumption data into 2D electricity usage images. This method retains the amplitude correlation and temporal dependencies of electricity data while enhancing the feature differences between normal users and electricity thieves. Consequently, it uncovers hidden electricity theft information, providing crucial data support for extracting theft-related feature information.
Assume the electricity consumption time series for user n over n days is denoted as = {, , …, }, where (i = 1, 2, 3, …, n) represents the i-th electricity consumption data point. First, the consumption sequence is normalized to form a new sequence . Then, the array is divided into Q bins based on the electricity consumption values, so that each data point is mapped to a specific bin (j = 1, 2, …, Q). Finally, the transition probabilities between each pair of states are computed to construct a Q × Q dimensional MTF matrix U [19].
Where represents the probability that an electricity consumption data point in bin is immediately followed by a data point in bin , with k = (1, 2, …, Q) [20].
Then, the Markov transition matrix is expanded by arranging each probability in the chronological order of the original time series, resulting in an n × n MTF matrix M.
where represents the transition probability from the state (to which is mapped) to the state (to which is mapped), with h, m = 1, 2, …, n.
Finally, each element of the M matrix with values in the range [0, 1] is mapped to the [0, 255] pixel value interval using Equation (4), transforming it into a 2D image.
where represents the pixel value at row h and column m of the image, and denotes the floor function.
To ensure the validity of our analysis data, we performed random sampling of both normal users and electricity theft users. As shown in Figure 2, to visually analyze the electricity consumption patterns of different users and investigate their variation trends, we randomly selected three normal users and three electricity theft users. Their daily electricity consumption–time curves over 304 consecutive days are plotted in Figure 2a,c, respectively. The zero value on the x-axis corresponds to the first day after data preprocessing.
Subsequently, the daily electricty consumption samples of users were transformed into 2D visualizations using the MTF-based method. Figure 2a displays the 304-day electricity consumption sequences of three normal users, with their corresponding 2D images shown in Figure 2b. Similarly, Figure 2c presents the 304-day electricity consumption sequences of three electricity theft users, with their corresponding 2D images displayed in Figure 2d.
Three representative users from each category are displayed for visual comparison. The analysis reveals that, in general, most electricity theft users exhibit lower daily electricity consumption than normal users, while normal users demonstrate stronger fluctuations and more discernible patterns in their electricity usage behavior. As observed in Figure 2a, the electricity consumption of regular users is influenced by seasonal variations. Distinct consumption peaks during winter and summer months indicate relatively stable and predictable usage patterns. In contrast, the consumption curves of electricity theft users show no discernible influence of seasonal or holiday-related factors. These curves either maintain prolonged low levels or exhibit sudden load spikes, displaying chaotic and irregular characteristics, as illustrated in Figure 2c. This distinction is further amplified and visualized in their corresponding MTF images (Figure 2b,d). The MTF images of normal users (Figure 2b) exhibit relatively ordered, grid-like or striped patterns with smoother transitions, reflecting the consistent and state-dependent nature of their daily consumption cycles (e.g., day-night patterns). In stark contrast, the MTF images of electricity theft users (Figure 2d) display highly chaotic, incoherent textures with scattered bright pixels or irregular blocks. This visual chaos directly corresponds to the unpredictable and abrupt state transitions in their consumption sequences—such as sudden jumps from very low to moderate consumption or erratic fluctuations—which fail to form any consistent temporal pattern. The lack of structural regularity in these 2D images provides a clear, model-friendly signature for distinguishing fraudulent behavior from normal usage. Although time-series-based analysis of electricity consumption curves can partially identify anomalous users, it remains challenging to observe and compare consumption variations across multiple time scales using this approach. In comparison, 2D representations provide a more intuitive visualization of the characteristic relationships within daily electricity consumption sequence data.
Therefore, machine learning models can capture the underlying electricity consumption patterns in MTF-based 2D images and automatically extract features, thereby achieving effective distinction between normal users and electricity theft users.
2.3. Feature Fusion Parallel Model
To achieve electricity theft detection, this paper designs a deep learning-based feature fusion model named ResNet-LSTM. The model combines ResNet and LSTM in parallel to integrate temporal and spatial features of electricity consumption patterns, thereby enhancing classification performance.
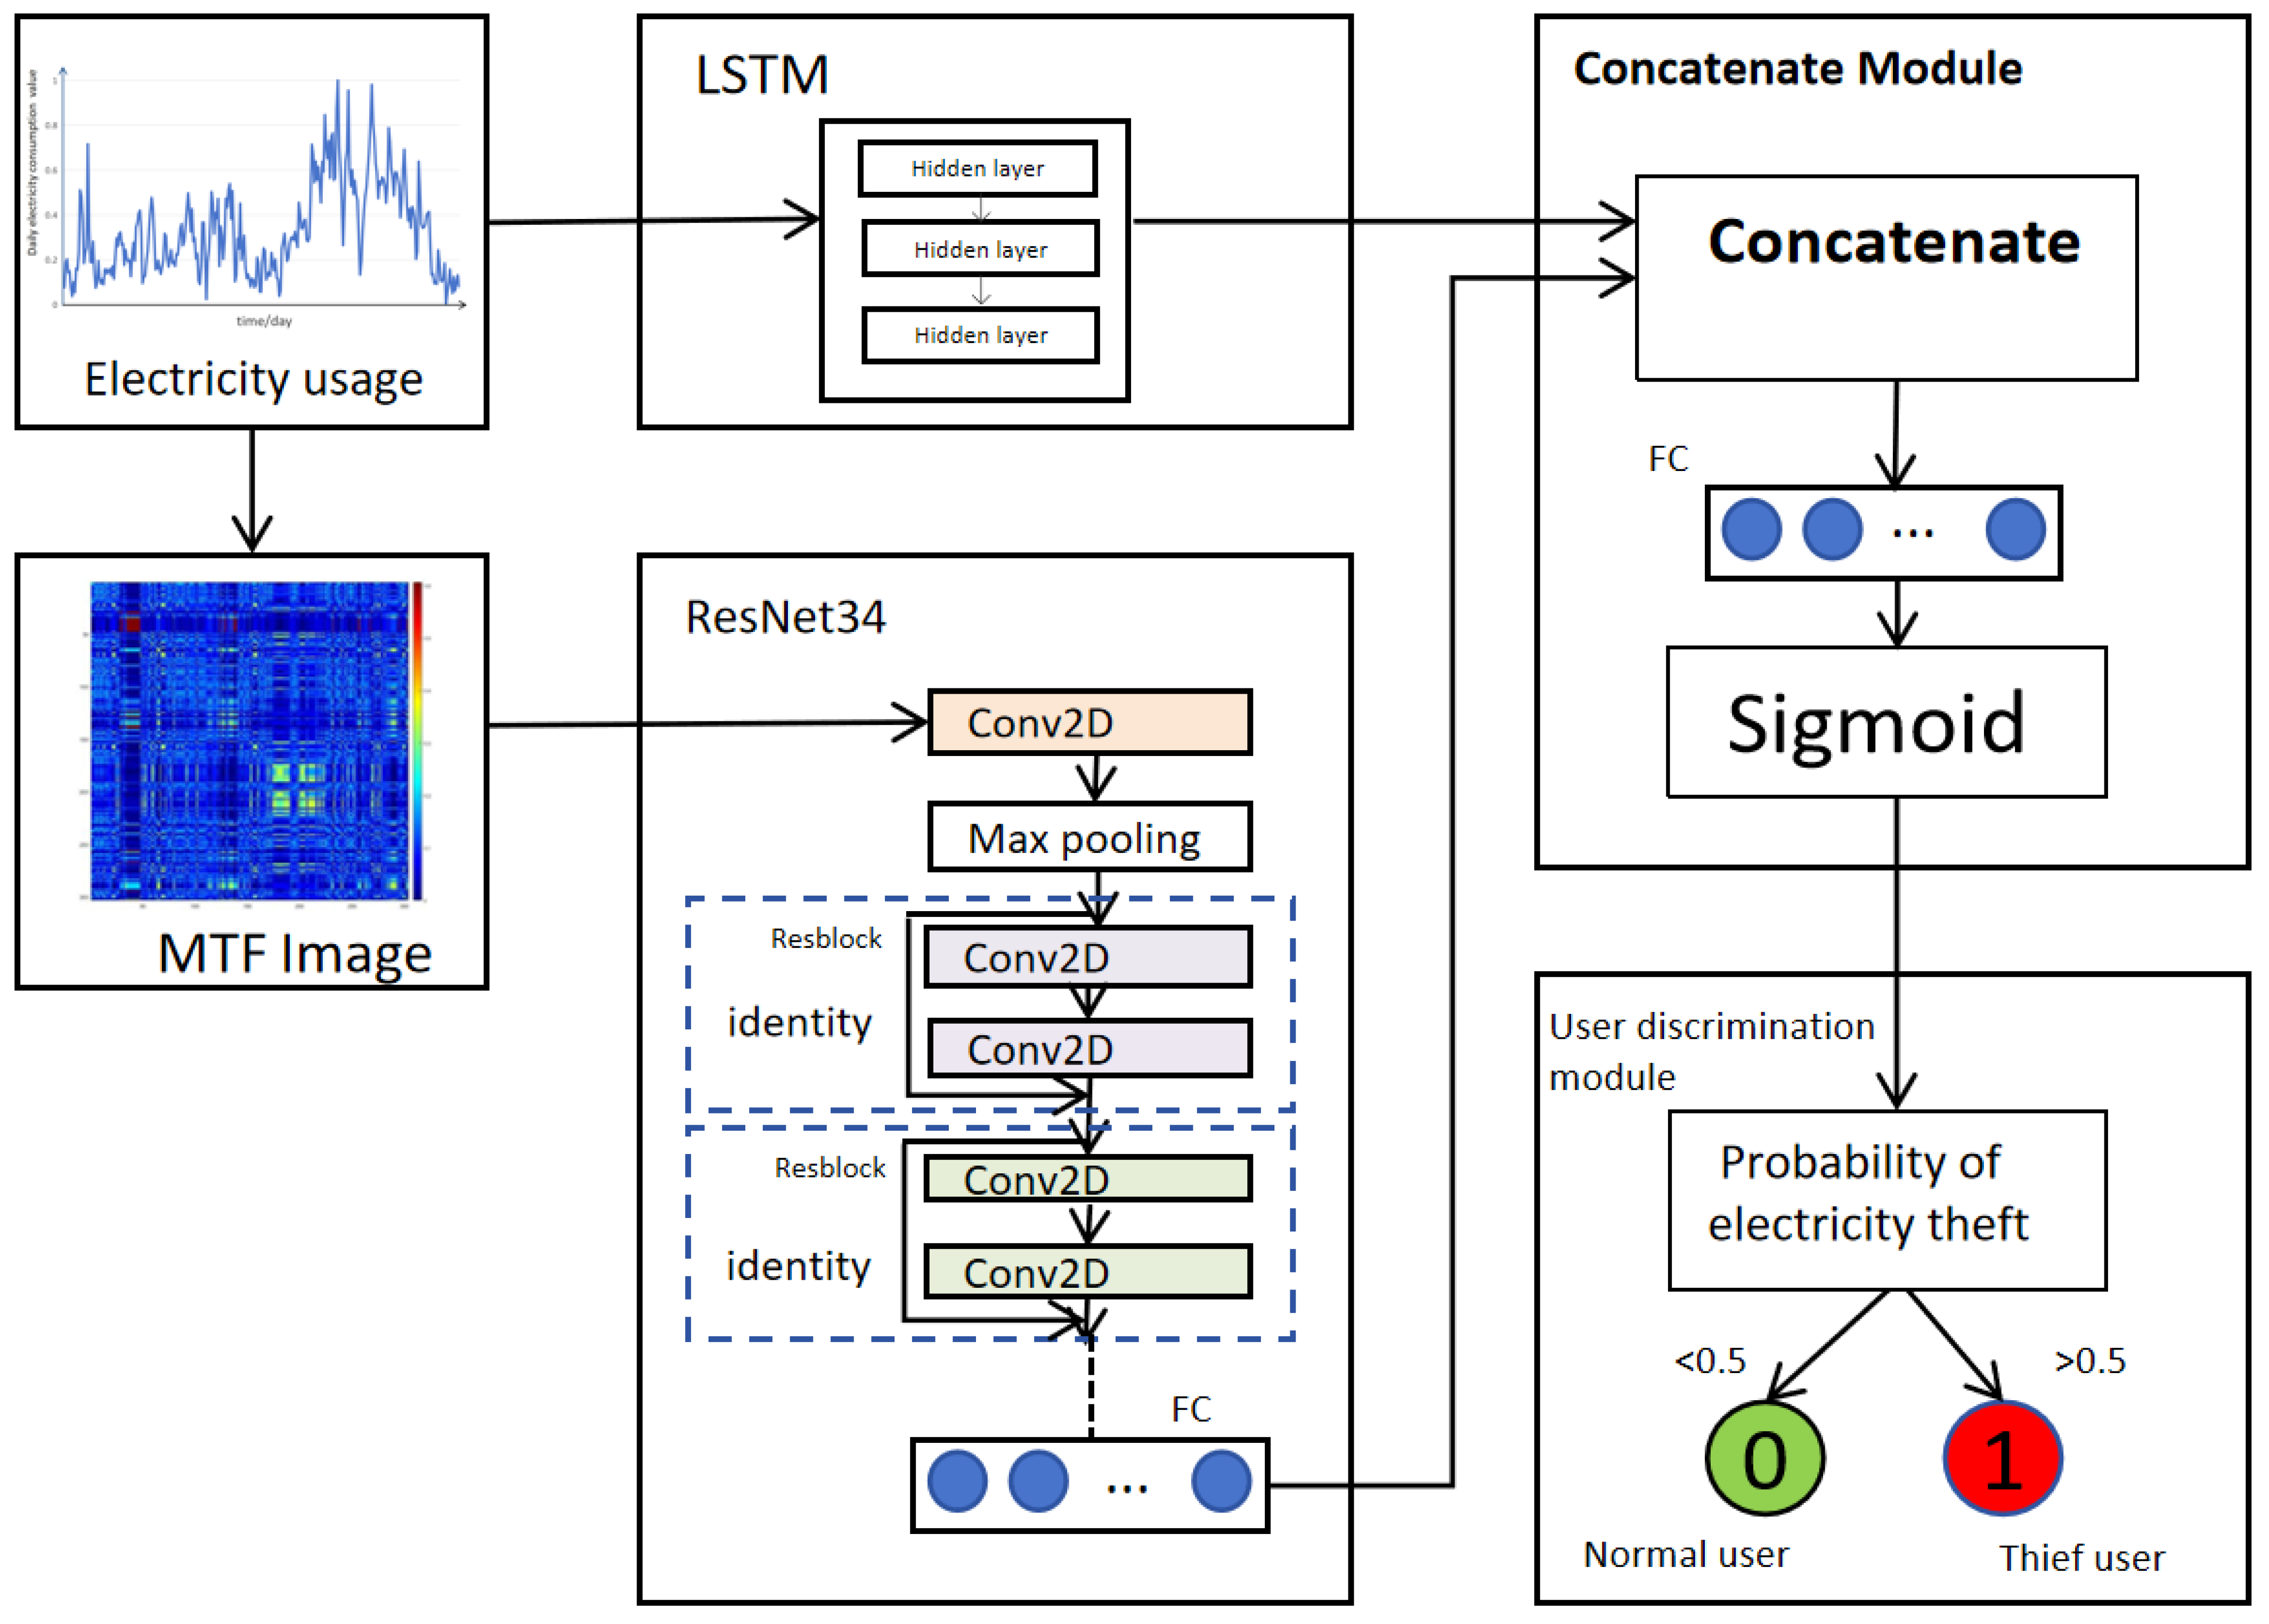
The ResNet-LSTM model architecture is illustrated in Figure 3. When processing electricity consumption time-series data, the model first converts the 1D temporal signal into a 2D Markov image. The ResNet model extracts local spatial features of power consumption patterns, while the LSTM branch captures long-term temporal dependencies. The feature vectors from both branches are concatenated through a fusion module, and the resulting high-dimensional features are classified by a Softmax classifier to detect power theft. By implementing a dual-branch architecture that integrates 1D temporal signals with 2D images, the model effectively utilizes multi-modal information to comprehensively describe data characteristics. This approach enhances feature extraction by identifying richer and more discriminative patterns, thereby improving classification accuracy. The following sections will provide detailed explanations of the 1D processing, 2D processing, and fusion modules.
Figure 3.
Overall architecture of the ResNet-LSTM model.
2.3.1. 1D Sequence Processing Module
For sequential data classification, LSTM is a widely adopted deep learning model [21]. Originally developed to address the gradient explosion and vanishing gradient issues in traditional recurrent neural networks (RNNs) when processing long sequences, LSTM has become a cornerstone in deep learning.
In RNNs, information propagation through the chain rule during backpropagation causes continuous multiplication of weight matrices across time steps. This accumulation can cause gradient values to increase rapidly. The resulting excessively large weight updates hinder model convergence, a phenomenon known as gradient explosion. Conversely, when input values are extremely large or small, activation functions such as Sigmoid or tanh produce outputs approaching 0 or 1, where their gradients approach zero. This leads to the vanishing gradient problem, where gradient values diminish exponentially during backpropagation over multiple time steps, making it difficult for the network to learn long-term dependencies.
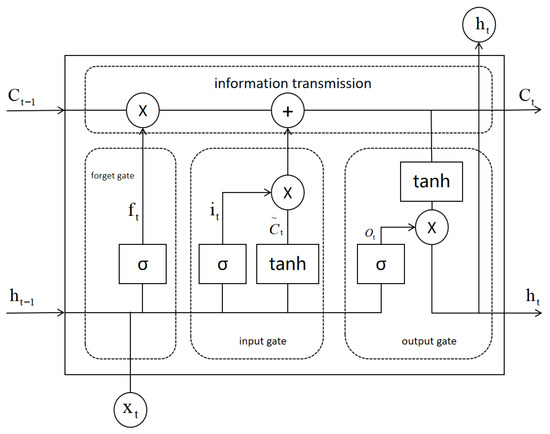
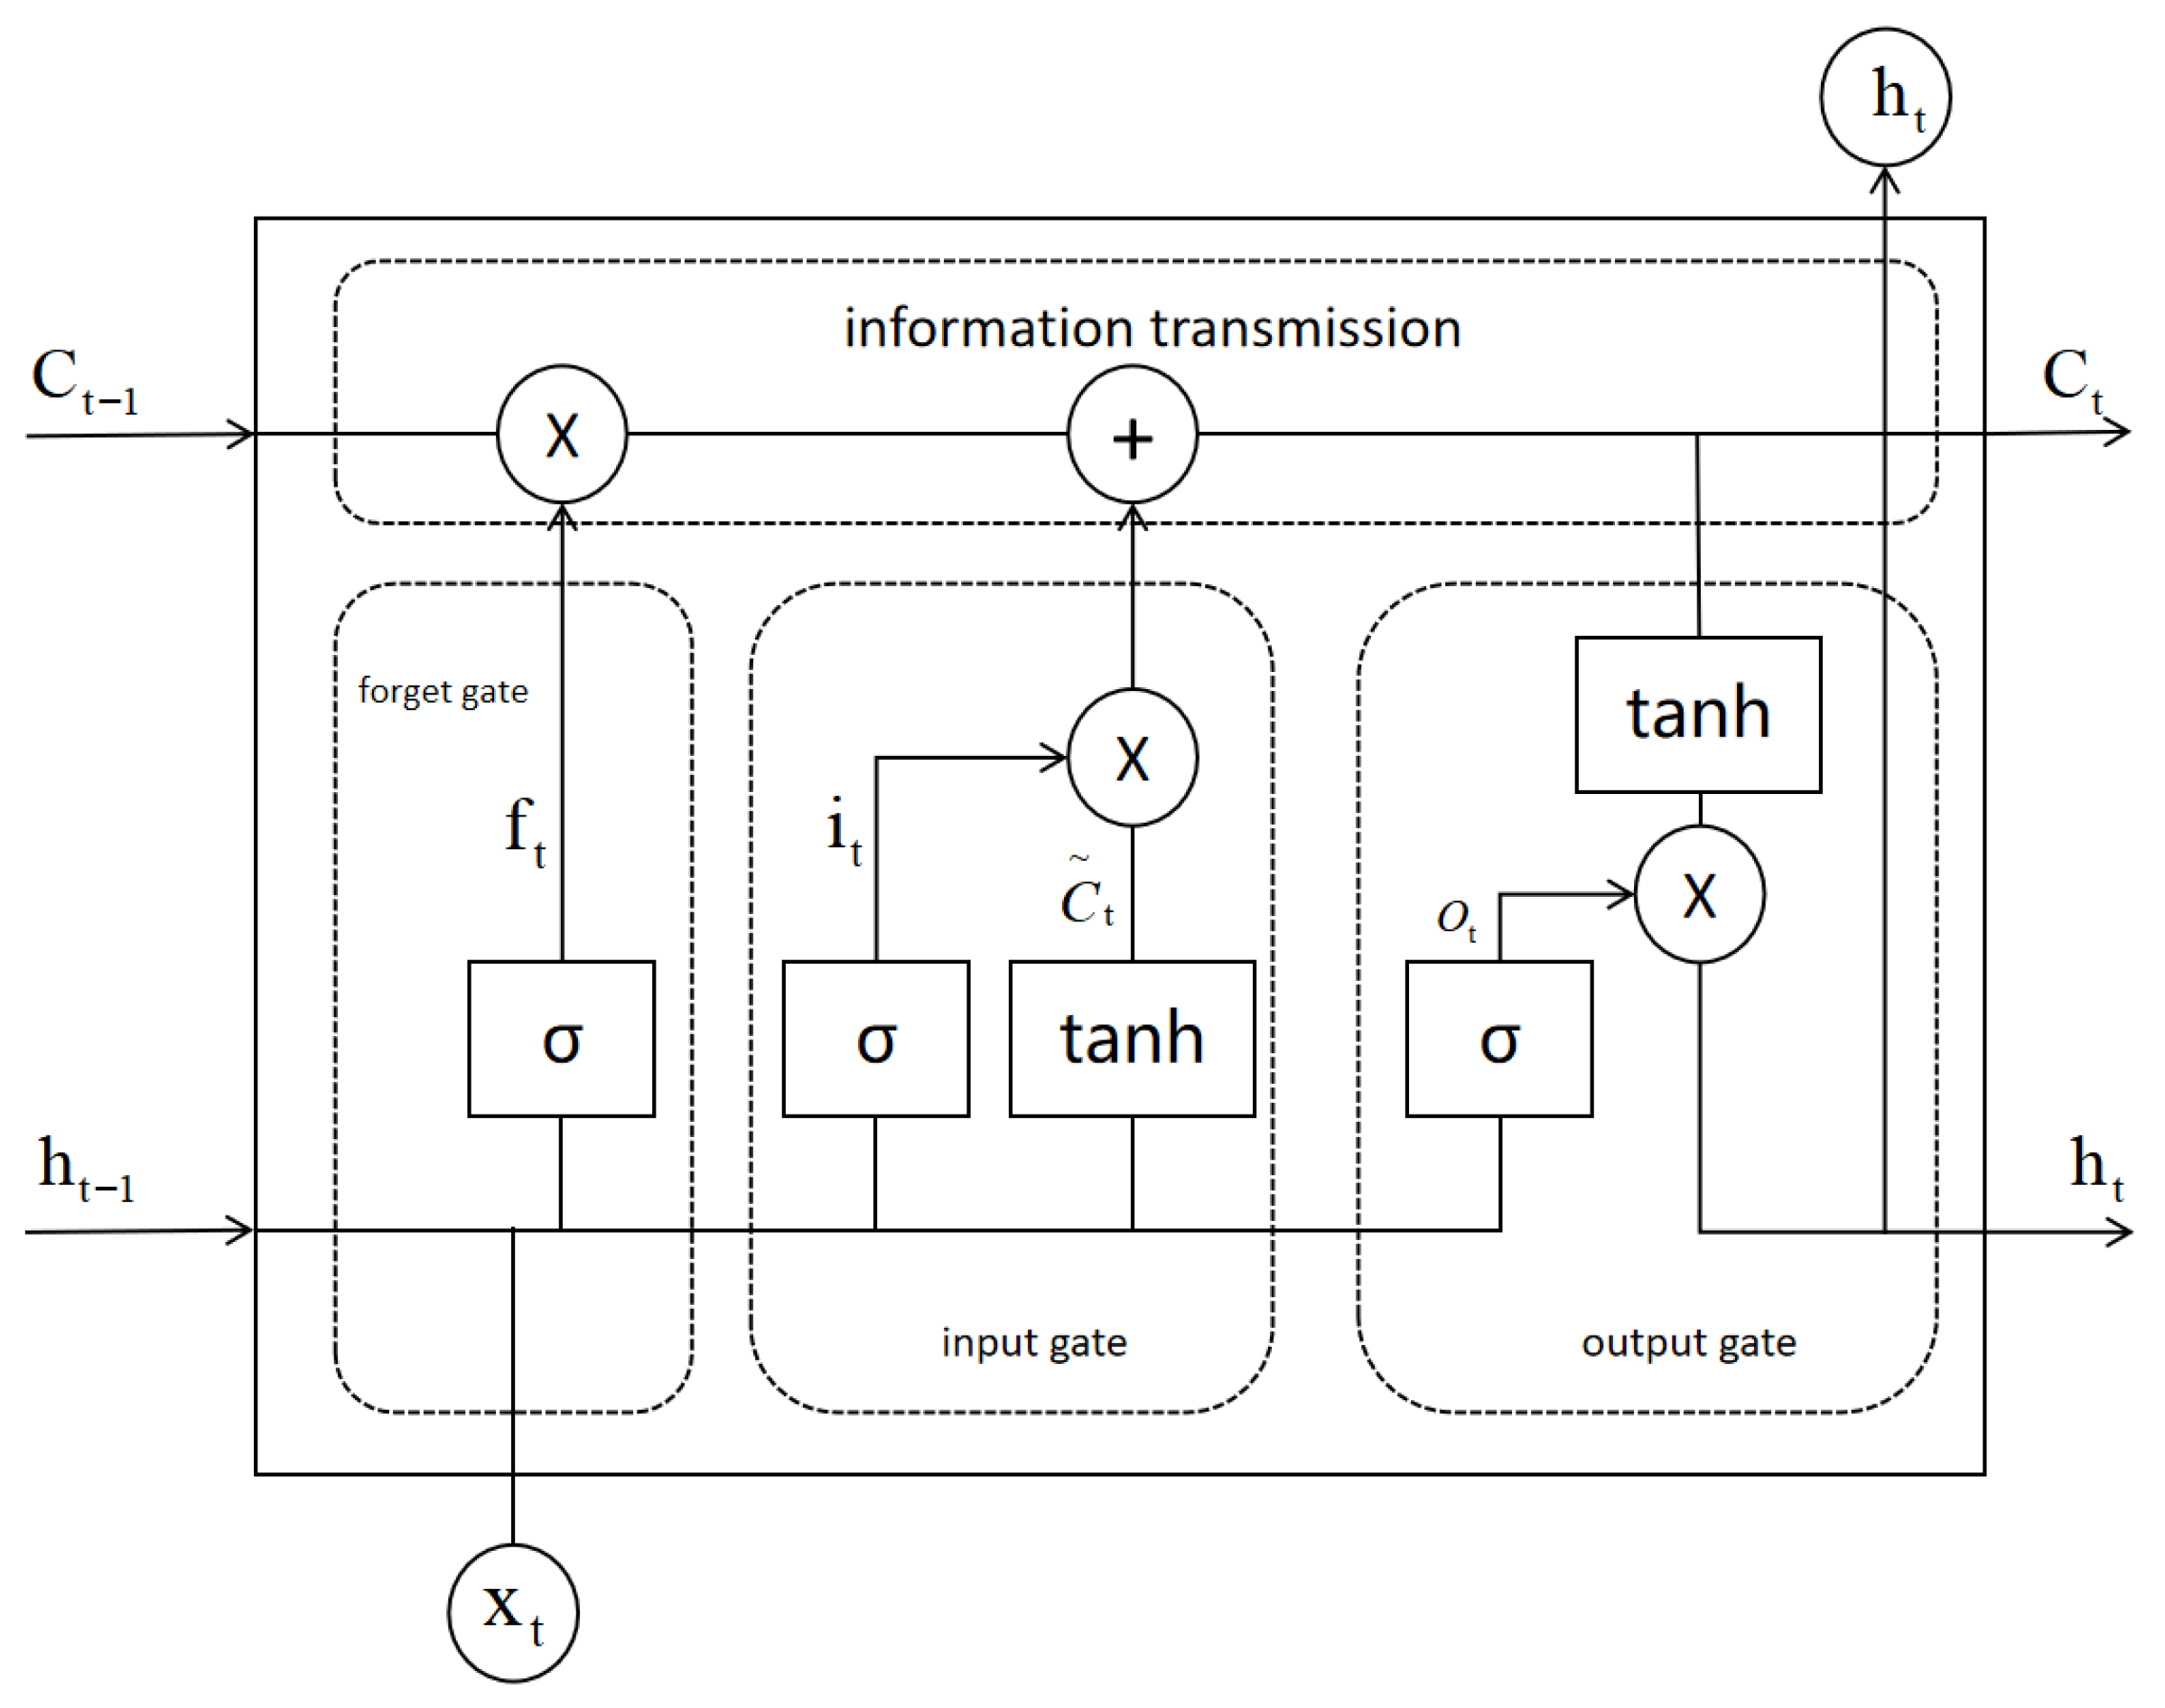
LSTM networks effectively address the gradient instability issue in traditional RNNs through innovative gating mechanisms and state management units, making them widely adopted in time series prediction tasks. The architecture incorporates three gating structures (input gate, forget gate, and output gate) along with two state variables (cell state and hidden layer state), dynamically regulating information flow to maintain gradient stability. This unique design enables outstanding performance in time series analysis, with the cell state serving as the core mechanism for information propagation. The process is visually represented in Figure 4 as the topmost straight line (from to ).
Figure 4.
LSTM network architecture diagram.
2.3.2. 2D Image Processing Module
In image recognition model selection, traditional CNNs face challenges like gradient explosion or vanishing gradients when deepened, leading to performance degradation. To address this, ResNet [22] introduced residual blocks.
For 2D images of electrical current sequences processed through MTF 2D processing, CNNs can learn from training data by leveraging their specialized convolutional layers, thereby avoiding explicit feature extraction. The core concept of CNNs involves iterative learning and feature extraction through a series of operations including convolution, non-linear activation function mapping, and pooling. The basic structure of CNNs consists of an input layer, convolutional layers, pooling layers, fully connected layers, and an output layer. The neuron activation function employs the ReLU function, while the final fully connected layer uses the Softmax logistic regression function for classification, with the calculation formula being [23]
where represents the output value of the i-th node, and n denotes the number of output categories.
The overall model expression of the convolutional neural network is shown in Equation (6).
In this formula, represents the 2D image modal data of the electricity consumption sequence; represents the classification result of whether the output is electricity theft; represents the convolution layer; represents the pooling layer; represents the fully connected layer; and represents the classification function for calculating the output result [24].
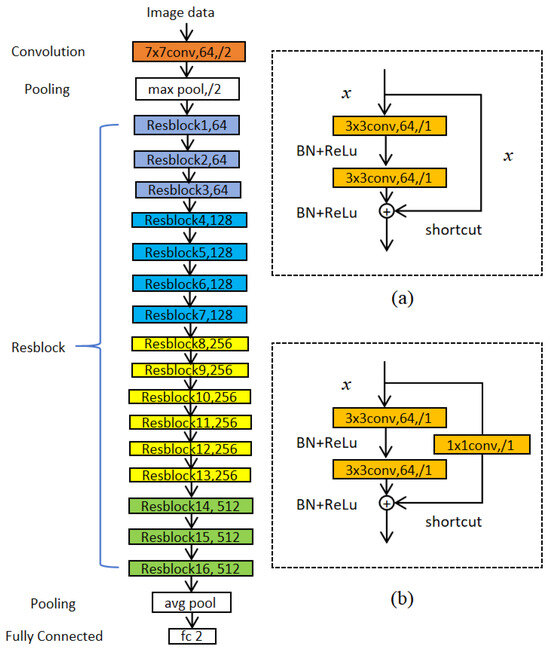
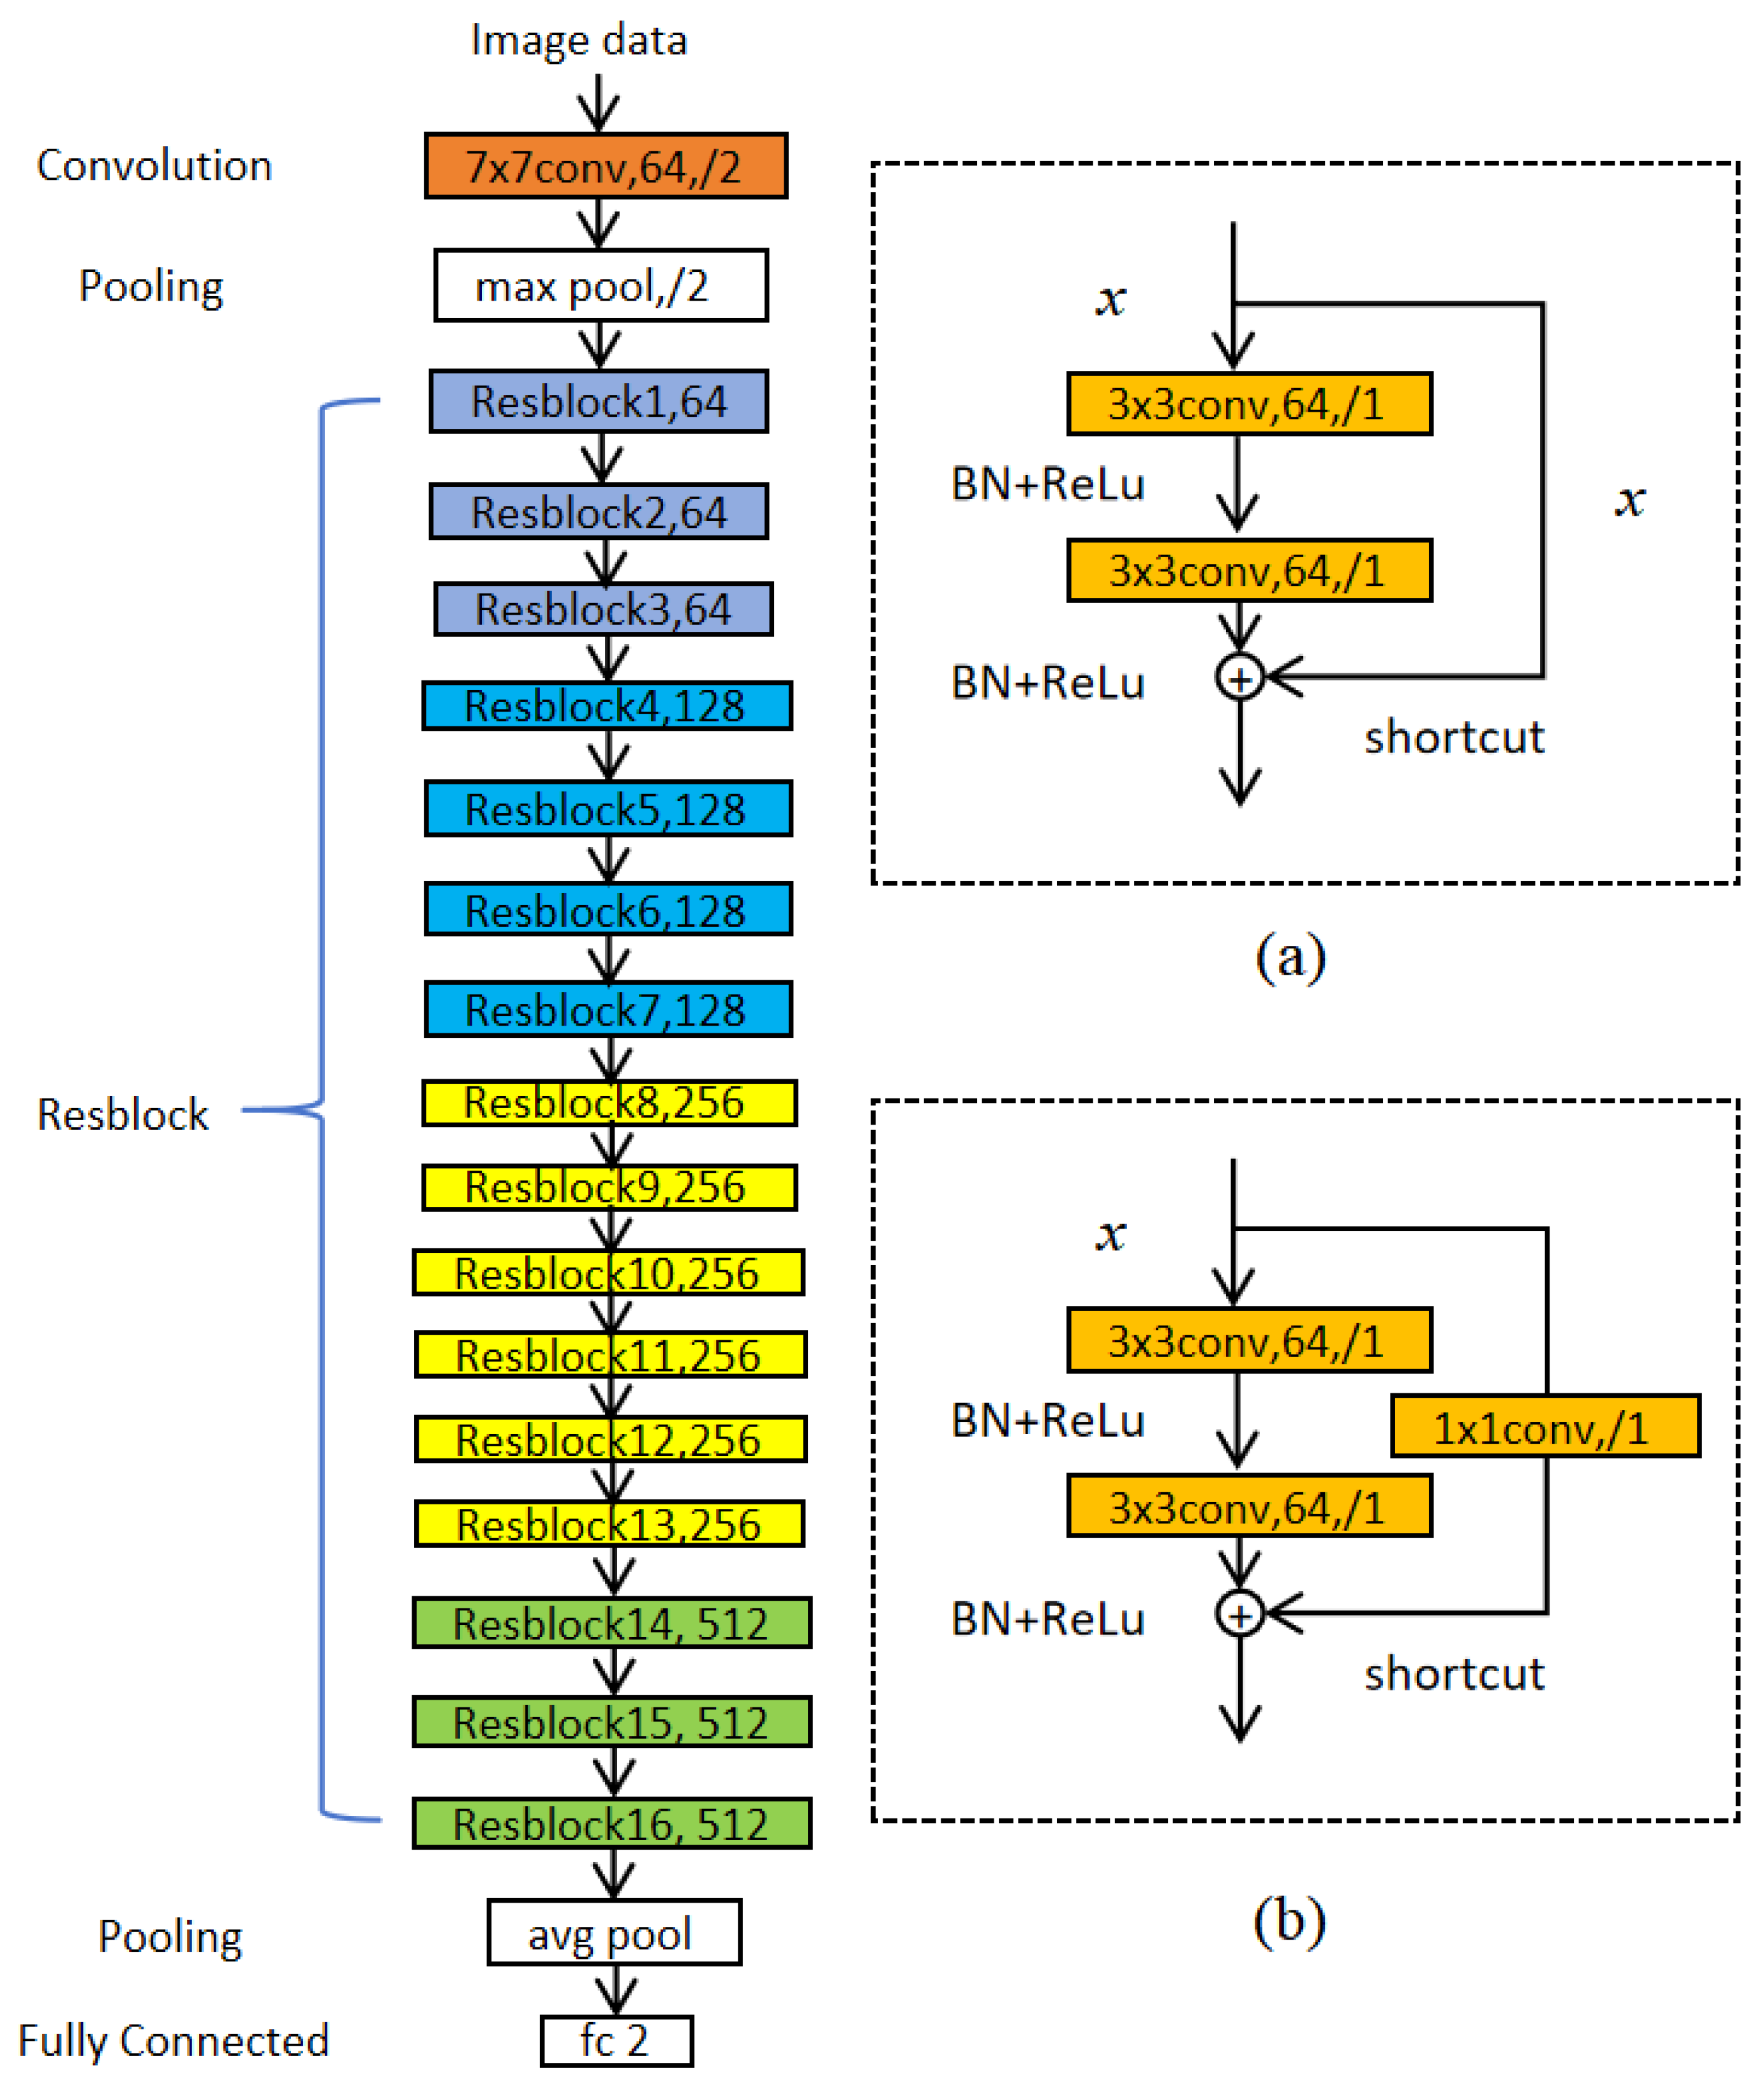
ResNet introduced the residual learning module (residential block, Resblock) to address the gradient vanishing problem caused by network depth, effectively resolving the performance degradation due to gradient dispersion during deep network training. Based on MTF, the daily electricity consumption of users is converted from a 1 × 304 1D sequence to a 304 × 304 2D image, which serves as the input for the deep residual network. The ResNet34 architecture adopted in this study is illustrated in Figure 5.
Figure 5.
ResNet34 architecture diagram. The network features an initial 7 × 7 convolutional layer (64 filters, stride 2) and a pooling layer (stride 1), followed by 16 residual modules. Subfigures illustrate the two shortcut types: (a) identity shortcuts used for modules 1–3, 5–7, 9–13, and 15–16; and (b) projection shortcuts via 1 × 1 convolutions (stride 2) used for modules 4, 8, and 14.
The convolutional layer is configured with 64 filters of size 7 × 7 and a stride of 2. The pooling layer employs a stride of 1. The residual module consists of 16 stacked layers, where layers 1, 2, 3, 5, 6, 7, 9, 10, 11, 12, 13, 15, and 16 are directly connected (as shown in Figure 5a). For layers 4, 8, and 14, a 1 × 1 convolutional layer with stride 2 is used as the shortcut path (as shown in Figure 5b).
2.3.3. Module Connection
The aforementioned convolutional modules extract broad and deep features of user electricity consumption behavior from 1D time-series data and 2D image data, respectively. To enable the model to learn both types of features simultaneously, the outputs of the 1D and 2D processing modules are concatenated to generate a new fused feature set. The concatenation operation is defined as shown in Equation (7):
where and represent the 1D and 2D feature tensors of electricity consumption information; represents the fused feature after concatenation; and denote the i-th elements of the 1D and 2D feature tensors; (·) is the concatenation function, which concatenates two tensors along the same connection axis; m and n are their corresponding dimensions along the connection axis [25].
To enable the hybrid module to equitably learn feature information from both channels, this study sets both n and m to 128. The concatenation operation integrates the two types of electricity consumption features extracted by the convolutional modules. This newly formed feature set is then fed into a fully connected layer containing 64 neurons for non-linear feature learning. Finally, the corresponding electricity theft probability is obtained through a Sigmoid activation function. In this framework, users with a theft probability greater than 0.5 are classified as electricity theft users, while those with a probability below this decision threshold are identified as normal users.
3. Results
3.1. Experimental Setup and Training Details
This study implements the ResNet-LSTM hybrid neural network model using PyTorch 2.3.1 deep learning framework, leveraging GPU acceleration capabilities for efficient training. All experiments were conducted in a Windows 10 environment using PyCharm 2024.1.4 with Python 3.9 for code development, training, and validation. The hardware configuration consisted of a 9th Gen Intel Core i5-9400F 2.5 GHz CPU and a GTX 1650 4G GPU.
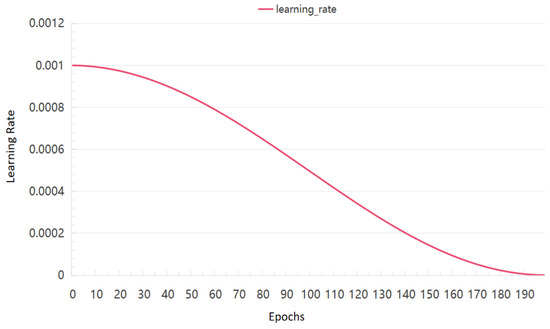
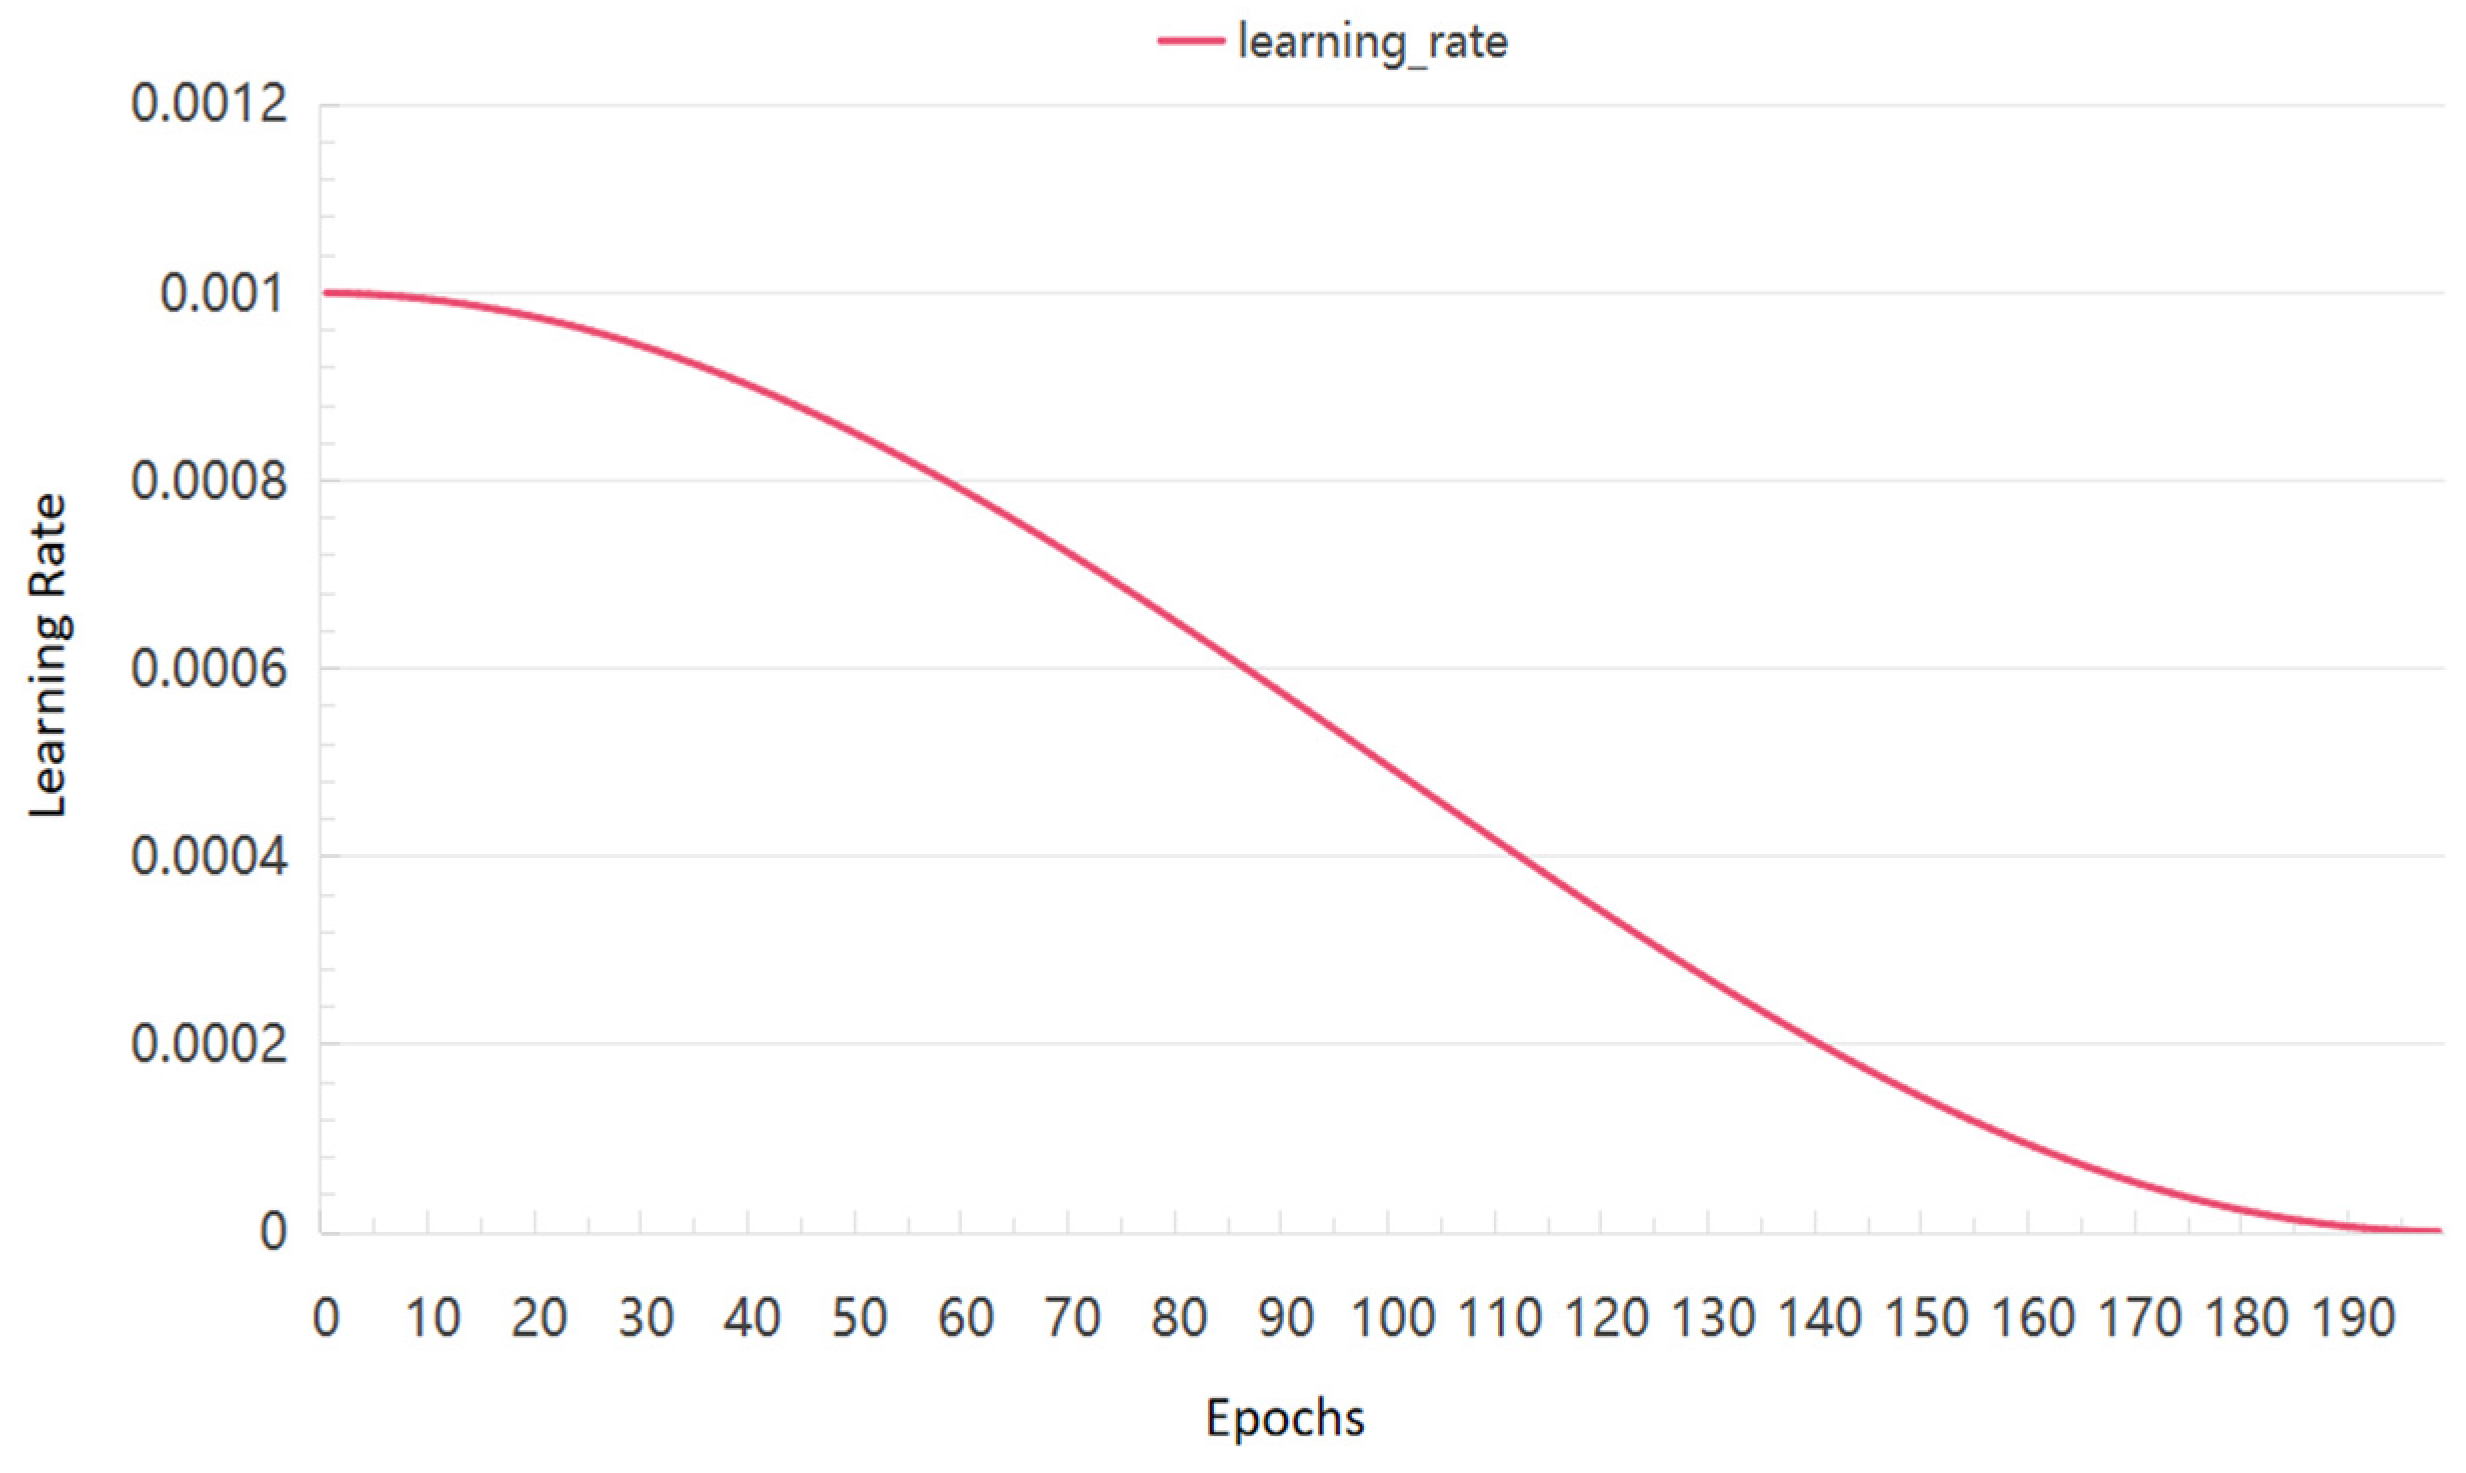
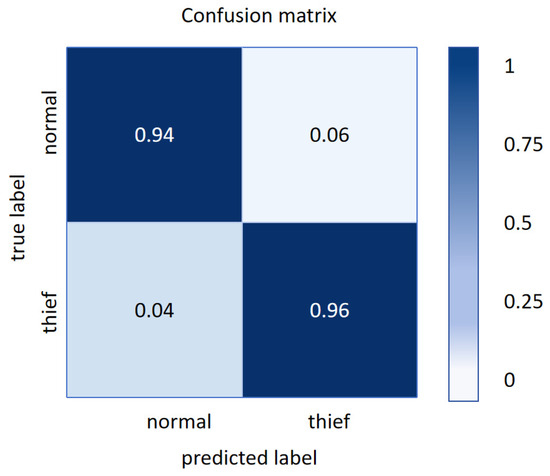
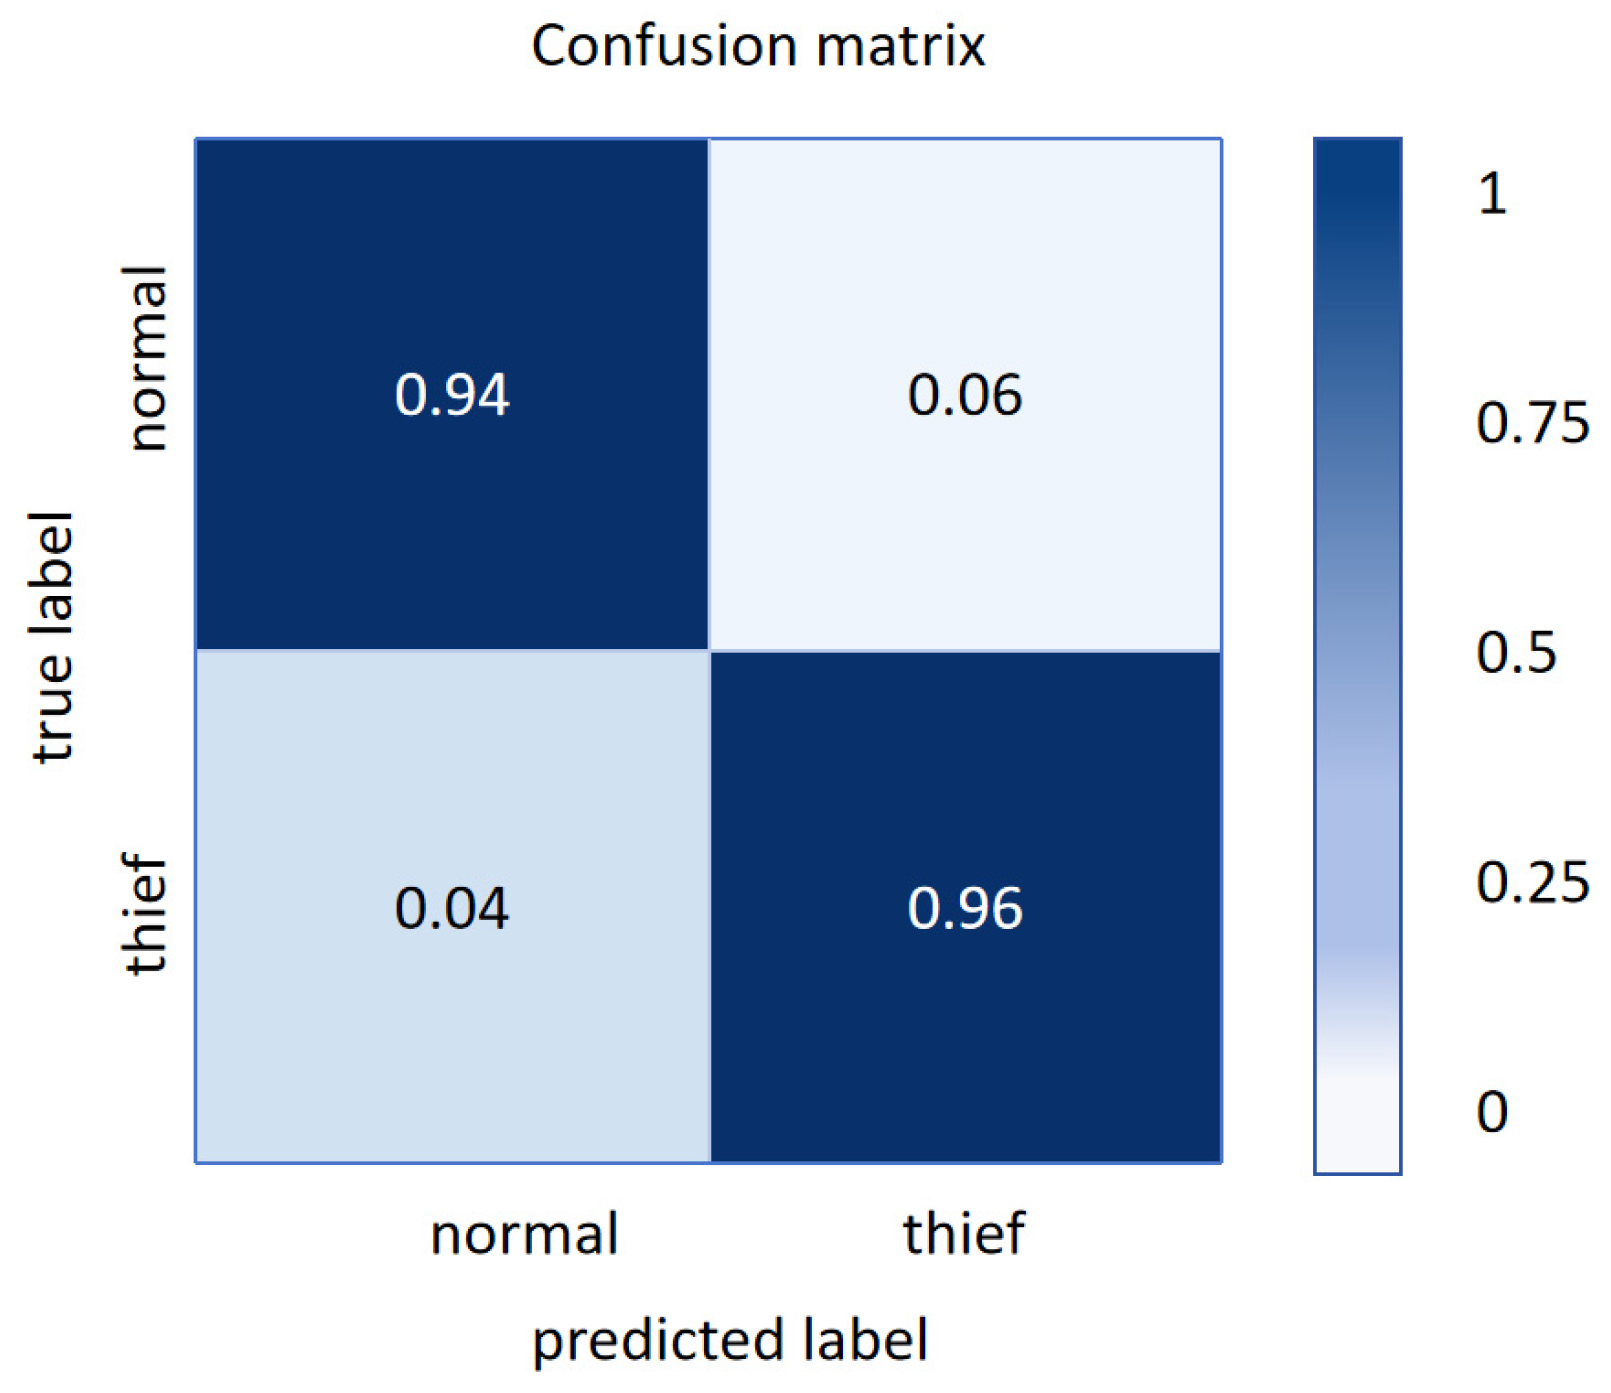
The 2D image data of all samples were generated using the MTF conversion method. The dataset was divided into three subsets (training, validation, and testing) in a 3:1:1 ratio. The Adam optimization algorithm was employed with 200 iterations and an initial learning rate of 0.001. The proposed method yielded learning rate and loss curves as shown in Figure 6, while the confusion matrix for electricity theft detection is presented in Figure 7.
Figure 6.
Learning rate curve.
Figure 7.
Confusion matrix of real and predicted labels.
Figure 6 displays the learning rate curve used in this study, reflecting the dynamic changes in the learning rate over training epochs during the model training process. The horizontal axis (X-axis) represents the training epochs, while the vertical axis (Y-axis) indicates the learning rate values. The curve exhibits a gradually declining trend, which results from the adoption of a learning rate decay strategy. This strategy aims to use a higher learning rate in the early stages of training to accelerate convergence, followed by a gradual reduction to refine parameter updates, enhance model stability, and prevent overfitting. Such an adjustment mechanism helps the model approach the optimal solution more smoothly during the training process.
Figure 7 presents the confusion matrix of the ResNet-LSTM model on the test set, providing an intuitive evaluation of the model’s classification performance between normal users and electricity theft users. In the matrix, the top-left quadrant (True Positive, TP) represents the number of samples correctly identified as electricity theft users; the top-right quadrant (False Positive, FP) indicates the number of normal users incorrectly classified as electricity theft; the bottom-left quadrant (False Negative, FN) denotes the number of electricity theft users misclassified as normal; and the bottom-right quadrant (True Negative, TN) corresponds to the number of normal users correctly identified. To fairly evaluate the final model, we performed hold-out validation on a completely independent test set. The test set covers a validation period of 304 days and comprises 1200 users (900 normal and 300 electricity theft), reflecting a real-class distribution after balancing. The corresponding confusion matrix is shown in Figure 7.
The experimental results demonstrate that the model achieves a recognition accuracy of 94% for normal users and 96% for electricity theft users. This indicates that the model not only effectively distinguishes between the two user categories but also exhibits high detection sensitivity and discriminative capability towards theft behaviors. This outcome further validates the effectiveness of the MTF image enhancement and hybrid neural network fusion strategy in the task of electricity theft detection.
3.2. Performance Indicator Selection
Current evaluation metrics for assessing the performance of classification models include accuracy , recall , precision , and the Area Under the Receiver-Operating Characteristic (ROC) Curve (AUC). Among these, , and evaluate the classification precision of the method, while AUC measures its generalization capability [26]. This study adopts accuracy , recall and ROC curve as the evaluation metrics for the model.
represents the proportion of correctly classified samples to the total number of samples. The closer is to 1, the better the classification performance of the model. The expression for is shown in Equation (8).
where represents the number of users correctly classified as electricity theft (true positives); represents the number of users misclassified as normal but actually engaged in electricity theft (false negatives); represents the number of users misclassified as electricity theft but actually normal (false positives); represents the number of users correctly classified as normal (true negatives).
The recall rate , also known as the recall rate, represents the proportion of correctly classified electricity theft users to the total number of actual electricity theft users. The higher the recall rate , the higher the accuracy of classifying actual positive samples.
To validate the effectiveness and accuracy of the proposed algorithm model, a series of comparative experiments were conducted. Using the same dataset (1D electricity consumption data), we evaluated the classification performance of five models: 1D-CNN, GASF-ResNet, RP-ResNet, MTF-ResNet, and the proposed MTF and hybrid neural network model MTF-ResNet-LSTM. The results are detailed in Table 2.
Table 2.
Model Performance Comparison.
As shown in Table 2, the MTF-ResNet model achieves 0.891 and 0.911 scores on performance metrics and respectively, significantly outperforming other models. This demonstrates that the MTF-ResNet feature extraction approach better distinguishes between normal users and electricity theft users. When compared with the proposed MTF-ResNet-LSTM model, the latter shows superior performance. This is because the original MTF-ResNet model only utilizes 2D image modeling, which fails to capture both the global non-linear characteristics of electricity consumption data and temporal correlations. The integration of a 1D LSTM model enables the model to extract more comprehensive features during training.
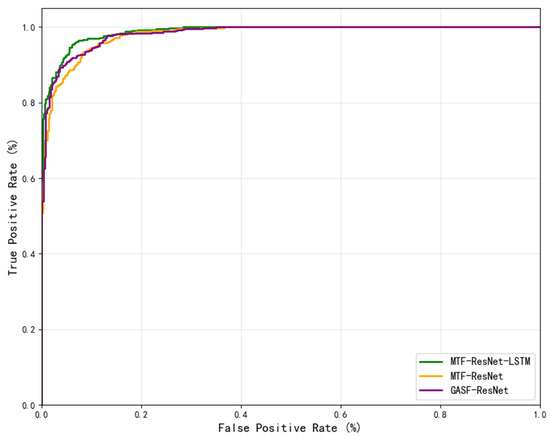
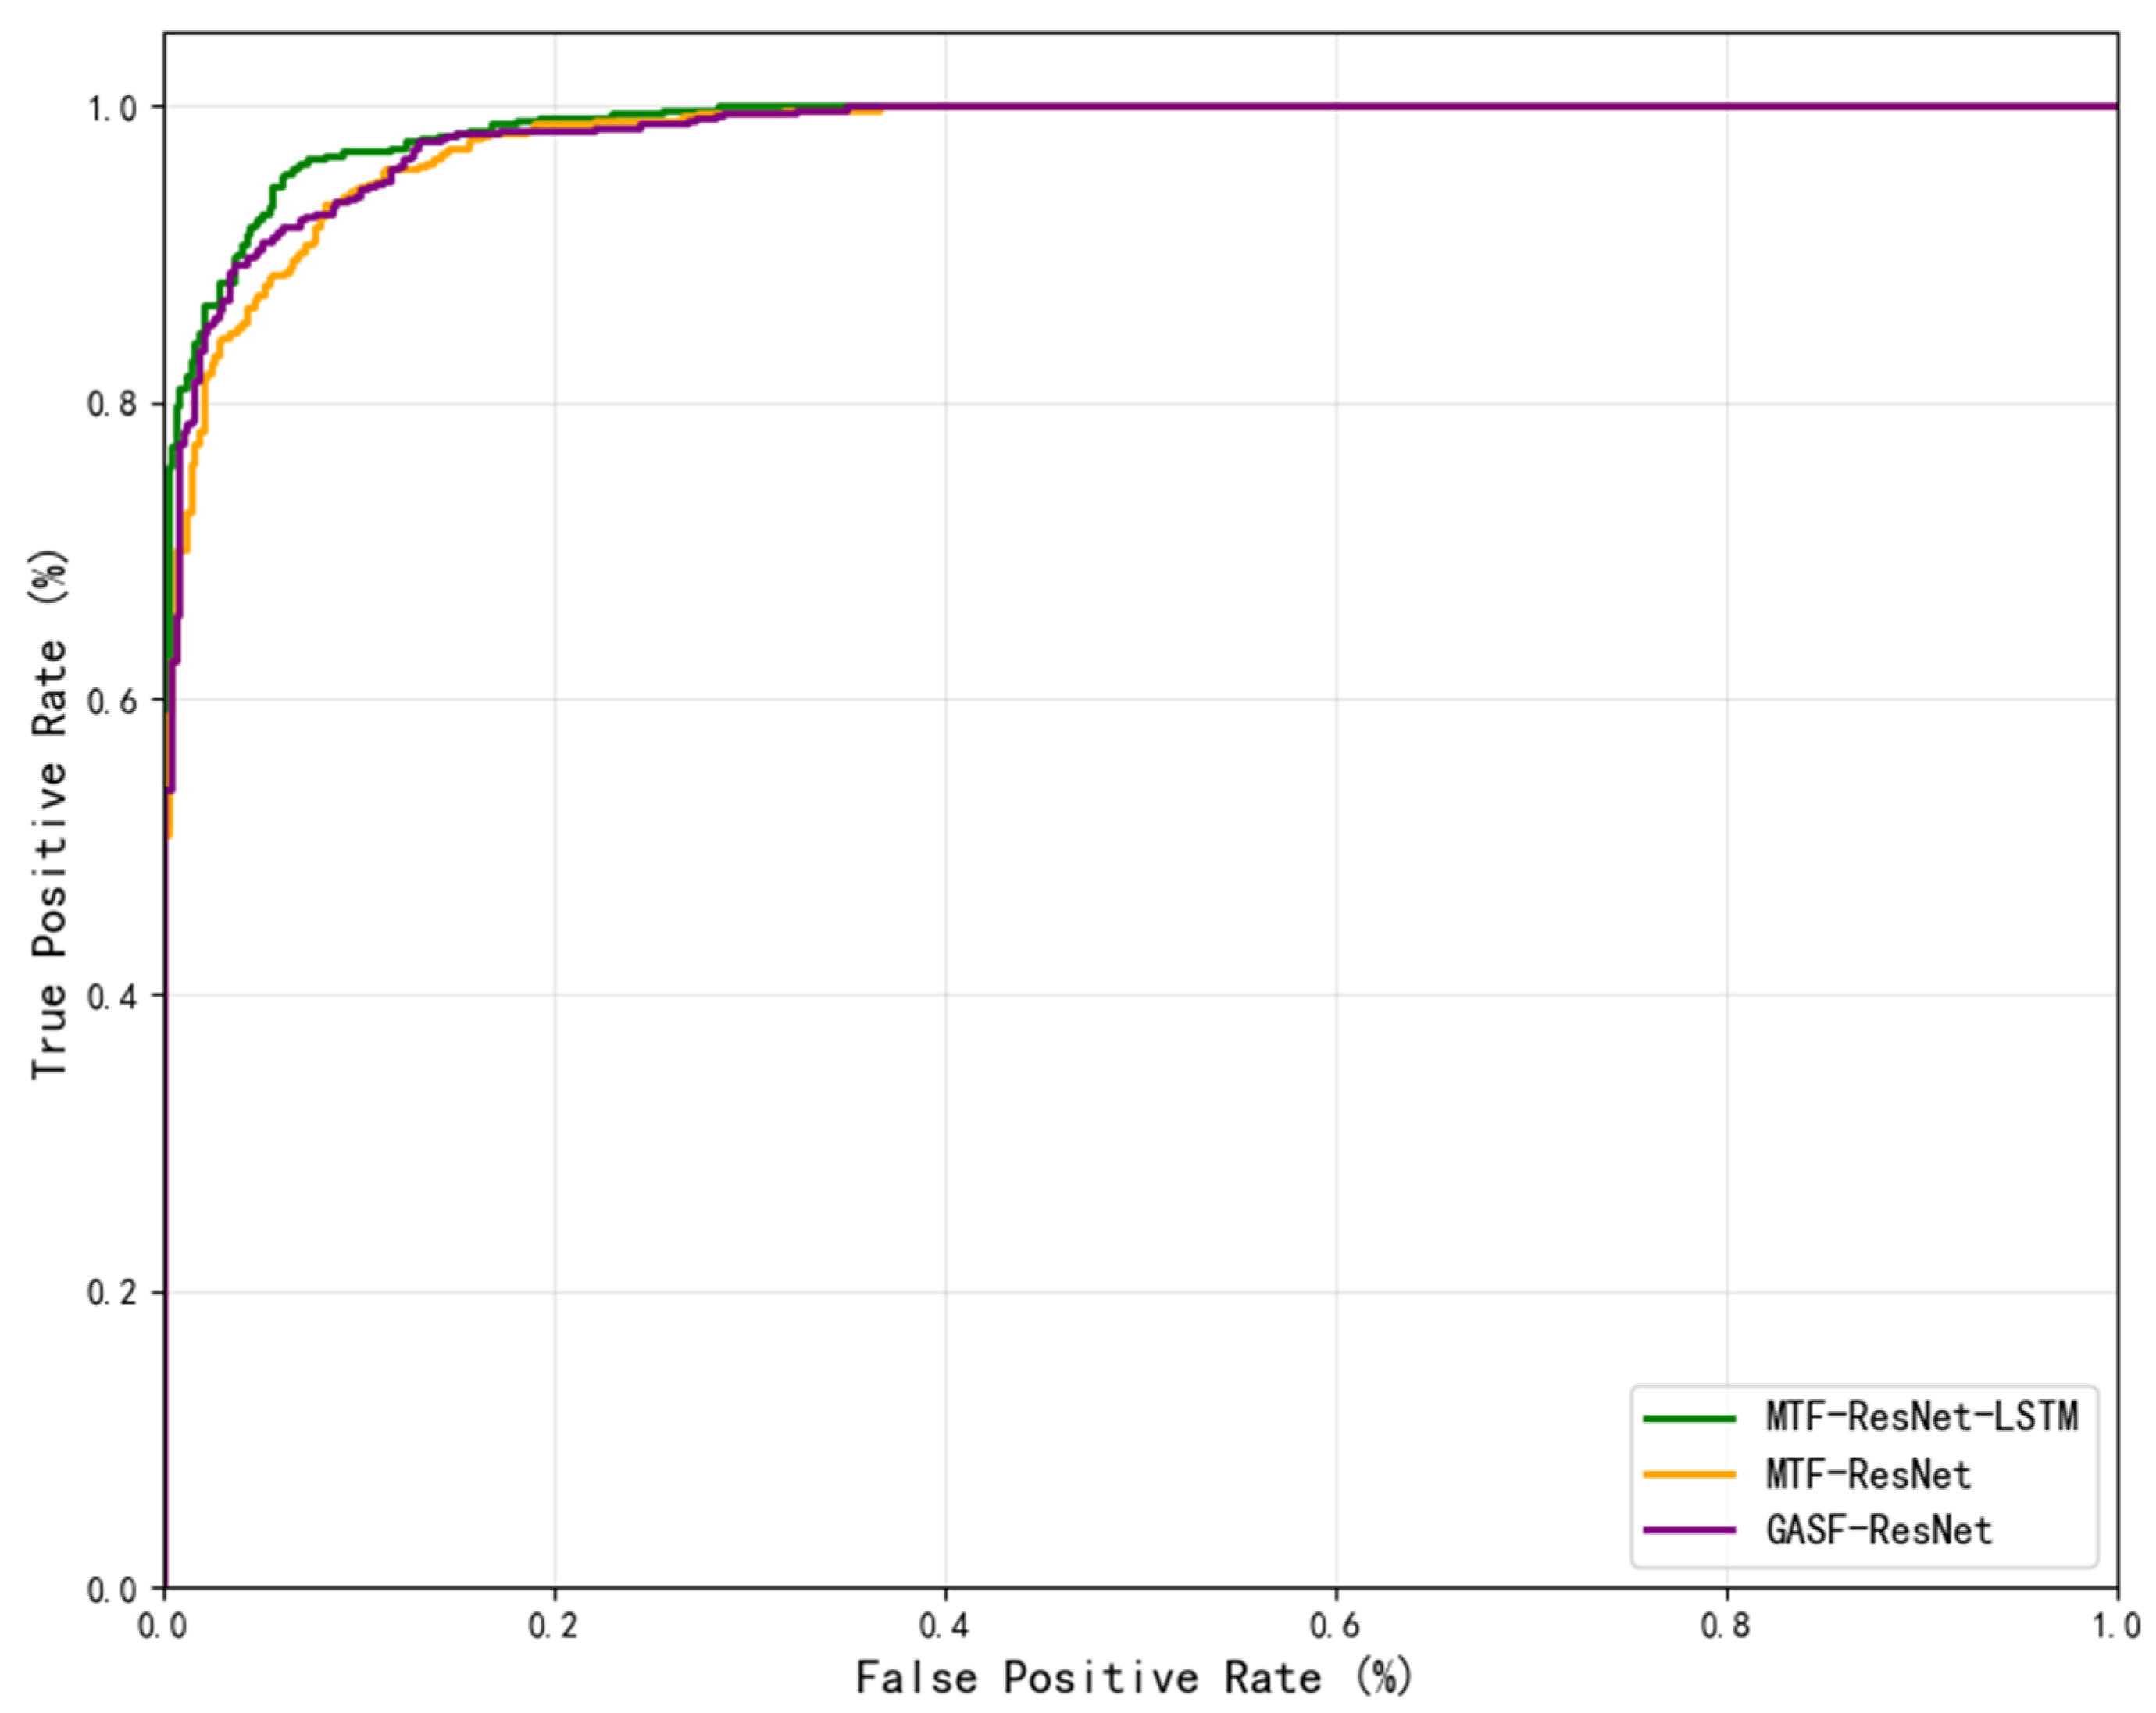
The model was evaluated by introducing the ROC curve. The ROC curves of MTF-ResNet-LSTM, MTF-ResNet, and GASF-ResNet are compared in Figure 8.
Figure 8.
ROC curve comparison.
As shown, the area under the ROC curve for MTF-ResNet-LSTM is significantly larger than those of MTF-ResNet and GASF-ResNet, thereby demonstrating its superior ability to handle the class imbalance problem.
4. Discussion
The experimental results presented in Section 3 clearly demonstrate the superior performance of the proposed MTF-ResNet-LSTM hybrid model for electricity theft detection. This section provides a deeper interpretation of these findings, contextualizes them within the broader landscape of existing research, analyzes the underlying reasons for the performance gains, and acknowledges the limitations and broader implications of our work.
4.1. Interpretation of Superior Performance
Our model’s significant improvement in accuracy (94.0%) and recall (96.0%) over all baselines (Table 2) is primarily due to its effective multi-modal feature fusion strategy. The MTF transformation successfully encodes the temporal dynamics of electricity consumption into a 2D spatial representation, where the transition probabilities between consumption states become visually discernible patterns (as seen in Figure 2b,d). The ResNet branch is adept at extracting these localized, texture-like spatial features from the MTF images, which are highly indicative of abnormal state transition behaviors characteristic of theft. Concurrently, the LSTM branch processes the original 1D sequence to capture its global, long-term temporal trends and periodicities—features that might be diluted or lost in the discretized, state-based MTF representation. The concatenation of these complementary feature sets provides the classifier with a far more comprehensive and discriminative profile of user behavior than any single-modality approach can offer.
4.2. Comparative Analysis with Existing Methods
The performance hierarchy observed in Table 2 validates the progressive advancements in methodology. Traditional 1D-CNN and SVM models perform the poorest, as they lack sophisticated mechanisms to model long-range dependencies in raw sequences. The image-encoding methods (GASF-ResNet, RP-ResNet) show a notable improvement by leveraging 2D CNNs to learn from transformed images, confirming the value of representing temporal transitions spatially. Among these, MTF-ResNet achieves the best performance, underscoring the specific effectiveness of the MTF in preserving meaningful sequential dependencies for the theft detection task. However, the performance leap from MTF-ResNet to our MTF-ResNet-LSTM model is the most significant. This directly supports our core hypothesis. Although MTF images are powerful, they cannot fully substitute the rich, continuous temporal context of the original sequence. The MTF-ResNet model is limited by its exclusive reliance on the image modality. Our hybrid model overcomes this by reintegrating the original sequential context via LSTM, resulting in a synergistic combination that enhances overall performance.
4.3. Limitations, Policy Implications, and Recommendations
4.3.1. Limitations
Despite its effectiveness, the proposed method has certain limitations that merit consideration. First, the performance is contingent on the quality and granularity of the historical data. While we addressed significant missing values, the model’s sensitivity to data sparsity in very short observation windows requires further study. Second, the parallel architecture, which involves both MTF image generation and dual-network processing, incurs a higher computational cost than single-branch models. This may pose challenges for real-time deployment on resource-constrained edge devices, suggesting a potential direction for future model lightweighting. Third, while the model achieves high accuracy, its “black-box” nature persists. Although the MTF images offer more interpretability than raw network weights, precisely tracing which spatio-temporal pattern combination led to a specific classification remains complex. Enhancing model interpretability is crucial for gaining the trust of grid operators and facilitating actionable investigations.
4.3.2. Policy Implications
The findings of this study carry significant implications for utility companies and regulatory bodies. The high-accuracy detection model can transition from a retrospective analysis tool to a proactive risk-screening instrument. This shift enables a move from costly, blanket manual inspections to targeted, data-driven audits, thereby optimizing resource allocation and increasing inspection hit rates. For regulators, our work demonstrates the feasibility of employing advanced AI analytics as part of compliance monitoring frameworks. It can inform the development of new standards or guidelines for using data analytics in non-technical loss reduction. Furthermore, the multi-modal approach underscores the importance of preserving and leveraging diverse data representations (like raw sequences and derived images) in future smart meter data governance policies, rather than relying on a single summary statistic.
4.3.3. Suggestions for Future Work and Implementation
This work contributes a robust framework for multi-modal learning in the context of smart grid security. The principle of fusing complementary representations could be productively applied to other anomaly detection tasks involving sequential data, such as fraud detection in finance or predictive maintenance in industrial IoT. For immediate future work, we plan to explore adaptive mechanisms for the key MTF parameter (the number of bins Q) and investigate attention-based fusion techniques to dynamically weigh the contributions of the spatial and temporal feature streams. Extending the model to incorporate exogenous variables (e.g., weather, tariff periods) could further improve its contextual understanding and robustness, paving the way for its application in even broader and more dynamic smart grid scenarios.
5. Conclusions
To improve electricity theft detection accuracy in distribution networks, this study proposes a method based on MTF and a hybrid ResNet-LSTM network. First, MTF converts 1D consumption sequences into 2D images to enhance feature representation. Then, the ResNet-LSTM architecture simultaneously extracts spatio-temporal characteristics: ResNet mines deep spatial features from images, while LSTM captures temporal dependencies from the original sequences. Experimental results on a real-world SGCC dataset demonstrated the superiority of the proposed model. It achieved a high detection accuracy of 94.0% and a recall of 96.0%, significantly outperforming key baseline models including GASF-ResNet (87.5% accuracy), RP-ResNet (86.9% accuracy), and the single-modality MTF-ResNet (89.1% accuracy). This validates the effectiveness of the proposed feature enhancement and multi-modal fusion strategy, offering a more efficient and accurate solution for electricity theft detection based on historical consumption data. Future work will focus on optimizing the model structure and parameters to further enhance its robustness and generalization capability, as well as extending its application to broader smart grid scenarios.
Author Contributions
Conceptualization, Y.W. and Z.M.; methodology, J.S. and Z.M.; software, C.Z.; validation, C.Z.; formal analysis, Z.M. and X.S.; investigation, Z.M.; resources, Z.M. and X.S.; data curation, C.Z.; writing—original draft preparation, C.Z.; writing—review and editing, C.Z., Y.W., X.S. and Z.M.; visualization, C.Z.; supervision, J.S., Y.W., X.S. and Z.M.; project administration, J.S., X.S. and Z.M.; funding acquisition, Z.M. All authors have read and agreed to the published version of the manuscript.
Funding
This work was supported by the Key Research and Development Plan Project of Guangxi under Grant AB23026075.
Data Availability Statement
The data presented in this study are openly available in the State Grid Corporation of China at https://github.com/henryRDlab/ElectricityTheftDetection (accessed on 1 June 2025).
Conflicts of Interest
The authors declare no conflict of interest.
References
- Gao, Y.; Foggo, B.; Yu, N. A Physically Inspired Data-Driven Model for Electricity Theft Detection With Smart Meter Data. IEEE Trans. Ind. Inform. 2019, 15, 5076–5088. [Google Scholar] [CrossRef] [Scilit]
- Xiao, Y.; Ye, Z.; Huang, R.; Liu, M.; Xia, R.; Gao, Y. Summary of research on electricity theft behavior detection methods. J. Electr. Power Sci. Technol. 2023, 38, 1–14. [Google Scholar]
- Ahir, R.K.; Chakraborty, B. Pattern-based and context-aware electricity theft detection in smart grid. Sustain. Energy Grids Netw. 2022, 32, 100833. [Google Scholar] [CrossRef] [Scilit]
- Qi, R.; Zheng, J.; Luo, Z.; Li, Q. A novel unsupervised data-driven method for electricity theft detection in AMI using observer meters. IEEE Trans. Instrum. Meas. 2022, 71, 2513010. [Google Scholar] [CrossRef] [Scilit]
- Xia, X.; Lin, J.; Xiao, Y.; Cui, J.; Peng, Y.; Ma, Y. A control-chart-based detector for small-amount electricity theft (SET) attack in smart grids. IEEE Internet Things J. 2021, 9, 6745–6762. [Google Scholar] [CrossRef] [Scilit]
- Fernandes, S.E.; Pereira, D.R.; Ramos, C.C.; Souza, A.N.; Gastaldello, D.S.; Papa, J.P. A probabilistic optimum-path forest classifier for non-technical losses detection. IEEE Trans. Smart Grid 2018, 10, 3226–3235. [Google Scholar] [CrossRef] [Scilit]
- Chen, J.; Guan, Z.; Bai, W.; Liu, J.; Zhao, Y.; Zhou, J.; Xiong, L. Improved DBSCAN-Based Electricity Theft Detection Using Spatiotemporal Fusion Features. Appl. Sci. 2025, 15, 12028. [Google Scholar] [CrossRef] [Scilit]
- Xia, X.F.; Lin, J.; Jia, Q.N.; Wang, X.; Ma, C.; Cui, J.; Liang, W. ETD-ConvLSTM: A Deep Learning Approach for Electricity Theft Detection in Smart Grids. IEEE Trans. Inf. Forensics Secur. 2023, 18, 2553–2568. [Google Scholar] [CrossRef] [Scilit]
- Khan, I.U.; Javeid, N.; Taylor, C.J.; Gamage, K.A.; Ma, X. A stacked machine and deep learning-based approach for analysing electricity theft in smart grids. IEEE Trans. Smart Grid 2021, 13, 1633–1644. [Google Scholar] [CrossRef] [Scilit]
- Liu, K.; Liu, X.; Zhang, P. Identification method of electricity theft based on long short-term memory autoencoder with load peak features. Autom. Electr. Power Syst. 2023, 47, 96–104. [Google Scholar]
- Tsao, Y.C.; Rahmalia, D.; Lu, J.C. Machine-learning techniques for enhancing electricity theft detection considering transformer reliability and supply interruptions. Energy Rep. 2024, 12, 3048–3064. [Google Scholar] [CrossRef] [Scilit]
- Liu, B.; Yuan, L.; Shao, X.; Wang, E.; Xia, Z.; Han, W.; Wu, C. Transformer-Based Generative Adversarial Network for Traffic Forecasting. IEEE Trans. Consum. Electron. 2025, 71, 12288–12299. [Google Scholar] [CrossRef] [Scilit]
- Wu, Z.; Wang, Y. PE-DOCC: A Novel Periodicity-Enhanced Deep One-Class Classification Framework for Electricity Theft Detection. Appl. Sci. 2025, 15, 2193. [Google Scholar] [CrossRef] [Scilit]
- Huang, Q.; Tang, Z.; Weng, X.; He, M.; Liu, F.; Yang, M.; Jin, T. A Novel Electricity Theft Detection Strategy Based on Dual-Time Feature Fusion and Deep Learning Methods. Energies 2024, 17, 275. [Google Scholar] [CrossRef] [Scilit]
- Bai, W.; Xiong, L.; Liao, Y.; Tan, Z.; Wang, J.; Zhang, Z. Detection Method for Three-Phase Electricity Theft Based on Multi-Dimensional Feature Extraction. Sensors 2024, 24, 6057. [Google Scholar] [CrossRef] [Scilit] [PubMed]
- Ahmed, T.; Saeed, M.S.; Masud, M.I.; Arfeen, Z.A.; Baloch, M.; Aman, M.; Shahzad, M. Securing Smart Grids: A Triplet Loss Function Siamese Network-Based Approach for Detecting Electricity Theft in Power Utilities. Energies 2025, 18, 4957. [Google Scholar] [CrossRef] [Scilit]
- Shi, J.; Gao, Y.; Gu, D.; Li, Y.; Chen, K. A novel approach to detect electricity theft based on conv-attentional Transformer Neural Network. Int. J. Electr. Power Energy Syst. 2023, 145, 108642. [Google Scholar] [CrossRef] [Scilit]
- State Grid Corporation of China. [EB/OL] 2018. Available online: https://github.com/henryRDlab/ElectricityTheftDetection (accessed on 1 June 2025).
- Jiang, J.; Guo, M. Fault diagnosis method of rolling bearing based on MTF and DenseNet. J. Mine Autom. 2022, 48, 63–68. [Google Scholar]
- Yueyu, C.; Guofeng, C. A Power Theft Detection Method for Distribution Network Users Based on Hybrid Neural Network. Zhejiang Electr. Power 2023, 42, 96–103. [Google Scholar] [CrossRef]
- Yang, Y.; Dong, Z.; Yao, F.; Shi, G.X.; Sun, R.Y. Fault diagnosis of double bridge parallel excitation power unit based on 1D-CNN-LSTM hybrid neural network model. Power Syst. Technol. 2021, 45, 2025–2032. (In Chinese) [Google Scholar]
- Bae, W.; Yoo, J.; Ye, J.C. Beyond deep residual learning for image restoration: Persistent homology-guided manifold simplification. In Proceedings of the 2017 IEEE Conference on Computer Vision and Pattern Recognition Workshops (CVPRW), Honolulu, HI, USA, 21–26 July 2017; pp. 1141–1149. [Google Scholar]
- Gong, Z.; Zou, Y.; Jin, T.; Liu, Y.; Lan, M.; Liu, Z. A Power Quality Disturbance Classification Method Based on Feature Fusion Parallel Optimization Model. Proc. CSEE 2023, 43, 1017–1027. [Google Scholar] [CrossRef]
- Zhao, Y.; Bai, W.; Lei, J.; Wang, Z.; Yang, Y.; Jiang, Z.; Xiong, L. An Electricity Theft Identification Method Based on MTF Dimension Enhancement and Residual Network. Adv. Technol. Electr. Eng. Energy 2024, 43, 78–86. [Google Scholar]
- Zhou, G.; Hua, J.; Li, M.; Fu, J.; Huang, L. An Electricity Theft Detection Method Based on Graph Transformation and Hybrid Convolutional Neural Network. Autom. Electr. Power Syst. 2022, 46, 78–86. [Google Scholar]
- Gao, A.; Zheng, J.; Mei, F.; Sha, H.; Qiu, X.; Xie, Y.; Li, X.; Guo, M.; Li, D. Electricity theft detection algorithm based on triplet network. Proc. CSEE 2022, 42, 3975–3986. [Google Scholar]

Disclaimer/Publisher’s Note: The statements, opinions and data contained in all publications are solely those of the individual author(s) and contributor(s) and not of MDPI and/or the editor(s). MDPI and/or the editor(s) disclaim responsibility for any injury to people or property resulting from any ideas, methods, instructions or products referred to in the content. |
© 2026 by the authors. Licensee MDPI, Basel, Switzerland. This article is an open access article distributed under the terms and conditions of the Creative Commons Attribution (CC BY) license.