


Abstract
Massive Open Online Courses (MOOCs) have emerged as a popular choice for learners as accessible and flexible education across the globe. Micro -are short skill-focused certifications offered within MOOCs to online learners. The interplay between multiple stakeholders, including universities, MOOCs providers, policy makers and industrial leaders, plays a decisive role in MOOC adoption. This study employed Educational Data Mining techniques to extract patterns in learner behavior, course design, institutional collaboration, etc., from the determinants of adoption and completion of the micro-credentials within MOOCs. The determinants were extracted from major online MOOCs databases, whereas additional parameters not captured in these databases were collected through an online survey from learners, industry professionals, and higher education institutions. A data mining-based framework is proposed to support stakeholders in planning effective course offerings, guiding learners in selecting suitable courses and helping MOOCs providers to align course credentials with market demands. Classification and predictive analysis revealed that course-related attributes, such as course certification type, course organization, course rating, course difficulty level, and whether the course was free or paid, play decisive roles in determining MOOC adoption. The decision tree classifier, based on the information gain and Gini index, ranked these attributes by order of preference with high accuracy, whereas regression analysis predicted multiple independent variables yielding good performance, as reflected in the confusion matrix.
1. Introduction
The popularity of Massive Open Online Courses (MOOCs) has been steadily increasing. MOOCs have positively transformed education by providing flexible learning opportunities for students. Learners from various countries enroll in these courses, access the materials and attend online examinations [1]. The students register for a program of their preference offered by the leading universities and institutes globally. MOOCs allow learners to structure their courses and progress according to their goals and learning skills. It offers organized access to course content, quizzes, and assignments. Students can complete their courses at their own pace, reaching educational goals through self-assessment. These online courses integrate the most recent social networking trends and student collaboration into the course offerings, facilitating collaboration among leading field practitioners for a more innovative learning experience.
The growth of MOOCs in recent years is widely associated with a rising trend among students to adopt micro-credentials [2]. Micro-credentials (MCs) are short and focused skill-based programs offered in particular areas of expertise. Various organizations, including educational institutions, deliver micro-credential programs via online platforms to attain defined learning outcomes. MCs typically certify the learners with a digital badge, which may assist in job searching and career progression. Some platforms, such as Coursera and Saylor Academy, offer complimentary MCs to students from underprivileged backgrounds [3].
All MOOC platforms now offer at least one type of micro-credential, with some offering as many as three different types, namely Digital Badges, Certifications and Nano Degrees [4]. The top online learning platforms, such as Coursera, edX, and Future-Learn, have partnered with top universities and industrial leaders to offer micro-credentials in high-demand areas such as artificial intelligence, digital marketing, big data, and data science, to name a few. Unlike traditional degrees which require completion in a specific duration under certain credit limits, micro-credential programs offer learners greater flexibility in completion times and course recognition/accreditation modes. Examples include the Master-Track course on Coursera and Micro-Masters on edX [5]. These flexibilities allow industry leaders to obtain proficiency in highly sought-after skills through MCs.
Many researchers utilize the Unified Theory of Acceptance and Use of Technology (UTAUT) model with other theoretical models such as TTF in exploring MOOC adoption in higher education [6].
Extended UTAUT-based MOOC adoption models also incorporate psychological, social, organizational, pedagogical, and behavioral attributes to better explain learners’ intentions and behaviors [7]. Several studies have combined the three major predictors (perceived usefulness (PU), perceived ease of use (PEU), and self-efficacy (SE)) from the UTAUT with external predictors such as user characteristics, which includes Demographics (DMs), Course-specific factors (CFs), and Credibility (CR), particularly in the context of MOOCs and online learning adoption.
Data mining is a domain useful in extracting meaningful and predictive information from larger databases and repositories. It employs machine learning techniques, algorithms, and mathematical and statistical models to discover patterns and correlations from the databases. The process of data mining consists of data collection, cleaning, transformation, visualization and the interpretation of results to fulfil these objectives [8]. The outcome of this process is knowledge, which is mined from data through classification, clustering and regression analysis [9,10,11,12]. Educational Data Mining (EDM) is a sub-domain of data mining targeted to discover patterns and relationships from educational data. In EDM, data mining algorithms are applied to the data obtained from educational processes in order to analyze learning behaviors, educational outcomes, etc. [13]. In the extant literature, EDM is applied to various learning datasets to analyze students’ learning interests, attendance records, course catalogs, portals and student’s interaction with online learning platforms. Clustering and other classification techniques are commonly used to personalize students’ learning experiences and propose overall curriculum improvement tailored to different learning needs. The processes related to MCs are still evolving and EDM techniques are expected to characterize future online educational systems [14].
Although existing research provides valuable insights into the adoption of MCs, most of the studies are primarily theoretical in nature. Many studies focus on single influences, such as analyzing student dropout rates based on course-related attributes. Many studies that consider multiple factors, such as demographics, technological, and course-related attributes to analyze the adoption of MOOCs, are based on theoretical and conceptual frameworks.
In contrast, the authors propose an Educational Data Mining (EDM) framework that empirically integrates all learner-centric factors. This study derives all the learner-centric factors based on theoretical models and their extended constructs, thereby covering the key aspects of MOOC adoption. The framework combines publicly available MOOC datasets with survey-based learner data specifically collected to capture technological, psychological, behavior and pedagogical factors derived from theoretical and conceptual frameworks. By applying machine learning techniques, the proposed approach enables the discovery of hierarchical and non-linear relationships among factors, providing data-driven insights into how these variables collectively influence student satisfaction and MOOC adoption.
MCs are typically offered through the collaborative effort of multiple stakeholders, i.e., learners, higher education institutions, government bodies, and industrial partners. The sustainability of a well-coordinated interplay among these primary stakeholders determines the sustainability of an MC. Although the present study aims to create a learner-centric framework, the application will not be limited to the group, rather it contributes to institutional innovation by enabling higher education institutions to transition from traditional degree-centric models toward flexible micro-credential ecosystems with curriculum planning according to learner demand, industry skill gap, accessibility and market needs. The other stakeholders, such as government bodies and industrial partners, will also benefit from the insights provided by this proposed framework. For example, for learners, the course-related influencing factors help identify which courses and domains are currently in demand, enabling informed enrollment decisions based on emerging trends. For course providers, the demographic and course-related factors reveal enrollment patterns, allowing them to identify high-demand courses and expand offerings accordingly. If learners show a higher preference for certified courses, providers can increase the availability of certification-based offerings. These insights will also guide course design decisions, such as adjusting difficulty level, structure, or certification format. From a policy-making perspective, the EDM-derived course-related factors offer empirical evidence to support strategic decisions. For instance, if features such as credit transferability or formal certification emerge as significant predictors of adoption, policymakers can consider enabling credit transfer mechanisms or expanding recognized certification pathways to support future learners.
2. Related Work
Massive open online courses (MOOCs) have significantly transformed the global education landscape and are characterized by their online delivery, large enrollments, and open access [15]. Traditional degree programs often fall short in demonstrating specializations and competencies sought by employers. MOOCs help to bridge the digital divide and promote educational equity across the world. Micro-credential programs within MOOCs enable learners to acquire additional skills and knowledge, enhancing their employability and career prospects [16]. Many famous online learning platforms such as Coursera and EDX allow learners to register for a free online course, offering self-paced and self-regulated learning opportunities. In recent years, the world has witnessed substantial transformations marked by a surge in online learning platforms driven by the growing focus on lifelong learning and the need for continuous skill development [17]. The rising adoption and recognition of MCs within MOOCs presents an opportunity to analyze their underlying dynamics. Data mining, with all its capabilities, can deliver advanced insights that guide academic managers to design study programs that are more learner-focused and aligned with market demands [18]. EDM is used to identify patterns and trends from the educational data, determine students’ behavior and trends and improve the academic curriculum, teaching, and assessment methods [19]. EDM algorithms require well-designed databases for the systematic application of its algorithms.
MCs within MOOCs offer flexible learning options, allowing access to the course contents anytime, anywhere in the world. MCs also enable learners to track the progress of the course and earn digital badges upon course completion [19].
MOOCs are also constrained by a lack of standardization, making course quality assessment difficult. Low completion rates of MOOCs stem from limited interaction with instructors/peers and reduced accountability. All the stakeholders concerned must be involved to ensure that the MCs are aligned with learners’ need [20]. Although EDM helps predict learner behavior in existing studies, their applications in MOOCs are often confined to one dimension. Some researchers have identified perceived usefulness and performance expectancy [21,22,23] as key factors positively associated with MOOC adoption. In [24], interviews with HEIs, learners, and administrators were conducted, revealing that the learners adopt MOOCs because they found digital credentials to be of long-term value and helpful for employment. Students believe that these credentials provide them with broader competencies and skills. In [25], Expectancy–Value Theory (EVT) is used to analyze the importance of digital credentials by evaluating the perceptions of value and ability beliefs. This framework outlined both enabling and inhibiting factors in credential adoption. Learners are more inclined to value digital credentials’ portability, allowing them to demonstrate their competencies in various contexts. In [26], a framework was proposed to identify the factors influencing students’ adoption, completion, and continuance of MOOCs. The framework investigated how technological features, user characteristics, and attributes of MOOCs impact students’ intentions at different stages. Stepwise regression analysis was applied to predict environmental factors that drive the initial adoption of MOOCs. The findings suggested that course quality influences its completion and continued use. High-quality instructional designs and relevant content enhance learner satisfaction and retention. Based on the above, it is evident that MOOCs providers should focus on enhancing technological characteristics, user engagement, and the overall quality of the courses. By doing so, they can better support students throughout their learning journey and improve retention rates.
MCs offer numerous benefits to learners, including just-in-time, specific, and practical knowledge, as well as hands-on learning experience. They allow skills updates, professional recycling, and continuous upskilling [27]. According to an EU report, the learners are more attracted to the MCs that last less than 3 months. Part-time courses typically require six to fifteen hours per week, along with real-time interaction with the instructor, which is lengthy and hard to commit to. In [28], personal interests and career objectives were found to be the key drivers in adopting MCs because they enable acquiring specializations in comparatively short time frames than traditional education. According to [29], cost, facilitating conditions, and effort expectancy were the most significant factors in the adoption of MOOCs. A lack of social interaction, poor internet facilities, and unavailability of online instructors were identified as MOOC adoption influencing factors.
The relevance of micro-credentials for modular learning in higher education was investigated in [30]. The study found that MCs were flexible for learners in choosing the right skill for the right job. The study emphasized the importance of collaboration among learners, educational institutions, providers, and employers, which ensures clear articulation of the course content and learning outcomes for proper recognition. Such collaboration adds value to enhance workforce adaptability. A new development in MOOCs was highlighted in [31], which facilitates learners to transfer MC credits to the degrees offered by many distinguished universities. HEIs through this development get a chance to directly align their education with market needs.
In [32], clustering and association rule mining were used on the MOOC server log to find the learner dropout rate. The analysis revealed that student–teacher interactions and the unavailability of personalized learning are major contributors to student dropout. Another EDM approach based on clustering and decision trees, presented in [33], identified factors contributing to the success rate of students following MOOCs. The study mined the behavioral patterns of students toward online courses. In [34], six machine learning techniques were applied in a multi-class model to predict students’ grades. The presented model was capable of handling imbalanced datasets. In [35], a method based on the demographic information of a learner was used to find the dropout rate. The method was applied for age, gender, the number of absences, and the time duration of class attended to predict the dropout rate. The technique was reported to outperform naive Bayes, logistic regression, and support vector machine. The approach in [36] aimed to predict students’ performance in virtual courses using demographics, GPA, and family background. The study also identified key factors influencing student learning behavior. A Behavior–Emotion Topic Model (BETM) [37] was proposed to address learners’ dropout rates. BETM analyzed discourse behaviors and content variations in virtual course completers and non-completers, showing that completers actively share course-related insights. In [19], EDM techniques using five machine learning algorithms, including Decision Tree Analysis and Outcome Voting Technique, were used to analyze student performance. The role of internal assessments is discussed in the study in predicting academic success and providing insights for educational stakeholders. Different institutions used EDM techniques for predictive analysis to monitor the progress of students and identified struggling students. High-risk students were also identified based on their attendance, performance in terms of GPA and demographic information. A course recommender system was proposed in [38] to predict potential recruiters in a course based on their academic background and prerequisite restrictions, for which machine learning models are developed to predict students’ performance based on demographic information and academic background.
Theoretical and conceptual frameworks have been developed that help to investigate adoption, acceptance and the continued use of educational technologies, including MOOCs and micro-credentials. The popular models that explain the user’s behavior and intentions towards technology are the Unified Theory of Acceptance and Use of Technology (UTAUT) [39], the Technology Acceptance Model (TAM) [40], the Theory of Planned Behavior (TPB) [41], and the Expectancy–Value Theory (EVT) [25]. The core constructs of these models are utilized by prior studies to investigate the adoption and engagement of students towards MOOCs. These core constructs include perceived usefulness, performance expectancy, effort expectancy and facilitating conditions, etc. In addition to the core constructs of the above-mentioned theories, many researchers introduced external factors and integrated them with the core constructs. References [26,42] developed a research model by using TAM as foundation theoretical models and integrated several external factors such as self-regulation, computer self-efficacy, learning tradition and perceived convenience to investigate MOOC adoption by students. Similarly, [21,23,26] presented the following factors as important in the adoption of MOOCS: Self-Regulation, Performance-to-Cost Value, Perceived Usefulness, Accessibility, and Social Influence. Reference [43] used the TAM constructs with the diffusion of other variables such as complexity, portability, etc. Reference [44] used the TAM constructs with external factors such as additional external variables (e.g., course relevance and content quality). Similarly, many researchers integrated the UTAUT model constructs with external variables such as self-efficacy, attitude toward technology, behavioral intention, Performance-to-Cost ratio and portability [20,45,46,47,48]. A detailed overview of the reviewed literature and the theoretical coverage of the factors is listed in Table 1.
Table 1.
Overview of the reviewed literature and the theoretical coverage of factors.
As summarized in Table 1, a total of 52 articles was reviewed, most of which were published between 2018 and 2025. More than half of these peer-reviewed articles used theoretical models such as TAM and UTAUT as a foundation of their studies for MOOC adoption and engagement towards MOOCs. Moreover, a few of them extended these theoretical models with the integration of external learner-centric factors. This corpus of information illustrates that MOOC adoption has been investigated through theoretically grounded perspectives. The present study aimed to conduct a study inclusive of all the constructions supported by multiple theoretical and empirical studies and found their presence in the publicly available datasets.
Researchers have addressed issues in MOOCs by applying different EDM techniques to students’ academic data. These techniques, such as clustering, classification and association rules mining, are used to get requisite insights over learners’ engagement patterns, drop-out rates, demographics patterns, accessibility, areas, subjects of education, technology availability, and inter-accessibility. A significant gap still exists in the integration of factors in EDM models to collectively analyze learner’s participation and technological, psychological, behavioral, social and pedagogical factors that will further unveil the non-trivial patterns towards the adoption of MOOCs. This study explicitly addresses this gap through a two-stage data integration and analysis strategy. First, publicly available MOOC datasets were examined to capture observable course-related attributes, such as course domain, certification type, course organization, rating and difficulty level. However, these datasets were found to be limited in representing technological and learner-centric factors, which are frequently emphasized in the literature but are not directly available in platform-level data. To address this limitation, based on an extensive review of existing studies, a comprehensive questionnaire was designed, specifically targeting the learner-related factors identified in the literature, including self-regulation, self-study management, perceived usefulness, productivity gain, and learning motivation, as well as technological access factors. By applying classification models to these datasets, this study simultaneously evaluates the relative influence of all these factors on MOOCs and micro-credential adoption.
3. Problem Definition
Consider a database (DB) comprising three schemas S1, S2, and S3. S1 is used to represent a set of micro-credential (MC) parameters P (P1, P2, P3,…, Pm) that influence the adoption of MCs in MOOCs. These parameters were selected from databases named Hvd_DS, CeRa_DS, and LearnO_DS. In S1, Pk is the class attribute that represents the value of adoption of MCs in MOOCs. Pk denotes the total number of enrolments in an MC, which appears under different names in different relations to S1.
S2 is a bibliographical reference schema consisting of the parameters Q (Q1, Q2, Q3,…, Qm), which influences the adoption of MCs in MOOCs. The class attribute in this schema is represented by Qk and is cited in the bibliography of multiple conclusive research studies.
S3 was developed by collecting responses from multiple respondents to the survey questions, which were designed using Pi and Qi selected from S1 and S2, respectively. The responses of the survey are stored in R (R1, R2, R3,…, Rm) with the class attribute Rk. The said parameters formed a new database named Student_RS.
A few fundamental relations between P, Q and R are given below:
This study formulates the problems from the above from multi-dimensional perspectives. These perspectives are formulated in the hypotheses listed as Ɵ-1 to Ɵ-4 below.
where is the entropy of the dataset computed through Equation (6) and is the proportion of instances in relative to S1.
where is the proportion of instances in S1 belonging to class i.
is computed using Equation (10).
where k is the number of classes and is the proportion of instances in class i in S1.
where is the dependent variable, X is the independent variable, is the intercept, is the slope and represents error.
Hypothesis Ɵ-1:
The parameters within P, Q and R are to be selected and graded based on the values of information gain [2,3] and the Gini index [2,3] of the parameters in relation to the class attributes Pk, Qk and Rk, respectively. The outcome of Ɵ-1 is to determine the gradation of parameters based on their impact on MC adoption. The equation to calculate information gain and the Gini index are given in Equations (3)–(6) and Equations (7)–(10).
Hypothesis Ɵ-2:
Based on the values of information gain and Gini index, a CART decision tree of S1, S2 and S3 is to be drawn for the classification of future test instances using Equations (3)–(9). This decision tree will run its training model on P, Q and R and take test instances through user prompts. The iterations of CART target minimization for the Mean Squared Error (MSE) are given in Equation (11).
Hypothesis Ɵ-3:
The predictor lines α1, α2 and α3 based on Pk, Qk and Rk are to be regressed using linear, multiple and logistic regressions. The mathematical formulations for these regression models are given in Equations (12)–(14), respectively.
The mathematical formulation used in Equations (12)–(14) will be used to build predictors for Qk and Rk.
Equation (12) applies linear regression for the continuous predictors and . Equation (13) extends this to multiple predictors, whereas Equation (14) uses logistic regression because represents a categorical or probabilistic outcome.
where pi and pj are the individual attributes of P and represents the mean value.
Hypothesis Ɵ-4:
The correlation matrix of the parameters P, Q and R are to be designed to find the covarying metrics and the extent of covariance in the adoption of MOOCs. The class attributes Pk, Qk, and Rk are eliminated from S1, S2 and S3, respectively, to find correlations among other parameters using Equation (15).
4. Proposed Methodology
The evolution of MCs and MOOCs presented new challenges in their adoption across diverse learners, platforms, regions, institutions, and educational sectors. This necessitates a comprehensive analysis of factors related to learners, computing courses, platform providers, and Higher Education Institutions (HEIs). Educational data mining enables leveraging vast data and provides an opportunity to extract valuable insights, patterns, and relationships among MOOCs variables. In this study, an Educational Data Mining (EDM) framework is proposed, which first identified the key parameters influencing MOOC adoption and then a comprehensive predictive model was developed. This model is capable of analyzing vast amounts of learner data extracting patterns in MOOC adoption, thereby guiding learners, policymakers and course designers.
Key parameters that influence MOOC adoption were identified through a comprehensive literature survey, coupled with data analysis of publicly available data sets. Four datasets were obtained, each comprising multiple attributes related to the learner’s enrolment in different courses offered across various platforms. The data obtained from two open datasets were stored in schema S1 and S2 of the shared integrated database (DB). Data on a few identified parameters was unavailable; therefore, an online survey form (Google Form, available at https://forms.gle/D1VN3NU6sscdf95D9, accessed on 4 February 2026) was designed and distributed to a selected group of respondents. EDM techniques were then applied to find correlations, dependencies, and predictive relationships among these parameters. After organizing the data in the database, the following steps were performed:
- The parameters stored in the database were carefully selected and ranked based on their respective Information Gain and Gini Index values [49,50], as calculated using Equations (7) and (8), ensuring that the most informative and discriminative features were prioritized.
- A CART (Classification and Regression Tree) decision tree classifier [50] was developed for each schema to effectively classify both existing and future instances, based on the class attribute “Number of Total Enrollments”.
- A similar CART decision tree classifier was developed for schema S3 to effectively classify both existing and future instances based on the class attribute “Number of Total Enrollments”.
- Both linear and logistic prediction models were developed for all given schemas to forecast future enrollments and the level of satisfaction, utilizing the existing parameter values using Equations (12)–(14). Multiple Linear regression was employed to quantify the influence of continuous variables, offering consistent metrics to estimate outcomes such as the likelihood of course adoption or completion rates based on new input parameters.
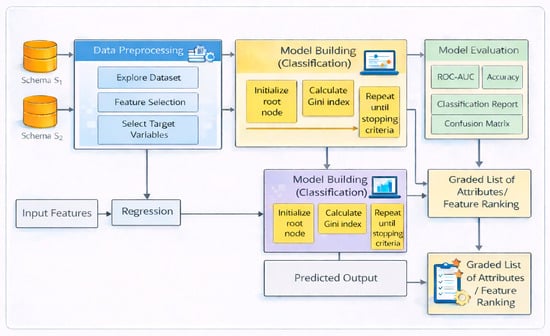
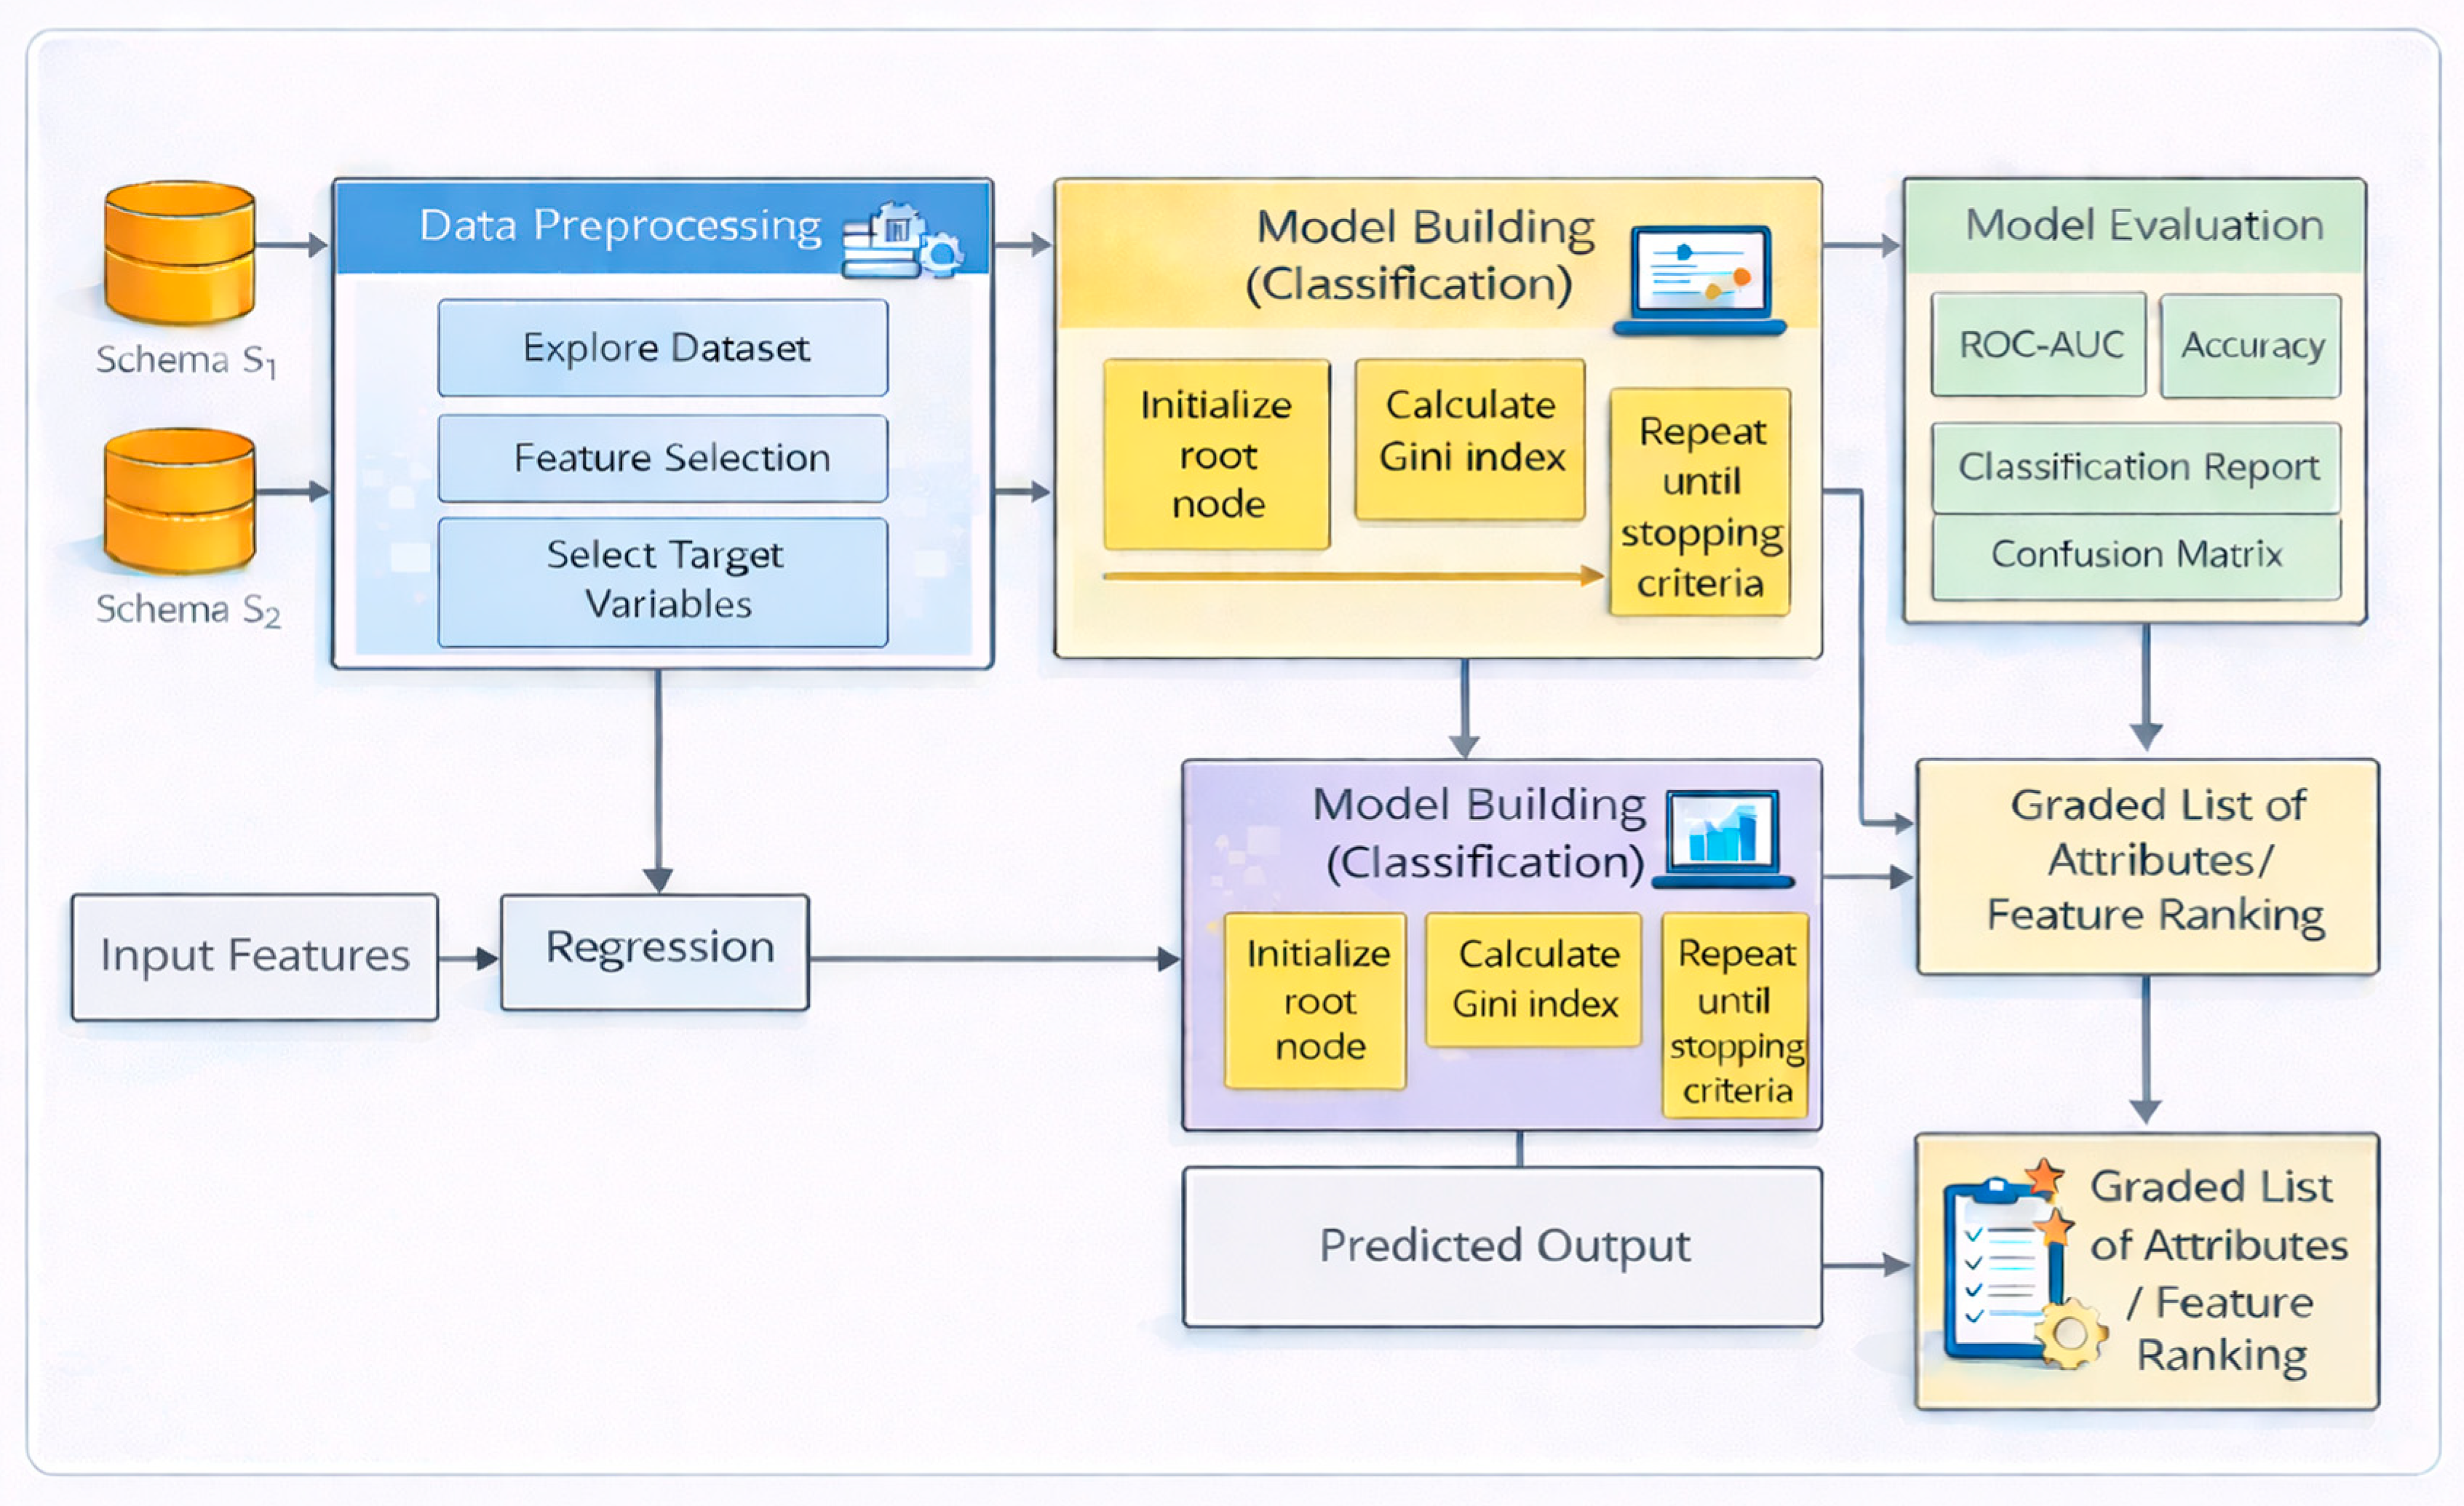
The EDM framework proposed in this study was divided into four major parts: Data preprocessing, Feature Engineering, Model Building (Classification) and Multiple Regression.
The model proposed in this study is depicted in Figure 1.
Figure 1.
Proposed EDM Framework.
In Figure 1, the process started with the elicitation of relevant datasets, and the data was obtained from leading MOOCs platforms, such as EDX, Coursera, and FutureLearn. The data related to these platforms was obtained from Kaggle (https://www.kaggle.com/), GitHub (https://github.com/) and OULAD (https://www.kaggle.com/datasets/anlgrbz/student-demographics-online-education-dataoulad, accessed on 1 January 2026) Repository and was preprocessed, reduced, and systematically organized into three distinct datasets, designated as Hvd_DS, CeRa_DS and LearnO_DS. A detailed literature review was conducted for the theoretical coverage of all factors supported by multiple theoretical and empirical studies and their association with the adoption of MOOCs. This study uses all the constructs from these three models, i.e., UTAUT, TAM, and EVT, in addition to the external factors used by various studies. All the aspects of a learner’s thought process, such as motivational, behavioral, social, and self-regulatory constructs, were extracted from the literature. These theoretical grounded constructs were compared with the variables in the datasets. The comparison revealed that all the constructs derived from the theoretical models were explicitly absent in the publicly available datasets.
The factors uncovered during the literature review but not included in Hvd_DS, CeRa_DS and LearnO_DS included Perceived usefulness, Self-Regulation, Performance-to-Cost, Accessibility, Transfer of Credits, Industrial Collaboration, etc., which were collected through online survey forms designed as a part of this study. The survey form consisted of thirty-six questions based on the learner’s motivation for adopting online courses. The survey asked the respondents about the demographics, motivation, learning experiences, challenges, and perceptions of MOOC effectiveness using a Likert scale [51] and multiple choice questions. A detailed list of the factors used in the current study are listed in Table 2.
Table 2.
A summary of the constructs used in MOOC adoption research.
The survey form was distributed among different age group individuals to obtain diverse responses. After eliminating the erroneous/incomplete entries from the survey responses, 175 valid responses were stored in S3 and were developed as a relational schema.
In order to make the datasets consistent and compatible with machine learning models, data preprocessing was performed for both databases S1 and S2 using one-hot encoding, mapping categorical labels to numerical values and using imputation for missing values. This type of encoding was applied to multiple columns in the datasets. For example, in the database CeRa_DS for the parameter P7 (course_students_enrolled), the original value was a string object (e.g., ‘5.3k’, ‘130k’). The variable was encoded and converted into categorical labels as “Low”, “Medium”, “High”, and “Very High” and was divided into four ranges of values: 1500.00–19,000.00, 19,000.00–52,000.00, 52,000.00–130,000.00, and 130,000.00–3,200,000.00, respectively. Entries for P7 (course_students_enrolled) in the range 1500.00–19,000.00 comprise the numeric values within 19,000.00, making it understandable for the machine learning model.
For CeRa_DS, the target variable (course_students_enrolled) was discretized into four quantile-based classes (Low, Medium, High, and Very High), resulting in an approximately balanced class distribution (each class representing ~24–26% of instances). We have not applied any explicit imbalance-handling techniques, such as cost-sensitive learning or resampling, as they can yield meaningful benefits but could also introduce artificial bias.
The schema S2 comprised of data collected through survey responses and the dataset was designated as Student_RS. Due to scarcity of the data collected through the survey forms, imputation was needed to convert the dataset into a meaningful resource for model building. K-Nearest Neighbours (K-NN) was used to estimate missing values and impute neighbors based on their proximity in the feature space.
In feature selection, Information Gain (IG) and the Gini Index were employed as statistical measures to assess the value of influence of each variable. Information Gain (Equations (3)–(5)) quantifies how much uncertainty was reduced when a given attribute, such as perceived usefulness, course difficulty, self-regulation, etc., was used to segment the data. In parallel, the Gini Index (Equations (7)–(9)) helped measure the degree of impurity of the dataset and provided a complementary perspective on attribute relevance.
In order to regularize the compatibility of the available data for machine learning models, one-hot encoding concept, developed by [52], was used. One-hot encoding is applied to all the nominal and ordinal categorical predictors across the dataset. For example, the parameter ‘Device Type’ from the dataset Hvd_DS was further divided into two categories, ‘Laptop’ and ‘Mobile’, and one-hot encoding was applied to each category, converting it into a new distinct feature with a binary value (0 or 1). This transformation helps a machine learning model to efficiently interpret and analyze the data types and avoid the artificial ordinal relationships that arise from simple integer encoding. Generalization of the datasets is performed by mapping the text attributes to categorical values and discretization of the continuous numeric data into distinct bins and ordinal categories. The target variables were transformed into categorical classes suitable for classification tasks. After this, the most informative features are identified.
A total of 70 parameters were preprocessed from schemas S1 and S2 for model building. Including all parameters in one table would reduce readability, so they were grouped into relevant categories for ease of understanding and are presented in Table 3.
Table 3.
The categorized parameters used for model building.
The dataset was split into two parts—train and test—to evaluate the efficacy of the model. A total of 75% of the data was used to train the model and 25% was later used for testing the model. The Classification and Regression Tree (CART) algorithm was applied to the map and the parameters were positioned on a hierarchical tree in order of their influence. Compared to other decision tree methods, the CART decision tree effectively handles non-linear and complex datasets that include both numeric and categorical data. Furthermore, CART decision trees are mostly intuitive and easy to visualize, making it easier to comprehend the data and decisions. Each internal node in the tree represents a split based on an influential feature calculated using the Gini Index, and the terminal nodes represent the likelihoods or outcomes related to MOOC adoption. This visualization made the relationships between variables more interpretable and highlighted how influencing attributes, such as course certification type, course rating, self- regulation, and course provider/offering organization can participate in decision pathways that ultimately influence both the “number of enrollments” and the “level of satisfaction”. The predictive performance of the trained models was then evaluated using a suite of standard classification metrics. These include overall accuracy, precision, recall, F1-score per class, and the Area Under the ROC Curve (AUC), to name a few. This helped to assess the model’s effectiveness in predicting the defined educational outcomes.
After identifying the variables with significant importance using the decision tree classification model, a multiple regression model was employed to explore the influence of the predictors on a continuous outcome variable. The model was employed on all the datasets of schemas S1 and S2, with distinct class attributes and target variables. This model was beneficial in predicting continuous variables, such as the number of learners enrolled in MOOCs, which is critical to ascertain the student behavioral responses that may be non-linear. Using a multiple linear regression model, we were able to measure the strength and direction of influence of independent variables such as Course rating, Course study hours, Course certification, and some demographic factors such as age, towards the adoption of MOOCs.
Overall, the combined use of the Gini Index, CART and multiple regression models provided a comprehensive EDM framework capable of interpreting and predicting educational outcomes. This multi-layered approach ensures a balance between model accuracy, interpretability, and actionable educational insight.
5. Experimentation, Results and Analysis
The Decision Tree Classifier was used and implemented using the Scikit-learn library in Python (https://www.python.org/). The model was trained on the following parameters to prevent the problem of over- and under-fitting. “GINI” selected the most important features for the splitting. The tuned hyperparameters of the four datasets are presented in Table 4:
Table 4.
Optimal hyperparameters for model building.
Due to the extremely small dataset of the Hvd_DS, Leave-One-Out Cross-Validation (LOOCV) was primarily used for more robust performance evaluation, effectively training on 29 instances and testing on one for each fold. In each fold of LOOCV, a decision tree was trained with max_depth = 3 and min_samples_leaf = 2, as depicted in Table 4.
In the other three datasets, the min_samples_leaf was set to five to ensure that each leaf node contained at least five samples for further processing. This may lead to generalization and prevents the tree from creating excessively strict rules based on a small subset of the training data, which might be an oversight. Overall, these hyperparameter settings were aimed at striking a good balance between model accuracy and generalization.
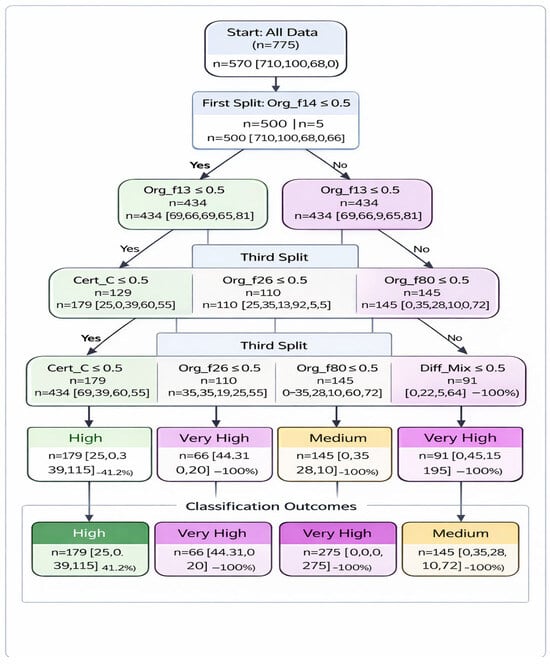
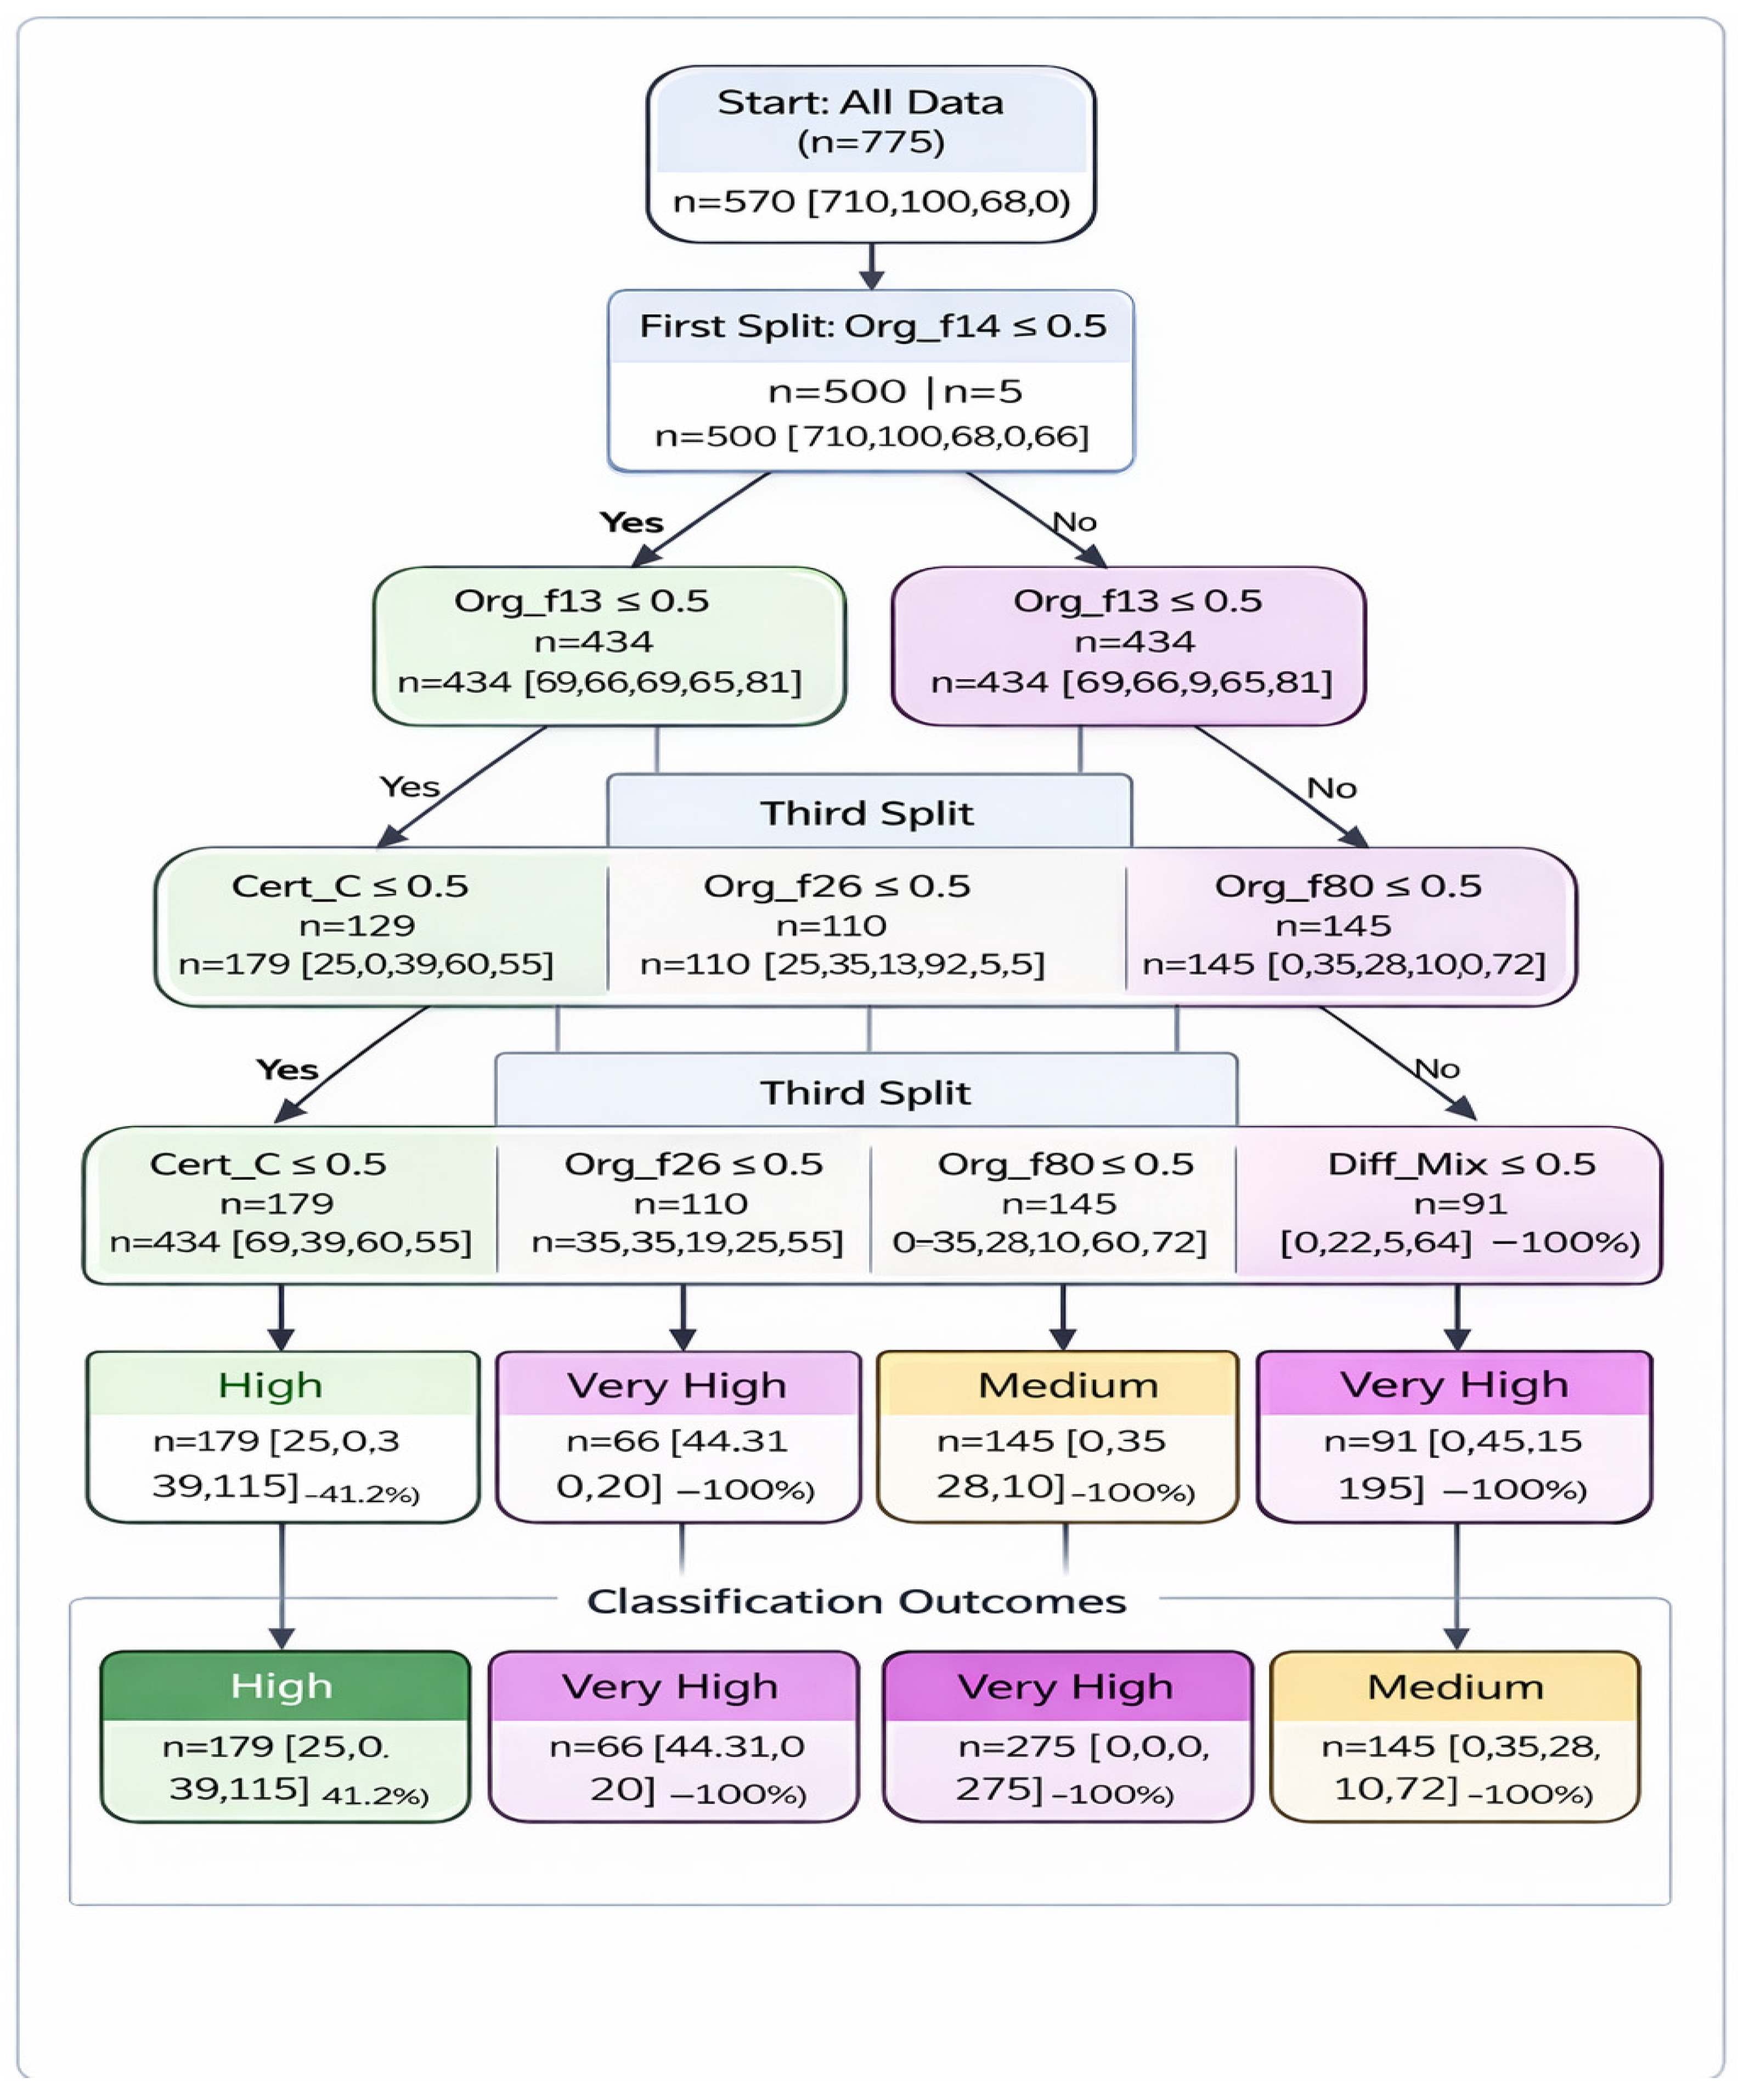
The visual depiction of the decision tree using the “GINI index” as a splitting criterion for the CeRa_DS dataset is shown in Figure 2. The hierarchical representation shows the influence of different attributes on the student’s course enrollment. The root node with the attribute course organization is the most significant factor affecting students’ enrollment, as indicated by the pure node (Gini = 0). At the root node, organizational factor Org_f14 (Organization_Name) was identified as the most influential predictor of enrollment levels. Courses offered by the Org_f14 (Organization_Name) show a high number of enrollments, detailing the significance of organizational credibility. At the next two splits of the Org_f13 (Organization_Name), certification-related attributes (Cert_C) and course ratings emerged as decisive variables. Courses offered with certifications and courses offering recognized certifications and high ratings “Rate” (Rating) are in High and Very High enrollments, indicating that both these factors help to increase learner registrations. Interestingly, a high course rating alone is sufficient to achieve very high enrollments despite being delivered by a less dominant organization (Org_f14 > 0.5), indicating that learner satisfaction is based mainly on course quality. At lower levels, courses offered with a lower difficulty level and higher ratings also exhibit higher enrollments. Overall, decision tree shows that the “Organization” offering a certain course is the most dominant determinant, followed by the course rating and certification.
Figure 2.
Decision Tree Classification for CeRa_DS, Uncovering Key Predictive Features.
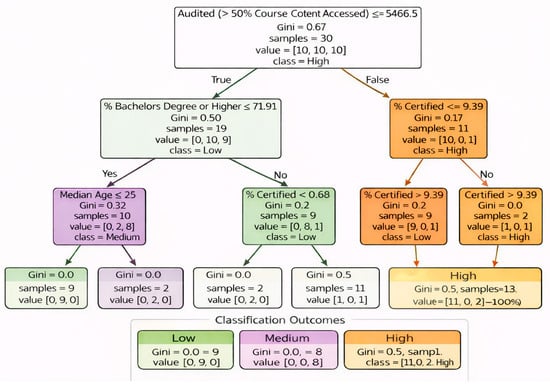
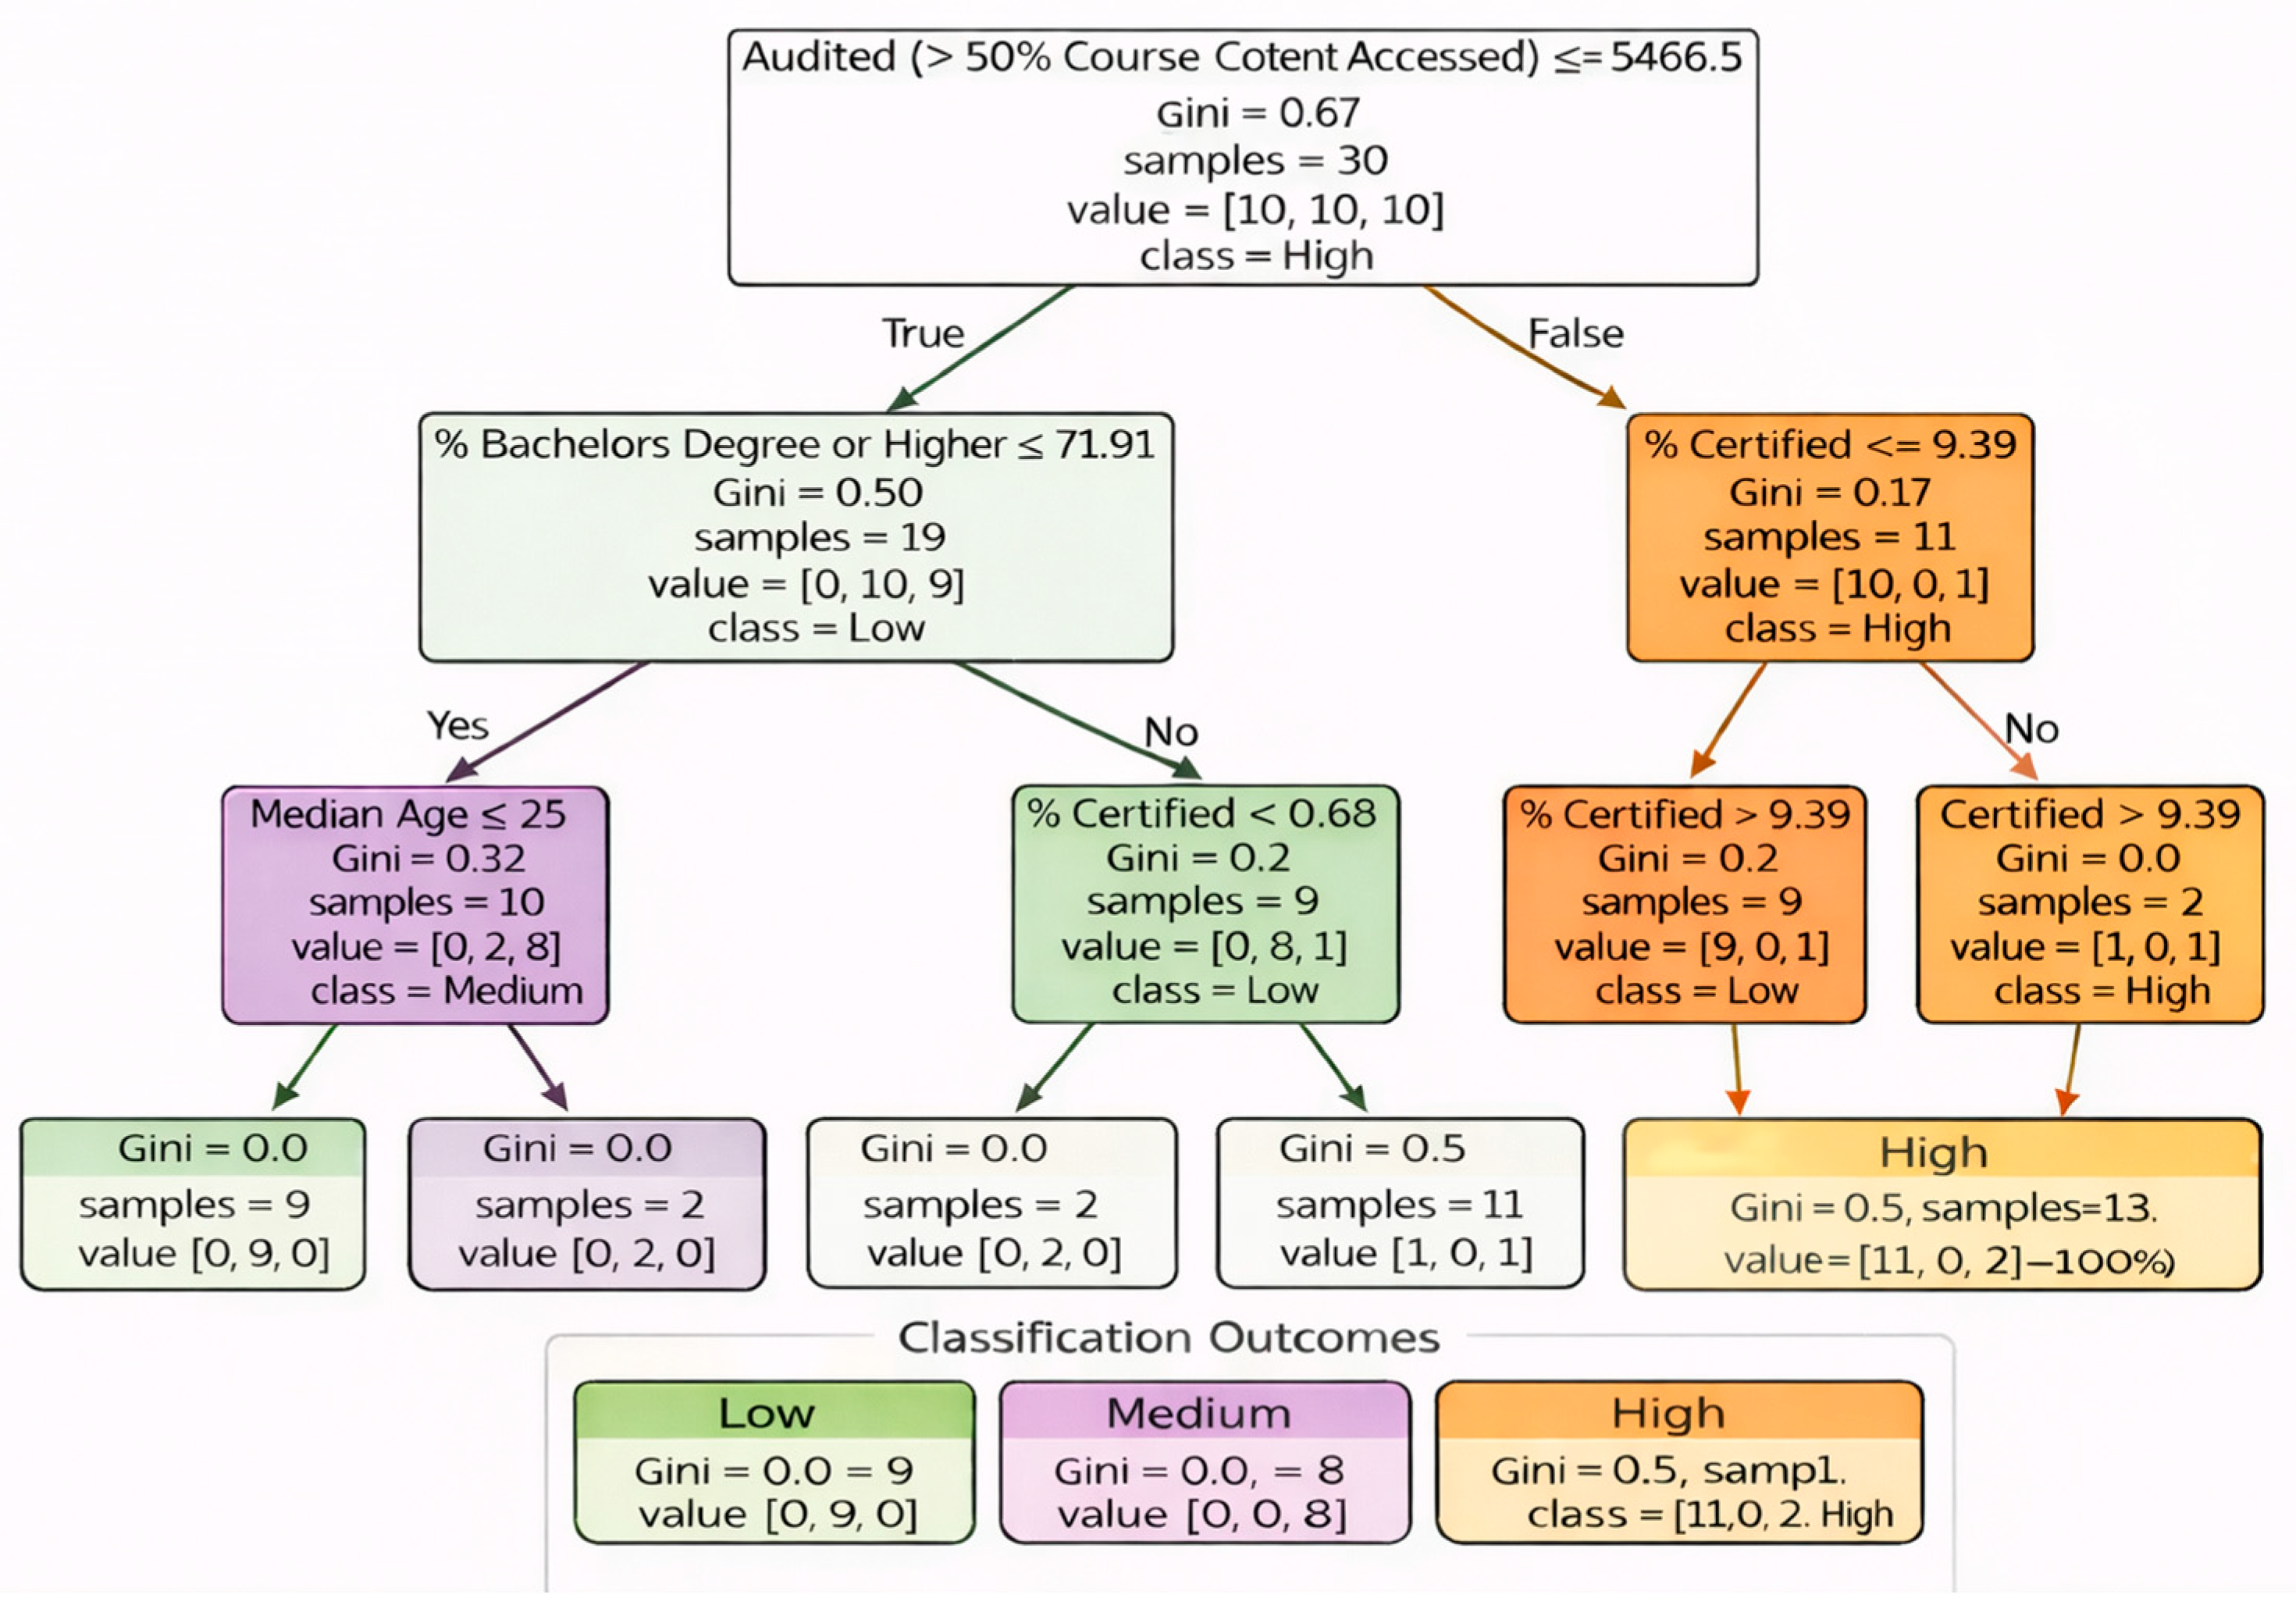
The decision tree of the Hvd_DS shown in Figure 3 has placed “Audited” at the root node to rank it as the most decisive factor to classify the target variable. The certification of the course is the most influential parameter, as indicated by the pure node (Gini = 0). The right branch indicates that active course engagement, combined with certification-related attributes, strongly drives adoption. The students having bachelors and higher degrees are more likely to enroll in a course, because this node has high Gini impurity (0.499), further giving a mixed distribution of classes. “Median Age_25” divided the data on the left side of the split, with a highly pure leaf node, indicating that younger people aged around 25 are more interested in enrolling in an MC. The left branch shows that lower levels of education, limited certification and lower content access are associated with reduced adoption. Looking at the right side of the tree, certified courses also contribute to learner enrollment, as they provide a good level of class purity, particularly for the medium class.
Figure 3.
Decision Tree Classification on Hvd_DS: Uncovering Key Predictive Features.
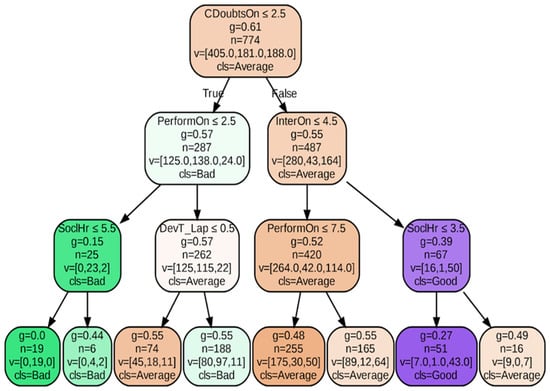
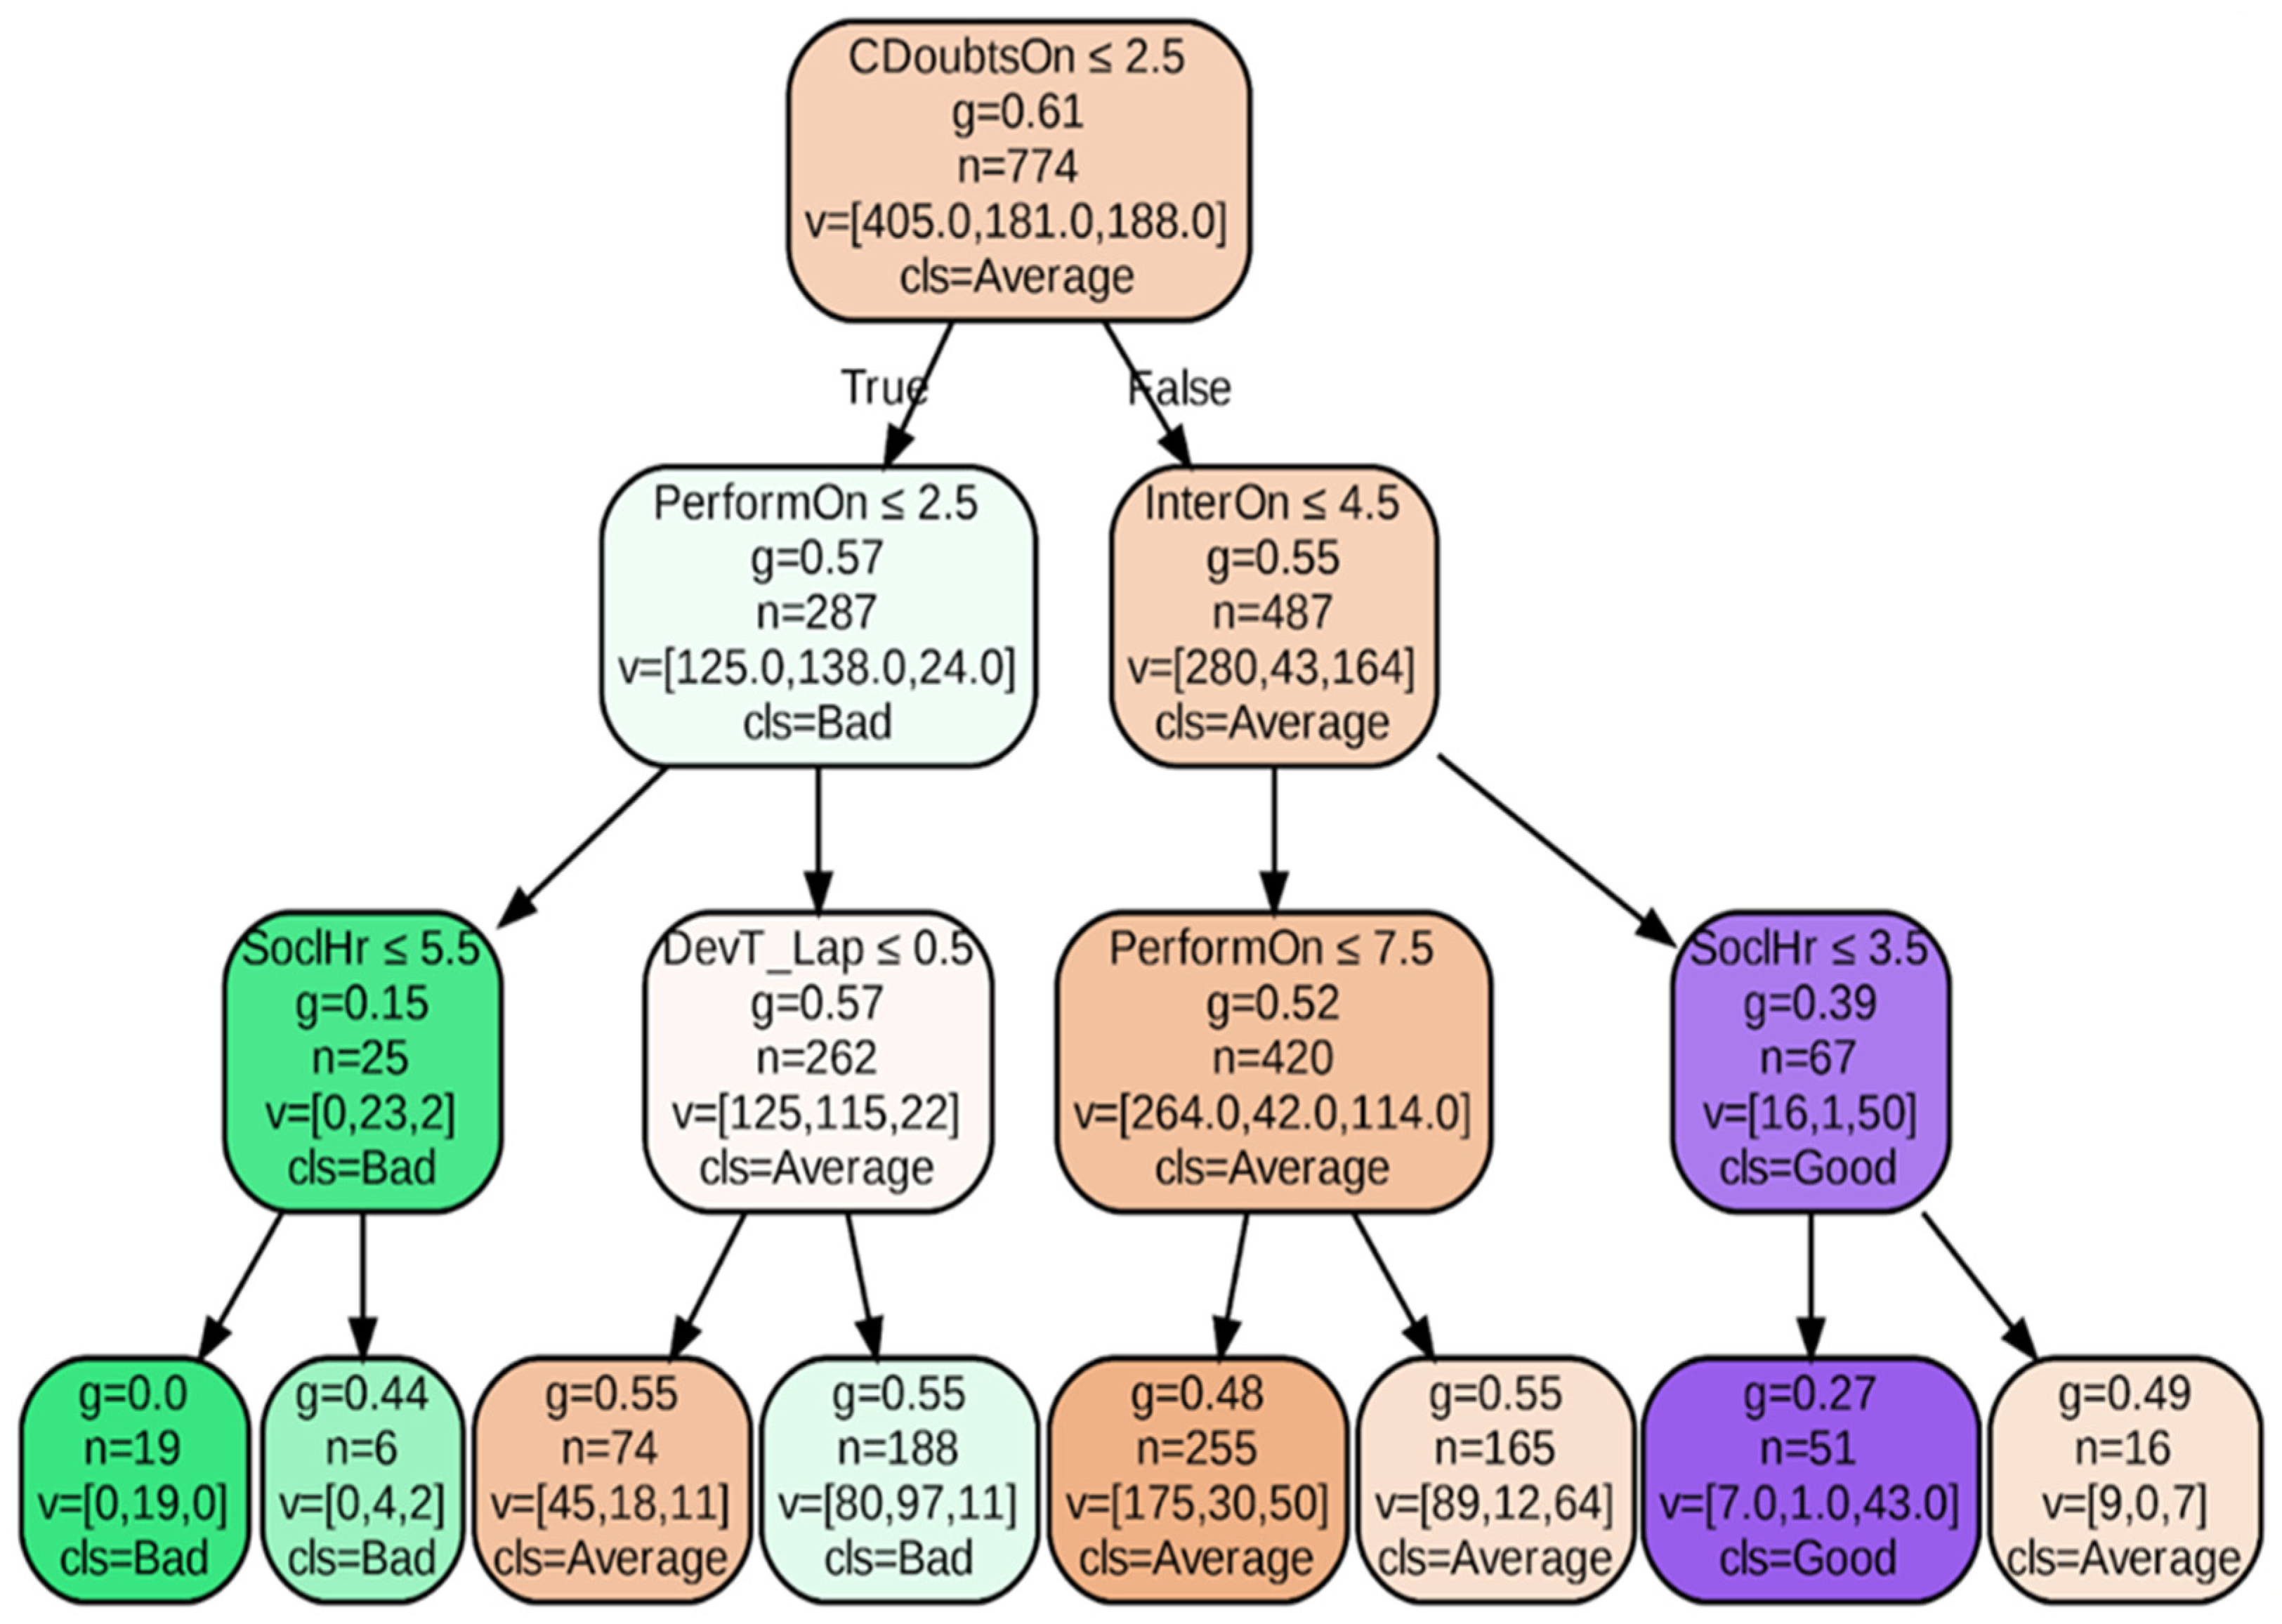
The decision tree (Figure 4) demonstrates the influence of the related attributes to student satisfaction levels in an online learning course. The three levels, Bad, Average, and Good, are used to measure students’ satisfaction levels. At the root node, C doubts on “Clearing doubts with faculties in online mode” is the most influential factor, showing that the students are satisfied with online courses if the faculty solves their doubts. Courses in which students did not find support in solving their doubts fall in the “Bad” satisfaction level. In contrast, satisfaction levels are improved when faculties actively address students’ doubts, highlighting the role of instructor responsiveness and support in an online course. With weak clearing support, online performance emerges as the next decisive factor. Limited Social Media time with lower perceived performance leads to dissatisfaction, indicating poor learning outcomes and less peer engagement. The number of subjects also acted as a moderate factor when the students reported better performance, with limited doubt clearing. Increased enrollments in different subjects also suggests an increased workload and shifting to the “Average” class. On the other branch of the tree, where “Clearing doubts with faculties in online mode” was rated positively, Interaction Online emerged as the dominant contributor to satisfaction, showing that more online sessions, peer interaction, and group studies are strongly associated with “Average” to “Good” satisfaction levels. Similarly, Social Media Time also played a key role in achieving “Good” satisfaction. Overall, the decision tree clearly shows that effective “Clearing of doubts with faculties in online mode” is the most influential factor in student satisfaction, followed by interaction quality and perceived performance. Social-media-based academic engagement and a manageable number of subjects further influence satisfaction outcomes.
Figure 4.
Decision Tree Classification on LearnO_DS: Uncovering Key Predictive Features.
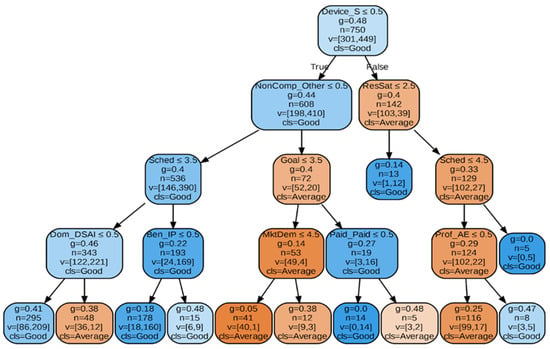
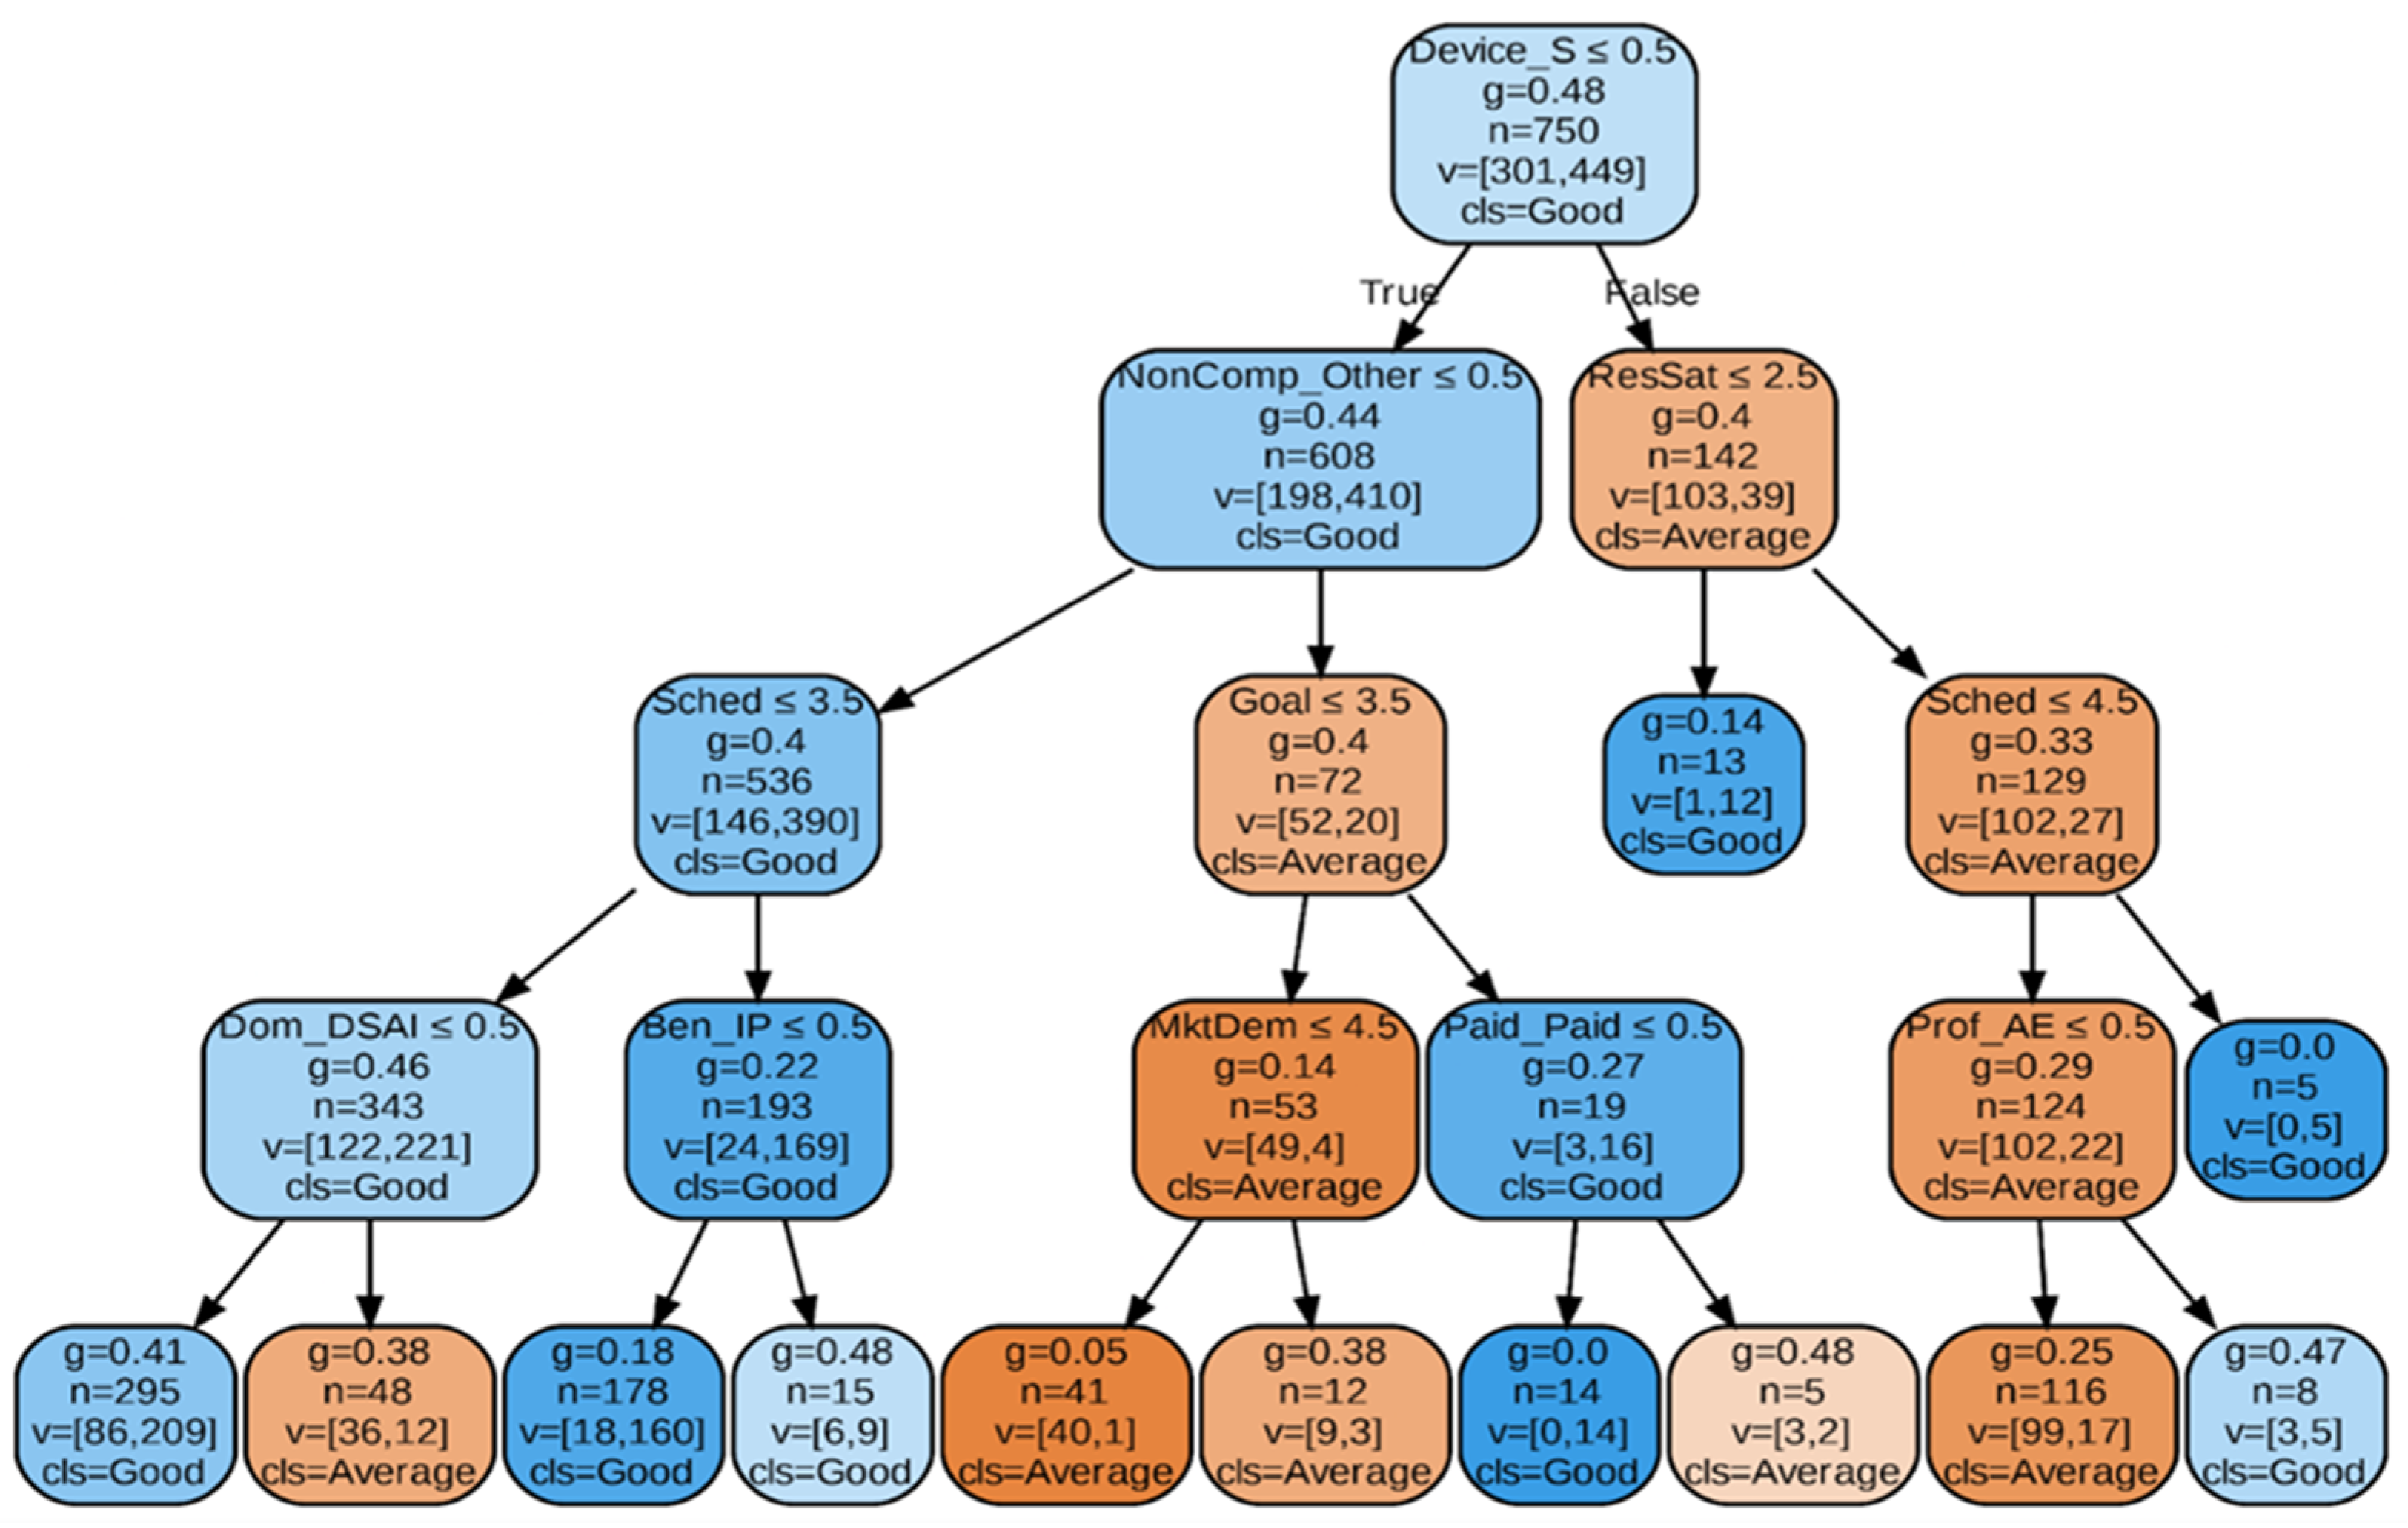
The model identified Primary_smartphone (Primary learning device: smart phone) as the most significant initial predictor, splitting the dataset at the root (Figure 5). The left subtree revealed that the students who do not use smartphones as primary learning devices reported higher satisfaction levels. In contrast, in the right subtree, the students with smartphones as primary learning devices generally exhibited average satisfaction, with further splits determined by satisfaction with course resources and study schedule management. For instance, one notable decision rule indicated that students who do not use smartphones, whose reason for non-completion was not “Other”, and who rated their study schedule management at ≤3.5, were highly likely to report “Good” satisfaction. Another rule indicated that smartphone users with high satisfaction in course resources (>2.5) and very high study schedule management (>4.5) were unanimously classified as having “Average” satisfaction (based on the samples in that leaf).
Figure 5.
Decision Tree Classification on Student_RS: Uncovering Key Predictive Features.
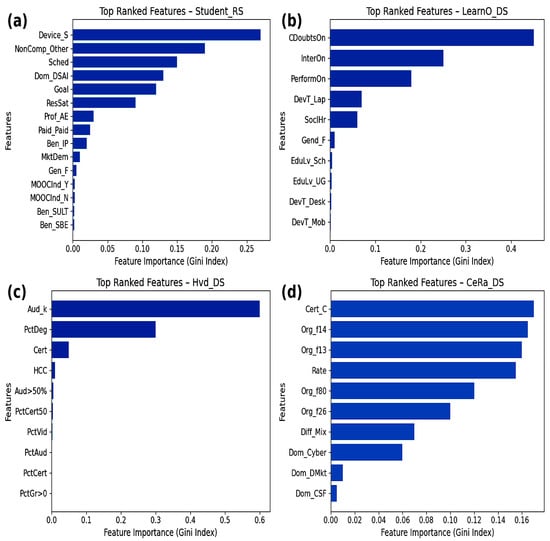
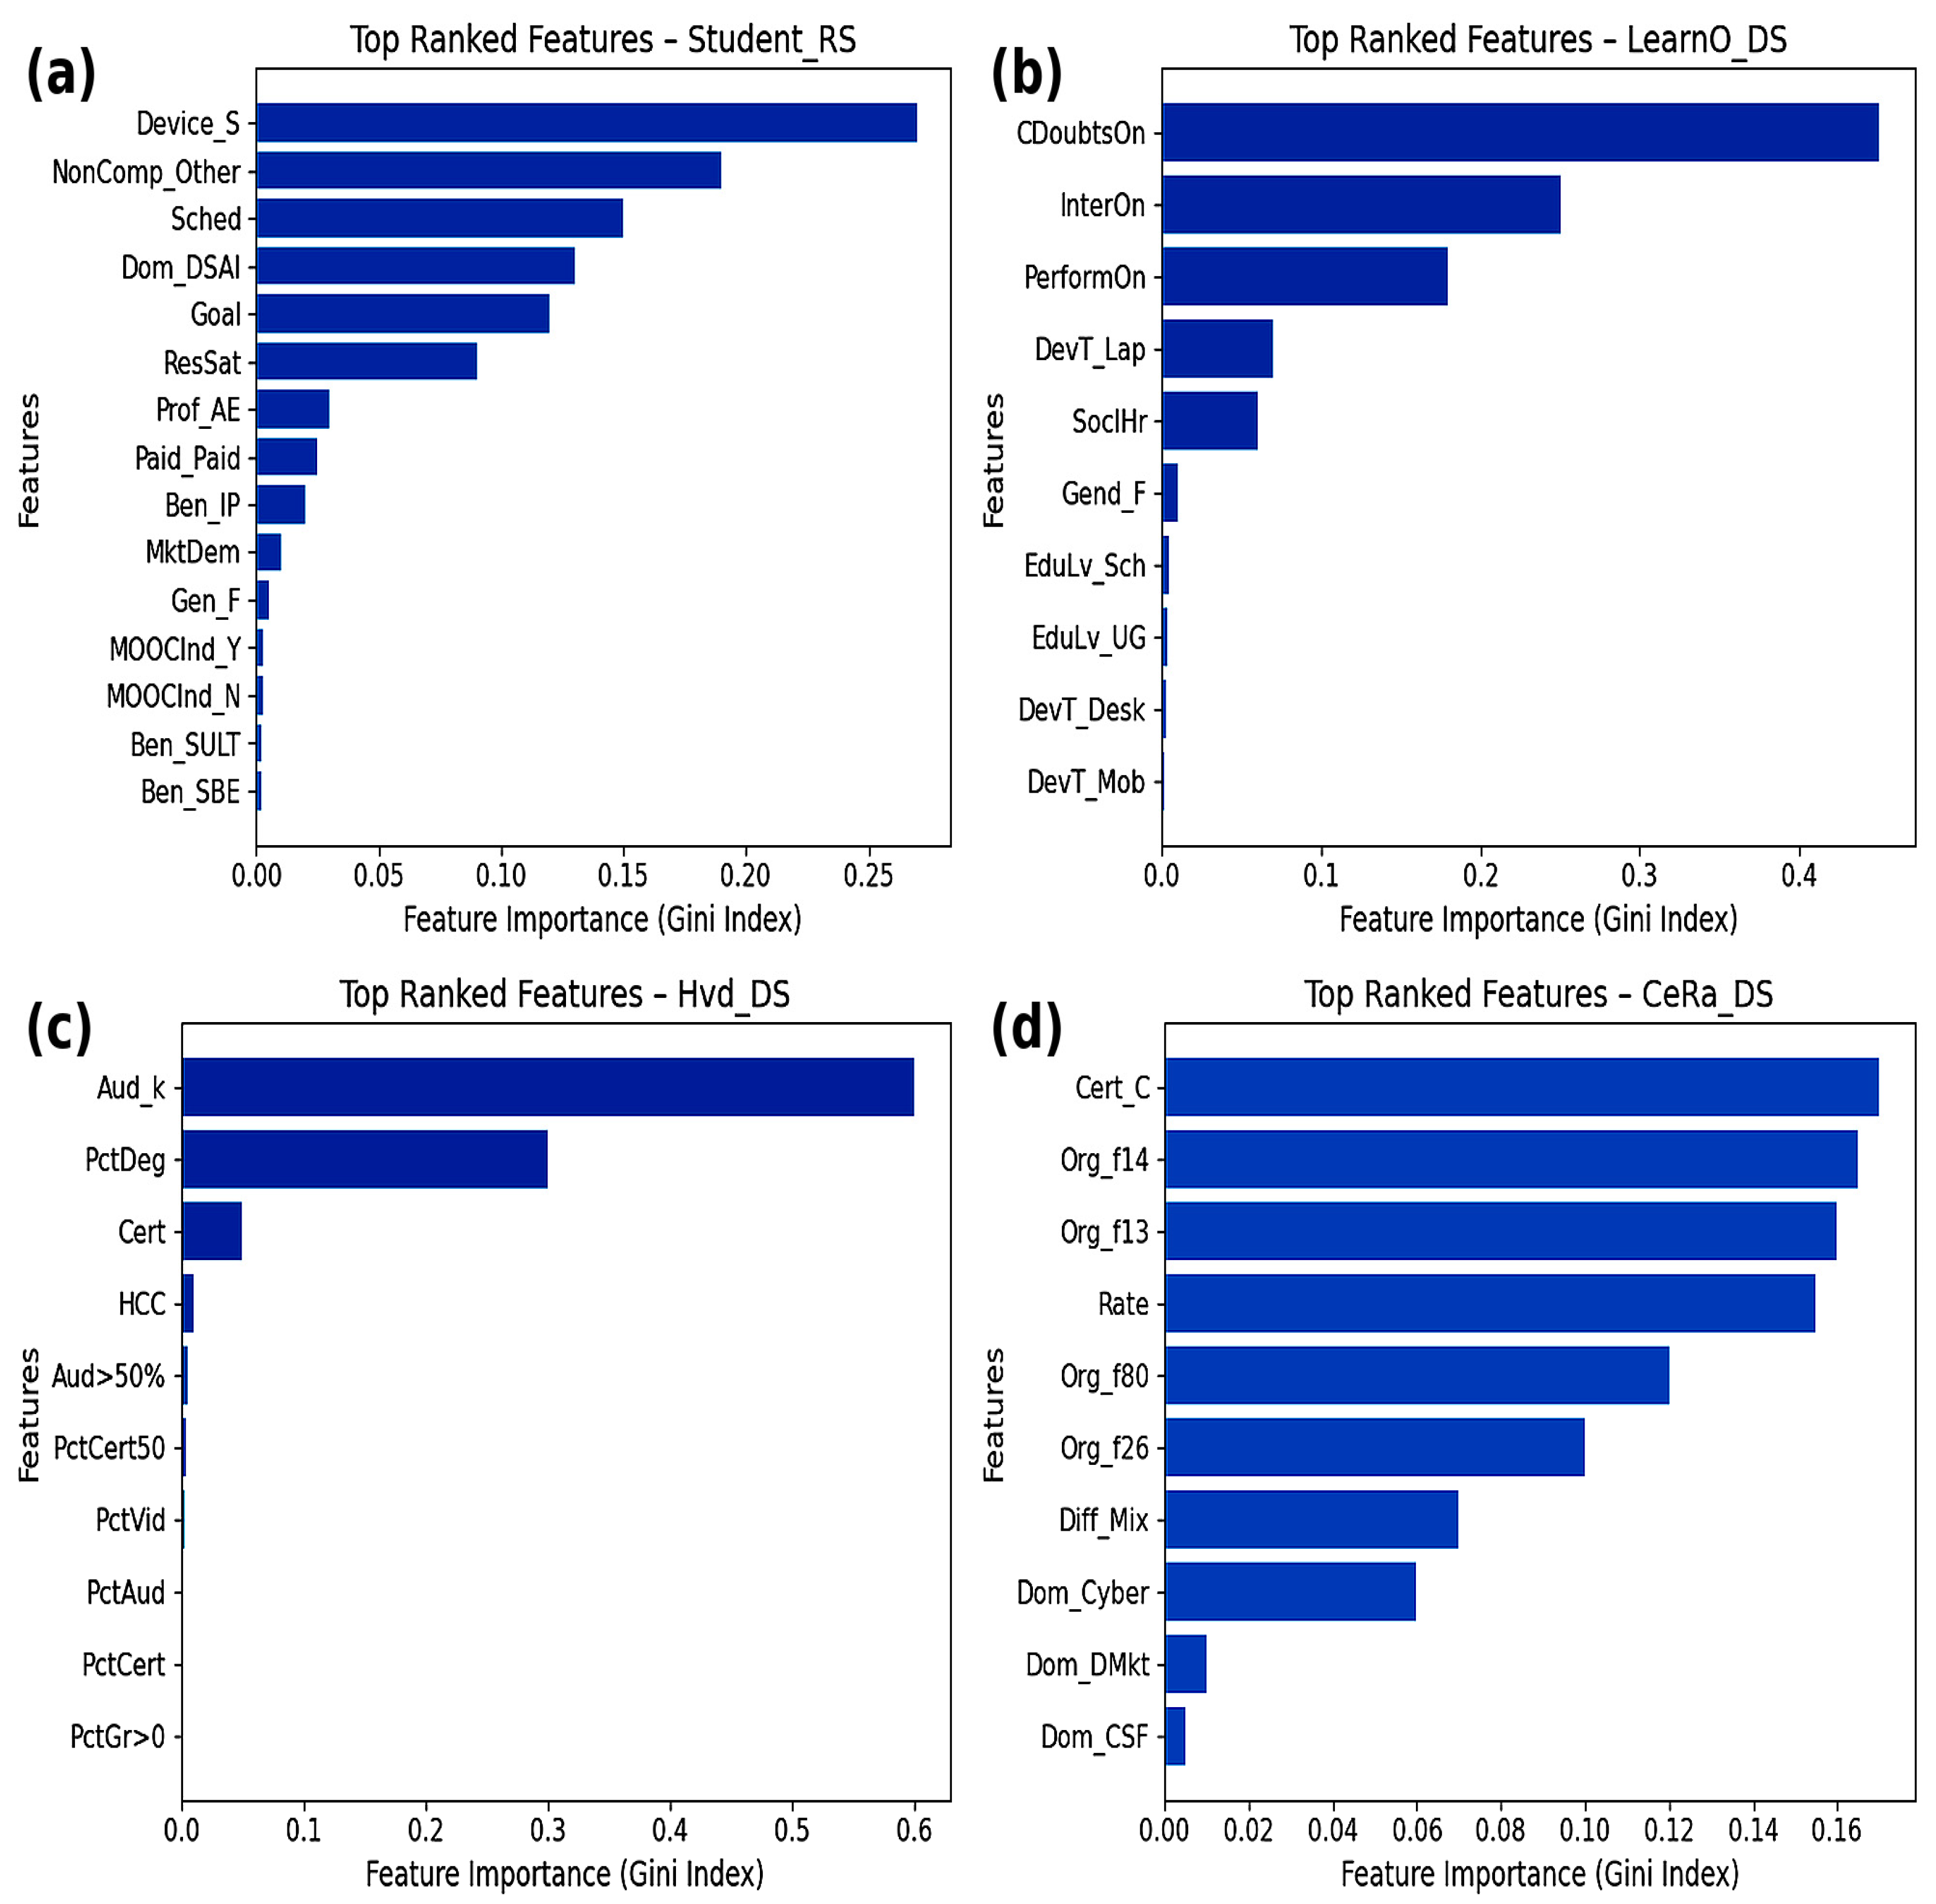
Figure 6 illustrated the feature ranking of each dataset, as measured by the Gini index, using the decision tree classifier. As illustrated in Figure 6a, Cert_C (course_certification) is the most influential parameter, indicating that learners are more likely to enroll in courses associated with a certification. ‘Org_f14’ (Course_Organization_Name) and ‘Org_13’ (Course_Organization_Name) are also significant attributes, which means that enrollments tend to be higher if reputable universities offer a course. Course difficulty generally falls into three categories: beginner, mixed, and advanced. The learners are more inclined towards the courses with a mixed course difficulty level, ‘Diff_Mix’ (Course_Dificulty level). Similarly, the feature ranking for the ‘Hvd_DS’ dataset indicates that learners with an education level of ‘Pct_Deg’ (a bachelors degree or higher) exhibit a higher trend in enrollments. From Figure 6c, it is evident that the learners’ “level of satisfaction” is achieved when they have more interactions with the faculty to clear their doubts in the subject as the ‘CdoubtsOn’ (Clearing doubts with faculties in an online mode). In Figure 6d, multiple factors, such as technology availability, self-regulation, and perceived usefulness, also contribute to MOOC adoption. ‘Device_S’ (Primary learning device_Smartphone) is the most influential factor, indicating the availability of smartphones as primary learning devices, whereas the moderate influential factors are the course-related and pedagogical factors. ‘Sched’ (Study schedule management) indicated that learners prefer to adopt self-regulation by managing their time, courses, quizzes, and assessments. In the course-related factors, ‘DOM_DSAI’ (Course domain_data science &AI) is the parameter with slightly higher influence, whereas courses such as web application have a lower impact. The variables that are contributing to the model but have a smaller influence include ‘Prof_AE’ (Current Profession—Academic/Educator) and ‘Paid_Paid’ (Paid vs. Unpaid Course). The trend indicates that demographics were found to have minimal impact, indicating that the enrollment patterns are not significantly influenced by gender, age, or area.
Figure 6.
Feature Ranking, (a) Prominent Features Student_RS, (b) Prominent Features LearnO_DS, (c) Prominent Features Hvd_DS, and (d) Prominent Features CeRa_DS.
5.1. Model Evaluation
The next step was to evaluate the model’s efficacy. The model was evaluated by measuring its accuracy. Accuracy is a measure of a model’s ability to classify instances correctly. The other evaluation metrics for our model included the confusion matrix and the AUC-ROC curve.
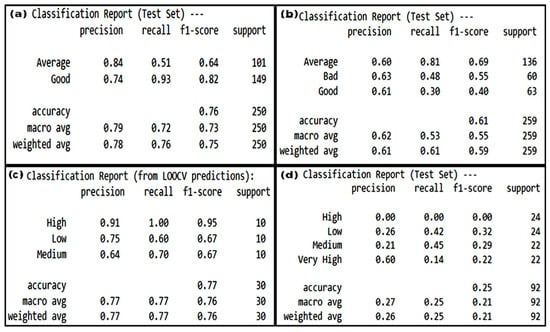
The classification report for each dataset in the respective databases are provided in Figure 7.
Figure 7.
Classification Report, (a) Classification report for CeRa_DS, (b) Classification report for Hvd_DS, (c) Classification report for LearnO_DS, and (d) Classification report for Student_RS.
Figure 7 shows the classification report of all the datasets for schema S1 and S2. The overall accuracy for CeRa_DS with class attribute “Number of enrollements” was only 25%, which depicts that the model did not perform adequately across all the categories. The precision and the recall values for the “High” and “Very High” classes are particularly low, and even in the “High” class, the model did not recognize any instance of the class. The recall values for the classes “Low” and “Medium” were better (0.42 and 0.45, respectively). The results show that the model struggled with class feature representation in the dataset because of the low feature diversity and the limited number of features available for processing.
The accuracy of the other three data sets Hvd_DS, LearnO_DS and Student_RS was 91%, 60% and 84%, respectively. The precision for the “Average” class was 0.84 and 0.74 for the “Good” class, indicating a good number of true positives. The ‘High’ adoption class of Hvd_DS performed exceptionally well, with a precision of 0.91, a recall of 1.00, and an F1-score of 0.95, highlighting the model’s strong ability to identify high enrollment. The balanced macro and weighted averages (≈0.77) further demonstrate consistent performance across all classes.
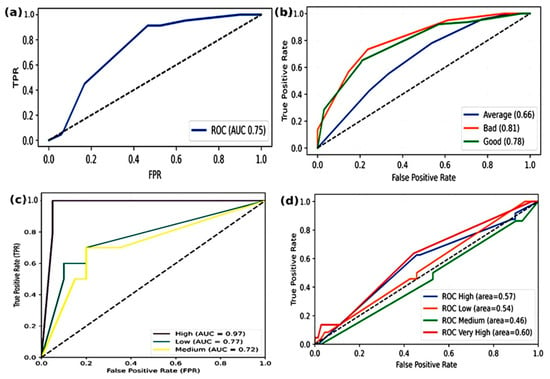
The classification report of the dataset LearnO_DS is presented in Figure 7c. The model achieved an accuracy of 61% on the test set. The model performed best on the “Average” class, with a recall of 0.84, indicating that the average instances are correctly classified. However, the F1-score was almost 60 for all the “Average”, “Bad” and “Good” classes. The evaluation results for Hvd_DS and Student_RS were good because both were comprised of high number of diverse demographic, course-related and educational features. This highlights the necessity for improved data collection with diverse features for the proposed model. Figure 8 presents the AUC-ROC curves for the Decision Trees of four datasets.
Figure 8.
AUC-ROC curves using the Decision Tree classifier, (a) AUC-ROC curves for CeRa_DS, (b) AUC-ROC curves for Hvd_DS, (c) AUC-ROC curves for LearnO_DS, and (d) AUC-ROC curves for Student_RS.
For CeRa_DS (Figure 8a), the AUC values for the High, Low, Medium, and Very High categories were 0.57, 0.54, 0.46, and 0.60, respectively, indicating near-random classification performance. Hvd_DS (Figure 8b) achieved substantially good results, with 0.97, 0.77 and 0.72 scores reflecting strong discriminative capability, particularly for the High category. In LearnO_DS (Figure 8c), the “Average”, “Bad”, and “Good” classes achieved AUC scores of 0.66, 0.81, and 0.78, respectively, with the bad class performing best. Finally, Student_RS (Figure 8d) produced an AUC of 0.75, indicating “Good” classification performance. Overall, the model’s effectiveness varied significantly, performing best on Hvd_DS.
5.2. Multiple Linear Regression Model
The datasets CeRa_DS and Hvd_DS have the class attribute of “number of enrollments”, whereas the datasets Student_RS and LearnO_DS have the class attribute of “level of satisfaction “. By applying MLR, we quantified the individual contribution of each variable through regression coefficients, allowing for a comparative interpretation across datasets. The model was evaluated using the standard metrics Mean Squared Error (MSE), Root Mean Squared Error (RMSE), Mean Absolute Error (MAE), and the Coefficient of Determination (R2).
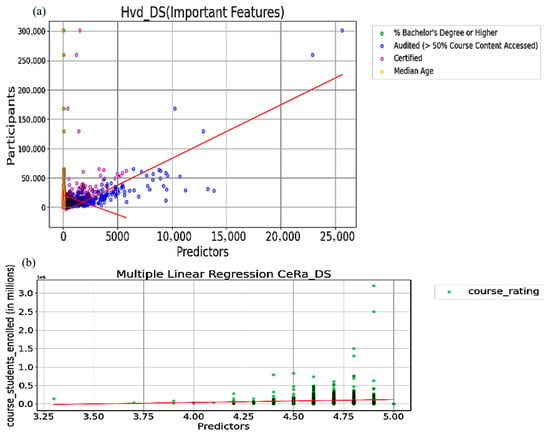
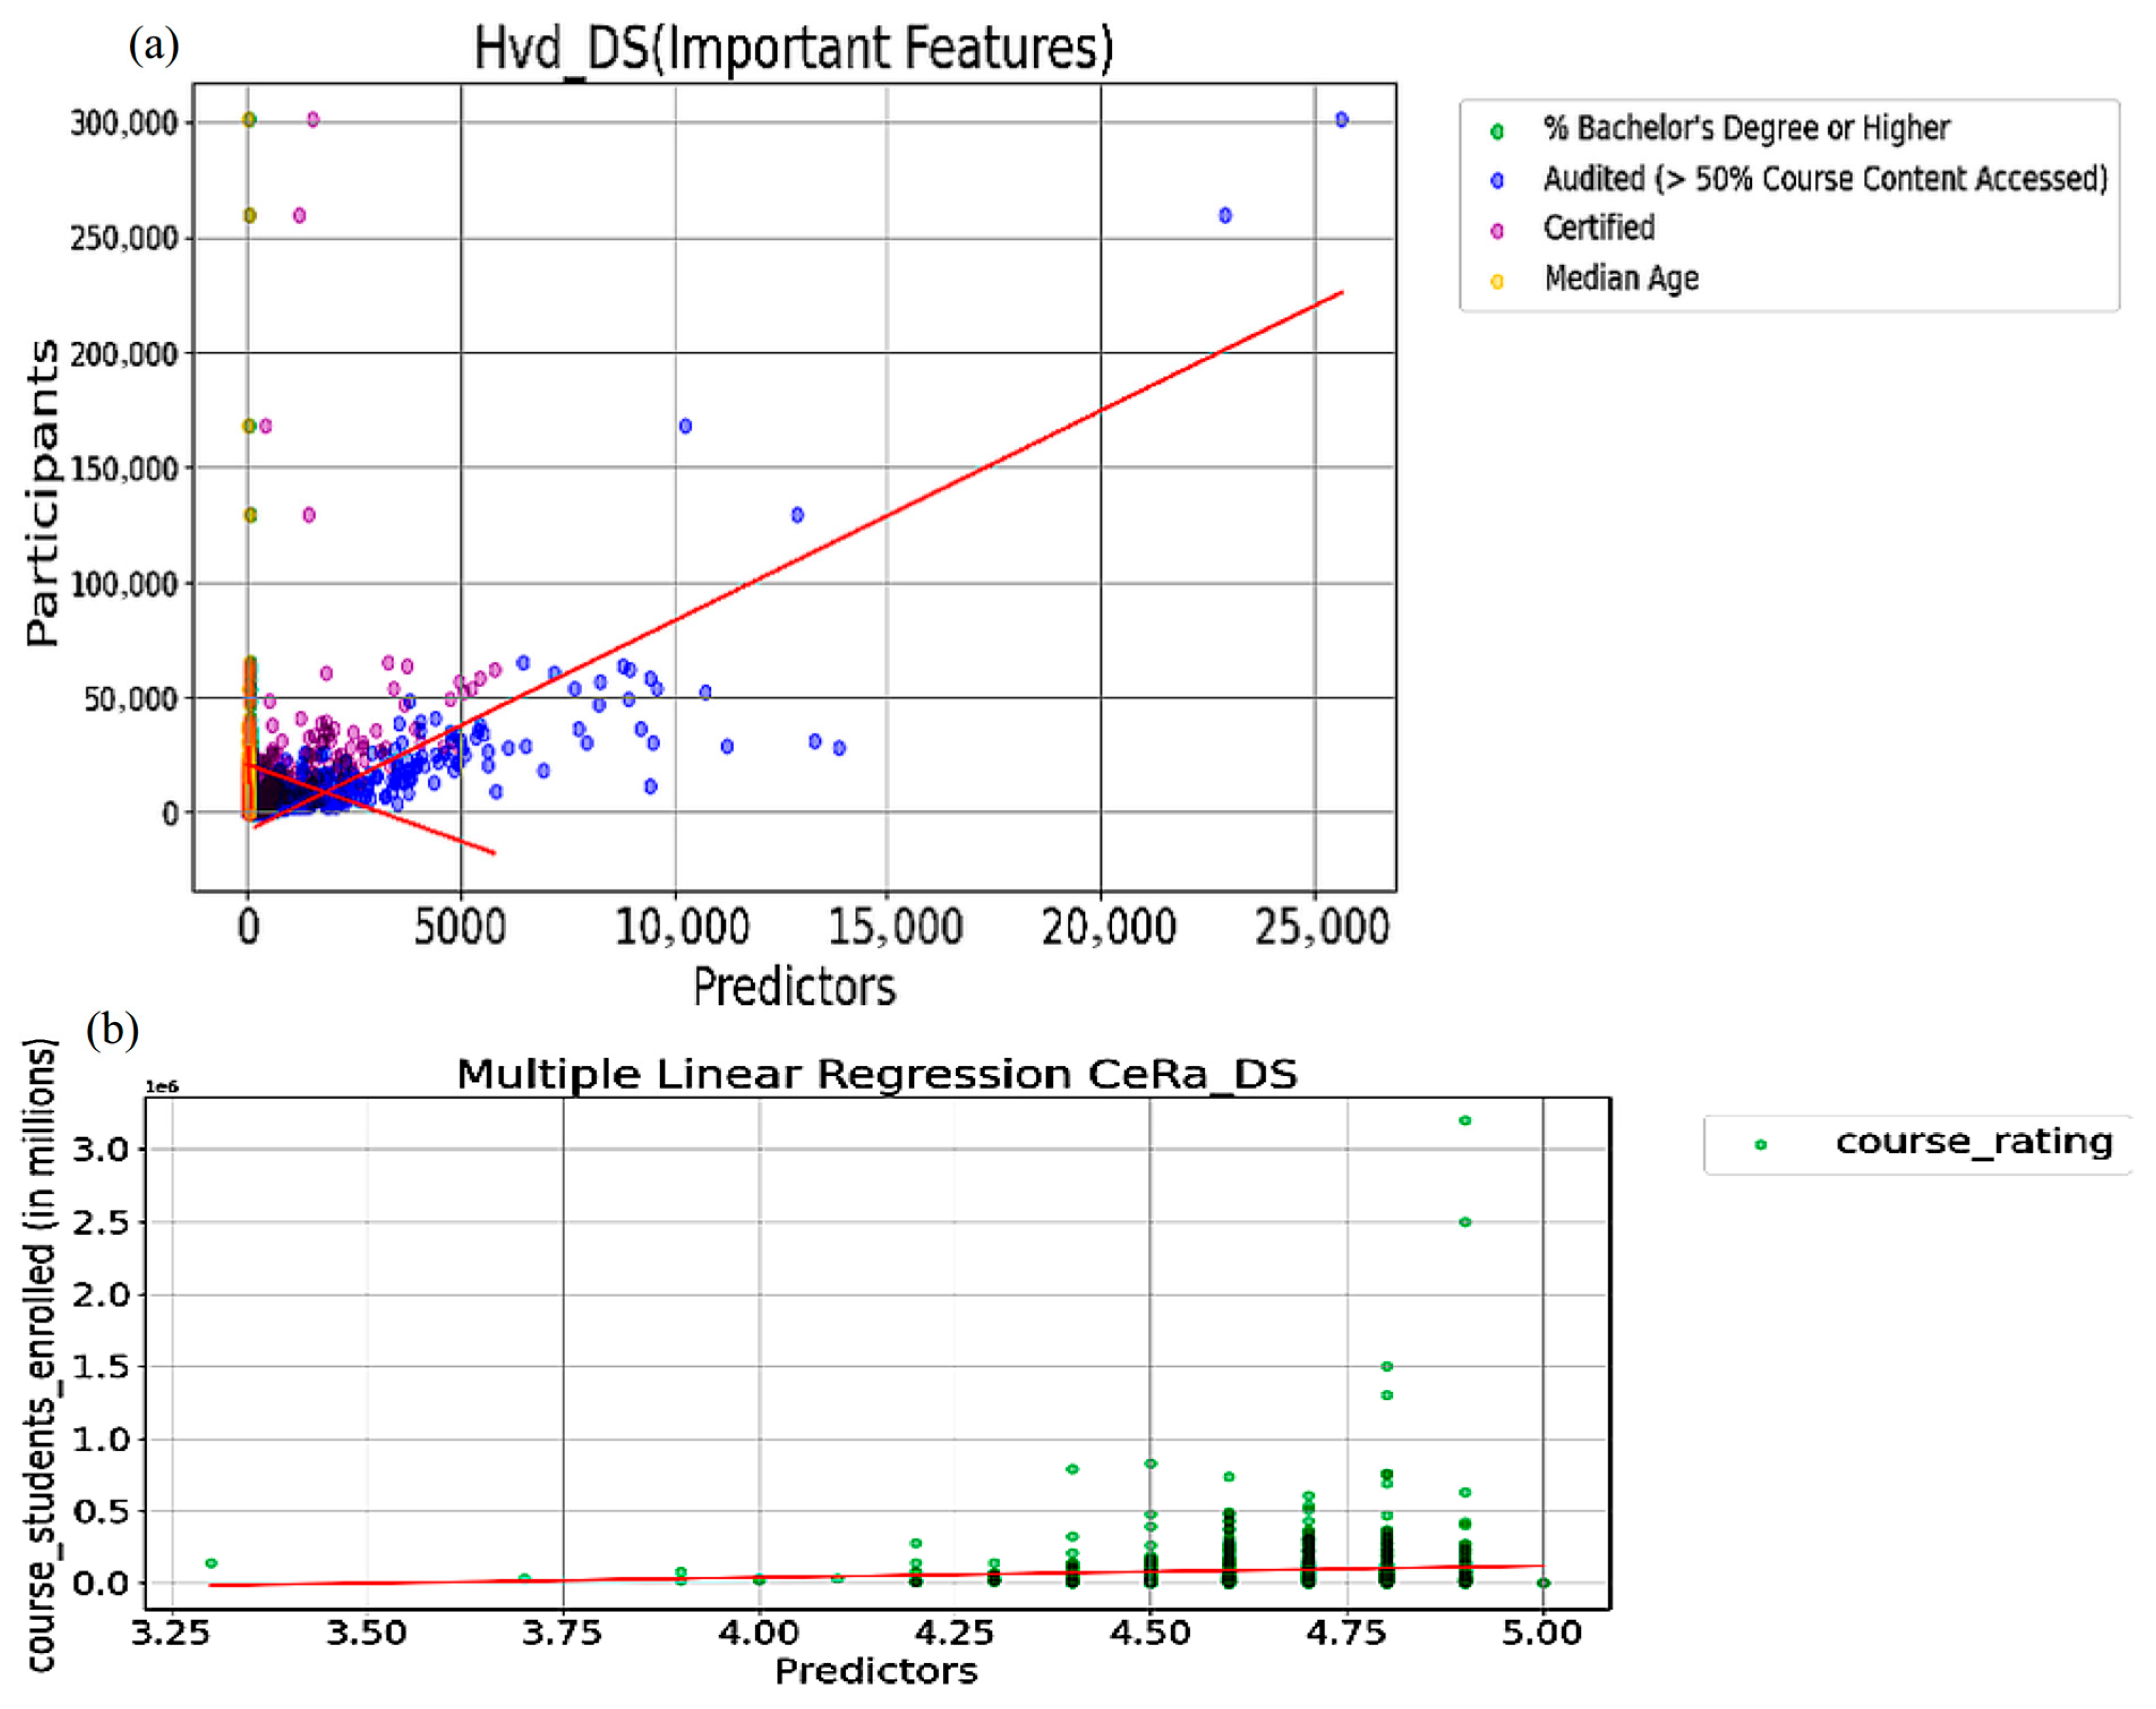
Figure 9 illustrates the linear regression results in datasets CeRa_DS and Hvd_DS. Figure 9a shows multiple linear regression for the dataset CeRa_DS, with the dependent variable “Number of enrollments” and the variable “course rating” as a sole predictor. The other variables from the dataset were excluded as they did not contain valid numerical data required for regression analysis. Each green point shows an individual course, its user rating on the X-axis, and the Y-axis represents the number of students enrolled. The red line shows the fitted regression line based on the least squares method. There is a very small positive trend between the predictor and the dependent variable. However, courses with high ratings (above 4.5) have a highly scattered distribution of data points, which shows the variance in enrollments. This shows that the courses with the high ratings are likely to have more enrollments as compared to the courses with medium or low ratings.
Figure 9.
Multiple Regression (a) Hvd_DS with important features and (b) Plot for CeRa_DS.
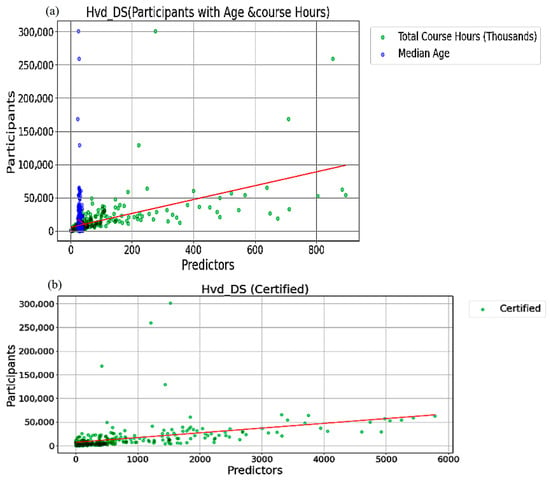
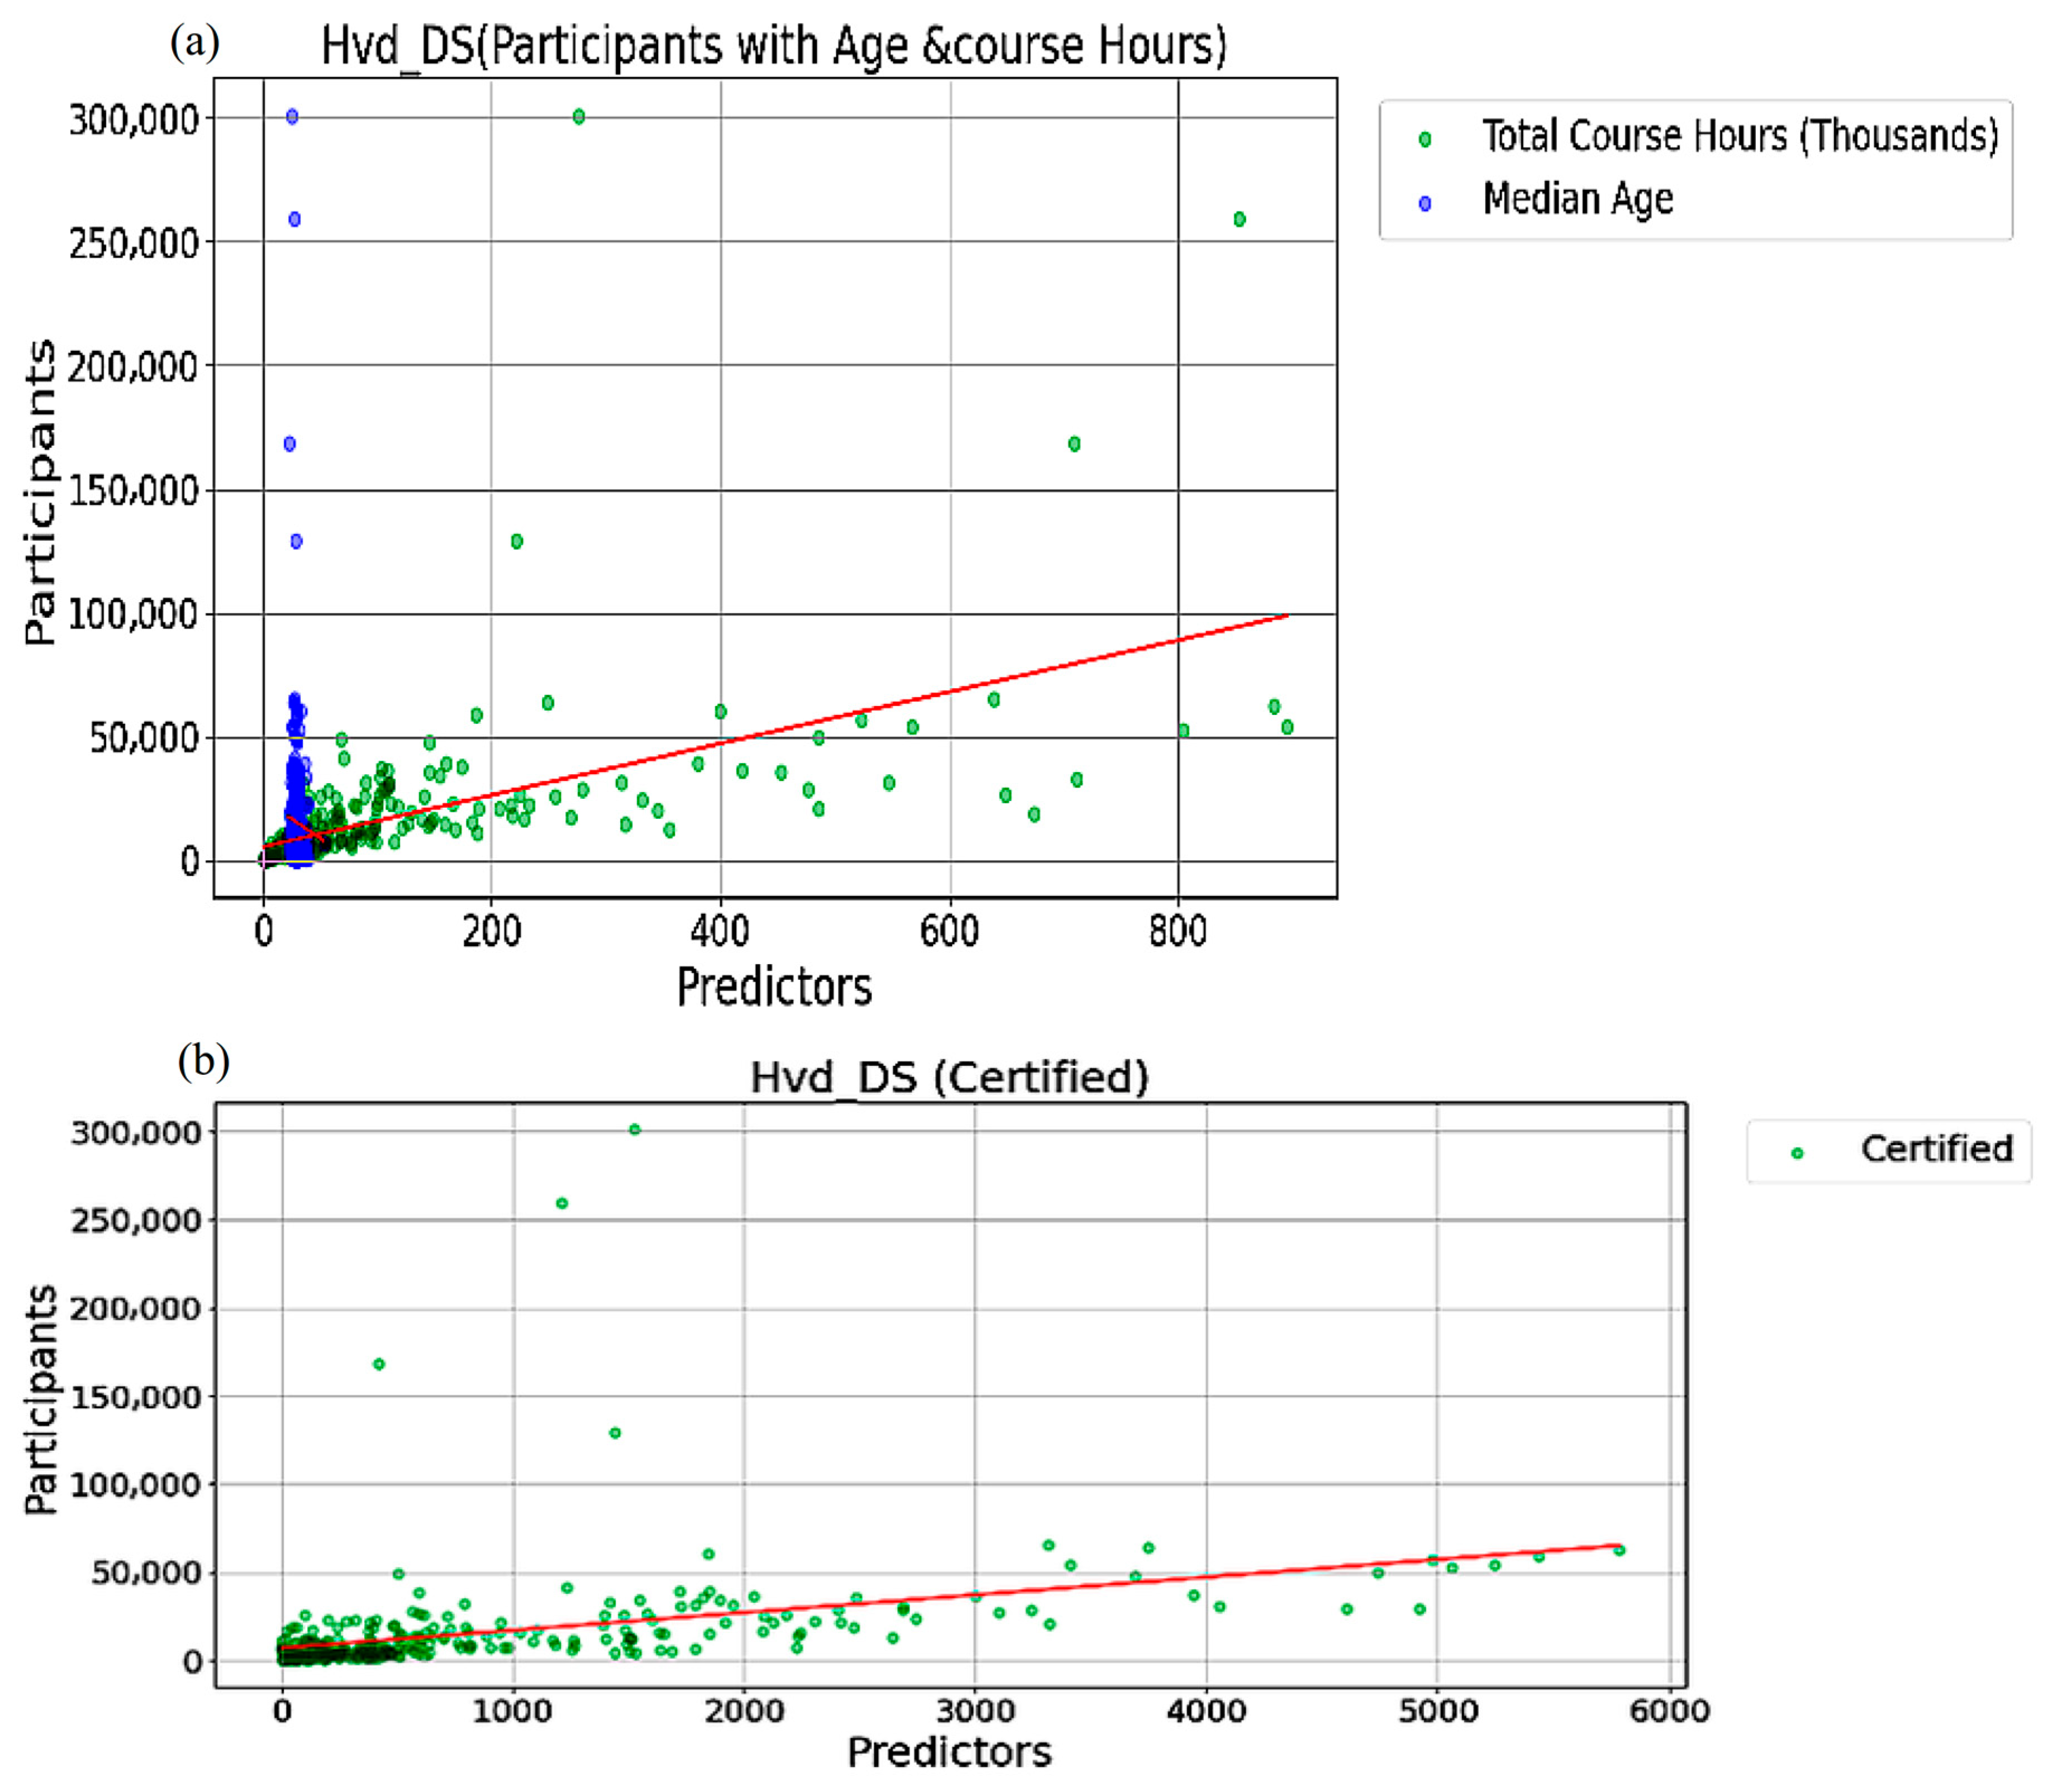
Figure 9b shows multiple regression for the dataset Hvd_DS, with the dependent variable “Number of Participants”, and Figure 10 shows the multiple regression of other course- and learner-related attributes, such as “Certification”, “Highest degree Attained” and “Course Audit status”, as predictors. Each colored dot represents a predictor variable, such as purple for “Certified” and yellow for the “median age”. The plot shows a positive association for most of the predictors, specifically “Certified” and “Audit Rates”, as there is a clear progressive upward trend in the regression line. To improve understanding, a separate graph was plotted using the variable “Course certification” as the sole predictor from the dataset Hvd_DS, depicted in Figure 10a. It is evident from the plot that there is a positive linear relationship between the number of participants and certification. The enrollments tend to increase if the courses offered are certified. The scattered data points also indicate a high level of variability. The regression line was also influenced by a few outliers (a very high number of participants).
Figure 10.
Multiple Regression (a) Hvd_DS with other features (Age and Course Hours) and (b) Hvd_DS with Certifications.
Figure 10b illustrates the relationship between the non-significant attributes of the dataset and the dependent variable “Number of Participants”. The multiple regression model shows a positive trend, indicating that “course study hours” and “age” are strongly associated with enrollment in a course. There is an upward pattern with a fitted regression line showing the influence of both attributes on enrollment. However, there is a small variance, with several outliers, which indicates that other variables may play a more substantial role as predictors of participation.
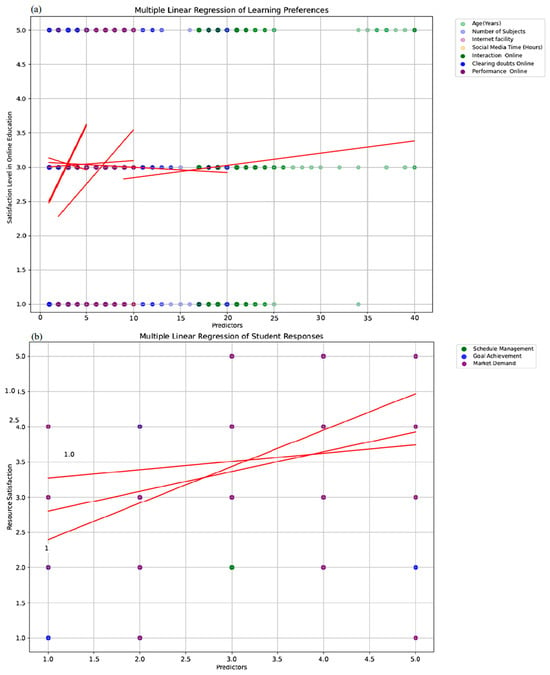
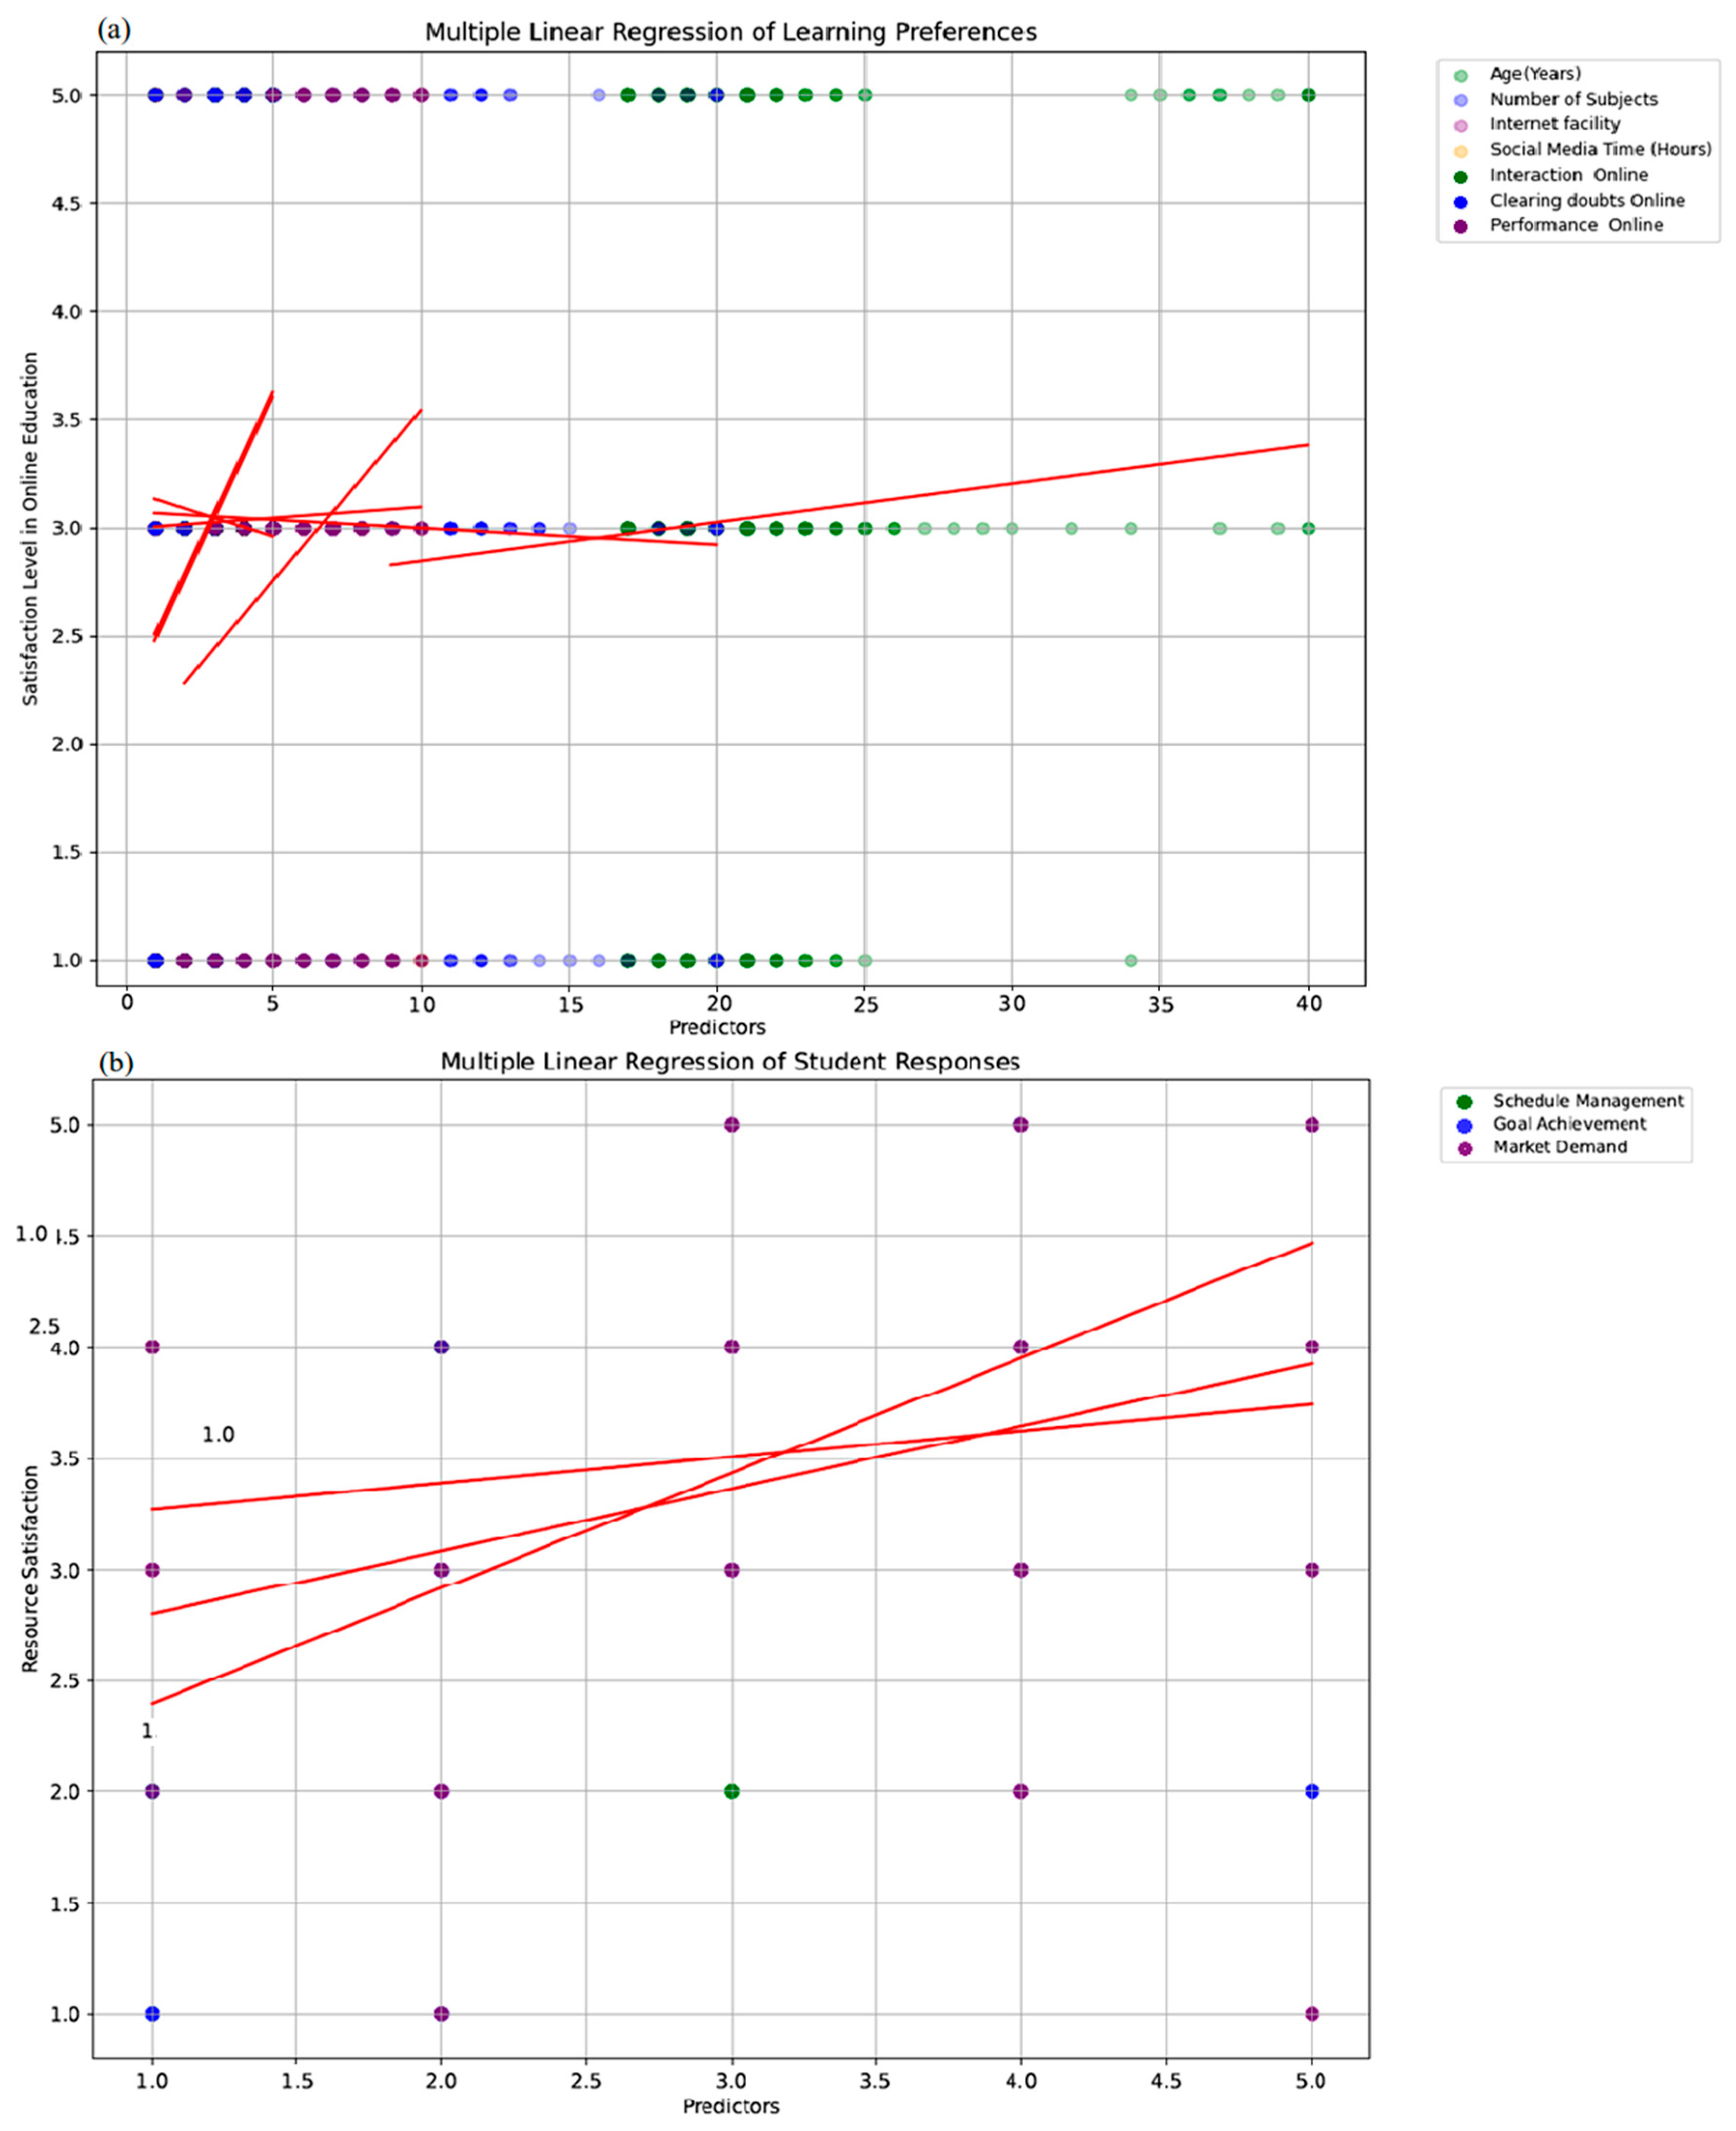
Figure 11 shows the multiple regression for the datasets LearnO_DS and Student_RS. The figure illustrates the outcomes of a multiple linear regression analysis to evaluate the influencing parameters that affect a user’s decision to choose an online learning platform. The predictors analyzed include age, number of subjects, internet facility, social media time (hours), online interaction, clearing doubts online, and online performance, with resource satisfaction as the dependent variable. Each predictor is represented by distinct color-coded data points, as shown in the legend. Key observations indicate that factors such as better internet facilities, increased online interaction, and effective doubt-clearing mechanisms play a vital role in scoring higher resource satisfaction. On the contrary, predictors such as social media time and age exhibit minimal impact or variability. The distribution of data points further reflects consistency for some predictors and variability for others. This analysis provides an actionable insight into the importance of reliable internet access, active engagement, and support systems in enhancing online learning satisfaction and can be used by MOOCs providers to improve their services.
Figure 11.
Multiple Regression (a) LearnO_DS and (b) Student_RS.
The Figure 11b shows the results of multiple linear regression for Student_RS by examining the relationship between the independent variable “Students Satisfaction Level” and three predictors (schedule management, market demand and goal achievement). The red regression line shows a positive correlation between all the predictors and satisfaction level. The regression line of the attribute “Goal Achievement” exhibits a steeper slope, indicating strong influence on the student’s satisfaction as compared to other variables.
This trend indicates that students are more likely to adopt micro-credentials within MOOCs when they perceive that these courses enhance self-regulation, enabling them to manage their course and to achieve their learning goals with increased productivity. Furthermore, the availability of short, market-driven courses aligned with emerging technologies and industry trends further strengthens their satisfaction with MOOCs.
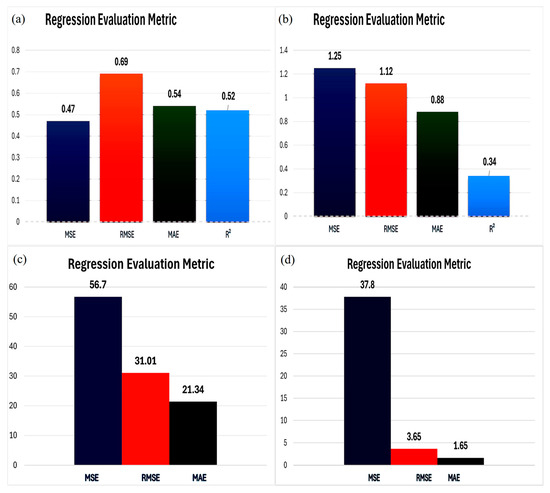
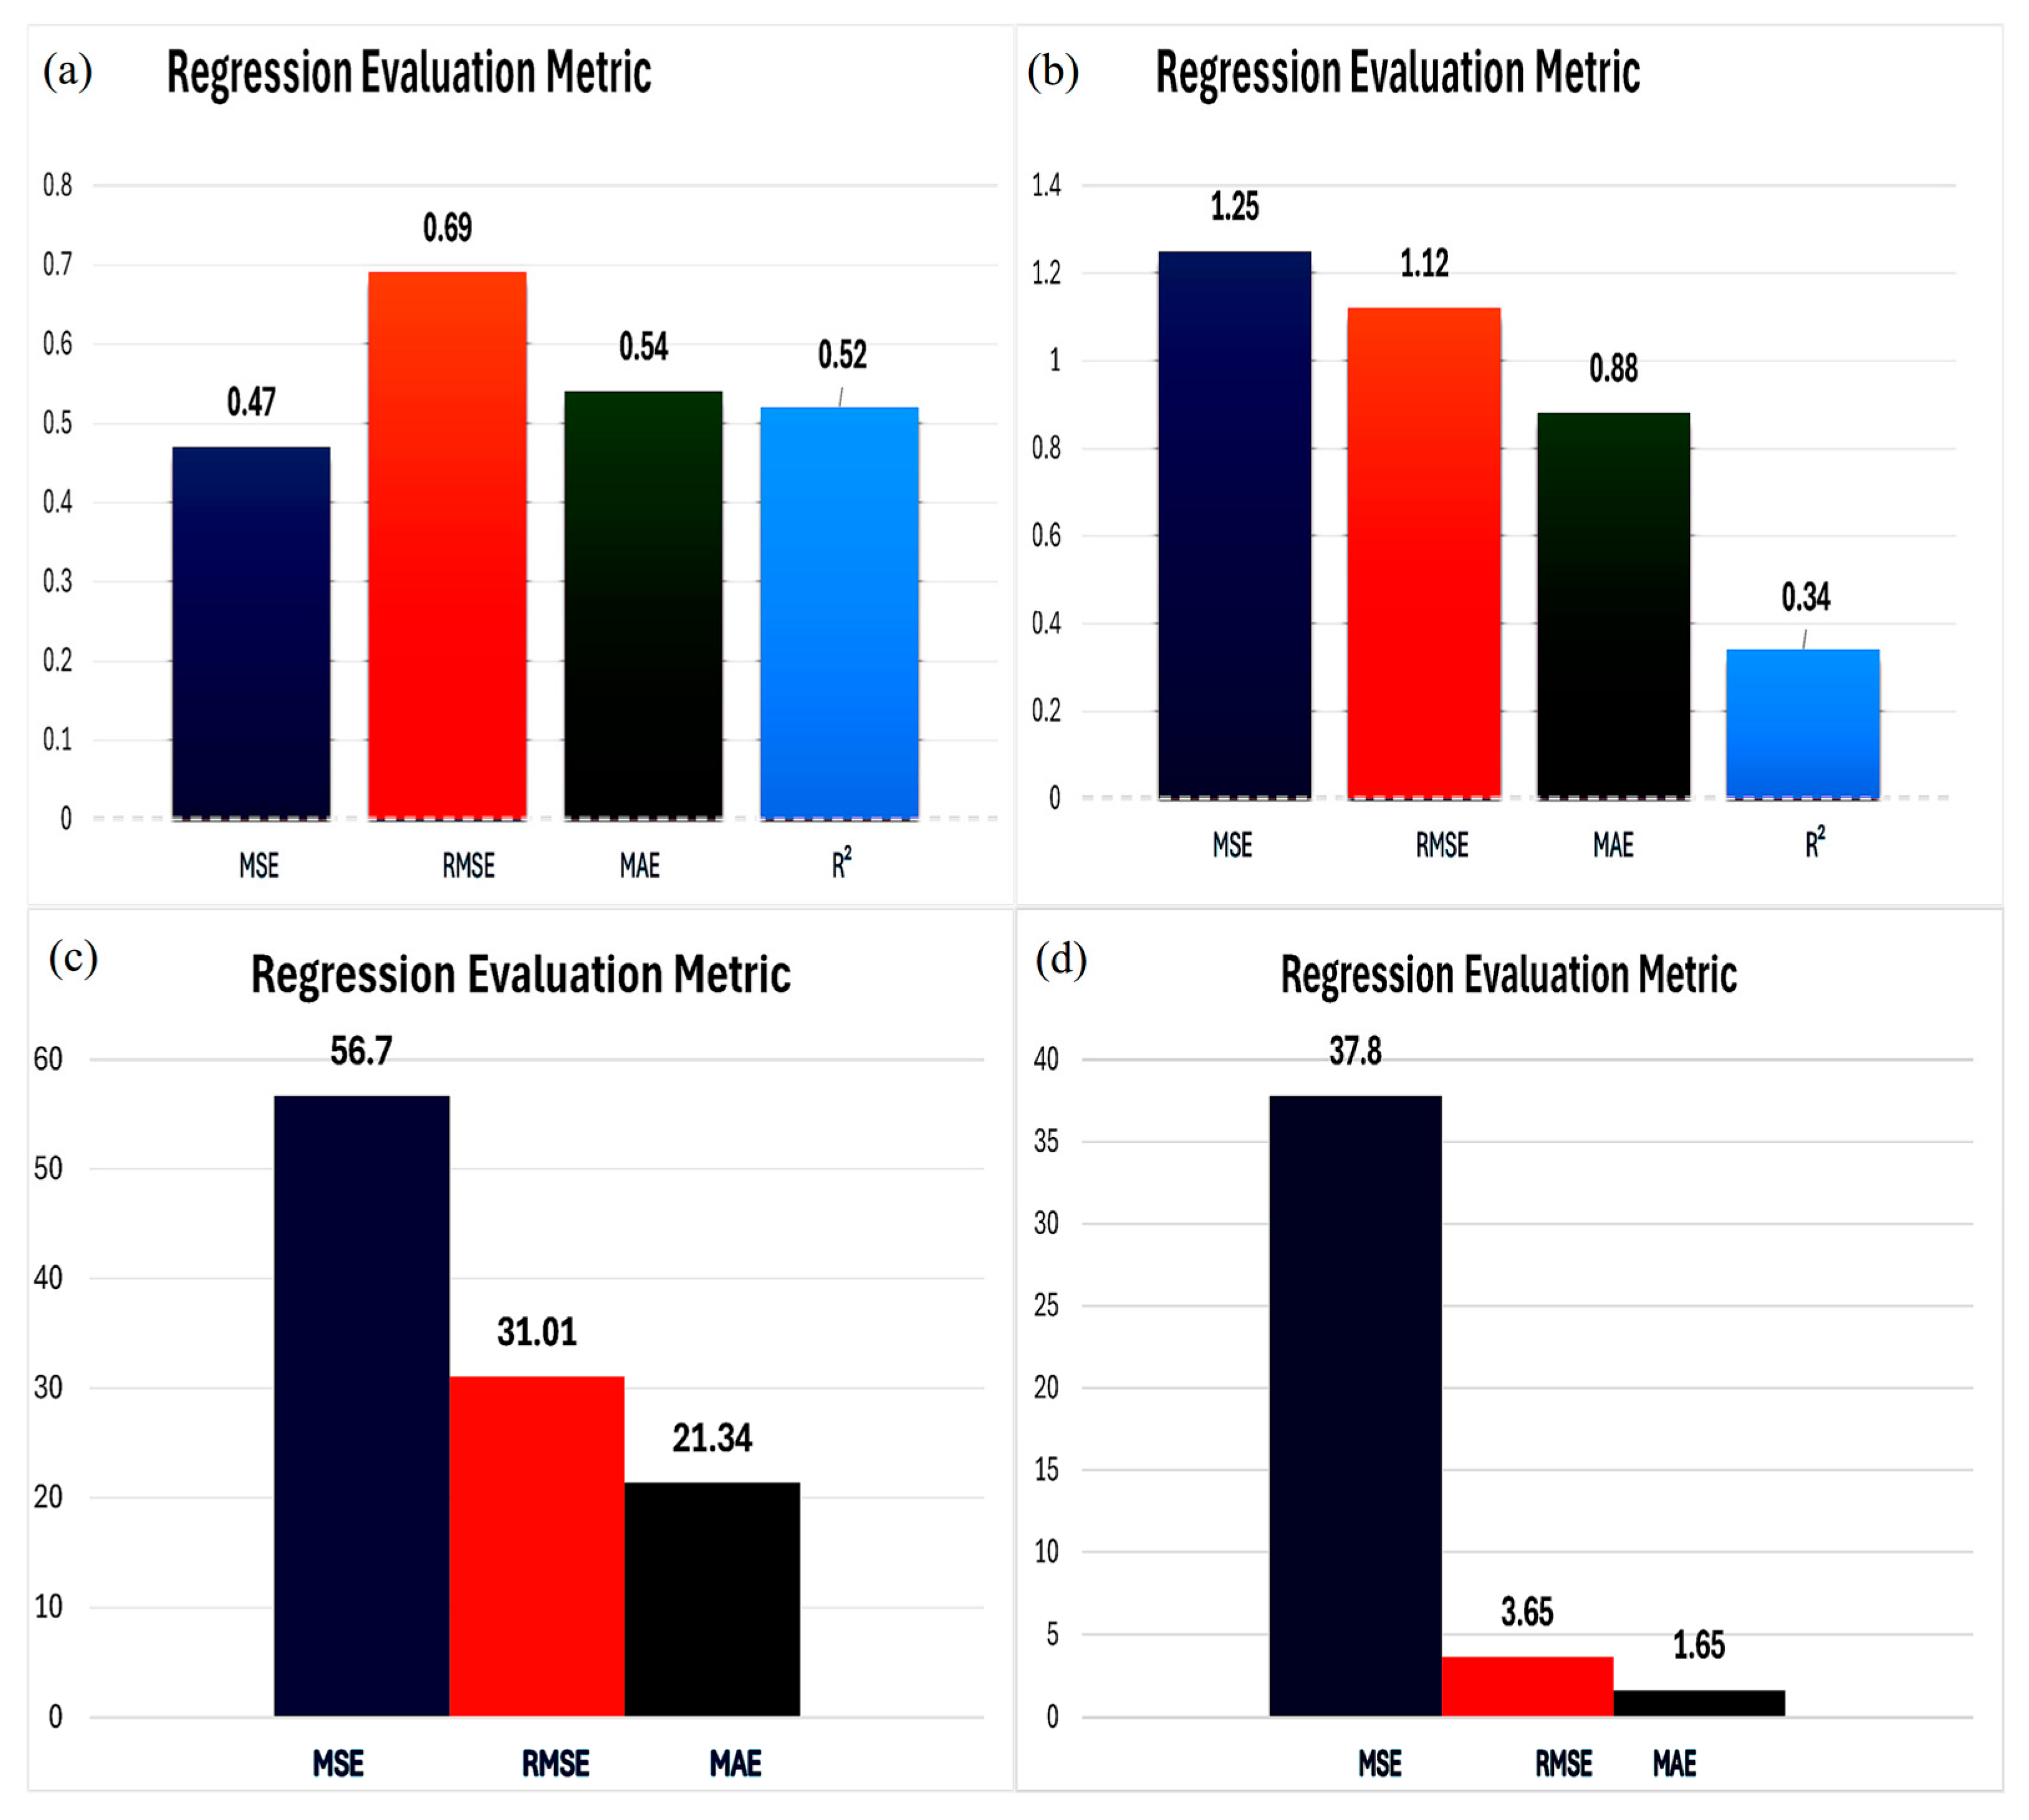
Figure 12 shows the regression results for four datasets. Accuracy was measured using MSE, RMSE, MAE, and R2. The model performed well with a low RMSE (3.65) and MAE (1.65) for Figure 12a, and shows the predictions were close to actual values. In Figure 12b, the model also gave reliable results with an RMSE of 31.01 and a MAE of 21.34. The model performed very good on the LearnO_DS dataset, as depicted in Figure 12c, and produced very small error values (MSE = 1.25 and RMSE = 1.12, MAE = 0.88). Figure 12d achieved overall balance, with very low error values (MSE = 0.47, RMSE = 0.69, and MAE = 0.54) and the highest R2 (0.52), with strong prediction accuracy. Overall, the models worked well across all datasets and were helpful in predicting factors related to MOOC adoption.
Figure 12.
Regression Evaluation Metrics: (a) CeRa_DS, (b) Hvd_DS, (c) LearnO_DS, and (d) Student_RS.
5.3. Discussion and Analysis
Overall, the decision tree model performed well. The class-wise analysis highlights that the model is particularly effective in separating well-defined learner categories and it reveals the model’s ability to capture meaningful patterns in diverse educational data. These findings support the suitability of the proposed approach as an interpretable decision-support model for investigating the learner’s adoption of MOOCs.
Decision tree models for Cera_DS identified course organization, certificate type, and course rating as the most influential parameters, and shows the interpretable patterns of feature linkage to enrollment bins. However, the overall predictive performance was modest (accuracy ≈ 25–26%, macro F1 ≈ 0.21), with the “High” enrollment class entirely missed and other classes showing weak precision and recall. This shows the limitations of the dataset, including the limited number of the sample size, the exclusion of other factors and the synthetic generalization of domains, which may lack representativeness. The constraints of the Cera_DS are further highlighted by the regression analysis, where the CeRa_DS dataset performed near-randomly (AUC values close to 0.5), whereas the R2 values ranged from 0.34 to 0.52 across the datasets, indicating that the included predictors capture only part of the variance in enrollment outcomes. These results imply that the enrollment decision taken by an individual is influenced by other factors that were not included in the feature list of the Cera_DS dataset. Despite this shortcoming, the current framework provides useful insights for all concerned stakeholders. The factors identified from this study also align with the UTAUT framework, as performance expectancy (course rating, course certification, and credentials), social influence (organization reputation) and other factors such as self-regulation emerged as significant factors for student enrollment. However, demographic parameters did not exhibit great influence and were shown to have a weak impact on online learning.
From a practical perspective, the results suggest that platforms and institutions should emphasize recognizable credentials and trusted affiliations to enhance learner engagement, which aligns with emerging 2024–2025 trends toward micro-credentials and industry-recognized certifications.
It also provides a tangible direction for future research efforts, where this model can be further refined and turned into an industry standard method for analyzing MOOC adoption behaviors.
6. Conclusions and Future Work
The present study proposes a unified framework that integrates theory-driven constructs derived from UTAUT, TAM, and Expectancy–Value Theory and complements them with variables extracted from publicly available MOOC datasets. Unlike prior studies, where the theoretical models were applied in isolation or with heavy reliance on survey-based approaches, the proposed framework consolidates these and utilizes an Educational Data Mining (EDM) approach to analyze them in conjunction. This integrated framework enables a comprehensive investigation of learner-centric adoption factors, encompassing social, course-related, pedagogical, and technological dimensions, thereby offering a more holistic understanding of MOOC adoption than existing models.
The experimental results across multiple datasets demonstrate that the proposed approach produces consistent and reliable predictive performance, indicating that the findings are not dataset-specific but generic across different learning contexts.
Decision tree classification revealed that micro-credential adoption is strongly influenced by a combination of course-related, learner-specific, psychological and technological factors. Course attributes such as certification type, course organization, ratings, difficulty level, pricing, and emerging domains (e.g., cybersecurity and data science/AI) consistently appeared among the most influential parameters in Gini-based feature importance rankings. Learner-related factors, including educational background, age group, certification intent, self-study management and pedagogical factors such as “Clearing doubt” (teacher assistance to clear doubts in the course), perceived usefulness, and goal achievement, were also identified as significant contributors. Additionally, technological and access-related parameters such as primary learning devices, internet availability, and device preference for course completion were shown to affect adoption outcomes.
The theoretical model constructs and their extensions, such as self-regulation, goal achievement and perceived usefulness, also emerged as significant factors.
The decision tree classifiers achieved accuracy values ranging from approximately 60% to over 90% across the datasets, with strong precision and recall observed for higher adoption cases. The ROC-AUC analysis further validated these findings, with AUC values consistently around 0.75 or higher, confirming the models’ ability to effectively discriminate between adoption levels beyond accuracy alone. Regression analysis accompanied the classification results by quantifying the influence of key parameters, yielding acceptable prediction errors (MSE, RMSE, and MAE) and R2 values, indicating meaningful explanatory power. Overall, the results confirm that micro-credential adoption in MOOCs is not driven by a single factor but emerges from the interaction between learner characteristics, course design, and technological accessibility.
The validated framework provides actionable, evidence-based insights for learners, and can also help institutions, policymakers, and MOOC platforms design more relevant, accessible, and targeted micro-credential offerings, considering the most influential factors identified in the findings, thereby contributing to greater MOOC adoption by learners.
This study remained limited in one dataset due to the small dataset and its limited features, and failed to capture complex interactions between the features, indicating that the findings are meaningful for understanding broad enrollment patterns, but have limited predictive reliability and generalizability. Future work may incorporate larger and more diverse datasets, longitudinal analysis, and advanced machine learning models to further enhance predictive accuracy and deepen our understanding of learner adoption behavior.
Author Contributions
Conceptualization, M.S. and R.G.; methodology, M.S., R.G. and S.K.S.; software, M.S. and R.G.; validation, M.S., R.G., P.I. and M.A.H.A.A.; formal analysis, M.S.; investigation, all authors; resources, all authors; data curation, M.S. and R.G.; writing—original draft preparation, M.S. and R.G.; writing—review and editing, all authors; visualization, M.S., R.G. and S.K.S.; supervision, M.S. and S.K.S.; project administration, R.G. and M.A.H.A.A.; funding acquisition, M.S. and S.K.S. All authors have read and agreed to the published version of the manuscript.
Funding
This research was funded through the UTP-FUI matching grant, and The APC was also funded by the same grant.
Institutional Review Board Statement
Ethical approval was waived in accordance with the institutional guidelines of Foundation University Islamabad Pakistan because this study involved an anonymous educational survey that did not collect any personally identifiable information and posed no risk to participants.
Informed Consent Statement
The study is not a medical study whereas the Helsinki agreement covers medical participant personal information only. A small online anonymous survey was conducted in this study that does not need any such approval. No such participant was involved in this study.
Data Availability Statement
The data presented in this study are available on request from the corresponding author due to privacy and ethical concerns.
Conflicts of Interest
The authors declare no conflicts of interest.
References
- Orman, R.; Çagiltay, N.; Çakir, H. Analysis of MOOC data with educational data mining: A systematic literature review. El-Cezeri 2025, 12, 191–204. [Google Scholar] [CrossRef] [Scilit]
- Alangari, H. Transforming learning: The rise of micro-credentials in higher education. In Digital Transformation in Higher Education, Part A; Emerald Publishing Limited: Bingley, UK, 2024; pp. 83–100. [Google Scholar]
- van de Laar, M.; West, R.E.; Cosma, P.; Katwal, D.; Mancigotti, C. The value of educational micro-credentials in open access online education: A doctoral education case. Open Learn. J. Open Distance e-Learn. 2024, 39, 373–386. [Google Scholar] [CrossRef] [Scilit]
- Varadarajan, S.; Koh, J.H.L.; Daniel, B.K. A systematic review of the opportunities and challenges of micro-credentials for multiple stakeholders. Int. J. Educ. Technol. High. Educ. 2023, 20, 13. [Google Scholar] [CrossRef] [Scilit] [PubMed]
- Ozbek, E.A. Digital transformation, MOOCs, micro-credentials and MOOC-based degrees: Implications for higher education. In International Open and Distance Learning Conference Proceedings Book; Anadolu University: Eskişehir, Turkey, 2019; p. 37. [Google Scholar]
- Wan, L.; Xie, S.; Shu, A. Toward an understanding of university students’ continued intention to use MOOCs: When UTAUT meets TTF. SAGE Open 2020, 10, 2158244020941858. [Google Scholar] [CrossRef] [Scilit]
- Zaremohzzabieh, Z.; Roslan, S.; Mohamad, Z.; Ismail, I.A.; Ab Jalil, H.; Ahrari, S. Influencing factors in MOOCs adoption in higher education: A meta-analytic path analysis. Sustainability 2022, 14, 8268. [Google Scholar] [CrossRef] [Scilit]
- Adriaans, P. Data Mining; Pearson Education India: New Delhi, India, 1996. [Google Scholar]
- Shaheen, M.; Shahbaz, M. An algorithm of association rule mining for microbial energy prospection. Sci. Rep. 2017, 7, 46108. [Google Scholar] [CrossRef] [Scilit]
- Shaheen, M.; Naheed, N.; Ahsan, A. Relevance-diversity algorithm for feature selection and modified Bayes for prediction. Alex. Eng. J. 2023, 66, 329–342. [Google Scholar] [CrossRef] [Scilit]
- Shahbaz, M.; Ahsan, S.; Shaheen, M.; Nawab, R.M.A.; Masood, S.A. Automatic generation of extended ER diagram using natural language processing. J. Am. Sci. 2011, 7, 1–10. [Google Scholar]
- Khan, S.; Shaheen, M. WisRule: First cognitive algorithm of wise association rule mining. J. Inf. Sci. 2024, 50, 874–893. [Google Scholar] [CrossRef] [Scilit]
- Romero, C.; Ventura, S. Data mining in education. WIREs Data Min. Knowl. Discov. 2013, 3, 12–27. [Google Scholar] [CrossRef] [Scilit]
- Dol, S.M.; Jawandhiya, P. Review of EDM for analyzing the performance of students in educational settings. In Proceedings of the 6th International Conference on Computing, Communication, Control and Automation (ICCUBEA), Pune, India, 26–27 August 2022; pp. 1–8. [Google Scholar]
- Williams, R.T. An overview of MOOCs and blended learning: Integrating MOOC technologies into traditional classes. IETE J. Educ. 2024, 65, 84–91. [Google Scholar] [CrossRef] [Scilit]
- Kiiskilä, P.; Kukkonen, A.; Pirkkalainen, H. Are micro-credentials valuable for students? Perspective on verifiable digital credentials. SN Comput. Sci. 2023, 4, 366. [Google Scholar] [CrossRef] [Scilit]
- Ngoc Ha, N.T.; Van Dyke, N.; Spittle, M. Micro-credentials in higher education: Perceived benefits for graduate employability. Stud. High. Educ. 2025; in press.
- Zhu, M.; Sari, A.R.; Lee, M.M. Trends and issues in MOOC learning analytics empirical research. Educ. Inf. Technol. 2022, 27, 10135–10160. [Google Scholar] [CrossRef] [Scilit]
- Yağcı, M. Educational data mining for academic performance prediction. Smart Learn. Environ. 2022, 9, 11. [Google Scholar] [CrossRef] [Scilit]
- Haron, H.; Hussin, S.; Yusof, A.R.M.; Samad, H.; Yusof, H. Implementation of the UTAUT model to understand MOOC adoption. IOP Conf. Ser. Mater. Sci. Eng. 2021, 1062, 012001. [Google Scholar] [CrossRef] [Scilit]
- Khalid, B.; Lis, M.; Chaiyasoonthorn, W.; Chaveesuk, S. Factors influencing behavioural intention to use MOOCs. Eng. Manag. Prod. Serv. 2021, 13, 83–95. [Google Scholar] [CrossRef] [Scilit]
- Mulik, S.; Srivastava, M.; Yajnik, N.; Taras, V. Flow experience of MOOC users. J. Int. Educ. Bus. 2020, 13, 1–19. [Google Scholar] [CrossRef] [Scilit]
- Abu-Shanab, E.A.; Musleh, S. Adoption of massive open online courses. Int. J. Web-Based Learn. Teach. Technol. 2018, 13, 62–76. [Google Scholar] [CrossRef] [Scilit]
- Ma, L.; Lee, C.S. Barriers to the use of MOOCs in developing countries. J. Educ. Comput. Res. 2019, 57, 571–590. [Google Scholar] [CrossRef] [Scilit]
- Lee, Y.; Song, H.-D. Motivation for MOOC learning persistence. Front. Psychol. 2022, 13, 958945. [Google Scholar] [CrossRef] [Scilit]
- Halim, A.A.; Othman, N.; Azri, N.; Samir, N.M. Perceived ease of use and perceived usefulness of MOOC TITAS platform. Int. J. Acad. Res. Bus. Soc. Sci. 2022, 12, 15216. [Google Scholar] [CrossRef] [Scilit] [PubMed]
- Bruguera, C.F.; Pagés, C.; Antonaci, A. Learner preferences regarding micro-credential programs. Zenodo Res. Rep. 2023, 2.2. [Google Scholar] [CrossRef]
- Durak, G.; Cankaya, S. The rise of micro-credentials. In Integrating Micro-Credentials with AI in Open Education; IGI Global: Hershey, PA, USA, 2025; pp. 1–18. [Google Scholar]
- Tanaka, K.; Angelin, A.; Chandra, Y.U. Determinant factors of behavioral intention using MOOCs. In Proceedings of the 14th International Conference on Educational and Information Technology (ICEIT), Guangzhou, China, 14–16 March 2025; pp. 247–253. [Google Scholar]
- Ahsan, K.; Akbar, S.; Kam, B.; Abdulrahman, M.D.-A. Implementation of micro-credentials in higher education. Educ. Inf. Technol. 2023, 28, 13505–13540. [Google Scholar] [CrossRef] [Scilit]
- Pirkkalainen, H.; Sood, I.; Padron Napoles, C.; Kukkonen, A.; Camilleri, A. Micro-credentials and learner empowerment. Educ. Res. 2023, 65, 40–63. [Google Scholar] [CrossRef] [Scilit]
- Kórösi, G.; Esztelecki, P.; Farkas, R.; Tóth, K. Clickstream-based outcome prediction in short video MOOCs. In Proceedings of the International Conference on Computer, Information and Telecommunication Systems (CITS), Colmar, France, 11–13 July 2018; pp. 1–5. [Google Scholar]
- Bezerra, L.N.M.; da Silva, M.T. Application of EDM to understand online students’ behavior. J. Inf. Technol. Res. 2019, 12, 154–168. [Google Scholar] [CrossRef] [Scilit]
- Bujang, S.D.A.; Selamat, A.; Krejcar, O. Predictive analytics model for student grade prediction. IOP Conf. Ser. Mater. Sci. Eng. 2021, 1051, 012005. [Google Scholar] [CrossRef] [Scilit]
- Tasnim, N.; Paul, M.K.; Sattar, A.S. Identification of dropout students using EDM. In Proceedings of the International Conference on Electrical, Computer and Communication Engineering (ECCE), Cox’s Bazar, Bangladesh, 7–9 February 2019; pp. 1–5. [Google Scholar]
- Khan, I.; Ahmad, A.R.; Jabeur, N.; Mahdi, M.N. AI-based monitoring of student performance. Smart Learn. Environ. 2021, 8, 17. [Google Scholar] [CrossRef] [Scilit]
- Peng, X.; Xu, Q. Learners’ behaviors and discourse content in MOOC reviews. Comput. Educ. 2020, 143, 103673. [Google Scholar] [CrossRef] [Scilit]
- Ani, A.; Khor, E.T. Predictive models for student performance in MOOCs. Educ. Inf. Technol. 2024, 29, 13905–13928. [Google Scholar] [CrossRef] [Scilit]
- Venkatesh, V.; Morris, M.G.; Davis, G.B.; Davis, F.D. User acceptance of information technology. MIS Q. 2003, 27, 425–478. [Google Scholar] [CrossRef] [Scilit]
- Davis, F.D. Technology acceptance model. Inf. Syst. Theory 1989, 205–219. [Google Scholar]
- Ajzen, I. The theory of planned behavior: Frequently asked questions. Hum. Behav. Emerg. Technol. 2020, 2, 314–324. [Google Scholar] [CrossRef] [Scilit]
- Al-Adwan, A.S. Drivers and barriers to MOOCs adoption. Educ. Inf. Technol. 2020, 25, 5771–5795. [Google Scholar] [CrossRef] [Scilit]
- Alamri, M.M. Investigating students’ adoption of MOOCs during COVID-19 pandemic. Sustainability 2022, 14, 714. [Google Scholar] [CrossRef] [Scilit]
- Ucha, C.R. Role of course relevance and course content quality in MOOCs acceptance and use. Comput. Educ. Open 2023, 5, 100147. [Google Scholar] [CrossRef] [Scilit]
- Altalhi, M. Toward a model for acceptance of MOOCs in higher education. Educ. Inf. Technol. 2021, 26, 1589–1605. [Google Scholar] [CrossRef] [Scilit]
- Altalhi, M.M. Towards understanding students’ acceptance of MOOCs. Int. J. Emerg. Technol. Learn. 2021, 16, 237–253. [Google Scholar] [CrossRef] [Scilit]
- Li, Y.; Zhao, M. Influencing factors of continued intention to use MOOCs. Front. Psychol. 2021, 12, 528259. [Google Scholar] [CrossRef] [Scilit]
- Meet, R.K.; Kala, D.; Al-Adwan, A.S. Factors affecting MOOC adoption in Generation Z. Educ. Inf. Technol. 2022, 27, 10261–10283. [Google Scholar] [CrossRef] [Scilit] [PubMed]
- Quinlan, J.R. Induction of decision trees. Mach. Learn. 1986, 1, 81–106. [Google Scholar] [CrossRef] [Scilit]
- Breiman, L.; Friedman, J.; Olshen, R.A.; Stone, C.J. Classification and Regression Trees; Chapman and Hall/CRC: Boca Raton, FL, USA, 2017. [Google Scholar]
- Likert, R. A technique for the measurement of attitudes. Arch. Psychol. 1932, 22, 1–55. [Google Scholar]
- Brownlee, J. Why One-Hot Encode Data in Machine Learning? Machine Learning Mastery, 30 June 2020.

Disclaimer/Publisher’s Note: The statements, opinions and data contained in all publications are solely those of the individual author(s) and contributor(s) and not of MDPI and/or the editor(s). MDPI and/or the editor(s) disclaim responsibility for any injury to people or property resulting from any ideas, methods, instructions or products referred to in the content. |
© 2026 by the authors. Licensee MDPI, Basel, Switzerland. This article is an open access article distributed under the terms and conditions of the Creative Commons Attribution (CC BY) license.