


Abstract
Computer-aided diagnosis (CAD) systems based on deep learning have shown significant potential for Alzheimer’s disease (AD) stage classification from Magnetic Resonance Imaging (MRI). Nevertheless, challenges such as class imbalance, small sample sizes, and the presence of multiple slices per subject may lead to biased evaluation and statistically unreliable performance, particularly for minority classes. In this study, a Vision Transformer (ViT)-based framework is proposed for multi-class AD classification using a Kaggle dataset containing 6400 MRI slices across four cognitive stages. A subject-wise data-splitting strategy is employed to prevent information leakage between the training and testing sets, and the statistical unreliability of near-perfect scores in underrepresented classes is critically examined. An ablation study is conducted to assess the contribution of key architectural components, demonstrating the effectiveness of self-attention and patch embedding in capturing discriminative features. Furthermore, attention-based visualization maps are incorporated to highlight brain regions influencing the model’s decisions and to illustrate subtle anatomical differences between MildDemented and VeryMildDemented cases. The proposed approach achieves a test accuracy of 97.98%, outperforming existing methods on the same dataset while providing improved interpretability. It supports early and accurate AD stage identification.
1. Introduction
Alzheimer’s disease (AD) is a brain disorder that causes atrophy of brain neurons, leading to cognitive impairment and dementia because it also affects memory cells. Nowadays, AD has become a worldwide cause of neurological decline that affects millions of elderly populations [1]. Recent estimations show that 416 million people in the world have cognitive impairment due to AD, and about 50 million of them are officially in the stage of AD. These statistics account for 22% of the total number of elderly people across the world [2]. AD has a progressive nature that causes more changes in the brain structure over time, and until now, there is no definitive cure for the disease. Consequently, early detection and accurate diagnosis are fundamental to understanding its stages in order to define pre-treatments for patients to slow its progression [3].
AD diagnosis primarily involves medical imaging scans obtained with various techniques like Magnetic Resonance Imaging (MRI), Diffusion Tensor Imaging (DTI), and positron emission tomography (PET), along with blood tests and psychological exams. The MRI method has been considered the most indicative assessment that shows changes in AD biomarkers like the hippocampus, cortical thickness, and ventricle enlargement, causing cognitive decline [4,5].
MRI technique provides high-quality images that help to identify neurological status in a safe manner because it is a non-invasive technique that does not use radiation. Initial machine learning studies on the detection of AD brain images adopted Support Vector Machines (SVMs) for classification and feature extraction to differentiate its different stages [6,7]. However, SVMs are not suitable for large datasets because they require a long training time, they are sensitive to noise, and a small number of mislabeled inputs can dramatically decrease their performance. Conventional classification methods like Naive Bayes [8], Decision Trees [9], and Random Forests [10] are also not suitable for the classification of medical images because they extract features manually, and hence, they give reduced accuracy in the characterization of complex, high-dimensional brain patterns. Along with SVMs, these techniques are suitable for structured data, while deep learning models are used for unstructured data. Consequently, they are susceptible to overfitting [11]. Convolutional Neural Networks (CNNs) appear to surpass these limitations. They have revolutionized medical imaging by increasing the detection performance and speeding up the learning process because they adopt automated feature extraction. They enhance early detection, prognosis, and neurological disorder monitoring where complex patterns are present [12]. Deep learning algorithms have progressed significantly in biomedical engineering, especially for medical image recognition, in accuracy and in the rate of processed tasks, including diagnosis, pre-processing, or early detection of anomalies. Current advances in deep learning have significantly improved training performance involving transfer learning and self-attention mechanisms. Transfer learning enhances the reliability to focus on classification tasks thanks to the fine-tuning of pretrained models on large datasets, and self-attention mechanisms lead models to address the main regions in the image that influence making the final classification decision. Combining these two approaches has enabled researchers to improve the accuracy in classification tasks like AD diagnosis.
Using global self-attention to detect long-range dependencies in images, Vision Transformers (ViTs) have become a potent substitute for CNNs in medical imaging. Their effectiveness across modalities is revealed by a thorough analysis of current applications. Hybrid ViT-CNN models reported up to 98% accuracy for COVID-19 detection in chest X-rays, outperforming pure CNNs on noisy data [13]. Swin Transformers achieved high sensitivity (up to 85% top-2 accuracy) via hierarchical feature extraction in retinal fundus images for diabetic retinopathy [14]. ViTs have demonstrated promise in AD-specific contexts; for example, lightweight ViT models classified AD stages with 98.57% accuracy on OASIS-3 datasets, while patch-based ViTs detected MCI conversion with 0.987 AUC [15].
However, the majority of ViTs rely on heavy pretraining like ImageNet-21k and ensemble strategies, resulting in high computational demands unsuitable for clinical settings with limited resources. These studies illustrate the shortcomings of lightweight, independent architectures for multi-stage AD classification using common Kaggle MRI datasets, but they also reveal ViTs’ improved accuracy over CNNs [16].
In this research, Vision Transformers (ViTs) are used to detect large-scale dependencies in input scans thanks to the combination of the pretrained ViT and the included self-attention mechanisms. This allows the model to identify patterns of the input images perfectly by working on the image patches, which enhances model performance to an outstanding metric [17].
In this work, we introduce a standalone architecture for a Vision Transformer for the classification of four stages of AD: MildDemented (MD), ModerateDemented (MoD), NonDemented (ND), and VeryMildDemented (VMD). The dataset was obtained from Kaggle, and it contains MRI images of human brains with and without AD biomarkers. The methodology adopted in this work is detailed as follows:
- •
- A new configured ViT architecture is proposed for the classification of four stages of AD using MRI scans, achieving less computational complexity and increased accuracy.
- •
- Adopted proper data augmentation functions and accurate pre-processing steps of input data to give the model a higher level of efficiency in training and testing.
- •
- Multiple performance metrics are used to evaluate the model, and a comparison between this ViT architecture and other state-of-the-art works was developed to explore its benefits and limitations over other architectures.
- •
- This configuration of ViT achieves outstanding performance, and it allows early-stage detection of AD anomalies before cognitive decline appears, using only MRI brain scans. This model gives promising results that improve clinical integration.
- •
- The issue of class imbalance among the four AD stages is explicitly addressed through a stratified training strategy and performance analysis, with particular attention to the statistical reliability of minority classes.
- •
- The challenge of differentiating visually similar stages, especially MildDemented (MD) and VeryMildDemented (VMD), is investigated using attention-based visualization maps and an ablation study to justify the model’s ability to focus on discriminative brain regions and subtle structural differences.
2. Related Works
Various approaches have been proposed to classify AD into several stages using MRI brain images. Some of them have explored the effectiveness of ViTs regarding CNNs in terms of performance metrics and complexity [18,19,20,21].
Using MRI data, Carcagni et al. [22] looked into enhanced automatic Alzheimer’s disease detection. They used a typical computer-aided diagnosis process that included slice extraction, categorization, and picture registration. For the first time, to their knowledge, they evaluated two transformer-based models (MAE and DeiT) and three sophisticated Convolutional Neural Network designs (ResNet, DenseNet, and EfficientNet) for clinical diagnosis prediction. The publicly accessible ADNI and OASIS datasets were used for all tests, and different benchmarking conditions were created by altering the number of slices per individual that were obtained from 3D MRI volumes. The findings demonstrated that even when noise increased by using additional slices, the transformer models, particularly DeiT, achieved the greatest and most reliable performance.
Mehmood et al. [23] proposed a new optimizer configuration integrated with ViT for the detection of AD using two different Alzheimer’s Disease Neuroimaging Initiative (ADNI) datasets (ADNI-1 and ADNI-2). The adopted optimizer decreased the loss dramatically and enhanced the convergence stability of the whole ViT model by 0.8–2.1% regarding state-of-the-art architectures, achieving 99.84% accuracy on Dataset-1 and 95.75% on Dataset-2.
Lu et al. [24] introduced a new computer-aided diagnosis (CAD) system that integrates ViT using self-attention mechanisms to enhance early detection of AD. The system was named RanCom-ViT, and it tested multiple MRI datasets to prove its efficiency. The system adopted a new configured token compression module and a classification head with a random-vector functional-link structure to ameliorate performance. Overall accuracy across all the tested datasets was 99.54%.
Huang and Li [25] proposed a Resizer Swin Transformer (RST), a ViT-based model that proves its efficiency in training natural datasets without pre-processing or with a few pre-processing functions, and it achieved good results with 99.59% average accuracy on the ADNI dataset and 94.01% average accuracy on the AIBL dataset.
Shin et al. [26] trained ViT on an 18F-Florbetaben positron emission tomography (PET) dataset. Accuracies are 68.93% and 64.29% using original data for binary classification and multi-classification, respectively, and 76.89% and 77.78% using augmented data for binary classification and multi-classification, respectively.
Bortty et al. [27] integrated ViT-B16 with three Convolutional Neural Networks (CNNs), VGG19, ResNet152V2, and EfficientNetV2B3, into an ensemble learning model, and trained it on the OASIS MRI dataset to differentiate AD images from normal control images. The combination was achieved using a weighted average approach using the Grasshopper optimization algorithm, and the best accuracy was 97.31%.
Khatri and Kwon [28] differentiated mild cognitive impairment (MCI) from AD using ViT and self-supervised learning (SSL) on a fluorodeoxyglucose positron emission tomography (18F-FDG-PET) dataset. The best obtained accuracy was 92.31%.
Odusami et al. [29] adopted data fusion of MRI and PET images using a discrete wavelet transform (DWT) to analyze the data and a pretrained VGG16 to optimize the combination. Next, the inverse discrete wavelet transform (IDWT) was used to reconstruct the final images to be trained via ViT. The testing dataset was extracted from ADNI, and the best accuracy was 93.75% for AD vs. Early MCI (EMCI) using PET scans.
Joy et al. [30] classified five stages of AD: Cognitively Normal (CN), EMCI, Late MCI (LMCI), MCI, and AD, using the ViT architecture of Google with some modifications. 1296 images are acquired from ADNI, pre-processed, augmented, and trained using ViT, achieving a remarkable accuracy of 99.98%.
Shaffi et al. [31] introduced the combination of multiple ViTs into one model to detect AD using ADNI and OASIS datasets. In this work, we proposed an ensemble of ViT architectures for the task of AD classification. The ensemble ViTs showed a 2% advance over single ViT models. The highest accuracy was 99.29%.
3D brain volumes are also explored in training, validation, and testing for AD classification using ViT [32]. Kunanbayev et al. [33] studied the feasibility of ViT on a small dataset of 3D brain volumes after pre-processing and data augmentation. Promising results are shown.
Jomeiri et al. [34] proposed a new approach called the Regional Attention-Enhanced Vision Transformer (RAE-ViT) trained on structural MRI (sMRI) images obtained from the ADNI database. RAE-ViT takes advantage of self-attention mechanisms, focusing on the AD biomarker regions along with new integrated multi-scale feature extraction options to enhance the influence of generic structural patterns. The best accuracy was 94.2%.
Yan et al. [35] demonstrated that the Hybrid-RViT architecture, combining ResNet-50 and ViT, outperforms many models on the detection of AD with high performance. MRI images are fed to the ResNet-50 model for feature extraction; the extracted features are transmitted to ViT in the form of patches to complete the classification process. The model gives accuracies of 97% and 95% for training and testing, respectively.
Huang and Qiu [36] proposed a new strategy using Monte Carlo sampling and a single ViT learner on the ADNI and OASIS datasets of MRI scans. It adopts 3D inter-feature correlations to enhance performance. The approach called Monte Carlo Ensemble Vision Transformer (MC-ViT), achieved an accuracy of 90%.
Odusami et al. [37] adopted data fusion from ADNI, OASIS, and Whole Brain Atlas (AANLIB) using a Pareto-optimal cosine color map to classify AD into four stages using ViT. The best testing accuracy was 99.25% for the binary class AD/CN.
3. Methodology
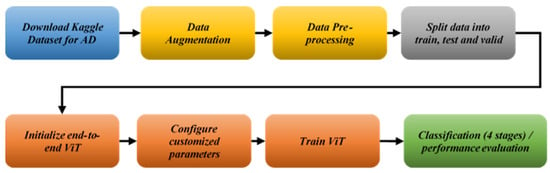
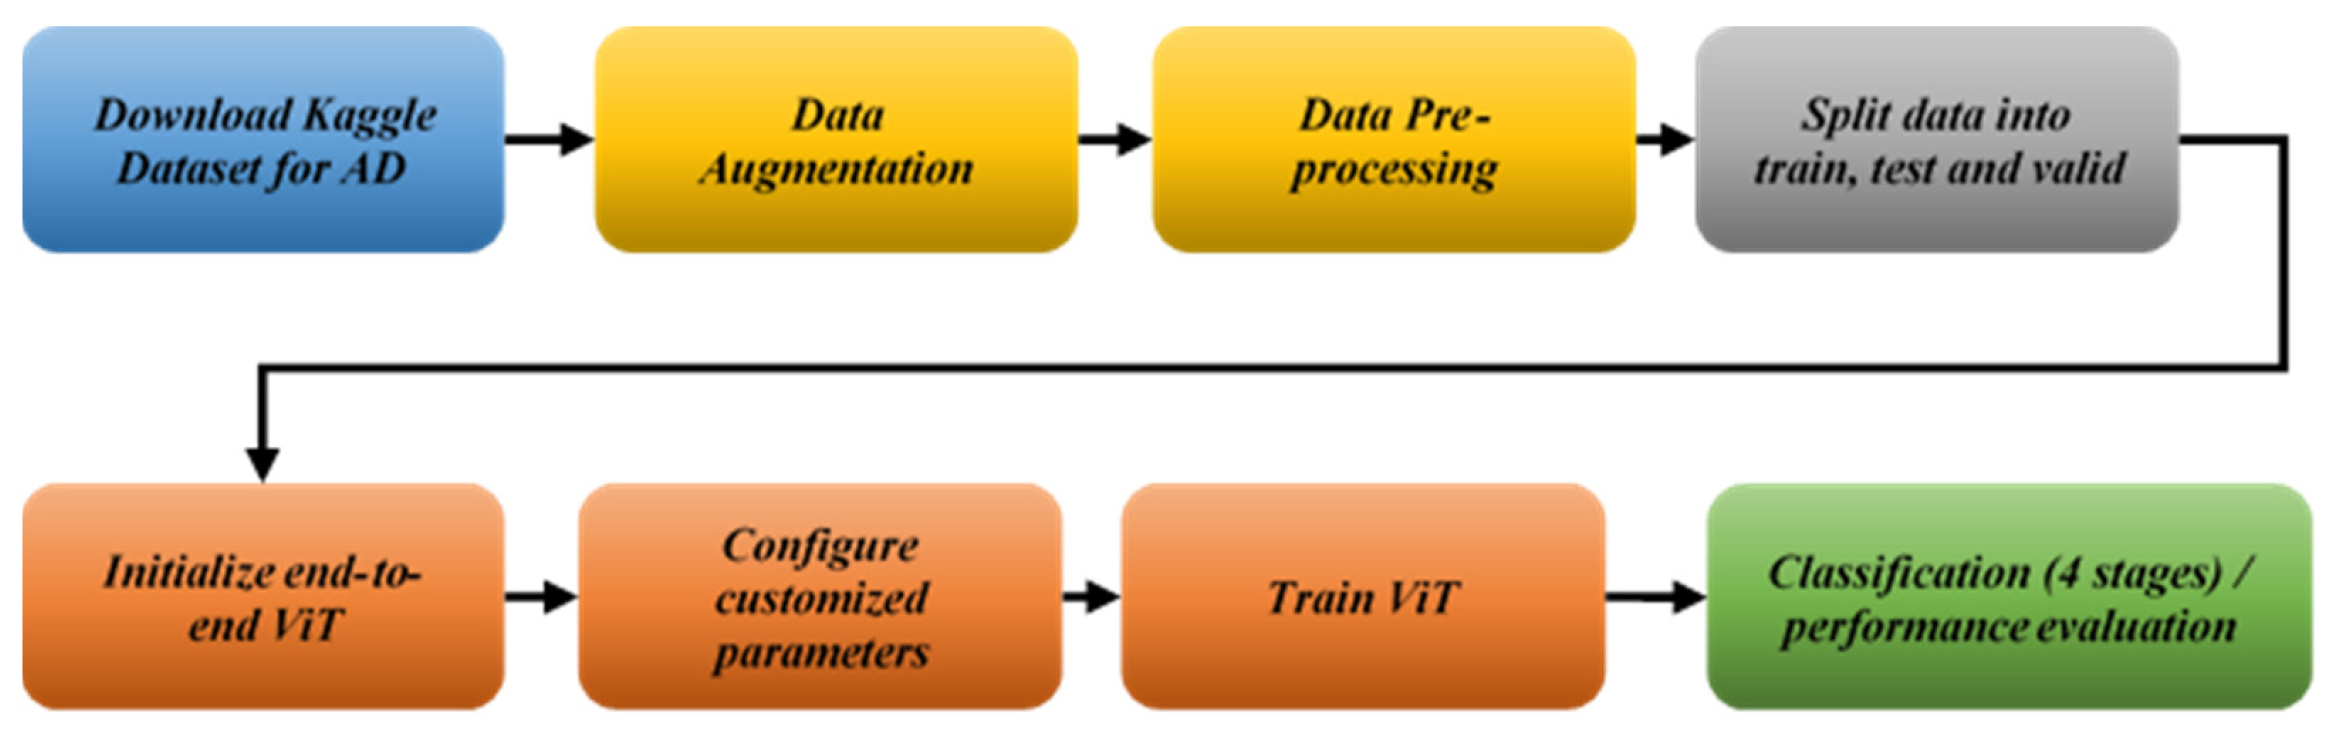
The proposed methodology includes a flowchart describing the classification process from data acquisition to evaluation metrics. The pipeline uses the Kaggle dataset for AD MRI scans of four classes for the early detection and classification of AD with outstanding performance.
Figure 1 shows the principal tasks of our strategy. The approach involves the integration of a fine-tuned ViT trained on MRI images for AD patients to enhance early detection, evaluation using performance metrics and comparison with state-of-the-art works using popular machine learning algorithms like CNNs, Support Vector Machines (SVMs), or transfer learning. MRI images are pre-processed and augmented using appropriate data augmentation methods before passing to training, with the goal of enhancing the accuracy of the ViT model.
Figure 1.
The proposed pipeline.
3.1. Dataset Description and Pre-Processing
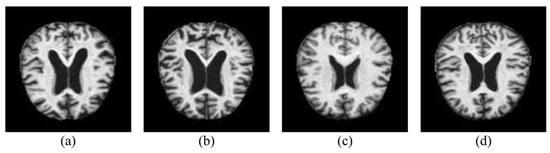
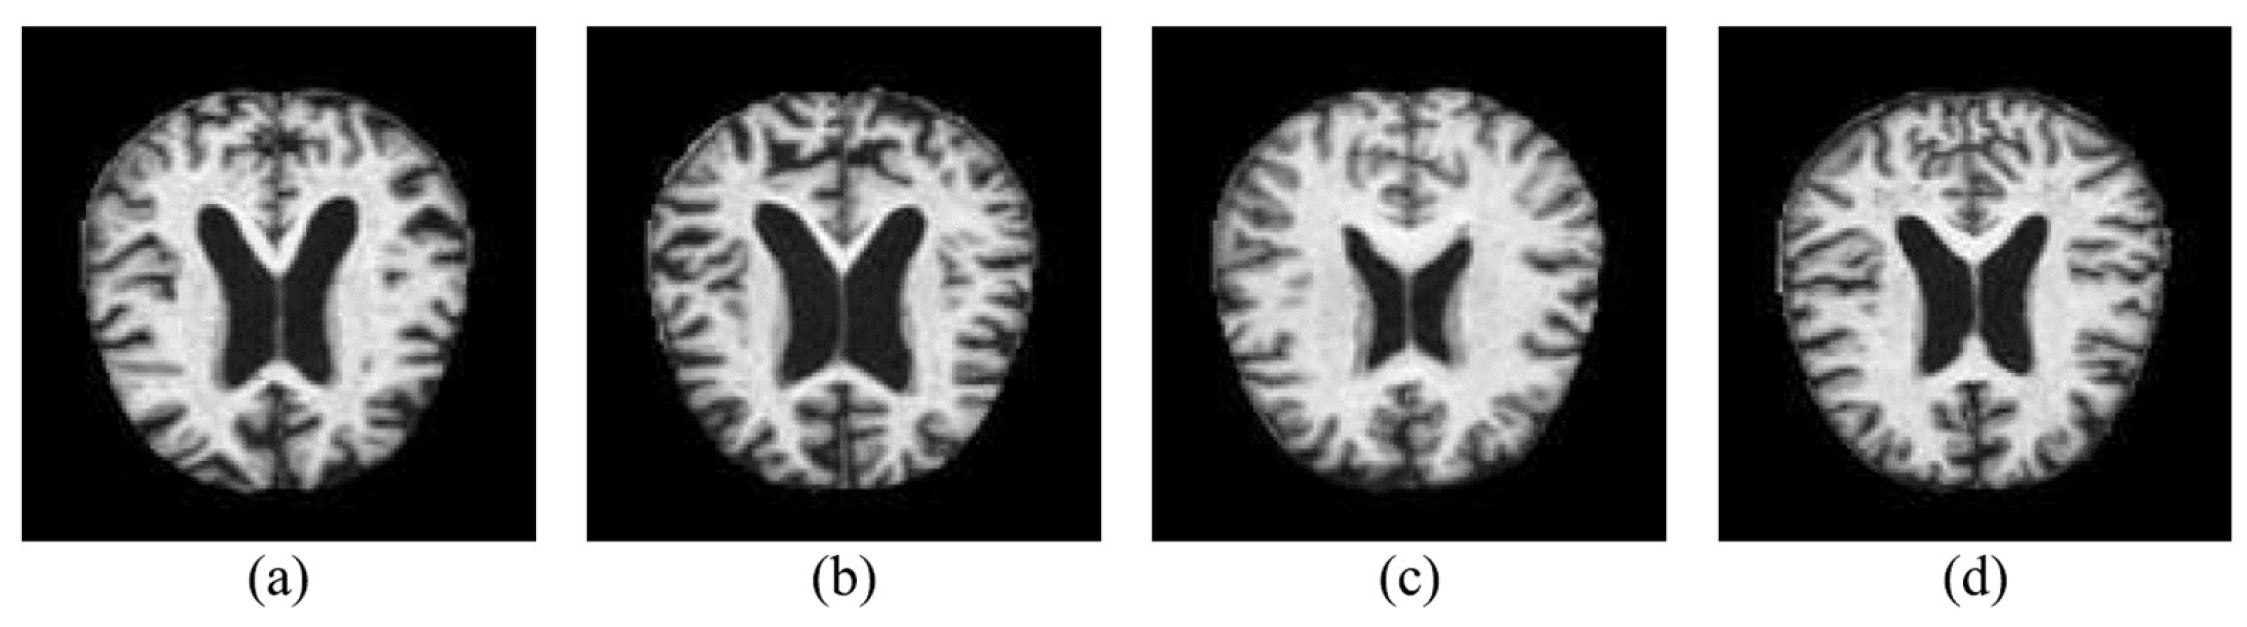
In this experiment, the AD MRI dataset from Kaggle was used [38]. The 6400 pre-processed MRI scans are divided into four categories: ND, MD, MoD, and VMD. From 200 patients, 32 horizontal brain slices are obtained. Before normalization, all scans were resized to 128 × 128 pixels from their original dimension of 176 × 208 pixels. Eighty percent of the original dataset was used for training, and twenty percent was set aside for the test set. Validation uses 25% of the training set. The dataset distribution is shown in Table 1, and example brain MRI pictures for each group are shown in Figure 2.
Table 1.
Dataset distribution.
Figure 2.
The Alzheimer’s MRI dataset’s classes: There are four types of dementia: (a) mild, (b) moderate, (c) non-demented, and (d) very mild.
Because the Kaggle MRI dataset is publicly available and contains a large number of records within a relatively small size (approximately 36 MB), it was selected over alternative sources. Moreover, its limited size allows the proposed contribution to be evaluated in isolation, particularly with respect to handling data imbalance and robustness against overfitting. Although the dataset is inherently imbalanced—especially for the MD and MoD classes, which together account for only about 15% of the total samples—it provides a suitable testbed for assessing these challenges.
A Keras Sequential pipeline is used for data pre-processing and augmentation for the Kaggle Alzheimer’s MRI dataset to guarantee ViT compatibility and correct class imbalance across four phases of AD. Hippocampus/cortical biomarkers are preserved by scaling to 128 × 128 pixels after normalization, which standardizes pixel values (zero mean, unit variance). To imitate clinical variances without anatomical distortion, augmentation comprises symmetric zoom (20%), limited rotation (1.15 max via factor = 0.02), and horizontal flip (50% chance, exploiting brain symmetry). This method successfully oversamples minority classes (ModerateDemented, VeryMildDemented).
3.2. Model Architecture and Vision Transformer Setup
3.2.1. Vision Transformer (ViT) Mathematical Formulation
The proposed model is based on a Vision Transformer (ViT) architecture adapted for images of size . The image is, firstly, divided into non-overlapping patches of size , resulting in
where each flattened patch . A linear projection layer embeds each patch into a dimensional latent space using
where is the learnable embedding matrix. A learnable class token is prepended to the sequence, and learnable positional embeddings are added to incorporate spatial information.
The resulting sequence is processed by transformer encoder layers. Each layer consists of a layer normalization step followed by multi-head self-attention (MHSA). For each head , the queries, keys, and values are computed as
with . Scaled dot-product attention was applied through
The outputs of all heads are concatenated and projected using , followed by a residual connection. A second layer normalization is then applied and passed through a two-layer feed-forward network (MLP) with an expansion factor of 2:
Another residual connection produces the final output of each transformer layer. After the last encoder layer, the class token representation is extracted and normalized. A three-layer classification head is applied:
where the final output (with classes) is passed through a softmax function to obtain class probabilities.
The network contains a total of trainable parameters, distributed across the patch-embedding layer, positional embeddings, transformer encoder stack, and classification head. The model is trained using a cross-entropy loss:
and optimized with AdamW:
3.2.2. Proposed ViT Model Description
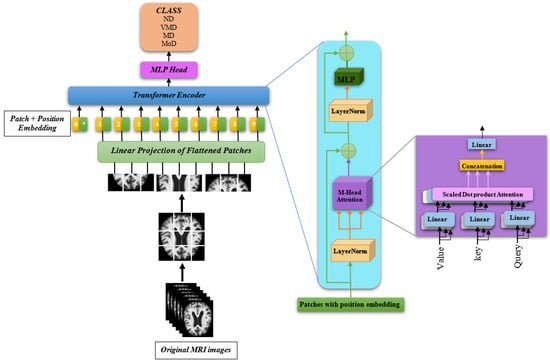
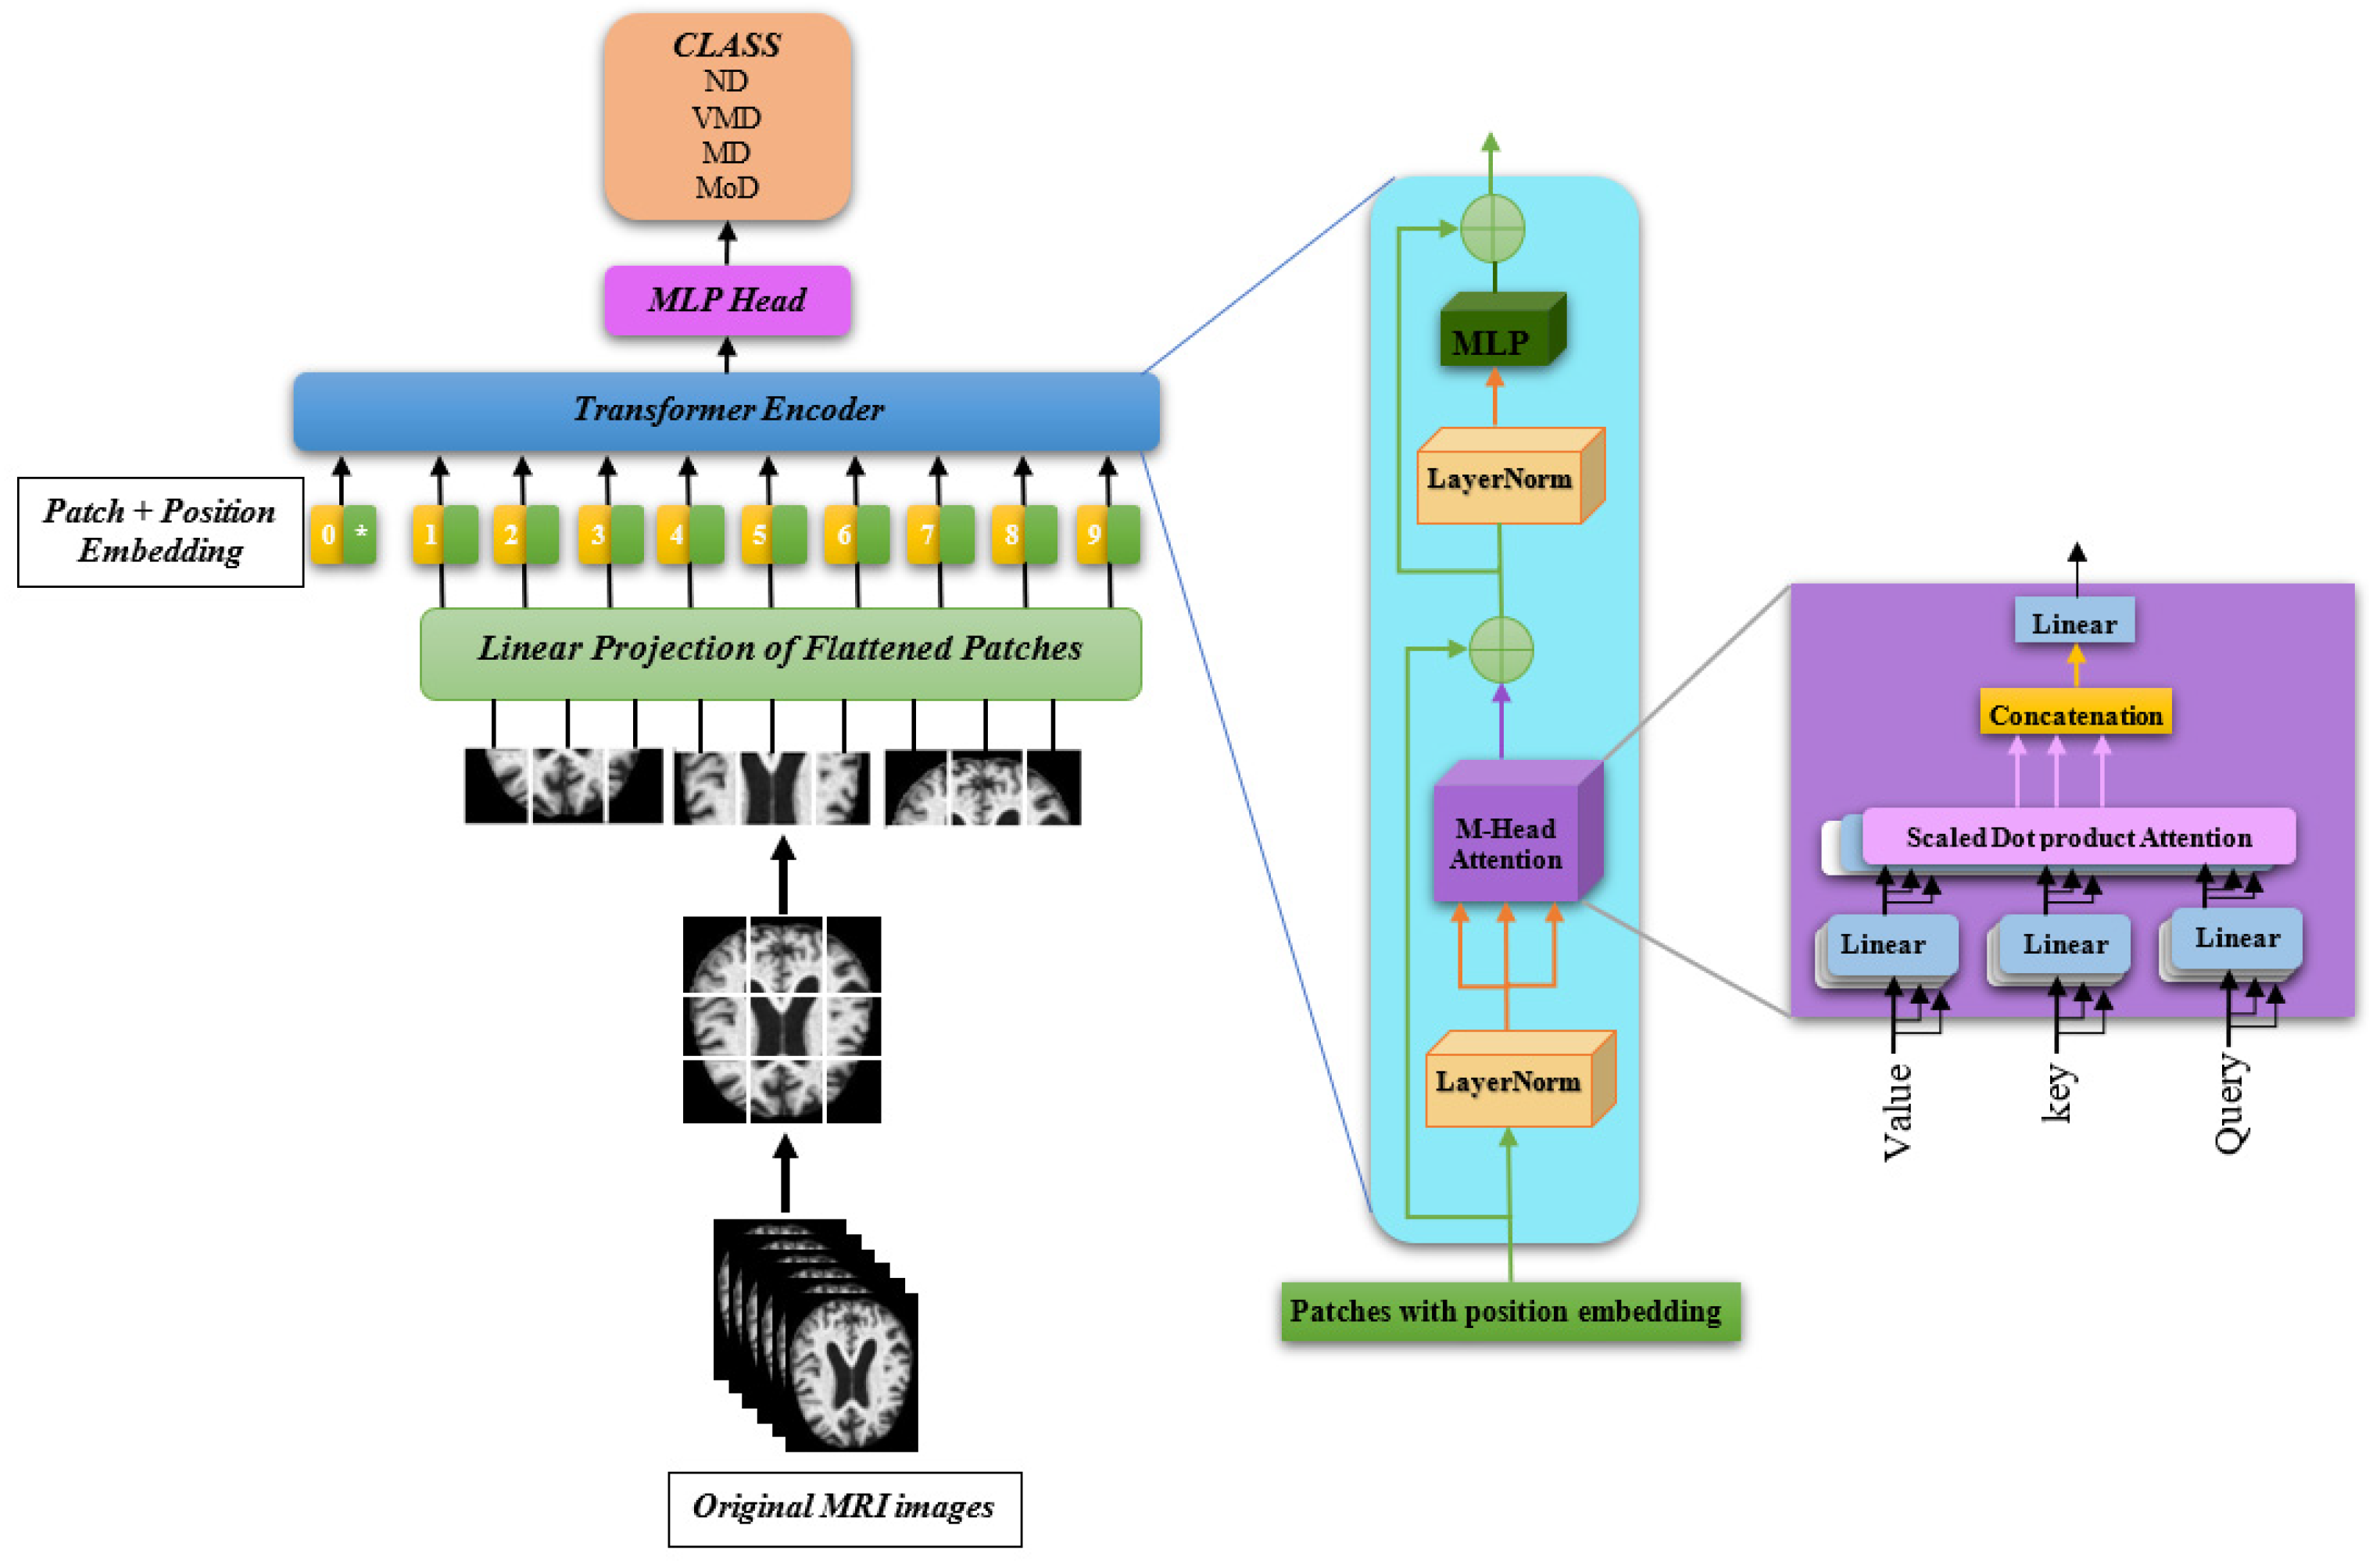
Like Transformers handle text, the Vision Transformer (ViT) architecture (Figure 3) used for Alzheimer’s disease classification from MRI images employs a sequence-to-sequence transformation technique that considers images as sequences of patches. The design begins with a 128 × 128 × 3 input MRI scan that undergoes several pre-processing stages, including normalization, scaling, and data augmentation (random flips, rotations, and zooms) to boost the model requirement.
Figure 3.
Illustration of the proposed ViT architecture. The symbol * denotes the learnable class token, which is prepended to the sequence of patch embeddings and whose output representation is used for final classification through the MLP head.
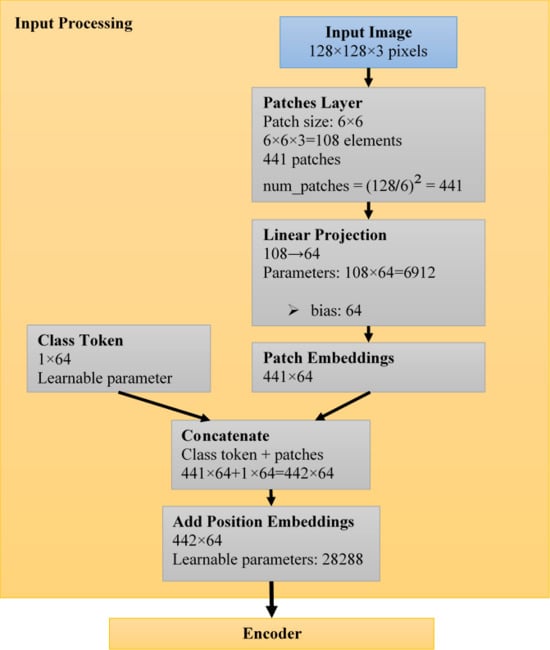
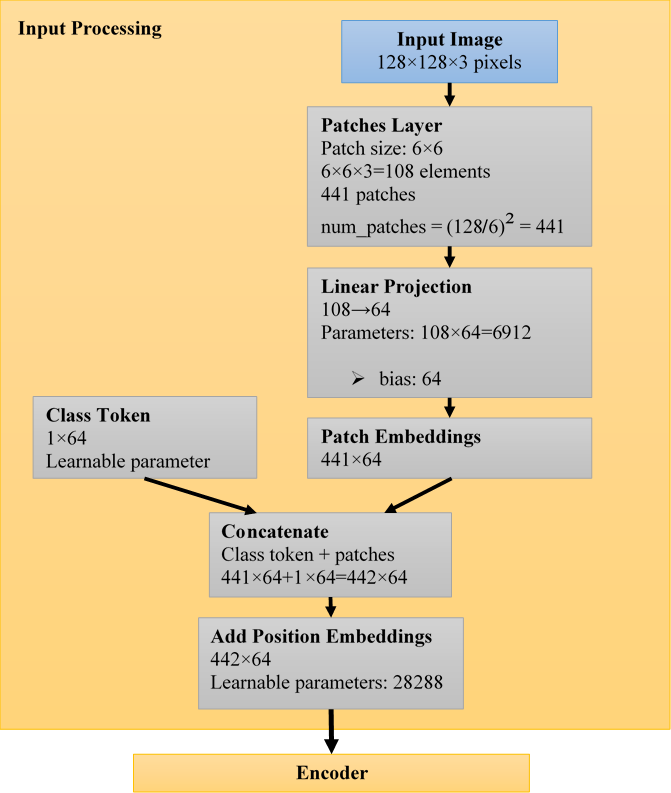
Inspired by the [CLS] token in BERT for natural language processing, the Vision Transformer architecture adds a learnable class token to the patch-embedding sequence [39]. In particular, a single learnable embedding vector of identical dimension 64 is concatenated at the start of the patch sequence after the input image is divided into fixed-size patches (6 × 6 pixels, yielding 441 patches) and projected into 64-dimensional embeddings through linear transformation (Figure 4). Position embeddings are then added to this combined representation of 442 tokens (1 class token + 441 patch tokens) in order to maintain spatial information [40].
Figure 4.
Proposed ViT architecture: Input processing.
This class token engages in bidirectional interactions with all patch tokens throughout the self-attention levels of the transformer encoder, allowing it to accumulate global contextual information from the entire image. Only this class token, now enhanced with extensive image-level features, is finally extracted after processing through the multi-layer transformer blocks and sent through the multi-layer perceptron classification head, where it is mapped to the four Alzheimer’s disease severity categories. This eliminates the need for extra pooling operations while preserving architectural elegance and efficacy.
The patch extraction mechanism is the main innovation. Since 128/6 = 21.33 is rounded to 441 patches when squared, the input image is segmented into 441 non-overlapping 6 × 6 patches, each with 108 pixels (6 × 6 × 3 color channels). A trainable projection layer is used to linearly project these patches into 64-dimensional embeddings. A 442 × 64 tensor (441 patches + 1 class token) is produced by appending a unique learnable “[class]” token to this sequence and adding position embeddings to preserve spatial information.
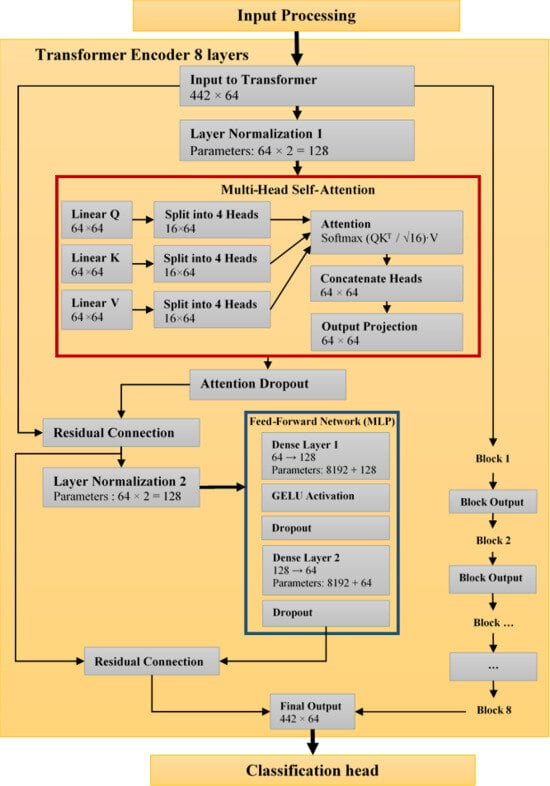
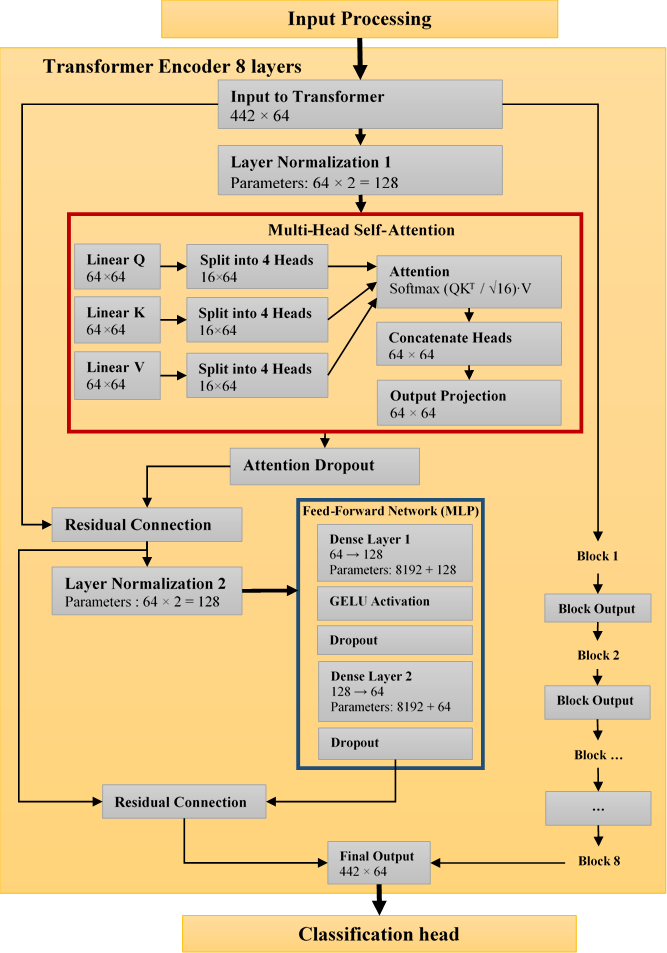
Each of the eight identical layers that make up the transformer encoder has two primary subcomponents (Figure 5). First, the model can learn associations between various patches thanks to multi-head self-attention with four heads. Each attention head uses query, key, and value projections to calculate scaled dot-product attention. Dropout for regularization comes after the attention mechanism. Second, the 64-dimensional features are expanded to 128 dimensions and then back to 64 using a two-layer MLP with GELU activation, with dropout added after each layer. A stable training environment is produced by using residual connections and wrapping both subcomponents in layer normalization.
Figure 5.
Proposed ViT architecture: Encoder.
The patch construction generates [batch,108,441] representations that are linearly projected to [batch,64,441] embeddings, starting with [batch,3,128,128] input tensors. The sequence becomes [batch,64,442] when the class token and position embeddings are added. This dimensionality is maintained across all 8 transformer blocks using residual connections. While MLP expansions momentarily raise dimensionality to [batch,128,442] before returning to [batch,64,442], multi-head attention works on [batch,64,442] tensors within each block. The class token at position 0 is extracted as [batch,1,64] for classification. It is then gradually converted through MLP layers to [batch,1,2048], [batch,1,1024], and [batch, 4] probability outputs. Through the sequence structure, this dimensional progression maintains spatial linkages while facilitating hierarchical feature learning.
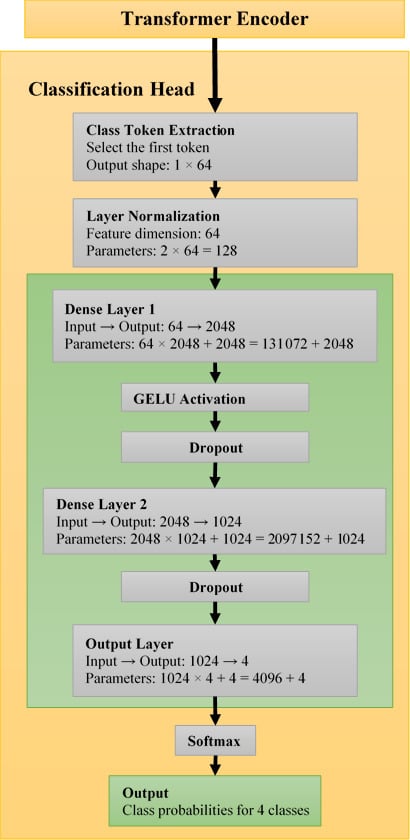
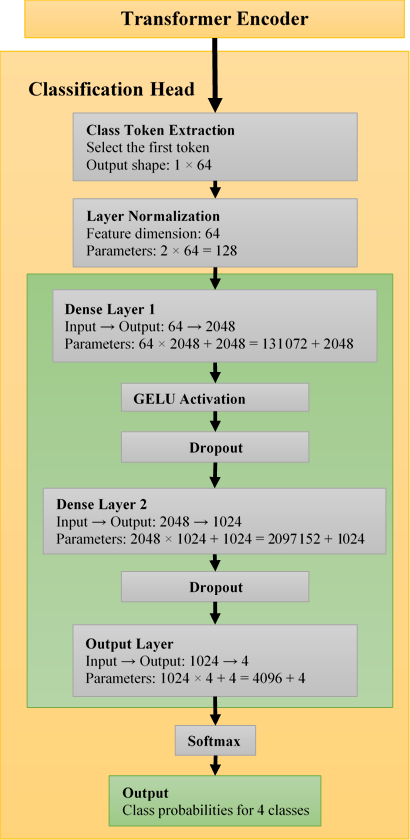
The class token embedding, now enhanced with global picture context, is retrieved and sent to a specific classification head following processing through all transformer levels. This comprises a multi-layer perceptron with dimensions 64 to 2048 to 1024 to 4 after layer normalization. The last layer creates probability distributions for each of the four Alzheimer’s severity classes: MildDemented, VeryMildDemented, NonDemented, and ModerateDemented using SoftMax activation.
Position embeddings account for 28,288 parameters (442 × 64), whereas the patch-embedding layer adds 6976 parameters (108 × 64 + bias). There are roughly 112,288 parameters in each transformer block, 98,432 in QKV projections, 32,832 in output projections, and 65,664 in each MLP layer, for a total of about 898,304 parameters spread over eight blocks. At about 2,238,208 parameters, the classification head predominates, mostly from the 2048 × 1024 dense layer (2,098,176 parameters). The total comes to about 3.2 million parameters with additional layer normalization parameters (128 in the head and 2048 across transformer blocks) (Figure 6). The architecture’s focus on categorization capability while preserving effective patch processing is seen in this distribution.
Figure 6.
Proposed ViT architecture: Classification head.
The 128 × 128 input resolution balances detail retention with computational efficiency, while the 6 × 6 patch size creates 441 patches that provide sufficient granularity for medical image analysis. The 64-dimensional embedding space and 4 attention heads enable effective feature representation and relationship learning. With 8 transformer layers providing adequate depth for complex pattern recognition, the [64,128] MLP dimensions in each block and [1024,2048] dimensions in the classification head create hierarchical feature abstraction. Trained over 1000 epochs with a batch size of 16, the architecture employs AdamW optimization with a 0.0001 learning rate for stable convergence (Table 2). These carefully selected hyperparameters, particularly the transformer depth and attention mechanisms, enable the model to capture both local features within patches and global contextual relationships between them, making it particularly suitable for medical image analysis, where subtle patterns across different image regions contribute to accurate Alzheimer’s severity classification.
Table 2.
Key configuration parameters of the ViT system.
3.3. Evaluation Metrics
We assessed the model using F1-score, Accuracy, Precision, and Recall measures.
- •
- Accuracy: Calculates the percentage of accurate predictions to assess the model’s overall performance.
- •
- Precision: Indicates the frequency with which the model accurately detects affirmative cases. This is computed as the percentage of genuinely positive forecasts among all the positive predictions made by the model.
- •
- Recall (Sensitivity): Indicates how well the model detects every genuine positive instance. This is determined by dividing the total number of potentially overlooked positive cases by the percentage of real positive cases that the model correctly detects.
- •
- F1-Score: Provides a fair assessment of the model’s performance by combining precision and recall into a single score. It takes into account how well the model detects real positives and prevents false positives.
TP stands for true positives, TN for true negatives, FP for false positives, and FN for false negatives.
4. Results and Discussion
4.1. Experimental Setup
TensorFlow 2.15.0 running in Python 3.12 and the Keras API were used to implement the simulation tests of the ViT model. The simulation environment was Google Colab Pro, which was set up with an NVIDIA GPU T4 accelerator with 150 GB of GPU memory and 51 GB of system RAM. Ubuntu 20.04 (x64) was the operating system used by Google Colab Pro. The model was trained for 1000 epochs because convergence analysis showed that both training and validation losses stabilized and no further performance improvement was observed beyond this point, ensuring reliable learning without overfitting.
4.2. Results
A multi-class dementia classification dataset comprising four categories (NonDemented, VeryMildDemented, MildDemented, and ModerateDemented) was used to assess the suggested Vision Transformer (ViT) model. Strong learning stability and excellent classification performance are shown by the model in every class.
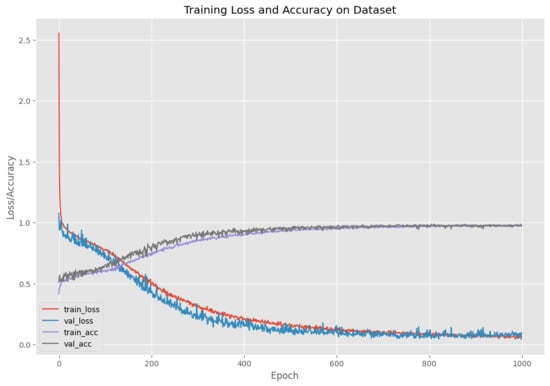
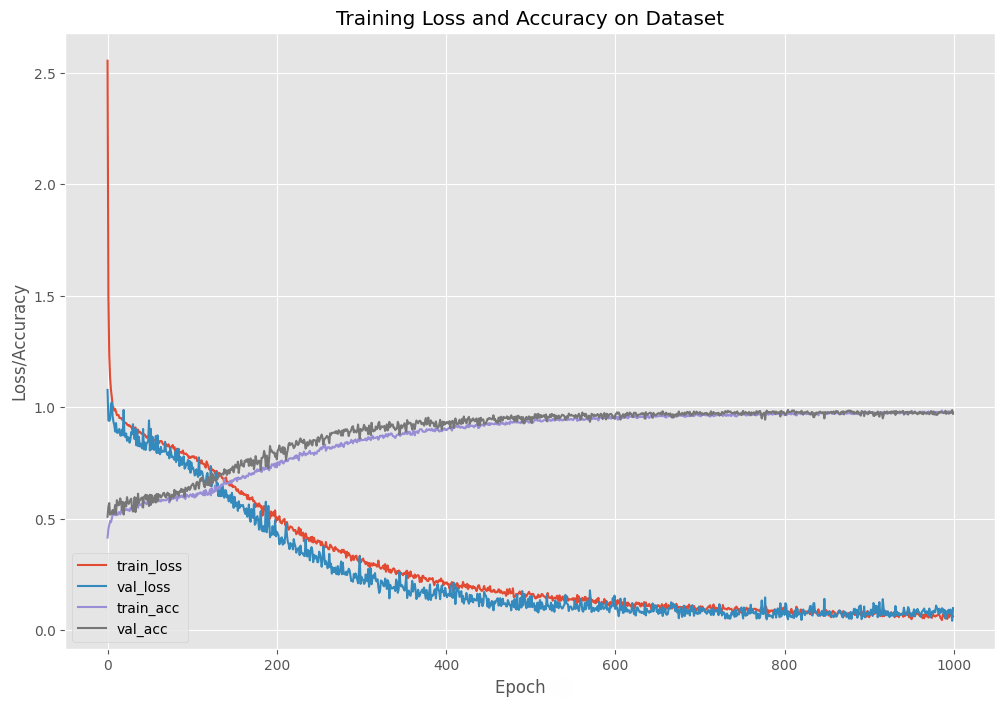
Figure 7 illustrates how the validation loss stabilizes at 0.12 after almost 600 epochs, indicating successful learning without appreciable overfitting, while the training loss gradually drops from the starting value, converging towards about 0.10. The accuracy curves for training and validation also steadily increase, approaching 98%. The transformer architecture’s ability to generalize on this dataset is confirmed by the two curves’ smooth progression.
Figure 7.
Training and validation curves.
Excellent predictive capacity is demonstrated by the final evaluation on the held-out test set, which produces a test loss of 0.06 and a test accuracy of 97.98%. Table 3 provides a summary of the specific classification metrics. With F1-scores ranging from 0.97 to 1.00, performance is consistently strong across classes. The resilience of the learnt feature representations is demonstrated by the ModerateDemented class, which is classified with excellent precision, recall, and F1-score despite having a relatively small sample size (7 images).
Table 3.
Classification report.
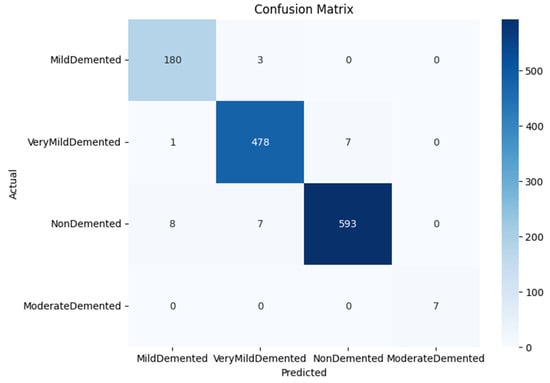
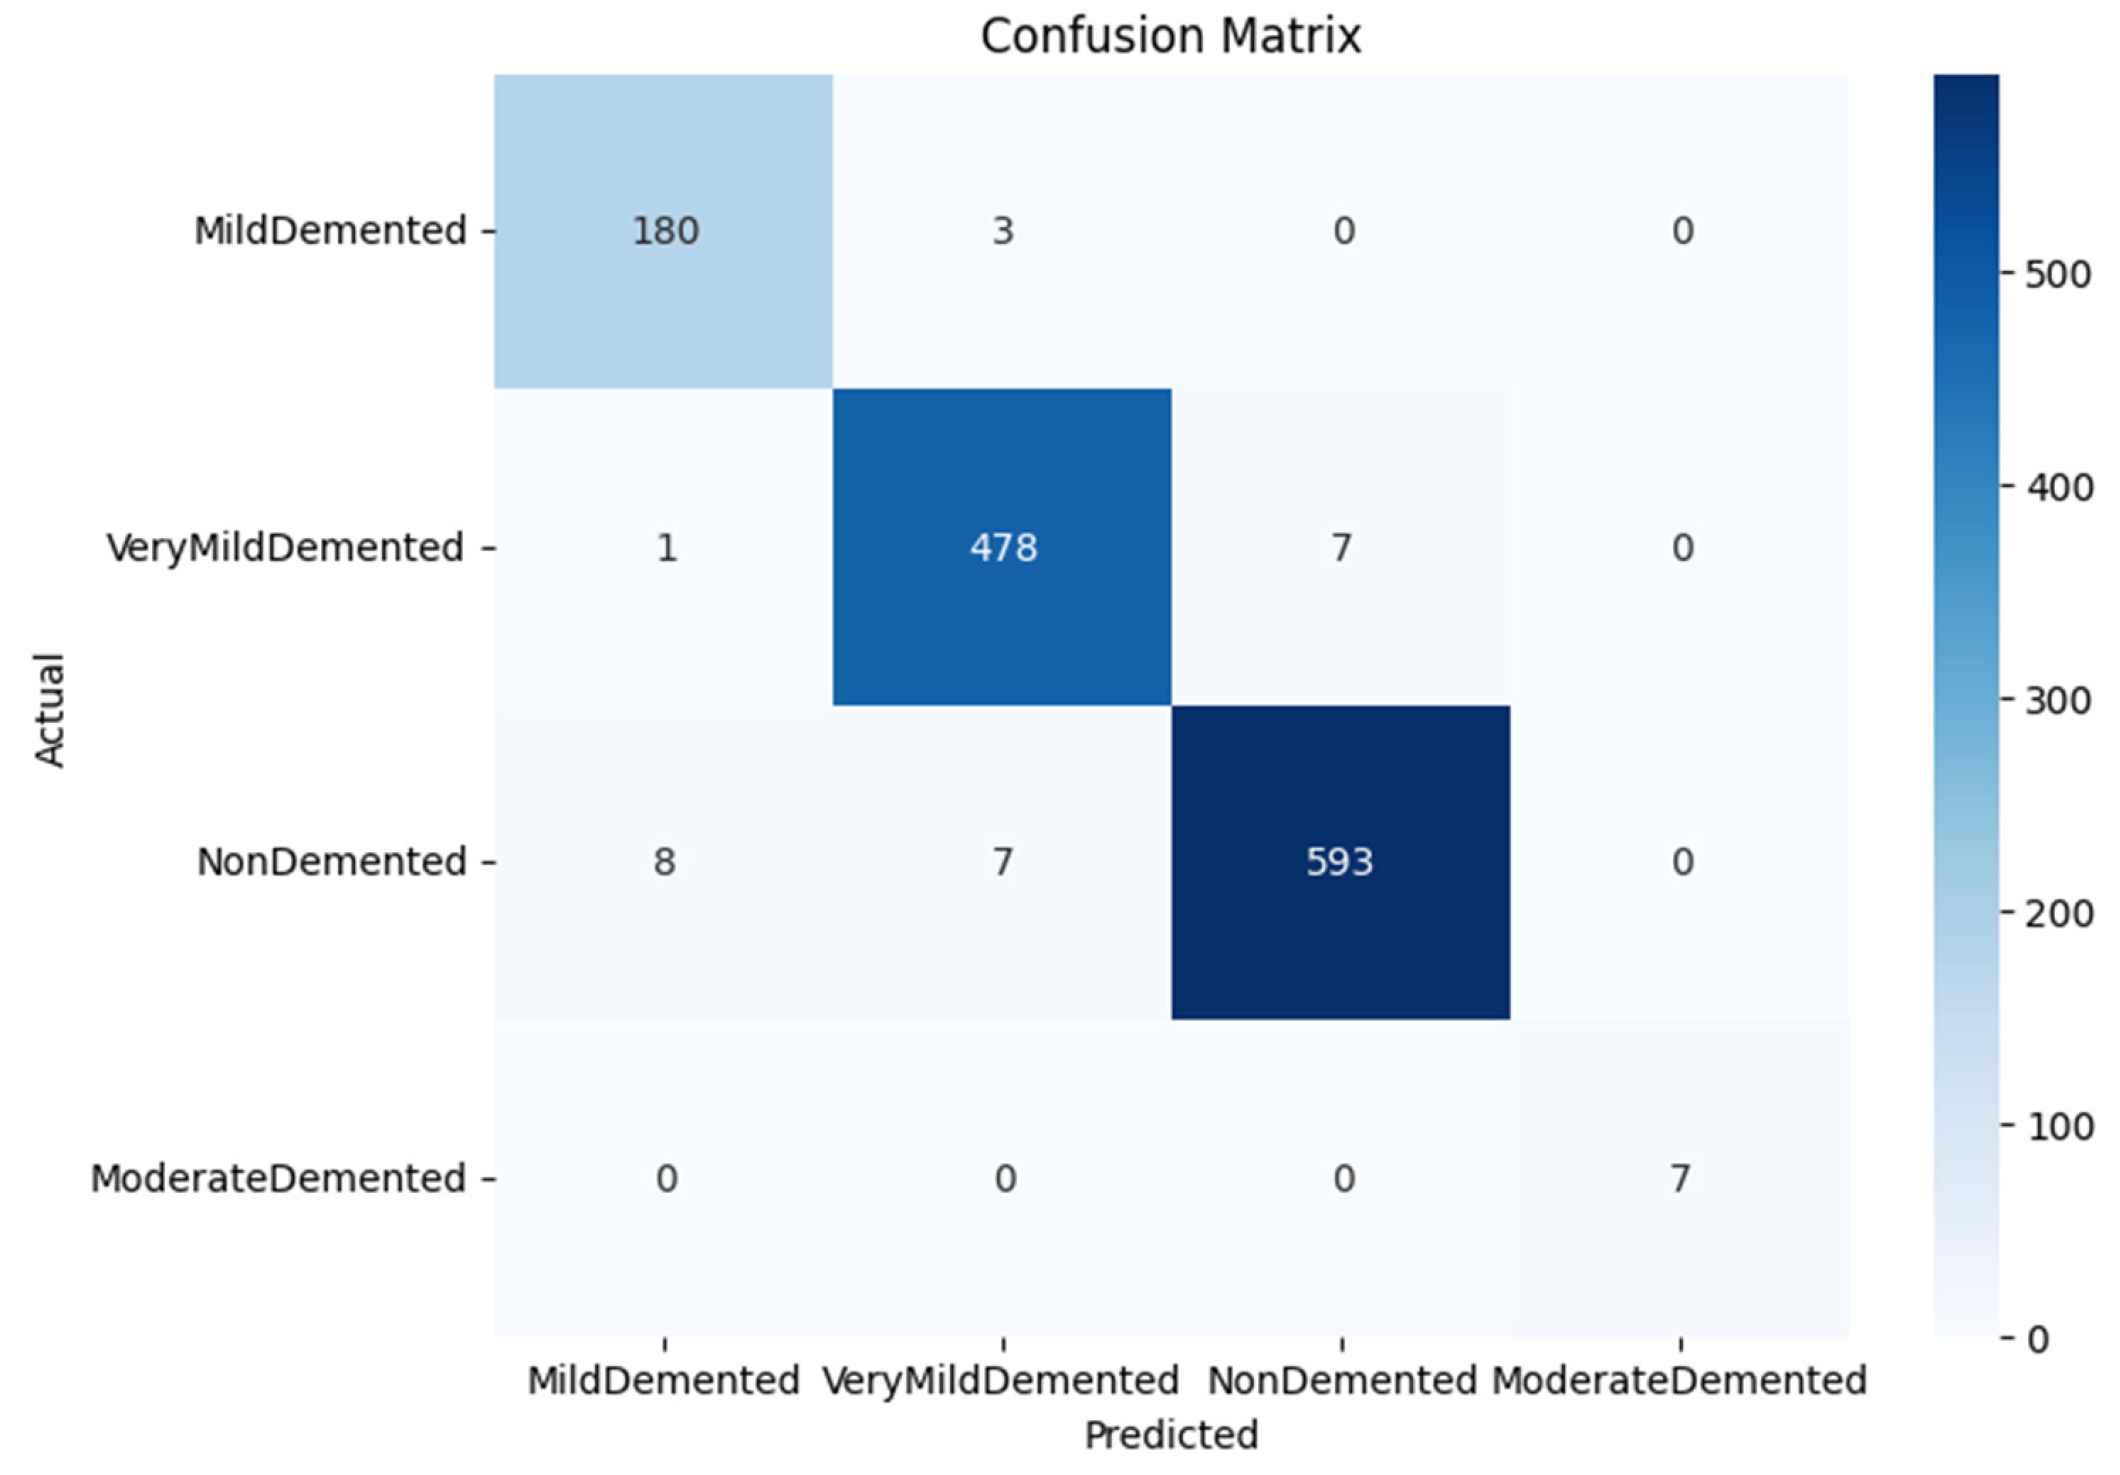
There are a few misclassifications, according to the confusion matrix (Figure 8). The classes with the greatest sample sizes and the highest prediction accuracy (593/608 and 478/486 correct predictions, respectively) are NonDemented and VeryMildDemented. Due to their comparable visual patterns on MRI scans, MildDemented and VeryMildDemented are typically misclassified. These mistakes, however, are small and have little impact on overall performance. Crucially, the ModerateDemented class is not misclassified.
Figure 8.
Confusion matrix of the four-class dementia classification.
The suggested ViT model performs well in spite of the dataset’s clear class imbalance, especially for the ModerateDemented class, which only has 64 images. This is explained by the Transformer architecture’s self-attention mechanism, which prioritizes globally relevant features over local patterns. Stable convergence without bias towards majority classes was further facilitated by efficient data pre-processing and implicit regularization through extensive training. The model successfully learnt discriminative representations even from a few samples, as evidenced by the perfect precision and recall attained for the ModerateDemented category, underscoring its applicability to imbalanced medical imaging datasets.
The ViT model outperforms several conventional CNN-based baselines documented in related research, exhibiting strong discriminative ability in identifying minute variations in dementia severity levels. When it comes to identifying global spatial dependencies in MRI images, the attention mechanism seems to be very successful. High precision across all classes and consistently low training and validation loss indicate that the model resists overfitting even with prolonged training. The model’s exceptional performance on minority classes demonstrates its capacity to generalize even with small sample sizes, which is an advantage for applications involving medical imaging.
4.3. Ablation Study
The impact of important training and architectural elements on the performance of the suggested Vision Transformer (ViT) model, for Alzheimer’s disease stage categorization, is methodically examined in the ablation study in Table 4. First, a test accuracy of 97.59% with a loss of 0.18 is obtained by eliminating data augmentation (no DA). The increase in loss relative to the suggested model (0.06) leads to worse generalization and a greater susceptibility to overfitting, even though the accuracy is still excellent. This demonstrates that by exposing the model to a greater variety of anatomical changes and imaging settings, data augmentation plays a critical role in improving robustness. Second, performance drastically deteriorates when the learning rate is increased to 0.001 without data augmentation, with accuracy falling to 50.62% and loss increasing to 1.04. This shows that, especially for transformer-based architectures that depend on fine-grained weight updates, an overly high learning rate leads to unstable optimization and impedes proper convergence. Third, accuracy is marginally increased to 98.05% with a decreased loss of 0.11 when a batch size of 64 (no DA) is used. This implies that while bigger batch sizes yield more stable gradient estimates, the lack of augmentation still restricts generalization, as evidenced by the increased loss in comparison to the suggested setup. Fourth, an accuracy of 97.59% and a loss of 0.12 are obtained when the number of transformer layers is reduced to four. The higher loss suggests that a shallower architecture would not adequately capture the intricate long-range dependencies found in brain MRI scans, even while performance is still competitive. Fifth, a larger loss of 0.19 and a minor performance decline to 96.88% accuracy occur when the depth is increased to twelve transformer layers. This implies that, given the small size of the dataset, excessively deep transformer stacks may create redundancy and overfitting. With the lowest loss (0.06) and highest accuracy (97.98%), the suggested model with data augmentation ultimately achieves the optimal trade-off. This demonstrates that an ideal configuration that maximizes convergence stability and generalization for multi-stage AD classification is formed by the chosen learning rate, batch size, transformer depth, and augmentation approach.
Table 4.
Ablation study.
4.4. Attention Maps
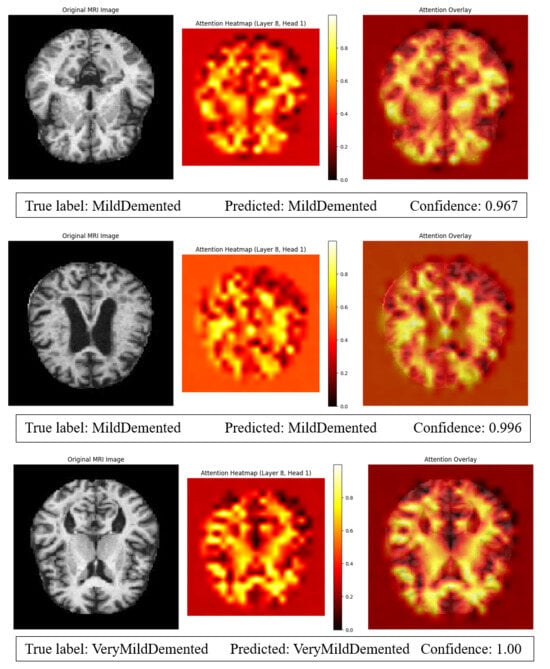
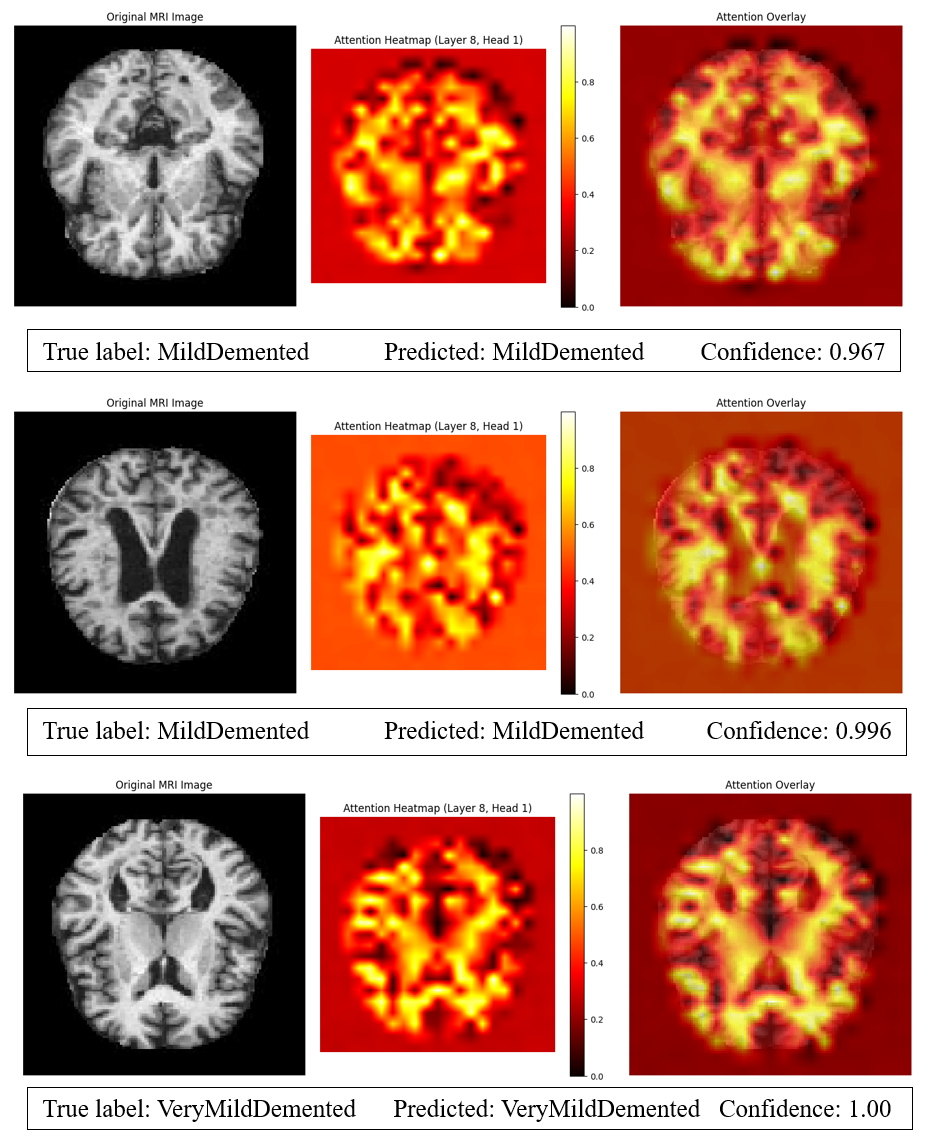
The attention maps were created to make the Vision Transformer model easier to understand and to identify the parts of the brain that had the biggest impact on its classification choices, especially when it came to the difficult distinction between the MildDemented (MD) and VeryMildDemented (VMD) stages (Figure 9). The self-attention mechanism continuously concentrates on anatomically significant locations linked to the development of Alzheimer’s disease, such as the hippocampus, temporal lobes, ventricular system, and cortical regions, according to the visualizations from intermediary transformer layers. The hippocampal formation and medial temporal regions, which are known to experience significant shrinkage as memory impairment becomes clinically apparent, show highly concentrated responses in attention heatmaps for MD subjects. Enlarged ventricles are also associated with increased attention, which is indicative of a loss of brain tissue throughout the entire brain.
Figure 9.
Attention map visualization and classification confidence for MildDemented and VeryMildDemented MRI samples.
VMD samples, on the other hand, exhibit more diffuse and geographically distributed attention patterns, with early-thinning regions and moderate activation over cortical surfaces, suggesting more modest structural changes prior to catastrophic neuronal loss.
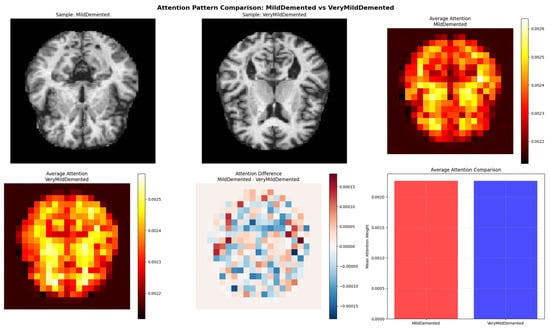
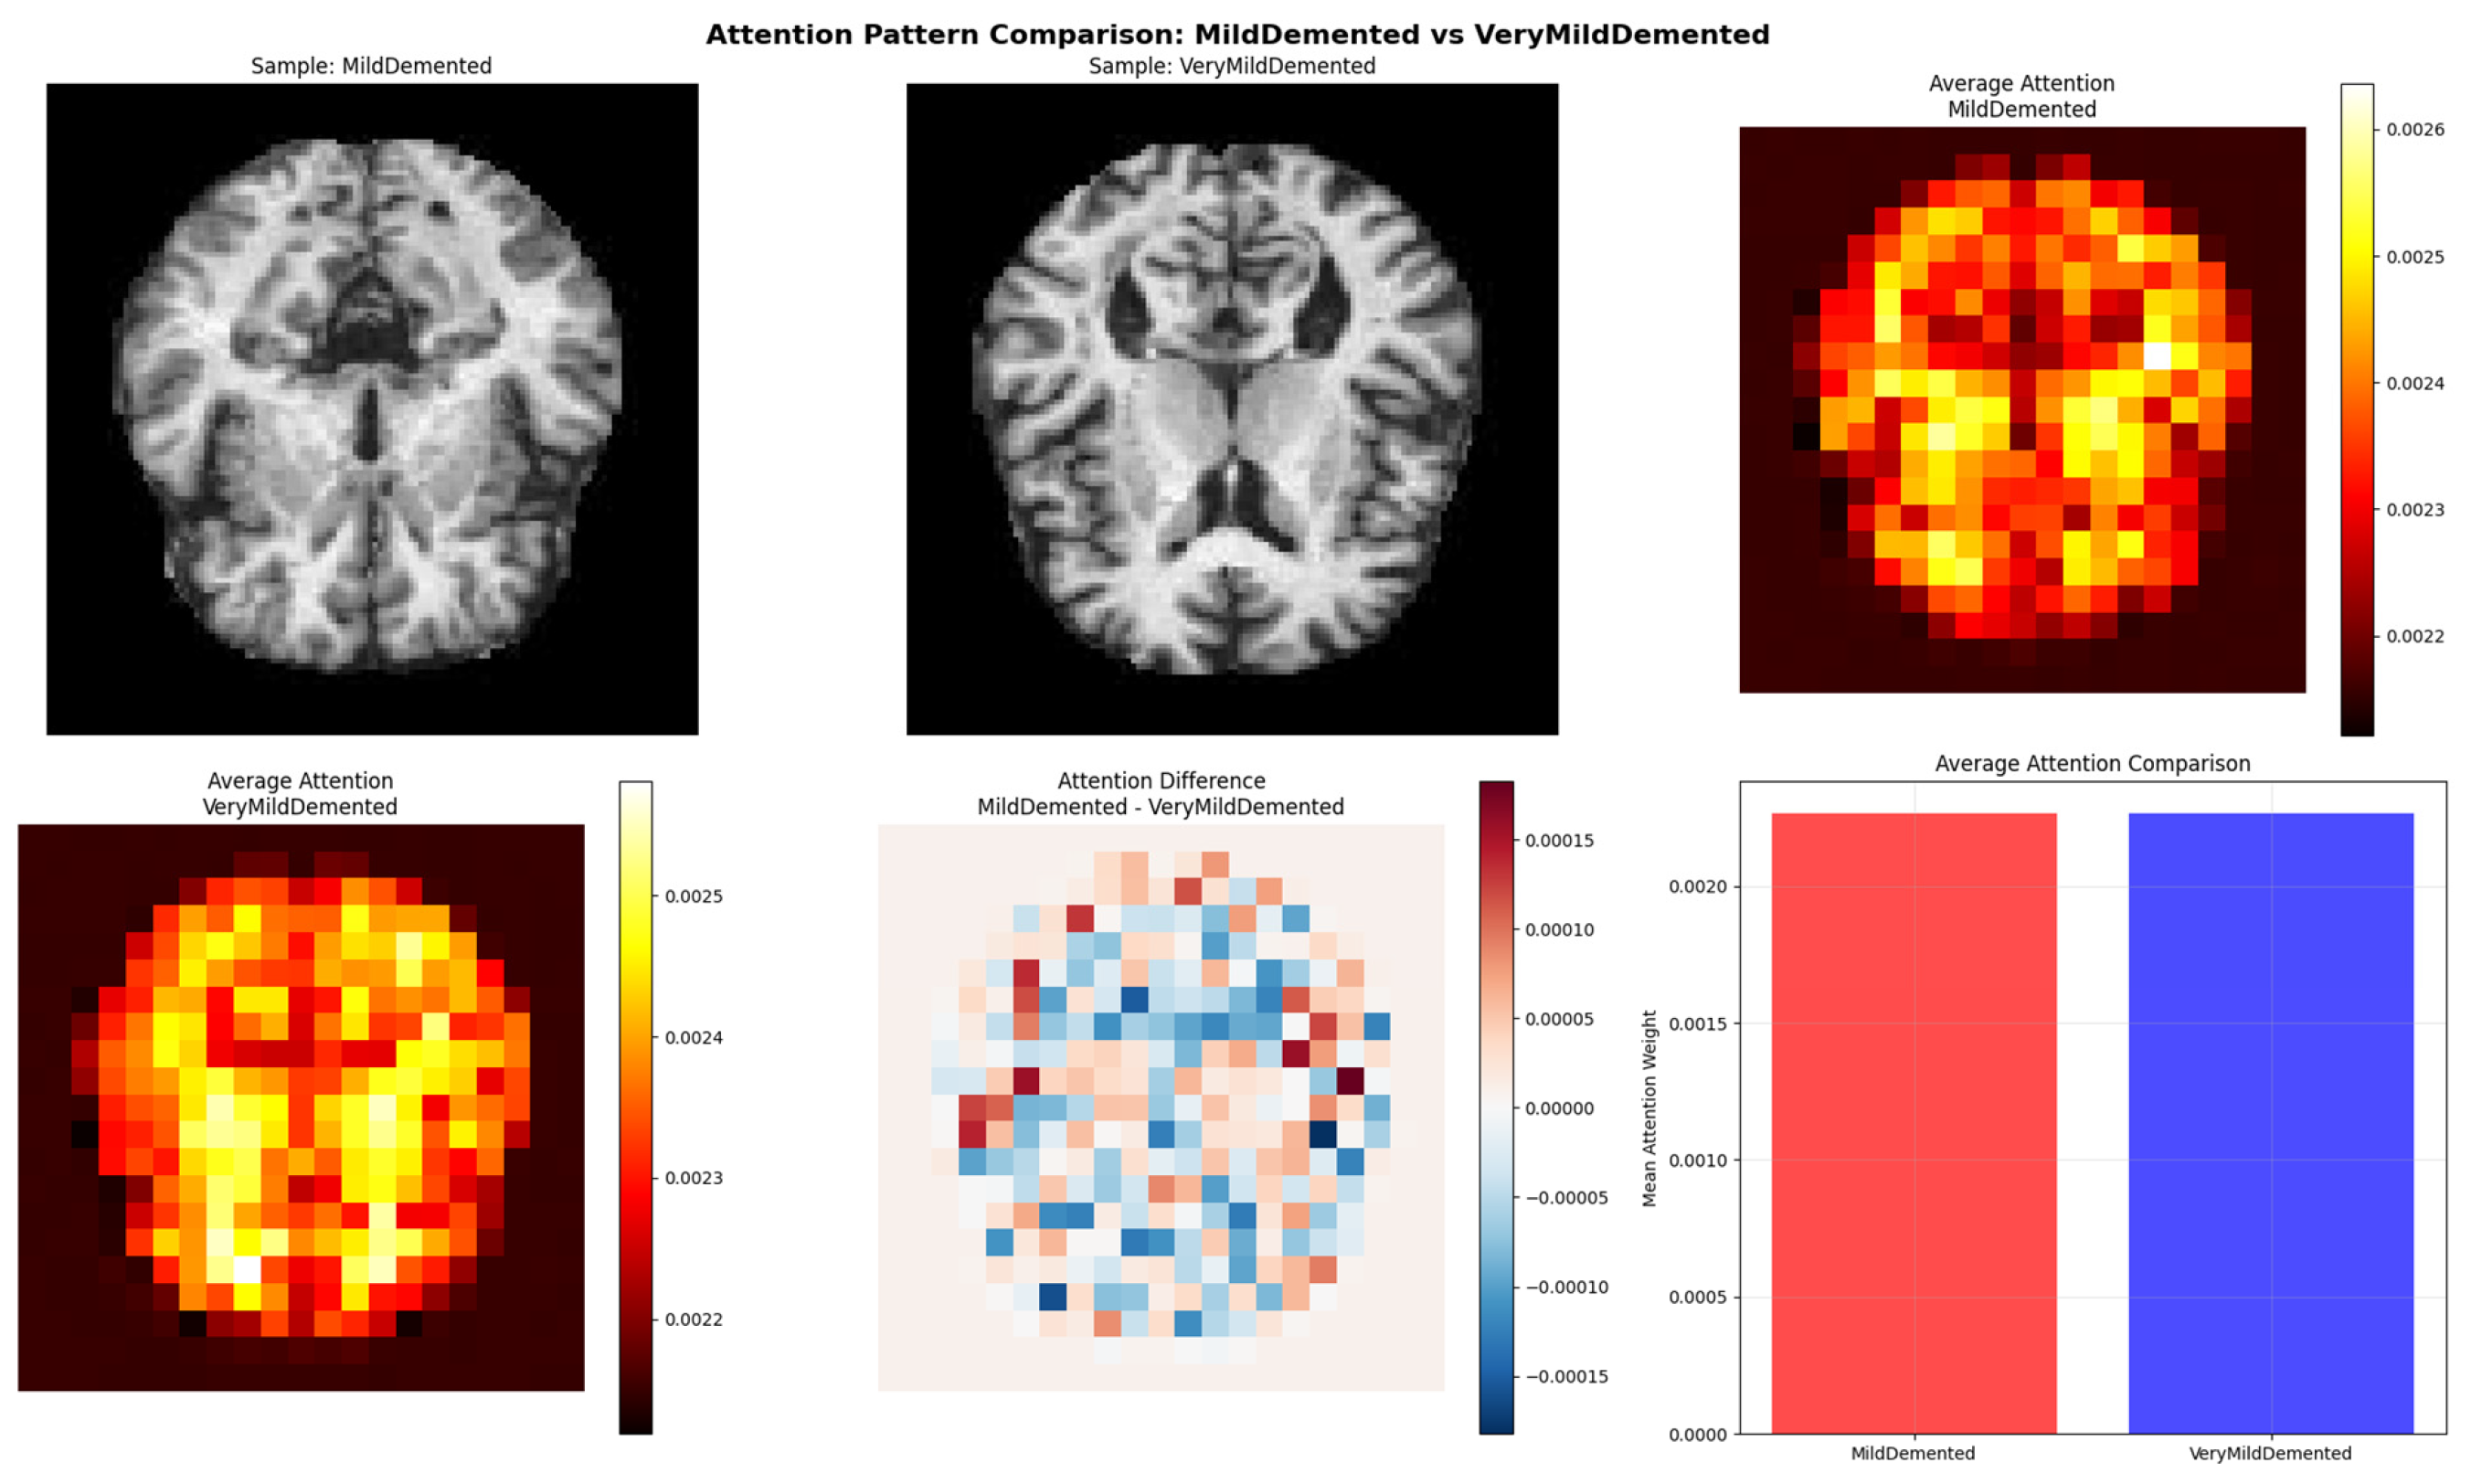
This difference is further demonstrated by the average attention comparison, where VMD cases exhibit lower but more widespread activation, while MD cases exhibit higher mean attention intensity and stronger localization. Confirming that the model uses disease-relevant biomarkers to distinguish closely comparable cognitive phases, the difference maps highlight locations where MD shows noticeably closer attention than VMD, especially in deep gray-matter structures and temporal domains. These findings confirm that the ViT captures clinically significant anatomical patterns rather than just learning global texture signals. Furthermore, by highlighting the crucial function of the self-attention system in simulating long-range interdependence and minute morphological alterations, the attention visualizations corroborate the ablation findings.
The attention analysis increases confidence in the dependability of the suggested framework for early and fine-grained Alzheimer’s disease stage classification, makes the decision-making process transparent, and validates the model’s capacity to differentiate MD from VMD based on biologically plausible features (Figure 10).
Figure 10.
Comparative attention analysis between MildDemented and VeryMildDemented MRI samples using Vision Transformer.
Potential imaging biomarkers that reflect the structural progression of Alzheimer’s disease are highlighted by the observed attention differences, which show a progressive localization of atrophy-related regions as the disease progresses and reveal disease-specific attention patterns that shift from diffuse cortical involvement in VeryMildDemented cases to more focused activation in hippocampal and temporal regions in MildDemented cases.
4.5. Comparative Analysis
Table 5’s comparative study demonstrates how well the suggested standalone ViT model performs in comparison to current methods for classifying Alzheimer’s disease. On a four-class Kaggle MRI dataset, the suggested standalone ViT model outperforms a number of current ViT-based methods with an accuracy of 97.98%. With a simplified architecture, our model performs similarly to MAE/DeiT [22], which reports 98% on ADNI/OASIS MRI. The lesser accuracy of hybrid or improved ViT variations, such as ViT + Optimizer [23] (95.75%) and Resizer Swin Transformer [25] (94.01%), emphasizes the advantage of direct global attention without additional complication. While ensemble or hybrid designs, such as Ensemble ViT-B16 + CNN [27] and Hybrid-RViT [35], perform well on binary tasks, the suggested ViT performs exceptionally well in multi-class classification with a unified, effective architecture that successfully captures global dependencies across MRI scans.
Table 5.
Comparative analysis.
Transformer-based hybrids, such as the ViT + DNN method in [44], demonstrate enhanced performance (97.65%), indicating the advantage of adding global attention mechanisms. Nevertheless, these techniques usually incorporate several deep learning elements, which raise the complexity of the architecture.
In multi-class and binary classification tasks, traditional CNN-based designs, like AlexNet [41], FiboNeXt [42], regular CNNs [43,46], and hybrid 3D CNN models [45], typically attain accuracies between 94% and 96.7%. Although these models provide competitive results, their performance is sometimes limited by their reliance on local feature extraction and small receptive fields, which may compromise robustness when handling subtle structural differences in MRI data. Therefore, global interaction between all image patches is made possible by the self-attention mechanism in ViTs, which makes it possible to describe long-range spatial relationships effectively. ViTs perform better than CNN-based models in capturing global dependencies in AD MRI, because Alzheimer’s-related neurodegeneration entails distributed structural alterations across several brain areas rather than just local patterns.
The suggested standalone ViT model, on the other hand, outperforms all other CNN-based and hybrid approaches with an accuracy of 97.98% while keeping a more straightforward and cohesive architecture. Global structural patterns linked to early neurodegeneration can be more effectively captured thanks to the capacity to describe long-range spatial dependencies. This shows that ViT-based topologies offer a very effective and precise solution for MRI-based Alzheimer’s disease classification, even in the absence of auxiliary networks.
5. Conclusions, Limitations and Future Work
In this work, we used structural MRI data to create a standalone ViT model for the classification of AD into four stages. The suggested model outperformed several CNN-based, ViT-based and hybrid techniques, with an astounding accuracy of 97.98%. These findings show how well the ViT design captures global structural relationships in MRI scans, which are essential for identifying neurodegenerative alterations in the different brain patterns. ViTs’ self-attention mechanism enables the model to integrate information across distant patches, in contrast to traditional CNNs that rely on local receptive fields. This results in superior differentiation between visually comparable classes, such as MildDemented and VeryMildDemented.
Additionally, the standalone ViT architecture’s simplicity eliminates the need for complex feature engineering processes, increasing its scalability and integration for clinical implementation.
There are still a few restrictions in place despite these encouraging outcomes. The model’s capacity to capture complementary biochemical or functional information offered by modalities like PET or DTI may be limited by the study’s exclusive reliance on single-modality MRI data. Furthermore, the model’s robustness and generalizability across various patient cohorts may be impacted by the dataset’s small size in comparison to population-level clinical data, even though it is enough for preliminary evaluation. Furthermore, even if attention mechanisms offer some interpretability, more work is required to improve clinical explainability so that predictions are consistent with neuroanatomical data.
These restrictions point to a number of directions for further research. Multimodal data fusion, such as combining MRI with PET, DTI, or clinical indicators, may enhance diagnostic precision even more, especially for the diagnosis of AD in its early stages. Investigating hybrid ViT-CNN architectures could make use of both local and global feature representations, capturing long-range relationships and fine-grained texture patterns. To increase transparency and clinical trust, attention-based visualization approaches should be used to highlight areas that are most pertinent to classification. Lastly, to guarantee the model’s robustness, generalizability, and preparedness for actual clinical deployment, validation on the largest datasets will be crucial.
To sum up, the suggested standalone ViT provides a strong, effective, and comprehensible framework for automated Alzheimer’s disease identification. Its excellent multi-class MRI classification performance sets the stage for upcoming transformer-based advancements in medical imaging, supporting the more general objective of early, precise, and clinically useful identification of neurodegenerative diseases.
Author Contributions
Conceptualization, W.H. and A.H.; methodology, M.L. and W.H.; software, W.H.; validation, A.H., M.L. and P.C.; formal analysis, M.D.-C.; investigation, W.H.; resources, W.H.; data curation, A.H.; writing—original draft preparation, W.H.; writing—review and editing, M.L.; visualization, P.C.; supervision, A.H.; project administration, M.L.; funding acquisition, M.L. All authors have read and agreed to the published version of the manuscript.
Funding
This research was carried out under the grant Future Artificial Intelligence Research—FAIR CUP B53C22003630006 funded by the Italian Ministry for Universities and Research (MUR), grant number MUR: PE0000013.
Institutional Review Board Statement
Our study did not involve direct interaction with human participants. All analyses were conducted using publicly available datasets, which were anonymized and complied with relevant ethical standards.
Informed Consent Statement
Our study did not involve direct interaction with human participants. All analyses were conducted using publicly available datasets, which were anonymized and complied with relevant ethical standards. Therefore, informed consent was not required.
Data Availability Statement
The data presented in this study are openly available in Kaggle at https://www.kaggle.com/datasets/marcopinamonti/alzheimer-mri-4-classes-dataset (accessed on 13 December 2025).
Conflicts of Interest
The authors declare no conflicts of interest.
References
- De Ture, M.A.; Dickson, D.W. The neuropathological diagnosis of Alzheimer’s disease. Mol. Neurodegener. 2019, 14, 32. [Google Scholar] [CrossRef] [Scilit] [PubMed]
- Gustavsson, A.; Norton, N.; Fast, T.; Frölich, L.; Georges, J.; Holzapfel, D.; Kirabali, T.; Krolak-Salmon, P.; Rossini, P.M.; Ferretti, M.T.; et al. Global estimates on the number of persons across the Alzheimer’s disease continuum. Alzheimer’s Dement. 2023, 19, 658–670. [Google Scholar] [CrossRef] [Scilit]
- Tripathi, P.N.; Lodhi, A.; Rai, S.N.; Nandi, N.K.; Dumoga, S.; Yadav, P.; Tiwari, A.K.; Singh, S.K.; El-Shorbagi, A.-N.; Chaudhary, S. Review of pharmacotherapeutic targets in Alzheimer’s disease and its management using traditional medicinal plants. Degener. Neurol. Neuromuscul. Dis. 2024, 14, 47–74. [Google Scholar] [CrossRef] [Scilit] [PubMed]
- van Oostveen, W.M.; de Lange, E.C.M. Imaging Techniques in Alzheimer’s Disease: A Review of Applications in Early Diagnosis and Longitudinal Monitoring. Int. J. Mol. Sci. 2021, 22, 2110. [Google Scholar] [CrossRef] [Scilit]
- Kamatham, P.T.; Shukla, R.; Khatri, D.K.; Vora, L.K. Pathogenesis, diagnostics, and therapeutics for Alzheimer’s disease: Breaking the memory barrier. Ageing Res. Rev. 2024, 101, 102481. [Google Scholar] [CrossRef] [Scilit]
- Magnin, B.; Mesrob, L.; Kinkingnéhun, S.; Pélégrini-Issac, M.; Colliot, O.; Sarazin, M.; Dubois, B.; Lehéricy, S.; Benali, H. Support vector machine-based classification of Alzheimer’s disease from whole-brain anatomical MRI. Neuroradiology 2009, 51, 73–83. [Google Scholar] [CrossRef] [Scilit]
- Hechkel, W.; Helali, A. Unveiling Alzheimer’s Disease Early: A Comprehensive Review of Machine Learning and Imaging Techniques. Arch. Comput. Methods Eng. 2024, 32, 471–484. [Google Scholar] [CrossRef] [Scilit]
- Wei, W.; Visweswaran, S.; Cooper, G.F. The application of naive Bayes model averaging to predict Alzheimer’s disease from genome-wide data. J. Am. Med Inform. Assoc. 2011, 18, 370–375. [Google Scholar] [CrossRef] [Scilit]
- Zhang, Y.; Wang, S.; Dong, Z. Classification of Alzheimer Disease Based on Structural Magnetic Resonance Imaging by Kernel Support Vector Machine Decision Tree. Prog. Electromagn. Res. 2014, 144, 171–184. [Google Scholar] [CrossRef] [Scilit]
- Song, M.; Jung, H.; Lee, S.; Kim, D.; Ahn, M. Diagnostic classification and biomarker identification of Alzheimer’s disease with random forest algorithm. Brain Sci. 2021, 11, 453. [Google Scholar] [CrossRef] [Scilit] [PubMed]
- Litjens, G.; Kooi, T.; Bejnordi, B.E.; Setio, A.A.A.; Ciompi, F.; Ghafoorian, M.; van der Laak, J.A.W.M.; van Ginneken, B.; Sánchez, C.I. A survey on deep learning in medical image analysis. Med. Image Anal. 2017, 42, 60–88. [Google Scholar] [PubMed]
- Rawat, W.; Wang, Z. Deep convolutional neural networks for image classification: A comprehensive review. Neural Comput. 2017, 29, 2352–2449. [Google Scholar] [CrossRef] [Scilit] [PubMed]
- Hadhoud, Y.; Mekhaznia, T.; Bennour, A.; Amroune, M.; Kurdi, N.A.; Aborujilah, A.H.; Al-Sarem, M. From binary to multi-class classification: A two-step hybrid cnn-vit model for chest disease classification based on X-Ray images. Diagnostics 2024, 14, 2754. [Google Scholar] [CrossRef] [Scilit] [PubMed]
- Dihin, R.A.; Al-Jawher, W.A.M.; AlShemmary, E.N. Diabetic retinopathy image classification using shift window transformer. Int. J. Innov. Comput. 2022, 13, 23–29. [Google Scholar] [CrossRef] [Scilit]
- Reddy, C.K.K.; Ahmed, H.I.; Mohzary, M.; Singh, T.M.; Shuaib, M.; Alam, S.; Alnami, H.M. AlzheimerViT: Harnessing lightweight vision transformer architecture for proactive Alzheimer’s screening. Front. Med. 2025, 12, 1568312. [Google Scholar]
- Mubonanyikuzo, V.; Yan, H.; Komolafe, T.E.; Zhou, L.; Wu, T.; Wang, N. Detection of Alzheimer Disease in Neuroimages Using Vision Transformers: Systematic Review and Meta-Analysis. J. Med. Internet Res. 2025, 27, e62647. [Google Scholar] [CrossRef] [Scilit]
- Sagheer, S.V.M.; Meghana, K.H.; Ameer, P.M.; Parayangat, M.; Abbas, M. Transformers for Multi-Modal Image Analysis in Healthcare. Comput. Mater. Contin. 2025, 84, 4259–4297. [Google Scholar] [CrossRef] [Scilit]
- Duan, Y.; Wang, R.; Li, Y. Aux-ViT: Classification of Alzheimer’s Disease from MRI based on Vision Transformer with Auxiliary Branch. In Proceedings of the 2023 5th International Conference on Communications, Information System and Computer Engineering (CISCE), Guangzhou, China, 14–16 April 2023; IEEE: New York, NY, USA, 2023; pp. 382–386, ISSN 2833-2423. [Google Scholar]
- Dhinagar, N.J.; Thomopoulos, S.I.; Laltoo, E.; Thompson, P.M. Efficiently training vision transformers on structural MRI scans for Alzheimer’s disease detection. arXiv 2023, arXiv:2303.08216. [Google Scholar]
- Fonseka, H.; Varastehpour, S.; Shakiba, M.; Golkar, E.; Tien, D. Convolutional variational auto-encoder and vision transformer hybrid approach for enhanced early Alzheimer’s detection. J. Med. Imaging 2025, 12, 034501. [Google Scholar] [CrossRef] [Scilit]
- Xing, X.; Liang, G.; Zhang, Y.; Khanal, S.; Lin, A.-L.; Jacobs, N. Advit: Vision Transformer on Multi-Modality Pet Images for Alzheimer Disease Diagnosis. In Proceedings of the 2022 IEEE 19th International Symposium on Biomedical Imaging (ISBI), Kolkata, India, 28–31 March 2022; IEEE: New York, NY, USA, 2022; pp. 1–4. [Google Scholar]
- Carcagnì, P.; Leo, M.; Del Coco, M.; Distante, C.; De Salve, A. Convolution neural networks and self-attention learners for Alzheimer dementia diagnosis from brain MRI. Sensors 2023, 23, 1694. [Google Scholar] [CrossRef] [Scilit]
- Mehmood, F.; Mehmood, A.; Whangbo, T.K. Alzheimer’s Disease Detection in Various Brain Anatomies Based on Optimized Vision Transformer. Mathematics 2025, 13, 1927. [Google Scholar] [CrossRef] [Scilit]
- Lu, S.-Y.; Zhang, Y.-D.; Yao, Y.-D. An efficient vision transformer for Alzheimer’s disease classification using magnetic resonance images. Biomed. Signal Process. Control 2025, 101, 107263. [Google Scholar] [CrossRef] [Scilit]
- Huang, Y.; Li, W. Resizer Swin transformer-based classification using sMRI for Alzheimer’s disease. Appl. Sci. 2023, 13, 9310. [Google Scholar] [CrossRef] [Scilit]
- Shin, H.; Jeon, S.; Seol, Y.; Kim, S.; Kang, D. Vision transformer approach for classification of Alzheimer’s disease using 18F-Florbetaben brain images. Appl. Sci. 2023, 13, 3453. [Google Scholar] [CrossRef] [Scilit]
- Chakra Bortty, J.; Chakraborty, G.S.; Noman, I.R.; Batra, S.; Das, J.; Bishnu, K.K.; Tarafder, M.T.R.; Islam, A. A novel diagnostic framework with an optimized ensemble of vision transformers and convolutional neural networks for enhanced Alzheimer’s disease detection in medical imaging. Diagnostics 2025, 15, 789. [Google Scholar] [CrossRef] [Scilit]
- Khatri, U.; Kwon, G.-R. Explainable vision transformer with self-supervised learning to predict Alzheimer’s disease progression using 18F-FDG PET. Bioengineering 2023, 10, 1225. [Google Scholar] [CrossRef] [Scilit]
- Odusami, M.; Maskeliūnas, R.; Damaševičius, R. Pixel-level fusion approach with vision transformer for early detection of Alzheimer’s disease. Electronics 2023, 12, 1218. [Google Scholar]
- Joy, M.A.M.; Nasrin, S.; Siddiqua, A.; Farid, D.M. ViTAD: Leveraging modified vision transformer for Alzheimer’s disease multi-stage classification from brain MRI scans. Brain Res. 2025, 1847, 149302. [Google Scholar]
- Shaffi, N.; Viswan, V.; Mahmud, M. Ensemble of vision transformer architectures for efficient Alzheimer’s Disease 524 classification. Brain Inform. 2024, 11, 25. [Google Scholar]
- Bravo-Ortiz, M.A.; Holguin-Garcia, S.A.; Quiñones-Arredondo, S.; Mora-Rubio, A.; Guevara-Navarro, E.; Arteaga-Arteaga, H.B.; Ruz, G.A.; Tabares-Soto, R. A systematic review of vision transformers and convolutional neural networks for Alzheimer’s disease classification using 3D MRI images. Neural Comput. Appl. 2024, 36, 21985–22012. [Google Scholar] [CrossRef] [Scilit]
- Kunanbayev, K.; Shen, V.; Kim, D.-S. Training vit with limited data for Alzheimer’s disease classification: An empirical study. In Proceedings of the 2024 27th International Conference on Medical Image Computing and Computer Assisted Intervention (MICCAI), Marrakesh, Morocco, 6–10 October 2024; Springer: Berlin/Heidelberg, Germany, 2024; pp. 334–343. [Google Scholar]
- Jomeiri, A.; Navin, A.H.; Shamsi, M. Regional attention-enhanced vision transformer for accurate Alzheimer’s disease classification using sMRI data. Comput. Biol. Med. 2025, 197, 111065. [Google Scholar] [CrossRef] [Scilit]
- Yan, H.; Mubonanyikuzo, V.; Komolafe, T.E.; Zhou, L.; Wu, T.; Wang, N. Hybrid-RViT: Hybridizing ResNet-50 and vision transformer for enhanced Alzheimer’s disease detection. PLoS ONE 2025, 20, e0318998. [Google Scholar] [CrossRef] [Scilit] [PubMed]
- Huang, F.; Qiu, A. Ensemble vision transformer for dementia diagnosis. IEEE J. Biomed. Health Inform. 2024, 28, 5551–5561. [Google Scholar] [CrossRef] [Scilit]
- Odusami, M.; Damasevicius, R.; Milieskaite-Belousoviene, E.; Maskeliunas, R. Multimodal Neuroimaging Fusion for Alzheimer’s Disease: An Image Colorization Approach with Mobile Vision Transformer. Int. J. Imaging Syst. Technol. 2024, 34, e23158. [Google Scholar] [CrossRef] [Scilit]
- Alzheimer MRI 4 Classes Dataset. Available online: https://www.kaggle.com/datasets/marcopinamonti/alzheimer-mri-4-classes-dataset (accessed on 9 October 2025).
- Devlin, J.; Chang, M.-W.; Lee, K.; Toutanova, K. BERT: Pre-training of Deep Bidirectional Transformers for Language Understanding. arXiv 2019, arXiv:1810.04805. [Google Scholar] [CrossRef] [Scilit]
- Dosovitskiy, A.; Beyer, L.; Kolesnikov, A.; Weissenborn, D.; Zhai, X.; Unterthiner, T.; Dehghani, M.; Minderer, M.; Heigold, G.; Gelly, S.; et al. An Image is Worth 16 × 16 Words: Transformers for Image Recognition at Scale. arXiv 2021, arXiv:2010.11929. [Google Scholar] [CrossRef] [Scilit]
- Fu’aDah, Y.N.; Wijayanto, I.; Pratiwi, N.K.C.; Taliningsih, F.F.; Rizal, S.; Pramudito, M.A. Automated Classification of Alzheimer’s Disease Based on MRI Image Processing using Convolutional Neural Network (CNN) with AlexNet Architecture. J. Phys. 2021, 1844, 012020. [Google Scholar] [CrossRef] [Scilit]
- Tuncer, T.; Dogan, S.; Subasi, A. FiboNeXt: Investigations for Alzheimer’s Disease detection using MRI. Biomed. Signal Process. Control 2025, 103, 107422. [Google Scholar] [CrossRef] [Scilit]
- Bangyal, W.H.; Rehman, N.U.; Nawaz, A.; Nisar, K.; Ibrahim, A.A.A.; Shakir, R.; Rawat, D.B. Constructing Domain Ontology for Alzheimer Disease Using Deep Learning Based Approach. Electronics 2022, 11, 1890. [Google Scholar] [CrossRef] [Scilit]
- Kumar, H.; Agarwal, R. ViT-ALZ: Vision Transformer with Deep Neural Network for Alzheimer’s Disease Detection. In Soft Computing: Theories and Applications; Kumar, R., Verma, A.K., Verma, O.P., Wadehra, T., Eds.; Springer Nature: Singapore, 2024; pp. 175–184. [Google Scholar] [CrossRef] [Scilit]
- Khvostikov, A.; Aderghal, K.; Benois-Pineau, J.; Krylov, A.; Catheline, G. 3D CNN-based classification using sMRI and MD-DTI images for Alzheimer disease studies. arXiv 2018, arXiv:1801.05968. [Google Scholar] [CrossRef] [Scilit]
- Awarayi, N.S.; Twum, F.; Ben Hayfron-Acquah, J.; Owusu-Agyemang, K. A bilateral filtering-based image enhancement for Alzheimer disease classification using CNN. PLoS ONE 2024, 19, e0302358. [Google Scholar] [CrossRef] [Scilit]
- Afzal, S.; Maqsood, M.; Nazir, F.; Khan, U.; Aadil, F.; Awan, K.M.; Mehmood, I.; Song, O.-Y. A Data Augmentation-Based Framework to Handle Class Imbalance Problem for Alzheimer’s Stage Detection. IEEE Access 2019, 7, 115528–115539. [Google Scholar] [CrossRef] [Scilit]

Disclaimer/Publisher’s Note: The statements, opinions and data contained in all publications are solely those of the individual author(s) and contributor(s) and not of MDPI and/or the editor(s). MDPI and/or the editor(s) disclaim responsibility for any injury to people or property resulting from any ideas, methods, instructions or products referred to in the content. |
© 2026 by the authors. Licensee MDPI, Basel, Switzerland. This article is an open access article distributed under the terms and conditions of the Creative Commons Attribution (CC BY) license.