


Abstract
The integration of Advanced Metering Infrastructure (AMI) provides high-resolution electrical data, essential for enhancing industrial efficiency and monitoring equipment health. However, the utility of this data is frequently compromised by anomalies, underscoring the necessity for robust, automated detection methodologies. This study benchmarks three distinct categories of machine learning models: a statistical baseline (SARIMA), an unsupervised classifier (Isolation Forest), and a deep learning reconstruction model (LSTM-Autoencoder). The evaluation was conducted using a multivariate dataset acquired from bakery manufactory equipment, employing a synthetic anomaly injection framework with a 5% contamination rate. The results indicate significant challenges in accurately detecting anomalies within this dataset. The SARIMA model achieved the highest average F1-Score (0.256), slightly outperforming the Isolation Forest (0.233), while the LSTM-Autoencoder performed the poorest (0.110). Critically, all models exhibited extremely low precision (ranging from 0.074 to 0.204), indicating an unacceptably high rate of false positives. The findings suggest that standard configurations of these models struggle to differentiate between true anomalies and the inherent variability of industrial operations, highlighting the need for advanced optimization and feature engineering for practical deployment.
1. Introduction
The modernization of electrical grids, facilitated by Advanced Metering Infrastructure (AMI), has generated a significant volume of high-frequency time-series data. In industrial environments, this granular data offers critical insights into the operational patterns of specific equipment, thereby enabling improved load forecasting, efficient demand-side management, and predictive maintenance strategies. Nevertheless, the integrity and utility of this data are often undermined by the presence of anomalies.
Anomalies, defined as patterns deviating significantly from expected behavior, typically originate from technical issues, such as meter malfunctions or errors, or operational issues, such as equipment failure. Within an industrial context, anomalies may not only signify energy loss but can also serve as critical indicators of impending equipment failure. These failures often manifest in electrical parameters, including voltage stability or power factor, before a catastrophic event occurs. The consequences of undetected anomalies are substantial, encompassing revenue loss, grid instability, and unplanned downtime, thus necessitating accurate and automated detection methods. The research landscape for anomaly detection in energy consumption is extensive and rapidly evolving, addressing various challenges and proposing diverse methodologies.
Initial studies emphasized that relying on a single, generalized model is often insufficient, highlighting the necessity of customized algorithms tailored to the specific data distributions of different industries (e.g., metal, chemical, food) [1]. Significant research has focused specifically on NTL fraud detection, introducing novel methods like two-stage processes using feature enrichment (ARIMA) and classification (Distributed Random Forest) to achieve high accuracy and address high false-negative rates [2]. Insights from related fields, such as computational modeling in wastewater treatment, confirm the trend that data-driven and hybrid (mechanistic + ML) models generally offer better prediction and lower errors than purely mechanistic approaches [3].
The focus has increasingly shifted towards advanced techniques within the smart grid context. Frameworks integrating Deep Reinforcement Learning (DRL) with hybrid CNN-RNN models, optimized via meta-heuristics (DRL-NSABC), have been proposed for accurate and adaptive detection, addressing limitations in false positive reduction [4]. Reconstruction-based models have gained traction; for instance, VAE-LSTM models with dynamic thresholds have been effectively used for anomaly detection and identification based on energy consumption in complex scenarios like shield tunneling [5].
The deployment environment also dictates model choice. Research on constrained IoT edge devices has shown that efficient models like Autoencoder Base (AEB) are appropriate due to their lower computational cost compared to more intensive models like U-Net [6]. In the realm of cybersecurity, efficient autoencoders trained only on normal data have successfully detected synthetic DDoS and FDIA attacks against smart microgrids by analyzing network traffic and AMI sensor data [7].
Comparative studies remain crucial. A comparison between Isolation Forest (IF) and Variational Autoencoders (VAE) for hotel consumption monitoring found IF superior due to its adaptability and lower computational complexity, making it suitable for limited resources [8]. However, for Integrated Energy Systems (IESs) with complex interactions, advanced methods like CVAE-A, utilizing deep clustering and Dual Attention mechanisms, are necessary to identify anomaly patterns [9].
The foundational task of forecasting electricity consumption often relies on LSTM networks, which have demonstrated high accuracy in predicting consumption trends [10]. Building on this, DeepESN neural networks have been proposed for industrial predictive maintenance, showing superiority over LSTM/RNN in timeliness and computational lightness, making them suitable for edge devices [11]. More recently, Transformer-based methods have emerged, outperforming state-of-the-art models; these often rely on synthesizing anomalies to handle the practical challenge of imbalanced data [12].
Traditional methods are still utilized; for example, SARIMA and LSTM were compared for real-time anomaly detection in road lighting systems using smart meter readings [13]. Other approaches focus on prediction errors, such as the CGA-RF method, which uses CNN-GRU with self-attention to generate residuals analyzed by RandomForest, improving accuracy over mainstream algorithms [14]. Continued optimization of LSTM models for household consumption forecasting highlights that anomalies are often better detected in daily rather than monthly readings [15].
Novel datasets and detection paradigms continue to emerge, such as the Dragon_Pi dataset for IoT side-channel power data intrusion detection, addressed using unsupervised Convolutional Autoencoders (CAE) [16]. Architecturally, edge-cloud hybrid frameworks are being developed, utilizing KNN on the edge for real-time detection and LSTM in the cloud for failure prediction, significantly reducing operational costs [17]. The interpretation of energy data is also evolving, with platforms like EnergiQ using Large Language Models (LLMs) to interpret appliance patterns and deliver personalized, natural language recommendations [18].
Alternative statistical approaches, such as window-based entropy time series, have been proposed to detect behavioral changes in household consumption, requiring no training period and adapting dynamically [19]. Challenges in data labeling persist, particularly in industrial Non-Intrusive Load Monitoring (NILM), where active learning approaches are used to significantly reduce the need for expert labeling [20].
For multivariate time series, Graph Transformer Networks (SGTrans) have been introduced, combining GNN and Transformer to model complex relationships and global temporal dependencies between sensors [21]. High-dimensional energy consumption anomaly detection often employs hybrid deep learning models combining CNN, Bi-LSTM, and attention mechanisms, utilizing the 3σ criterion on prediction error [22]. The practical benefits of Edge AI for real-time monitoring, emphasizing performance and scalability, have been confirmed in controlled IoT experiments [23].
A persistent challenge in Electricity Theft Detection (ETD) is the high False-Positive Rate (FPR). The K-MLX model addresses this by hybridizing K-Means (for grouping consumers), LSTM (for temporal features), and XGBoost (for robust classification) [24]. Energy anomalies are also investigated as proxies for identifying intrusions in smart buildings, using LSTM models to analyze deviations in magnitude and timing [25]. The robustness of these systems is critical, leading to research on mitigating data poisoning attacks during the training phase by integrating weighted regression and M-estimators [26].
Hybrid models consistently show strong performance in load forecasting, such as the LSTM-XGBoost framework, which outperforms individual models by leveraging LSTM for pattern extraction and XGBoost for predictive power [27]. Time-series reconstruction remains a popular approach, with methods like AF-GS–RandomForest utilizing the Autoformer algorithm for prediction and RandomForest for detection [28]. In localized applications, smart, low-cost IoT devices are developed to make local decisions using smoothing algorithms and ML classification, reducing power and bandwidth needs [29].
In the context of sustainable architecture, green building energy prediction is enhanced using integrated VAE-GRU architectures with self-attention mechanisms [30]. Unsupervised deep learning, such as Bidirectional LSTM autoencoders combined with text mining strategies (TF-IDF + SVD), is used for intrusion detection in smart-grid communication networks, overcoming the need for labeled data [31]. Analysis of competition-winning solutions, such as the LEAD competition, highlights the effectiveness of tree-based supervised learning (LightGBM, XGBoost) and the critical role of feature engineering [32]. Finally, novel vision-based detection (VOD) methods are being explored, converting time-series energy data into 2D plots to leverage models like ResNet-18 and YOLOv5s, effectively transferring expert knowledge to DL models [33].
Despite extensive research and the proposal of diverse methodologies [1,2,3,4,5,6,7,8,9,10,11,12,13,14,15,16,17,18,19,20,21,22,23,24,25,26,27,28,29,30,31,32,33], a practical gap persists. A significant portion of existing literature concentrates primarily on univariate energy consumption (kWh). There is a notable lack of standardized comparative analysis that benchmarks fundamental approaches across different algorithmic categories—statistical, classical machine learning (ML), and deep learning—on multivariate industrial AMI data. In such data, the interrelationships between different electrical parameters (e.g., voltage, current, power factor) are crucial for effective anomaly detection.
This paper addresses this gap by executing a comprehensive experimental comparison. The study aims to implement and contrast three distinct model categories: Seasonal Autoregressive Integrated Moving Average (SARIMA) as a statistical baseline, Isolation Forest (IF) as a classical unsupervised Machine Learning (ML) approach, and a Long Short-Term Memory Autoencoder (LSTM-AE) representing Deep Learning (DL) reconstruction. Furthermore, the research employs a replicable experimental framework involving synthetic anomaly injection to rigorously evaluate performance. The study provides a clear performance benchmark to guide practical deployment in industrial settings, analyzing the challenges faced when applying these methodologies to highly variable industrial data.
It is important to emphasize that the models evaluated in this study—SARIMA, Isolation Forest, and LSTM-Autoencoder—are intentionally selected as representative baseline approaches rather than optimized or state-of-the-art solutions. The primary purpose of this benchmark is to establish a performance baseline against which future, more sophisticated methods can be compared, and to identify the practical challenges that arise when applying standard anomaly detection techniques to complex industrial data.
2. Materials and Methods
This section details the experimental design executed, encompassing the dataset description, preprocessing, the synthetic anomaly injection framework, model architectures, and evaluation metrics.
2.1. Dataset Description
The study utilized a real-world dataset collected from seven three-phase electricity meters deployed in a bakery manufactory to monitor industrial equipment, including furnaces and proofing ovens. The raw data comprises approximately 94,600 records per meter, covering a continuous operational period of approximately six weeks. Data quality was generally high; six meters had 0% missing data, while one meter (Dala_Meter_007108) exhibited a missing data rate of 6.79%. The analysis focused on nine key features, segmented into power quality metrics (active_power_w, power_factor_total, frequency_hz) and three-phase measurements (voltage_a_v, voltage_b_v, voltage_c_v, current_a_a, current_b_a, current_c_a).
2.2. Data Preprocessing
A standardized preprocessing pipeline was implemented. Initially, missing data points were handled using time-based linear interpolation, supplemented by forward-fill and back-fill techniques. The raw data was collected at the native temporal resolution of the smart meters, which recorded measurements at intervals ranging from approximately 40 s to 1 min. The decision to resample to a consistent 1 h (1H) frequency was motivated by three considerations: (1) reducing computational complexity for iterative model training, (2) mitigating measurement noise present at sub-minute intervals, and (3) aligning with typical industrial monitoring practices where hourly aggregates are commonly used for trend analysis and anomaly detection. Instantaneous measurements were averaged within each hourly interval. Finally, standardization (Z-score normalization) was applied; the scaler was fitted exclusively on the training data (assumed normal) and then utilized to transform both the training and testing datasets.
2.3. Experimental Design and Anomaly Injection
The experiment employed a standardized framework to evaluate the models under controlled conditions using synthetic anomalies, necessitated by the absence of real-world anomaly labels.
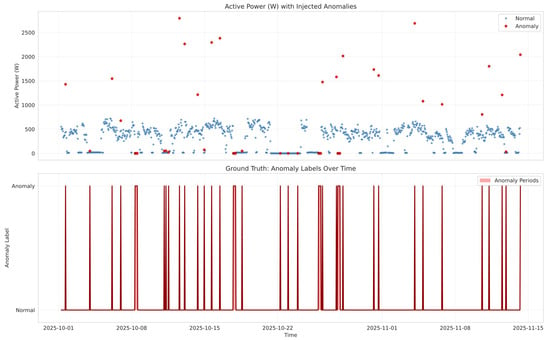
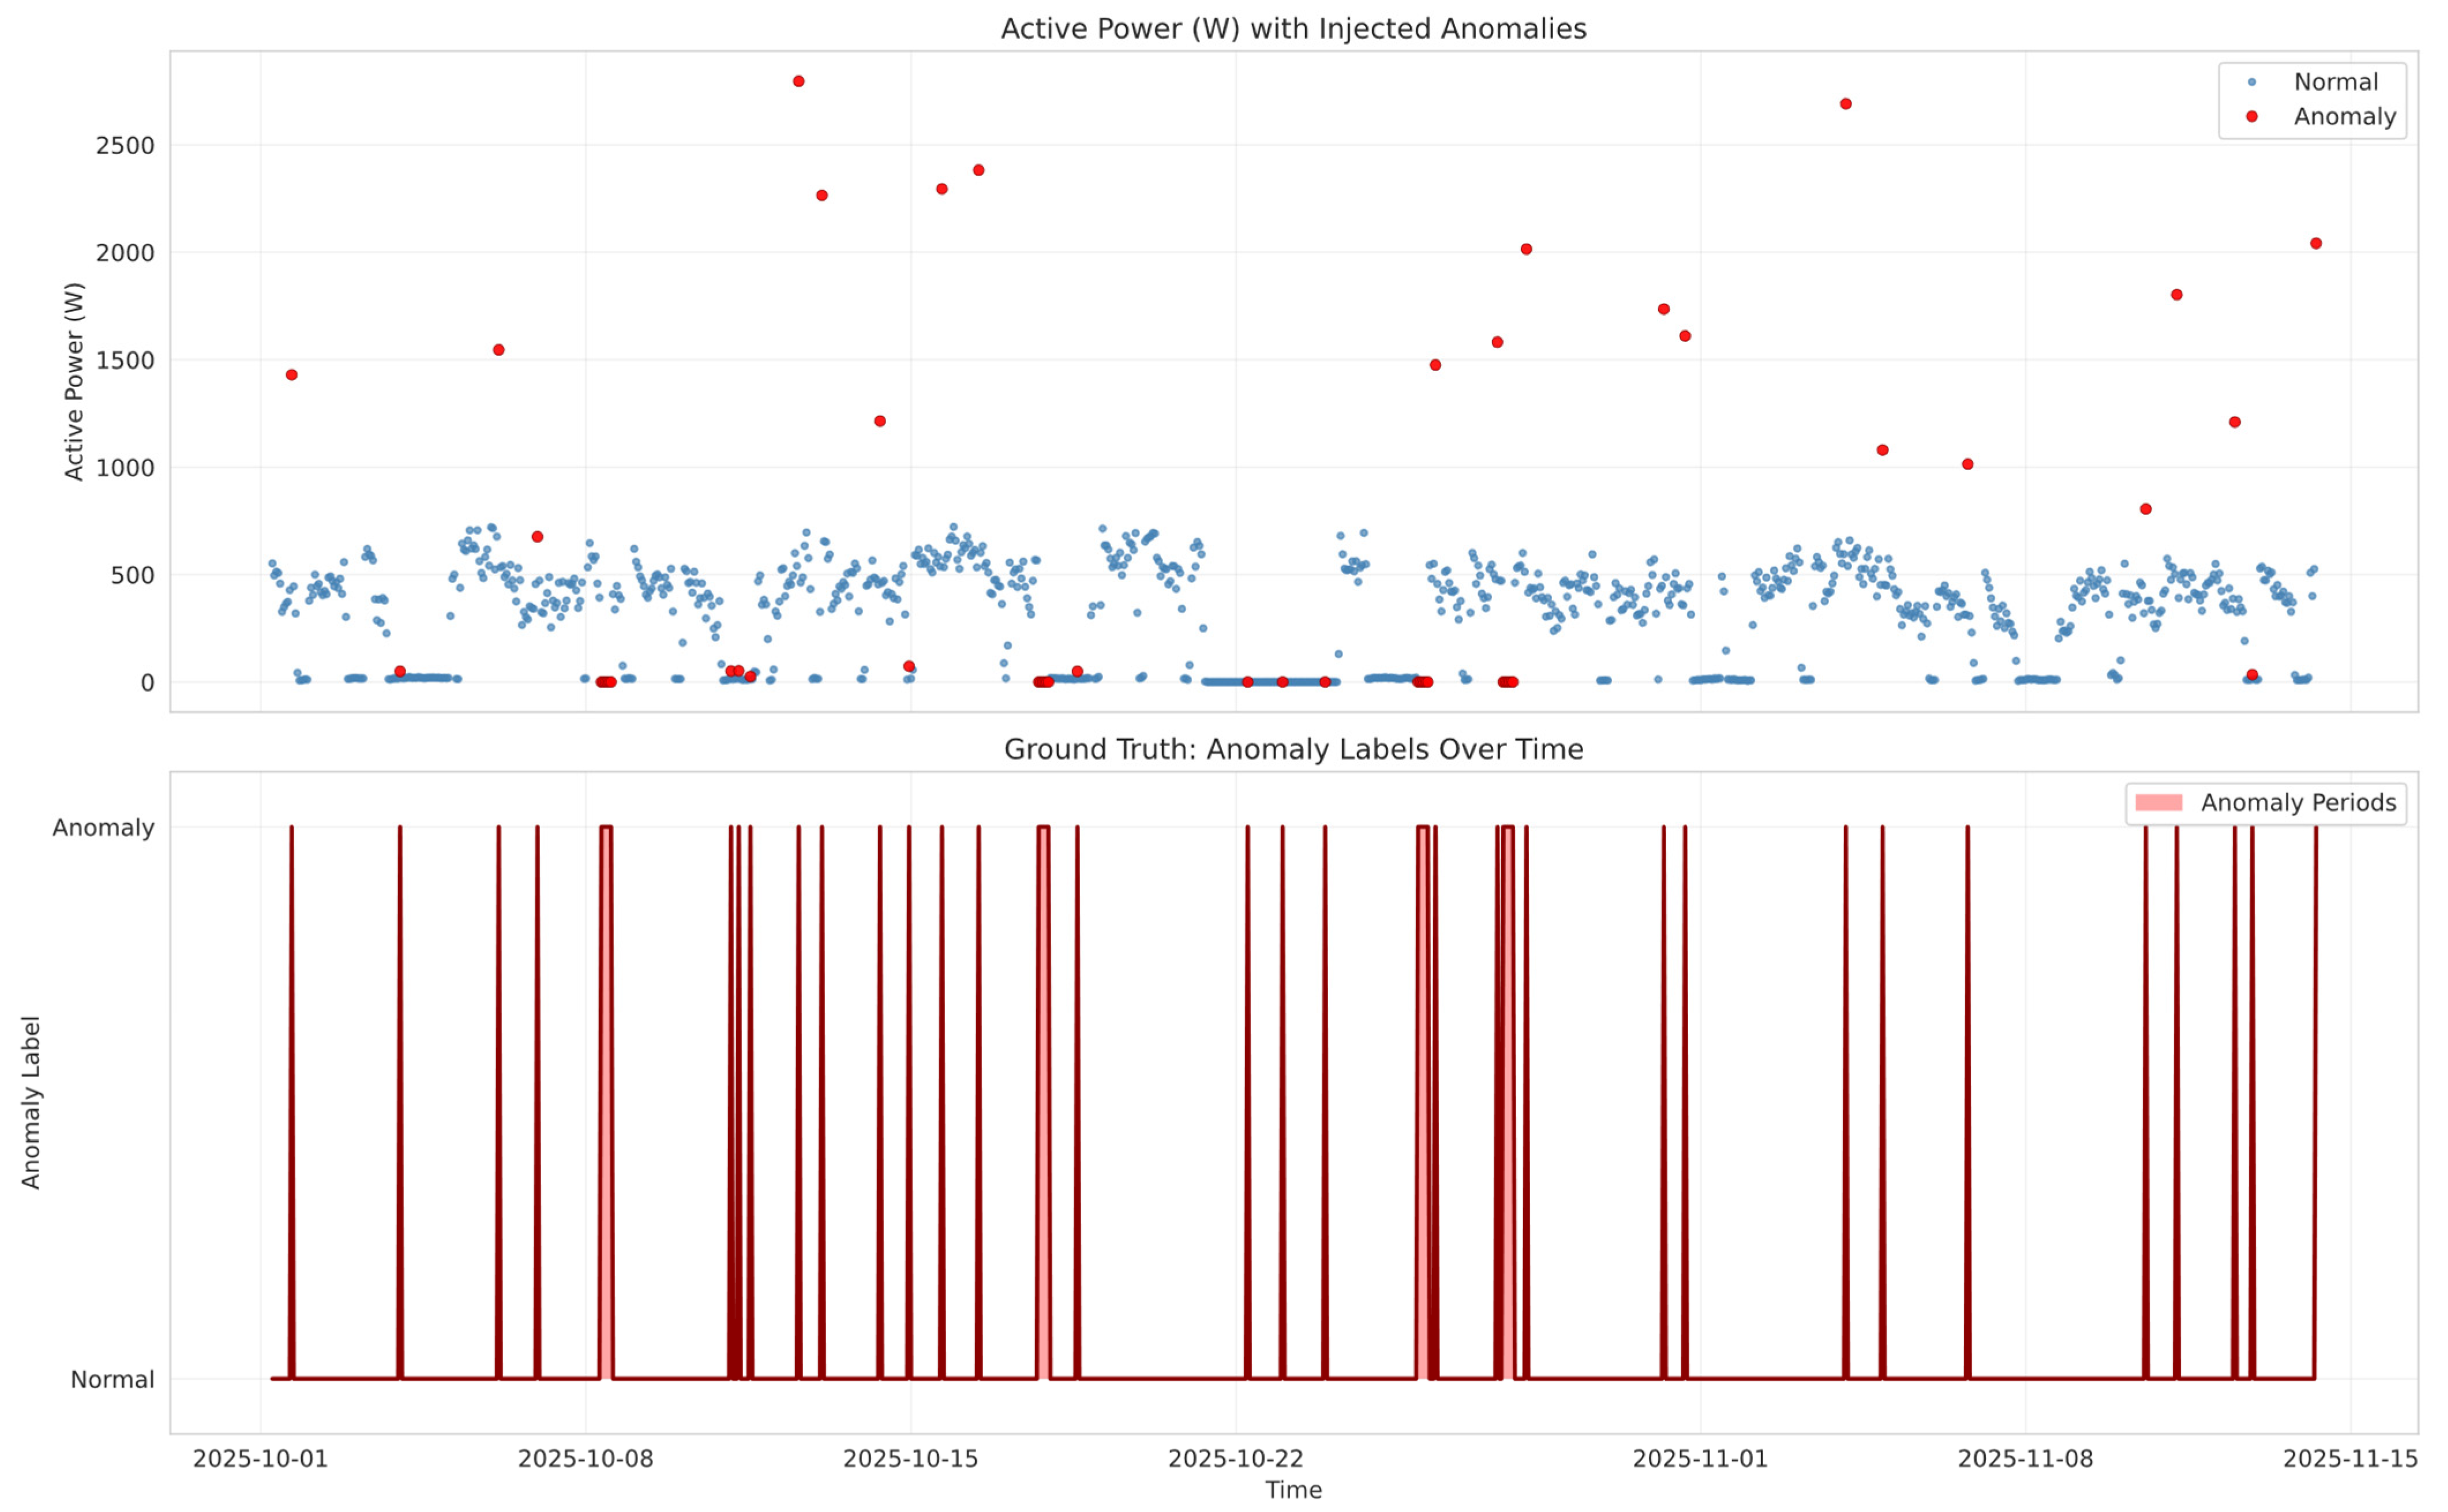
Each meter’s dataset was divided temporally; the initial 70% was allocated for training, while the remaining 30% was reserved for testing. Synthetic anomalies were introduced into the testing set at a contamination rate of 5%. Sixty percent of the anomalies were point anomalies (spikes), characterized by instantaneous increases in active_power_w and corresponding currents. The remaining forty percent were collective anomalies (flatlines), simulating equipment shutdown or sensor failure. Figure 1 illustrates the injection process on a representative meter’s test data, highlighting the ground truth anomalies.
Figure 1.
Visualization of Active Power (W) in the testing dataset for a representative meter, illustrating the injected synthetic anomalies (Ground Truth).
2.4. Model Architectures and Training
Three models, representing distinct methodological approaches, were implemented and evaluated.
- Model 1 (Baseline): SARIMA
SARIMA (Seasonal Autoregressive Integrated Moving Average) served as the statistical baseline, applied solely to the active_power_w feature. The SARIMA configuration of order (1, 0, 0) and seasonal order (1, 1, 0, 24) was selected based on preliminary analysis of the data characteristics. The non-seasonal order (1, 0, 0) indicates an AR(1) process without differencing or moving average components, appropriate for hourly power data which exhibited stationarity after resampling. The seasonal component (1, 1, 0, 24) captures the 24 h daily periodicity inherent in industrial operations, with one seasonal differencing operation to handle daily systematic variations. This configuration was not optimized via grid search or Autocorrelation Function (ACF)/Partial Autocorrelation Function (PACF) analysis, which represents a limitation discussed in Section 4 and a direction for future work. The detection logic relied on identifying prediction residuals exceeding 3 standard deviations (3σ criterion) of the training residuals.
- Model 2 (Unsupervised): Isolation Forest
Isolation Forest utilized the full suite of nine multivariate electrical features. The model was configured with 100 estimators, and the contamination parameter was set to ‘auto’, allowing the algorithm to determine the anomaly threshold based on the inherent distribution of the training data.
- Model 3 (Deep Learning): LSTM-Autoencoder
The LSTM-Autoencoder was employed for reconstruction-based anomaly detection using the multivariate features, utilizing a lookback window of 24 h. The encoder comprised LSTM layers (128 units, followed by 64 units) with ReLU activation and 10% Dropout, mirrored by the decoder. The model was trained using the Adam optimizer to minimize the Mean Absolute Error (MAE). The anomaly threshold was established at the 99th percentile of the reconstruction errors observed during the training phase.
2.5. Evaluation Metrics
Model performance was rigorously assessed using standard metrics appropriate for classification in imbalanced datasets: Precision, Recall, and the F1-Score. Additionally, Accuracy and ROC-AUC were recorded.
3. Results
The three models were evaluated on the testing datasets, which contained a 5% rate of synthetic anomalies. The results presented herein represent the average performance metrics aggregated across all seven smart meters. The quantitative outcomes are summarized in Table 1.
Table 1.
Aggregated Performance Summary (Average across all seven meters).
3.1. Comparative Analysis
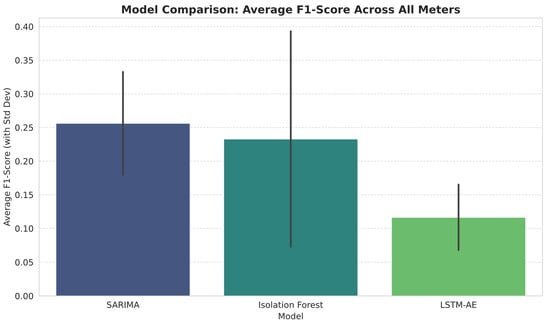
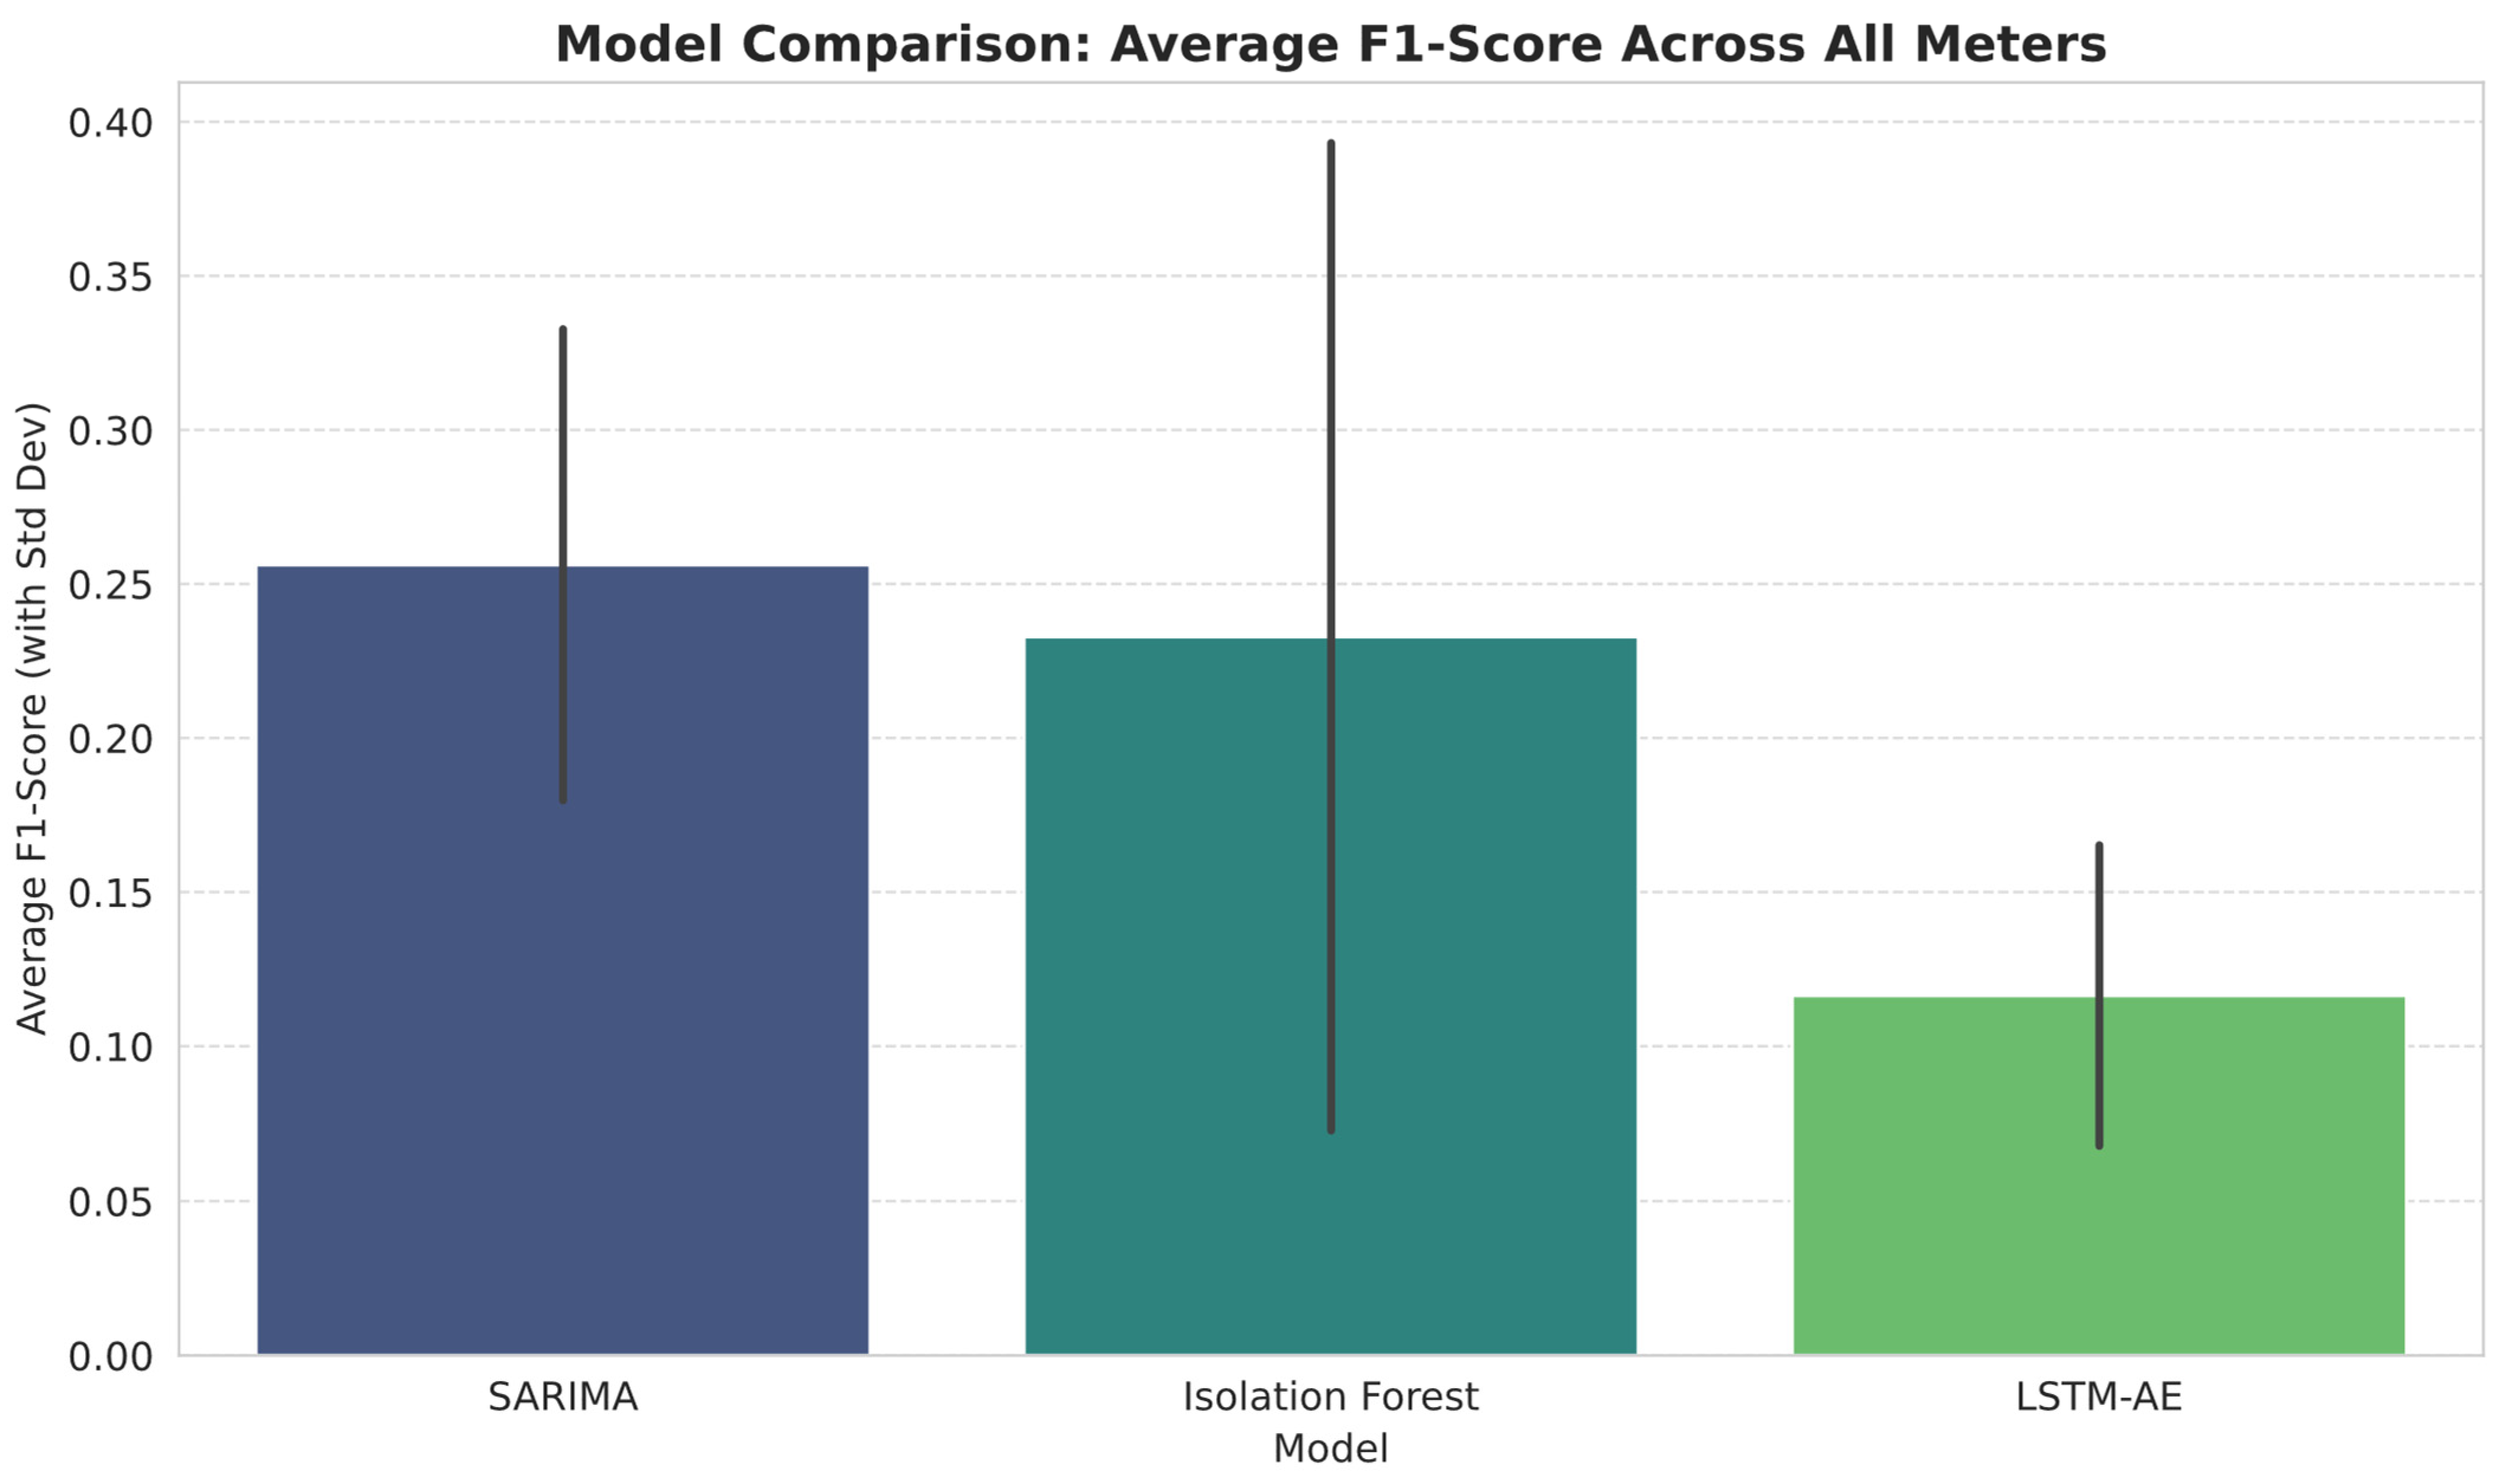
The experimental results demonstrate universally low performance across all tested models, indicating significant difficulty in detecting the injected anomalies. A comparison of the F1-Scores, visualized in Figure 2, shows that the SARIMA model achieved the highest average F1-Score (0.256), marginally surpassing the Isolation Forest (0.233). The LSTM-Autoencoder exhibited the weakest performance by a substantial margin (0.110).
Figure 2.
Comparison of Average F1-Scores across all seven meters. Error bars represent the standard deviation between meters.
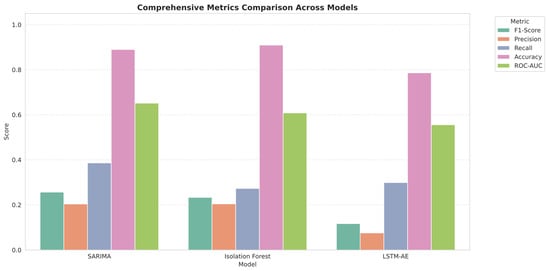
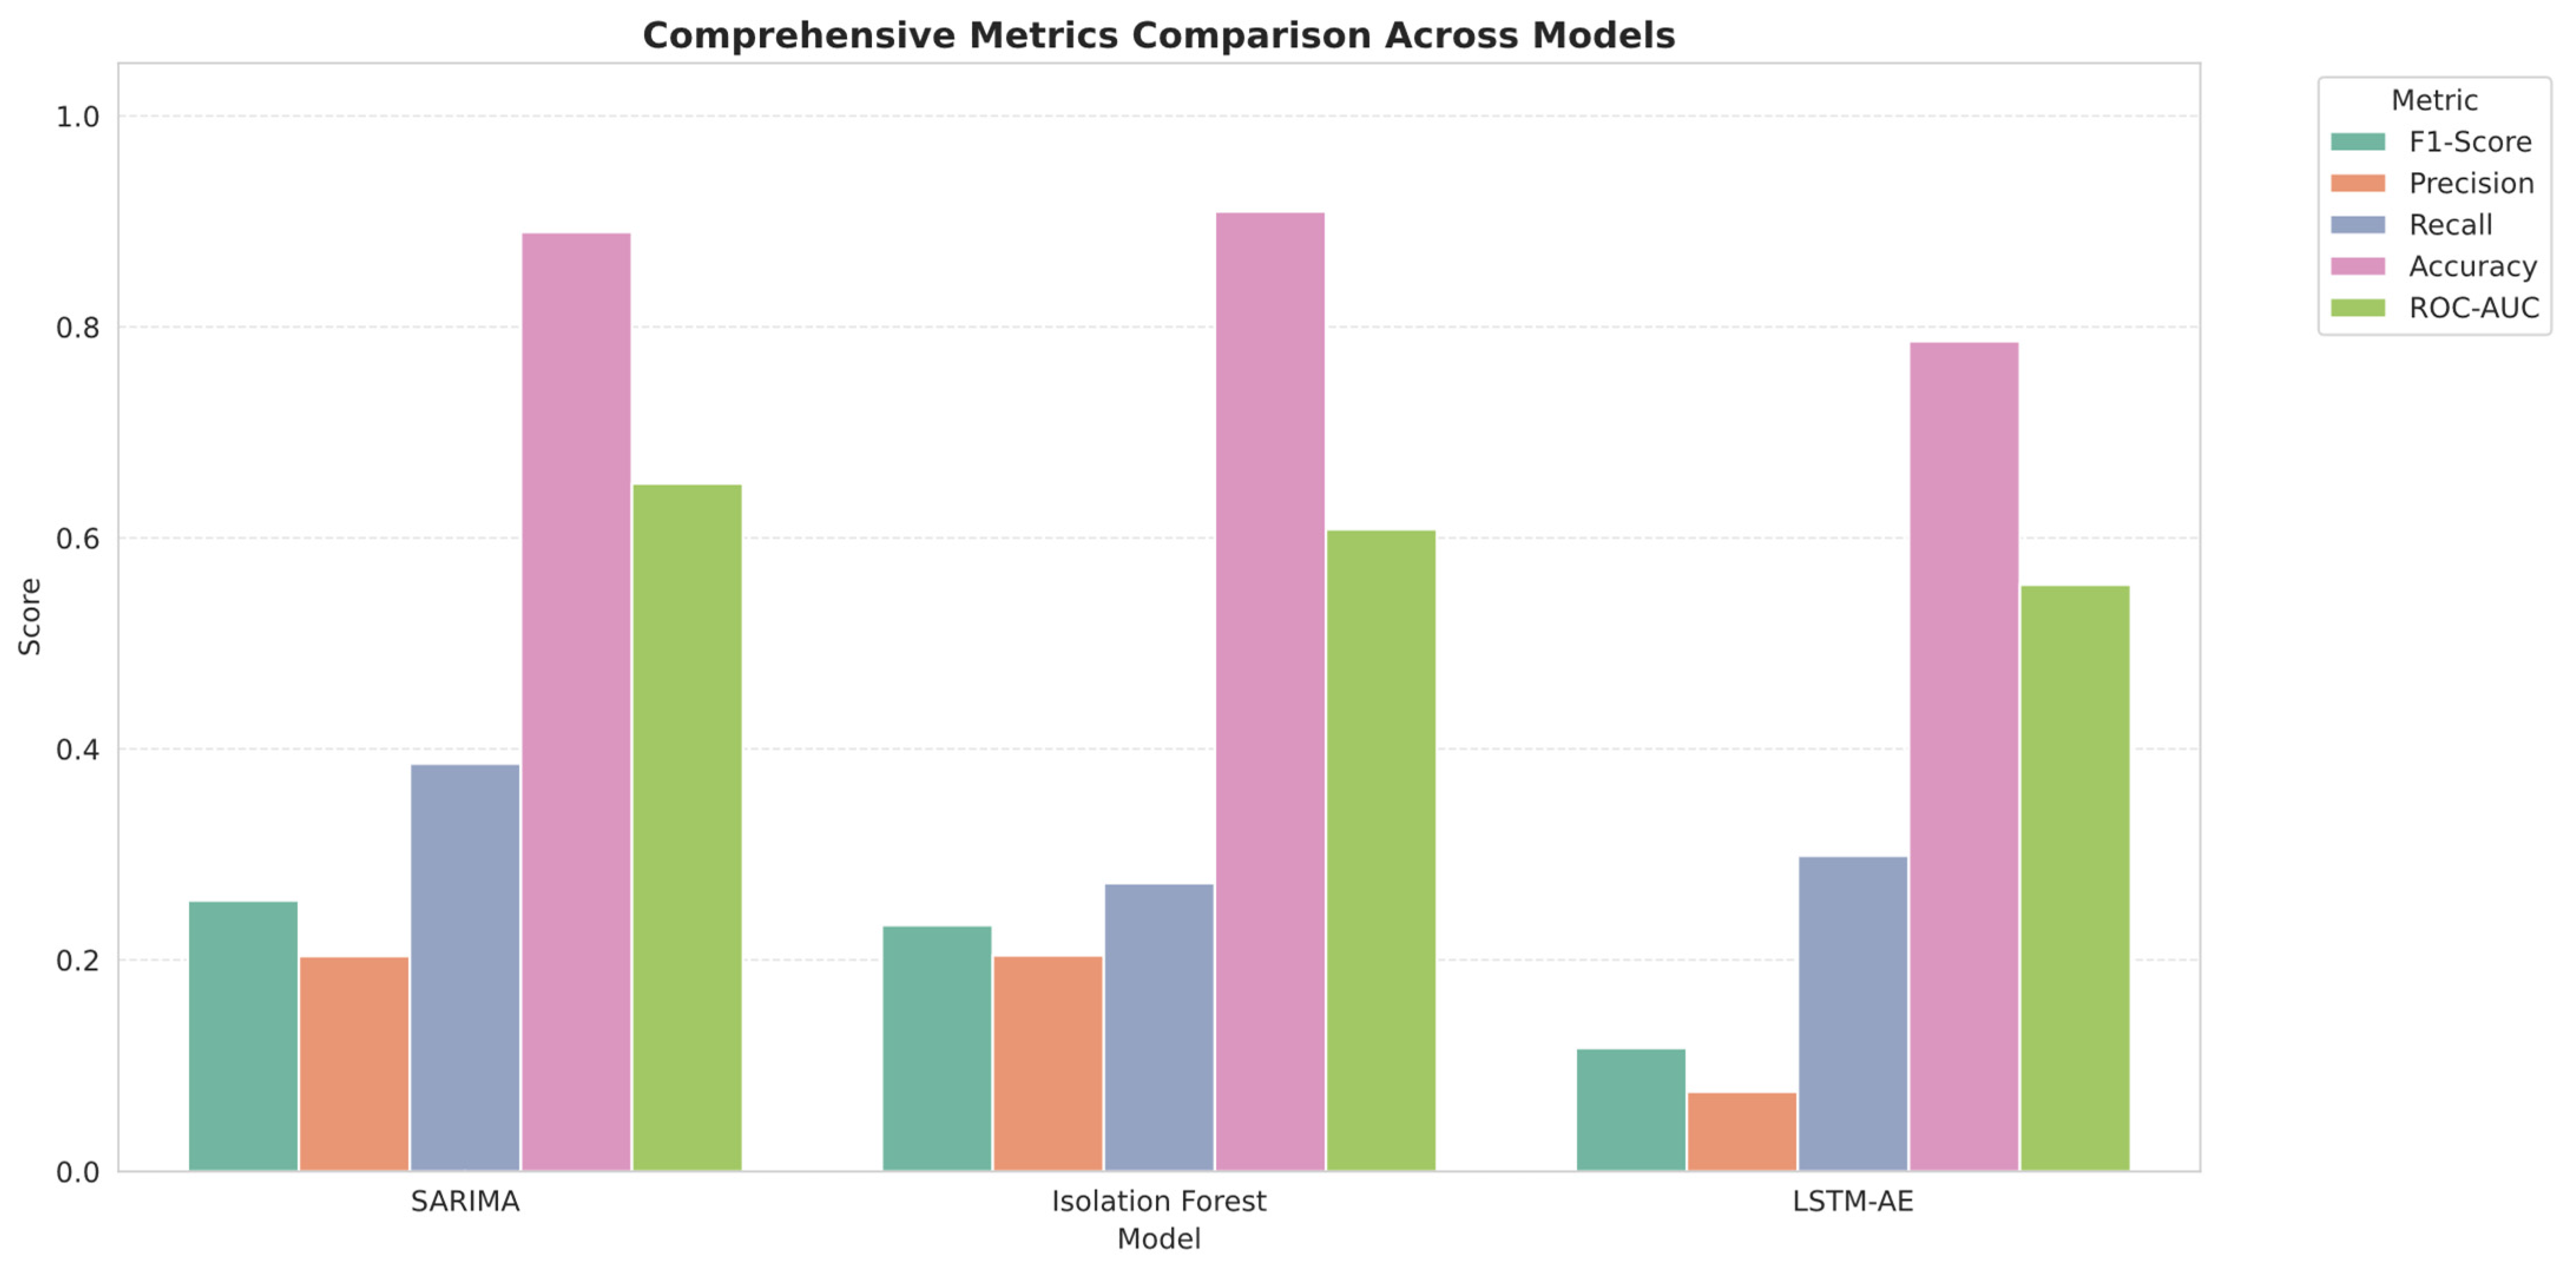
A detailed examination of the component metrics reveals critical deficiencies in model behavior, as visualized in Figure 3. The most striking observation is the extremely low Precision across all models. Both SARIMA and Isolation Forest achieved a Precision of only 0.204, while the LSTM-AE reached only 0.074. This signifies that approximately 80% or more of the anomalies flagged by the models were, in fact, normal data points (false positives).
Figure 3.
Detailed comparison of average Precision, Recall, Accuracy, ROC-AUC and F1-Scores across the three models.
In terms of Recall, performance was also poor. SARIMA achieved the highest Recall (0.386), meaning it still missed over 60% of the actual anomalies. The Isolation Forest and LSTM-AE exhibited even lower Recall (0.273 and 0.235, respectively).
3.2. Qualitative Analysis and Model Behavior
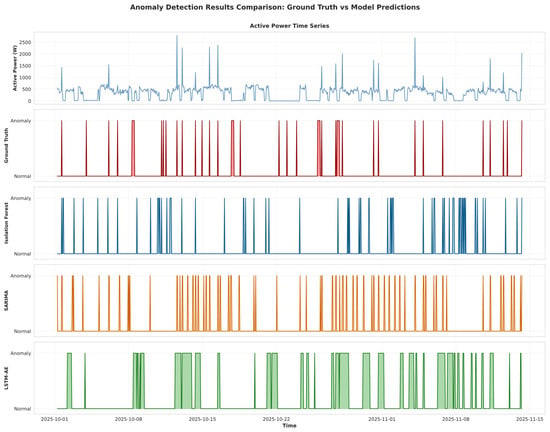
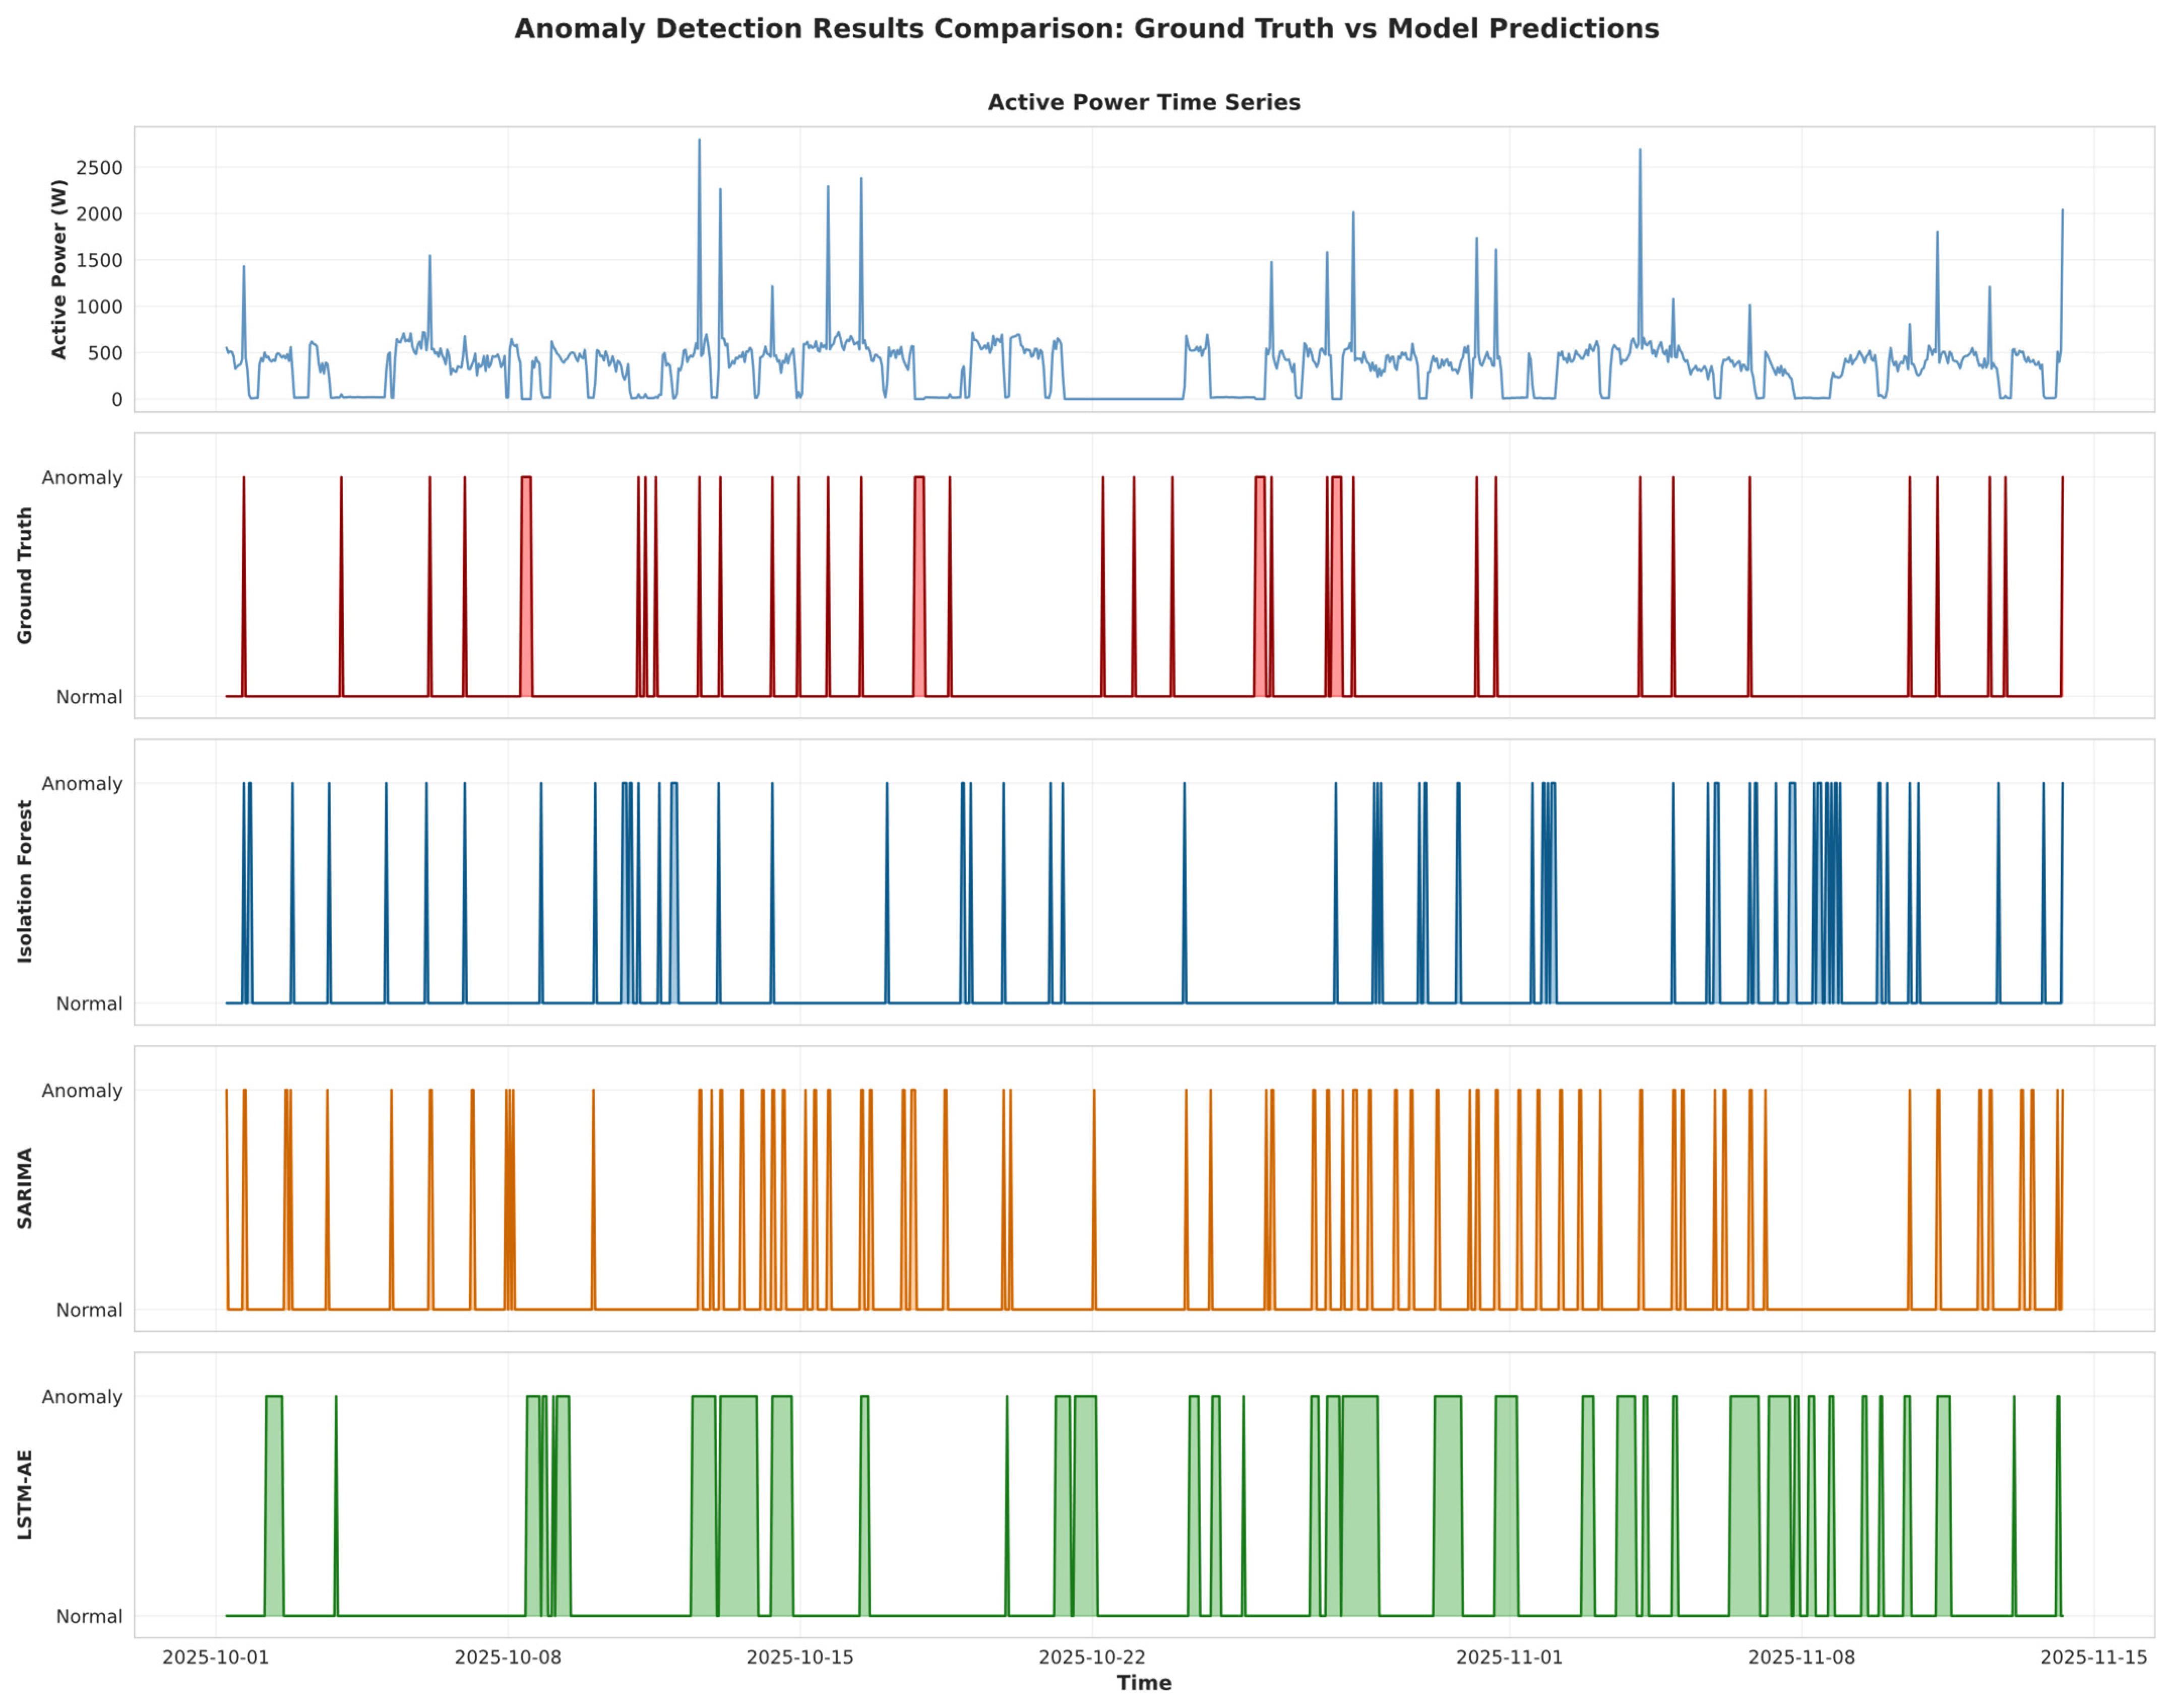
A visualization of the model predictions against the ground truth for a representative meter (Figure 4) illustrates the behavioral issues identified in the quantitative analysis. In an outcome consistent with Table 1, models exhibit a tendency to over-flag anomalies, frequently classifying normal operational variations as anomalous. Simultaneously, many of the actual ground truth anomalies are missed.
Figure 4.
Time-series visualization of anomaly detection results for a representative meter. Ground truth anomalies are compared with predictions from Isolation Forest, SARIMA, and LSTM-AE.
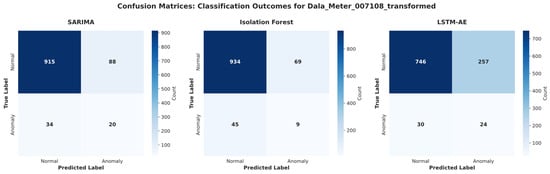
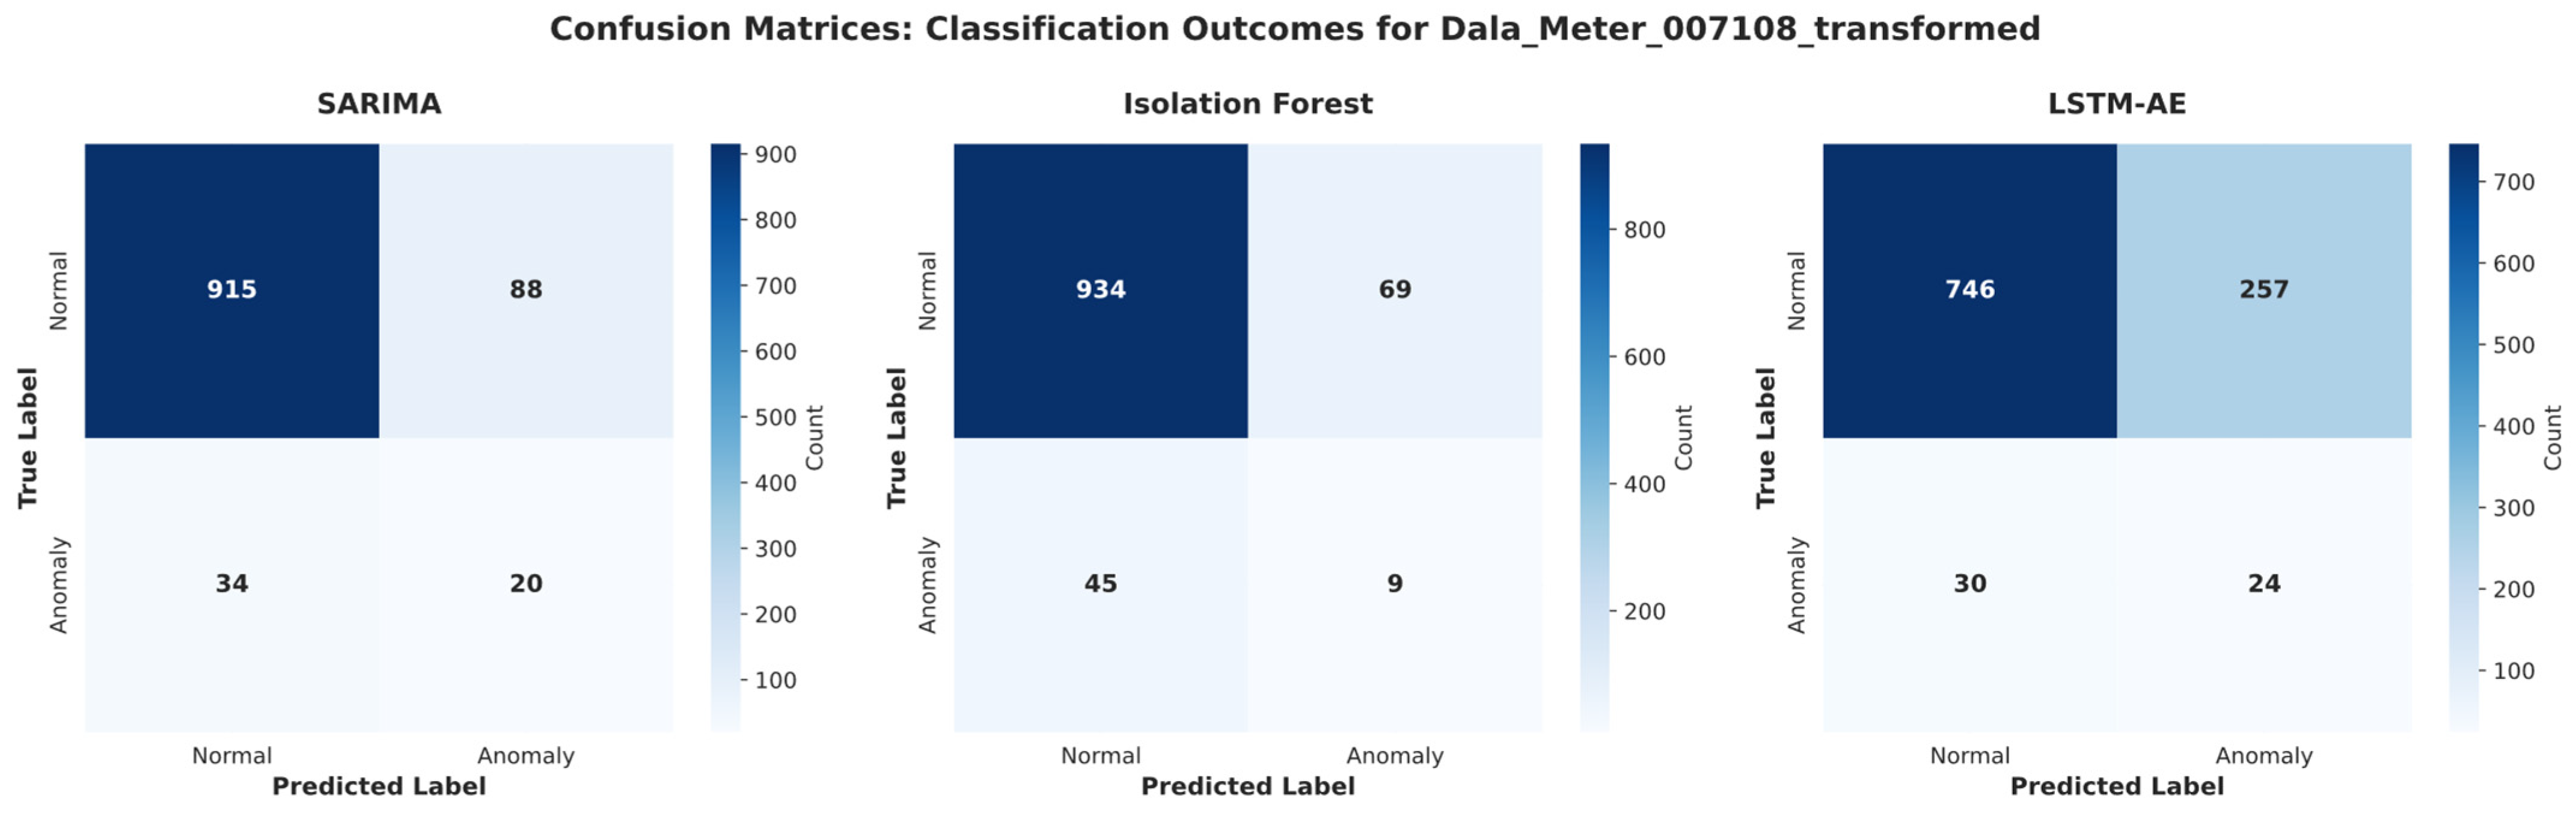
The confusion matrices for a representative meter (Figure 5) further quantify these observations. For all models, the number of False Positives (FP) significantly outweighs the number of True Positives (TP), leading to the low precision scores. Furthermore, the number of False Negatives (FN) is high across the board, indicating poor detection sensitivity.
Figure 5.
Confusion matrices for the three models evaluated on a representative meter, detailing the classification outcomes.
3.3. Disaggregated Detection by Anomaly Type
To provide diagnostic insight into model-specific behaviors, detection performance was disaggregated by anomaly type. Table 2 presents the recall rates separately for point anomalies (60% of injected anomalies) and collective anomalies (40%).
Table 2.
Disaggregated detection performance by anomaly type for a representative meter.
The disaggregated results reveal distinct model behaviors. SARIMA demonstrates strong performance on point anomalies (Recall = 0.633) but near-complete failure on collective anomalies (Recall = 0.042). This is consistent with its design: the 3σ threshold on prediction residuals is well-suited for detecting sudden spikes but cannot identify sustained flatline periods where the signal simply deviates from expected patterns without exhibiting large instantaneous errors.
In contrast, the LSTM-Autoencoder exhibits more balanced detection, achieving 0.500 recall on point anomalies and 0.375 on collective anomalies. The reconstruction-based approach can detect both types because flatline sequences produce sustained reconstruction errors across the lookback window.
Isolation Forest performed poorly on both anomaly types (0.267 and 0.042, respectively), suggesting that the multivariate feature space may not provide clear separation between normal and anomalous points under the ‘auto’ contamination setting.
3.4. Threshold Sensitivity Analysis
To demonstrate that the observed high false-positive rate is a structural challenge rather than an artifact of a single threshold choice, a sensitivity analysis was conducted for the SARIMA model. Table 3 presents detection performance across a range of σ-multipliers from 2σ to 4σ.
Table 3.
SARIMA threshold sensitivity analysis for a representative meter.
The results demonstrate a clear precision-recall tradeoff. At the most sensitive threshold (2σ), the model achieves high recall (0.792) but extremely low precision (0.091), meaning over 90% of flagged points are false positives. Increasing the threshold to 4σ dramatically improves precision to 0.500 while maintaining recall at 0.321—achieving the highest F1-score (0.391) in this analysis.
Notably, even at the most restrictive threshold tested (4σ), precision remains at 0.500, indicating that half of all alerts would still be false positives. This confirms that the high false-positive rate observed in this study is a structural limitation arising from the overlap between normal operational variability and anomalous patterns, rather than an artifact of the specific 3σ threshold employed in the main analysis.
4. Discussion
The results of the benchmark comparison provide critical insights into the challenges of applying standard anomaly detection methodologies to this industrial smart meter dataset.
4.1. Hypothesis Refutation and Baseline Superiority
The initial hypothesis—positing that the multivariate models, particularly the LSTM-Autoencoder, would outperform the univariate baseline—was refuted. Surprisingly, the SARIMA model achieved the highest F1-Score and Recall (Table 1). This suggests that the injected anomalies were slightly more discernible through univariate statistical deviations in active power than through the multivariate relationships or temporal reconstructions utilized by the other models. However, the performance of SARIMA (F1-Score 0.256) remains far below the threshold required for practical industrial deployment.
4.2. The Critical Issue of Low Precision
The most significant finding of this study is the universally low precision across all models. With precision scores around 0.20 or lower, the false-positive rate is excessively high. In an industrial setting, this would render the systems unusable, as engineers would be overwhelmed by false alarms (alarm fatigue), leading to a loss of trust in the monitoring system.
This high rate of false positives indicates that the models, in their current configuration, are overly sensitive to the inherent variability of the bakery manufactory’s operations. Normal events, such as equipment startups, shutdowns, or transient load changes, are being incorrectly classified as anomalies.
4.2.1. Sources of False Positives
A detailed examination of false positive instances reveals several contributing factors:
- Operational Transients: The bakery manufactory exhibits regular transient events during equipment startup (typically between 6:00 and 8:00) and shutdown (18:00–20:00) cycles. These transients manifest as rapid changes in active power and current that resemble the injected spike anomalies, leading to systematic misclassification.
- Load Variability: Industrial baking equipment operates across multiple production cycles with varying loads. This inherent variability in “normal” operation expands the distribution of normal data points, making threshold-based detection unreliable.
- Multicollinearity: The nine features exhibit strong correlations (e.g., voltage phases, current phases with power), potentially introducing redundancy that confuses multivariate models rather than providing additional discriminative signal.
4.2.2. Data Quality Considerations
The meter with 6.79% missing data (Dala_Meter_007108) showed marginally lower performance across all models, suggesting that data imputation may introduce artifacts that affect model behavior. This observation underscores the importance of data completeness in anomaly detection applications.
4.3. Failures in Multivariate Modeling
The Isolation Forest and LSTM-Autoencoder performed worse than the univariate baseline. Several factors likely contributed to this outcome. For the Isolation Forest, the use of ‘contamination = ‘auto’’ may have led the algorithm to overestimate the anomaly rate in the training data due to its natural variability, resulting in an overly sensitive model.
For the LSTM-Autoencoder, the poor performance (F1-Score 0.110, Precision 0.074) suggests significant difficulties in establishing a robust representation of “normal” temporal behavior. Defining an effective anomaly threshold based on reconstruction error is a known challenge. If the reconstruction error for normal data is already highly variable, the 99th percentile threshold used may be ineffective, leading to excessive false positives as the model fails to accurately reconstruct normal but complex patterns.
4.4. Implications and Limitations
The results indicate that off-the-shelf implementations of these algorithms are inadequate for anomaly detection in this specific industrial context. The high variability and complexity of the data demand more sophisticated approaches.
4.4.1. Practical Implications of False Positive Rates
The observed precision rates (≤0.204) translate to an operational environment where more than 80% of triggered alarms would be false positives. In industrial practice, this creates several critical concerns:
- •
- Alarm Fatigue: Maintenance personnel receiving an excessive volume of false alerts will inevitably begin ignoring or disabling alerts, potentially missing genuine equipment failures.
- •
- Resource Waste: Each false alarm requires investigation time, estimated at 15–30 min per incident for industrial electricians, resulting in significant labor costs.
- •
- System Distrust: High false positive rates erode confidence in automated monitoring systems, reducing the likelihood of organizational adoption of predictive maintenance technologies.
- •
- Threshold Tuning Tradeoffs: Adjusting thresholds to reduce false positives would necessarily decrease recall, potentially allowing actual anomalies (and corresponding equipment failures) to go undetected.
4.4.2. Limitations of Synthetic Anomaly Injection
The synthetic anomalies used in this study—comprising point anomalies (60%) and collective anomalies (40%)—represent a subset of real-world industrial fault scenarios. Several important anomaly types were not simulated:
- •
- Trend Anomalies: Gradual equipment degradation (e.g., motor bearing wear) typically manifests as slow drift in power consumption over days or weeks, a pattern not captured by point or flatline injections.
- •
- Periodic Fluctuation Anomalies: Abnormal cyclic behavior, such as unstable thermostat control or intermittent electrical faults, produces oscillating patterns distinct from the injected anomaly types.
- •
- Multi-variable Collaborative Anomalies: Real equipment failures often produce correlated anomalies across multiple electrical parameters (e.g., simultaneous voltage sag and current spike), whereas the injected anomalies affected only active power and corresponding currents.
The mismatch between synthetic and real anomaly characteristics likely affects the ecological validity of the performance metrics. Models may perform differently on real industrial faults, and future research should incorporate realistic fault simulations or, ideally, utilize datasets with labeled real-world anomalies.
4.4.3. Model Configuration Limitations
The poor performance might also be attributed to suboptimal model configurations. The SARIMA parameters were not optimized via ACF/PACF analysis, the Isolation Forest contamination rate was set automatically rather than tuned, and the LSTM-Autoencoder threshold was fixed at the 99th percentile without sensitivity analysis. The assumption of the training data being entirely clean may also have been violated, potentially confusing the models during the training phase.
4.5. Scope Clarification: Benchmark vs. Model Limitations
To prevent overgeneralization of the results, Table 4 clarifies which conclusions can legitimately be drawn from this benchmark and which aspects remain explicitly out of scope.
Table 4.
Scope clarification: Benchmark conclusions vs. out-of-scope interpretations.
The results should therefore be interpreted as identifying the challenges that baseline methods face when applied to complex industrial data, rather than as evidence of fundamental model inadequacy.
5. Conclusions
This study conducted a comparative analysis of SARIMA, Isolation Forest, and LSTM-Autoencoder for anomaly detection in multivariate smart meter data acquired from a bakery manufacturing. The models were intentionally evaluated in their baseline configurations to establish benchmark performance levels and identify the practical challenges inherent in this domain. The results demonstrated universally poor performance, with F1-Scores ranging from 0.110 to 0.256. Contrary to expectations, the univariate SARIMA model slightly outperformed the multivariate approaches. All models suffered from critically low precision (≤0.204), highlighting a failure to distinguish between true anomalies and normal operational variability.
These findings underscore the significant challenges of anomaly detection in complex industrial environments and provide a transparent baseline against which future methods can be evaluated.
Future research should address the identified limitations through a structured progression:
- Hyperparameter Optimization: Systematic grid search for SARIMA (p,d,q)(P,D,Q,s) parameters using ACF/PACF analysis, Isolation Forest contamination rate tuning, and LSTM-AE architecture and threshold selection optimization.
- Advanced Feature Engineering: Development of domain-specific derived features such as phase imbalance indices, power factor deviation metrics, and temporal contextual features (time-of-day, day-of-week) that encode operational patterns.
- Adaptive Thresholding: Implementation of dynamic threshold strategies that adjust based on operational context (e.g., different thresholds for production vs. idle periods).
- Hybrid/Context-Aware Models: Integration of process knowledge (production schedules, equipment specifications) to reduce false positives during known operational transients.
- Semi-Supervised Approaches: If limited labeled anomaly data becomes available, semi-supervised methods may leverage both labeled and unlabeled data for improved detection accuracy.
Author Contributions
Conceptualization, A.A., S.A. and G.A.; methodology, A.A. and O.A.; software, A.A. and Y.F.; validation, A.A., S.A., Y.F., B.D. and O.A.; formal analysis, A.A. and O.A.; investigation, A.A., Y.F. and B.D.; resources, S.A. and G.A.; data curation, A.A., B.D. and O.A.; writing—original draft preparation, A.A.; writing—review and editing, A.A., S.A., G.A., Y.F., B.D. and O.A.; visualization, A.A.; supervision, S.A. and G.A.; project administration, A.A.; funding acquisition, S.A. and G.A. All authors have read and agreed to the published version of the manuscript.
Funding
This research was supported by the project “Development of a digital twin of a food processing enterprise using artificial intelligence and IIoT technologies” (2024–2026), funded by the Ministry of Science and Higher Education of the Republic of Kazakhstan (Grant No. BR24992975). The APC was funded by the same grant.
Institutional Review Board Statement
Not applicable.
Informed Consent Statement
Not applicable.
Data Availability Statement
The raw data supporting the conclusions of this article will be made available by the authors on request.
Acknowledgments
During the preparation of this manuscript, the author(s) used a Generative AI tool to check spelling, English correctness, and formatting. The authors have reviewed and edited the output and take full responsibility for the content of this publication.
Conflicts of Interest
The authors declare no conflicts of interest.
Abbreviations
The following abbreviations are used in this manuscript:
| ACF | Autocorrelation Function |
| AI | Artificial Intelligence |
| AMI | Advanced Metering Infrastructure |
| ARIMA | Autoregressive Integrated Moving Average |
| Bi-LSTM | Bidirectional Long Short-Term Memory |
| CAE | Convolutional Autoencoder |
| CGA-RF | CNN-GRU with Attention and Random Forest |
| CNN | Convolutional Neural Network |
| CVAE-A | Conditional Variational Autoencoder with Attention |
| DDoS | Distributed Denial of Service |
| DL | Deep Learning |
| DRL | Deep Reinforcement Learning |
| DRL-NSABC | Deep Reinforcement Learning with Novel Search Artificial Bee Colony |
| ETD | Electricity Theft Detection |
| FDIA | False Data Injection Attack |
| FPR | False Positive Rate |
| GNN | Graph Neural Network |
| GRU | Gated Recurrent Unit |
| IES | Integrated Energy System |
| IF | Isolation Forest |
| IoT | Internet of Things |
| K-MLX | K-Means, LSTM, XGBoost |
| KNN | K-Nearest Neighbors |
| LEAD | Load Energy Anomaly Detection |
| LLM | Large Language Model |
| LSTM | Long Short-Term Memory |
| LSTM-AE | Long Short-Term Memory Autoencoder |
| MAE | Mean Absolute Error |
| ML | Machine Learning |
| NILM | Non-Intrusive Load Monitoring |
| NTL | Non-Technical Loss |
| PACF | Partial Autocorrelation Function |
| PCA | Principal Component Analysis |
| RNN | Recurrent Neural Network |
| ROC-AUC | Receiver Operating Characteristic—Area Under Curve |
| SARIMA | Seasonal Autoregressive Integrated Moving Average |
| SGTrans | Sparse Graph Transformer |
| SVD | Singular Value Decomposition |
| TF-IDF | Term Frequency-Inverse Document Frequency |
| VAE | Variational Autoencoder |
| VAE-GRU | Variational Autoencoder with Gated Recurrent Unit |
| VAE-LSTM | Variational Autoencoder with Long Short-Term Memory |
| VOD | Vision-Based Outlier Detection |
References
- Jung, M.; Jang, H.; Kwon, W.; Seo, J.; Park, S.; Park, B.; Park, J.; Yu, D.; Lee, S. A Comparative Study of Customized Algorithms for Anomaly Detection in Industry-Specific Power Data. Energies 2025, 18, 3720. [Google Scholar] [CrossRef] [Scilit]
- Badawi, S.A.; Guessoum, D.; Elbadawi, I.; Albadawi, A. A Novel Time-Series Transformation and Machine-Learning-Based Method for NTL Fraud Detection in Utility Companies. Mathematics 2022, 10, 1878. [Google Scholar] [CrossRef] [Scilit]
- Duarte, M.S.; Martins, G.; Oliveira, P.; Fernandes, B.; Ferreira, E.C.; Alves, M.M.; Lopes, F.; Pereira, M.A.; Novais, P. A Review of Computational Modeling in Wastewater Treatment Processes. ACS ES&T Water 2023, 4, 784–804. [Google Scholar] [CrossRef] [Scilit]
- Nevisi, M.M.S.; Shoeibi, M.; Hernando-Gallego, F.; Martín, D.; Khatami, S.S. An Evolutionary Deep Reinforcement Learning-Based Framework for Efficient Anomaly Detection in Smart Power Distribution Grids. Energies 2025, 18, 2435. [Google Scholar] [CrossRef] [Scilit]
- Hu, M.; Zhang, F.; Wu, H. Anomaly Detection and Identification Method for Shield Tunneling Based on Energy Consumption Perspective. Appl. Sci. 2024, 14, 2202. [Google Scholar] [CrossRef] [Scilit]
- Dembski, J.; Wiszniewski, B.; Kołakowska, A. Anomaly Detection and Segmentation in Measurement Signals on Edge Devices Using Artificial Neural Networks. Sensors 2025, 25, 5526. [Google Scholar] [CrossRef] [Scilit]
- Thulasiraman, P.; Hackett, M.; Musgrave, P.; Edmond, A.; Seville, J. Anomaly Detection in a Smart Microgrid System Using Cyber-Analytics: A Case Study. Energies 2023, 16, 7151. [Google Scholar] [CrossRef] [Scilit]
- Mendes, T.; Cardoso, P.J.S.; Monteiro, J.; Raposo, J. Anomaly Detection of Consumption in Hotel Units: A Case Study Comparing Isolation Forest and Variational Autoencoder Algorithms. Appl. Sci. 2022, 13, 314. [Google Scholar] [CrossRef] [Scilit]
- Guo, W.; Sun, S.; Tang, C.; Li, G.; Bai, X.; Zhao, Z. Classification of Anomaly Patterns in Integrated Energy Systems Based on Conditional Variational Autoencoder and Attention Mechanism. Energies 2023, 16, 4367. [Google Scholar] [CrossRef] [Scilit]
- Qureshi, M.; Arbab, M.A.; Rehman, S.U. Deep learning-based forecasting of electricity consumption. Sci. Rep. 2024, 14, 6489. [Google Scholar] [CrossRef] [Scilit] [PubMed]
- Bonci, A.; Fredianelli, L.; Kermenov, R.; Longarini, L.; Longhi, S.; Pompei, G.; Prist, M.; Verdini, C. DeepESN Neural Networks for Industrial Predictive Maintenance through Anomaly Detection from Production Energy Data. Appl. Sci. 2024, 14, 8686. [Google Scholar] [CrossRef] [Scilit]
- Mu, T.; Yu, Y.; Feng, G.; Luo, H.; Yang, H. Detecting anomalous electricity consumption with transformer and synthesized anomalies. PeerJ Comput. Sci. 2023, 9, e1721. [Google Scholar] [CrossRef] [Scilit] [PubMed]
- Śmiałkowski, T.; Czyżewski, A. Detection of Anomalies in the Operation of a Road Lighting System Based on Data from Smart Electricity Meters. Energies 2022, 15, 9438. [Google Scholar] [CrossRef] [Scilit]
- Li, C.; Liu, D.; Wang, M.; Wang, H.; Xu, S. Detection of Outliers in Time Series Power Data Based on Prediction Errors. Energies 2023, 16, 582. [Google Scholar] [CrossRef] [Scilit]
- Alraddadi, G.H.; Othman, M.T.B. Development of an Efficient Electricity Consumption Prediction Model using Machine Learning Techniques. Int. J. Adv. Comput. Sci. Appl. 2022, 13, 379. [Google Scholar] [CrossRef] [Scilit]
- Lightbody, D.; Ngo, D.-M.; Temko, A.; Murphy, C.C.; Popovici, E. Dragon_Pi: IoT Side-Channel Power Data Intrusion Detection Dataset and Unsupervised Convolutional Autoencoder for Intrusion Detection. Future Internet 2024, 16, 88. [Google Scholar] [CrossRef] [Scilit]
- Sathupadi, K.; Achar, S.; Bhaskaran, S.V.; Faruqui, N.; Abdullah-Al-Wadud, M.; Uddin, J. Edge-Cloud Synergy for AI-Enhanced Sensor Network Data: A Real-Time Predictive Maintenance Framework. Sensors 2024, 24, 7918. [Google Scholar] [CrossRef] [Scilit]
- Papaioannou, C.; Tzitzios, I.; Papaioannou, A.; Dimara, A.; Anagnostopoulos, C.-N.; Krinidis, S. EnergiQ: A Prescriptive Large Language Model-Driven Intelligent Platform for Interpreting Appliance Energy Consumption Patterns. Sensors 2025, 25, 4911. [Google Scholar] [CrossRef] [Scilit]
- Moure-Garrido, M.; Campo, C.; Garcia-Rubio, C. Entropy-Based Anomaly Detection in Household Electricity Consumption. Energies 2022, 15, 1837. [Google Scholar] [CrossRef] [Scilit]
- Fabri, L.; Leuthe, D.; Schneider, L.-M.; Wenninger, S. Fostering non-intrusive load monitoring for smart energy management in industrial applications: An active machine learning approach. Energy Inform. 2025, 8, 54. [Google Scholar] [CrossRef] [Scilit]
- Yang, Q.; Zhang, J.; Zhang, J.; Sun, C.; Xie, S.; Liu, S.; Ji, Y. Graph Transformer Network Incorporating Sparse Representation for Multivariate Time Series Anomaly Detection. Electronics 2024, 13, 2032. [Google Scholar] [CrossRef] [Scilit]
- Pan, H.; Yin, Z.; Jiang, X. High-Dimensional Energy Consumption Anomaly Detection: A Deep Learning-Based Method for Detecting Anomalies. Energies 2022, 15, 6139. [Google Scholar] [CrossRef] [Scilit]
- Ortiz-Garces, I.; Villegas-Ch, W.; Luján-Mora, S. Implementation of edge AI for early fault detection in IoT networks: Evaluation of performance and scalability in complex applications. Discov. Internet Things 2025, 5, 108. [Google Scholar] [CrossRef] [Scilit]
- Kawoosa, A.I.; Prashar, D.; Anantha Raman, G.R.; Bijalwan, A.; Haq, M.A.; Aleisa, M.; Alenizi, A. Improving Electricity Theft Detection Using Electricity Information Collection System and Customers’ Consumption Patterns. Energy Explor. Exploit. 2024, 42, 1684–1714. [Google Scholar] [CrossRef] [Scilit]
- Glass, A.; Sithungu, S.; Glass, R.; Müller-Lietzkow, J. Intrusion Detection in Smart Buildings Using Energy Anomalies: A Long Short-Term Memory Model Approach. Eur. Conf. Cyber Warf. Secur. 2025, 24, 135–140. [Google Scholar] [CrossRef] [Scilit]
- Abedzadeh, S.; Bhattacharjee, S. Mitigating Impact of Data Poisoning Attacks on CPS Anomaly Detection with Provable Guarantees. Information 2025, 16, 428. [Google Scholar] [CrossRef] [Scilit]
- Dakheel, F.; Çevik, M. Optimizing Smart Grid Load Forecasting via a Hybrid Long Short-Term Memory-XGBoost Framework: Enhancing Accuracy, Robustness, and Energy Management. Energies 2025, 18, 2842. [Google Scholar] [CrossRef] [Scilit]
- Mao, Z.; Zhou, B.; Huang, J.; Liu, D.; Yang, Q. Research on Anomaly Detection Model for Power Consumption Data Based on Time-Series Reconstruction. Energies 2024, 17, 4810. [Google Scholar] [CrossRef] [Scilit]
- Alvear-Puertas, V.E.; Burbano-Prado, Y.A.; Rosero-Montalvo, P.D.; Tözün, P.; Marcillo, F.; Hernandez, W. Smart and Portable Air-Quality Monitoring IoT Low-Cost Devices in Ibarra City, Ecuador. Sensors 2022, 22, 7015. [Google Scholar] [CrossRef] [Scilit]
- Zeng, Q.; Peng, F.; Han, X. Towards sustainable architecture: Enhancing green building energy consumption prediction with integrated variational autoencoders and self-attentive gated recurrent units from multifaceted datasets. PLoS ONE 2025, 20, e0317514. [Google Scholar] [CrossRef] [Scilit] [PubMed]
- Azar, J.; Al Saleh, M.; Couturier, R.; Noura, H. Text Mining and Unsupervised Deep Learning for Intrusion Detection in Smart-Grid Communication Networks. IoT 2025, 6, 22. [Google Scholar] [CrossRef] [Scilit]
- Fu, C.; Arjunan, P.; Miller, C. Trimming outliers using trees. In Proceedings of the BuildSys ’22: The 9th ACM International Conference on Systems for Energy-Efficient Buildings, Cities, and Transportation, Boston, MA, USA, 9–10 November 2022; ACM: New York, NY, USA, 2022; pp. 456–461. [Google Scholar] [CrossRef] [Scilit]
- Tian, J.; Zhao, T.; Li, Z.; Li, T.; Bie, H.; Loftness, V. VOD: Vision-Based Building Energy Data Outlier Detection. Mach. Learn. Knowl. Extr. 2024, 6, 965–986. [Google Scholar] [CrossRef] [Scilit]

Disclaimer/Publisher’s Note: The statements, opinions and data contained in all publications are solely those of the individual author(s) and contributor(s) and not of MDPI and/or the editor(s). MDPI and/or the editor(s) disclaim responsibility for any injury to people or property resulting from any ideas, methods, instructions or products referred to in the content. |
© 2026 by the authors. Licensee MDPI, Basel, Switzerland. This article is an open access article distributed under the terms and conditions of the Creative Commons Attribution (CC BY) license.