


Abstract
The wave energy resource along the Azores coast is evaluated for the present (1990–2019) and future (2030–2059) periods using the third-generation wave model WAVEWATCH III, forced by winds and sea-ice cover from the RCP8.5 EC-Earth integration dynamically downscaled with the Weather Research and Forecasting model. The results indicate that the region is characterized by a high-energy wave climate, with mean wave power values typically ranging between 30 and 40 kW/m. A statistical comparison between the two periods shows a moderate reduction in wave energy potential under future conditions, with strong spatial variability. The performance of four wave energy converters (AquaBuoy, Wavestar, Oceantec, and Atargis) is analyzed, revealing significant differences in energy production and capacity factor depending on device–site matching. A techno-economic evaluation is performed by estimating the LCOE, accounting for capital expenditure, operational costs, device lifetime, and annual energy production (AEP). The results demonstrate that economic performance is primarily driven by energy production rather than capital cost alone, and that wave energy exploitation in the Azores remains viable under near-future climate conditions.
1. Introduction
The rising need for environmentally sustainable energy resources has stimulated technological progress in wave energy conversion systems. Ocean waves and offshore wind resources provide substantial potential for renewable energy generation. Among marine renewable energies, ocean wave energy represents a highly attractive resource due to its high energy density, predictability, and complementarity with wind and solar power. Compared with other renewable sources, wave energy presents reduced intermittency and often peaks during winter periods, coinciding with higher electricity demand.
The assessment of wave potential has evolved significantly over recent decades. Early studies relied mainly on simplified analytical formulations and limited in situ measurements, providing preliminary estimates of wave power availability [1].
The assessment of wave energy potential has evolved significantly over recent decades. Early studies relied mainly on simplified analytical formulations and limited in situ measurements, providing preliminary estimates of wave power availability. With advances in numerical modeling, satellite observations, and long-term hindcast databases, modern assessments now incorporate spectral wave models, high-resolution regional simulations, and probabilistic approaches that account for temporal variability and extreme sea states [2,3,4].
Current climate conditions are generally assessed using reanalysis products and satellite observations, whereas future projections rely on global wave models forced by wind and sea-ice fields derived from climate simulations (e.g., CMIP5 or CMIP6). These simulations generate Earth system projections up to the end of the twenty-first century under various Representative Concentration Pathways (RCPs) [5], although ocean wave processes are not explicitly resolved.
More recently, climate change projections have been integrated into wave resource assessments, enabling evaluation of future changes in the wave climate and their implications for energy production and offshore infrastructure reliability.
Near-future wave energy resources in the Black Sea were evaluated in [6] under different climate change scenarios using numerical wave modeling forced by climate projections. The study identified spatial variations in projected wave power and highlighted the potential influence of climate change on future wave energy exploitation.
Future changes in the global wave climate were analyzed in [7] using a 155-member ensemble derived from ten wave model studies forced by CMIP5 climate models under the RCP8.5 scenario. The authors identified climate model selection as the main source of projection uncertainty, rather than the wave model or downscaling approach, emphasizing the importance of multi-model and multi-method frameworks for reliable future wave climate assessments.
Within the CLIMENA project, present and future-climate simulations were made, using the WWIII model to produce high-resolution wave climatic data. In [8] performed a comparison between climate simulations for the period 1980–2009 and ERA5 reanalysis data over the North Atlantic basin, demonstrating that the simulations adequately reproduce recent climate conditions in terms of mean significant wave height (Hs), mean wave period (Tm), peak period (Tp), and wind speed (WND). In a subsequent study, [9] generated global wave simulations using the WWIII model driven by wind and sea-ice fields from a CMIP5 model under the RCP8.5 scenario, extending projections to the end of the twenty-first century. Four 30-year time slices representing past, present, mid-century, and late-century climates were analyzed to investigate changes in wave and wind conditions.
In parallel with improvements in resource assessment, Wave Energy Converter (WEC) technologies have undergone continuous development. Numerous device concepts—including point absorbers, oscillating water columns, overtopping devices, and attenuators—have progressed from conceptual designs to prototype and demonstration stages.
The effects of climate change on wave energy generation at the Wave Hub test site off the coast of Cornwall, UK, were investigated using a methodology that links projected wave climate variations with wave energy converter performance. The study showed that although available wave energy may slightly increase under future climate scenarios, extractable energy does not necessarily increase because changes in wave characteristics, such as increased wave steepness, can reduce device efficiency. The results highlight the importance of considering both resource variability and converter performance when assessing future wave energy potential.
A marine spatial planning framework was developed in [10] to identify optimal locations for wave energy converter deployment on the Basque continental shelf in the Bay of Biscay, aiming to minimize conflicts with existing maritime activities.
The potential for wave energy exploitation along the Mediterranean coastline was evaluated in [11] by assessing the performance of eight offshore wave energy converters using a 37-year hindcast wave dataset. The results indicated that a large portion of the Mediterranean coastline could be effectively exploited through appropriately downscaled WEC designs.
The impact of climate change on the wave energy resources along the Atlantic coast of the Iberian Peninsula using future climate projections under the high-emission RCP8.5 scenario was evaluated by [12]. Their results indicate a general decreasing trend in wave energy potential across the region, with the most significant reductions occurring in the northwestern areas. The study reports decline in annual maximum wave power on the order of 7–15 kW/m, primarily attributed to changes in atmospheric circulation patterns and ocean temperature gradients. Additionally, the authors highlight shifts in seasonal variability and emphasize the implications for the design and operation of wave energy converters (WECs), particularly regarding efficiency and survivability under evolving wave climates.
The near-future evolution of wave energy potential in the coastal environment of the Iberian Peninsula using a high-resolution SWAN wave modeling system driven by climate projections under the RCP4.5 scenario was assessed by [13]. The study compares simulated wave conditions for a historical period with those projected for the near future and finds that significant wave height means are expected to decrease by up to about 10%, particularly in the western nearshore regions, leading to corresponding reductions in mean wave power.
Annual and seasonal variations in wave climate and their effects on the electrical output and operational performance of three full-scale wave energy converters—Pelamis, AquaBuoy, and Wave Dragon—operating at offshore sites in western Brittany, France, were examined in [14] showing that highly energetic sea states contribute only a limited portion of the total energy production, whereas capacity factors exhibit pronounced monthly variability, reaching nearly 65% during winter.
A classification of wave energy resources using a Delphi method, combining expert knowledge to define criteria for evaluating wave energy potential in the 21st century is proposed by [15]. Applied to the northwest Iberian Peninsula, the approach integrates multiple indicators—such as resource availability, variability, and technological and economic factors—to provide a more comprehensive assessment than traditional methods. The results highlight spatial differences in wave energy potential and demonstrate that expert-based frameworks can support more robust decision-making in marine energy planning and site selection.
Using high-resolution SWAN model data, [16] assessed the wave energy resource along the Galician coast (NW Spain) for 2014–2021 and evaluated the performance of multiple wave energy converters. Results indicated that the Atargis device is best suited for much of the region, although device selection must also consider technical, environmental, socio-economic, and depth-related constraints. In another study [17] assessed the suitability of different wave energy converters along the northwestern coast of Spain under projected near-future winter wave climate conditions. The study evaluated the performance of several WEC technologies, showing that future seasonal changes in wave characteristics may affect the device efficiency and highlighting the importance of considering climate-driven variability when selecting converters for long-term deployment.
The feasibility of wave energy converters operating in regions characterized by moderate wave energy resources was examined in [18]. The study demonstrated that correct device selection and technological adaptation can support efficient energy extraction even under moderate wave conditions, highlighting the importance of reviewing site suitability criteria for WEC deployment.
The Levelized Cost of Energy (LCOE) for wave energy technologies was reviewed in [19] using a techno-economic modeling approach to evaluate the economic feasibility of wave energy conversion systems. The study analyzed the main cost parameters influencing LCOE, including device design, installation, operation and maintenance, and energy production performance.
Overall, the previous studies demonstrate significant progress in the assessment of wave energy, the evaluation of WEC performance, and the analysis of climate change impacts on future wave conditions. Moreover, investigations of WEC performance under varying wave climates have shown that device efficiency strongly depends on local sea-state characteristics and seasonal variability, reinforcing the need for site-specific analyses. Techno-economic studies highlight that reducing the LCOE remains a major challenge for the large-scale deployment of wave energy technologies. Despite these advances, limited research has focused on integrated assessments that simultaneously consider future wave climate variability and WEC feasibility in remote island regions.
In this context, this study investigates the feasibility of WECs in the Azores under climate change scenarios by integrating wave resource assessment with device performance and techno-economic evaluation. A comparative analysis of different WEC technologies is carried out to assess how site-specific wave conditions influence energy production and economic performance. In addition, projected changes in wave climate, including both mean conditions and extreme events, are analyzed to evaluate their potential impact on WEC operation and survivability. By combining resource characterization, device–site interaction, and economic indicators such as AEP and LCOE, this work contributes to a better understanding of the role of wave energy in future sustainable energy systems for isolated ocean regions.
2. Models and Physics
2.1. Wave and Wind Models
In this study, the state-of-the-art spectral wave model WAVEWATCH III [20] is used to characterize the wave generation in the North Atlantic basin.
The WWIII model was developed by the Marine Modeling and Analysis Branch (MMAB), of the Environmental Center (EMC), of the National Centers for Environmental Prediction (NCEP), and resolves an advection type energy balance equation:
where N is the action density spectrum, σ is the relative frequency, and S characterizes the source terms. The right side of the equation holds for the kinematics of the model, while the left side characterizes the physical processes that generate, dissipate, and distribute the wave energy (the nonlinear effects: wind-wave interactions, quadruplet wave-wave interactions, and dissipation through white capping and bottom friction). The source terms include wind-wave interactions, quadruplet wave-wave interactions, and dissipation through white capping and bottom friction.
EC-EARTH [21] is an earth-system model developed by a consortium of European research institutions and researchers, based on state-of-the-art models for the atmosphere, the ocean, sea-ice and the biosphere. The simulation used in this work was produced by the Swedish Meteorological and Hydrological Institute (SMHI) using a RCP8.5 emission scenario.
The WRF model version 4.3 [22] was used to dynamically downscale the EC-Earth model data to the regional scale. The simulation’s domain includes two nested grid domains on a two-way nested basis, with 115 × 9, 145 × 106, and 181 × 157 grid points and resolutions of 45, 15, and 5 km, respectively.
2.2. System Set-Up Description
To generate waves for the North Atlantic basin, the WWIII wave model, version 5.16 [20], is used, with 32 frequencies and 24 directions (Table 1), the model is implemented with wind and sea-ice cover from EC-EARTH simulations.
Table 1.
Parameterizations of the WWIII model for the North Atlantic Basin.
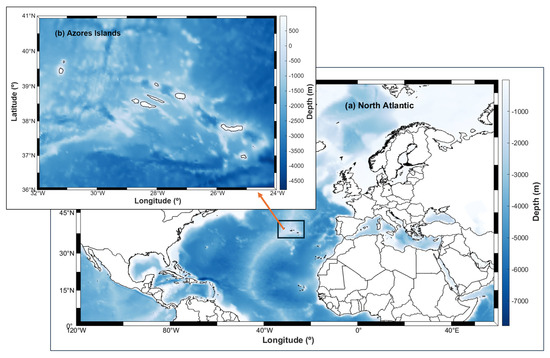
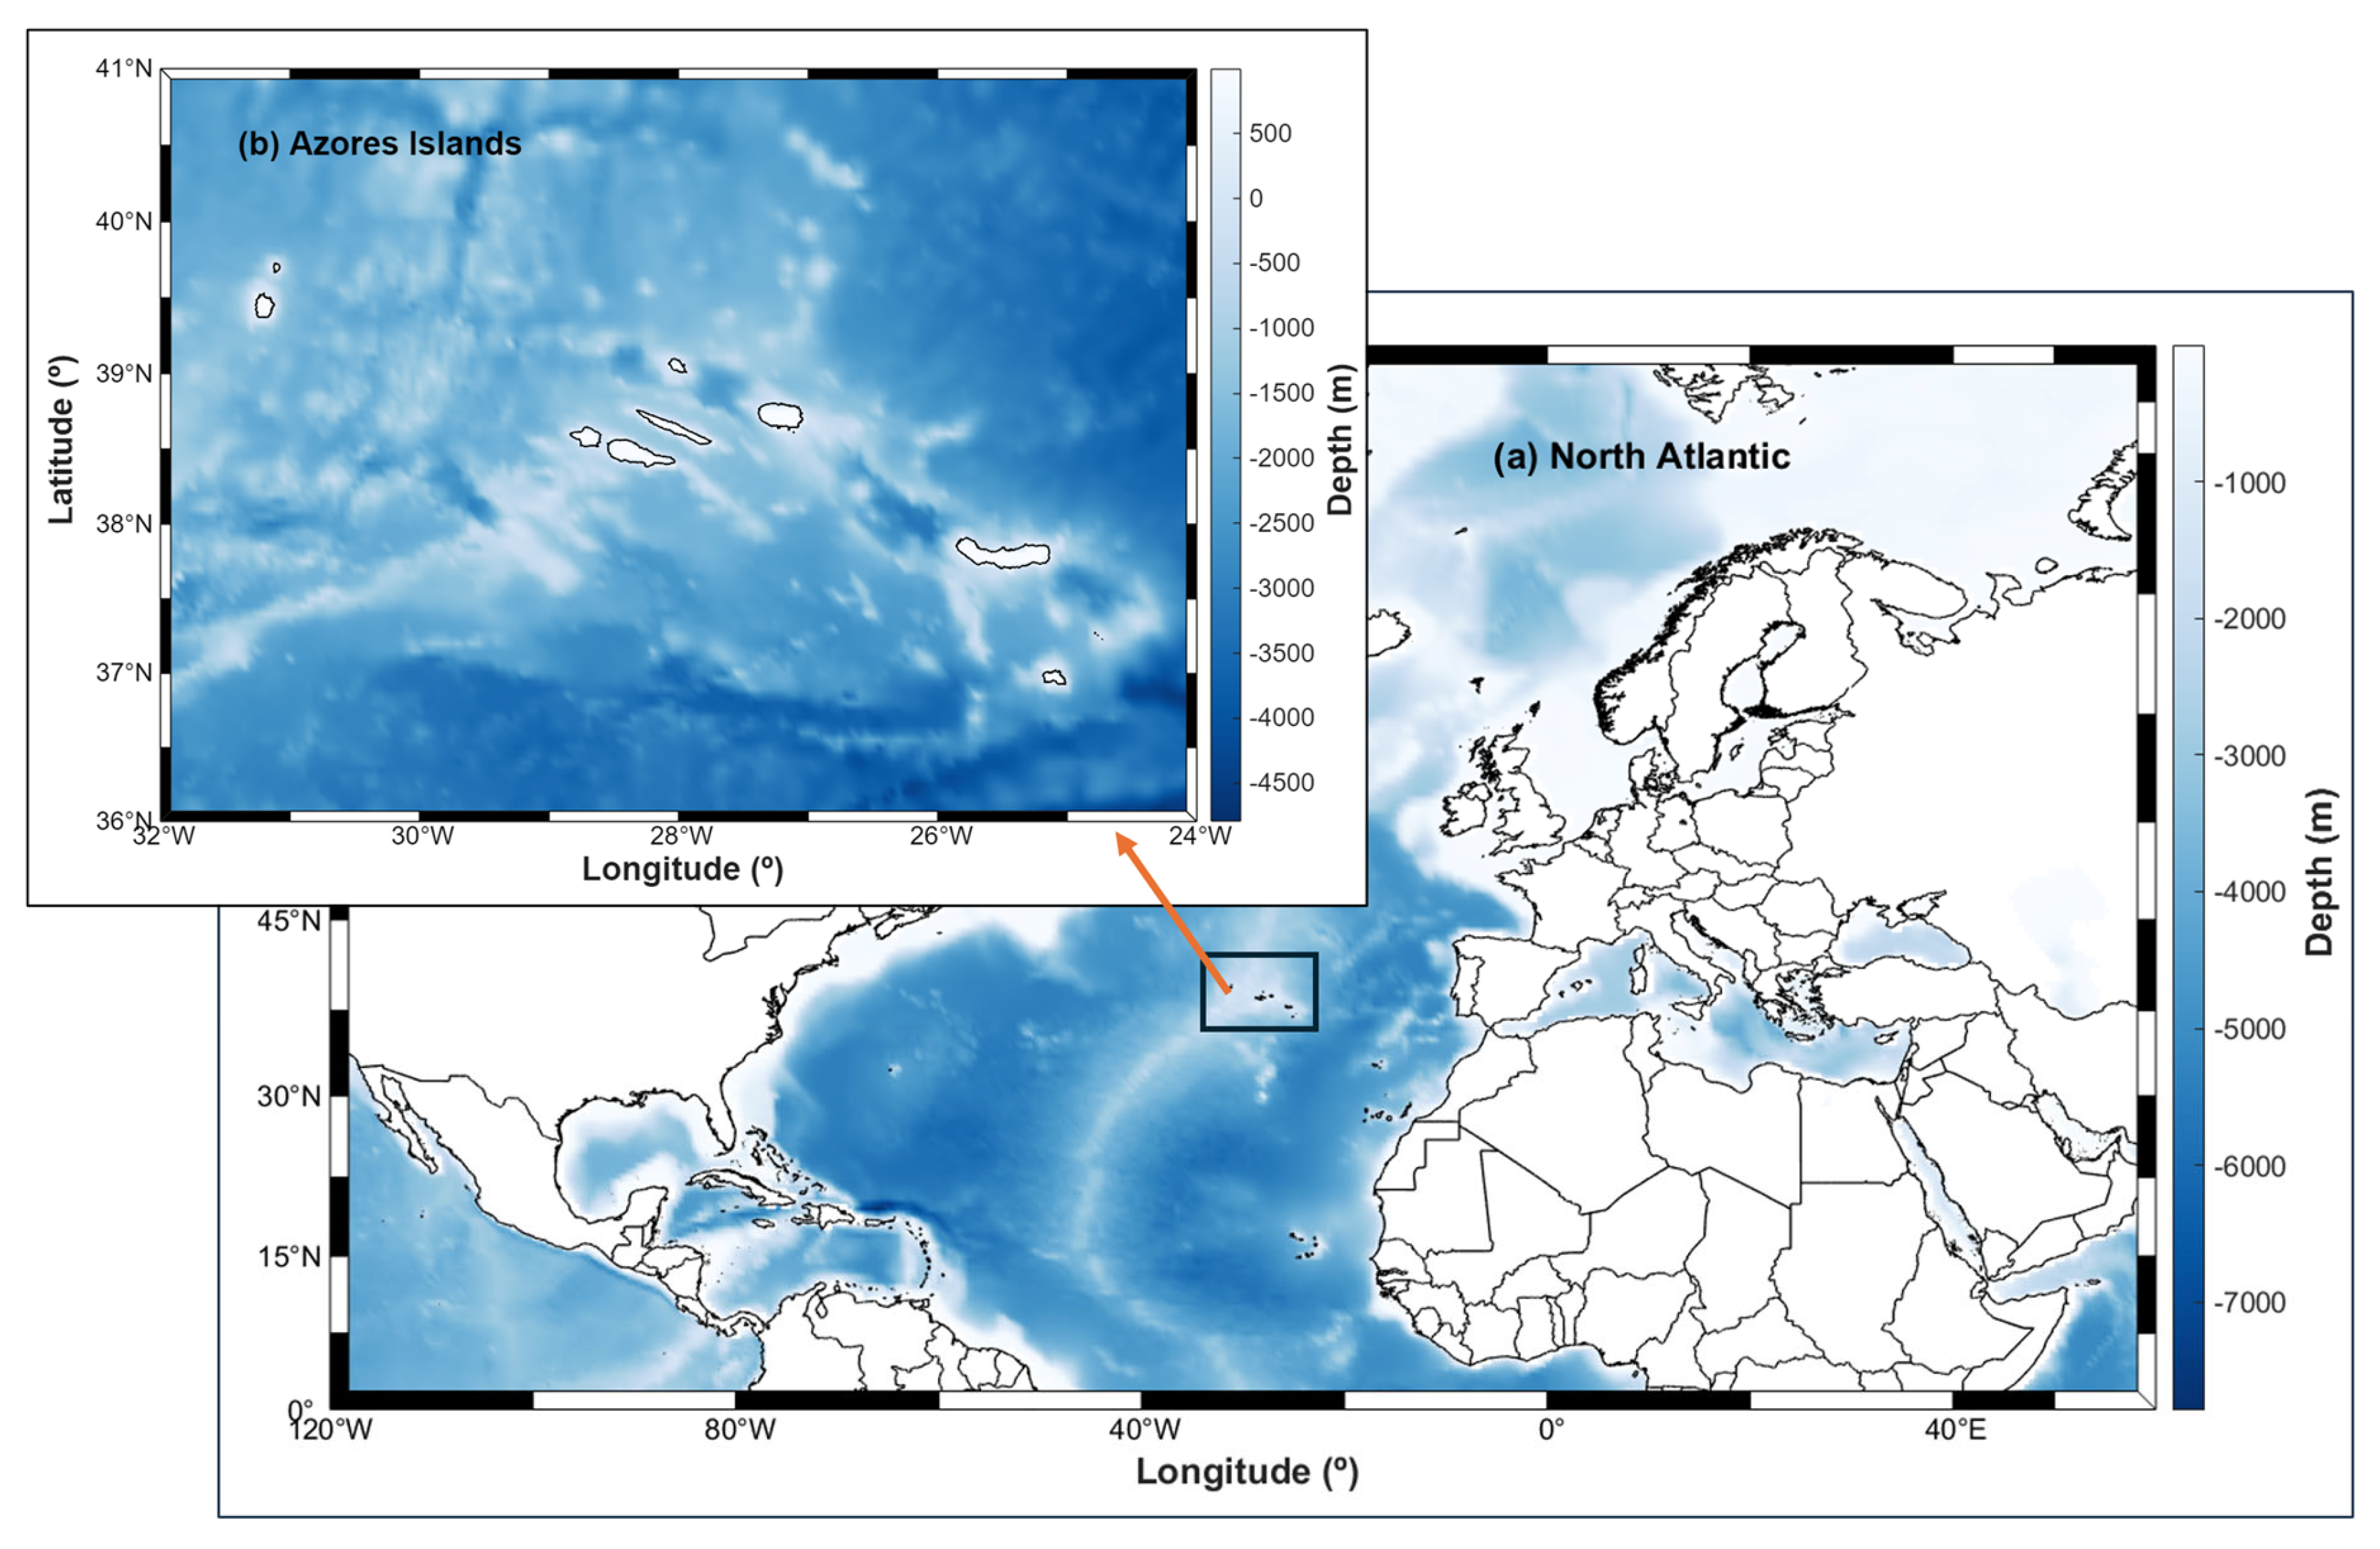
The second nested level of WWIII is implemented over the Azores Islands (Figure 1), using boundary conditions provided by the outer domain and wind fields dynamically downscaled with WRF (Table 2). Both computational bathymetric grids are generated using the GRIDGEN software, version 1.0.02 [23], a MATLAB-based tool specifically developed to create grids for WWIII simulations. The adopted spatial resolutions are 0.5° × 0.5° for the North Atlantic basin and 0.05° × 0.05° for the Azores regional domain. The modeling framework covers two 30-year periods: a past period from 1 January 1990 to 31 December 2019, and a future projection period from 1 January 2030 to 31 December 2059, ensuring robustness for climate-scale analysis.
Figure 1.
WWIII System domain. (a) North Atlantic. (b) Azores.
Table 2.
Parameterizations of the WWIII model for the Azores.
3. Characterization and Validation of the Wave Energy Resource
In [24] a statistical analysis is carried out on wave data derived from downscaled reanalysis for the recent past (1990–2014) and from near-future climate simulations (2030–2054), followed by an assessment of changes in wave climate conditions. The reliability of the simulations is evaluated by comparing RCP8.5 WWIII past data with WWIII–ERA5 at the Graciosa (39° 05.21′ N, 27° 57.73′ W) and Praia Vitória (38° 45.05′ N, 27° 00.62′ W) buoy locations. The validation results demonstrated good agreement between the past WWIII simulation (WWIIIPast) and the WWIII simulation forced with ERA5 data (WWIIIERA5).
To quantify the similarity between probability density functions (PDFs) of WW3 outputs and reference data (ERA5) the PDF overlap (>95%) and the normalized bias are calculated.
where , are time series from WWIIIpast and WWIIIERA5 simulations, respectively. denotes the relative frequency of bin ‘i’ in the probability density function (PDF), and n is the total number of bins. In the present study, n = 30 bins were used for significant wave height and peak period. The higher the OP percentage, the stronger the agreement between the simulations.
In addition, spatial distribution of overlap percentages and the spatial patterns of the normalized bias (NBias) between the RCP8.5 WWIIIpast simulation and the WWIIIERA5 simulation for Hs and Tp are estimated. The NBias quantifies the relative bias between WW3past and the reference data WWIIIERA5 and is given by:
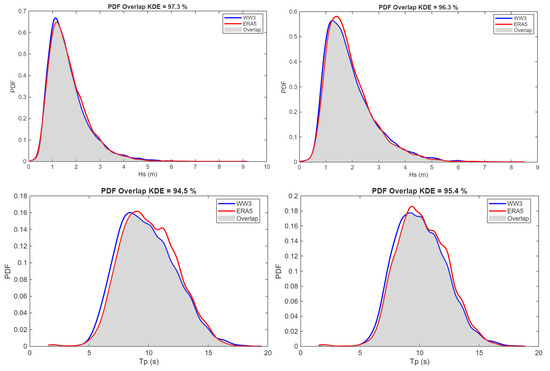
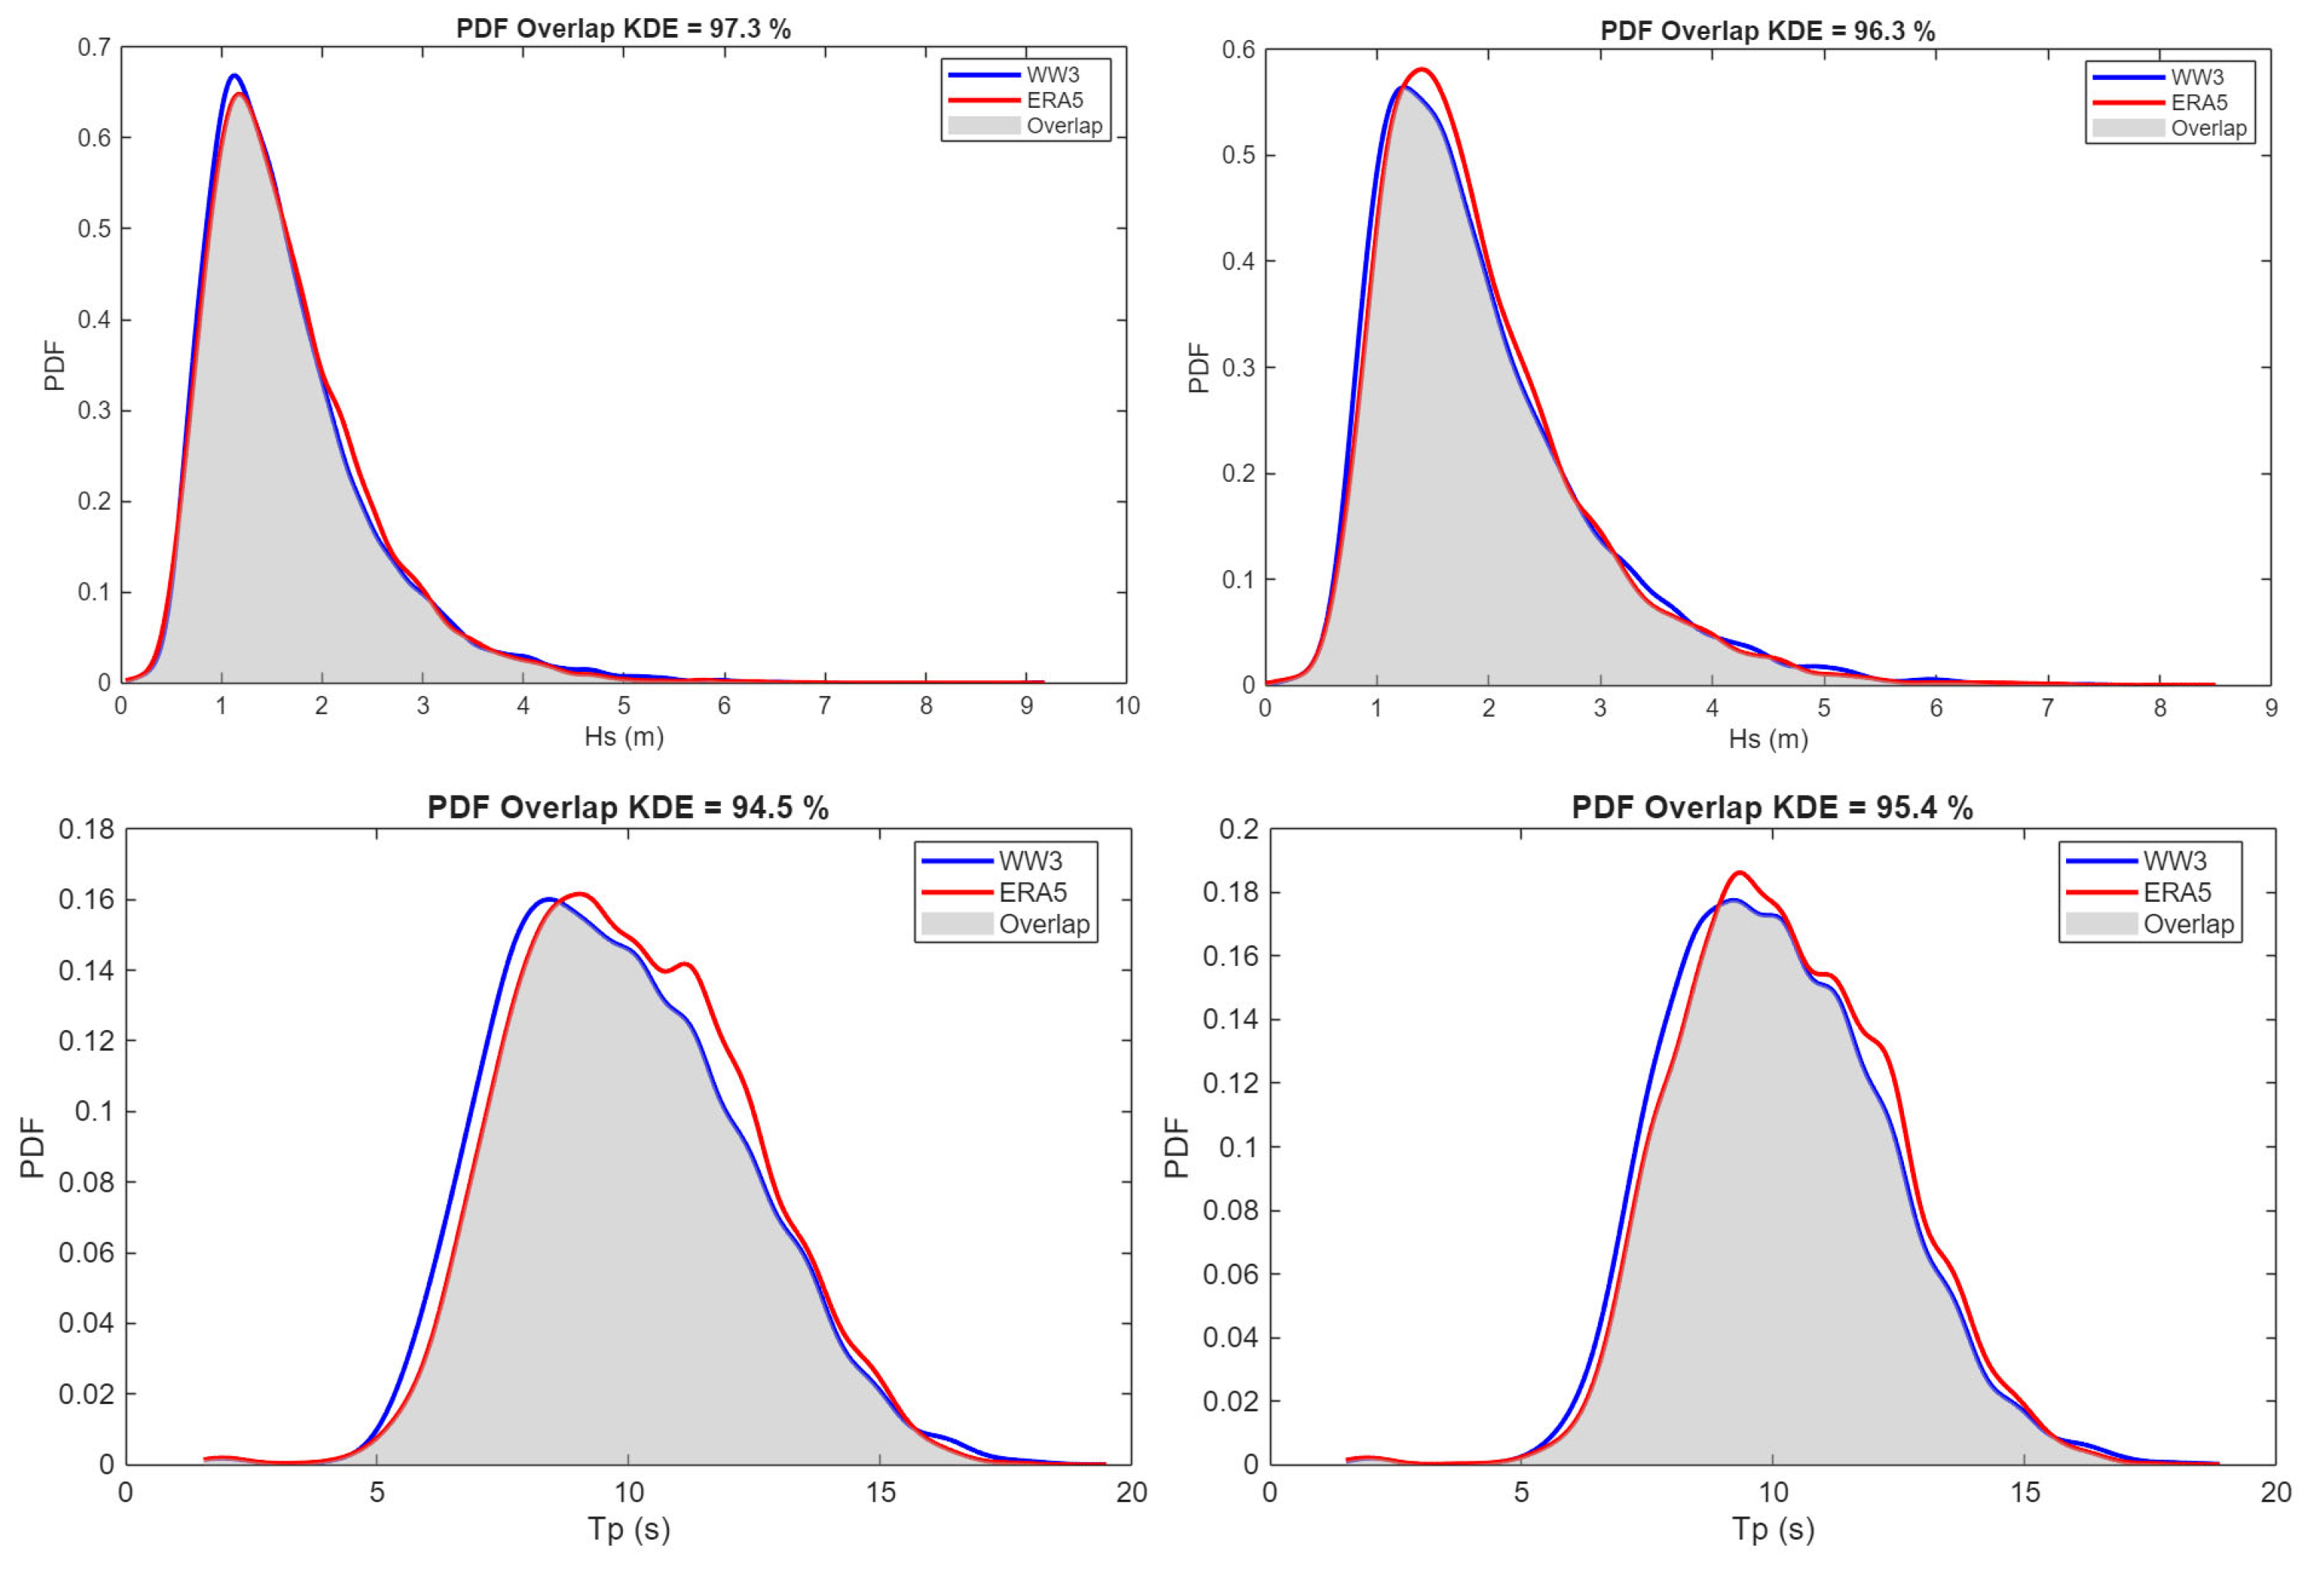
As can be observed in Figure 2, the overlap percentage between WWIIIpast simulations and WWIIIERA5 PDFs stays above 94% using kernel density estimation. These values indicate excellent agreement between the modeled and reference wave climate distributions. The close correlation between both methods confirms the robustness of the metric and the capability of the WWIIIpast simulation to reproduce the statistical characteristics of the WWIIIERA5 wave climate. The overall validation results confirm strong consistency between the simulations across all variables and statistical metrics considered.
Figure 2.
Overlap percentage between the RCP8.5 WWIIIpast simulation and the WWIIIERA5 simulation at the location of the Graciosa buoy (left panel) and Praia Vitoria buoy (right panel) for Hs (top panels) and Tp (bottom panels).
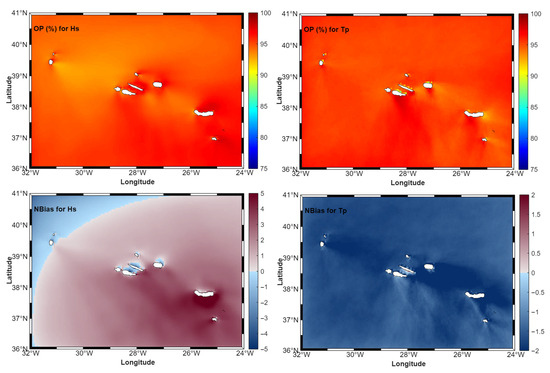
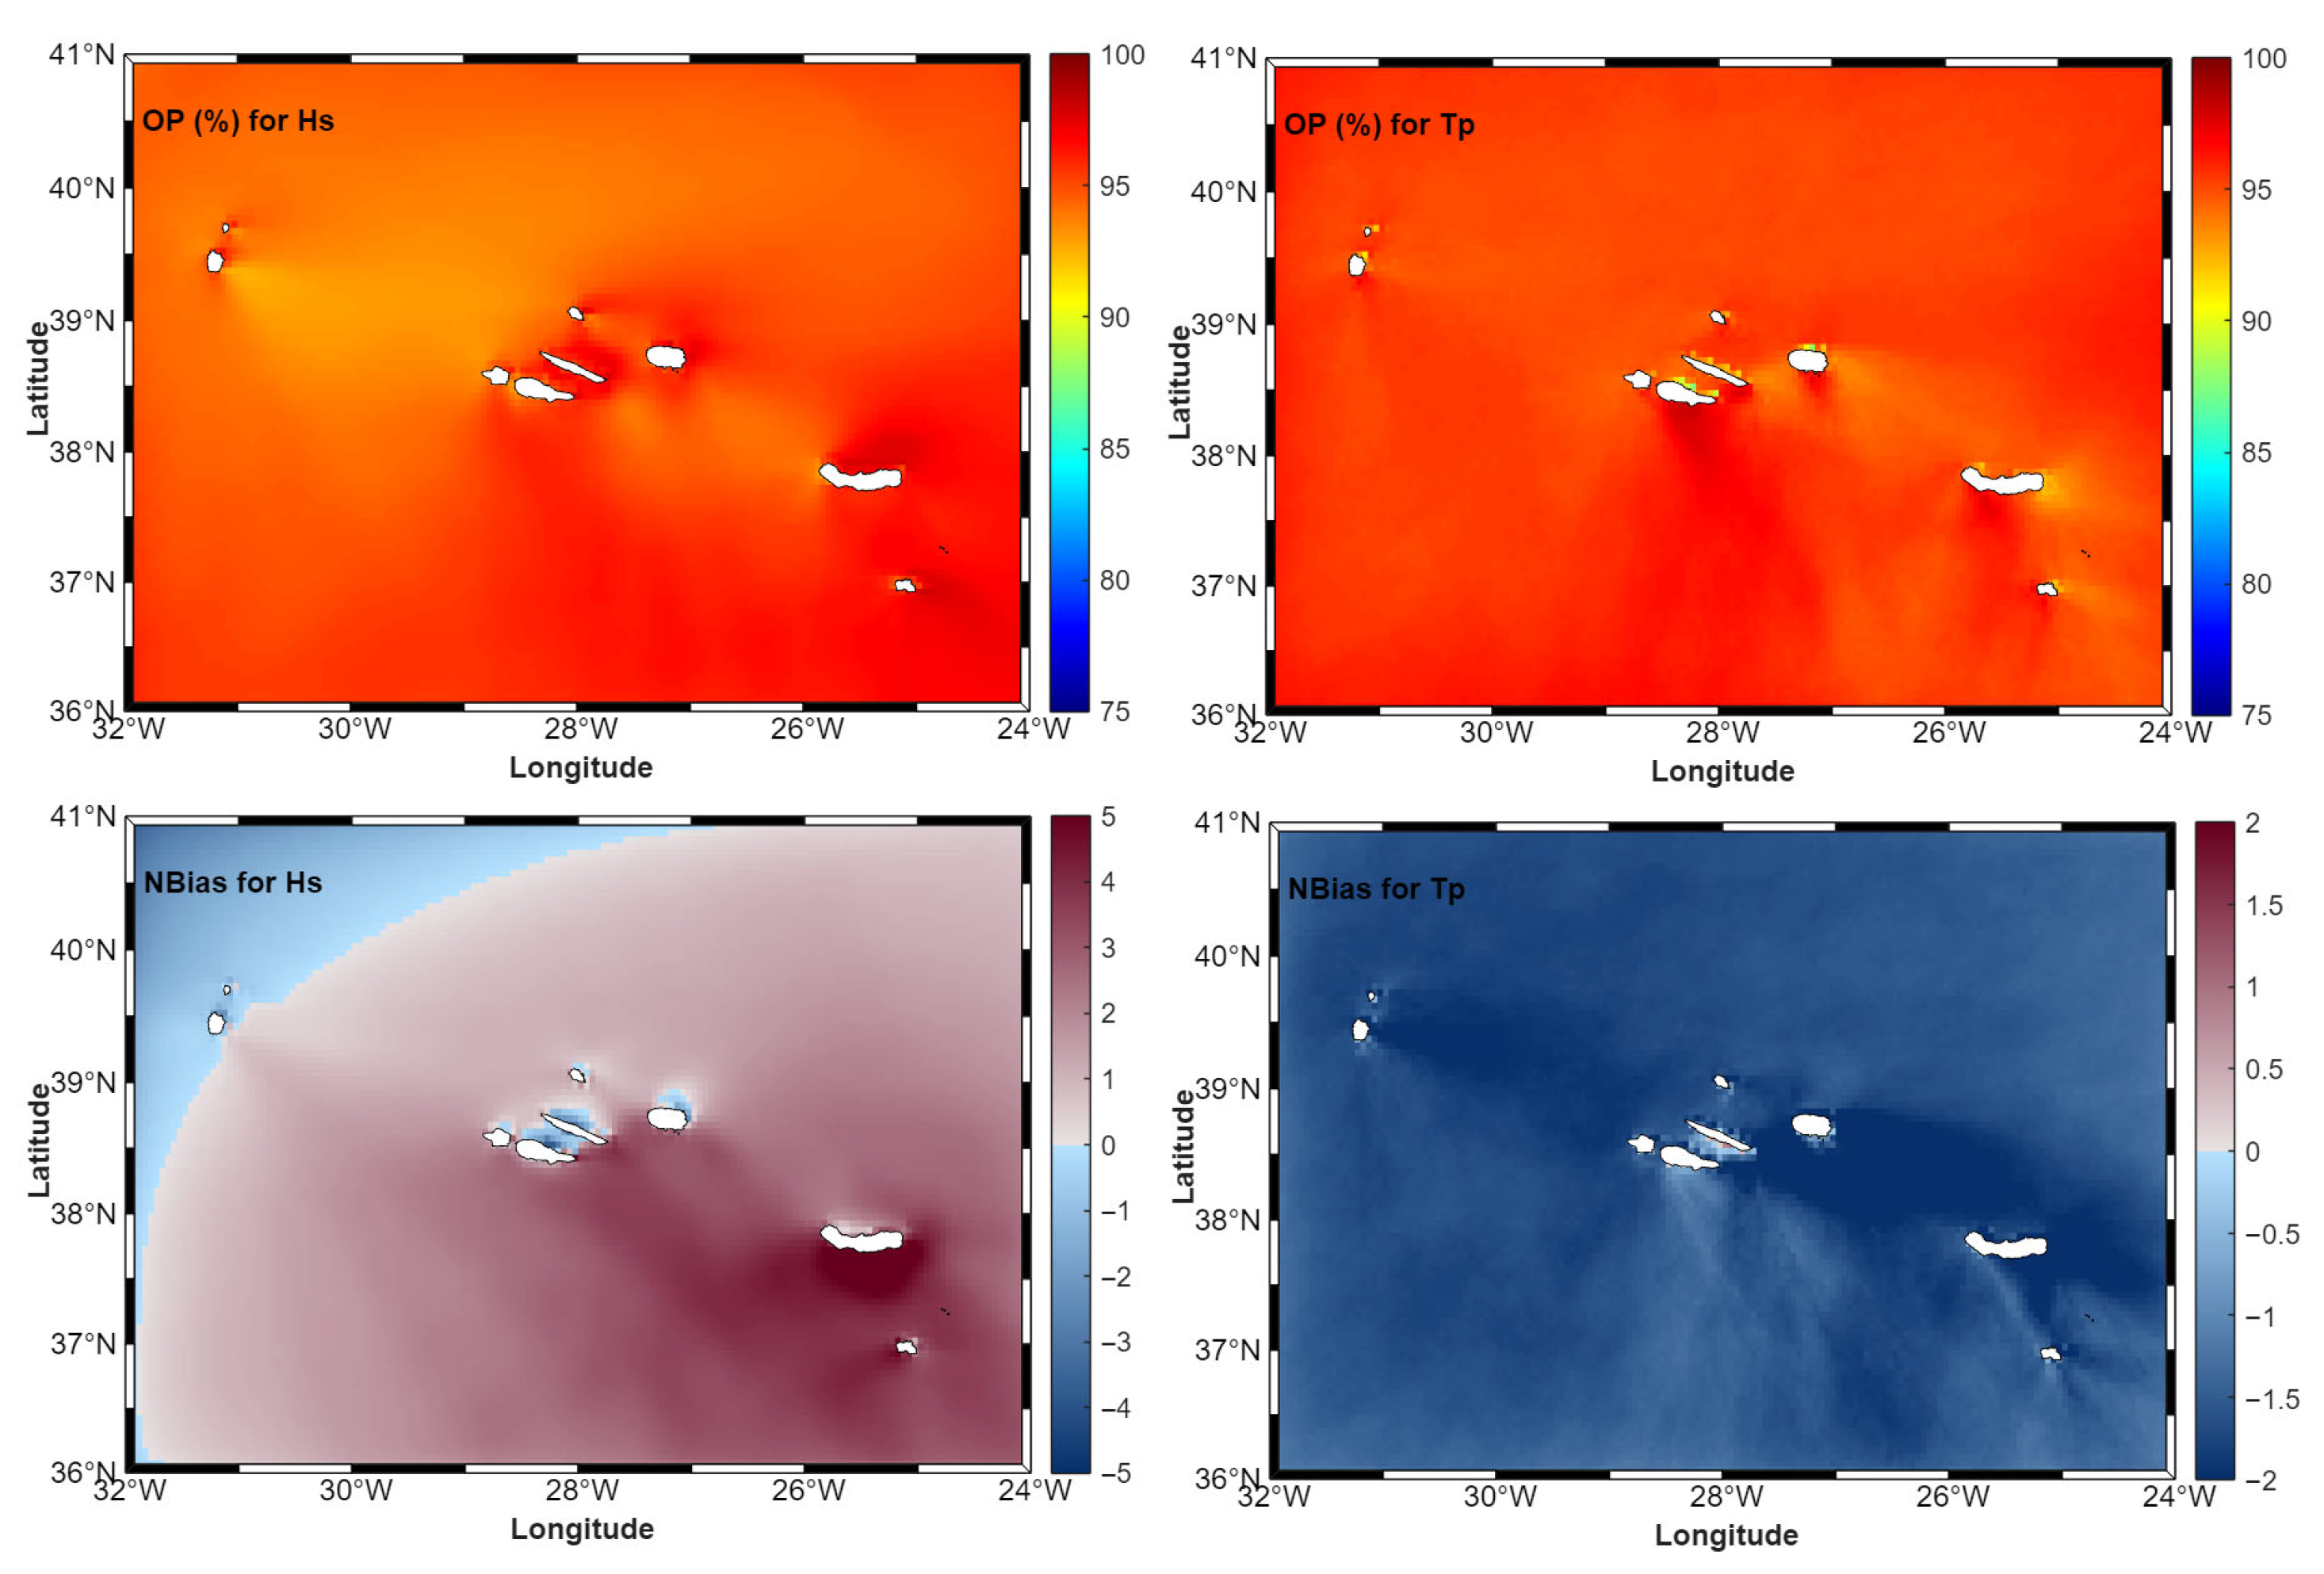
Figure 3 shows regions exhibiting overlap percentages exceeding 95% for both parameters and normalized bias values within ±5%, for Hs and ±2%, for Tp, indicating a good agreement between WWIIIpast and WWIIIERA5, with the model accurately reproducing the wave climate distribution while showing minor systematic differences in mean conditions for the Hs. For Tp it can be observed that the NBias has essentially negative values, meaning WW3 slightly underestimates ERA5 on average, by about 2%, suggesting slightly weaker EC-Earth wind speeds. The high overlap percentages and small normalized biases indicate that the WW3 simulation forced by EC-Earth winds produces a present-day wave climate that remains statistically consistent with ERA5, supporting its use for future projections.
Figure 3.
Spatial distributions of PDF overlap percentage between the WWIIIpast simulation and the WWIIIERA5 simulation and spatial distributions of NBIAS, for Hs (top panels) and Tp (bottom panels).
4. Wave Energy Estimation and WEC Performance
4.1. Wave Power Estimation
In WWIII, wave energy flux is not computed as a single bulk parameter but derived from the spectral energy distribution. The model resolves the wave spectrum in frequency and direction, and energy transport is represented through the propagation of wave action with the group velocity. The total energy flux is obtained by integrating the product of spectral energy density and group velocity over all frequencies and directions.
In [25], the wave energy resource in the Azores was characterized using a 25-year simulation forced with WWIII/WRF and WWIII/ERA5 wind fields. Climate projections were evaluated against the ERA5 reanalysis, revealing mean absolute differences below 0.1 m for significant wave height and 0.4 s for mean wave period. Wave energy was computed directly from the WWIII outputs. The results showed small discrepancies between the mean values of the two simulations, with the WWIII/WRF configuration slightly underestimating WWIII/ERA5 in offshore areas, while marginally overestimating it near the eastern sectors of the central and eastern island groups.
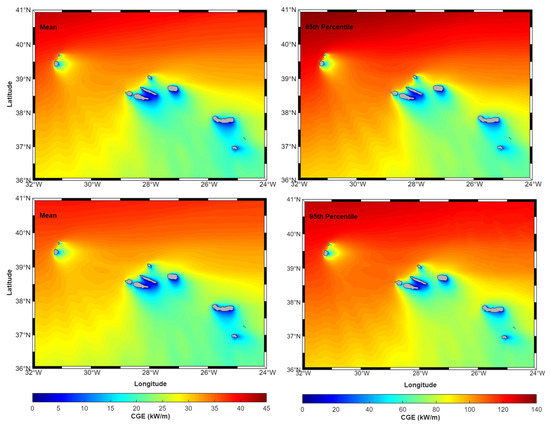
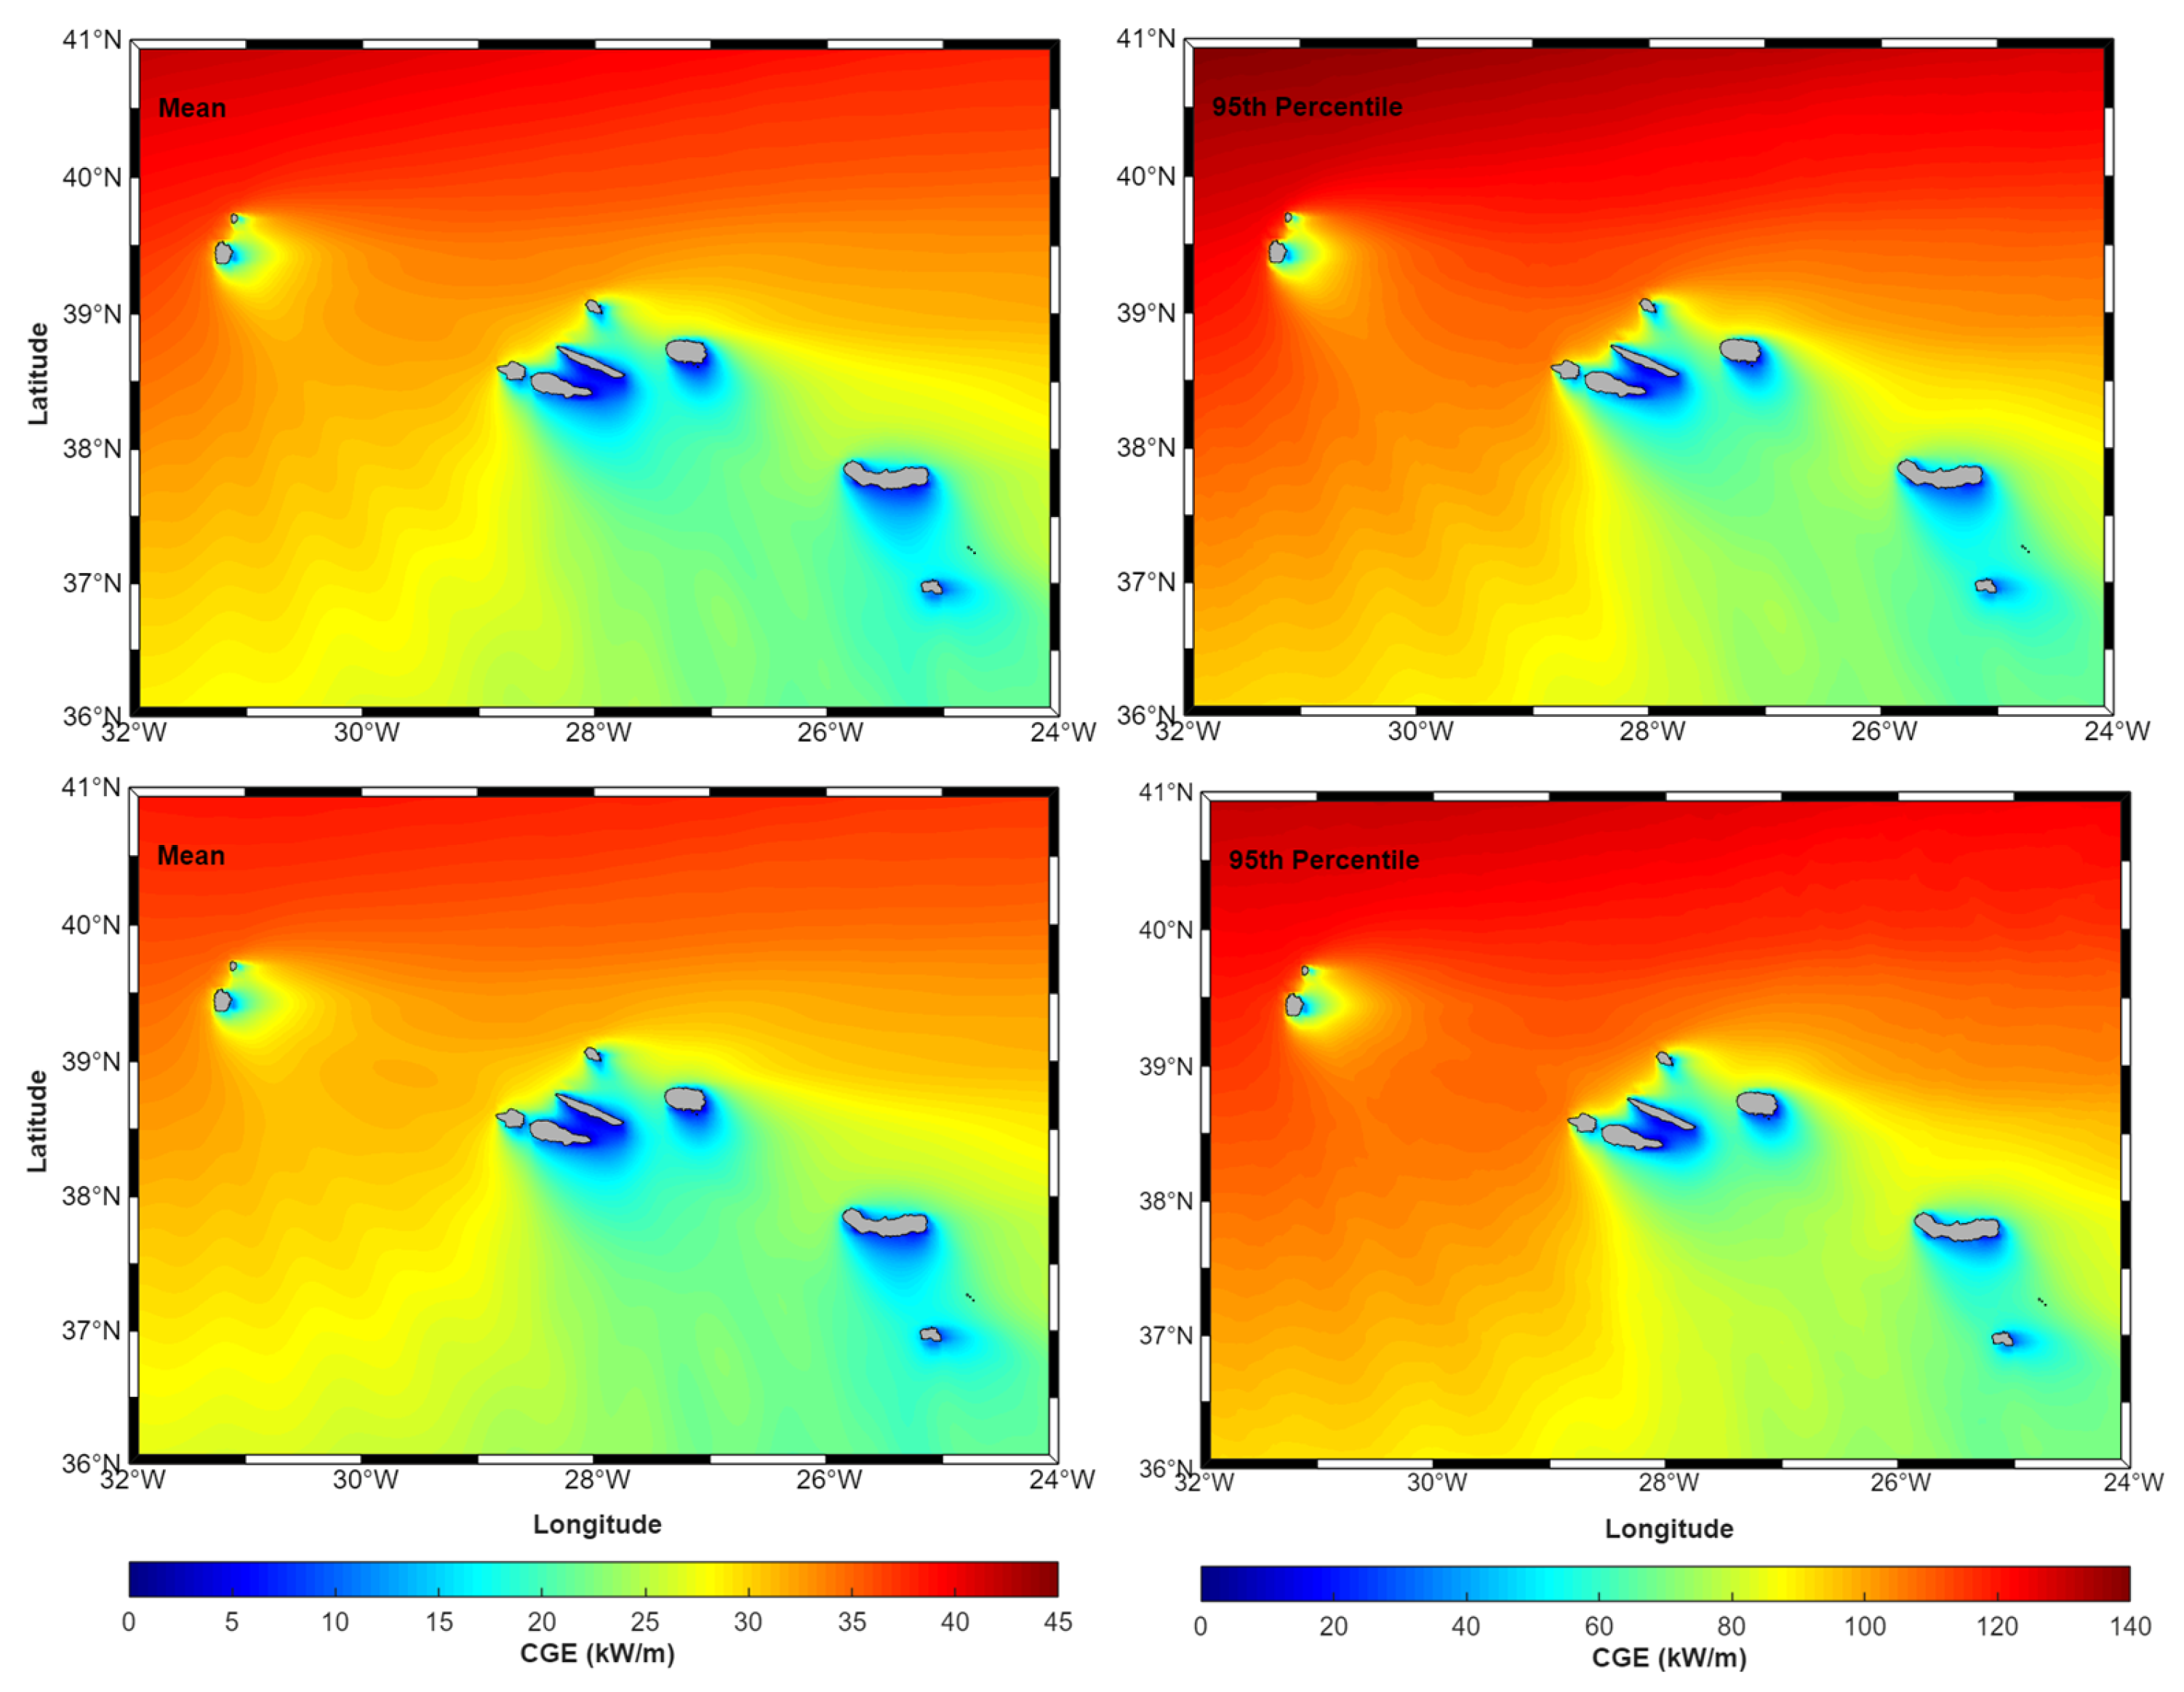
The spatial distribution of wave energy flux around the Azores Islands is presented in Figure 4. The mean wave energy flux reveals moderate energy levels in the vicinity of the islands, typically ranging between 15 and 30 kW/m, with values increasing toward the northwest, where Atlantic swell conditions are more dominant. The 95th percentile highlights extreme energy conditions, exceeding 120–130 kW/m in the northwest sector, while values near the islands are lower due to wave attenuation and sheltering. The results indicate that the highest energy levels—both in mean and extreme conditions—are consistently observed in the western and northwestern part of the domain, reflecting the dominant Atlantic wave direction. Essentially, the spatial patterns of the 95th percentile remain largely consistent in the future scenario, suggesting that no drastic changes in the distribution of extreme wave energy are observed, although slight variations in magnitude may occur. These findings suggest that, while average energy availability may not change significantly, extreme wave conditions will remain a critical factor for WEC design and survivability in the region. Devices deployed in high-energy areas will be exposed to both enhanced energy production potential and increased structural loading.
Figure 4.
Mean wave energy flux (left panel) and 95th percentile (right panel) for 1990–2019 (top panel) and 2030–2059 (bottom panel).
4.2. Site Selection
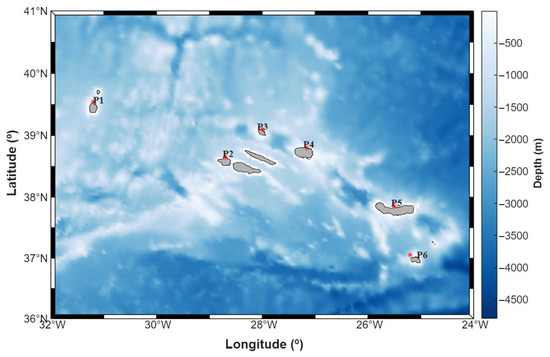
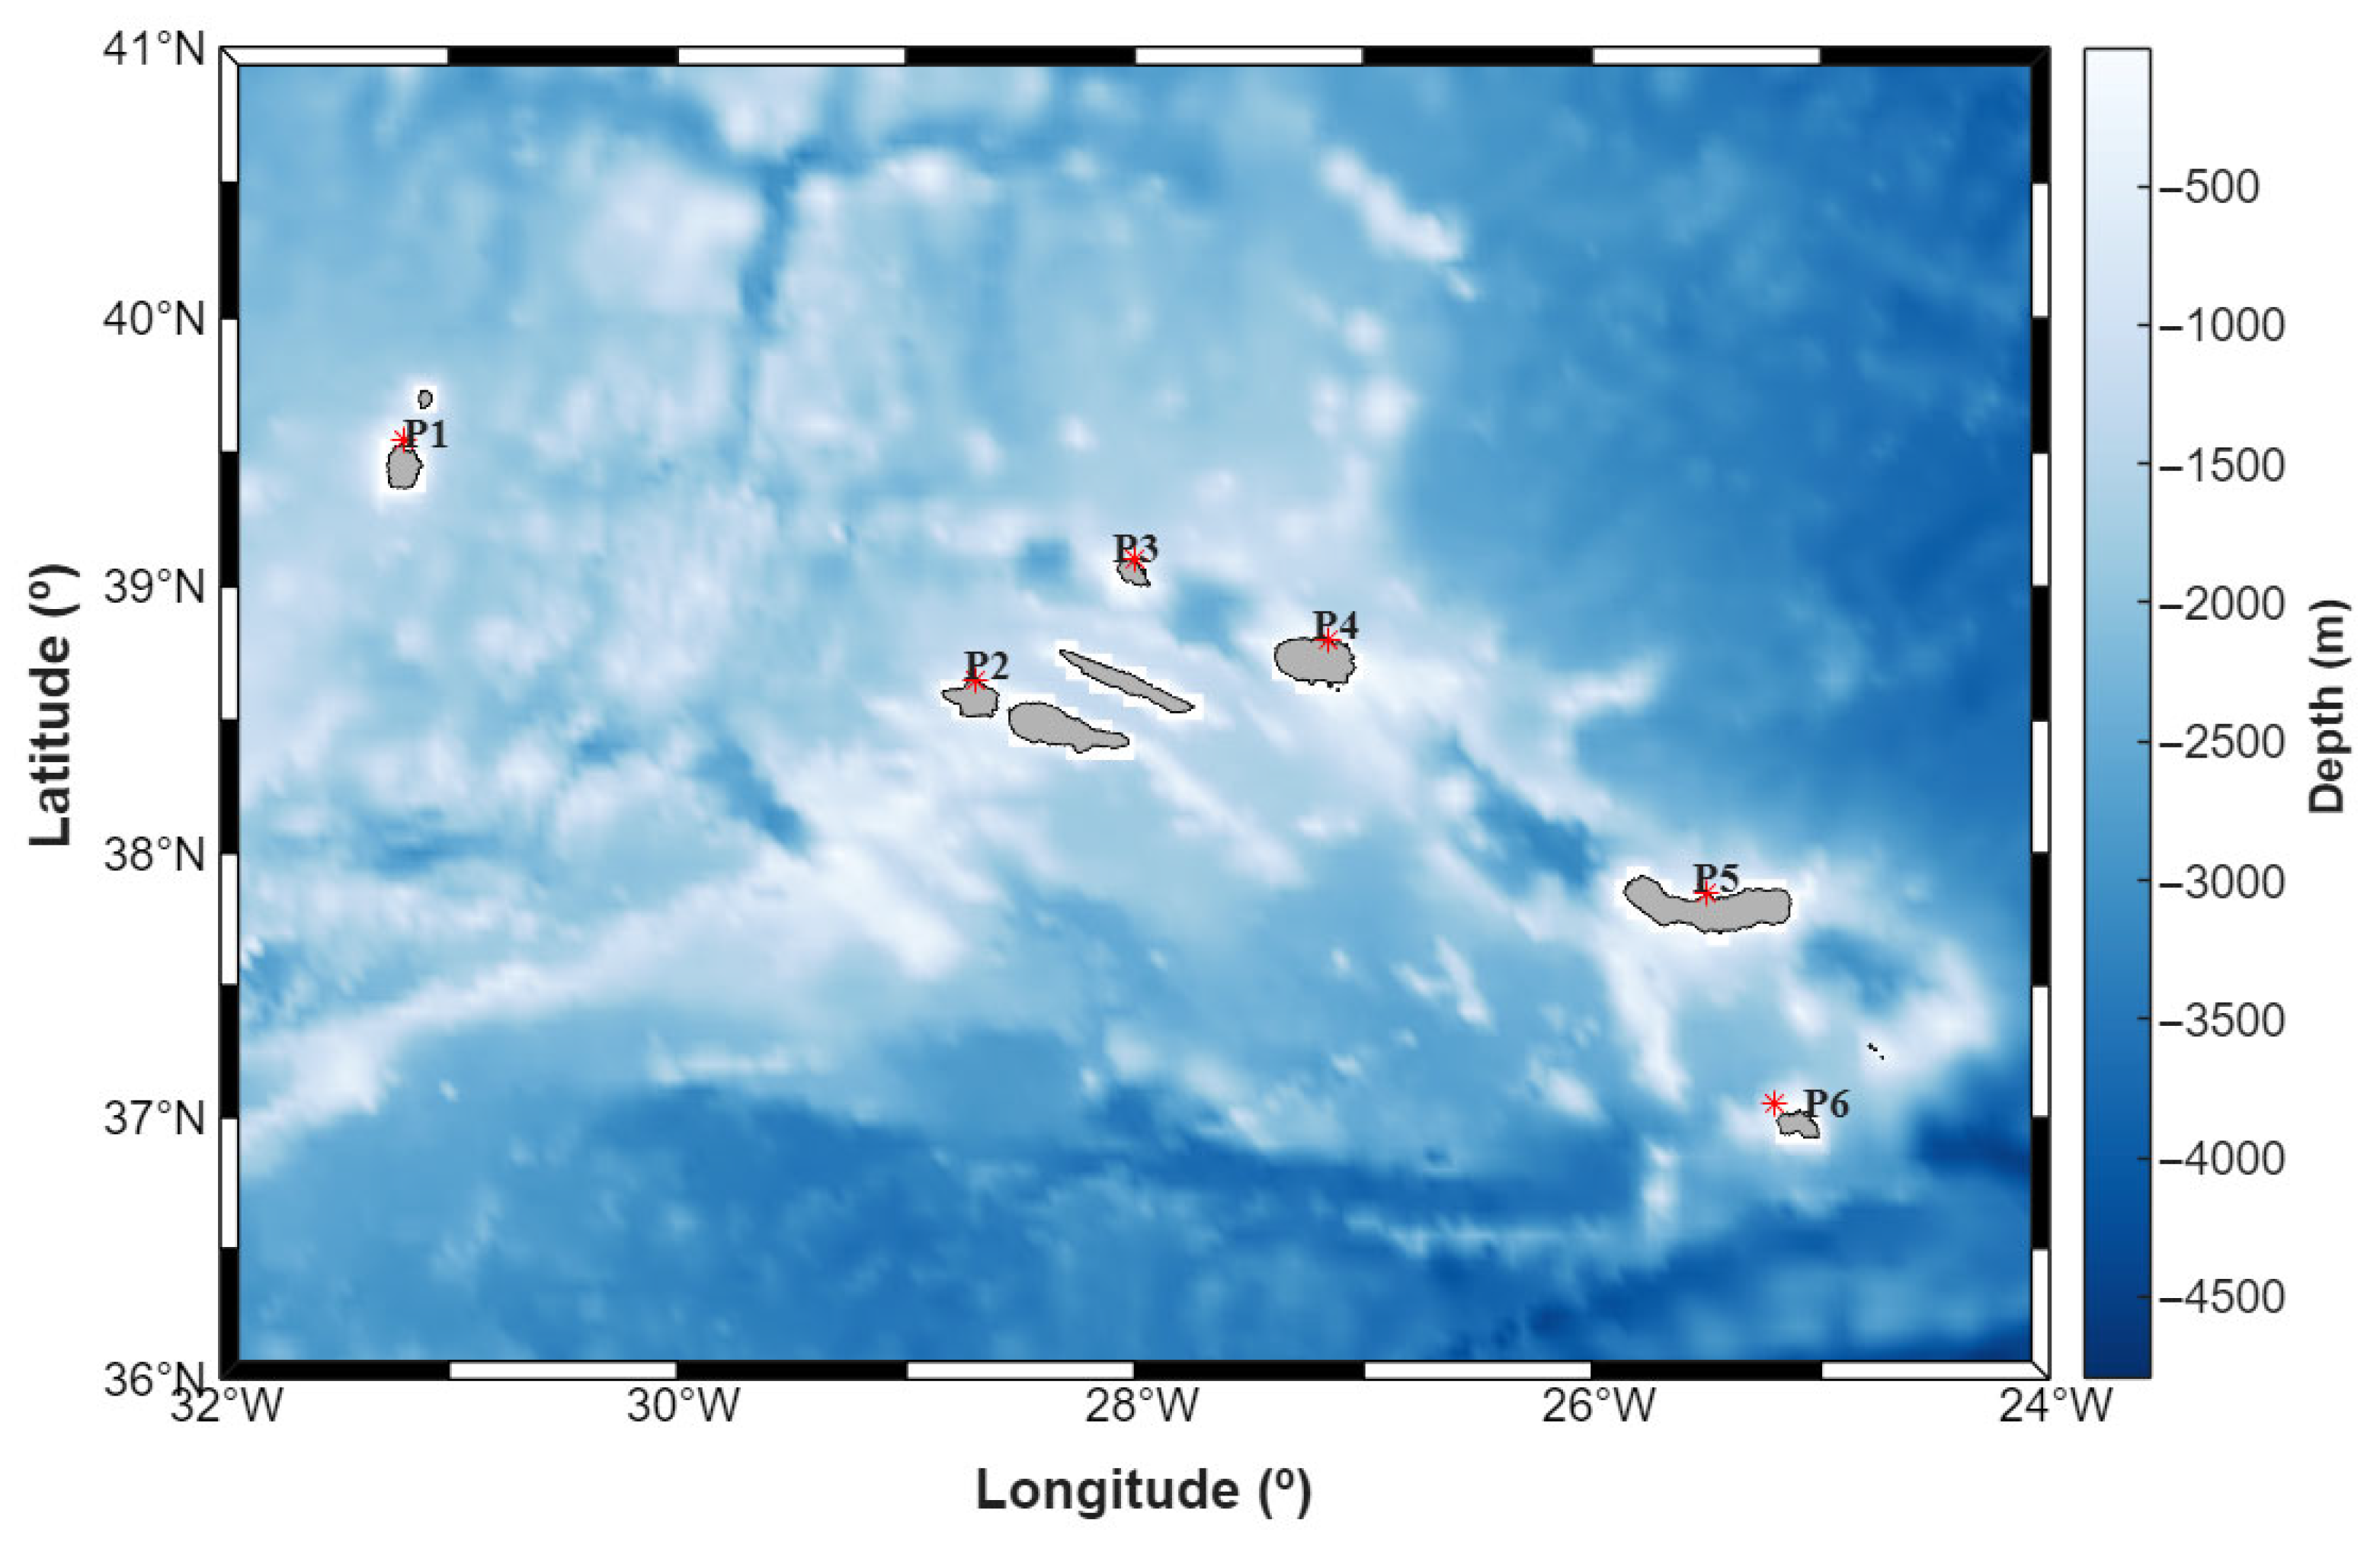
The evaluation of wave energy potential at specific sites represents a crucial initial step in determining the feasibility and expected performance of wave energy converters (WECs). A site-specific approach enables a comprehensive characterization of the local wave climate, including key parameters such as significant wave height, mean wave period, and wave power flux, all of which directly affect the energy capture efficiency of different WEC technologies. Given the spatial variability of the wave regime across the Azores archipelago—shaped by complex bathymetry, island sheltering, and regional wind patterns—conducting localized assessments is particularly important. In this study, six representative sites located near the islands, in areas with favorable energy conditions, were selected to estimate the expected energy production and evaluate the performance of various WEC devices.
The study by [26] identified priority locations for wave energy development in the Azores archipelago. Several areas were highlighted as suitable for deploying various WEC technologies in offshore and intermediate-depth waters. Based on that work, six locations were selected to assess the available wave energy resource (Figure 5). These locations lie at water depths ranging from 57 m to approximately 110 m, and their main characteristics are presented in Table 3.
Figure 5.
Location of the 6 locations considered. The red sign corresponds to the site locations.
Table 3.
Characterization of the 6 locations.
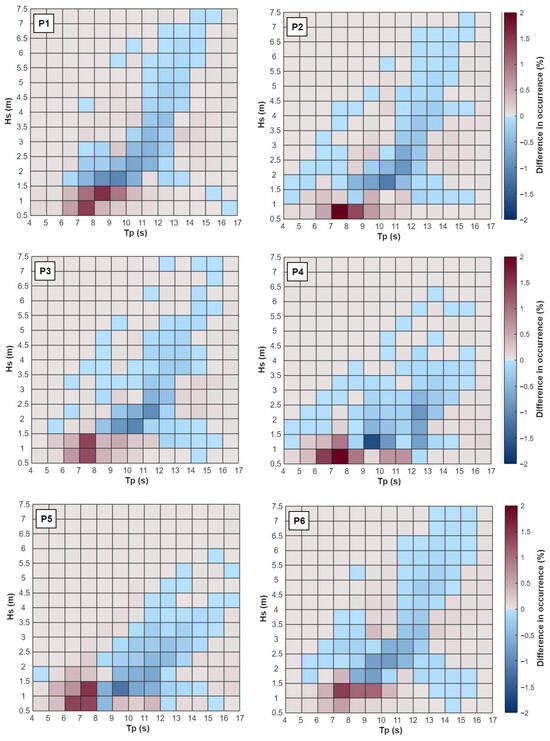
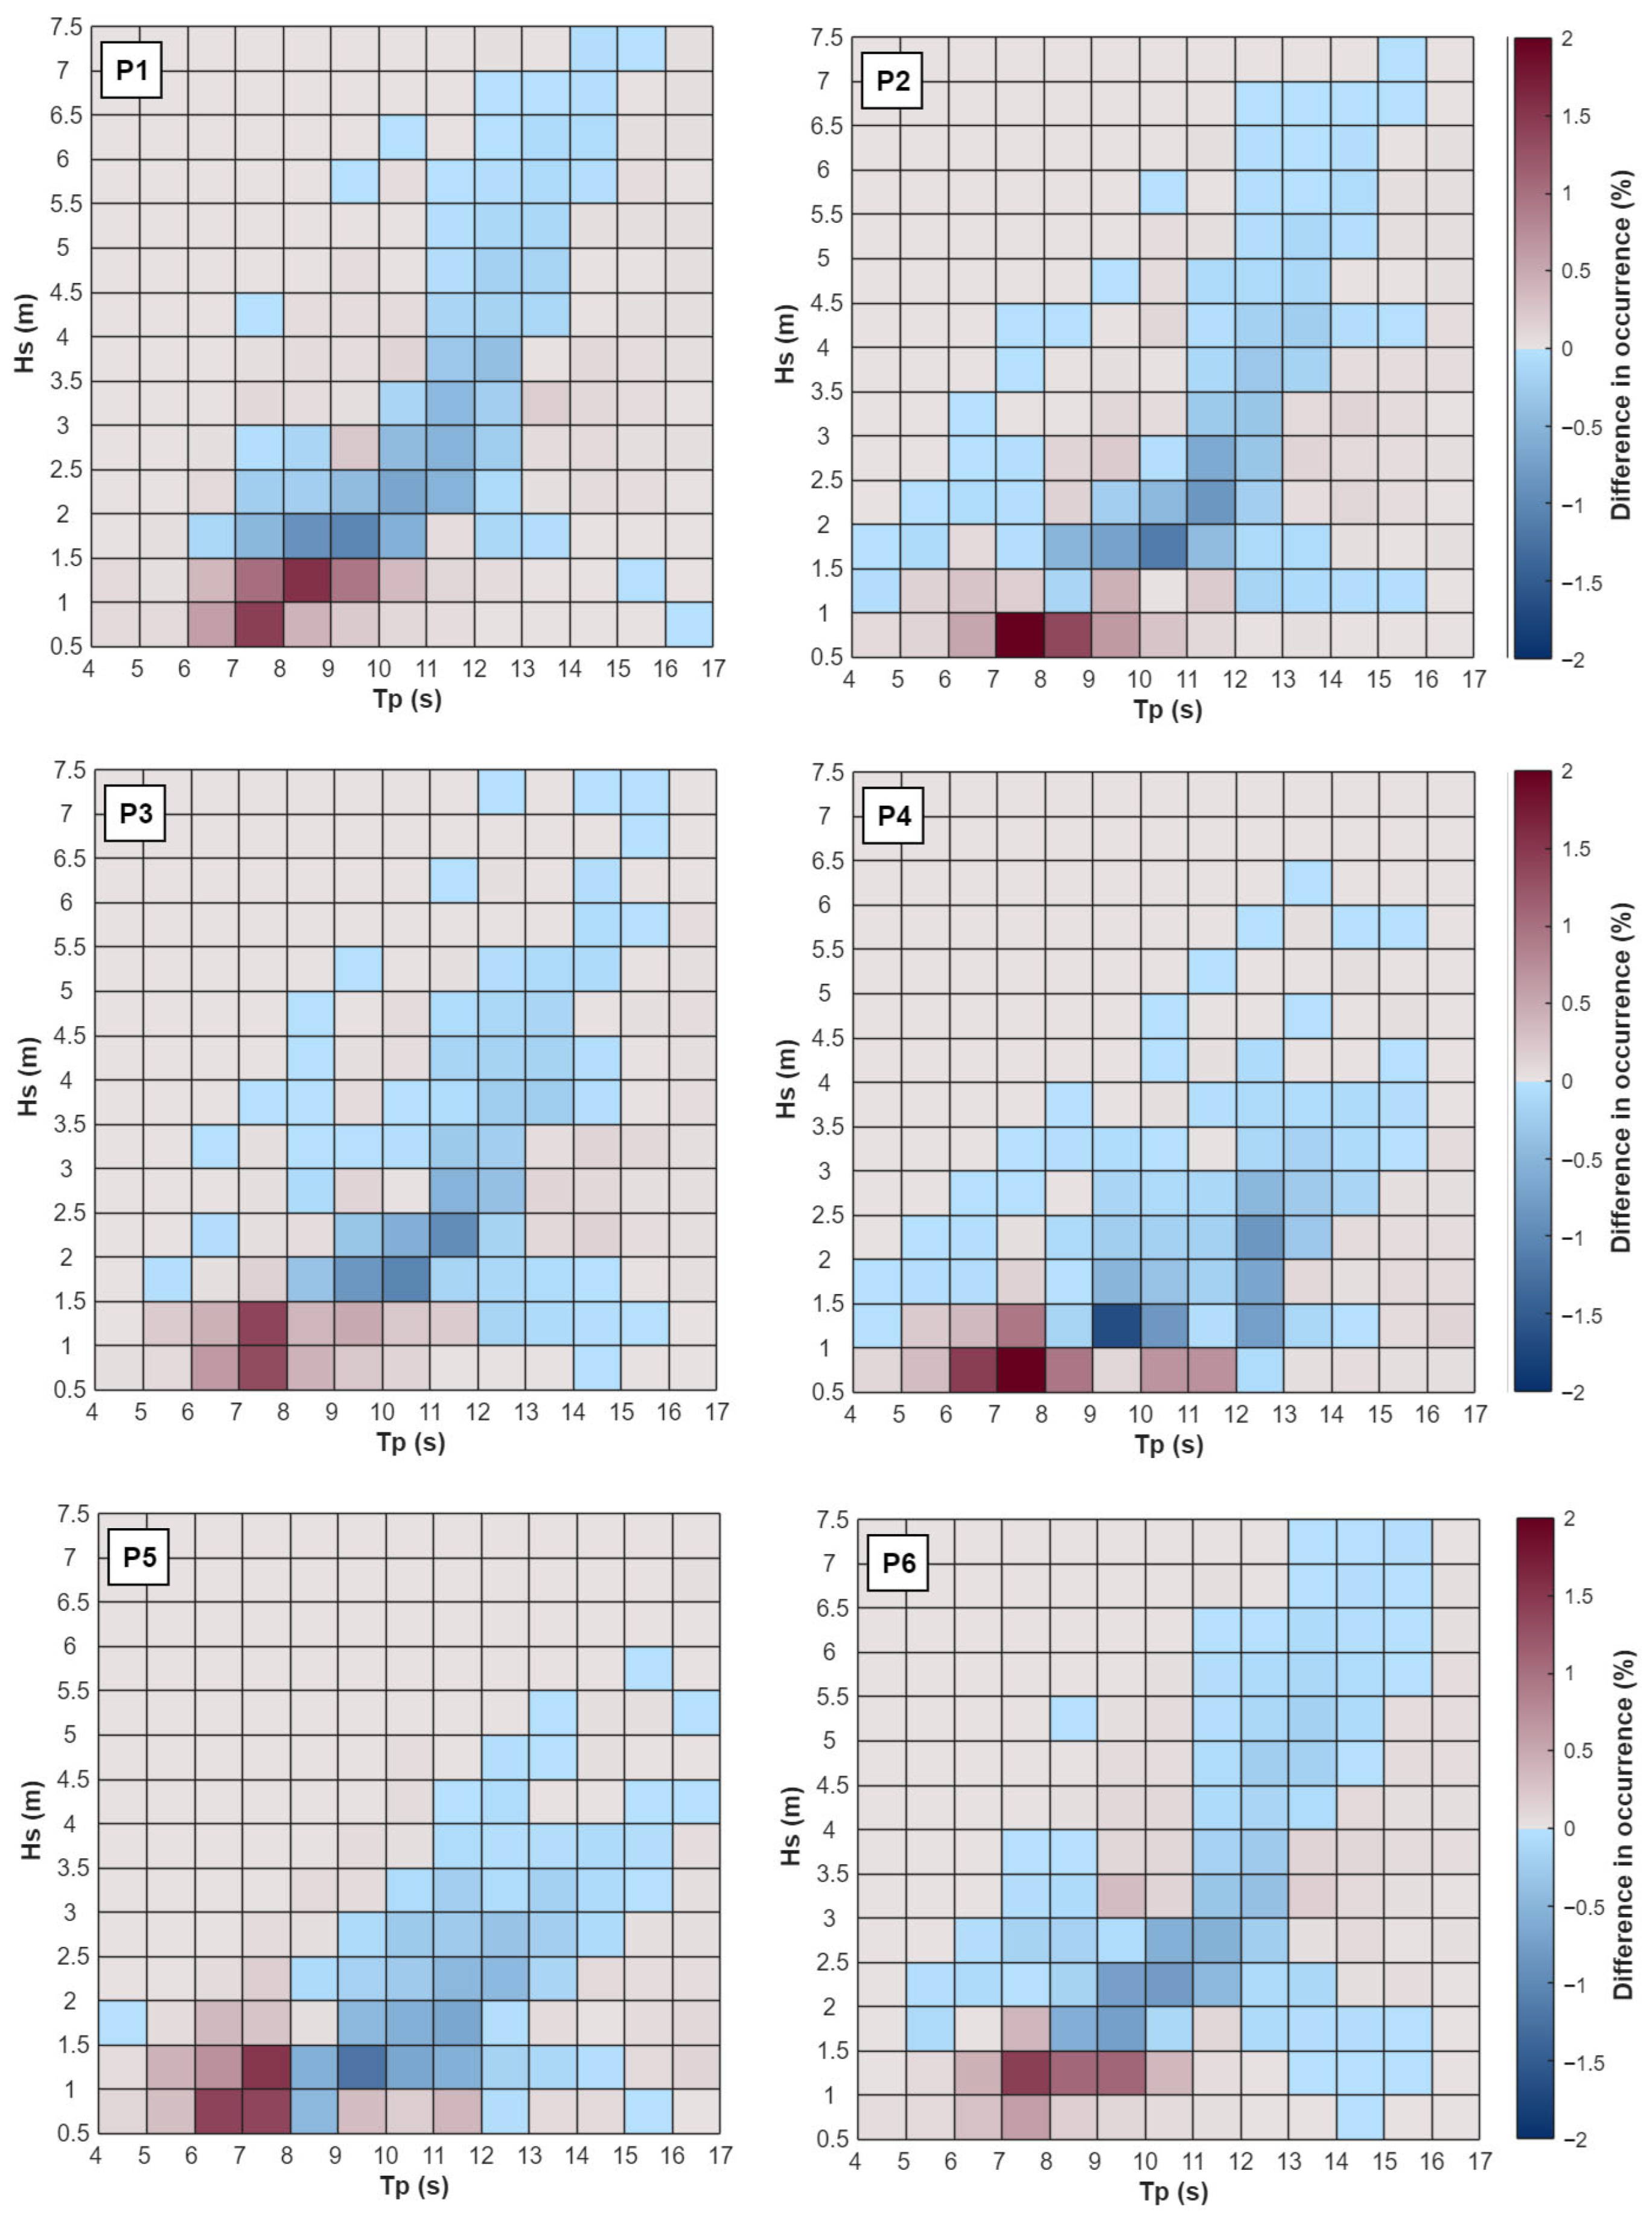
The probability of occurrence of each sea state is estimated using long-term wave data, which are organized into scatter diagrams that classify sea states according to Hs Tp. The total dataset is divided into bins (e.g., 0.5 m for Hs and 1 s for Tp). The difference in sea-state occurrence (percentage points) between the future (2030–2054) and historical (1990–2014) periods, derived from downscaled climate simulations and is presented in Figure 6. The results reveal a consistent redistribution of sea-state occurrence across all analyzed locations (P1–P6). An increase in the frequency of low-energy sea states (Hs ≈ 0.5–1.5 m, Tp ≈ 7–9 s) is observed, while a general decrease occurs in intermediate sea states (Hs ≈ 1.5–4 m, Tp ≈ 9–14 s), which typically dominate the wave climate. Changes in higher-energy sea states are generally small and do not indicate a significant increase in extreme conditions. This pattern suggests a shift toward moderate wave conditions in the future, with potential implications for wave energy resource availability and system performance. These results are in line with the ones presented by [12].
Figure 6.
Difference in sea-state occurrence (%) between future (2030–2054) and past (1990–2014) periods, based on downscaled wave simulations.
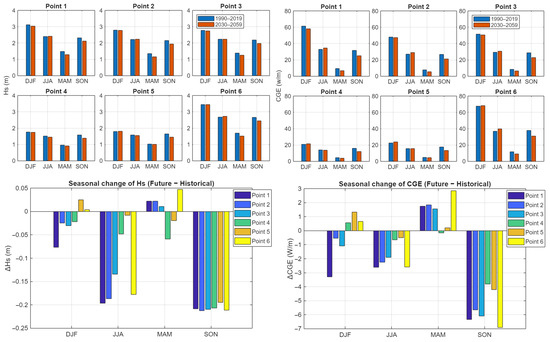
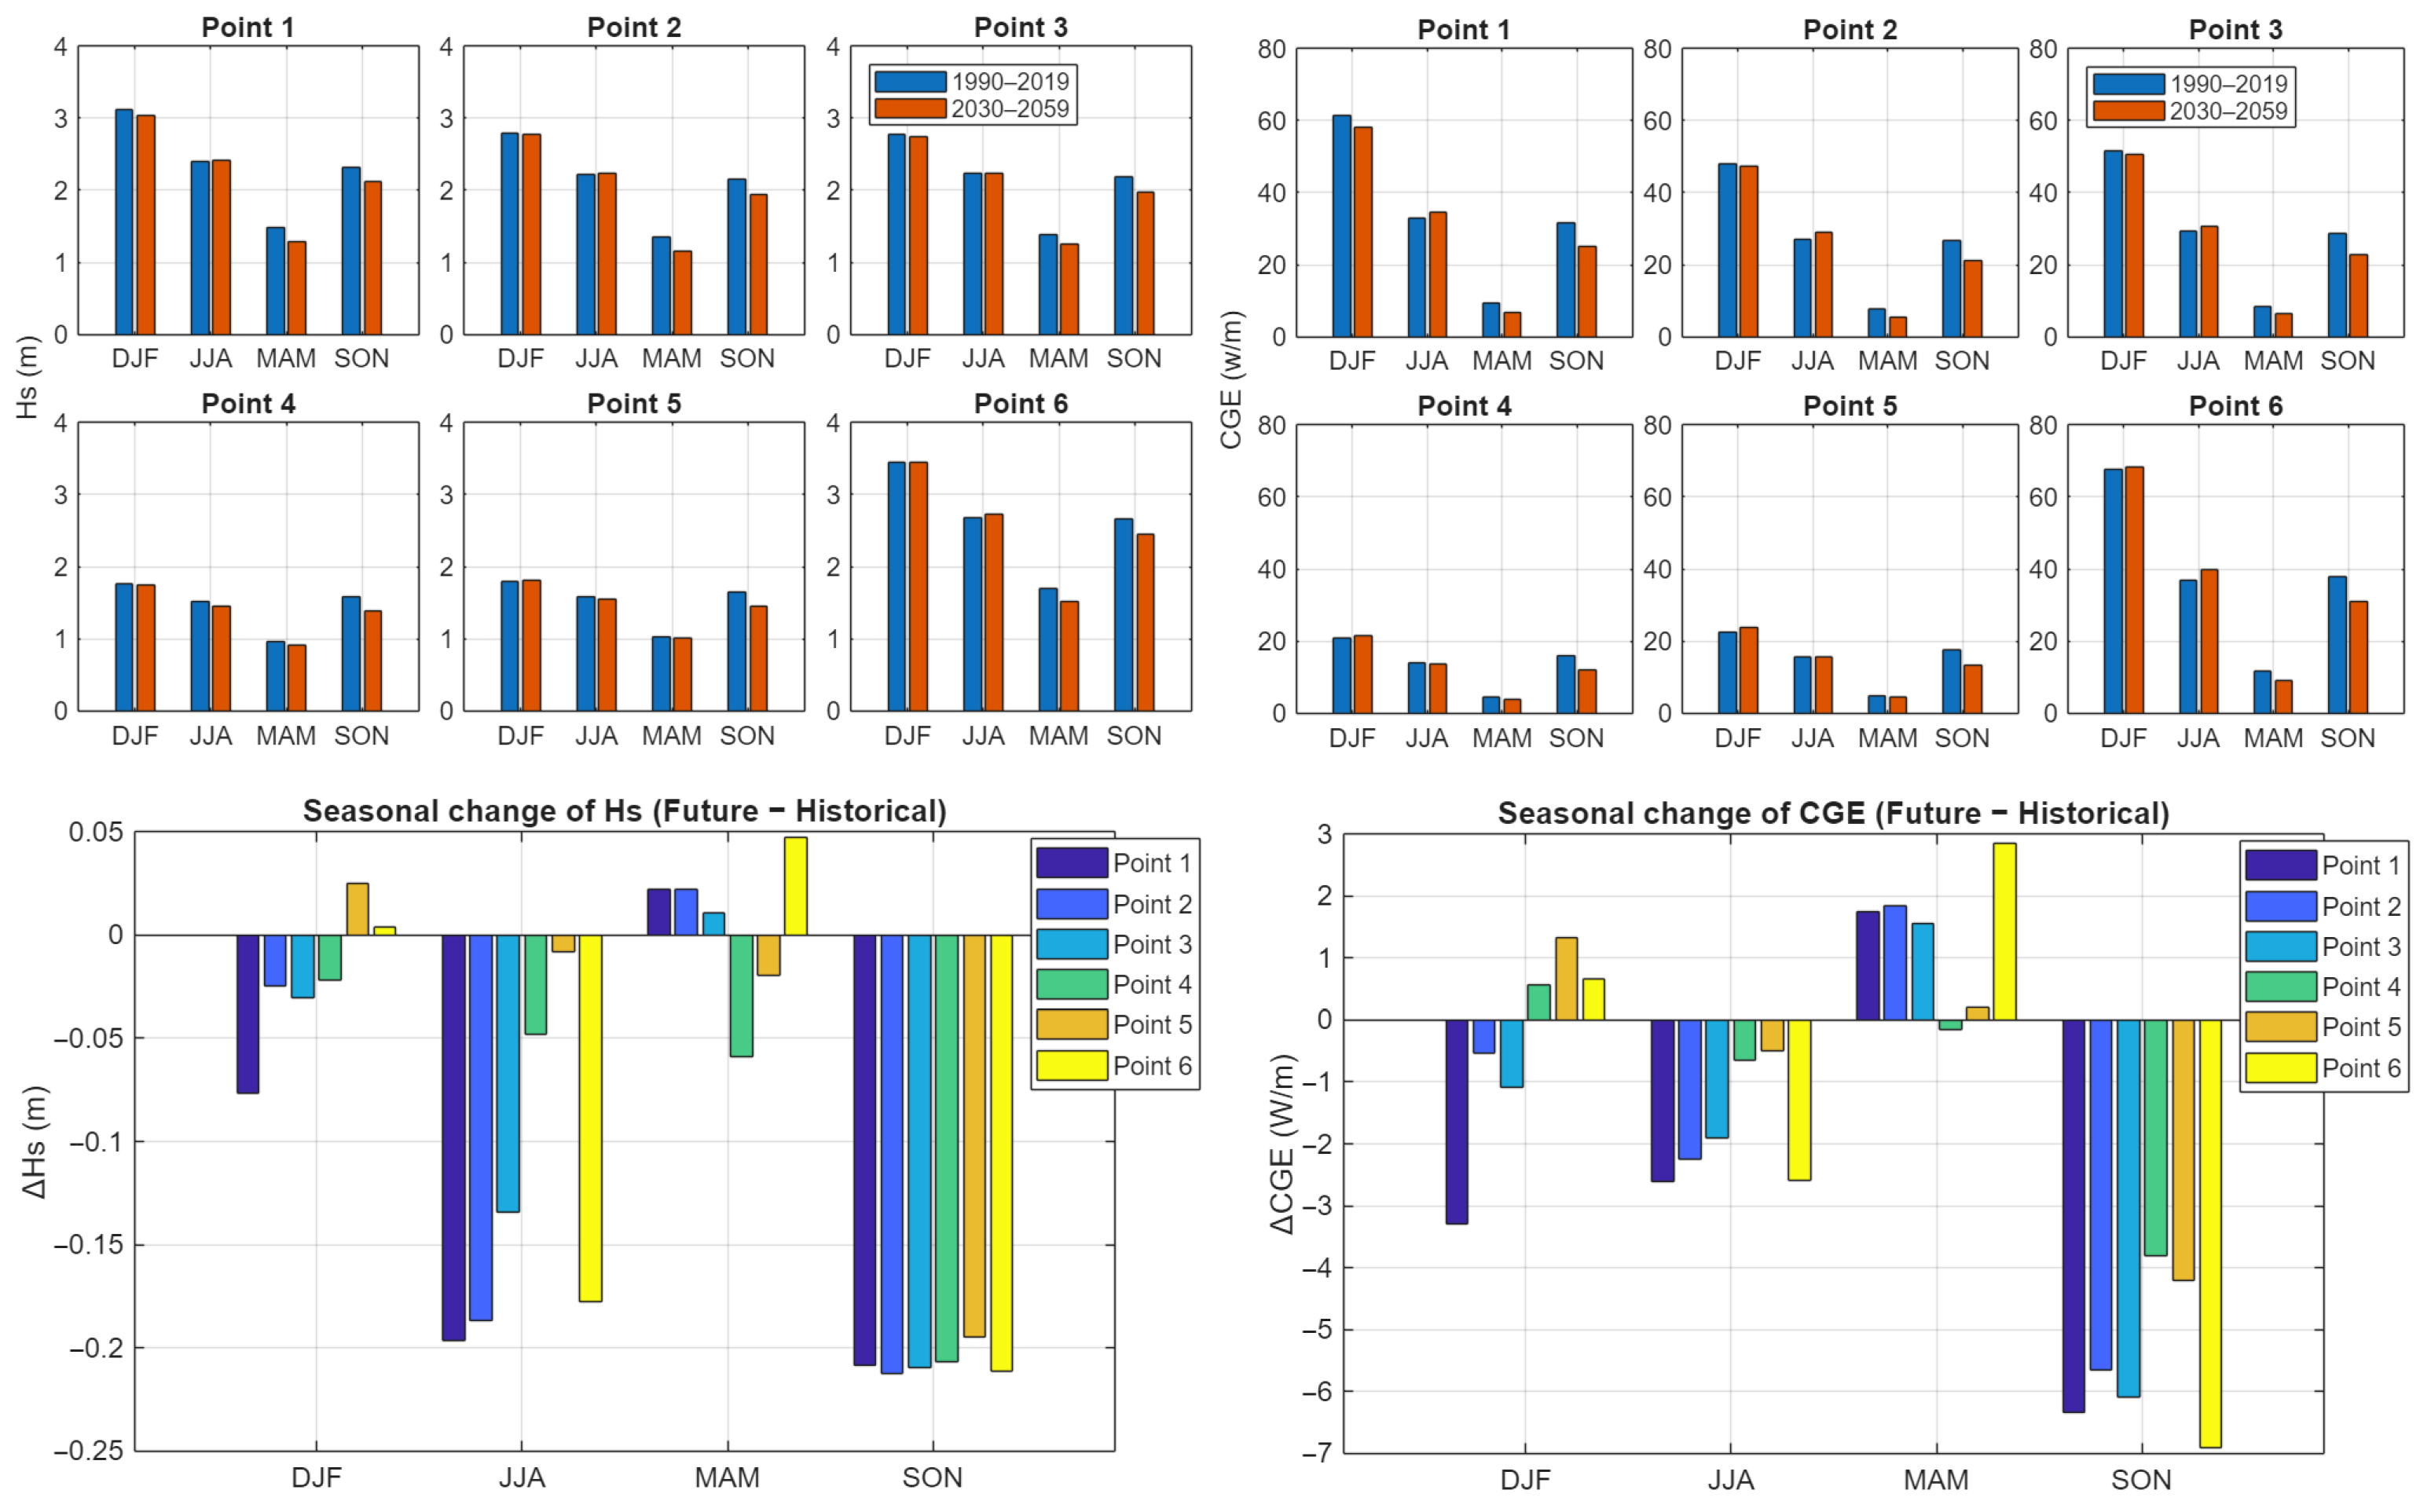
The seasonal statistics were calculated for the 6 sites, for both the historical period (1990–2019) and a future projection (2030–2059). Variations were assessed by computing absolute and relative differences between the two timeframes for each meteorological season. The seasons—DJF, MAM, JJA, and SON—were defined according to the standard meteorological convention, with December attributed to the following year.
Figure 7 shows a slight reduction in significant wave height (Hs) at most locations during winter (DJF). In summer (JJA), Hs decreases across nearly all sites. The most pronounced reductions occur during autumn (SON) for all locations. A similar pattern is observed for wave power, with most locations indicating a projected decrease in CGE, especially in summer and autumn. Winter presents only minor variations, with some sites showing slight increases while others exhibit small decreases. The results indicate JJA and SON display predominantly negative ΔHs values across all sites, highlighting a significant reduction in summer and autumn wave conditions. The largest decrease reaches approximately −0.2 m (~20 cm), mainly during summer.
Figure 7.
Seasonal variations between 1990 and 2019 and 2030–2059, for Hs (left panel) and CGE (right panel), for each location (top panel), and seasonal differences for Hs (left panel) and CGE (right panel), of the 6 locations considered (bottom panel).
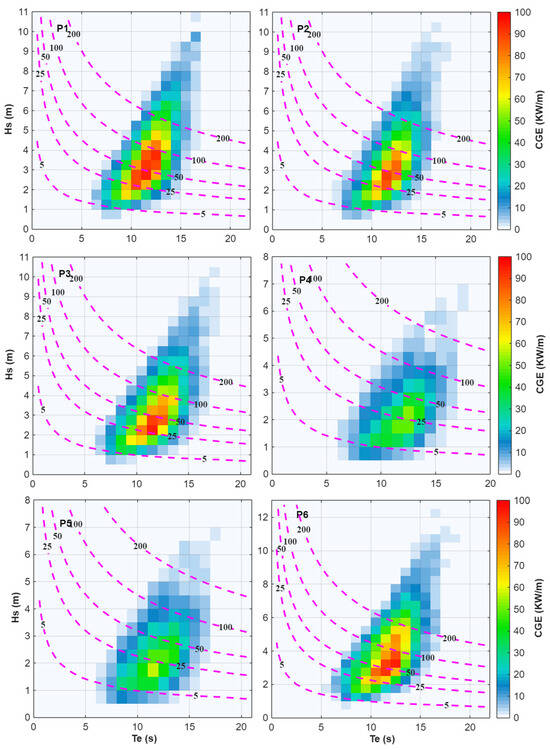
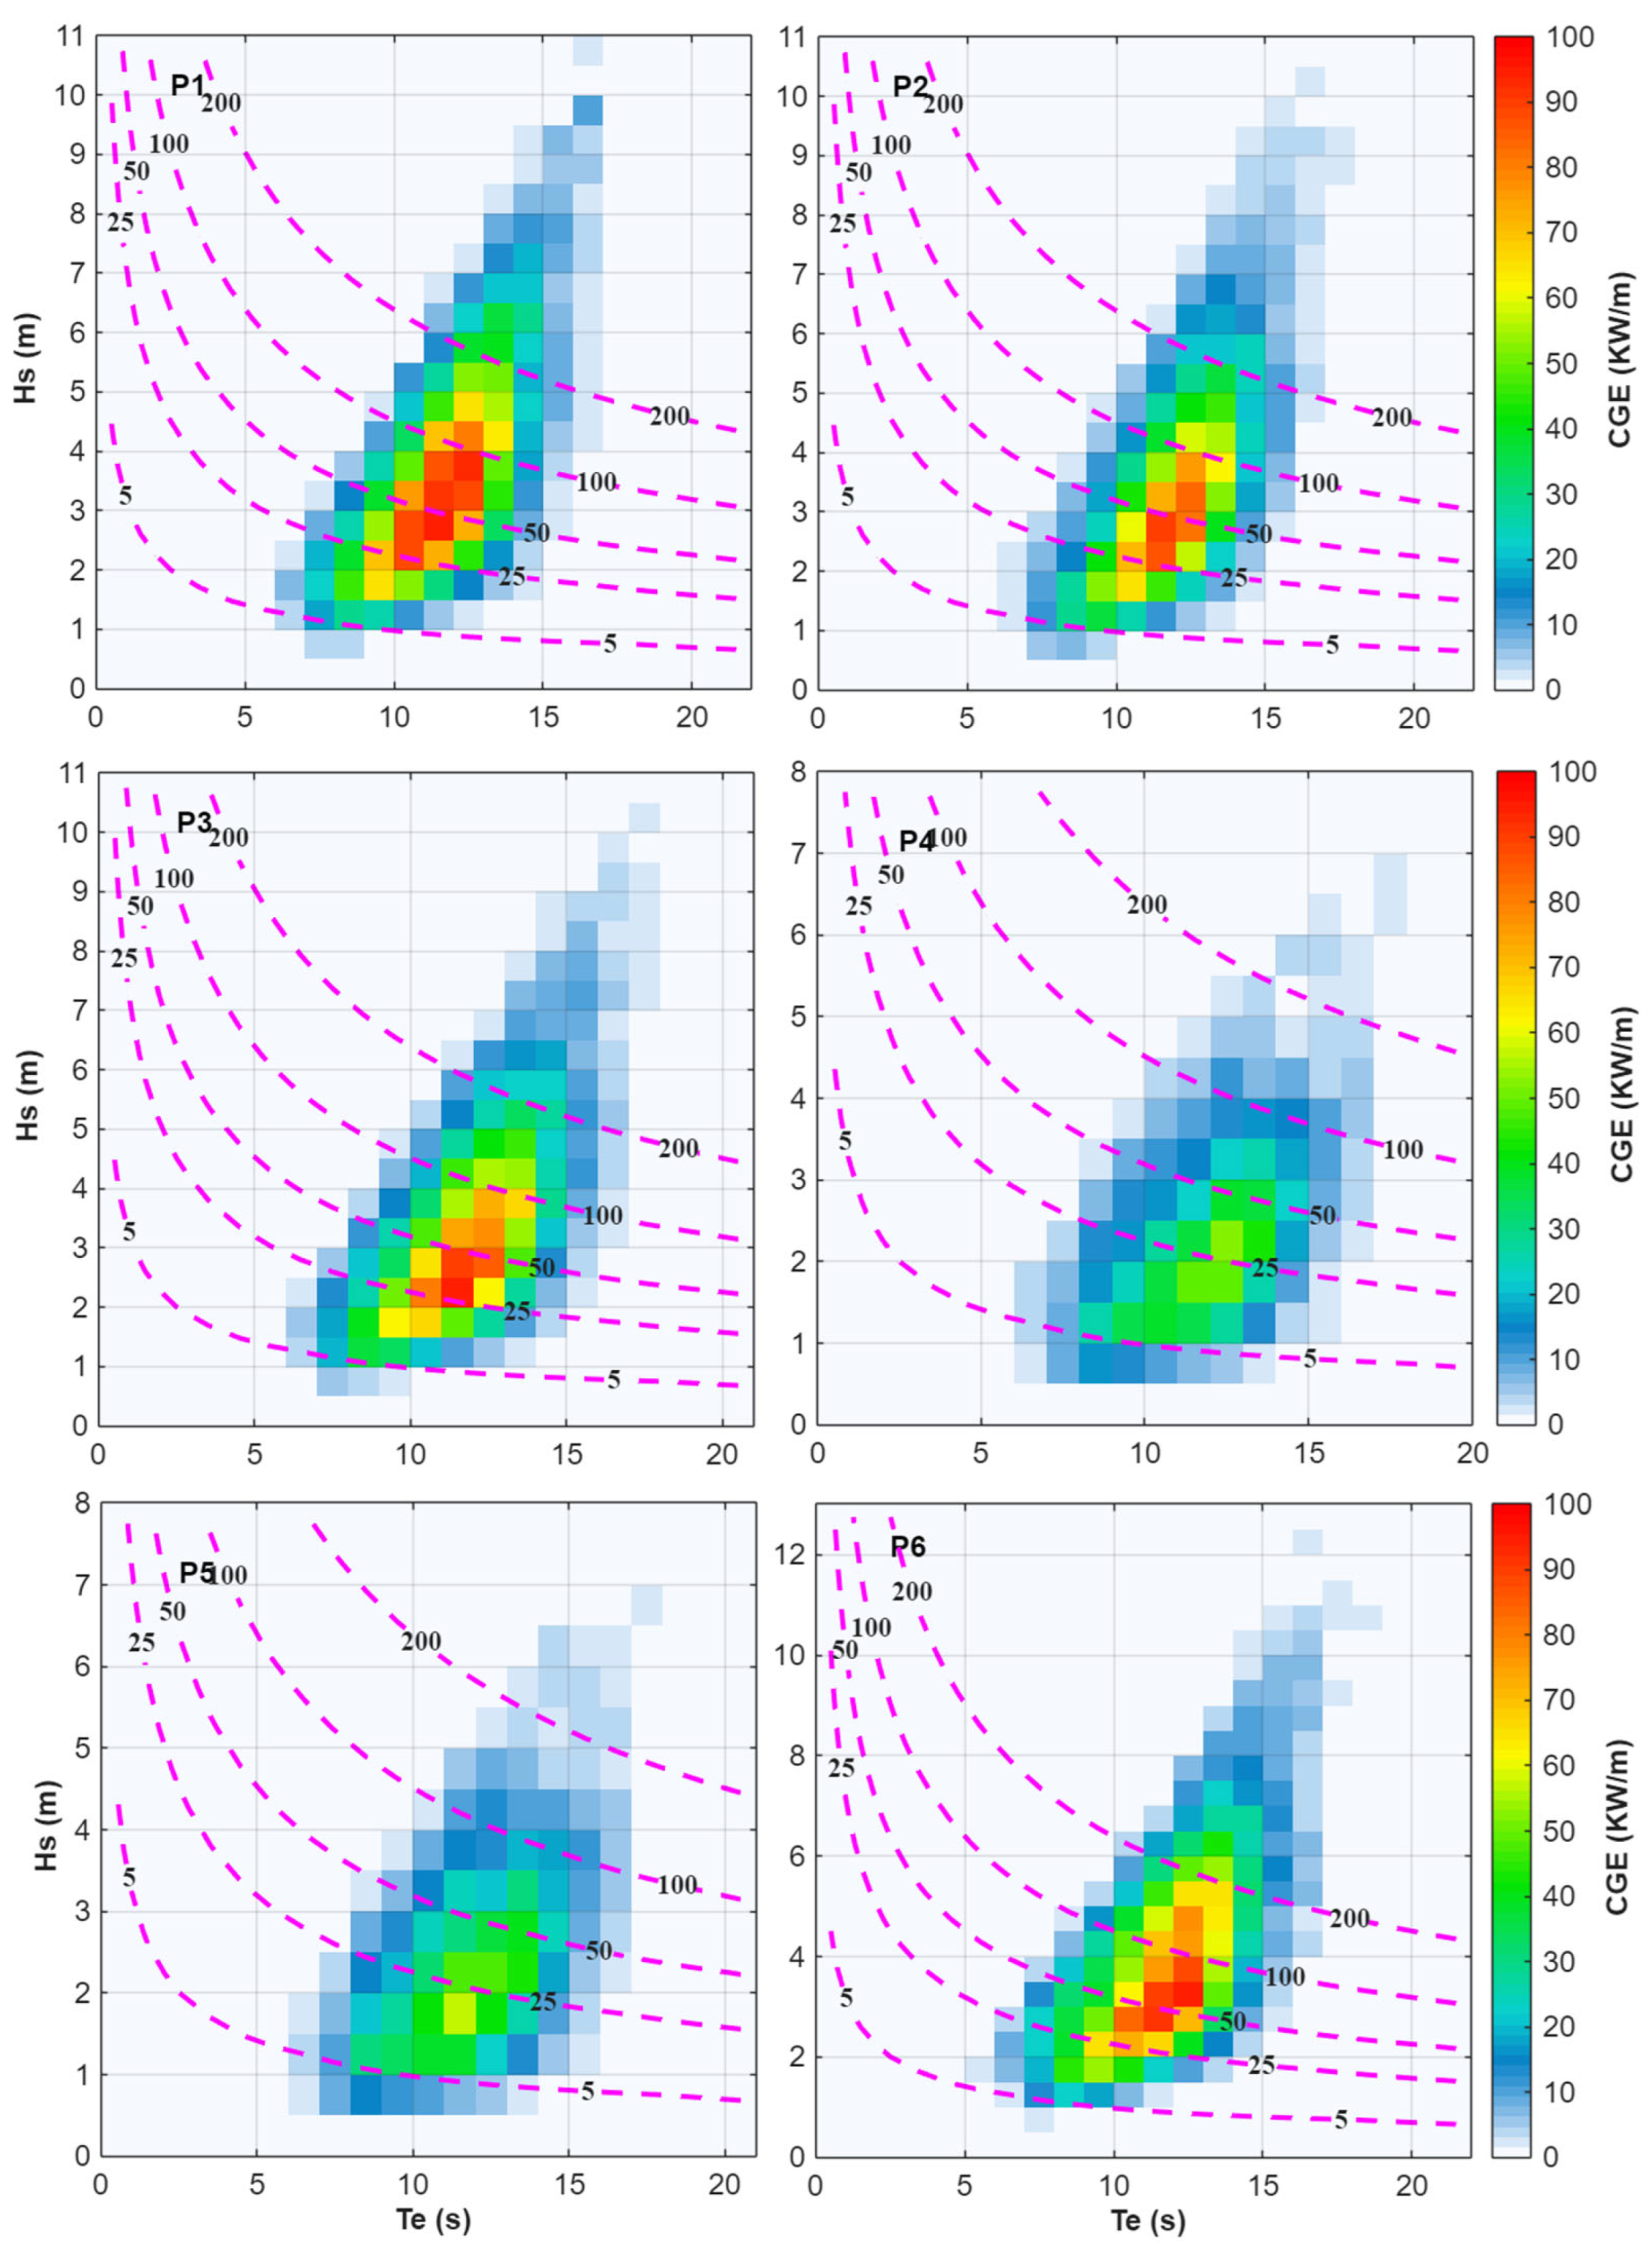
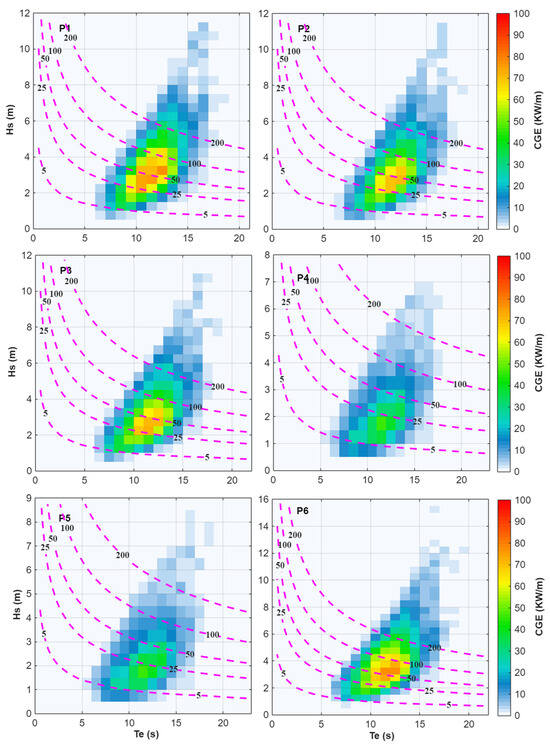
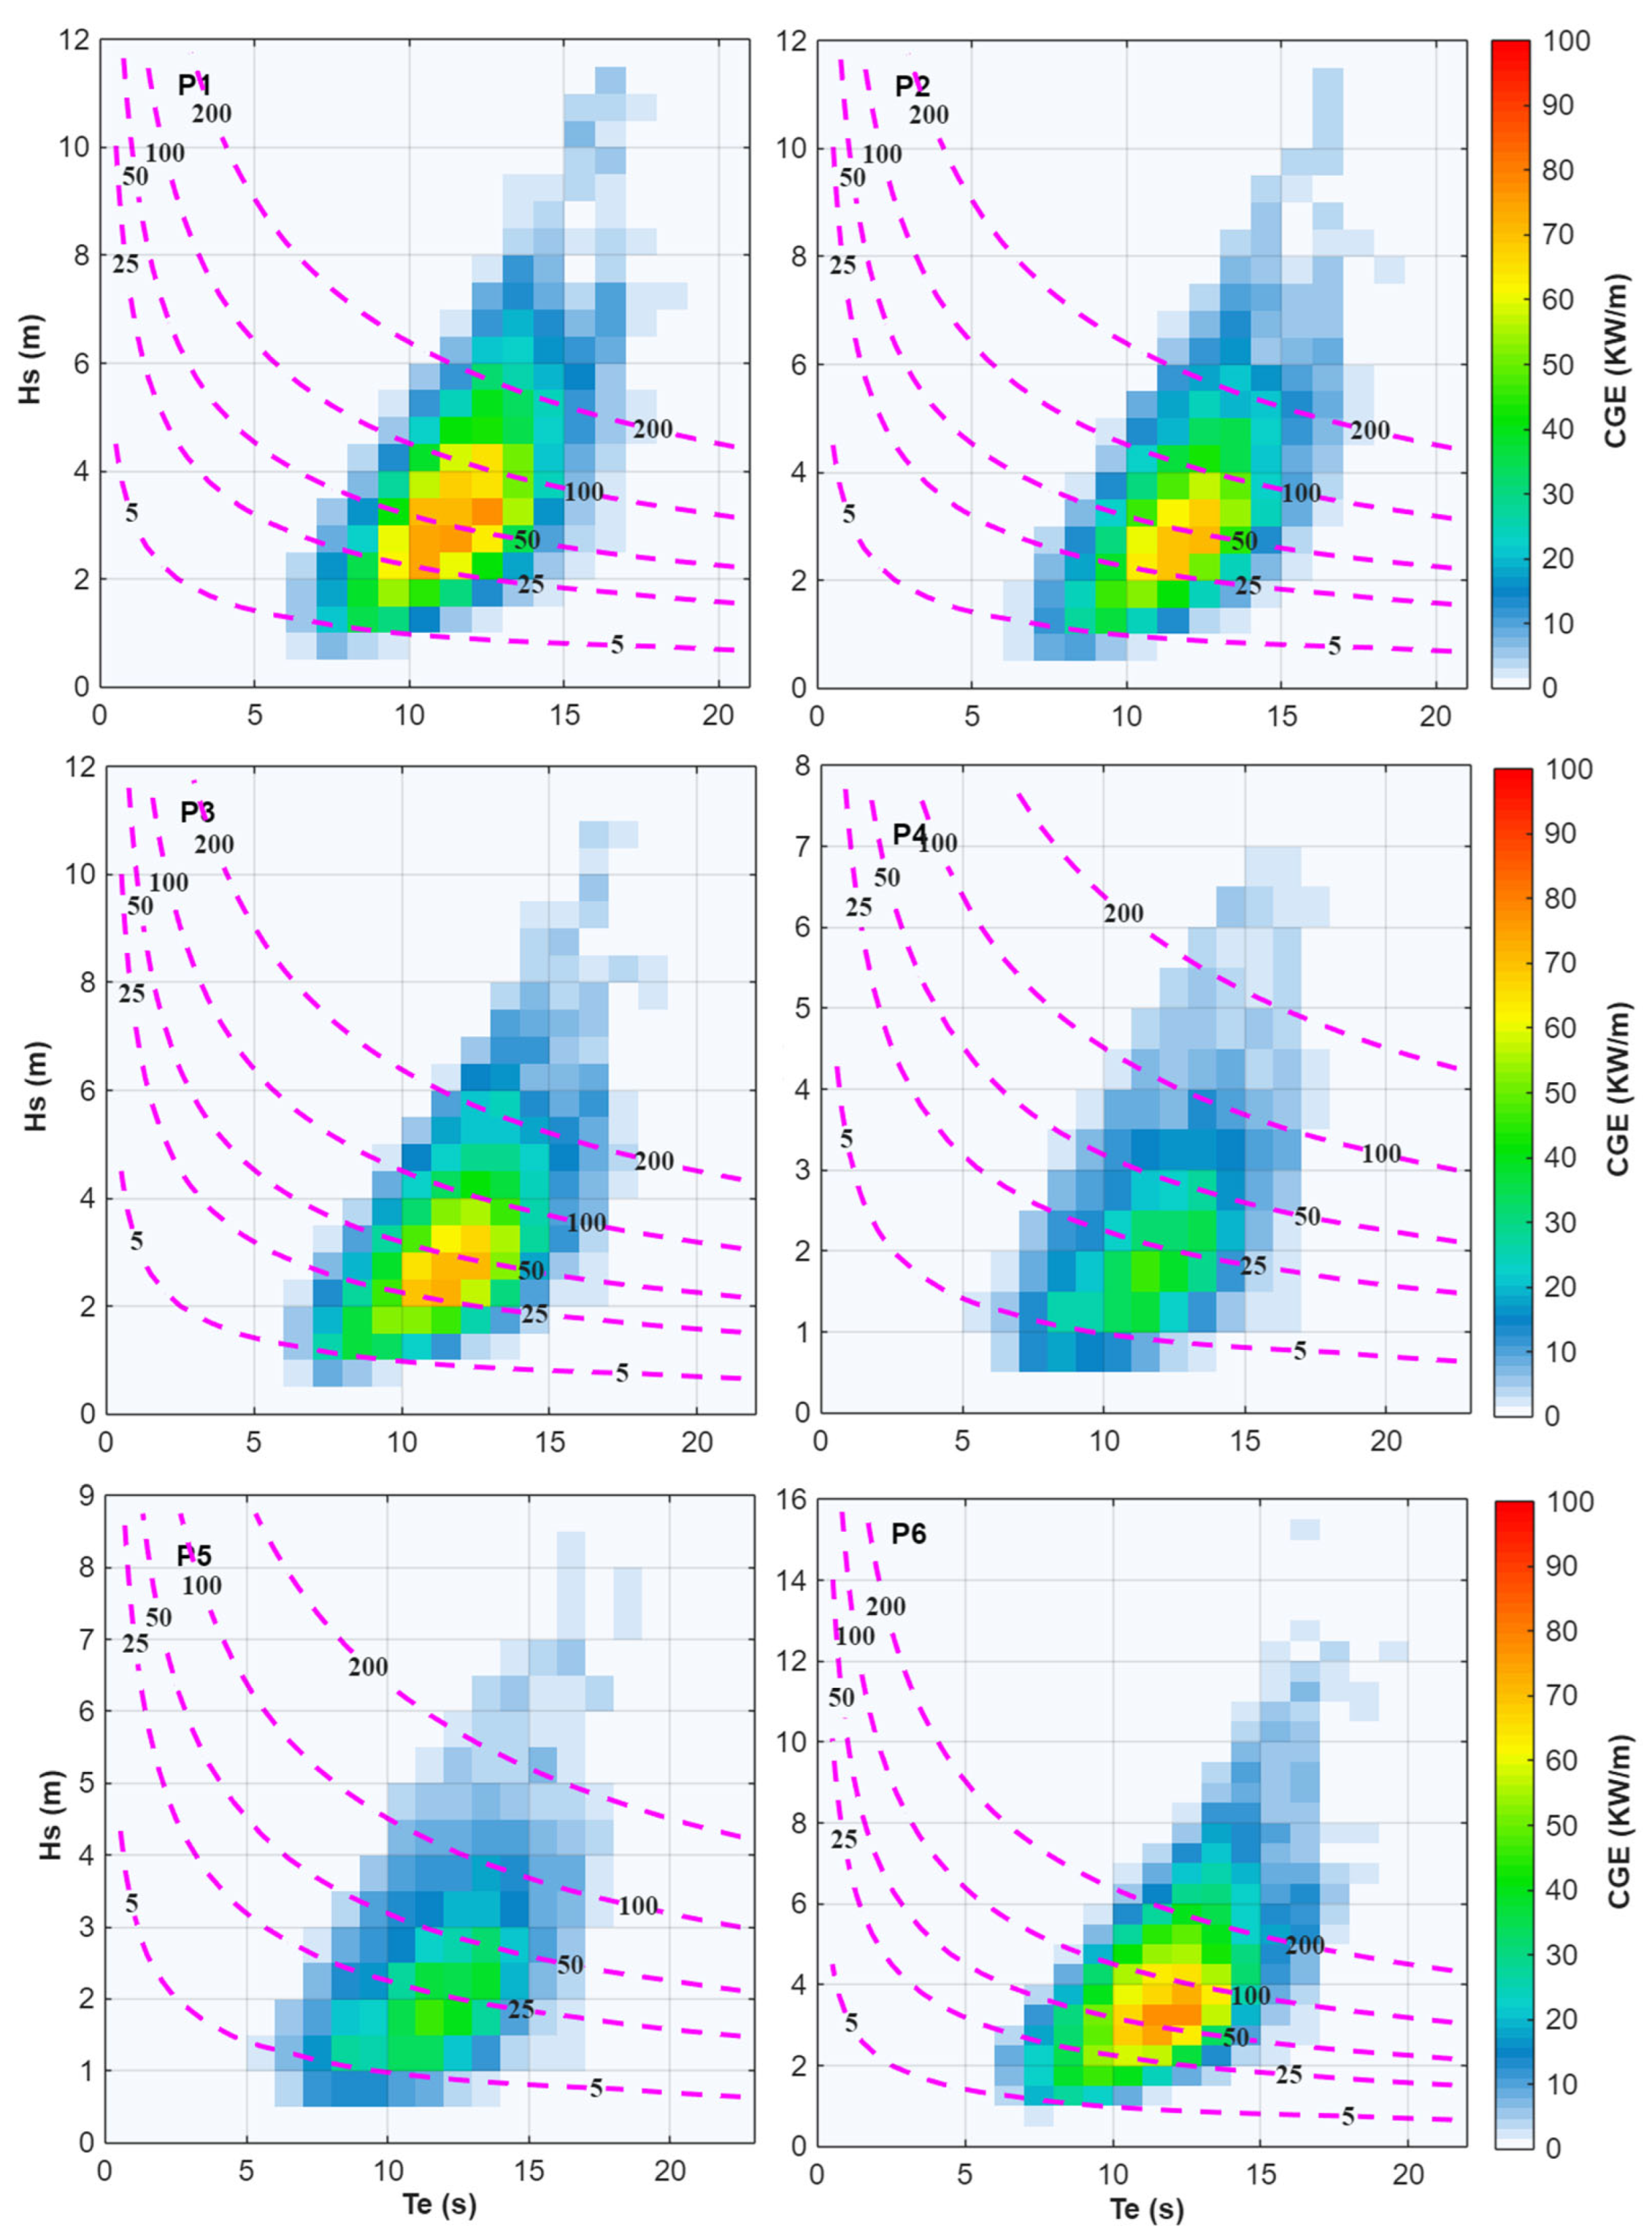
Figure 8 and Figure 9 show the joint distribution of Hs and energy period Te for six representative locations (P1–P6), together with contours of constant wave energy flux (CGE). In all sites, the highest occurrence density is concentrated within intermediate sea states, generally characterized by Hs between approximately 2–5 m and Te between 9 and 14 s, which correspond to the most relevant conditions for wave energy extraction. Locations P1–P3 show similar distributions, with energy concentrated around moderate wave heights and periods, indicating relatively consistent offshore wave climates. Locations P4 and P5 exhibit lower Hs values overall, with occurrences shifted toward smaller wave heights and slightly shorter periods, suggesting less energetic conditions. In contrast, P6 shows a stronger distribution extending toward higher Hs values, indicating the presence of more energetic sea states and higher wave power potential. The overlaid CGE isolines highlight that the highest energy flux values are associated with combinations of larger wave heights and longer periods, though these conditions occur less frequently.
Figure 8.
Joint distribution of the wave energy percentage of occurrence for 1990–2019, for different locations. The color scale represents the contribution of the sea state to the total incident energy, as a percentage. The wave power isolines are also represented.
Figure 9.
Joint distribution of the wave energy percentage of occurrence for 2030–2059, for the different locations. The color scale represents the contribution of the sea state to the total incident energy, as a percentage. The wave power isolines are also represented.
Comparing the two scenarios, it is evident that the distributions preserve a pattern like the historical period, with the highest occurrence densities concentrated in intermediate sea states, typically characterized by Hs values between approximately 2–5 m and Te ranging from 9 to 14 s. These conditions continue to represent the most relevant sea states for wave energy conversion. Although a slight shift toward lower Hs values can be observed, indicating a reduction in energetic conditions.
4.3. Device Types and Working Principles
Wave Energy Converters (WECs) are technologies developed to capture the energy contained in ocean waves and transform it into electrical power. These devices can be classified according to several criteria, including their geometric configuration and their orientation with respect to the incoming wave field. A broad range of WEC concepts has been designed to operate under diverse wave climates and water depths, highlighting the strong dependence of device performance and survivability on local wave conditions.
The selection of these WEC technologies aims to represent a diverse range of energy conversion principles and design approaches. The four devices analyzed—AquaBuoy, Wavestar, Oceantec, and Atargis—were chosen to cover distinct categories of WECs, including point absorbers, multi-body systems, inertial/gyroscopic devices, and submerged pressure-differential systems. The AquaBuoy is a point absorber device consisting of a floating buoy connected to a submerged structure [27]. Energy is extracted from the relative heave motion induced by incident waves. The device is designed to operate close to resonance, maximizing motion response under dominant wave periods. The Wavestar device is a multi-body point absorber system composed of several floats mounted on a fixed structure [28]. Each float oscillates independently in response to wave action, allowing distributed energy capture and improving adaptability to varying sea states. The Oceantec device (oscillating water column type) operates through the oscillation of an internal water column inside a partially submerged chamber [29]. The Atargis device is a fully submerged pressure-differential system. It extracts energy from pressure variations beneath the free surface caused by passing waves, rather than relying on visible surface motion. This allows operation with reduced visual impact and potentially improved survivability under extreme conditions. More information is provided in Table 4.
Table 4.
Characterization of the WEC used.
WEC performance is strongly dependent on the local wave climate and the degree of device–site matching. Different technologies operate optimally within specific wave periods and energy ranges, leading to significant spatial variability in efficiency. Point absorbers such as AquaBuoy rely on resonance and are highly sensitive to the dominant wave period, whereas multi-body systems like Wavestar can capture energy over a broader spectral range. The inertial Oceantec device is driven by pitch motion and benefits from long-period waves, while the submerged Atargis system depends on pressure fluctuations and is less sensitive to surface conditions. These differences highlight that no single WEC is universally optimal, and that performance is governed by the interaction between device characteristics and local wave conditions.
4.4. Electric Power Output
For each location, the wave climate is described by a joint distribution of: Hs and Te obtained from the hindcast and future simulations. The average electrical power output: Pe is computed by weighing the power associated with each sea state by its probability of occurrence. Estimating average electrical power output from a wave energy converter at a given location involves coupling the device’s power matrix to the local wave climate. The average electrical power output, , is calculated for each period (past and future) and is given by:
where is the probability of occurrence of a given sea state and is the WEC power matrix. Each WEC power matrices used in this study were obtained from: [17,29,30] and is presented in the Appendix A. Both the scatter diagram and the power matrix provide structured representations of the wave resource and WEC performance by organizing data into consistent discrete intervals. The power matrices used in this study represent the electrical output of each WEC within its operational range, as a function of sea state parameters (significant wave height and energy period). These matrices implicitly include device-specific operational limits, such as rated power and cut-off thresholds, beyond which power production is reduced or set to zero to represent shutdown or protection mechanisms under extreme conditions.
The scatter diagram describes the frequency of occurrence of sea states through the joint distribution of significant wave height and wave period, whereas the power matrix represents the electrical power output of a given WEC for each combination of significant wave height and wave period.
The capacity factor (Cf) quantifies effectively a wave energy converter operates relative to its rated (maximum) power capacity. It is expressed as the ratio between the average electrical power produced (Pe) over a given period and the rated power () of the device:
Table 5 shows the mean values of the electric power and capacity factors among the analyzed WECs, for historical simulations. The results show that Atargis achieves the highest power output at all locations, exceeding ~1200 kW at Point 6, reflecting its large-scale design and suitability for energetic sea states. Wavestar presents intermediate production levels, with values ranging between approximately 245–408 kW, while Oceantec generates moderate power outputs between about 60–154 kW. AquaBuoy exhibits the lowest production, with values generally below 65 kW across all sites.
Table 5.
Electric power and capacity factor for the historical period (1990–2019).
Table 6 summarizes the mean electric power and capacity factor values for the analyzed WECs under future conditions. Atargis device achieves the highest power output at all locations, exceeding ~1130 kW at Point 6. Wavestar shows intermediate production levels (≈217–391 kW), followed by Oceantec (≈60–150 kW), while AquaBuoy presents the lowest outputs, generally below 60 kW across all sites.
Table 6.
Electric power and capacity factor for the future period (2030–2059).
The capacity factor results show significant variations in operational efficiency across WEC technologies and locations. Wavestar achieves the highest capacity factors at all sites, ranging from approximately 41% to 68%, indicating strong performance under the prevailing wave conditions and good alignment with the dominant sea states. Oceantec shows moderate efficiency, with capacity factors between about 12% and 31%, while AquaBuoy presents slightly lower values, varying from roughly 10% to 25%. Atargis presents consistently high performance, with capacity factors between about 18–48%, demonstrating good adaptation to energetic sea states. Spatially, Point P6 consistently records the highest capacity factors for all devices, whereas locations P4 and P5 show the lowest values, confirming the influence of local wave energy availability on device performance. A slight decrease in both electric power output and capacity factor is observed between the historical and future periods for most devices and locations, reflecting the projected decrease in wave energy resources.
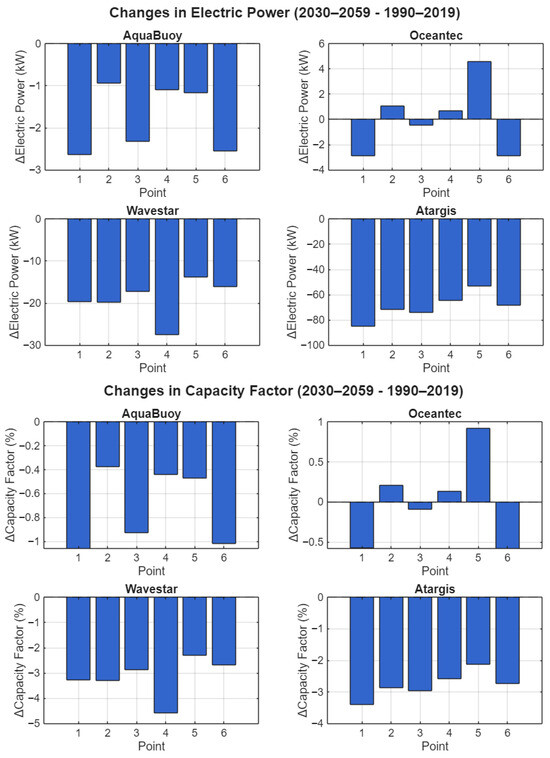
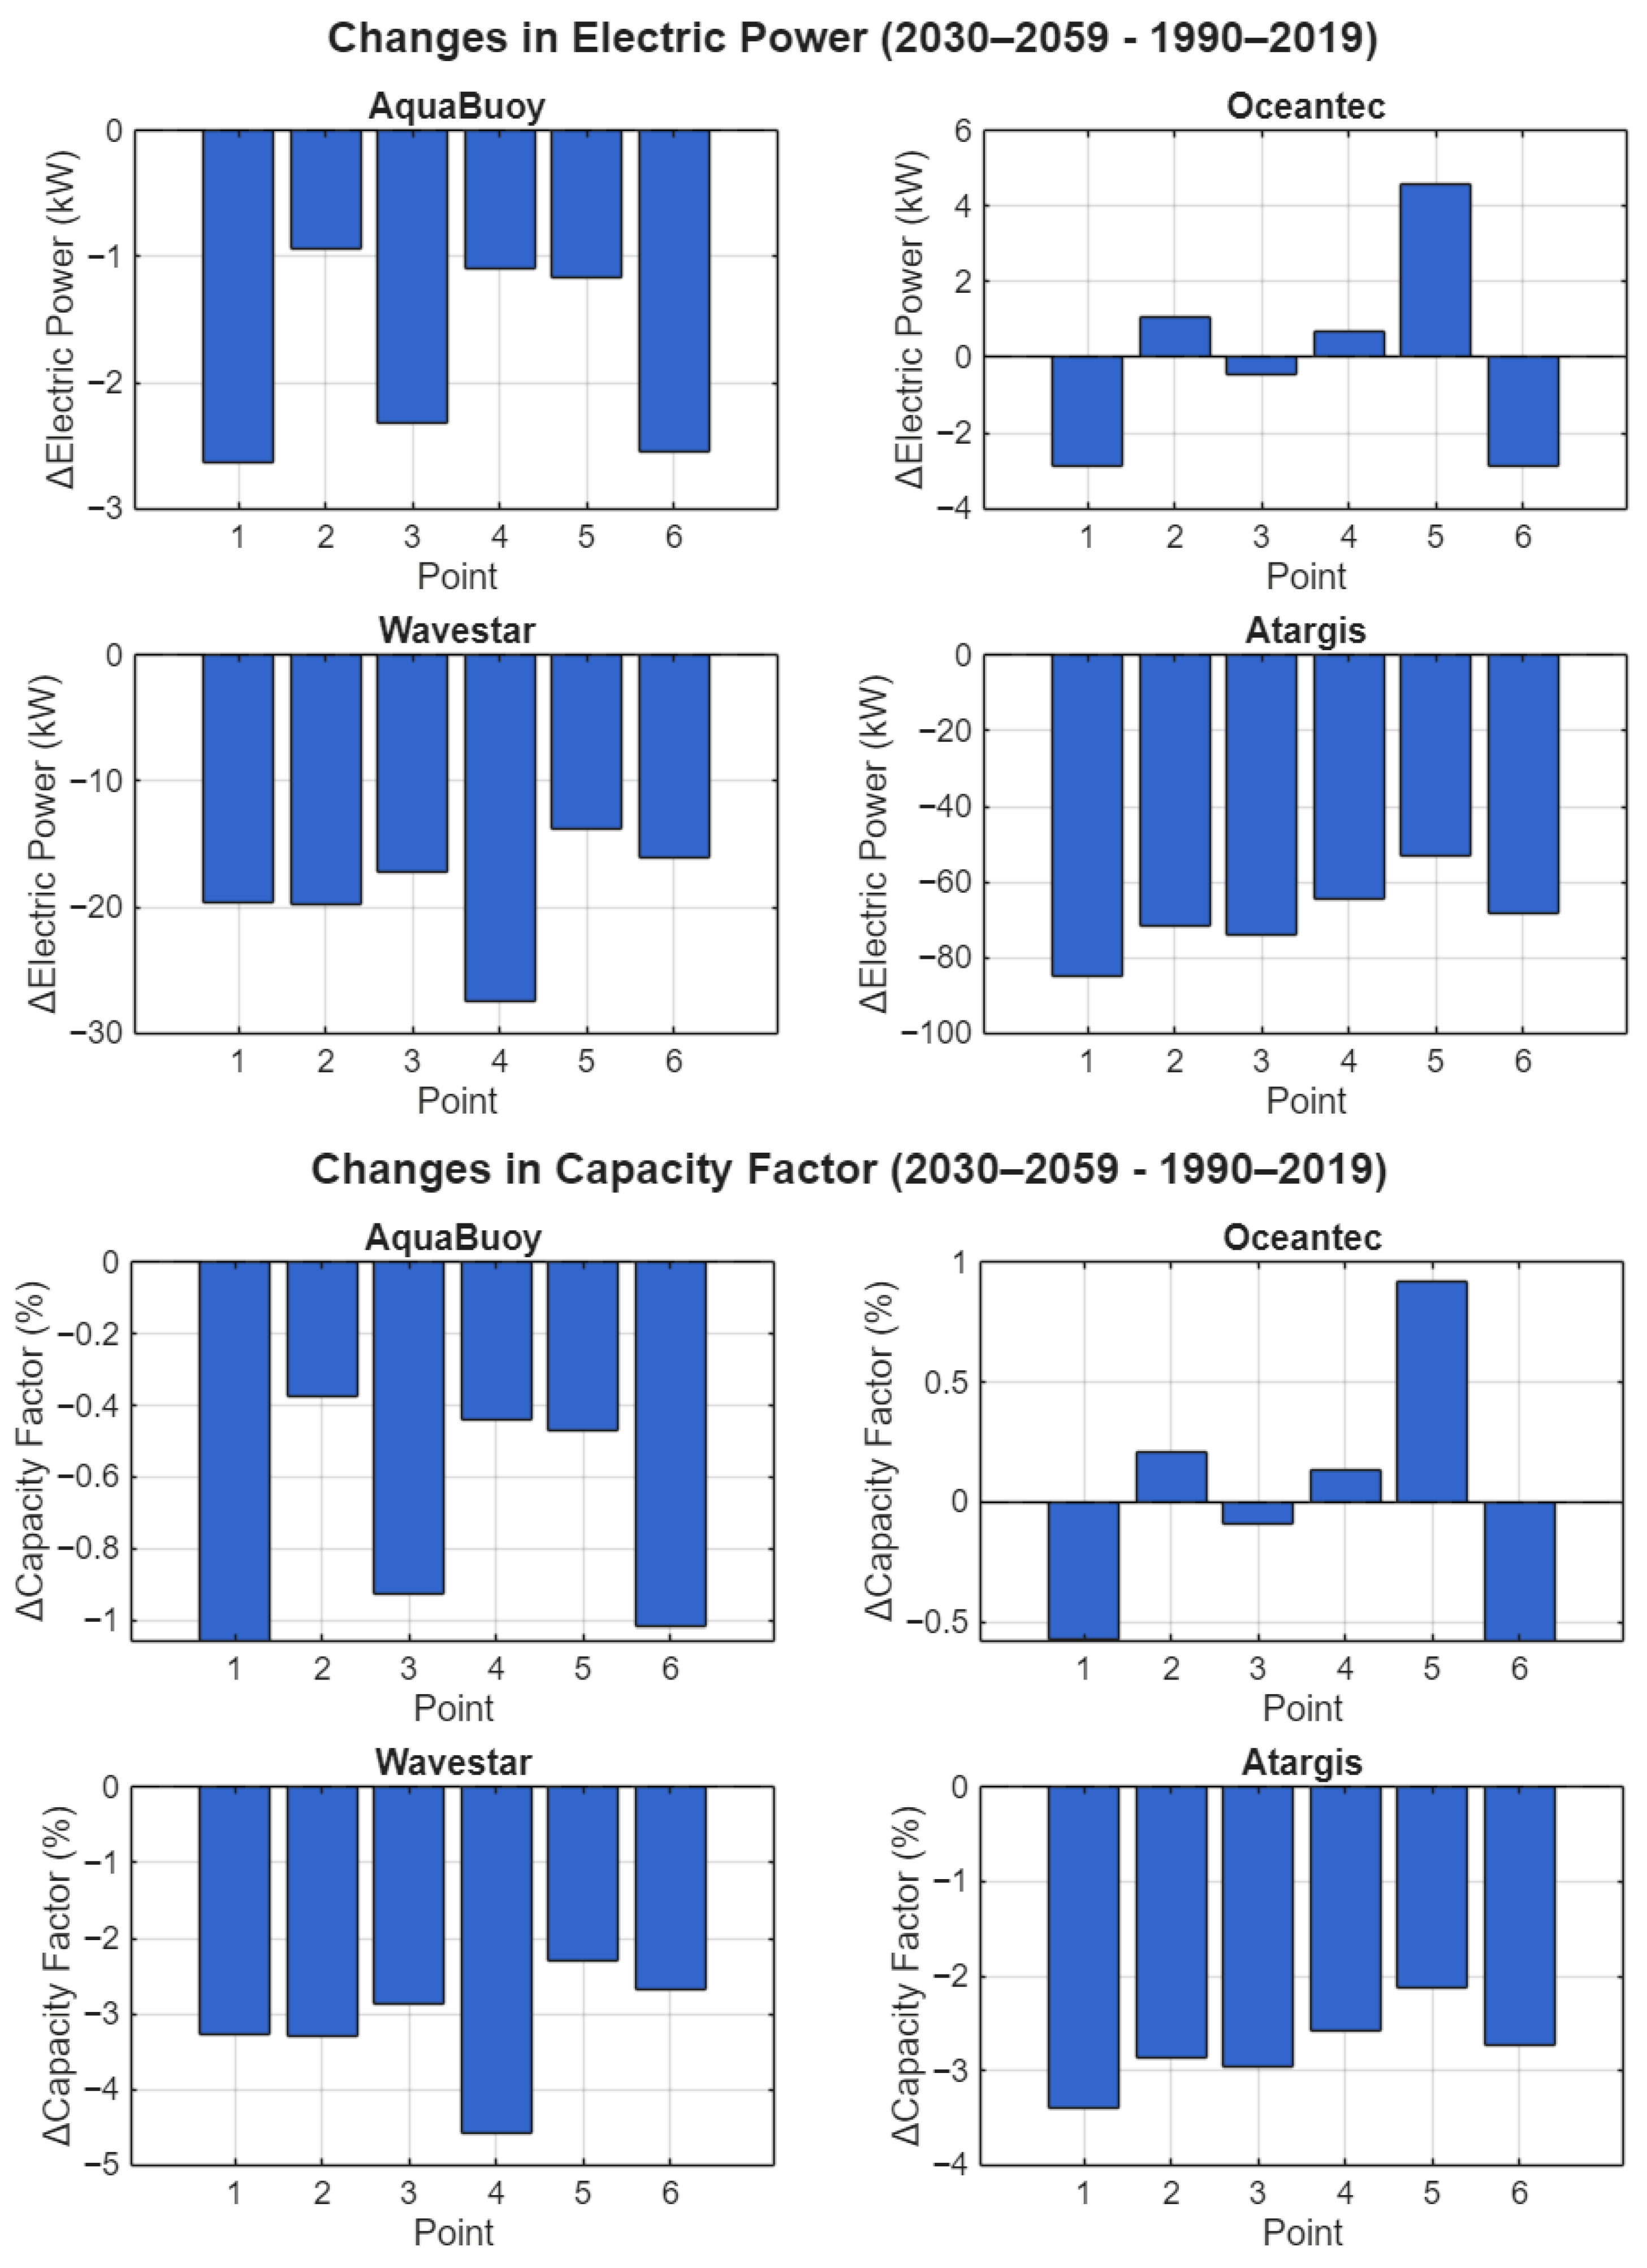
Figure 10 presents the projected changes in Electric Power (ΔPe), (left panel), and in capacity factor (ΔCF), (right panel), between the future period (2030–2059) and the historical period (1990–2019) for four WECs, across the six studied locations. Negative values indicate a reduction in performance under future wave conditions, while positive values indicate improvement. The future projections (2030–2059) indicate a general but moderate reduction in both electric power production and capacity factor across most devices and locations. The decrease is more pronounced at the most energetic sites (particularly P1, P2, P3, and P6), where devices such as Wavestar and Atargis show noticeable declines in performance. Atargis exhibits reductions of about 2–4% in capacity factor at several locations, while Wavestar shows decreases of approximately 3–4% at the most exposed sites. Overall, both metrics indicate a general reduction in WEC performance under future wave climate conditions, consistent with the previously identified decreases in significant wave height and wave energy flux, particularly during summer and autumn. In summary, the results demonstrate that climate-change-induced modifications in the wave climate are expected to reduce the efficiency of most WEC technologies, although the degree of impact depends on device type and site characteristics. Devices adapted to moderate sea states (e.g., Oceantec) appear more resilient, whereas technologies requiring higher wave energy levels experience larger performance declines.
Figure 10.
The blue bars show the projected changes in Electric Power (ΔPe) and in capacity factor (ΔCF) between the future period (2030–2059) and the historical period (1990–2019), at each point.
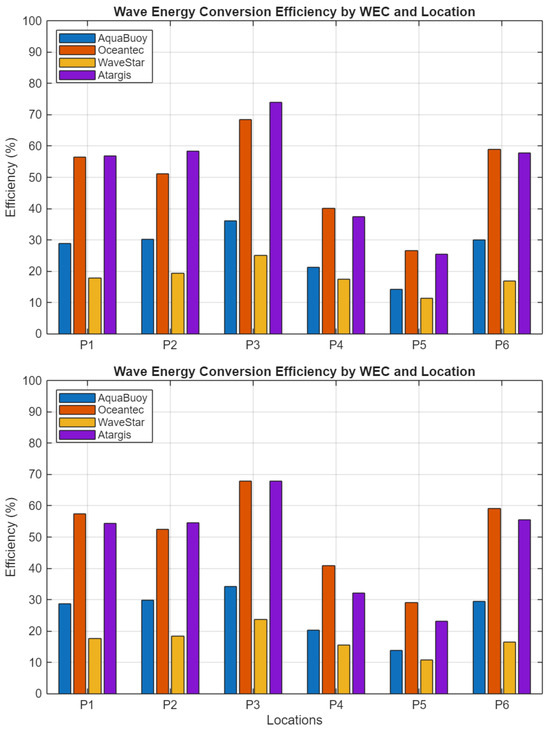
In addition to electric power production, capacity factor, an efficiency metric was evaluated to quantify the ability of each WEC to convert the available wave energy resource into electrical power, allowing a direct comparison of device performance independent of installed capacity.
The wave energy conversion efficiency (ε) measures how much of the available wave energy resource is converted into electricity by a WEC, and is calculated as the ratio between the mean electrical power output and the incident wave power available across the characteristic width of each device:
where (kW) is the power produced by the WEC, (kW/m) is the mean available wave energy at a specific point and B is the device width (m).
Figure 11 shows the calculated wave energy conversion efficiencies for both present and future periods. The results reveal significant differences in wave energy conversion performance among the analyzed devices and across the six locations. Wavestar and Atargis achieve the highest efficiencies, with values reaching approximately 68–74% at the most energetic sites (particularly P3), indicating a strong ability to convert the available wave resource into electrical power. In contrast, AquaBuoy and Oceantec exhibit more moderate efficiencies, generally ranging between 14 and 36% and 27–59%, respectively. The highest efficiencies are consistently observed at the more energetic offshore locations (P1-P3 and P6), while lower values occur at the less energetic sites (P4 and P5), reflecting the dependence of device performance on local wave climate conditions. Once again for the future period the results are consistent with previous ones, demonstrating a small reduction in efficiency across all locations, for all the WECs considered.
Figure 11.
Comparison of the efficiency for both historical and future simulations 1990–2019 (upper panel) 2030–2059 (bottom panel).
5. Economic Performance
While technical performance quantifies energy extraction potential, economic feasibility ultimately determines deployment viability.
The LCOE is used to evaluate the economic performance of the different WEC technologies. In this study, LCOE is defined following a standard discounted cash flow approach, accounting for the time value of money and lifetime system performance:
where represents the total costs in year , is the energy produced in year. is the discount rate, and is the project lifetime.
The total costs include initial capital expenditures (CapEx) and ongoing operational and maintenance costs (OpEx). Energy production is evaluated on an annual basis and assumed to vary depending on device performance and site-specific wave conditions. For simplification, if constant annual energy production and OpEx are assumed, the LCOE expression can be reformulated as:
where AEP is the annual energy production, calculated as AEP = Pe × ∆t, being ∆t = 24 h multiplied by 365 days, Pe is the average electrical power output (in MW) and is the Capital Recovery Factor, defined as:
For this study it was considered a discount rate of 8% (typical values vary between 5 and 8%) and a lifetime of 20 years (wave energy projects typically assume 20–25 years). In this study, a practical packing density of 10 MW/km2 was assumed for evaluating the feasibility of a wave farm, consistent [18]. This value represents a typical estimate used in the literature for offshore wave energy arrays, accounting for spacing requirements between devices to minimize hydrodynamic interactions (e.g., wake effects, wave shadowing) and to ensure safe installation and maintenance operations.
The CapEx and OpEx values adopted in this study are based on representative ranges reported in the literature for wave energy technologies. Different values were assigned to each WEC to reflect variations in design and technological complexity, with CapEx ranging from 3.5 to 5.5 M€/MW and OpEx between 4% and 5.5% of CapEx. More information can be found in Table 7.
Table 7.
Economic analysis of the future productivity of wave energy.
These values are consistent with typical estimates for early-stage wave energy systems and allow for a comparative assessment across devices under a unified economic framework. However, it should be noted that site-specific factors may influence the actual cost structure. In the case of the Azores, additional costs may arise due to logistical challenges, offshore accessibility, and maintenance operations in remote locations. As such, the results should be interpreted as indicative, and not as a detailed site-specific economic evaluation.
Capital and operational expenditures vary significantly among wave energy converters due to differences in structural design, power take-off systems, deployment depth, and technological maturity [19,29]. Large overtopping devices exhibit higher capital intensity due to massive structural components and multiple turbine systems, whereas compact point absorbers require lower structural investment but may incur higher operational expenditures due to offshore accessibility constraints. These cost assumptions are consistent with reported pre-commercial wave energy ranges of 4–8 M€/MW, with annual OpEx typically representing 4–6% of CapEx. Nevertheless, due to limited commercial deployment, cost values are subject to uncertainty and should be interpreted as indicative rather than definitive.
Table 8 and Table 9 show the LCOE behavior for 4 different installed capacities (2, 5, 10, 20 MW). The results show that across all WECs, LCOE decreases as installed capacity increases: AquaBuoy varies from 556.8 to 463.1 €/MWh, Oceantec from 546.9 to 454.9 €/MWh, Wavestar from 211.4 to 188.1 €/MWh and Atargis from 223.3 to 185.8.0 €/MWh, for the historical simulations. Comparing the different technologies, Wavestar exhibits the lowest LCOE (~175 €/MWh) and AquaBuoy shows the highest LCOE (483.4 €/MWh) for the installed capacity of 20 MW.
Table 8.
Mean values LCOE for the different WECs, for the historical simulation.
Table 9.
Mean values LCOE for the different WECs, for the future simulation.
The classification of technologies is mainly controlled by their energy performance (capacity factor) rather than CapEx alone, demonstrating the dominant influence of site-device interaction on economic performance. The higher the capacity factor the lower the LCOE. When comparing historical and future climate conditions, projected changes in wave resource slightly increase LCOE for most WECs, indicating reduced energy production, except for the Oceantec device, suggesting greater resilience to projected spectral shifts.
6. Discussion
The results confirm that the Azores region is characterized by a highly energetic wave climate, dominated by swell conditions. The joint distributions of significant wave height (Hs) and energy period (Te) indicate that the most frequent sea states correspond to intermediate Hs values (2–4 m) paired with relatively long periods (9–14 s), which are typical of North Atlantic swell-dominated regimes. This reinforces the role of the Azores as a transition zone between locally generated wind seas and remotely generated swell, as reported in previous studies [31]. This dual influence has important implications for wave energy exploitation, as it results in a relatively stable and energetic resource with a broad spectral distribution.
The offshore wave energy levels obtained (typically ranging between 30 and 40 kW/m), are comparable to other North Atlantic regions such as the western Iberian [32] margin and western Brittany [14], confirming the suitability of the region for wave energy exploitation. However, the spatial variability observed around the islands highlights the importance of local effects, such as wave shadowing and bathymetric influence, which can significantly affect energy availability at specific location. Moreover, [10] estimated offshore wave power levels of approximately 35–40 kW/m over the Basque continental shelf. While [16] reported wave power values reaching 45–50 kW/m along the Galician coast.
The calculated capacity factors and electric power production obtained for the analyzed WECs are consistent with comparative multi-device assessments performed across European Atlantic environments [33]. The higher performance achieved by Wavestar and Atargis in the present study reflects a favorable interaction between device characteristics and the local wave climate, while the lower outputs obtained for AquaBuoy and Oceantec are consistent with previously reported behavior.
The combined analysis of electric power production (Pe), capacity factor (CF), and wave energy conversion efficiency (ε) provides a comprehensive assessment of WEC performance across the studied locations. Efficiency results are consistent with existing literature. An assessment of wave energy conversion efficiency near European islands [32], including the Azores, showed that efficiency indicators such as normalized electric power, capture width, and capacity factors vary significantly with both device type and site conditions.
The comparative performance of the analyzed WECs demonstrates that energy production is strongly governed by the interaction between device characteristics and the local wave climate. Devices such as Wavestar and Atargis achieve higher capacity factors and energy output, while AquaBuoy and Oceantec show lower performance levels.
From the mechanical point of view, these differences can be established by explicitly relating device dynamics to the local wave spectrum. The Azores wave climate is characterized by a predominance of long-period swell (9–14 s), which directly influences the response of different WEC technologies. Point absorber systems such as AquaBuoy rely on resonance in heave motion and achieve optimal performance when their natural frequency aligns with the dominant wave period. However, in a broad-banded wave spectrum, such as that observed in the region, resonance conditions are not consistently satisfied, resulting in lower overall efficiency. In contrast, multi-body systems such as Wavestar can interact with a wider range of wave frequencies due to the distributed response of multiple floats, allowing more stable energy capture across varying sea states. Similarly, the Atargis device, operating below the free surface, extracts energy from pressure variations and is less sensitive to surface irregularities, which contributes to its relatively stable performance under swell-dominated conditions. The Oceantec device, based on rotational or inertial response, depends on pitch excitation and is therefore sensitive to specific combinations of wave period and spectral distribution, which can limit its efficiency under irregular wave conditions. These results demonstrate that device performance is fundamentally controlled by the degree of alignment between device dynamics and the local wave spectrum, highlighting that spectral compatibility is a key factor in wave energy conversion efficiency.
Future projections indicate moderate reductions in electric power production and capacity factors across the analyzed locations. These changes are not uniform, exhibiting clear spatial variability, which highlights the importance of site-specific assessments when evaluating future deployment scenarios. Despite these reductions, the overall wave energy resource remains sufficiently high, suggesting that climate change is unlikely to significantly compromise the feasibility of wave energy exploitation in the Azores in the near future. The persistence of energetic conditions, combined with relatively limited simulations in the wave climate, supports the long-term potential of the region for wave energy applications. This is consistent with previous studies showing that climate-driven changes in wave conditions tend to have a limited but non-negligible impact on WEC performance [15,17].
The analysis of the 95th percentile of wave energy flux further indicates that extreme conditions remain significant across both present and future scenarios. The spatial distribution of high energy events remains largely unchanged, suggesting that extreme wave loads will continue to be a key design constraint for WEC deployment. This highlights that survivability considerations may be more strongly influenced by extreme events than by changes in mean wave energy.
It is important to note that the power estimation in this study is based on device-specific power matrices, which represent the operational behavior of each WEC within its design range. These matrices inherently include operational limits, such as rated power and cut-off thresholds, beyond which power production is reduced or set to zero to reflect shutdown or protection mechanisms under high sea states. Therefore, extreme conditions are partially accounted for in the results through these operational constraints. However, the present analysis does not explicitly model structural loads, failure mechanisms, or detailed survival strategies. As such, the results should be interpreted as representative of operational performance within design limits, rather than as a comprehensive assessment of structural survivability.
From an economic perspective, the LCOE results demonstrate that cost performance is strongly dependent on energy production. Devices with higher capacity factors, such as Wavestar and Atargis, achieve significantly lower LCOE values despite higher investment costs in some cases. This reinforces the importance of hydrodynamic efficiency and effective resource utilization in determining economic viability. Additionally, the observed decrease in LCOE with increasing installed capacity highlights the role of economies of scale in improving the competitiveness of wave energy technologies.
Despite the insights provided, several limitations should be acknowledged. The economic assessment is based on generalized CapEx and OpEx values, which may not fully capture the additional costs associated with remote regions such as the Azores, particularly in terms of logistics, installation, and maintenance. The estimation of Annual Energy Production relies on power matrices and wave climate distributions, without incorporating advanced control strategies that could enhance device performance. Furthermore, the LCOE formulation assumes simplified cost structures and constant annual energy production. The analysis also does not explicitly account for array effects, hydrodynamic interactions between devices, or detailed structural response under extreme wave conditions. In addition, the use of a single climate model and emission scenario limits the robustness of the projections, as it does not capture the full range of uncertainties associated with model selection and scenario variability. Although the adopted approach provides a consistent and physically based assessment, the results should be interpreted as indicative and comparative rather than as a detailed site-specific design or deployment study. This is consistent with previous studies indicating that climate model selection represents one of the main sources of uncertainty in wave climate projections [7,34]. Multi-model ensemble approaches based on CMIP simulations highlight the importance of incorporating a range of climate forcings to improve robustness. However, the Azores region remains poorly covered by existing regional climate initiatives, as it lies outside the standard CORDEX domains, which limits the availability of high-resolution, dynamically downscaled multi-model datasets. Consequently, most available studies are restricted to basin-scale analyses over the North Atlantic, which do not adequately resolve local processes that are critical for wave energy assessments. Therefore, while the present results provide a consistent and physically based projection of future wave energy conditions, they should be interpreted within the context of scenario-dependent uncertainty, and not as a unique or deterministic representation of future conditions, highlighting the need for future multi-model and multi-scenario approaches.
7. Conclusions
The Azores archipelago is particularly sensitive to changes in wind patterns, wave regimes, and extreme weather events. However, global climate models generally lack the spatial resolution required to accurately represent the complex wind fields and wave dynamics around the islands. Therefore, downscaled projections are necessary to properly quantify variations in extreme wave heights, storm impacts, and resource availability, allowing the development of robust design criteria for ports, marine infrastructure, and wave energy converters. This study assessed the wave energy potential of the Azores under present (1990–2019) and future (2030–2059) climate conditions, combining wave resource characterization with the performance and economic evaluation of different wave energy converters. Given the complex wind and wave dynamics of the region, the use of dynamically downscaled climate projections is essential to adequately represent local conditions and support reliable assessments.
The results confirm that the Azores is a high-energy, swell-dominated region, with wave conditions comparable to other energetic North Atlantic regions. Future projections indicate moderate changes in the wave climate, with slight reductions in wave energy at some locations and marked spatial variability. However, these changes are not expected to significantly compromise the overall wave energy potential of the region.
The analysis of extreme wave conditions indicates that high-energy events remain a key feature of the regional wave climate under both present and future scenarios. This suggests that design constraints and survivability considerations for WEC deployment are likely to be governed more by extreme conditions than by changes in mean wave energy.
A key outcome of this study is that WEC performance is primarily governed by the interaction between device characteristics and local wave climate. Devices such as Wavestar and Atargis show superior performance due to better adaptation to the prevailing swell-dominated regime, whereas AquaBuoy and Oceantec show lower energy production. These results highlight that device–site matching, driven by spectral compatibility, is a critical factor in determining overall performance.
From an economic perspective, the results demonstrate that the LCOE is strongly influenced by energy production rather than CapEx alone. Devices with higher capacity factors achieve significantly lower LCOE values, reinforcing the importance of hydrodynamic efficiency and effective resource utilization. In addition, the observed influence of installed capacity on LCOE highlights the role of economies of scale in improving the competitiveness of wave energy technologies.
Overall, the results highlight that optimal WEC selection in the Azores cannot be based on a single indicator. Instead, a combined evaluation of energy production, capacity factor, and conversion efficiency is required, together with a detailed understanding of local wave conditions and their temporal variability.
Despite these insights, the results should be interpreted as indicative rather than definitive. The analysis is based on generalized economic assumptions and does not explicitly account for advanced control strategies, array effects, or structural response under extreme conditions. Furthermore, the use of a single climate model and emission scenario limits the ability to fully capture uncertainty in future projections. Future work should address these aspects through multi-model approaches, multi-scenario ensembles and more detailed techno-economic modeling to support robust, site-specific deployment strategies, to increase confidence in predictive applications.
Author Contributions
Writing, M.G.; methodology, M.B. and M.G.; formal analysis, M.G. and M.B.; validation M.G.; resources M.B. and M.G.; supervision and project administration, C.G.S.; writing—review and editing, C.G.S. and M.B. All authors have read and agreed to the published version of the manuscript.
Funding
The work contributes to the Strategic Research Plan of the Centre for Marine Technology and Ocean Engineering, financed by the Portuguese Foundation for Science and Technology (Fundação para a Ciência e Tecnologia-FCT) under contract UID/00134/2025 (DOI: https://doi.org/10.54499/UID/00134/2025).
Data Availability Statement
The original contributions presented in this study are included in the article.
Conflicts of Interest
The authors declare no conflicts of interest.
Appendix A
Table A1.
Oceantec power matrix [30].
Table A2.
AquaBuoy power matrix [30].
Table A3.
Wavestar power matrix [35].
Table A4.
Atargis power matrix [17].
References
- Pontes, M.T. Assessing the European Wave Energy Resource. J. Offshore Mech. Arct. Eng. 1998, 120, 226–231. [Google Scholar] [CrossRef] [Scilit]
- Arinaga, R.A.; Cheung, K.F. Atlas of Global Wave Energy from 10 Years of Reanalysis and Hindcast Data. Renew. Energy 2012, 39, 49–64. [Google Scholar] [CrossRef] [Scilit]
- Gunn, K.; Stock-Williams, C. Quantifying the Global Wave Power Resource. Renew. Energy 2012, 44, 296–304. [Google Scholar] [CrossRef] [Scilit]
- Reguero, B.G.; Losada, I.J.; Méndez, F.J. A Global Wave Power Resource and Its Seasonal, Interannual and Long-Term Variability. Appl. Energy 2015, 148, 366–380. [Google Scholar] [CrossRef] [Scilit]
- van Vuuren, D.P.; Edmonds, J.; Kainuma, M.; Riahi, K.; Thomson, A.; Hibbard, K.; Hurtt, G.C.; Kram, T.; Krey, V.; Lamarque, J.F.; et al. The Representative Concentration Pathways: An Overview. Clim. Change 2011, 109, 5–31. [Google Scholar] [CrossRef] [Scilit]
- Rusu, L. Evaluation of the near Future Wave Energy Resources in the Black Sea under Two Climate Scenarios. Renew. Energy 2019, 142, 137–146. [Google Scholar] [CrossRef] [Scilit]
- Morim, J.; Hemer, M.; Wang, X.; Cartwright, N.; Trenham, C.; Semedo, A.; Young, I.; Bricheno, L.; Camus, P.; Casas-Prat, M.; et al. Robustness and Uncertainties in Global Multivariate Wind-Wave Climate Projections. Nat. Clim. Change 2019, 9, 711–718. [Google Scholar] [CrossRef] [Scilit]
- Bernardino, M.; Gonçalves, M.; Guedes Soares, C. Marine Climate Projections toward the End of the Twenty-First Century in the North Atlantic. J. Offshore Mech. Arct. Eng. 2021, 143, 061201. [Google Scholar] [CrossRef] [Scilit]
- Bernardino, M.; Gonçalves, M.; Campos, R.M.; Guedes Soares, C. Extremes and Variability of Wind and Waves across the Oceans until the End of the 21st Century. Ocean Eng. 2023, 275, 114081. [Google Scholar] [CrossRef] [Scilit]
- Galparsoro, I.; Liria, P.; Legorburu, I.; Bald, J.; Chust, G.; Ruiz-Minguela, P.; Pérez, G.; Marqués, J.; Torre-Enciso, Y.; González, M.; et al. A Marine Spatial Planning Approach to Select Suitable Areas for Installing Wave Energy Converters (WECs), on the Basque Continental Shelf (Bay of Biscay). Coast. Manag. 2012, 40, 1–19. [Google Scholar] [CrossRef] [Scilit]
- Bozzi, S.; Besio, G.; Passoni, G. Wave Power Technologies for the Mediterranean Offshore: Scaling and Performance Analysis. Coast. Eng. 2018, 136, 130–146. [Google Scholar] [CrossRef] [Scilit]
- Majidi, A.G.; Ramos, V.; Giannini, G.; Rosa Santos, P.; das Neves, L.; Taveira-Pinto, F. The Impact of Climate Change on the Wave Energy Resource Potential of the Atlantic Coast of Iberian Peninsula. Ocean Eng. 2023, 284, 115451. [Google Scholar] [CrossRef] [Scilit]
- Rusu, L. The near Future Expected Wave Power in the Coastal Environment of the Iberian Peninsula. Renew. Energy 2022, 195, 657–669. [Google Scholar] [CrossRef] [Scilit]
- Guillou, N.; Chapalain, G. Annual and Seasonal Variabilities in the Performances of Wave Energy Converters. Energy 2018, 165, 812–823. [Google Scholar] [CrossRef] [Scilit]
- Ribeiro, A.S.; deCastro, M.; Costoya, X.; Rusu, L.; Dias, J.M.; Gomez-Gesteira, M. A Delphi Method to Classify Wave Energy Resource for the 21st Century: Application to the NW Iberian Peninsula. Energy 2021, 235, 121396. [Google Scholar] [CrossRef] [Scilit]
- Arguilé-Pérez, B.; Ribeiro, A.S.; Costoya, X.; de Castro, M.; Carracedo, P.; Dias, J.M.; Rusu, L.; Gómez-Gesteira, M. Harnessing of Different WECs to Harvest Wave Energy along the Galician Coast (NW Spain). J. Mar. Sci. Eng. 2022, 10, 719. [Google Scholar] [CrossRef] [Scilit]
- Arguilé-Pérez, B.; Ribeiro, A.S.; Costoya, X.; deCastro, M.; Gómez-Gesteira, M. Suitability of Wave Energy Converters in Northwestern Spain under the near Future Winter Wave Climate. Energy 2023, 278, 127957. [Google Scholar] [CrossRef] [Scilit]
- Lavidas, G.; Blok, K. Shifting Wave Energy Perceptions: The Case for Wave Energy Converter (WEC) Feasibility at Milder Resources. Renew. Energy 2021, 170, 1143–1155. [Google Scholar] [CrossRef] [Scilit]
- Guo, C.; Sheng, W.; De Silva, D.G.; Aggidis, G. A Review of the Levelized Cost of Wave Energy Based on a Techno-Economic Model. Energies 2023, 16, 2144. [Google Scholar] [CrossRef] [Scilit]
- WW3DG. The WAVEWATCH III R; MMAB: College Park, MD, USA, 2016.
- Hazeleger, W.; Severijns, C.; Semmler, T.; Ştefǎnescu, S.; Yang, S.; Wang, X.; Wyser, K.; Dutra, E.; Baldasano, J.M.; Bintanja, R.; et al. EC-Earth: A Seamless Earth-System Prediction Approach in Action. Bull. Am. Meteorol. Soc. 2010, 91, 1357–1363. [Google Scholar] [CrossRef] [Scilit]
- Skamarock, W.C.; Klemp, J.B.; Dudhia, J.; Gill, D.O.; Liu, Z.; Berner, J.; Wang, W.; Powers, J.G.; Duda, M.G.; Barker, D.M.; et al. A Description of the Advanced Research WRF Model Version 4; UCAR: Boulder, CO, USA; NCAR: Boulder, CO, USA, 2019.
- Chawla, A.; Tolman, H.L. Automated Grid Generation for WAVEWATCH III; NOAA: Washington, DC, USA, 2007.
- Gonçalves, M.; Bernardo, C.; Bernardino, M.; Guedes Soares, C. Climate Change Impacts on the Wave Energy in the Azores Islands. In Trends in Renewable Energies Offshore; CRC Press: London, UK, 2022; pp. 43–51. [Google Scholar]
- Gonçalves, M.; Bernardino, M.; Guedes Soares, C. Assessing Climate Change in the Azores Area in the near Future. In Advances in Maritime Technology and Engineering; CRC Press: London, UK, 2024; pp. 635–641. [Google Scholar]
- Ramos, S.; Gonçalves, M.; Guedes Soares, C. A Method for Identifying Compatible Locations for Wave Energy Exploration with Different WECS. In Proceedings of the International Conference on Offshore Mechanics and Arctic Engineering-OMAE; American Society of Mechanical Engineers (ASME): New York, NY, USA, 2021; Volume 5. [Google Scholar]
- Xie, J.; Zuo, L. Dynamics and Control of Ocean Wave Energy Converters. Int. J. Dyn. Control 2013, 1, 262–276. [Google Scholar] [CrossRef] [Scilit]
- Ghafari, H.R.; Ghassemi, H.; He, G. Numerical Study of the Wavestar Wave Energy Converter with Multi-Point-Absorber around DeepCwind Semisubmersible Floating Platform. Ocean Eng. 2021, 232, 109177. [Google Scholar] [CrossRef] [Scilit]
- Diaz-Maya, M.; Ulloa, M.; Silva, R. Assessing Wave Energy Converters in the Gulf of Mexico Using a Multi-Criteria Approach. Front. Energy Res. 2022, 10, 929625. [Google Scholar] [CrossRef] [Scilit]
- Majidi, A.G.; Ramos, V.; Rosa-Santos, P.; das Neves, L.; Taveira-Pinto, F. Power Production Assessment of Wave Energy Converters in Mainland Portugal. Renew. Energy 2025, 243, 122540. [Google Scholar] [CrossRef] [Scilit]
- Gleizon, P.; Campuzano, F.; Carracedo, P.; Martinez, A.; Goggins, J.; Atan, R.; Nash, S. Wave Energy Resources Along the European Atlantic Coast. In Marine Renewable Energy; Springer International Publishing: Cham, Switzerland, 2017; pp. 37–69. [Google Scholar]
- Rusu, L.; Onea, F. Assessment of the Performances of Various Wave Energy Converters along the European Continental Coasts. Energy 2015, 82, 889–904. [Google Scholar] [CrossRef] [Scilit]
- Monteiro, N.M.R.; Oliveira, T.C.A.; Silva, P.A.; Abdolali, A. Wind–Wave Characterization and Modeling in the Azores Archipelago. Ocean Eng. 2022, 263, 112395. [Google Scholar] [CrossRef] [Scilit]
- Hemer, M.A.; Fan, Y.; Mori, N.; Semedo, A.; Wang, X.L. Projected Changes in Wave Climate from a Multi-Model Ensemble. Nat. Clim. Change 2013, 3, 471–476. [Google Scholar] [CrossRef] [Scilit]
- Marquis, L.; Kramer, M.M.; Kringelum, J.; Chozas, J.F.; Helstrup, N.E. Introduction of Wavestar Wave Energy Converters at the Danish Offshore Wind Power Plant Horns Rev 2. In Proceedings of the International Conference on Ocean Energy (ICOE), Dublin, Ireland, 17–19 October 2012. [Google Scholar]

Disclaimer/Publisher’s Note: The statements, opinions and data contained in all publications are solely those of the individual author(s) and contributor(s) and not of MDPI and/or the editor(s). MDPI and/or the editor(s) disclaim responsibility for any injury to people or property resulting from any ideas, methods, instructions or products referred to in the content. |
© 2026 by the authors. Licensee MDPI, Basel, Switzerland. This article is an open access article distributed under the terms and conditions of the Creative Commons Attribution (CC BY) license.