


Abstract
Island microgrids are highly vulnerable to extreme weather, which threatens operational stability and post-disaster recovery. To address the challenge of widespread power outages caused by typhoons, a novel coordinated framework is proposed which optimizes electric ships as mobile power sources to enhance island microgrid resilience. By integrating a hybrid wind field model with an improved wind-resistant A* algorithm, the framework synergistically optimizes dynamic scenario-aware ship routing and distribution network reconfiguration. The problem is formulated as a mixed-integer second-order cone programming (MISOCP) model. Case studies based on real-world data from Hengsha Island, Shanghai, demonstrate that the proposed dynamic routing strategy significantly outperforms static approaches. Specifically, critical load recovery rates are improved by at least 29% during the navigation-restricted phase and total load curtailment costs are reduced by 31.6%. These findings reveal this significance of integrating spatiotemporal environmental dynamics into optimization frameworks, providing a robust decision-making tool for island grid operators to maintain power supply to critical loads under evolving disaster conditions.
1. Introduction
1.1. Background and Motivation
Owing to their single connection to a public power grid, remote islands typically have fragile infrastructures, making them highly susceptible to prolonged outages during extreme weather events. Catastrophic natural disasters have underscored this vulnerability. For example, Typhoon Rai in 2021 destroyed 92.7% of the power grid and stopped transport electrification infrastructure for 48 h in Eastern Visayas, Philippines, thereby decreasing effective emergency response rates to below 40% during the critical 72 h post-disaster window [1]. In 2024, Typhoon Capricorn crippled 500 power feeders across Haikou’s urban grid, triggering electricity restoration delays of over 72 h in coastal communities [2]. Further demonstrating this escalating threat, the successive strikes of Super Typhoon Haiou and Typhoon Fenghuang in 2025 caused a complete blackout across 156 municipalities in 12 major affected regions of the Philippines, including Southern Luzon and the Visayas, severely disrupting critical infrastructure and emergency response systems [3]. These disasters have created an urgent need to increase the resilience of island distribution networks to accelerate restoration and minimize load loss.
Shipboard power systems, which act as mobile power resources, have emerged as a critical solution to mitigate outages of island microgrids because of their operational flexibility and rapid response ability [4]. However, unlike terrestrial transportation electrification systems, geographical constraints increase the difficulty of enhancing the resilience of island microgrids [5]; in addition, navigable areas for vessels fluctuate with typhoon trajectories, and dynamic wind variations can affect ship routing [6]. Furthermore, the unpredictable arrival times of ships introduce additional uncertainty into the scheduling and dispatch of resources, which poses a critical challenge for optimization strategies regarding improvements in the resilience of island microgrids in disasters. Consequently, this study conceptualizes the shipboard power system as a proactive mobile microgrid, focusing on the dynamic interaction between its maritime mobility and the island’s energy demand under evolving disaster conditions.
1.2. Literature Review
Power system resilience reflects the ability of a system to withstand extreme events and recover from outages [7]. For microgrids, resilience enhancement approaches are typically divided into pre-disaster preparedness [8,9,10,11,12,13,14,15] and post-disaster recovery strategies [16,17,18,19,20,21,22].
During the pre-disaster phase, two primary research directions prevail. The first direction is focused on modeling potential disaster scenarios and reinforcing critical infrastructure in vulnerable regions, enabling the proactive identification of high-risk components [8]. In Refs. [9,10], the authors proposed a two-stage stochastic framework to increase transmission system resilience through typhoon path simulation and targeted hardening strategies. In Ref. [11], a risk-averse pre-disaster allocation model was developed for proactive resource allocation to minimize the expected damage level and restoration costs. In Ref. [12], a Monte Carlo-based framework was developed to evaluate grid resilience and restoration costs under typhoon scenarios while considering increased levels of renewable energy. The second direction is focused on coordinating flexible resources to prepare microgrids for resilient operation [13]. In Ref. [14], an electric bus scheduling scheme with predetermined service routes was proposed to support grid restoration, enhancing mobile power supply reliability. In Ref. [15], a two-stage robust optimization framework was developed for the optimal placement and sizing of mobile energy storage units ahead of disasters.
Post-disaster recovery strategies prioritize rapid service restoration through optimized resource dispatch and network reconfiguration. Several studies have leveraged disaster forecasts and typhoon trajectory data to optimize repair crew routing and fault isolation [16,17]. A robust logistics framework was explored in Ref. [18] to manage uncertainties in the restoration process. In Ref. [19], an integrated approach combining pre-disaster storage planning and post-disaster repair sequencing was proposed, incorporating network reconfiguration and self-healing techniques. A switch-based active islanding strategy was developed in Ref. [20] to proactively isolate faults and restore services via remote-controlled switches. In Refs. [21,22], static switches were employed to enable peer-to-peer support among neighboring microgrids. Although these studies prioritized resilience enhancement for large-scale grids with dense infrastructure and extensive transportation networks, isolated island microgrids have rarely been investigated. Island communities that depend on mainland grid connections face substantial risks when natural disasters sever undersea or overhead cables, often resulting in long-lasting outages [23]. The geographic isolation and limited spatial footprint severely restrict the availability of traditional backup generation and delay the arrival of external repair crews and logistics support, making restoration inherently challenging. Furthermore, many island systems rely heavily on local renewable energy resources, which, while sustainable, introduce low-inertia operation and high uncertainty, further complicating stable post-disaster recovery and demanding specialized enhancement schemes [24].
Regarding mobile power resource integration, recent studies have explored resilience enhancement schemes specifically tailored for island contexts. In Ref. [25], a real-time optimization framework based on deep reinforcement learning is proposed, which adheres to physical constraints while optimizing network loss, system resilience, and operational cost. In Ref. [26], grid enhancement strategies for island power systems, including the use of utility-scale solar farms to form renewable energy-based microgrids and grid hardening to resist extreme weather, were reviewed. In Ref. [27], a preventive control strategy was proposed to transition island microgrids from economic operation-based modes to resilience-oriented modes prior to disaster onset. In Ref. [28], a multi-stage recovery strategy was developed for multi-energy systems, emphasizing the coordination of diverse flexible resources to enhance restoration efficiency. To further improve the intelligence of resource deployment, a hierarchical multi-agent reinforcement learning approach was proposed in Ref. [29] for the dynamic dispatch of repair crews and mobile units within resilient microgrids.
The coordination and routing of mobile resources are central to power system restoration. In Refs. [30,31,32], the impact of road blockage and traffic congestion on the dispatch planning of repair crews and electric vehicles was explicitly addressed; however, these studies primarily relied on standard routing techniques within static or pre-defined terrestrial networks. While Ref. [33] explored shipping route optimization to enhance port resilience based on network characteristics, the coupling between real-time maritime environmental physics and energy dispatch remained unaddressed. Recent progress in Ref. [34] has introduced intelligent ship route planning via an A*-guided search model to optimize navigation under weather conditions and carbon emission constraints. Nevertheless, previous maritime research focuses on navigation efficiency or safety in general sea states, failing to capture the time-varying constraints and safety boundaries specifically imposed by evolving typhoon wind fields during grid recovery. Consequently, there is a critical need for an adaptive path-planning mechanism that can synchronize vessel navigation with the spatiotemporal uncertainty of island microgrid restoration requirements.
As summarized in Table 1, existing research primarily focuses on terrestrial mobile resources and general resilience strategies, with limited exploration of maritime-specific navigation physics and dynamic environmental couplings tailored for island microgrids.
Table 1.
Summary of representative research.
Despite these advances, existing research still presents significant limitations when addressing the unique challenges of island systems, particularly in coordinated post-disaster recovery. The main difference between this study and previous research lies in the shift from terrestrial road-based dispatch to maritime-specific navigation physics. Specifically, existing strategies often overlook the fact that shipboard mobility is governed by dynamic maritime constraints, which act as the primary determinants of resource availability. Furthermore, the conventional reliance on static routing or fixed dispatch sequences fails to integrate time-varying environmental dynamics, leading to a decoupling of environmental models from grid operation. To bridge these gaps, the main aim of this study is to make use of shipboard power systems as a spatiotemporally constrained energy resource, achieving an optimization between maritime navigation and island microgrid resilience.
1.3. Contributions and Organization
To address these challenges, a dynamic wind field model is proposed to capture the temporal changes in wind speed, direction, and electric ship navigation constraints. On this basis, a new optimization framework is developed for the coordinated scheduling of electric ship dispatch and distributed resource dispatch. The key contributions of this study are summarized as follows:
- A hybrid typhoon wind field model integrating Batts and Holland models is developed to characterize spatiotemporal wind evolution. Unlike traditional static routing, this model is directly coupled with an improved A* algorithm to translate real-time wind vectors into dynamic speed-loss and heading constraints, enabling the generation of adaptive paths that prioritize both navigation safety and arrival punctuality.
- This study pioneers the conceptualization of electric ships as specialized mobile resilience assets for island microgrids. By coupling energy states with kinematic variables under time-varying wind resistance, the framework explicitly captures the ship’s spatiotemporal availability, providing a novel solution for island microgrid resilience under extreme weather.
- A holistic framework is proposed to co-optimize vessel prepositioning and multi-stage scheduling based on the progressive evolution of the typhoon field. By formulating the problem as a mixed-integer second-order cone programming (MISOCP) model, the framework achieves a scenario-aware synergy between shipboard energy management and terrestrial grid restoration, effectively capturing the complex interactions between maritime environmental dynamics and power system resilience requirements. The efficiency of the proposed algorithm is verified by case studies on Hengsha Island, Shanghai, China.
The remainder of this work is organized as follows. Section 2 presents the problem statement and models for island microgrids. Section 3 formulates the coordinated scheduling problem. Section 4 introduces the proposed hybrid optimization method. Section 5 presents a discussion of the simulation results and an evaluation of the performance levels under multiple disaster scenarios. Section 6 presents the conclusion.
2. Problem Description and Mathematical Formulation
2.1. Problem Description
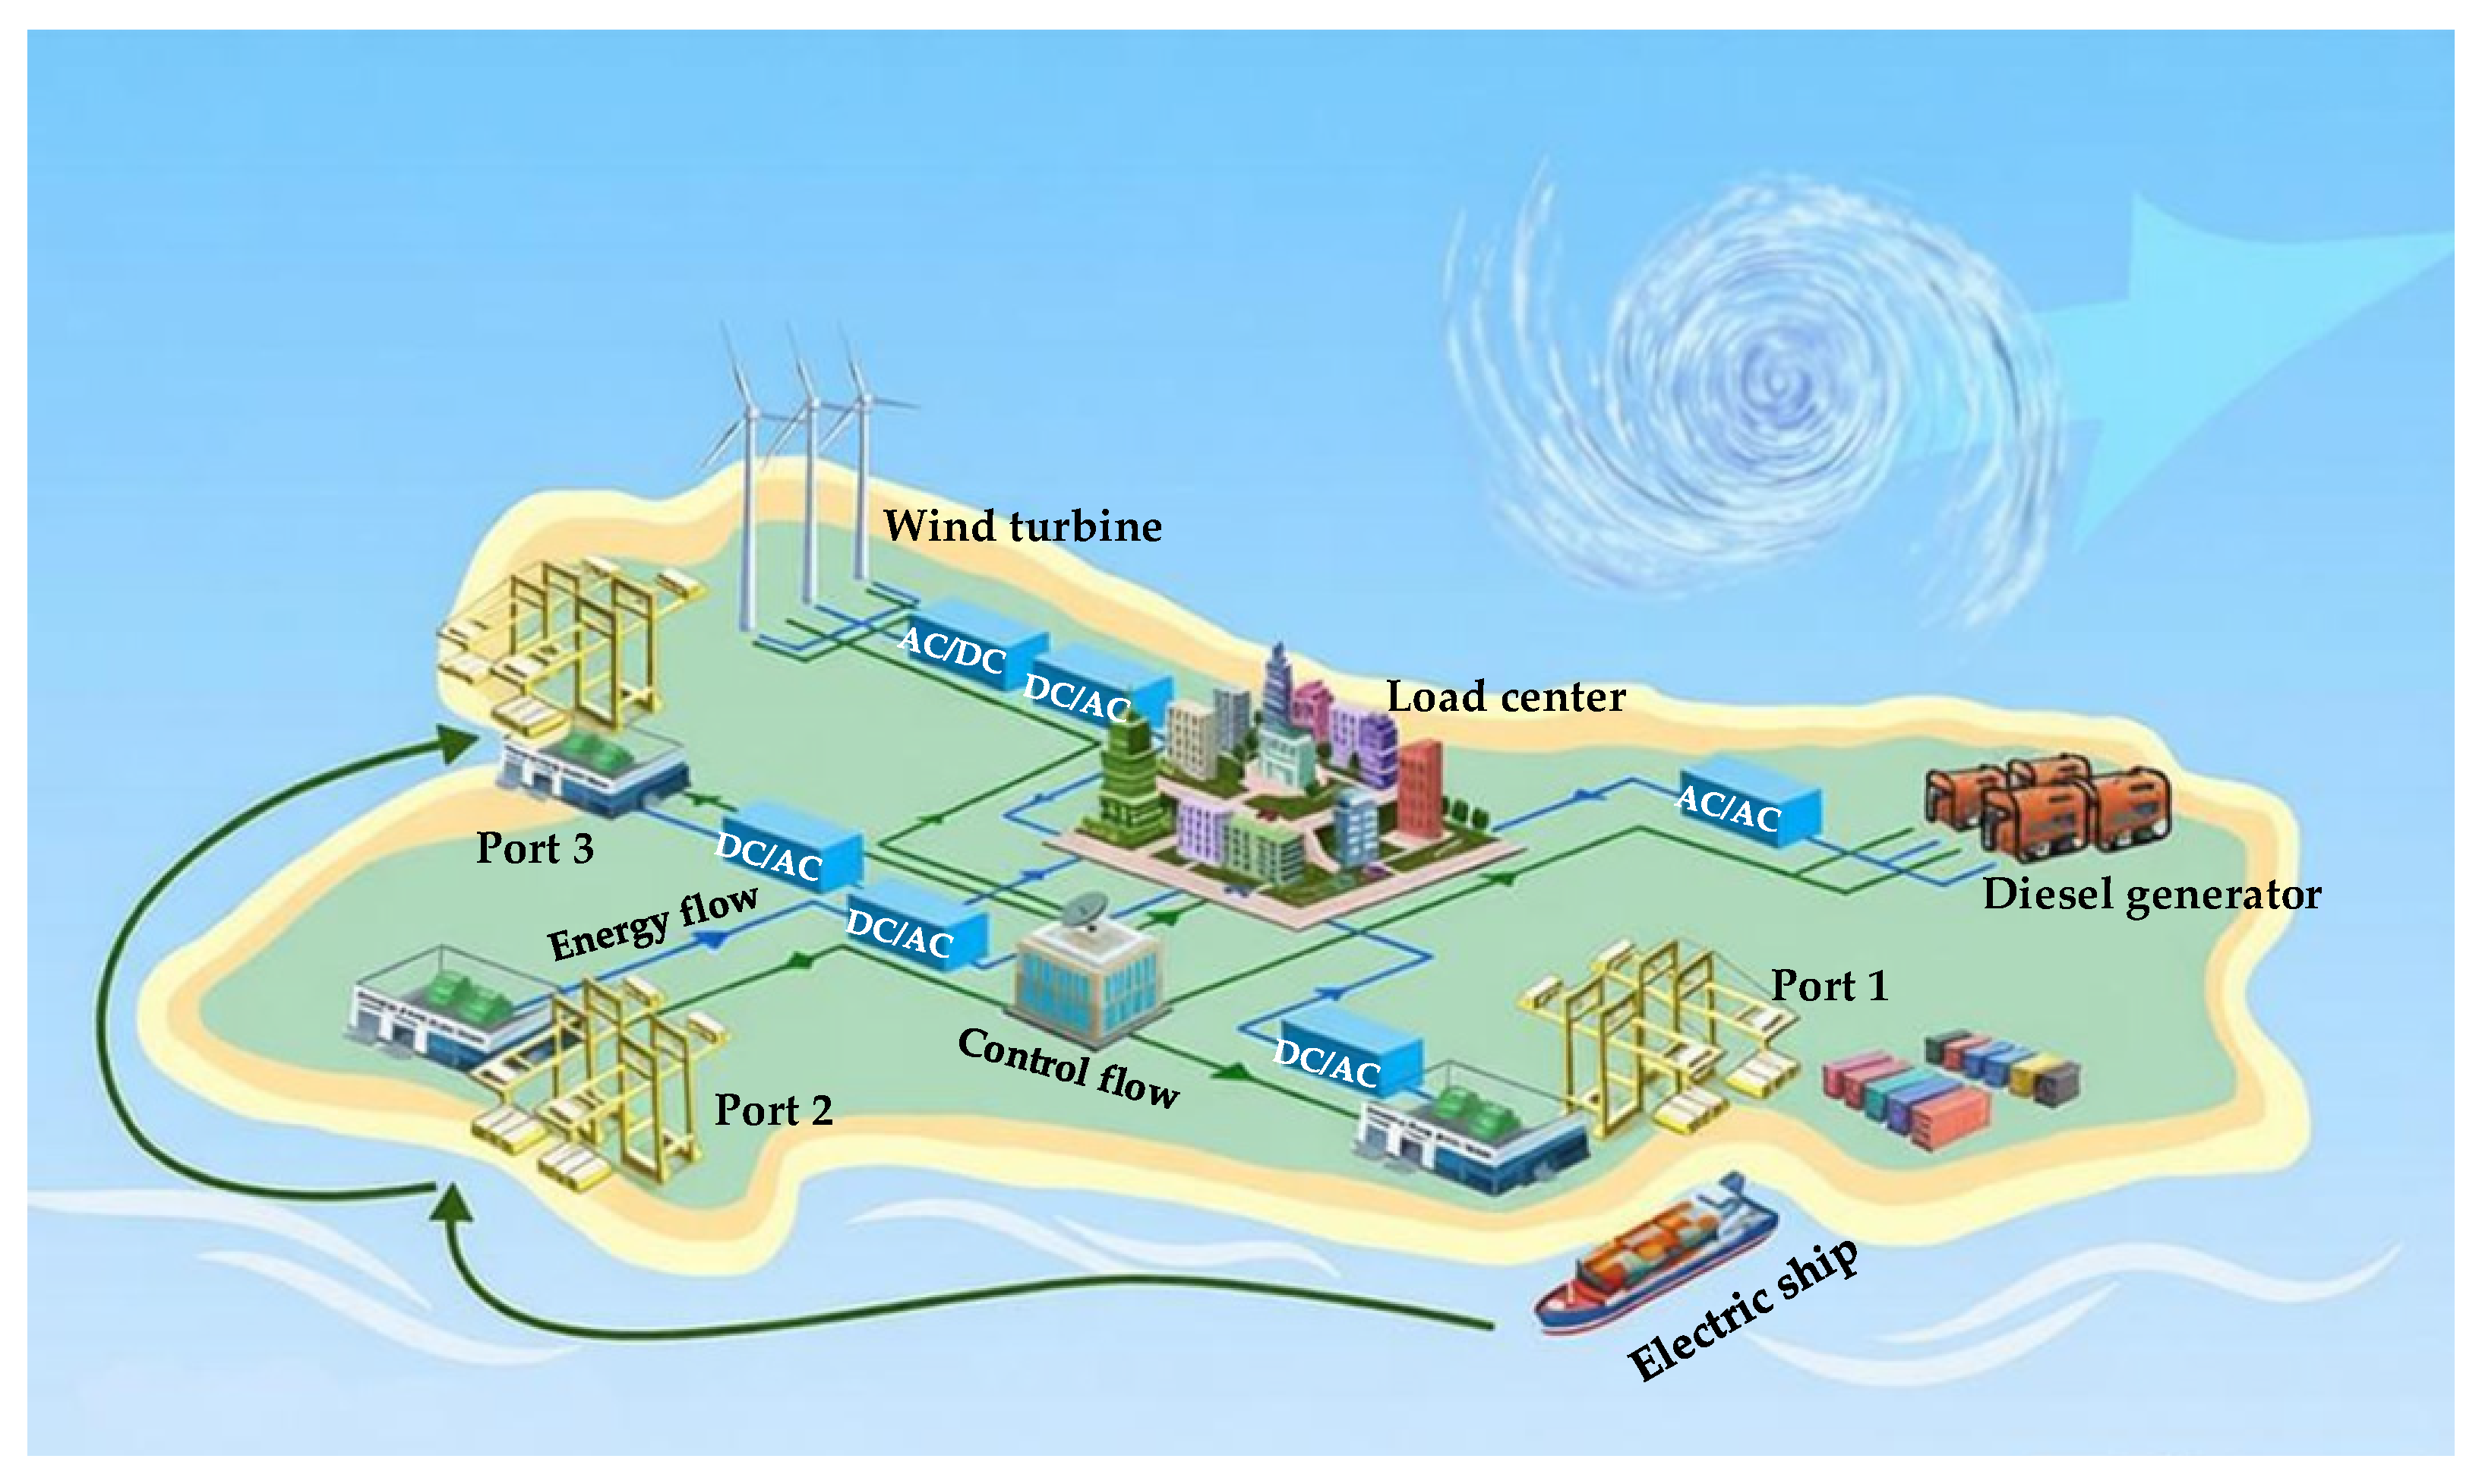
This study addresses the strategic coordination of electric ship routing and distributed energy resource scheduling in island microgrids. Unlike conventional land-based power systems with stationary infrastructure, ship-based power dispatch during typhoon events encounters dynamic environmental disruptions and highly decentralized load demands. As illustrated in Figure 1, evolving wind fields lead to continuous fluctuations in vessel speed and direction, introducing uncertainty in ship arrival times and sequences at island nodes. These variations directly affect the spatiotemporal characteristics of energy support, thereby necessitating adaptive and resilient dispatch strategies. Accordingly, a refined modeling framework is essential for capturing the coupled dynamics of wind evolution, ship navigation, and microgrid operation characteristics.
Figure 1.
Electric ship dispatch for island microgrid resilience.
2.2. The Impact of Dynamic Wind Field
2.2.1. Wind Field Model
Typhoons exhibit smooth trajectories with belt-shaped wind fields, which are typically associated with severe convective weather. Vessels are assumed to navigate safely under Beaufort scale level 12 typhoon conditions. Areas experiencing winds exceeding level 12 are designated as no-sail zones, prohibiting vessel dispatch until the typhoon leaves the affected waters.
An enhanced Batts wind field model is adopted, integrating the wind field formulation and storm decay dynamics. Wind characteristics at any location are computed on the basis of the central position of the typhoon, facilitating microgrid component failure analysis and evaluating the impact of ship scheduling. The decay of the central pressure differential can be described as follows:
2.2.2. Modeling of the Transmission Line and Tower Failures
The failure risks of transmission lines and towers under typhoon-force winds are high. Failure probabilities are determined by segment-specific wind speeds. The network is discretized into nl transmission segments and nk towers. The failure probability for the i-th transmission segment at time t is as follows:
2.2.3. Ship Wind Resistance Model
In the actual operation of electric ships, the true ship speed is defined as the relative velocity between the vessel and the surrounding wind field [35]. To assess the impact of wind resistance, the ship speed is adjusted via the following equation:
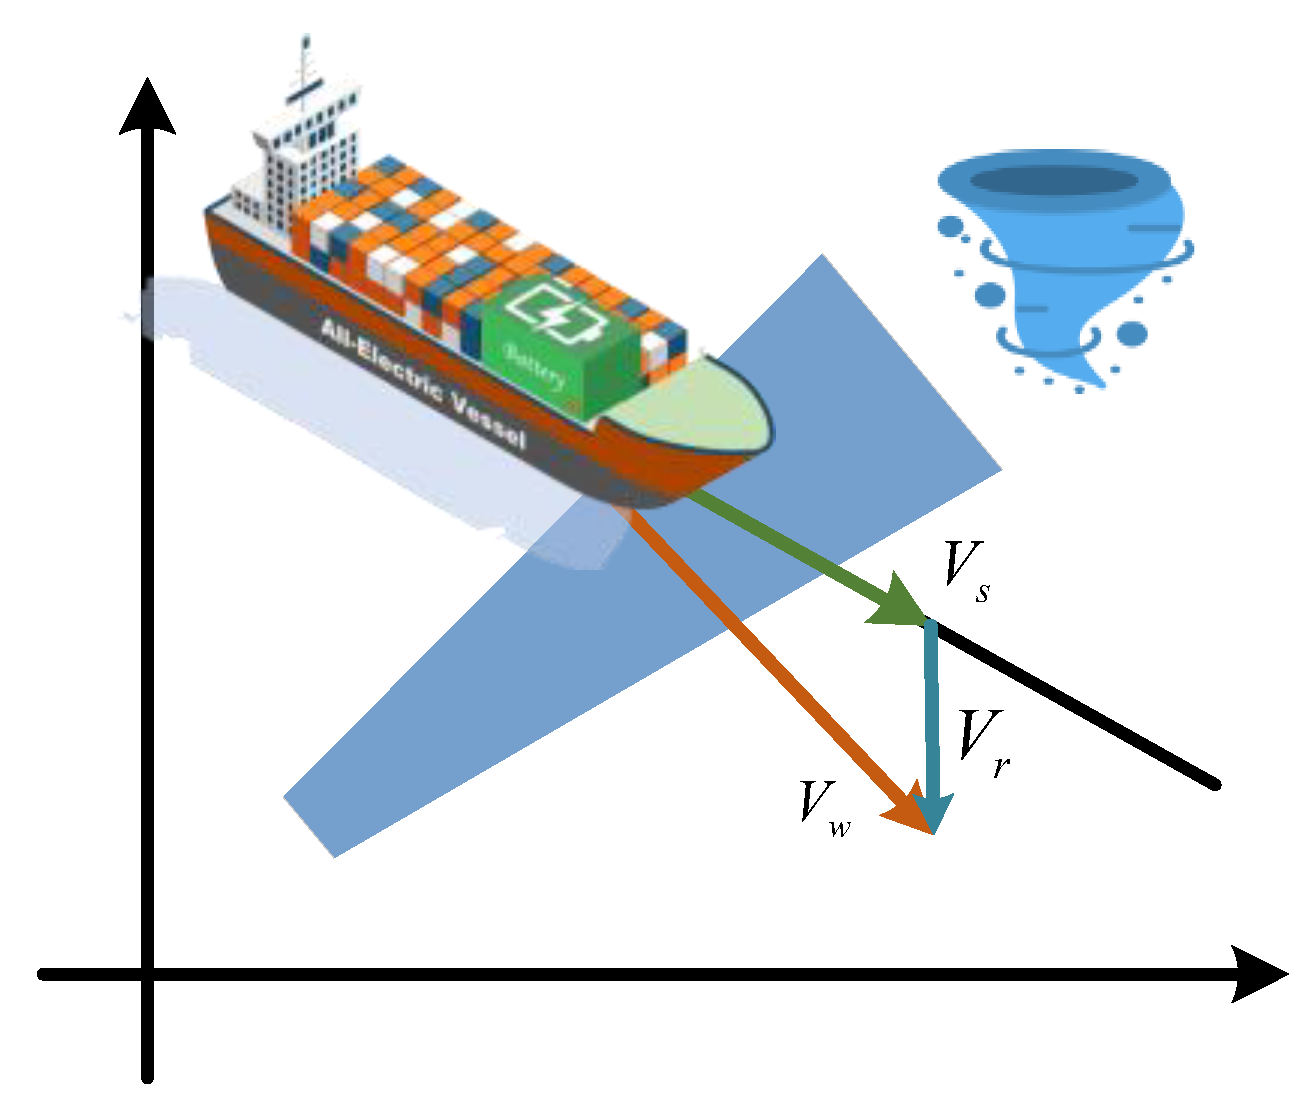
Notably, unlike fixed transportation networks on land, during typhoon events, both the ship arrival time and the path to the target node are dynamically influenced by the wind speed and direction, introducing significant uncertainty into the ship movement process. The effect of the wind field on the ship’s speed, as illustrated in Figure 2, highlights the model’s alignment with real-world conditions, thereby enhancing its applicability in practical maritime operations.
Figure 2.
Schematic of real ship speed calculations. Arrows denote wind speed vectors and the black solid line represents the ship’s navigation trajectory.
2.3. Framework
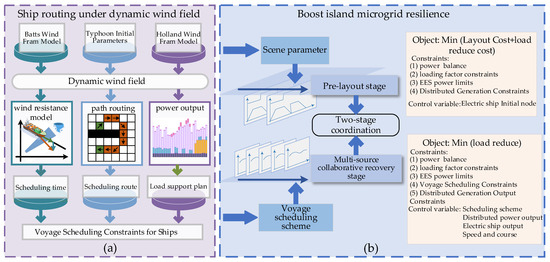
An integrated framework is proposed for enhancing island microgrid resilience through the synergistic optimization of electric ship dispatch and local energy resources. As illustrated in Figure 3, the framework is structured into two interconnected components. Figure 3a establishes the environment–navigation coupling layer: a dynamic typhoon scenario is first generated using hybrid Batts–Holland wind field models based on initial typhoon parameters. This spatiotemporal scenario drives three critical ship-specific modules: a wind resistance model that calculates the impact of wind speed and direction on vessel navigation, a path routing module that utilizes the A* algorithm to optimize trajectories while avoiding navigation-restricted zones, and a power output module that evaluates ship energy consumption and available support capacity. These modules collectively formulate the electric ship’s voyage scheduling constraints. Figure 3b defines the two-stage decision-making architecture: the typhoon scenarios are mapped to grid fault conditions to serve as inputs for the pre-layout stage, which determines the optimal initial positioning of the electric ship. Subsequently, during the multi-source collaborative recovery stage, the framework optimizes the scheduling scheme and real-time power dispatch of wind turbines, diesel generators, and the electric ship. By integrating these adaptive voyage constraints into a mixed-integer linear programming (MILP) model, the framework ensures coordinated power mutual assistance between isolated microgrids, thereby maximizing system resilience during extreme weather events.
Figure 3.
Framework for enhancing island microgrid resilience through ship scheduling integration: (a) ship voyage scheduling model; (b) two-stage multi-source coordinated post-disaster recovery model.
3. Problem Formulation
The resilience of island microgrids is quantified by their critical load restoration capability after a disaster. Following typhoon impacts, damaged lines are identified through meteorological data and microgrid line information. A novel two-stage coordination framework is proposed to optimize resource dispatch and electric ship scheduling, aiming to minimize weighted load curtailment under post-typhoon fault scenarios.
3.1. Pre-Disaster Layout
In the pre-disaster layout stage, a two-stage robust optimization model is developed to determine the optimal pre-positioning locations of the electric ship to minimize configuration costs and load curtailment costs. The first-stage decision variables include the connection status between the electric ship and microgrid nodes and the operational status of line switches. The second-stage decision variables encompass load curtailment levels, wind turbine power outputs, node voltage magnitudes, branch active/reactive power flows, and current magnitudes. The objective function is mathematically formulated as follows:
3.1.1. Distribution Network Radial Topology Constraints
To address island integration and power-deficient island scenarios, an enhanced single-commodity flow method is employed to ensure that the radial topology constraint is satisfied during the restoration process. A virtual node variable is introduced, which accounts for the number of islands after network reconfiguration, integrating it into the optimization process. Virtual power is relaxed via the big-M method, as shown below:
3.1.2. Distribution Network Operation Constraints
For radial distribution networks, the DistFlow power flow equations are employed. Since the network topology varies with the status of line switches, the big-M method is applied to relax the voltage equations. The system operation constraints are formulated as follows:
Equations (27) and (28) represent the active and reactive power balance constraints at the nodes of the island microgrid, respectively. Equations (29) and (30) define the node voltage constraints, where M denotes the slack variable introduced by the Big-M method. Equation (31) establishes the upper and lower bounds for the node voltage within the microgrid. Equations (32) and (33) impose constraints on the branch current and branch power flow, respectively, within the microgrid. To address the bilinear terms in Equation (27), a second-order cone relaxation method is employed, converting them into the second-order cone constraint expressed in Equation (34).
3.1.3. Load Shedding Constraints
Equations (35) and (36) describe the constraints on active and reactive power load shedding at node i, respectively. Equation (35) ensures that the active power shedding (PiLs) value remains within the permissible range, bounded by 0 and the maximum allowable active power shedding (Pi,maxL) value. Equation (36) models the proportional relationship between reactive and active power shedding, where the reactive power shedding QiLs is scaled according to the ratio of the active power shedding PiLs to its maximum value Pi,maxL, maintaining consistency between the two load reductions.
3.1.4. Distributed Generation Output Constraints
While the high-impact zone of the typhoon remains over the island, wind turbines are shut down due to excessive wind speeds. After the high-impact zone moves away and the wind speed drops below the cutoff threshold, the wind turbines are recommissioned and operate at high power outputs, significantly contributing to the resilience of the island microgrid. The mathematical model for calculating the output power of the island wind generation system is formulated as follows:
Equation (39) represents the output model for wind power generation systems, whereas Equations (37) and (38) define the upper and lower output limits, respectively, for distributed energy resources in the island microgrid. Equation (40) imposes a constraint on the power factor of the distributed resources.
3.2. Post-Disaster Recovery Optimization
Following a disaster-induced islanding event, the fault duration and damaged lines of the microgrid are estimated on the basis of disaster severity and repair resource availability. The proposed multi-source coordination model for post-disaster recovery dynamically schedules electric ships, diesel generators, and distributed resources to increase the resilience of the distribution network. The optimization objective minimizes weighted load curtailment under fault conditions while incorporating ship routing uncertainties, and the mathematical formulation is expressed as follows:
3.2.1. Ship Voyage Model
The joint optimization of island microgrids must consider both transportation constraints and power limitations. These constraints and the associated physical laws are defined as follows:
Equation (42) states that when the time interval is shorter than the ship scheduling time, the connection status of the ship at node k is 0. Equation (43) represents the coupling relationship between the charging/discharging state and spatial state of the ship, ensuring that charging and discharging occur only when the connection status is active. Owing to the bilinearity of Equation (42), an intermediate variable is introduced, and the linearization method is applied to express Equation (38) as Equations (44) and (45).
3.2.2. Ship Charging and Discharging Model
Equations (46) and (47) define the upper and lower bounds for active power during the charging and discharging of an electric ship. Equations (48) and (49) specify the upper and lower bounds of the reactive power during the charging and discharging of an electric ship. Equation (50) presents the coupling relationship between the charging/discharging status and the spatial state of the electric ship, ensuring that charging and discharging occur only when the connection status is active. Equation (51) defines the dynamic State of Charge balance, encompassing energy exchange with the grid and consumption during navigation. Equation (52) specifies the physical upper and lower bounds on the State of Charge of the electric ship.
4. Solution Method
Compared with mainland grids, island microgrids exhibit greater complexity in terms of resilience enhancement due to environmental volatility and electric ship integration uncertainties. The proposed hybrid framework integrates an adaptive A* algorithm with a mixed-integer second-order cone programming model to co-optimize voyage scheduling and resource allocation.
4.1. Adaptive A* Path Planning Algorithm
The classic A* algorithm is widely adopted for static shortest-path problems via best-first heuristics. To address environmental dynamics, particularly typhoon-induced wind field impacts, an enhanced A* algorithm is developed. This approach integrates real-time wind speed and direction into the cost assessment to dynamically update no-sail zones and node traversal costs.
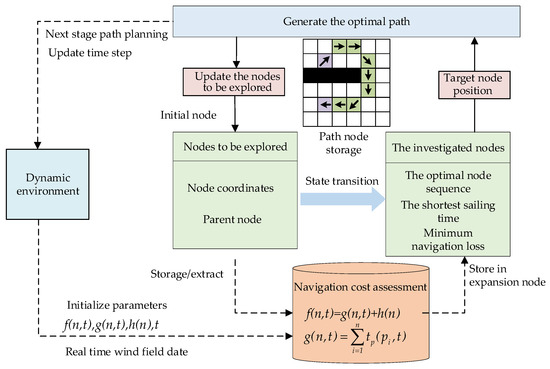
As illustrated in Figure 4, the systematic execution of the adaptive A* algorithm follows these steps:
Figure 4.
Adaptive A* path planning algorithm flow.
- Step 1: Parameter Initialization. The algorithm initializes the search by defining the start node, target node position, and time step t. The priority queue (Nodes to be explored) and the set of visited nodes (The investigated nodes) are established. Real-time wind field data are imported to set the baseline environmental parameters.
- Step 2: Dynamic Cost Assessment. Calculate the total cost f(n,t) = g(n,t) + h(n). Here, g(n,t) is a time-dependent function representing the cumulative sailing time, where the traversal cost tp(pi,t) for each grid is adaptively adjusted according to wind-induced speed variations.
- Step 3: Node Expansion. Employ an eight-directional expansion mechanism. Nodes where wind speeds exceed safety thresholds are marked as temporary no-sail zones with infinite traversal costs, ensuring they are excluded from the feasible path.
- Step 4: State Transition. The heuristic function h(n) guides the search toward the target while accounting for minimum navigation loss. Nodes with the minimum f(n,t) undergo a state transition to the “Investigated nodes” set, and their information is stored in the path node storage.
- Step 5: Path Generation. Upon reaching the target, the optimal node sequence is generated via backtracking. The algorithm then updates the time step to trigger the next stage of path planning, maintaining synchrony with the evolving environment.
4.2. MISOCP-Based Scheduling Framework
A two-stage robust optimization framework is developed to co-optimize ship routing and distributed energy resource dispatch under post-disaster uncertainty scenarios. The pre-disaster stage optimizes vessel pre-positioning while accounting for wind generation uncertainty, and the post-disaster stage coordinates restoration efforts through distributed energy resources and mobile energy systems. The compact form of the two-stage robust optimization is defined as follows:
This problem is decomposed into a master problem and a subproblem via a column-and-constraint generation (C&CG) algorithm. The master problem defined below solves for the optimal pre-disaster layout decisions under a finite scenario set:
Subproblem: Given the pre-deployment scheme X* of mobile energy storage, determine the worst-case wind turbine output. The subproblem can be formulated as .
The inner minimization problem of the subproblem is a convex optimization problem. According to the strong duality theory, it can be transformed into a maximization form, which is then combined with the outer maximization problem to form the following single-level optimization problem:
Since the subproblem contains the non-convex bilinear term uTφ, it is difficult to solve directly. However, as the variables u and φ are independent of each other, when the problem reaches its optimal value, u will take either the lower or upper bound of the set Us. Therefore, a binary variable ϑi is introduced as an indicator of the wind power output bounds: when ϑi = 0, the wind power output is at its lower bound; when ϑi = 1, the wind power output is at its upper bound. Thus, uTφ can be transformed as follows:
Equation (57) introduces the linear constraint for ϑiφi using the Big-M method. Equation (58) is added to prevent the model from being overly conservative. After these transformations, the subproblem can be solved using commercial solvers.
5. Simulation Results
5.1. Study Area and Dataset Configuration
Hengsha Island, located off the coast of Shanghai, China, is selected as a case study for evaluating post-disaster resilience enhancement strategies. The study employs the standard IEEE 33-bus test feeder as the network model [36], with load data derived from and scaled based on actual historical profiles of Hengsha Island. The total simulation horizon is defined as 600 min (10 h) with a temporal resolution of 15 min per time step. It is assumed that the island microgrid experiences typhoon-induced failures starting at 06:00 (Step 1) and the restoration analysis concludes at 16:00 (Step 40). This coastal island thus serves as an experimental platform for demonstrating the integration of electric ships as mobile power sources in microgrid restoration scenarios.
5.2. Scenario Description and Fault Dynamics
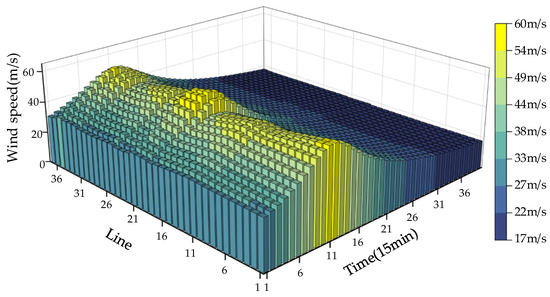
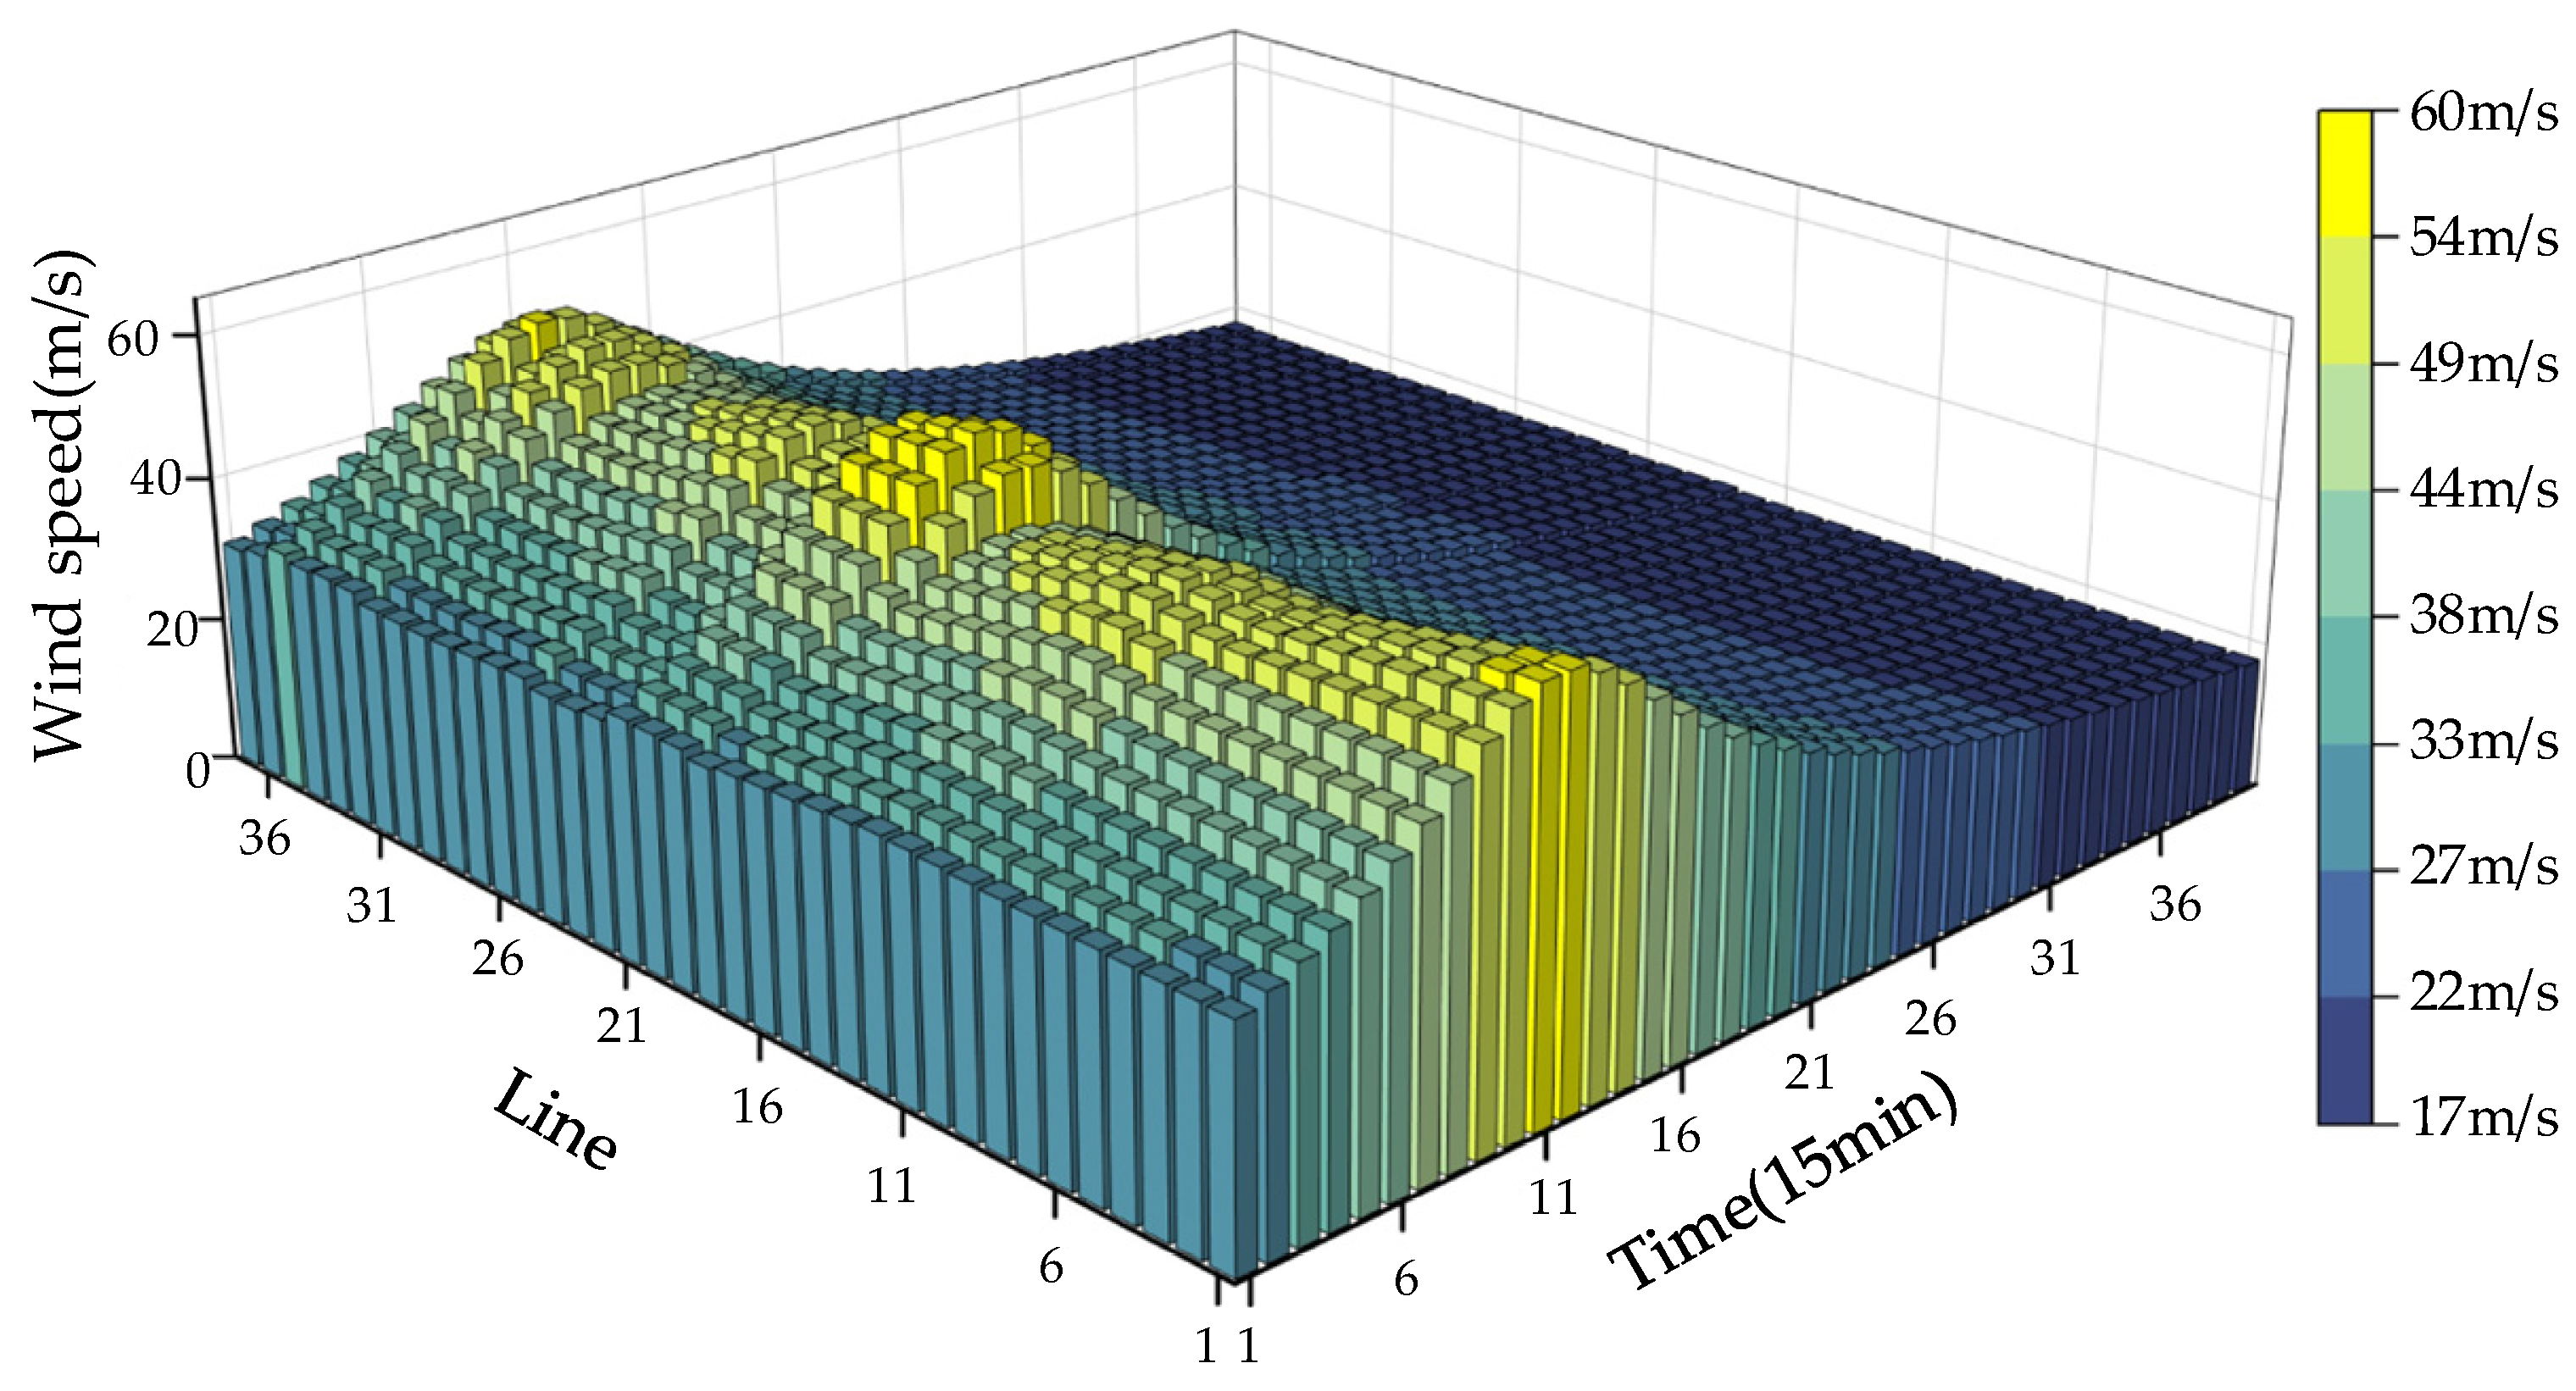
Island microgrids, which are constrained by geographic isolation and limited infrastructure, exhibit heightened vulnerability to typhoon-induced power disruptions. A time-dependent fault scenario is constructed for the Hengsha Island microgrid to simulate the spatiotemporal changes in wind speeds across critical transmission corridors. As shown in Figure 5, during typhoon approach phases, the wind speed increases exponentially within the radius of the maximum winds, resulting in elevated failure risks for lines proximal to the storm trajectory. After the 16th operational time interval, gradual maximum wind displacement reduces the wind intensity and stabilizes the grid conditions. Faulted transmission lines (1–2, 2–19, 3–4, 3–23, 19–20, 20–21, 21–22) demonstrate spatial correlation with peak wind stress zones, underscoring the necessity of integrating dynamic wind field data into adaptive resilience planning frameworks.
Figure 5.
Real-time wind speed curve for island lines.
5.3. Ship Routing Disturbance Analysis Across Typhoon Lifecycle
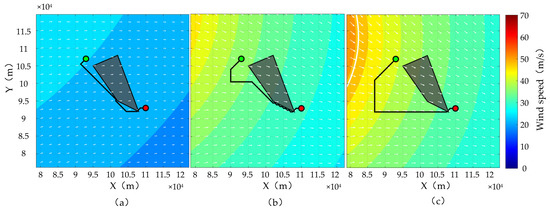
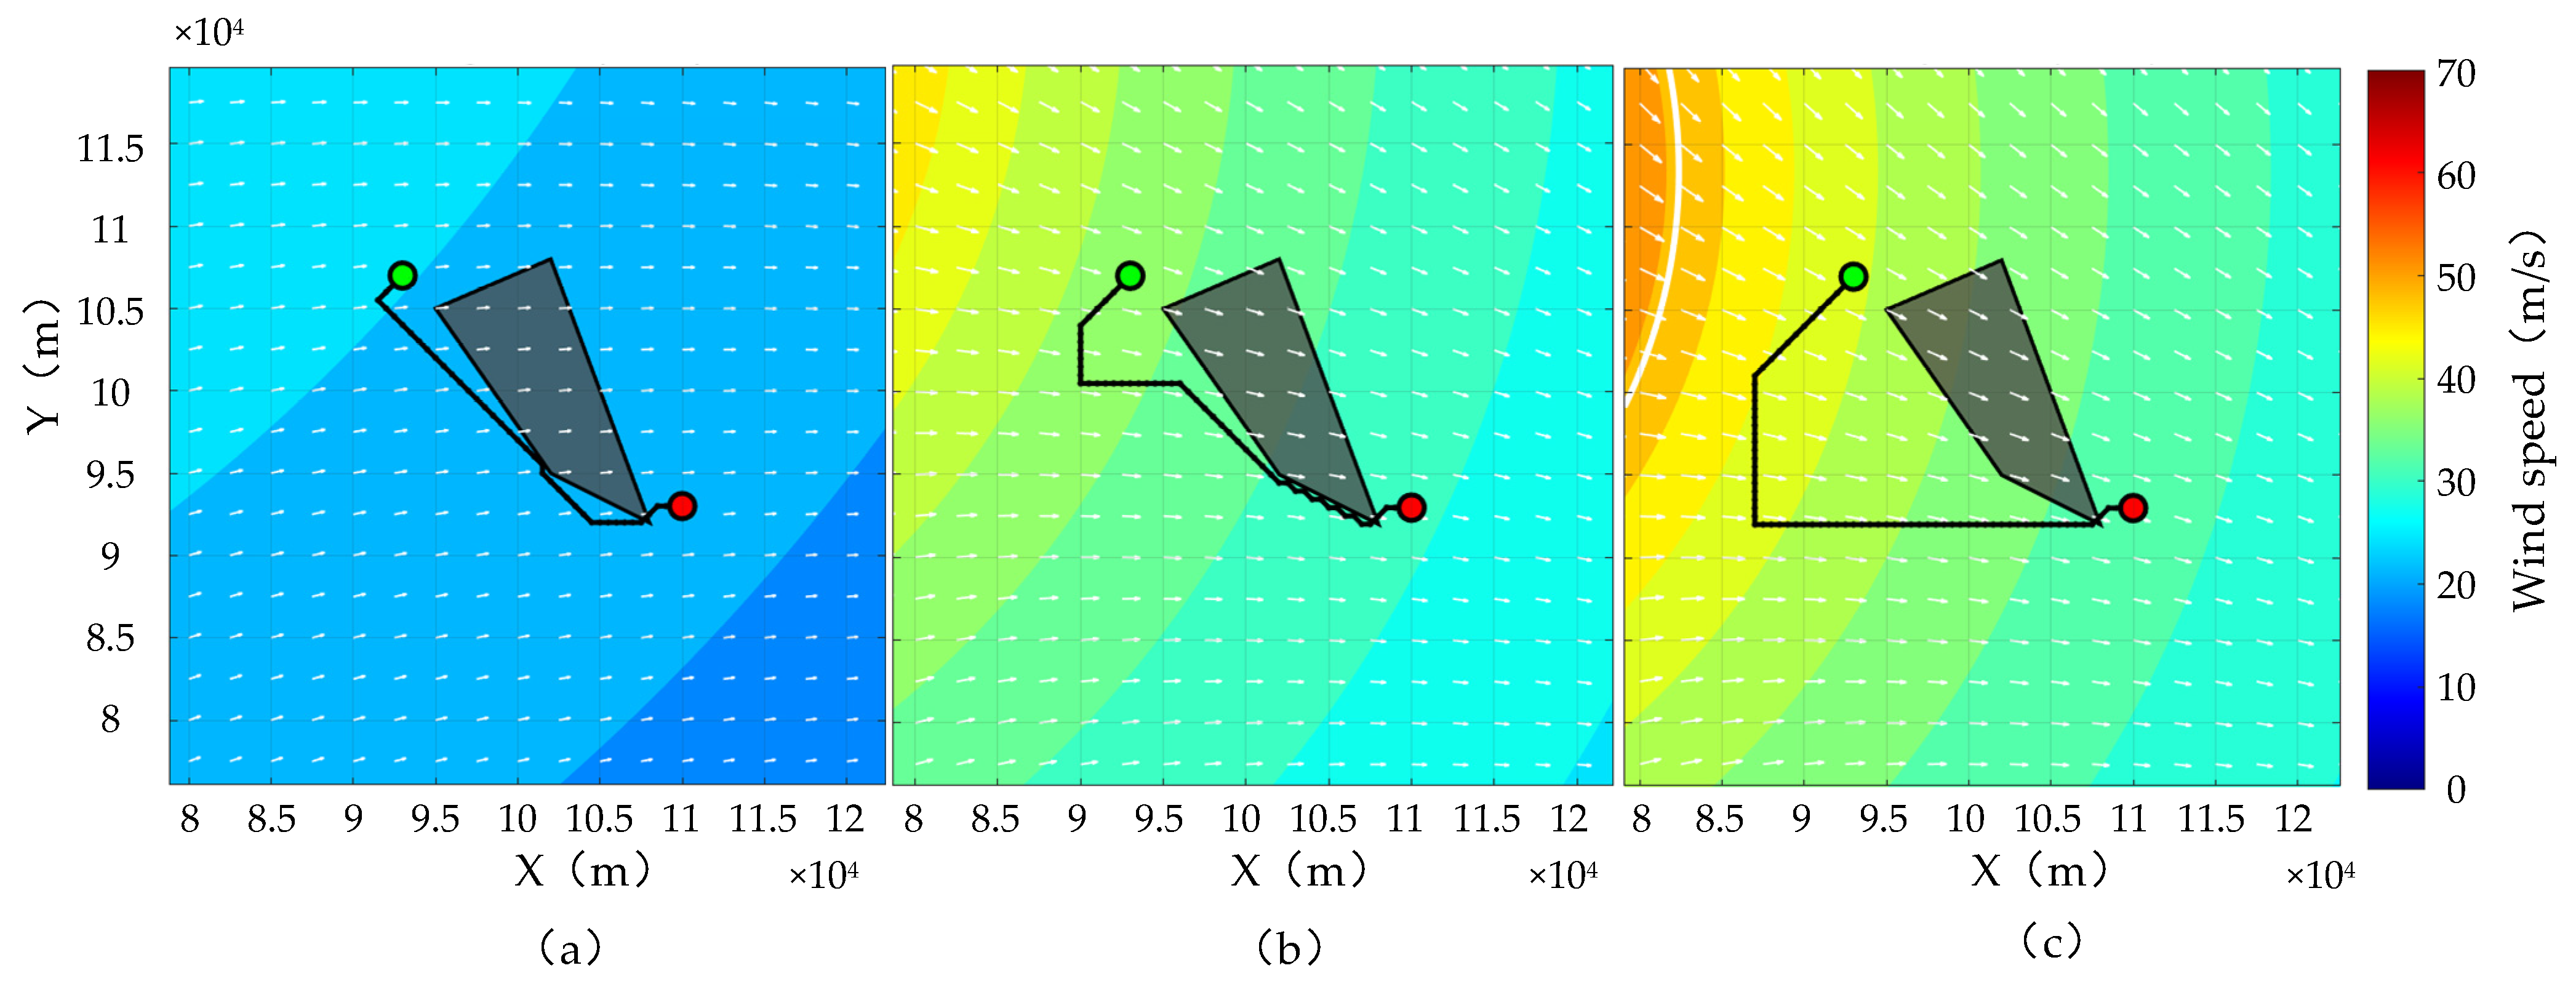
To validate the method’s adaptability in dynamic environments, we analyzed the evolution of ship routing decisions across the typhoon lifecycle (t = 1 h, 4 h, 8 h) using a dedicated case study designed to verify wind field disturbance. The simulation clearly demonstrates a non-linear relationship between routing disturbance and environmental intensity: As shown in Figure 6a, during the initial phase (t = 1 h), the algorithm selects a near-geometrically optimal path with minimum energy expenditure (6411.31 kWh, 2.56 h). As the typhoon progresses into the intensification phase (Figure 6b, t = 4 h), the expanded forbidden zone forces the algorithm to execute an evasive detour for safety, leading to increased travel time and energy consumption. However, at the peak intensity phase (Figure 6c, t = 8 h), the expanded Forbidden Zone forces the algorithm to execute a significant evasive detour for safety, causing both travel time (4.84 h) and energy consumption (12,508.47 kWh) to peak. This major fluctuation in path, time, and energy consumption (energy variance exceeding 5 MWh) unequivocally validates the A* algorithm’s ability to successfully identify and mitigate high uncertainty across the typhoon lifecycle, directly addressing the validation requirement for dynamic disturbance analysis.
Figure 6.
Validation of dynamic ship routing disturbance across the typhoon lifecycle: (a) ship trajectory at t = 1 h; (b) ship trajectory at t = 4 h; (c) ship trajectory at t =8 h. The shadowed areas represent the island coastlines; the white arrows indicate the wind direction; the green and red circles represent the starting and ending points, respectively.
5.4. Comparative Case Design
To comprehensively evaluate the effectiveness of the proposed resilience enhancement framework, four distinct case studies are constructed:
- Case 1: The baseline strategy involves only distributed energy resource operation and network reconfiguration without mobile power support.
- Case 2: This case introduces electric ships as mobile energy storage units; however, coordinated scheduling optimization is not implemented.
- Case 3: This case implements coordinated scheduling between distributed energy resources and electric ships, excluding dynamic routing considerations.
- Case 4: This case fully integrates coordinated power dispatch, electric ship routing optimization, and dynamic scenario awareness.
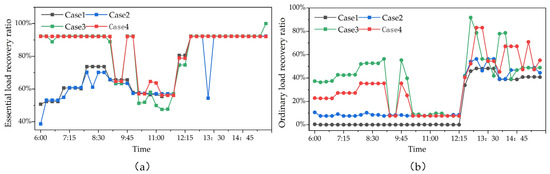
The critical load recovery ratio, normal load recovery ratio, and load shedding cost for each case are presented in Figure 7 and Table 2.
Figure 7.
Case load recovery ratio: (a) essential load recovery ratio; (b) ordinary load recovery ratio.
Table 2.
Case study results and comparative analysis.
In case 1, the microgrid depends exclusively on distributed energy resources and diesel generators, leading to extensive load curtailment and incurring the highest economic loss ($151,345). Wind turbines are forced offline during the initial typhoon phase due to excessive wind speeds, segmenting the system into five isolated microgrids. Restoration efforts prioritize critical loads, achieving a 50–70% recovery rate within the first 12 h, whereas noncritical loads remain largely unserved until the wind conditions subside after 12:00. This scenario highlights the inherent limitations of static resource configurations under extreme weather conditions.
In case 2, electric ships are introduced as mobile energy storage units to enhance inter-microgrid energy support via ship-to-grid power transfer. However, in the absence of voyage scheduling optimization, the support capability remains constrained to initially connected microgrids, and it cannot allocate resources dynamically to high-deficit zones. Consequently, noncritical load recovery improves by only 10% over that in case 1, whereas critical load restoration rates remain unchanged. Although total load curtailment costs are reduced to $142,660, the marginal improvement in system resilience demonstrates that uncoordinated electric ship deployment fails to fully exploit the potential flexibility of mobile energy integration.
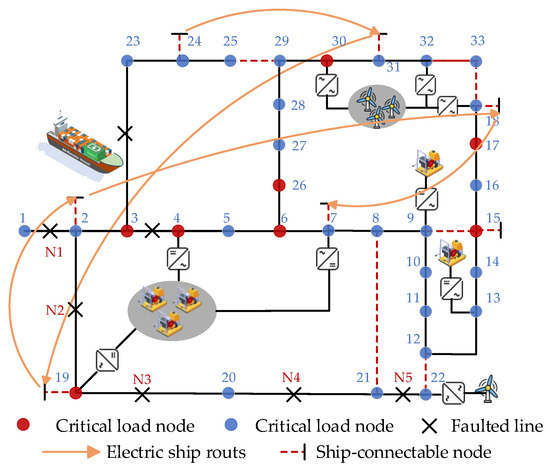
Case 3 explores a co-scheduling strategy between distributed energy resources and an electric ship while neglecting spatiotemporal operational constraints imposed by typhoon dynamics. Using pre-fault network topology and static load prioritization, the optimal navigation path for the electric ship is determined to be 24-31-2-7-18-19. This configuration improves inter-microgrid power sharing and enables targeted energy support during restoration.
Although case 3 achieves stronger critical load recovery and reduces curtailment costs to $99,844, it has practical limitations. Specifically, the fixed routing strategy fails to adapt to evolving wind fields and maritime navigation constraints, overlooking time-varying operational conditions. As a result, the observed performance gains partially reflect idealized assumptions rather than real-world adaptability, emphasizing the need for dynamic, scenario-aware optimization, as implemented in case 4.
Case 4 implements a dynamic scenario-aware routing optimization, where the navigation path of the electric ship is adaptively updated on the basis of real-time wind field evolution and typhoon progression. As illustrated in Figure 8, the optimized route is determined as 24-31-19-2-18-7. This path allows the ship to sequentially access critical nodes while maintaining safe navigation margins under time-varying wind constraints. Furthermore, this dynamic strategy extends to real-time microgrid restoration. When the electric ship connects to a critical load node i, its available support capacity PtMdch is dynamically integrated into the real-time isolated microgrid energy balance calculation. The arrival at nodes 19 and 2 enables the prioritized recovery of their respective local critical loads, while subsequent movement to node 7 ensures energy support for the adjacent isolated areas. This adaptive adjustment of the recovery sequence ensures a continuous energy supply to critical loads throughout the evolving disaster phases.
Figure 8.
Optimal ship routing for Case 4 considering maritime wind resistance.
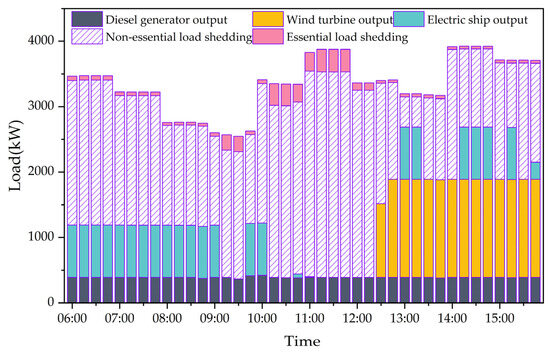
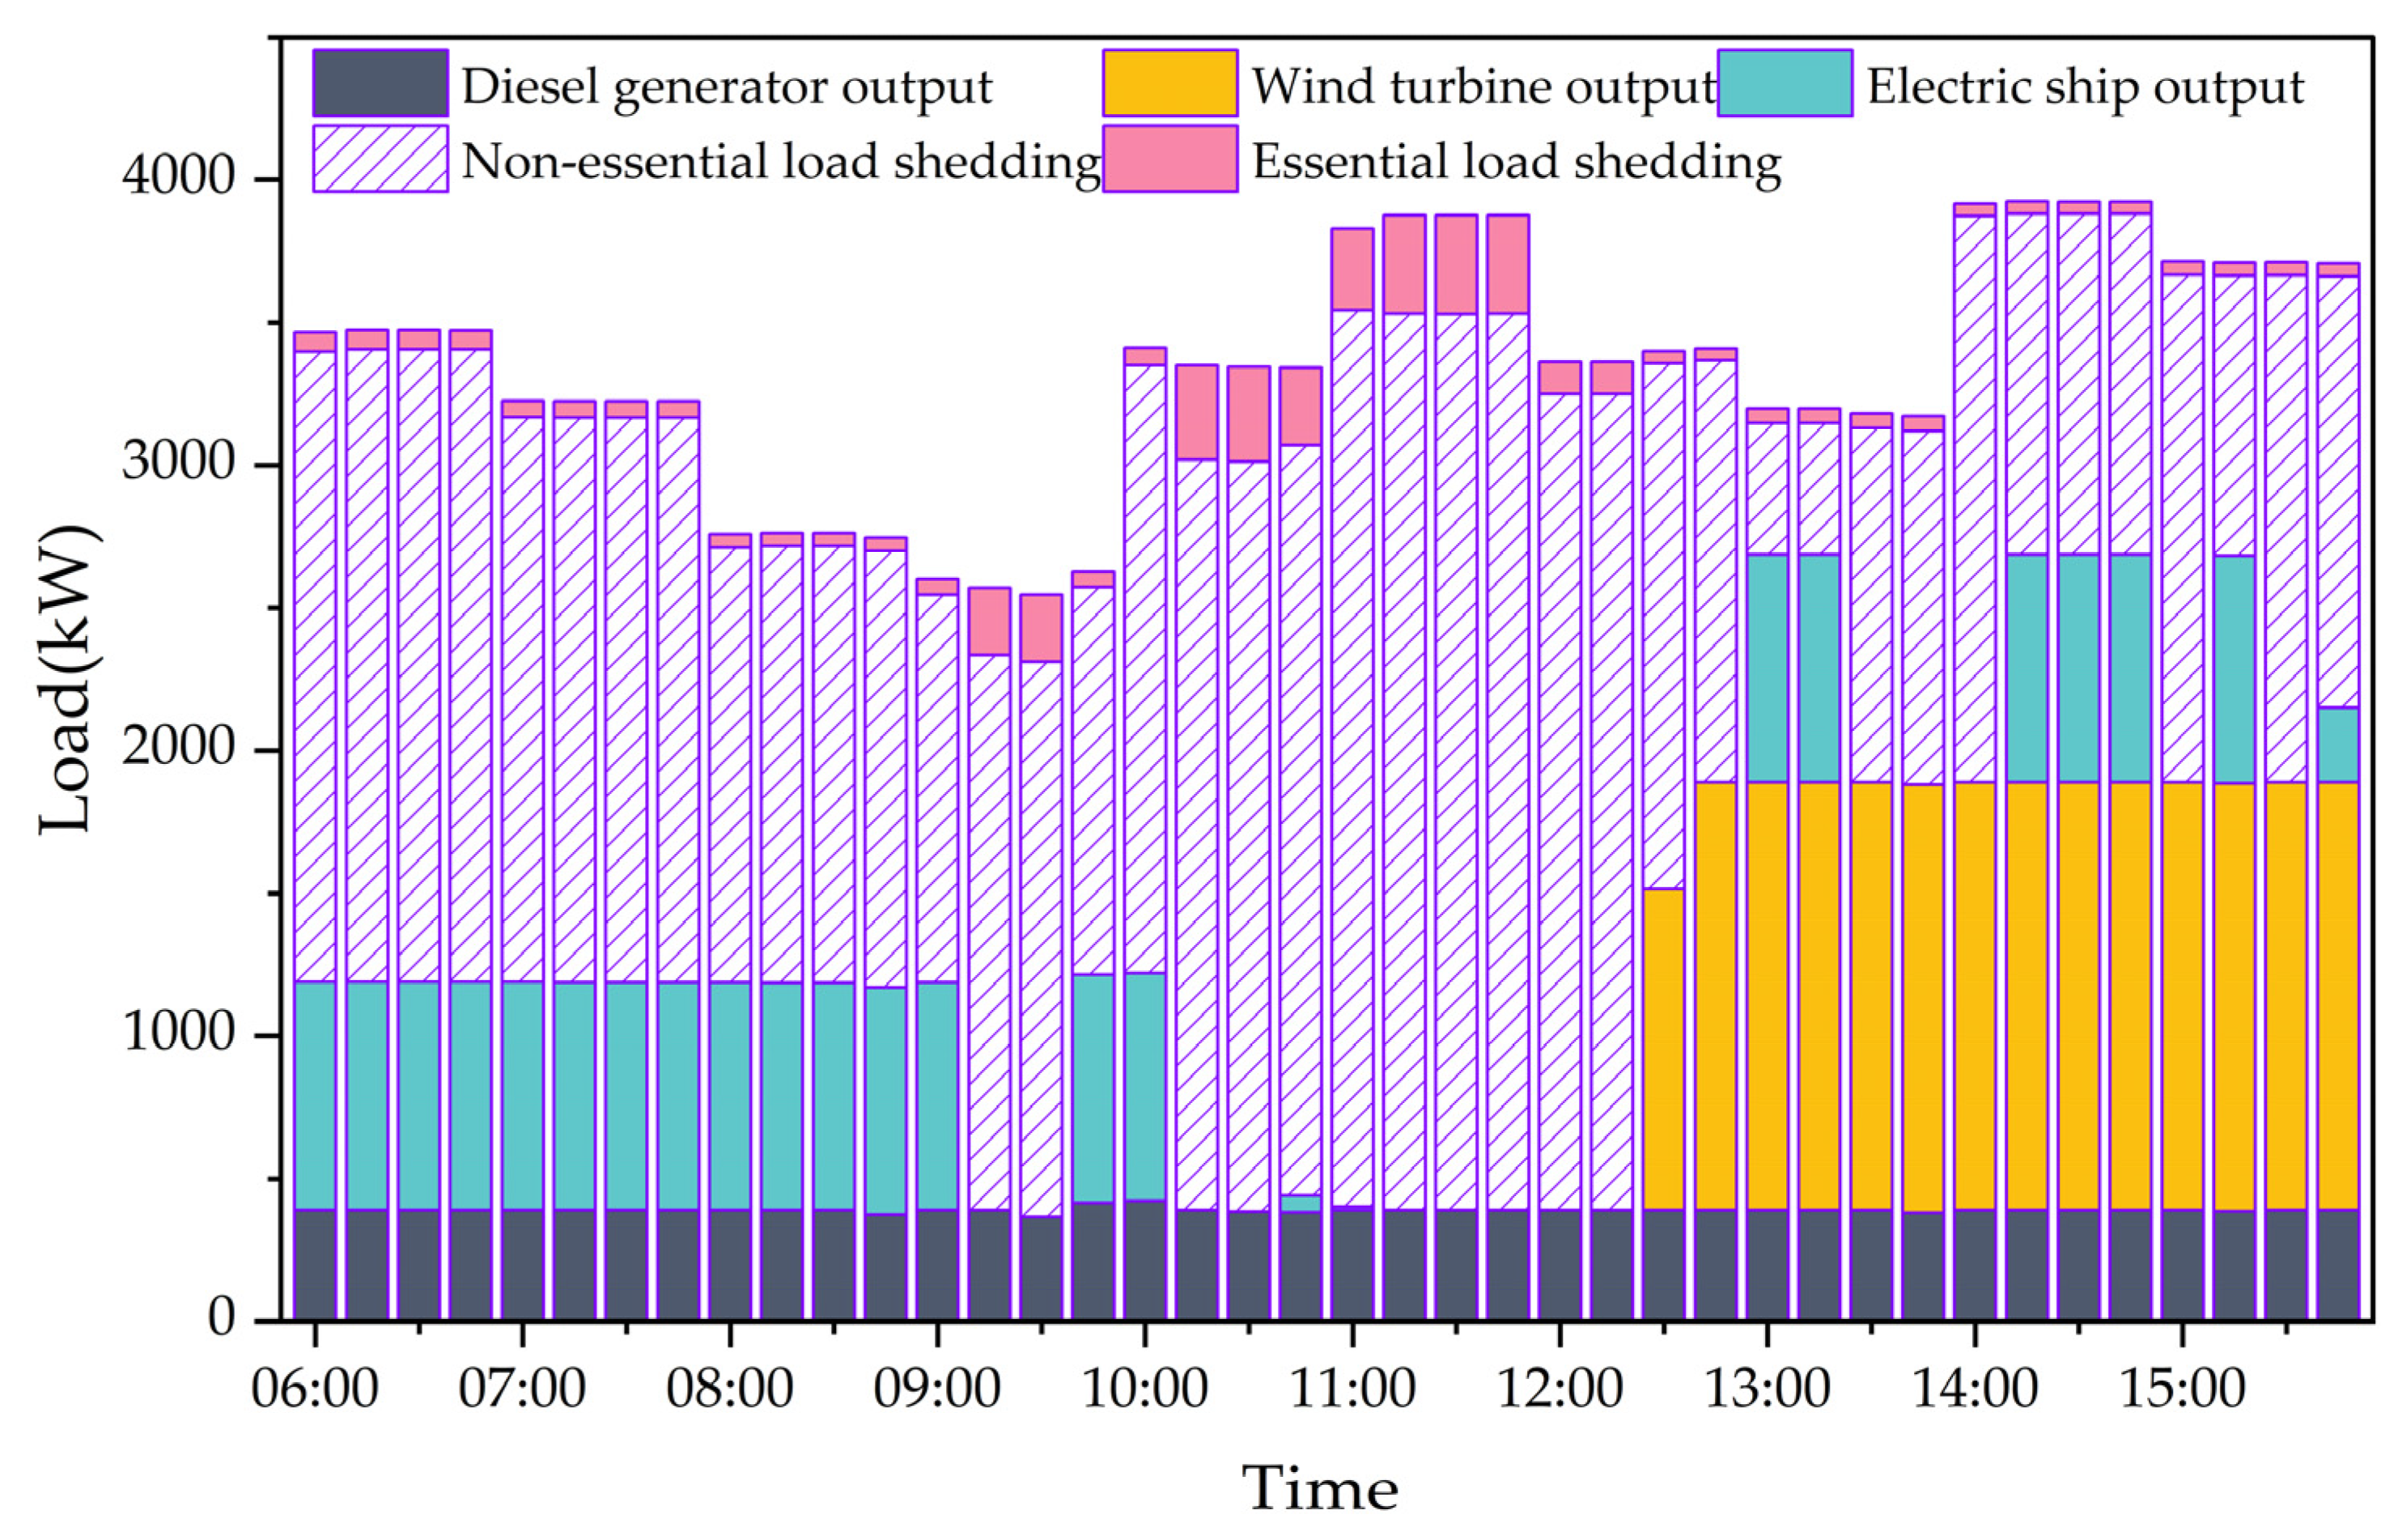
Figure 9 illustrates the dynamic energy balance and the strategic role of the electric ship during the multi-stage restoration. In the initial stage (06:00–09:00), while wind turbines are cut out due to extreme wind speeds, the electric ship remains docked at the local microgrid to provide substantial power support, preventing catastrophic load shedding when the system is primarily dependent on diesel generators. As the restoration progresses, a critical transition occurs to prevent total blackouts in isolated microgrids that lack local generation, such as those containing nodes 3 and 19. The electric ship is dynamically dispatched to connect at node 19 by 11:00 and subsequently at node 2 by 13:00, effectively prioritizing these vulnerable clusters before moving to nodes 18 and 7. By adaptively updating docking locations and discharge magnitudes to synchronize with real-time grid deficits, this strategy realizes inter-island power mutual assistance.
Figure 9.
Post-typhoon energy dispatch load curve.
This adaptive routing strategy markedly enhances system resilience. Compared with those in case 1, critical load recovery rates increase by 29–40% before navigation restrictions are lifted and by 8–34% during the subsequent deployment phase. Noncritical load recovery increases by 7–35%, whereas total load curtailment costs decrease by 31.6%, reaching $103,583. These findings empirically validate the critical importance of integrating spatiotemporal environmental dynamics into optimization frameworks. The incorporation of dynamic scenario-aware scheduling not only enhances the flexibility and robustness of island microgrid restoration strategies but also significantly outperforms static scheduling approaches in disaster scenarios. The results demonstrate that considering evolving environmental conditions enables more resilient and efficient power system restoration.
6. Conclusions
A resilience-oriented dispatch framework for island microgrids is proposed by modeling shipboard power systems as spatiotemporally constrained energy resources. By integrating a hybrid wind field model with a two-stage MILP coordination strategy and an improved A* routing algorithm, the gap between maritime environmental physics and grid restoration requirements is effectively bridged. Simulation results on Hengsha Island demonstrate that a 31.6% reduction in curtailment costs and a 40% improvement in critical load recovery are achieved. A synthetic discussion of these findings reveals a non-linear relationship between environmental intensity and resource availability, proving that maritime accessibility is a primary determinant of restoration performance. By capturing dynamic evasive detours during peak typhoon phases, the research goal of achieving synergy between navigation dynamics and grid resilience is fulfilled, ensuring that the mobility of shipboard power systems is strictly governed by the time-varying constraints of the maritime environment.
Despite these advances, the current model is limited by the assumption of deterministic typhoon trajectories, and the robustness of the optimization framework will be enhanced in future study. Furthermore, multi-vessel collaborative dispatch and resource configuration within multi-island microgrid clusters will be considered.
Author Contributions
Conceptualization, J.M. and S.W.; methodology, J.M.; software, X.L.; validation, S.W.; formal analysis, M.Z.; writing—original draft, J.M. and X.L.; writing—review and editing, S.W. and M.Z.; investigation, X.L.; supervision, S.W. and M.Z. All authors have read and agreed to the published version of the manuscript.
Funding
This research was funded by the National Natural Science Foundation of China under grant of 52177101.
Data Availability Statement
The original contributions presented in this study are included in the article. Further inquiries can be directed to the corresponding author.
Conflicts of Interest
The authors declare no personal, academic, or financial conflicts of interest associated with this paper.
Nomenclature
| The resulting surface opposing wind direction | |
| Constant Coefficient Matrix | |
| Coefficient Vector | |
| Holland model parameter | |
| Air drag coefficient and Hydrodynamic Drag Coefficient | |
| Mobile power resource allocation cost | |
| Grid scale of the divided wind field and distance between the study point | |
| Upper and lower limits of ship power | |
| Single voyage loss/single trip loss/Energy loss during navigation | |
| The electric quantity of the ship at time t and t | |
| Wind resistance/Virtual power flow/Virtual power dispatched | |
| Fault model parameters for transmission lines and towers | |
| Gravitational acceleration | |
| Typhoon center pressure drop/Initial typhoon pressure drop | |
| Intermediate Variable | |
| Upper limit of the squared branch current | |
| Transmission segment length/Variable Obtained After l Iterations | |
| A very large number | |
| Sets of nodes for electric ship connection diesel generators and wind power sources | |
| Model parameter for maximum wind speed calculation | |
| Transmission branch | |
| Ship weight | |
| Number of Second-Order Cone Constraints | |
| Number of transmission/tower transmission segments | |
| Fault probability of lines/towers/entire line transmission branch | |
| Maximum active/reactive load power/active/reactive power curtailment | |
| Upper limits of active/reactive power output/Active and reactive power of distributed generation | |
| Radius of maximum wind speed at time t | |
| Branch resistance/reactance/Hydrodynamic resistance/total resistance | |
| Typhoon duration/time step/ship transit time through the grid | |
| Uncertainty set/optimization variables in the Second Stage | |
| Typhoon translation speed/Wind speed at the radius of maximum wind speed/wind speed at study point | |
| Wind speed on transmission lines/towers at time t | |
| Maximum wind speed withstand capacity/design wind speed of the line/tower | |
| Ship speed/wind speed/relative vessel speed and heading at time t | |
| Actual vessel speed at time t | |
| Wind turbine cut-in/cut-out/rated wind speed | |
| Load weight | |
| Optimization variables in the First Stage | |
| Model parameter for the radius of maximum wind speed | |
| Typhoon center position | |
| Optimization Variables in the Second Stage/Maximum power point tracking efficiency | |
| Auxiliary Variables and Maximum Number of Iterations | |
| Typhoon pressure drop decay coefficient/fault probability of segment l/k of transmission line m at time t | |
| Fault parameters of transmission lines/towers | |
| Child and parent node sets of node i | |
| Upper/lower limit of power factor for distributed generation | |
| Typhoon center angle and wind direction angle | |
| Ship heading and wind direction at time t | |
| Branch set/node set | |
| Improve system efficiency/motor efficiency | |
| Dual variable of the constraint | |
| Connection status between mobile power resources and nodes | |
| Initial typhoon pressure drop coefficient | |
| Air density/air seawater density |
References
- Philippines: Super Typhoon Rai (Odette) Humanitarian Needs and Priorities (Dec 2021–Jun 2022). Available online: https://www.unocha.org/publications/report/philippines/philippines-super-typhoon-rai-odette-humanitarian-needs-and-priorities-dec-2021 (accessed on 22 January 2026).
- Thumbs up from Southern Power Grid Received! Available online: https://en.hbfec.com.cn/news/327.html (accessed on 22 January 2026).
- Philippines: Tropical Cyclones Kalmaegi/Tino and Fung-Wong/Uwan—Flash Update No.1 (As of 07 November, 9 p.m. local time). Available online: https://www.unocha.org/publications/report/philippines/philippines-tropical-cyclones-kalmaegitino-and-fung-wonguwan-flash-update-no1-07-november-9-pm-local-time (accessed on 22 January 2026).
- Li, S.; Fan, X.; Qi, Z.; Peng, S. Research on resilience synergy enhancement strategies for port microgrids and ship energy systems in the context of extreme weather. Renew. Energy 2025, 258, 125035. [Google Scholar] [CrossRef] [Scilit]
- Guzs, D.; Utans, A.; Sauhats, A.; Junghans, G.; Silinevics, J. Resilience of the Baltic Power System When Operating in Island Mode. IEEE Trans. Ind. Appl. 2022, 58, 3175–3183. [Google Scholar] [CrossRef] [Scilit]
- Zis, T.P.V.; Psaraftis, H.N.; Ding, L. Ship weather routing: A taxonomy and survey. Ocean Eng. 2020, 213, 107697. [Google Scholar] [CrossRef] [Scilit]
- Babu, K.V.S.M.; Dwivedi, D.; Chakraborty, P.; Yemula, P.K.; Pal, M. A comprehensive review on resilience definitions, frameworks, metrics, and enhancement strategies in electrical distribution systems. Appl. Energy 2025, 394, 126141. [Google Scholar] [CrossRef] [Scilit]
- Mishra, D.K.; Eskandari, M.; Abbasi, M.H.; Sanjeevikumar, P.; Zhang, J.; Li, L. A detailed review of power system resilience enhancement pillars. Electr. Power Syst. Res. 2024, 230, 110223. [Google Scholar] [CrossRef] [Scilit]
- Hu, X.; Guo, H.; Lao, K.W.; Hao, J.; Liu, F.; Ren, Z. MiniRocket-MARL synergy for storm tide resilience: MESS-DV enhanced recovery in coastal distribution networks. Appl. Energy 2025, 401, 126710. [Google Scholar] [CrossRef] [Scilit]
- Bahrami, M.; Vakilian, M.; Farzin, H.; Lehtonen, M. A stochastic framework for optimal island formation during two-phase natural dis-asters. IEEE Syst. J. 2021, 16, 2090–2101. [Google Scholar] [CrossRef] [Scilit]
- Zhang, W.; Shao, C.; Hu, B.; Xie, K.; Siano, P.; Li, M.; Cao, M. Transmission defense hardening against typhoon disasters under decision-dependent uncertainty. IEEE Trans. Power Syst. 2022, 38, 2653–2665. [Google Scholar] [CrossRef] [Scilit]
- Shabani, A.; Nafar, M.; Niknam, T. Four-level framework for enhancing active distribution network resilience to wind storms. Electr. Power Syst. Res. 2025, 249, 112027. [Google Scholar] [CrossRef] [Scilit]
- Babu, C.H.; Raju, H.; Thangaraj, Y.; Thanikanti, S.B.; Nastasi, B. Optimizing power and energy loss reduction in distribution systems with RDGs, DSVCs and EVCS under different weather scenarios. Sustain. Energy Technol. Assess. 2025, 75, 104219. [Google Scholar] [CrossRef] [Scilit]
- Li, B.; Chen, Y.; Wei, W.; Huang, S.; Xiong, Y.; Mei, S.; Hou, Y. Routing and scheduling of electric buses for resilient restoration of distribution system. IEEE Trans. Transp. Electrif. 2021, 7, 2414–2428. [Google Scholar] [CrossRef] [Scilit]
- Pan, T.; Li, X.; Su, L.; Shi, Y.; Gao, Y.; Tang, R.; Yang, C. Resilience enhancement strategy for port distribution networks considering mobile energy storage. Electr. Power Syst. Res. 2025, 246, 111685. [Google Scholar] [CrossRef] [Scilit]
- Qiujie, W.; Hao, X.; Hong, T.; Zhenxing, L.; Fei, Y.; Mohamed, M.A. Enhancing pre-disaster resilience of distribution networks considering temporal characteristics of typhoon disasters and cyber-physical collaborative control. Reliab. Eng. Syst. Saf. 2025, 268, 111954. [Google Scholar] [CrossRef] [Scilit]
- Chen, X.; Liu, J.; Ren, J.; Li, P.; Hou, S.; Zhou, X. A two-stage resilience enhancement method for distribution networks considering demand response. Electr. Power Syst. Res. 2026, 251, 112237. [Google Scholar] [CrossRef] [Scilit]
- Lei, S.; Chen, S.; Li, Y.; Hou, Y. Resilient disaster recovery logistics of distribution systems: Co-optimize service restoration with repair crew and mobile power source dispatch. IEEE Trans. Smart Grid 2019, 10, 6187–6202. [Google Scholar] [CrossRef] [Scilit]
- Xiong, H.; Yan, M.; Li, F.; Ding, T.; Guo, C.; Li, Z. Resilience enhancement for distribution system with multiple non-anticipative uncertainties based on multi-stage dynamic programming. IEEE Trans. Smart Grid 2024, 15, 5706–5720. [Google Scholar] [CrossRef] [Scilit]
- Liu, J.; Qin, C.; Yu, Y. Enhancing distribution system resilience with proactive islanding and RCS-based fast fault isolation and service restoration. IEEE Trans. Smart Grid 2019, 11, 2381–2395. [Google Scholar] [CrossRef] [Scilit]
- Ye, Z.; Ding, Z.; Liu, Y.; Yu, Y. Coordinated Control Strategy for Island Power Generation System with Photovoltaic, Hydrogen-Fueled Gas Turbine and Hybrid Energy Storage. J. Mar. Sci. Eng. 2025, 13, 2071. [Google Scholar] [CrossRef] [Scilit]
- Xu, J.; Zhang, T.; Du, Y.; Zhang, W.; Yang, T.; Qiu, J. Islanding and dynamic reconfiguration for resilience enhancement of active distribution systems. Electr. Power Syst. Res. 2020, 189, 106749. [Google Scholar] [CrossRef] [Scilit]
- Ma, Z.G.; Værbak, M.; Cong, L.; Billanes, J.D.; Jorgensen, B.N. Enhancing Island Energy Resilience: Optimized Networked Microgrids for Renewable Integration and Disaster Preparedness. Electronics 2025, 14, 2186. [Google Scholar] [CrossRef] [Scilit]
- Jiang, T.; Sun, T.; Liu, G.; Li, X.; Zhang, R.; Li, F. Resilience evaluation and enhancement for island city integrated energy systems. IEEE Trans. Smart Grid 2022, 13, 2744–2760. [Google Scholar] [CrossRef] [Scilit]
- Jaisanbayev, A.; Harsh, P.; Sun, H.; Liu, C. Resilient microgrid operation under adverse weather conditions with deep reinforcement learning. Sustain. Energy Technol. Assess. 2025, 84, 104748. [Google Scholar] [CrossRef] [Scilit]
- Affolabi, L.; Shahidehpour, M.; Nassif, A.B.; Lelic, M.; Kushner, D.; Bahramirad, S. Electricity Grid Enhancement in Puerto Rico by Establishing Renewable-Based Microgrids in Vieques and Culebra Islands. In Proceedings of the 2023 IEEE PES GTD International Conference and Exposition (GTD), Istanbul, Turkiye, 22–25 May 2023; pp. 16–21. [Google Scholar] [CrossRef] [Scilit]
- Ma, H.; Wang, H. Optimal resilient scheduling strategy for electricity–gas–hydrogen multi-energy microgrids considering emergency islanding. Energy 2025, 324, 135732. [Google Scholar] [CrossRef] [Scilit]
- Sun, Q.; Wu, Z.; Ma, Z.; Gu, W.; Zhang, X.P.; Lu, Y.; Liu, P. Resilience enhancement strategy for multi-energy systems considering multi-stage recovery process and multi-energy coordination. Energy 2022, 241, 122834. [Google Scholar] [CrossRef] [Scilit]
- Qiu, D.; Wang, Y.; Zhang, T.; Sun, M.; Strbac, G. Hierarchical multi-agent reinforcement learning for repair crews dispatch control towards multi-energy microgrid resilience. Appl. Energy 2023, 336, 120826. [Google Scholar] [CrossRef] [Scilit]
- Ding, T.; Wang, Z.; Jia, W.; Chen, B.; Chen, C.; Shahidehpour, M. Multiperiod distribution system restoration with routing repair crews, mobile electric vehicles, and soft-open-point networked microgrids. IEEE Trans. Smart Grid 2020, 11, 4795–4808. [Google Scholar] [CrossRef] [Scilit]
- Thirumalai, M.; Hariharan, R.; Yuvaraj, T.; Prabaharan, N. Optimizing distribution system resilience in extreme weather using prosumer-centric microgrids with integrated distributed energy resources and battery electric vehicles. Sustainability 2024, 16, 2379. [Google Scholar] [CrossRef] [Scilit]
- Yan, M.; Shahidehpour, M.; Paaso, A.; Zhang, L.; Alabdulwahab, A.; Abusorrah, A. Distribution system resilience in ice storms by optimal routing of mobile devices on congested roads. IEEE Trans. Smart Grid 2020, 12, 1314–1328. [Google Scholar] [CrossRef] [Scilit]
- Yuan, X.; He, X. Enhancement strategy for port resilience: Shipping route optimization methods based on network characteristics of ports. J. Mar. Sci. Eng. 2025, 13, 325. [Google Scholar] [CrossRef] [Scilit]
- Chen, X.; Hu, R.; Luo, K.; Wu, H.; Biancardo, S.A.; Zheng, Y.; Xian, J. Intelligent ship route planning via an A∗ search model enhanced double-deep Q-network. Ocean Eng. 2025, 327, 120956. [Google Scholar] [CrossRef] [Scilit]
- Wen, S.; Jin, X.; Zheng, Y.; Wang, M. Probabilistic coordination of optimal power management and voyage scheduling for all-electric ships. IEEE Trans. Transp. Electrif. 2023, 10, 3661–3669. [Google Scholar] [CrossRef] [Scilit]
- Zimmerman, R.D.; Murillo-Sánchez, C.E.; Thomas, R.J. MATPOWER: Steady-state operations, planning, and analysis tools for power systems research and education. IEEE Trans. Power Syst. 2010, 26, 12–19. [Google Scholar] [CrossRef] [Scilit]

Disclaimer/Publisher’s Note: The statements, opinions and data contained in all publications are solely those of the individual author(s) and contributor(s) and not of MDPI and/or the editor(s). MDPI and/or the editor(s) disclaim responsibility for any injury to people or property resulting from any ideas, methods, instructions or products referred to in the content. |
© 2026 by the authors. Licensee MDPI, Basel, Switzerland. This article is an open access article distributed under the terms and conditions of the Creative Commons Attribution (CC BY) license.