


Abstract
The rapid expansion of aquaculture necessitates the development of advanced technologies to enhance the stability and survivability of deep-sea aquaculture platforms. This study investigates the hydrodynamic performance of a trussed semi-submersible aquaculture cage (TSAC) through comprehensive wave tank experiments. A 1:32 scaled-down prototype was manufactured and used to evaluate key hydrodynamic characteristics, including the natural frequency, radiation damping, horizontal mooring stiffness, Response Amplitude Operator (RAO), and mooring force, under regular wave excitation. Experimental results indicate that the pitch RAO can reach a value of up to under high-wave conditions, and the windward-side mooring forces exhibit periodic fluctuations while others remain almost stable. The results provide critical data for the development of high-fidelity numerical models and offer practical insights for the optimal design and deployment of large-scale deep-sea aquaculture platforms, contributing to the advancement of sustainable marine aquaculture technologies.
1. Introduction
Global population growth and land-based resource constraints have exacerbated the problem of food shortages, particularly in terms of protein resources. To address this challenge, obtaining more marine protein resources has become an important strategy, with the rapid expansion of nearshore and offshore aquaculture being particularly critical [1,2,3]. However, traditional nearshore aquaculture faces bottlenecks such as spatial restrictions, environmental pollution, and limited varieties, making it challenging to meet the market demand for seafood on a large scale and with a high standard of quality. Consequently, deep-sea offshore aquaculture has received extensive attention as an emerging field, and numerous concepts for aquaculture platforms have been proposed, e.g., deep-sea aquaculture cages and aquaculture vessels [4].
The research and development relating to aquaculture platforms have received extensive attention worldwide [5], particularly since the 1990s, with notable developments in countries such as Norway, the United States of America, Japan, and China. Norway has established a comprehensive industrial chain system in the domain of deep-sea aquaculture. In 2017, Norway achieved a significant milestone with the successful development and deployment of the world’s first ultra-large floating deep-sea steel aquaculture cage, designated “Ocean Farm 1” [6]. With a farming capacity of 250,000 , this innovation signalled a new era in deep-sea aquaculture equipment and technology. In 2020, Norway launched the semi-submersible aquaculture platform “Havfarm 1” [7], which significantly improved the stability of the equipment under harsh sea conditions. The United States of America has also made notable advancements in deep-sea aquaculture technology. Since the “Aquapod” [8], which was proposed in the early 2000s, the United States of America has continued to promote deep-sea aquaculture technology in terms of environmental protection, sustainable development, and intelligent management through the Aquaculture Innovation Center (AIC) and “Kampachi Farms” and other institutions and enterprises. Japan has developed a distinct technological system tailored to its geographical environment. The development of deep-sea aquaculture cage technology in Japan has undergone a systematic evolution, progressing from simplicity to complexity and from small scale to large scale. China, a comparatively recent entrant into this domain [9], is undergoing rapid and substantial development. “Deep Blue No. 1”, measuring 60 in diameter and 35 in height, was deployed to commence operations from 2018, while “Deep Blue No. 2” was deployed in the open sea in 2024, and “Dehai farm 1” was manufactured in 2018 and is still under commercial operation. These exemplify China’s notable advances in the domain of large-scale deep-sea aquaculture cage technology [10]. Additionally, other coastal countries such as Chile, Brazil, Canada, Australia, New Zealand, and South Korea are actively developing deep-sea aquaculture cage technology to address the dual challenge of increasing global food demand and protecting the environment [11].
Both the aquaculture cage and the aquaculture vessel can be equipped with automatic machines and intelligent tools, enabling large-scale intensive aquaculture to improve production efficiency. Additionally, with the strong positioning capability of the employed mooring system, floating aquaculture platforms can resist extreme wind, waves, and currents in the offshore environment [12]. Compared with the aquaculture vessel, the deep-sea aquaculture cage is more cost-effective, and thus is widely adopted and utilized [13,14,15]. Several aquaculture cages have been successfully manufactured and operated in the open sea, benefiting from the established expertise of the shipbuilding industry. However, their hydrodynamic performance, which fully considers the coupling of the mooring system and net, has not been fully addressed or deepened. To address this, two widely employed approaches for investigating the hydrodynamic performance of aquaculture cages in a deep-sea environment are numerical simulations and wave tank experiments [16,17].
Multiple studies have advanced the numerical simulations of aquaculture platform hydrodynamics. Miao et al. [18] calculated the loads on a semi-submersible offshore aquaculture platform based on three-dimensional potential flow theory and calculated the kinematic response and mooring force by an indirect time-domain method. Ma et al. [19] employed the boundary element method (BEM) and a collective mass model to numerically simulate the dynamic response of a hinged multi-body floating-type aquaculture platform in regular waves. Zhuang et al. [20] performed numerical calculations of the motion response of a moored platform at different wave positions using a high-order spectral computational fluid dynamics method, with results showing that the maximum heave and surge motions do not occur at the location of maximum wave height. Martin et al. [21] examined the hydrodynamic response of a semi-submersible aquaculture platform by integrating computational fluid dynamics (CFD) and the collective mass method (CMM). Although these numerical methods effectively simulate hydrodynamic behavior across diverse operating conditions, their predictions for coupled net and mooring system responses under complex waves contain significant errors (often exceeding 10%) [21].
Physical experiments are a more reliable method for studying the dynamic behavior of coupled net and mooring system responses under extreme waves. As presented in [22,23,24], these experiments visually reflect changes in cage displacement and mooring loads, providing a validation basis for numerical simulation studies. At the beginning of the 20th century, experimental studies on physical models of mooring systems primarily focused on nearshore or offshore aquaculture [25]. With the growing demand for deep-sea aquaculture, research on mooring systems has gradually shifted to the deep-sea environment [26,27,28]. Zhao et al. [29] conducted scaled-down physical experiments on the “Ocean Farm 1” deep-sea aquaculture cage (with a 42 mooring layout, equipped with eight steel chains) to investigate the impacts of the wave factor, the net, and the draft on the mooring force and the motion characteristics of the aquaculture cage. The follow-up study developed a numerical model and investigated the motion responses of “Ocean Farm 1” in waves and currents [30]. In an experimental study of the semi-submersible truss-structured large-scale intelligent aquaculture cage “Dehai farm 1”, Huang et al. [10] compared the mooring forces of three single-point moorings using a scaled-down model. They also analyzed the platform’s motion and the change of the mooring force in waves and currents. A 1:30 scaled experimental model [31] was designed using a modeling method combining gravity similarity and net scaling, and the effects of wave height, wave period, and draft depth on the mooring force of the steel chain, as well as the kinematic response of the platform under the combined excitation of water and wave current, were investigated. In contrast, Bi et al. [32] designed a mooring system comprising 36 steel mooring chains for a multi-module-coupled floating aquaculture platform. They conducted a 1:40 scaled hydrostatic attenuation test and a regular wave excitation experiment. The findings of these physical experiments have the potential to provide valuable insights into the dynamic behavior of nets in complex marine environments. Physical experiments remain the most reliable approach for investigating the performance of deep-sea aquaculture platforms due to their strong flexibility and reliable feasibility. Sufficient physical test data can not only provide direct references for engineering design but also offer essential support for the verification and improvement of numerical models.
This study experimentally investigates the hydrodynamic performance of a trussed semi-submersible aquaculture cage (TSAC) under regular wave conditions, with a primary focus on survivability-related parameters essential for the engineering design and operational safety of deep-sea aquaculture platforms. To ensure accurate extrapolation of experimental data for performance prediction and optimization of the full-scale structure, a 1:32 scaling ratio was strictly maintained based on Froude scaling [33]. The scaled-down physical model corresponds to a prototype currently in successful commercial operation in the South China Sea. Through systematic wave tank testing, three key aspects were examined: the identification of resonance frequencies to prevent resonant responses under typical environmental loads, the quantification of motion amplitudes via Response Amplitude Operators (RAOs) to evaluate platform stability for long-term operation and maintenance, and the characterization of mooring forces under extreme wave scenarios to inform mooring system design and structural integrity verification. The obtained results provide reliable experimental data for the validation of numerical models and deliver an essential test basis for the survivability-oriented design and optimization of large-scale semi-submersible aquaculture platforms, thereby supporting the advancement of robust and sustainable offshore aquaculture technologies.
The paper is organized as follows: Section 2 describes the details of the scaled-down model of the TSAC that was utilized for the experiments. Section 3 delineates the water tank experiments and the key data measured, including the Calm-water decay test, the RAO test, and the mooring force test. The ensuing discussion in Section 4 provides a thorough examination of the experiment outcomes.
2. Experiment Model
2.1. Full Scaled Model
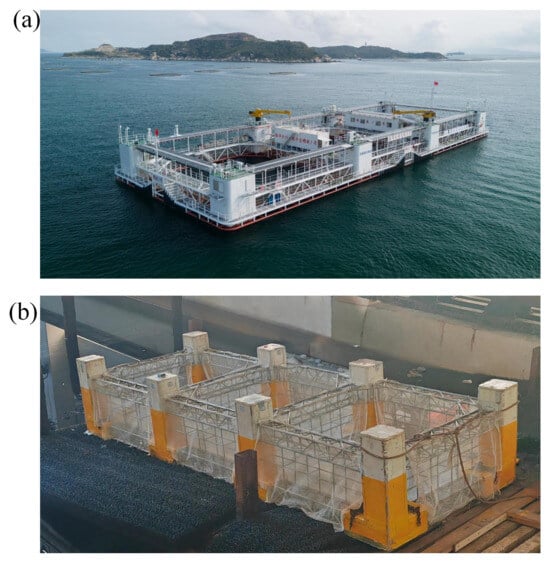
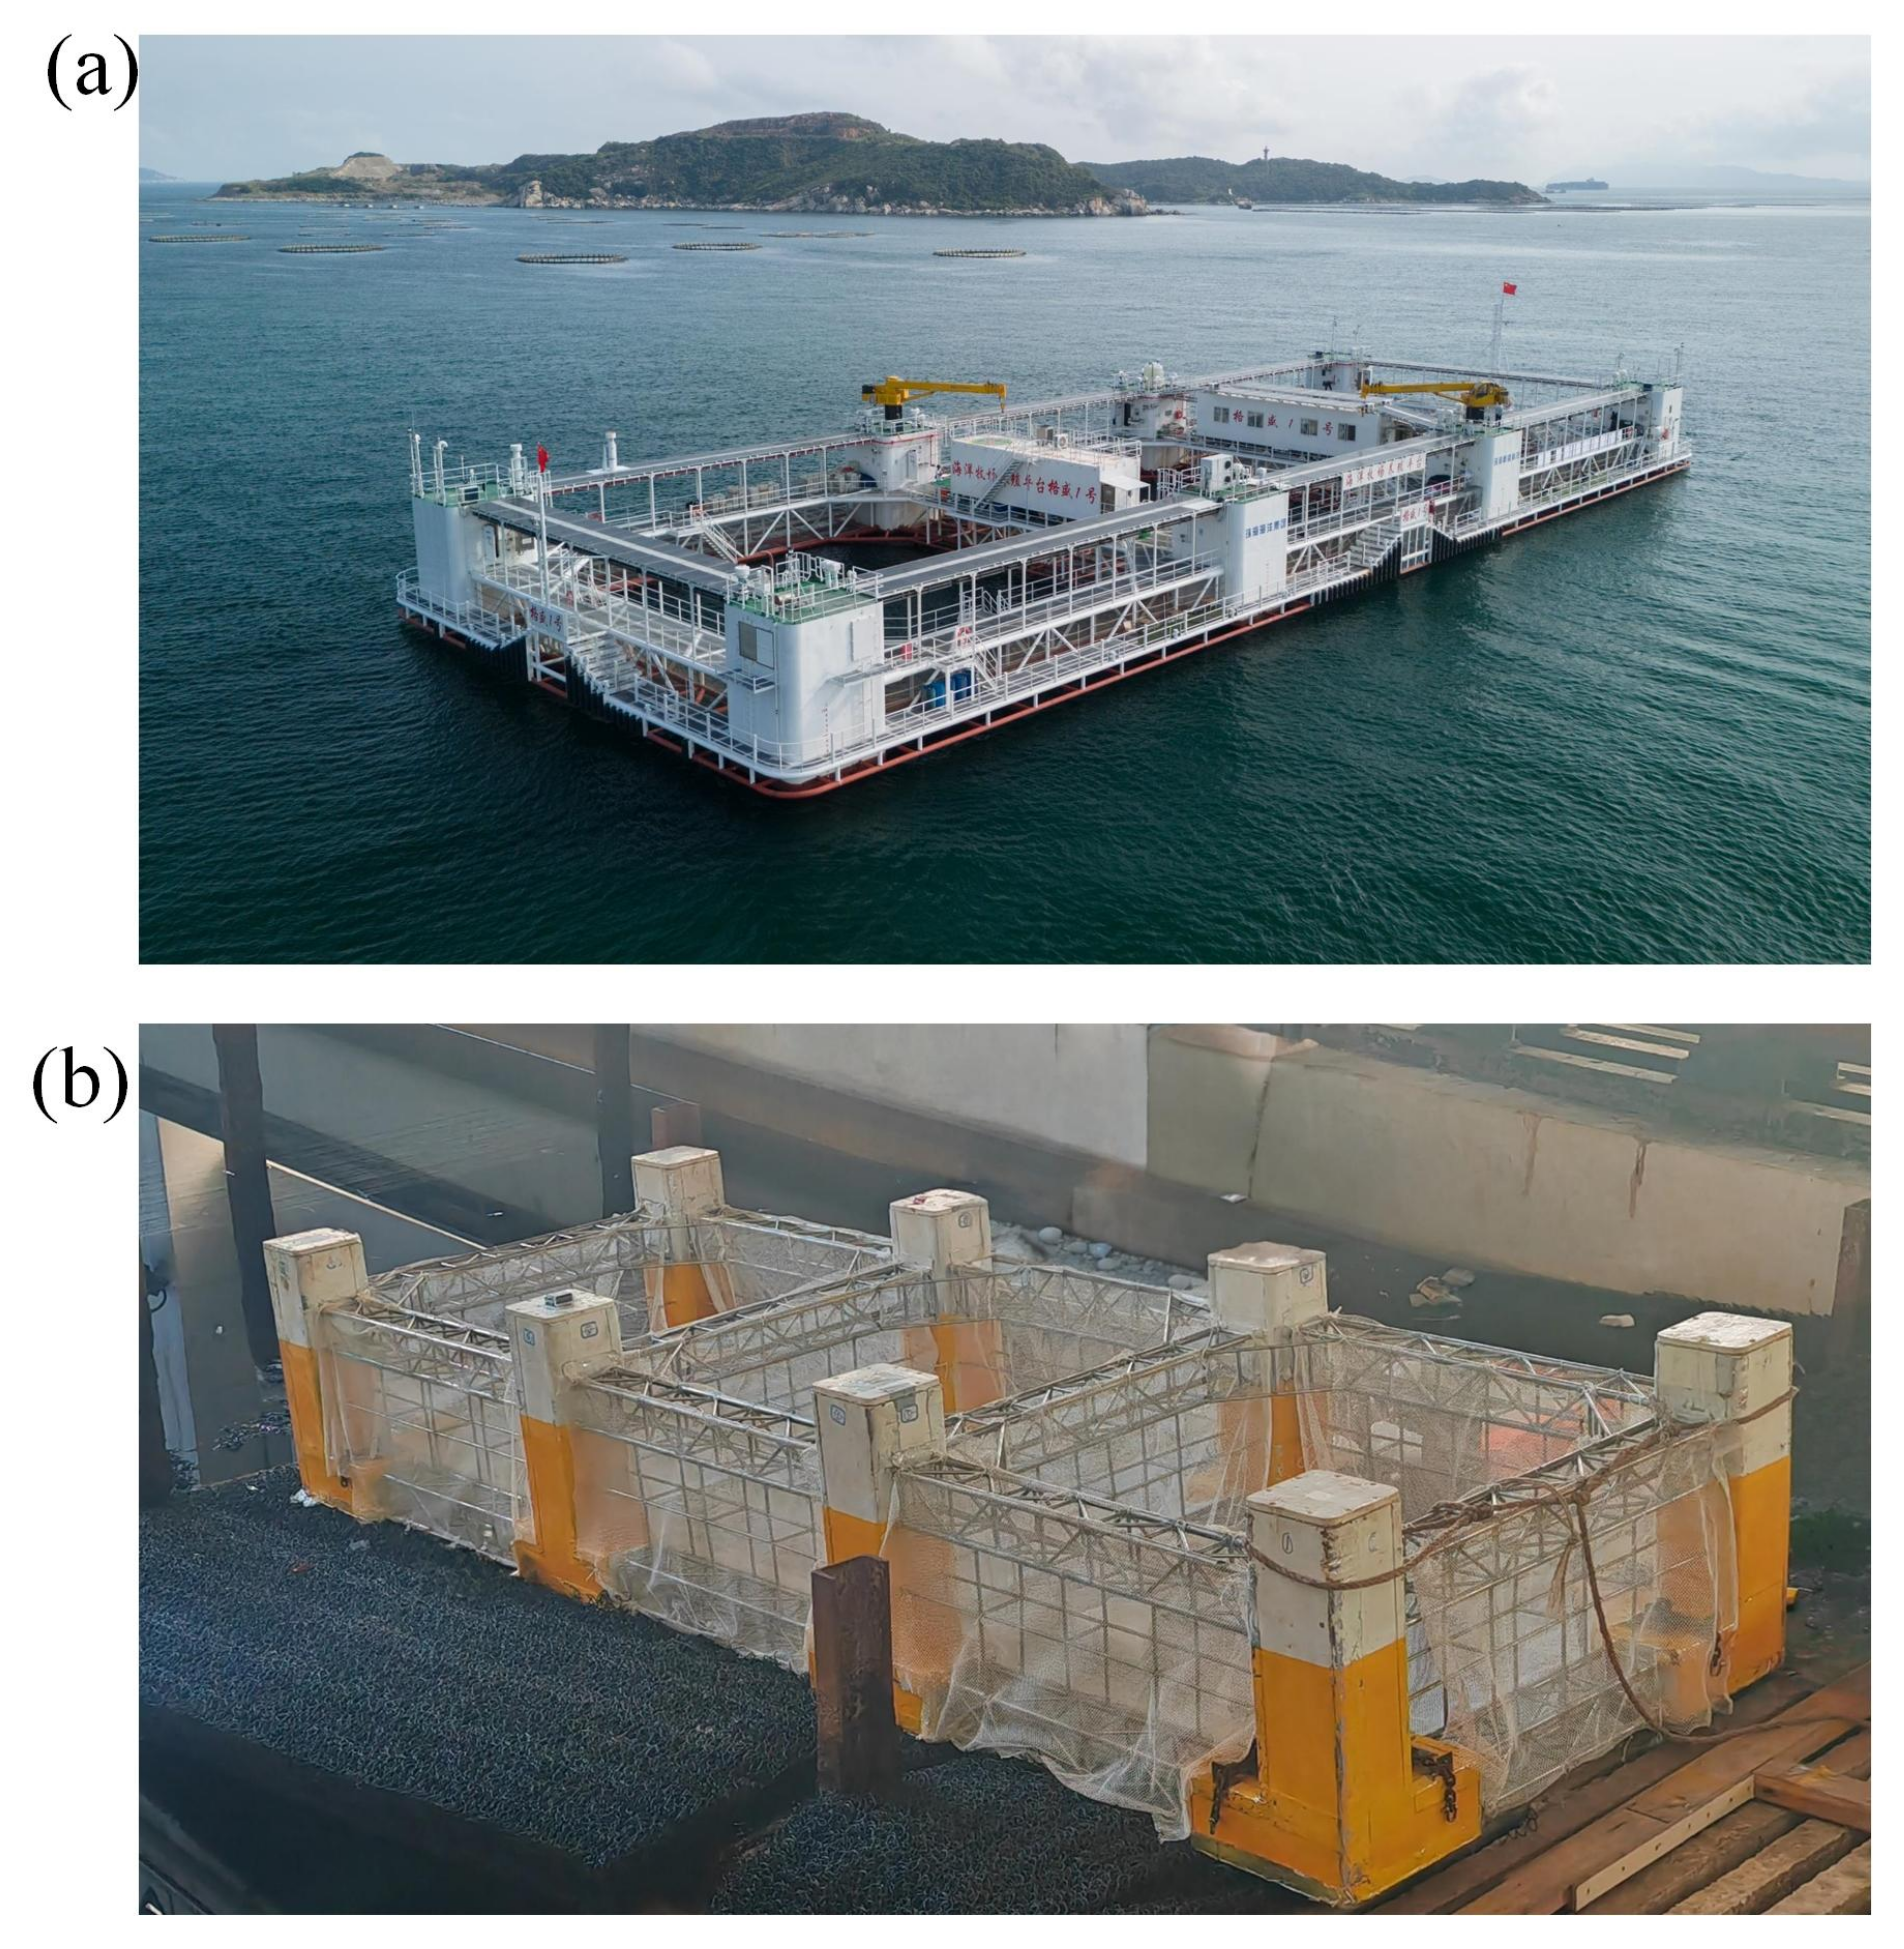
This study focuses on a TSAC suitable for the deep-sea environment. The full-scale model is designated as illustrated in Figure 1a. Table 1 lists the detailed parameters of the full-scale TSAC and the scaled-down prototype. While full-scale prototypes have demonstrated operational viability in real-sea conditions, systematic experiments of scaled-down prototypes provide critical insights for numerical model calibration and mechanistic studies of hydrodynamic performance. The dimensions of the full-scale TSAC are , with a designed draft depth of and an effective volume of . The vertical center of gravity is located 4.4 m above the baseline of the model bottom. The primary structure is mainly supported by eight columns, with a ballast water volume of approximately 205 . The TSAC utilizes a four-corner mooring system, which is secured to the seabed under various wind and wave conditions. Each corner is connected by two R3-grade gearless anchor chains with the following specifications: an actual diameter of 64 , a line density of −1 in air, an axial stiffness of , and a minimum breaking load of 3552 . The pre-tension of each mooring line is 17 kN. The TSAC features a double-layer net structure comprising the side net, bottom net, and separator net, all of which are made of ultrahigh-molecular-weight polyethylene fibers, with a designed net inner diameter of 8 .
Figure 1.
The developed concept: (a) full-scale prototype in open-sea commercial operation; (b) scaled-down prototype used in experiments.
Table 1.
Component parameters of the full-scale TSAC.
2.2. Froude Scaling
The scaled model in this experimental study was designed and manufactured based on the Froude similarity criterion. The Froude number, defined as the ratio of inertial force to gravitational force, serves as the fundamental criterion for simulating gravity-dominated phenomena in wave–structure interactions:
where V is the characteristic velocity (m/s), g is the gravitational acceleration (m/s2), and L is the characteristic length (m). Froude similarity requires equality of the Froude number between model and prototype:
Based on this condition, the scaling relationships for various physical quantities can be derived [34]. Defining the length scale ratio as , the scaling ratios for key physical quantities are presented in Table 2.
Table 2.
Scaling ratios of physical quantities based on Froude similarity (prototype/model).
Viscous forces are governed by the Reynolds number, whose scaling ratio differs from that of the Froude number [34]:
This indicates that viscous damping is not similar between the model and prototype. In this study, the damping coefficient of the model itself was precisely measured through free-decay tests. The purpose was not to directly extrapolate to the prototype, but to provide a calibration benchmark for numerical models.
2.3. Scaled-Down Model
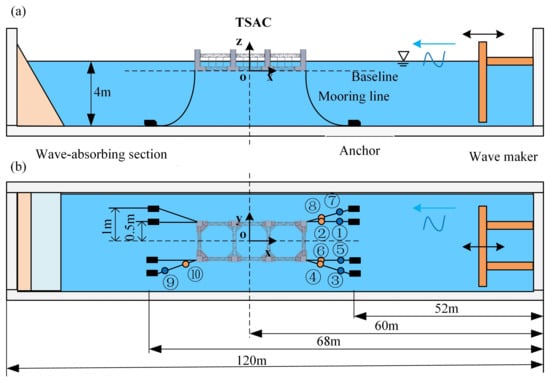
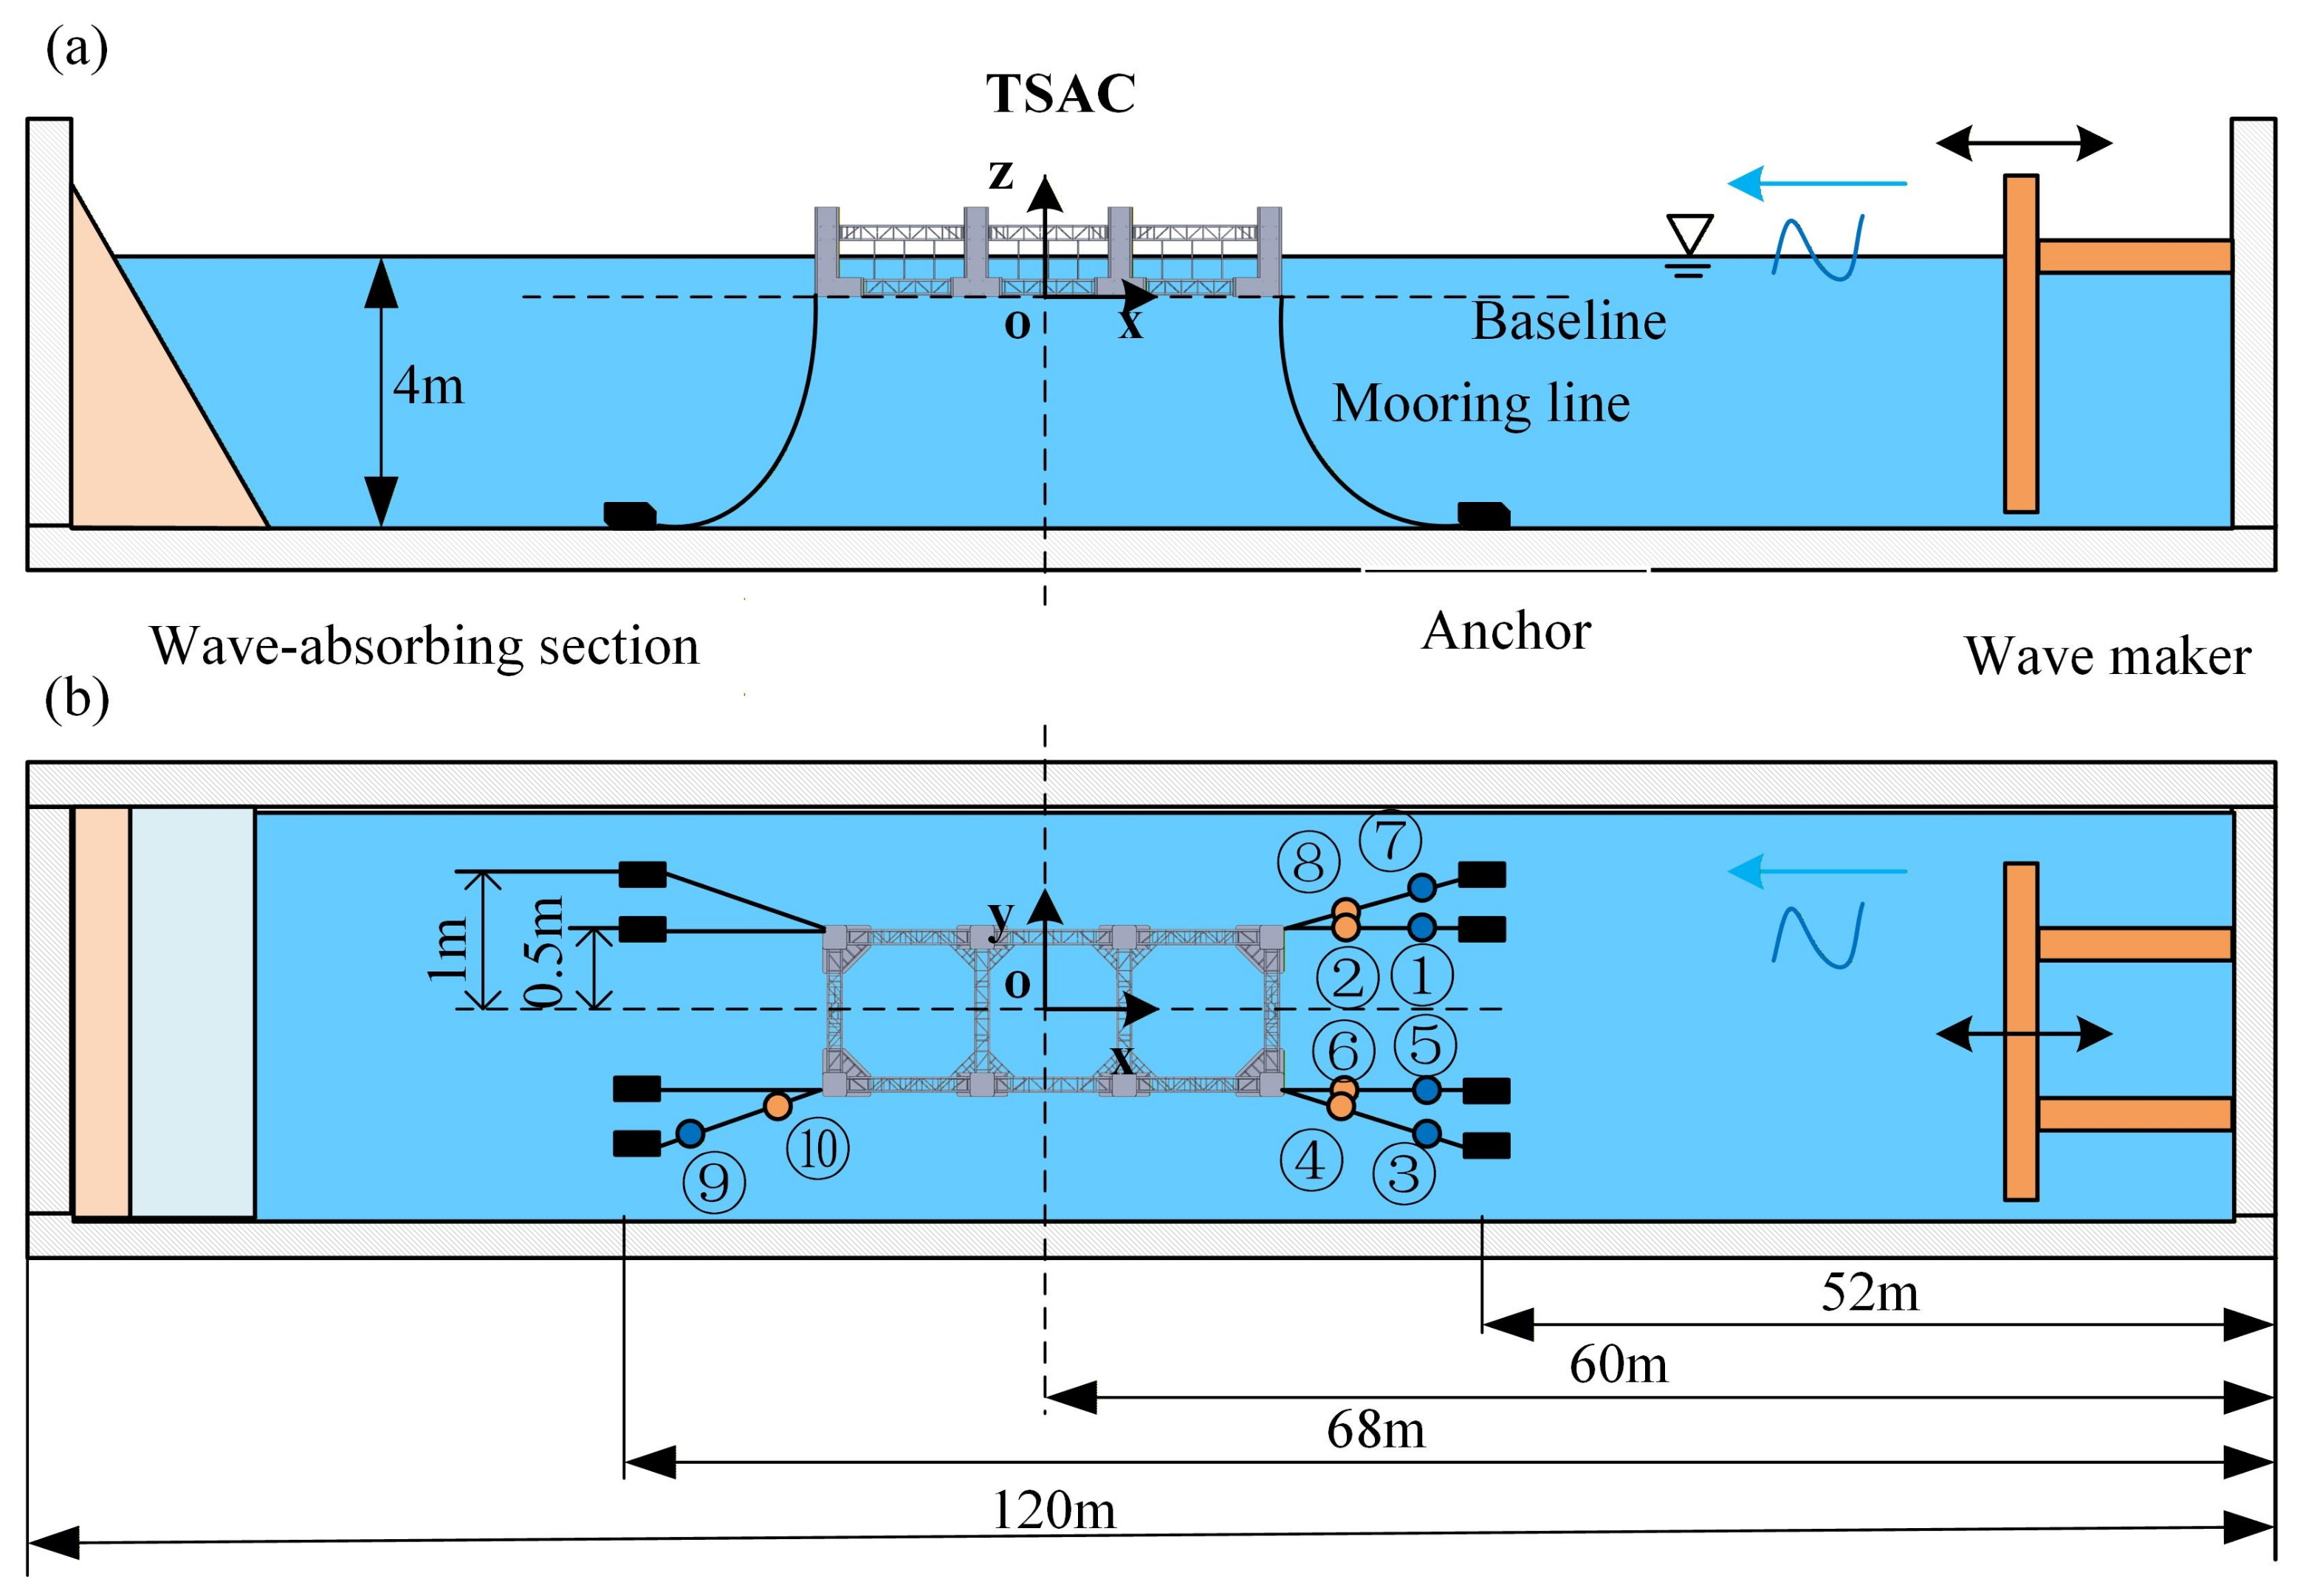
Figure 1b demonstrates the scaled-down prototype, for which a Froude scaling of 1:32 was employed. Table 3 lists the detailed parameters of the scaled-down prototype. The coordinate system used is referenced in Figure 2. The scaled-down prototype employed in this study comprises a rectangular aquaculture space formed by connecting columns and trusses, and the scaled-down prototype has a length of , a width of 1000 , a height of , and a vertical center gravity of 137.5 mm from the baseline. To effectively reflect the hydrodynamic performance of the TSAC, the structural features and mechanical characteristics of the prototype are strictly designed and retained according to the scaling rules. The scaled-down physical prototype employs a four-corner mooring system, and each corner has two mooring chains, as shown in Figure 2. The anchoring system comprises eight groups of anchor blocks, where each group consists of two 25 kg standard weights connected in parallel. The anchor blocks are connected to the corresponding mooring chain. It should be noted that, in the scaled mooring system, chains with a line weight of m−1 and a diameter of 4 were actually selected, compared to the theoretical values of −1 and 2 , respectively. This is because chains with a 2 diameter lack sufficient mechanical strength and are highly prone to deformation or even fracture during commissioning and testing. Additionally, the small size of 2 chain links makes it difficult to proportionally scale down connecting components (e.g., shackles) when attaching them to the model, sensors, and anchor blocks. Therefore, to ensure the structural integrity and operational feasibility of the model system throughout the testing process, 4 diameter chains with adequate mechanical strength and reliable connectivity were chosen. As illustrated in Table 3, except for a maximum discrepancy of between the outer diameter of the truss straight tube and the theoretical value, all other parameters were within a margin of error, which ensured the scaled-down accuracy of the model to the greatest extent possible.
Table 3.
Parameters of the scaled-down prototype without and with ballast.
Figure 2.
Schematic diagram of wave tank and prototype arrangement: (a) side view; (b) top view.
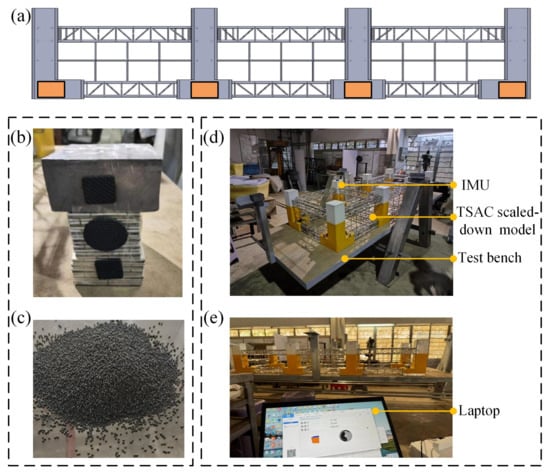
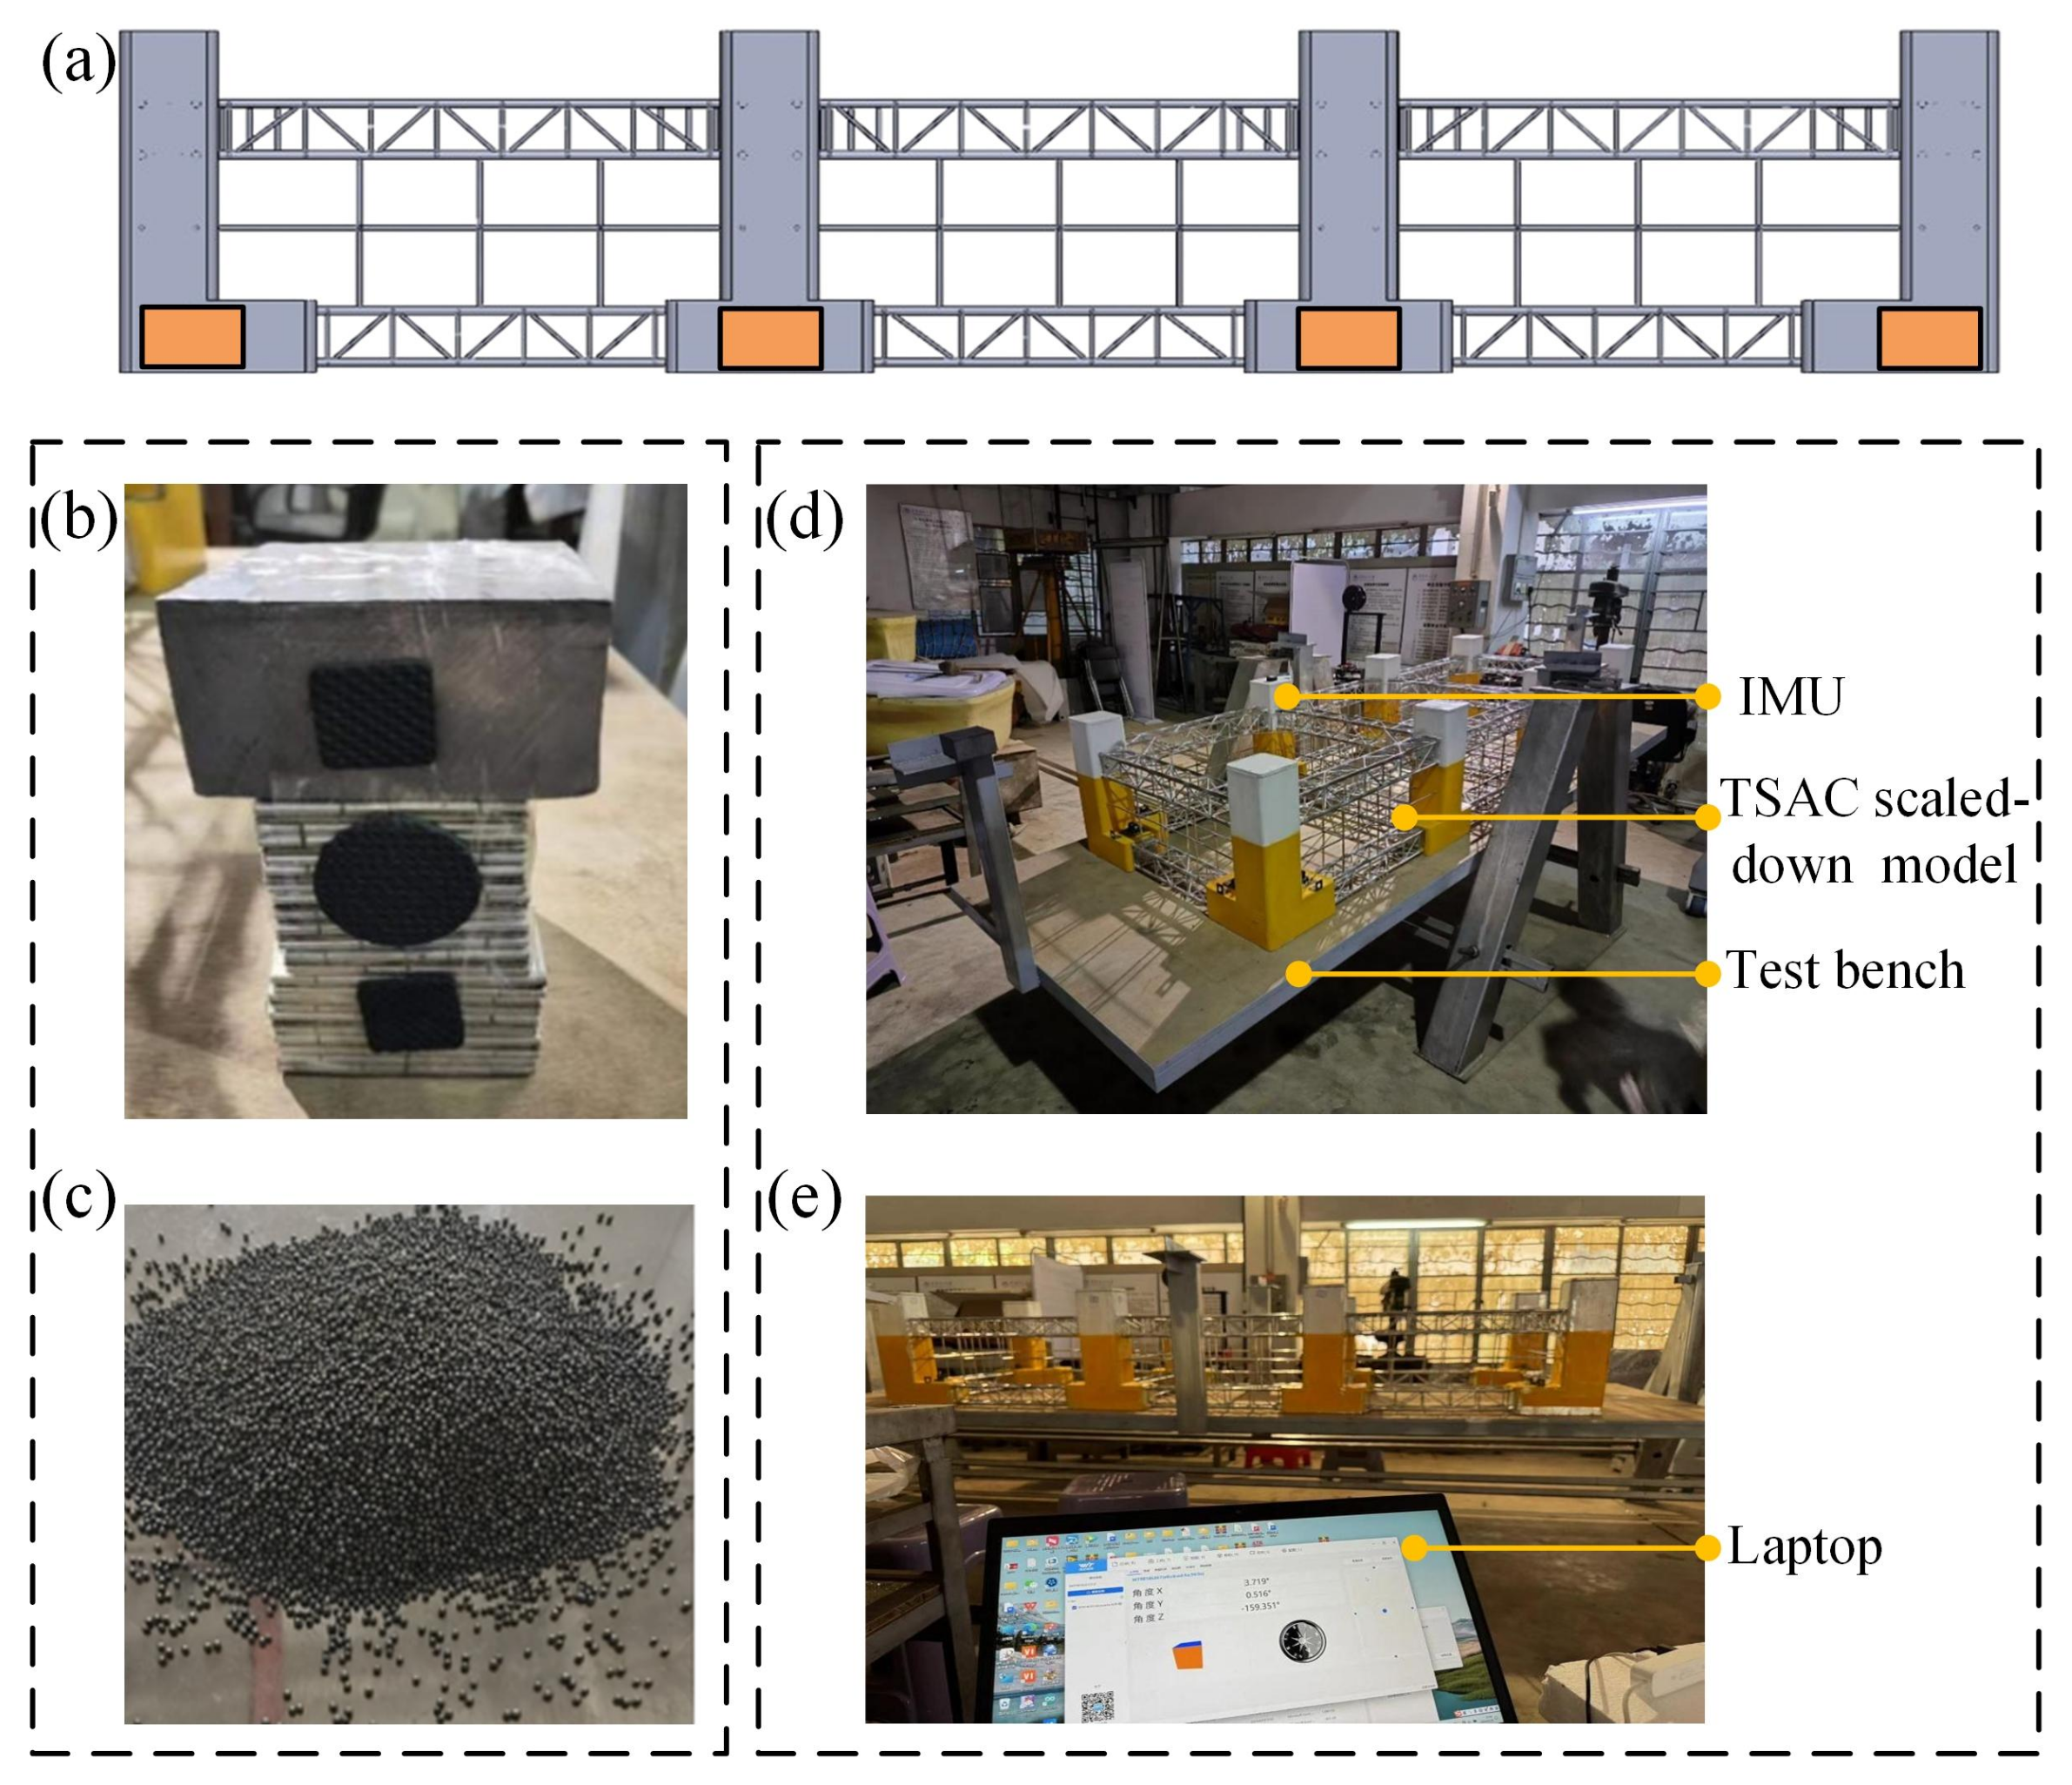
More importantly, the prototype was not only strictly scaled in terms of geometric dimensions, but also strictly calibrated in terms of inertia-related parameters. As shown in Figure 3, an inertia tuning test rig was employed to accurately achieve the desired inertia-related parameters for the scaled-down prototype. Table 3 presents the desired and measured mass, the center of gravity, and the moment of inertia of the scaled-down prototype, and numerical computation and fine-tuning were repeatedly employed to find the optimal mass and position of ballast. The results show that the maximal error for each parameter was less than , except for in the case of the netting and mooring system.
Figure 3.
(a) Schematic diagram of ballast tank locations, (b,c) the ballast materials employed, (d) the test rig for moment of inertia, and (e) the laptop for the test rig.
3. Experimental Setup
The physical experiments were conducted on the scaled-down TSAC in the wave tank of South China University of Technology, Guangzhou, China. The experimental wave tank is 120 in length, 8 in width, and 4 in depth. The end of the wave tank is equipped with a sloped, energy-absorbing net to minimize the interference of wave reflection. The wave tank is equipped with a rocking-plate wave-making and measurement system capable of handling regular waves with a period ranging from to and a wave height ranging from to . The system can also generate irregular waves, including the ITTC spectrum, the ISSC spectrum, the PM spectrum, and the JONSWAP spectrum. The towing system has a speed range of to .
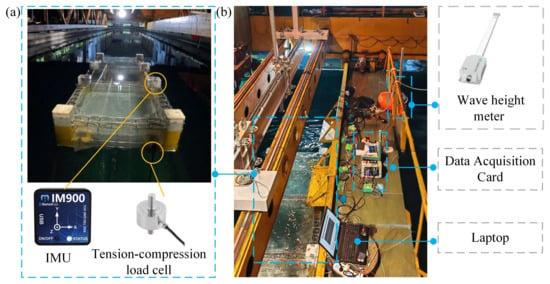
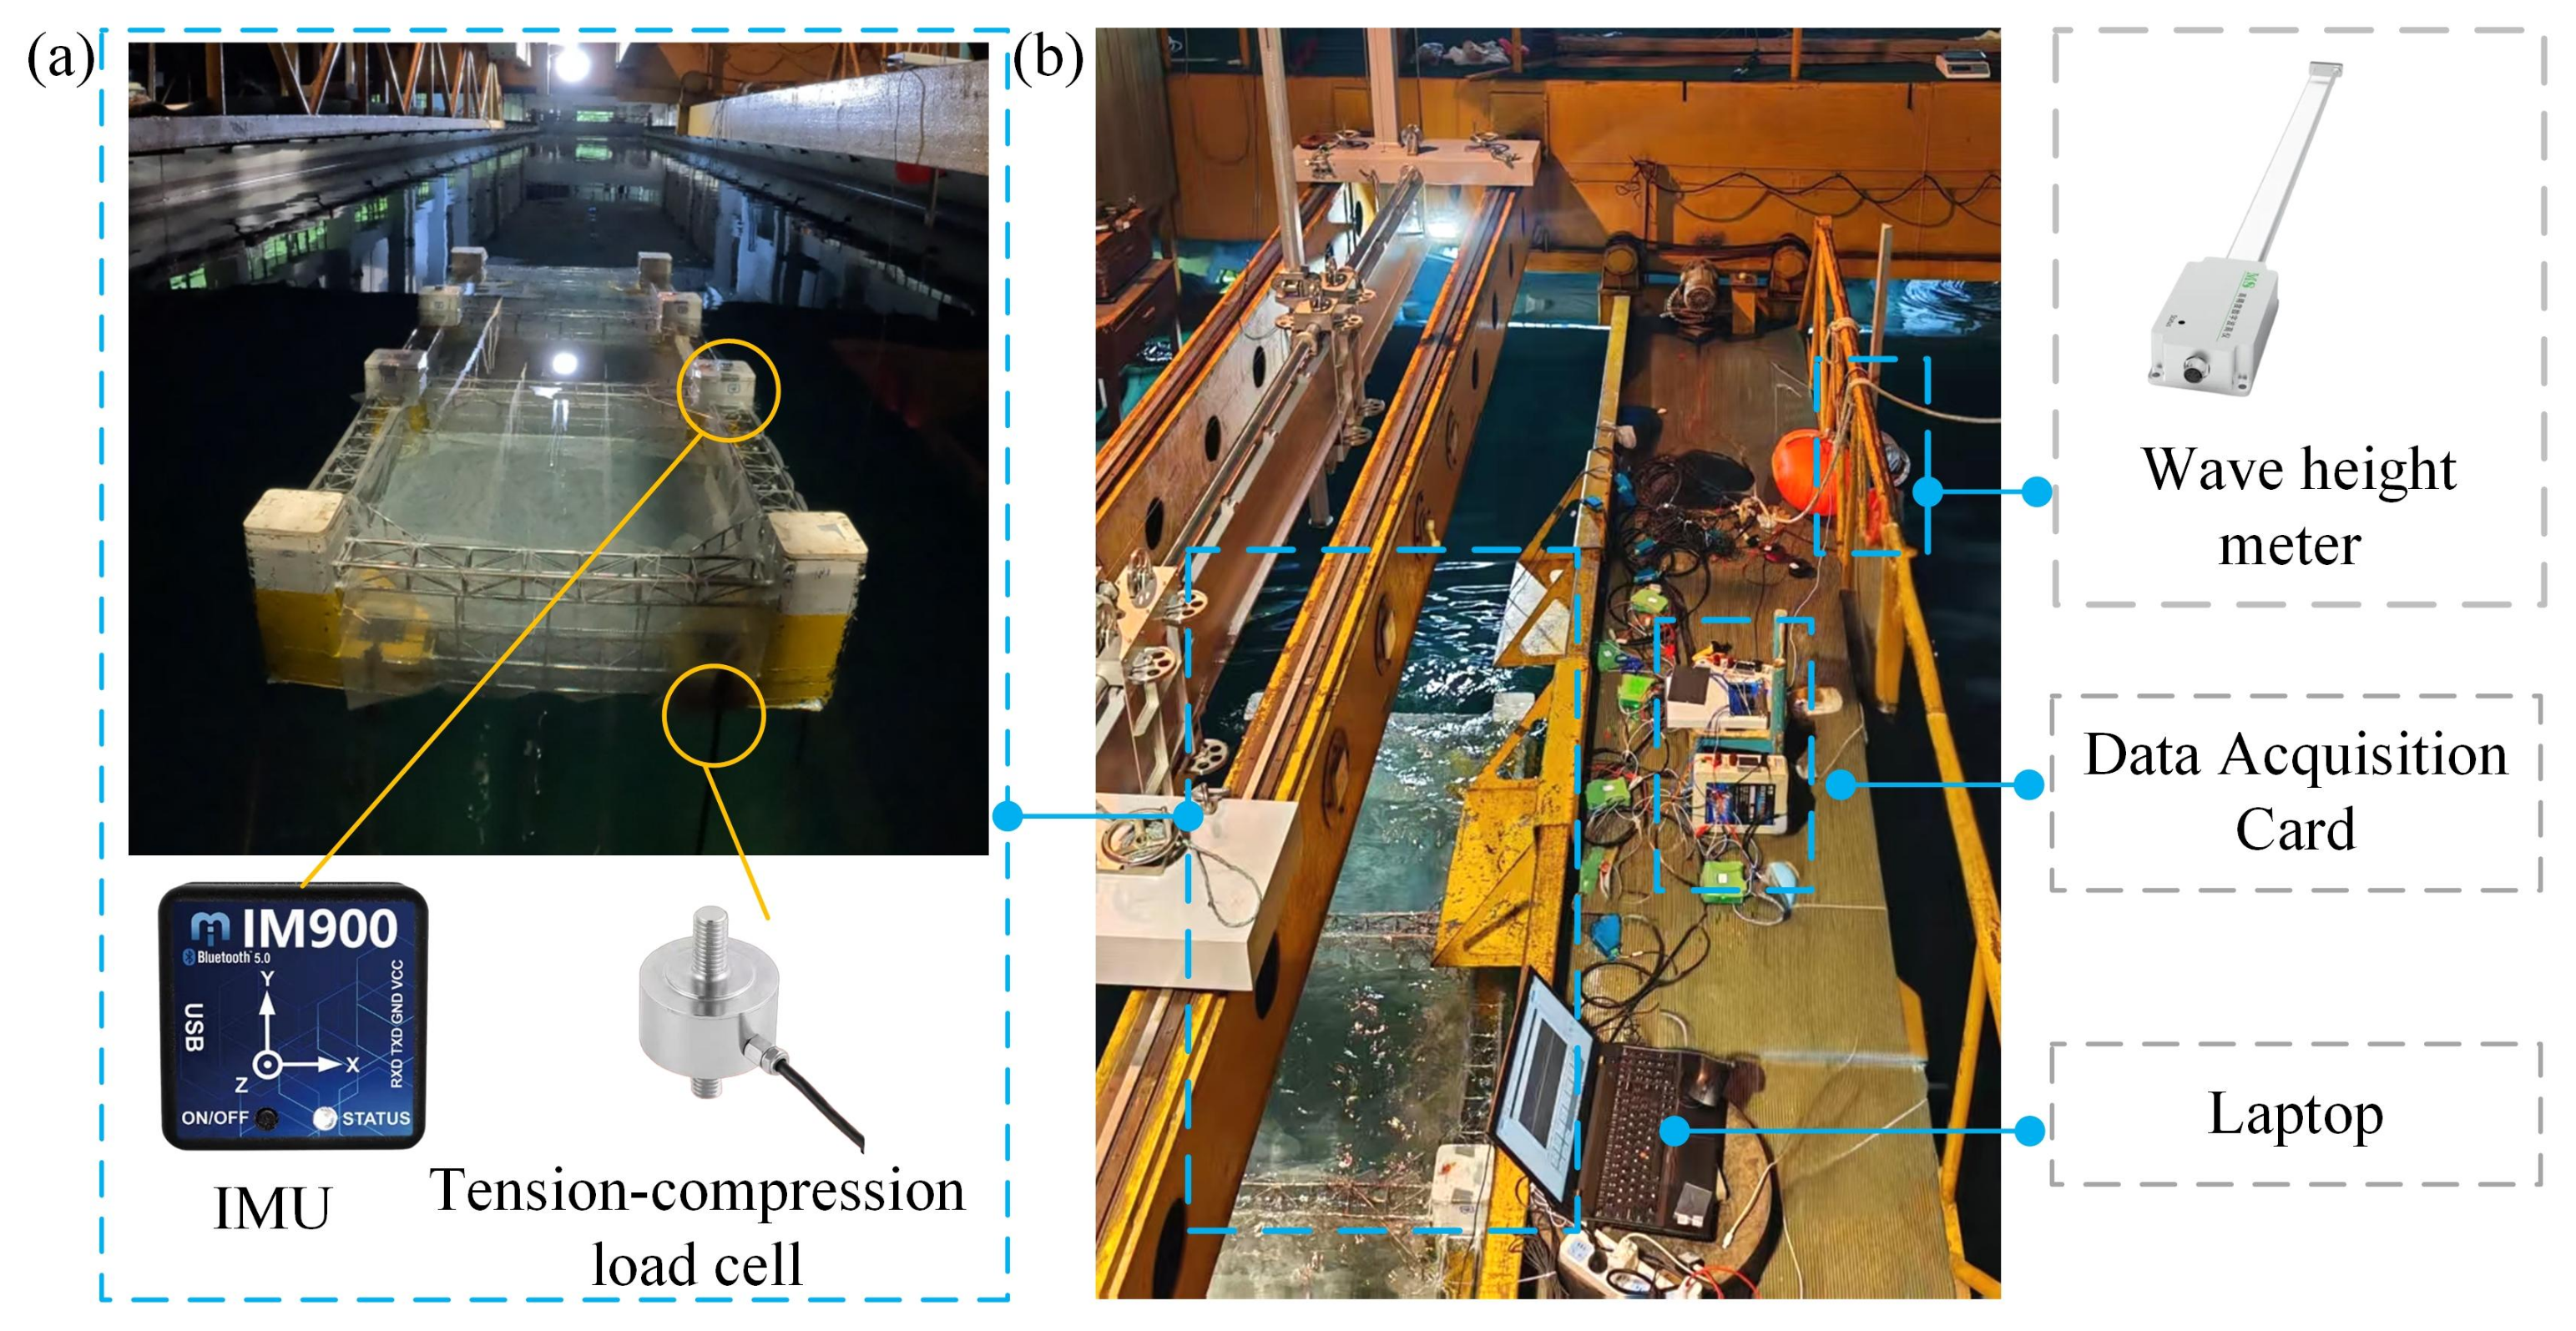
The scaled-down prototype was arranged at a distance of 68 from the wave-making end, as illustrated in Figure 2. It was situated at the center of the wave tank, in the direction perpendicular to the wave propagation direction. The mooring system was symmetrically distributed around the center of the model in the x-direction, 8 from the model in both the front and back. The propagation direction of incident waves was aligned with the x-direction of the TSAC coordinate system. The configuration of the mooring system is delineated in Figure 4. A data acquisition system and a laptop computer for real-time monitoring and recording of sensor data were placed on the trailer.
Figure 4.
Experimental setup: (a) the scaled-down prototype and sensors; (b) the measuring system.
3.1. Calm-Water Free-Decay Test
The free-decay test employed was a methodical procedure that involved examining the natural frequencies and damping coefficients in the roll and pitch directions of the scaled-down TSAC prototype. During the free-decay test, the Inertial Measurement Unit (IMU, model number: WT901SDCL, accuracy: 0.2 degrees), sampling at 10 Hz, was used to measure the rotational displacement of the prototype, a high-precision data acquisition card was employed to collect input data from each sensor simultaneously, and a laptop computer was used to monitor and record the collected data. In detail, when the water surface was still, the experimenter placed the scaled-down model at an initial angle of approximately 5° (difficult to control precisely but can be measured accurately using an IMU) and allowed it to oscillate freely. The time-series motion data in the roll and pitch directions were measured using the IMU. After collecting these data, a thorough analysis was conducted to compute the damping coefficient and the natural frequency of the scaled-down aquaculture cage, where the Froude method or the Faltinsen method could be employed. The equation of motion for the TSAC in the time domain in calm water can be expressed as follows:
where M and are the mass and added mass of the TSAC, respectively. X is the displacement of the TSAC, c is the damping coefficient, and k is the hydrostatic recovery stiffness. Thus, the undamped natural frequency of the prototype can be expressed as follows:
It should be noted that, although the scaling error of the net is 8.1%, such a scaling approach leads to overestimation of both platform damping and added mass. The damping coefficient obtained from the free-decay test reflects the comprehensive damping characteristics of the model in the experimental environment. Due to the scale effects associated with viscous damping, this value cannot be directly extrapolated to full scale according to Froude’s law [35]. Its primary purpose is to serve as a critical calibration parameter for subsequent numerical models, ensuring that the numerical models can accurately reproduce the motion responses of the physical model and thereby establishing a reliable predictive tool.
3.2. Hydrostatic Stiffness Test
The horizontal mooring stiffness is a core parameter governing the capability of a moored floating system to resist environmental loads and maintain station-keeping [36]. These characteristics are critical elements in mooring system design and constitute the primary objective of this study. On the one hand, it directly governs the mean static offset of the system under sustained environmental forces (such as wind, current, and wave drift forces)—greater stiffness results in smaller offset. On the other hand, it determines the system’s natural frequency in the horizontal direction. If the low-frequency components of environmental loads approach this frequency, dangerous slow-drift resonance can be excited, leading to large-amplitude oscillations and an increased risk of mooring failure. Therefore, accurately determining the horizontal mooring stiffness is indispensable for predicting system motions, assessing resonance risks, and ensuring mooring safety [37].
Regarding vertical and rotational stiffnesses: The vertical (heave) restoring stiffness is overwhelmingly dominated by the hydrostatic waterplane area of the platform itself, which is precisely known from the scaled geometry and mass properties. The accurate direct measurement of the rotational stiffness (pitch/roll) is highly challenging and is therefore not typically obtained through direct experimental means. Considering that the contribution of the mooring system to the rotational stiffness is nonlinear, and coupled, this coupling effect is usually neglected during the preliminary design and model testing phases. Alternatively, its influence is implicitly accounted for within the global system responses, such as the RAOs [38].
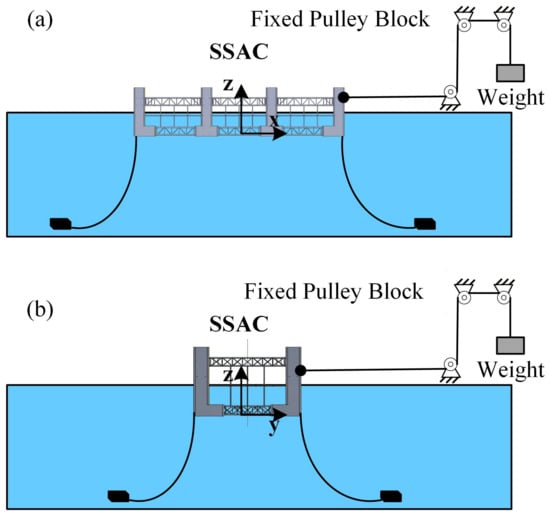
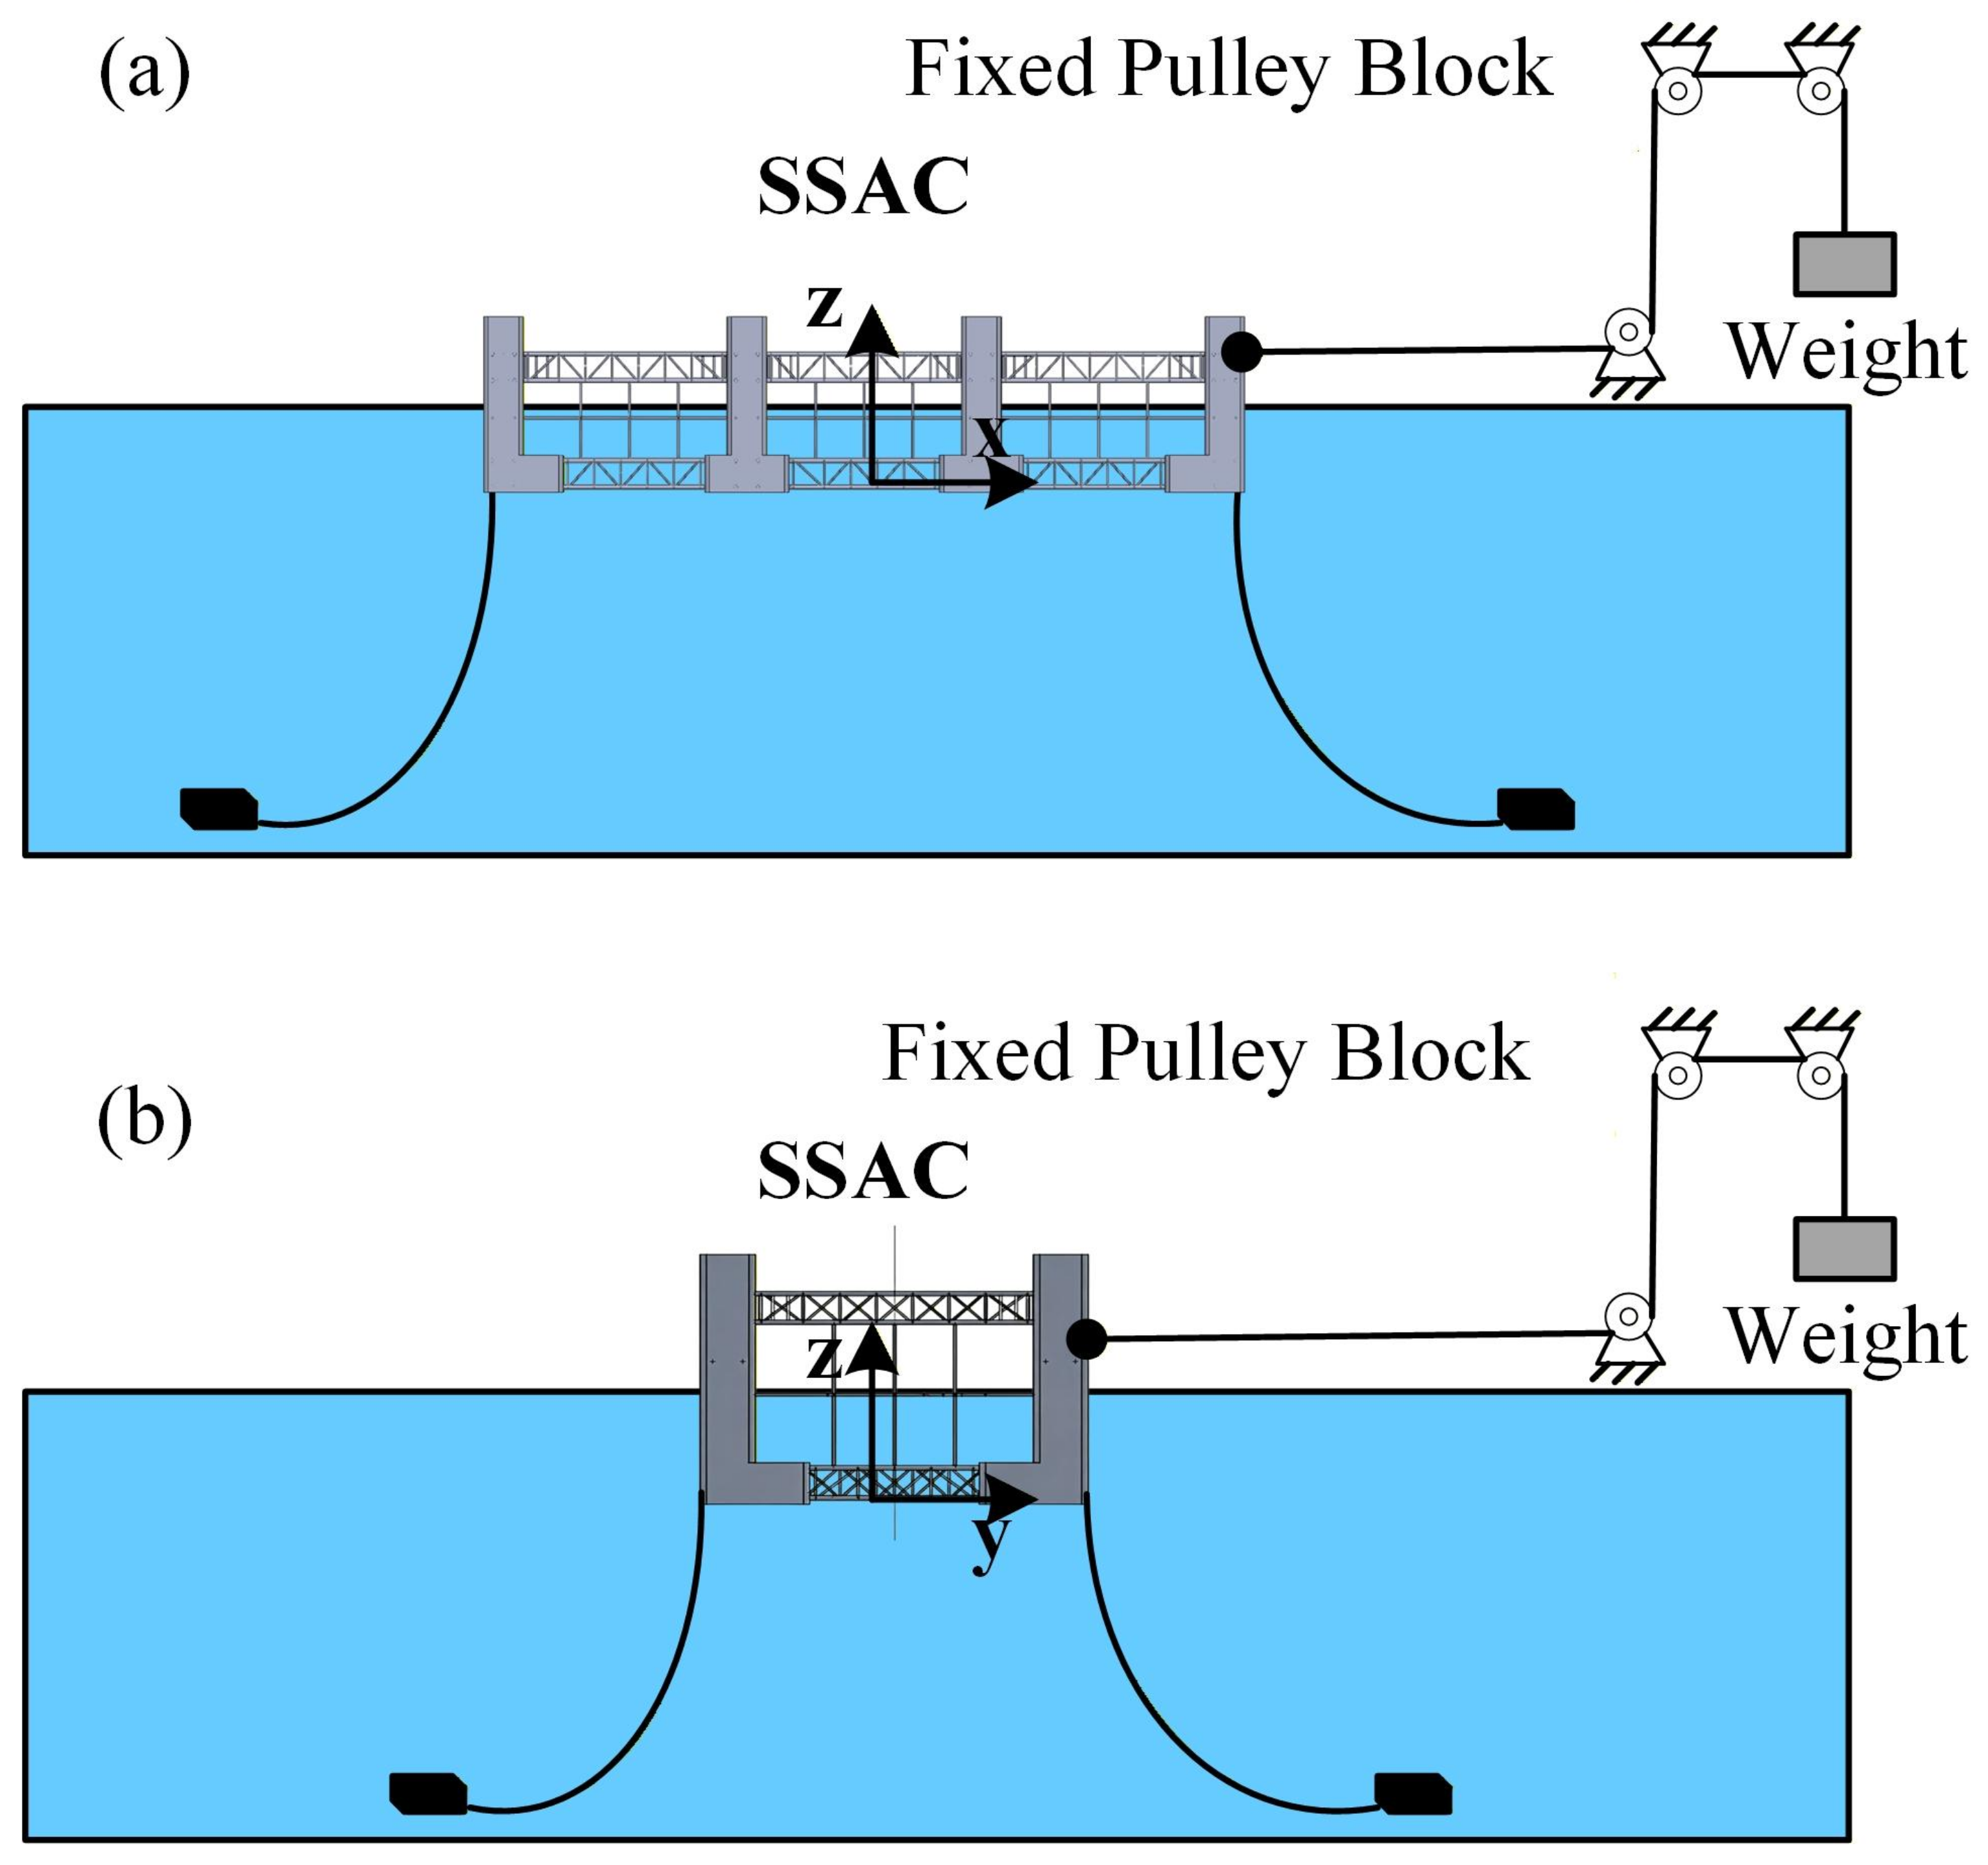
The measurement system shown in Figure 5 was employed to measure the horizontal restoring stiffness of the system. In the setup, the weight of the calibrated mass represents the horizontal force applied to the model. Prior to testing, it was ensured that the segment of the steel wire rope connected to the scaled model was horizontal. Subsequently, a calibrated mass was suspended from the free end of the wire rope, and a constant tensile force was gradually applied by lowering the mass. Under this force, the model displaced until it reached a new equilibrium position, which was recorded to determine the displacement distance. The horizontal restoring stiffness of the scaled model was then calculated. After each test, the model was reset to its equilibrium position, and the next test was conducted only after the water conditions stabilized. Finally, the horizontal mooring stiffness of the system was determined based on Hooke’s law.
Figure 5.
The principle of the stiffness test: (a) the stiffness test in the x-direction, (b) the stiffness test in the y-direction.
3.3. RAO Test
This section aims to obtain the RAO of the TSAC prototype with a mooring system. The experimental equipment comprises the following components: a tension–compression load cell (with a range of 0 to 80 kg and calibrated prior to the experiment) for measuring the mooring force, the IMU for measuring the roll and pitch motions, a high-precision data acquisition card for simultaneously collecting data from each sensor, and a laptop computer for monitoring and recording the collected data. IMUs were installed on top of the front and rear columns of the scaled-down prototype.
Regular waves were employed to excite the model, testing the platform’s response under extreme wave conditions. The selection of regular waves was based on the actual wave spectrum at the full-scale deployment site. A JONSWAP spectrum was adopted, defined as follows [36]:
where is the significant wave height, taken as 3.3 m (corresponding to 0.103 m at model scale), is the spectral peak circular frequency, is the peak spectral period, taken as 7.5 s (corresponding to 1.33 s at model scale), and is the peak enhancement factor, taken as 3.3.
For extreme wave height testing using regular waves, an extreme wave height of 1.6 to 2.2 times is generally selected [36] as the significant wave height. Accordingly, two wave heights, 0.20 m and 0.25 m, were chosen for the experiments. Wave periods ranging from 1.0 s to 2.5 s were also tested, encompassing the peak spectral period of 1.33 s.
Prior to testing, the model was moored at the center of the wave basin. An IMU was used to monitor its attitude. After confirming that the horizontality of the model’s upper plane had reached an acceptable tolerance, all service vessels were cleared from the water surface. Once the water surface became calm, wave generation was initiated.
During the experiment, the IMU data and the incident wave data were collected synchronously. A post analysis of the aforementioned multi-source data was performed to obtain the RAO curves of the prototype in the roll and pitch directions. The RAO represents the ratio of a structure’s motion response amplitude to the regular incident wave amplitude, defined as follows:
where is the amplitude of the aquaculture cage’s motion, and is the amplitude of the regular incident wave.
3.4. Mooring Force
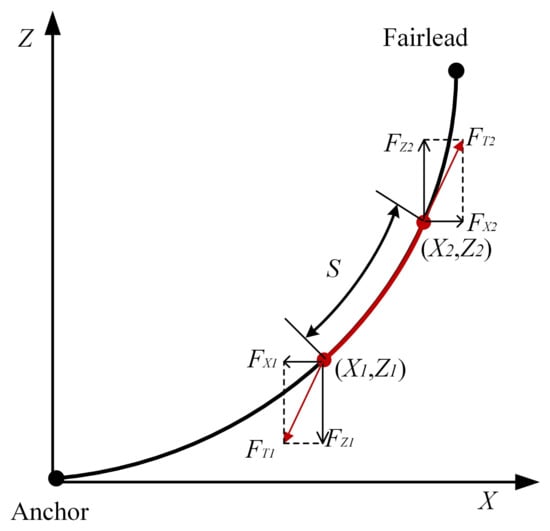
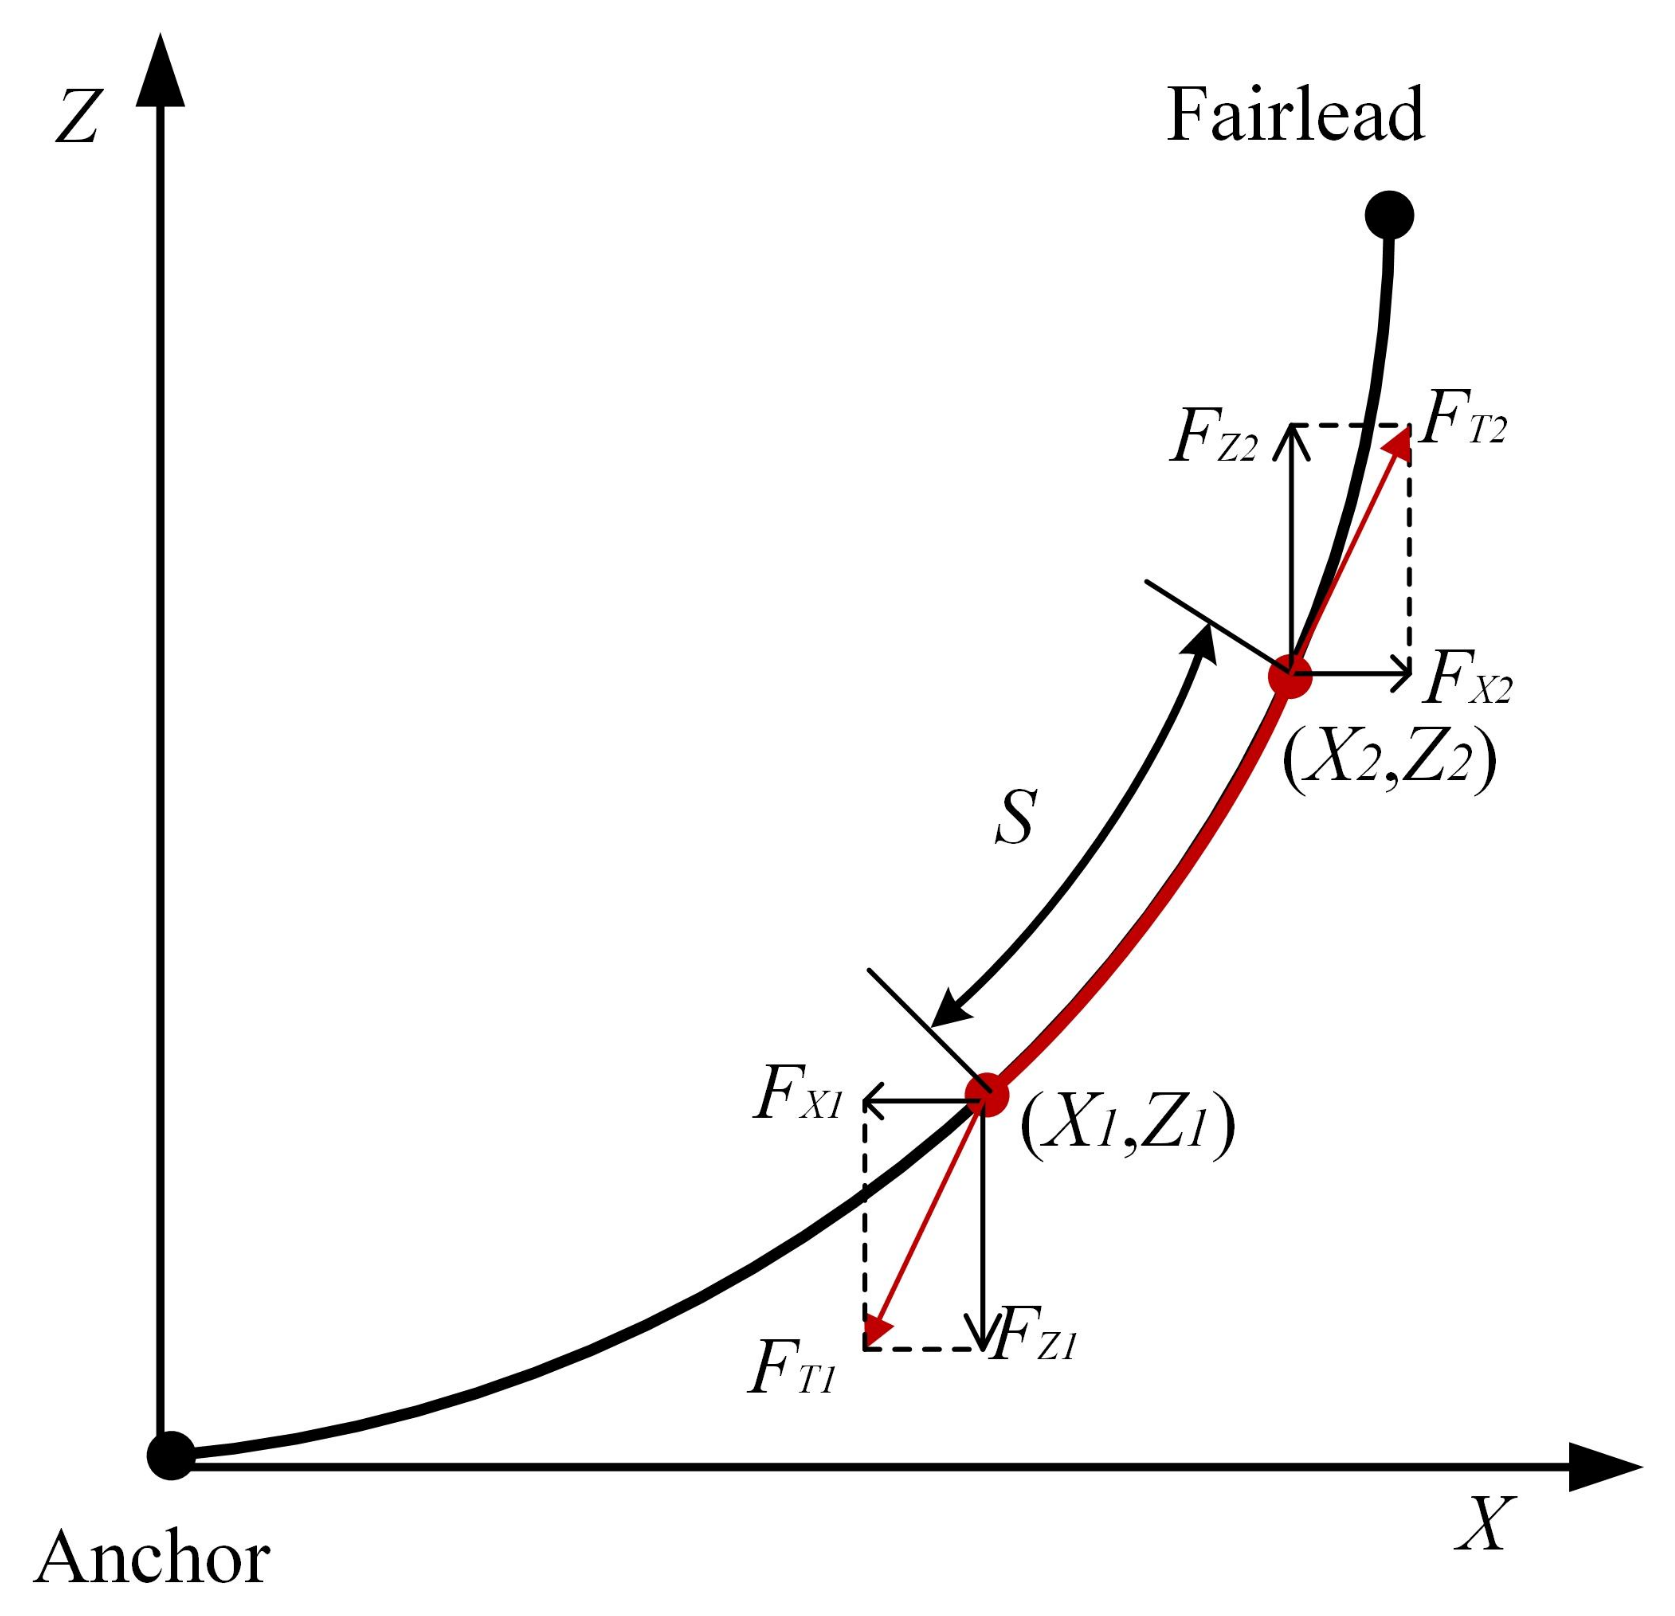
In mathematical calculating, the mooring line can be discretized into a series of Morison elements [39], and the local coordinate system of the quasi-static suspension mooring chain model is shown in Figure 6. Given a catenary mooring line that has zero slope at its seabed anchor connection, the horizontal and vertical tensions on the local axis system, i.e., and , respectively, are formulated as follows:
where L is the unstretched length of the suspended chain segment, w is the density per unit mass of the submerged portion, and is the stiffness per unit length.
Figure 6.
Modeling of suspension chain lines in a local coordinate system.
Therefore, the tangential tensions are as follows:
The stretched length of the suspension chain line is expressed as follows:
When the unstretched length of a section of suspension chain line is less than the theoretical unstretched length L and the tension at the top is known, the position of the bottom end of the section of suspension chain line is formulated as follows:
To obtain experimental data on the mooring force at different mooring line positions, ten tension–compression load cells (DYMH-103 tension–compression load cells with a capacity of 80 kg and a sensitivity of 1.0–1.5 mV/V) were symmetrically arranged on the anchor chain of the scaled-down prototype, as illustrated in Figure 2. Among them, five were positioned at the near-surface end of the anchor chain (near the scaled-down prototype), and the remaining five were placed at the bottom end of the anchor chain pool (near the anchor block). It is well-known that mooring chains on the upward side exhibit substantial loads under incident waves; therefore, two sensors with a larger measuring range were placed on each of the four mooring chains on the windward side. This configuration was implemented to obtain more precise force data, supporting the design of the full-scale aquaculture cage.
4. Results and Discussion
4.1. Calm-Water Decay Test Result
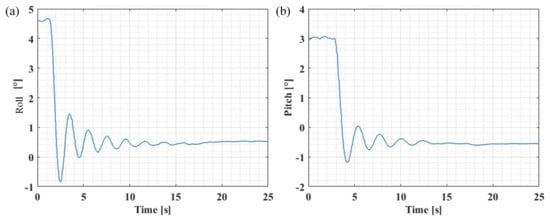
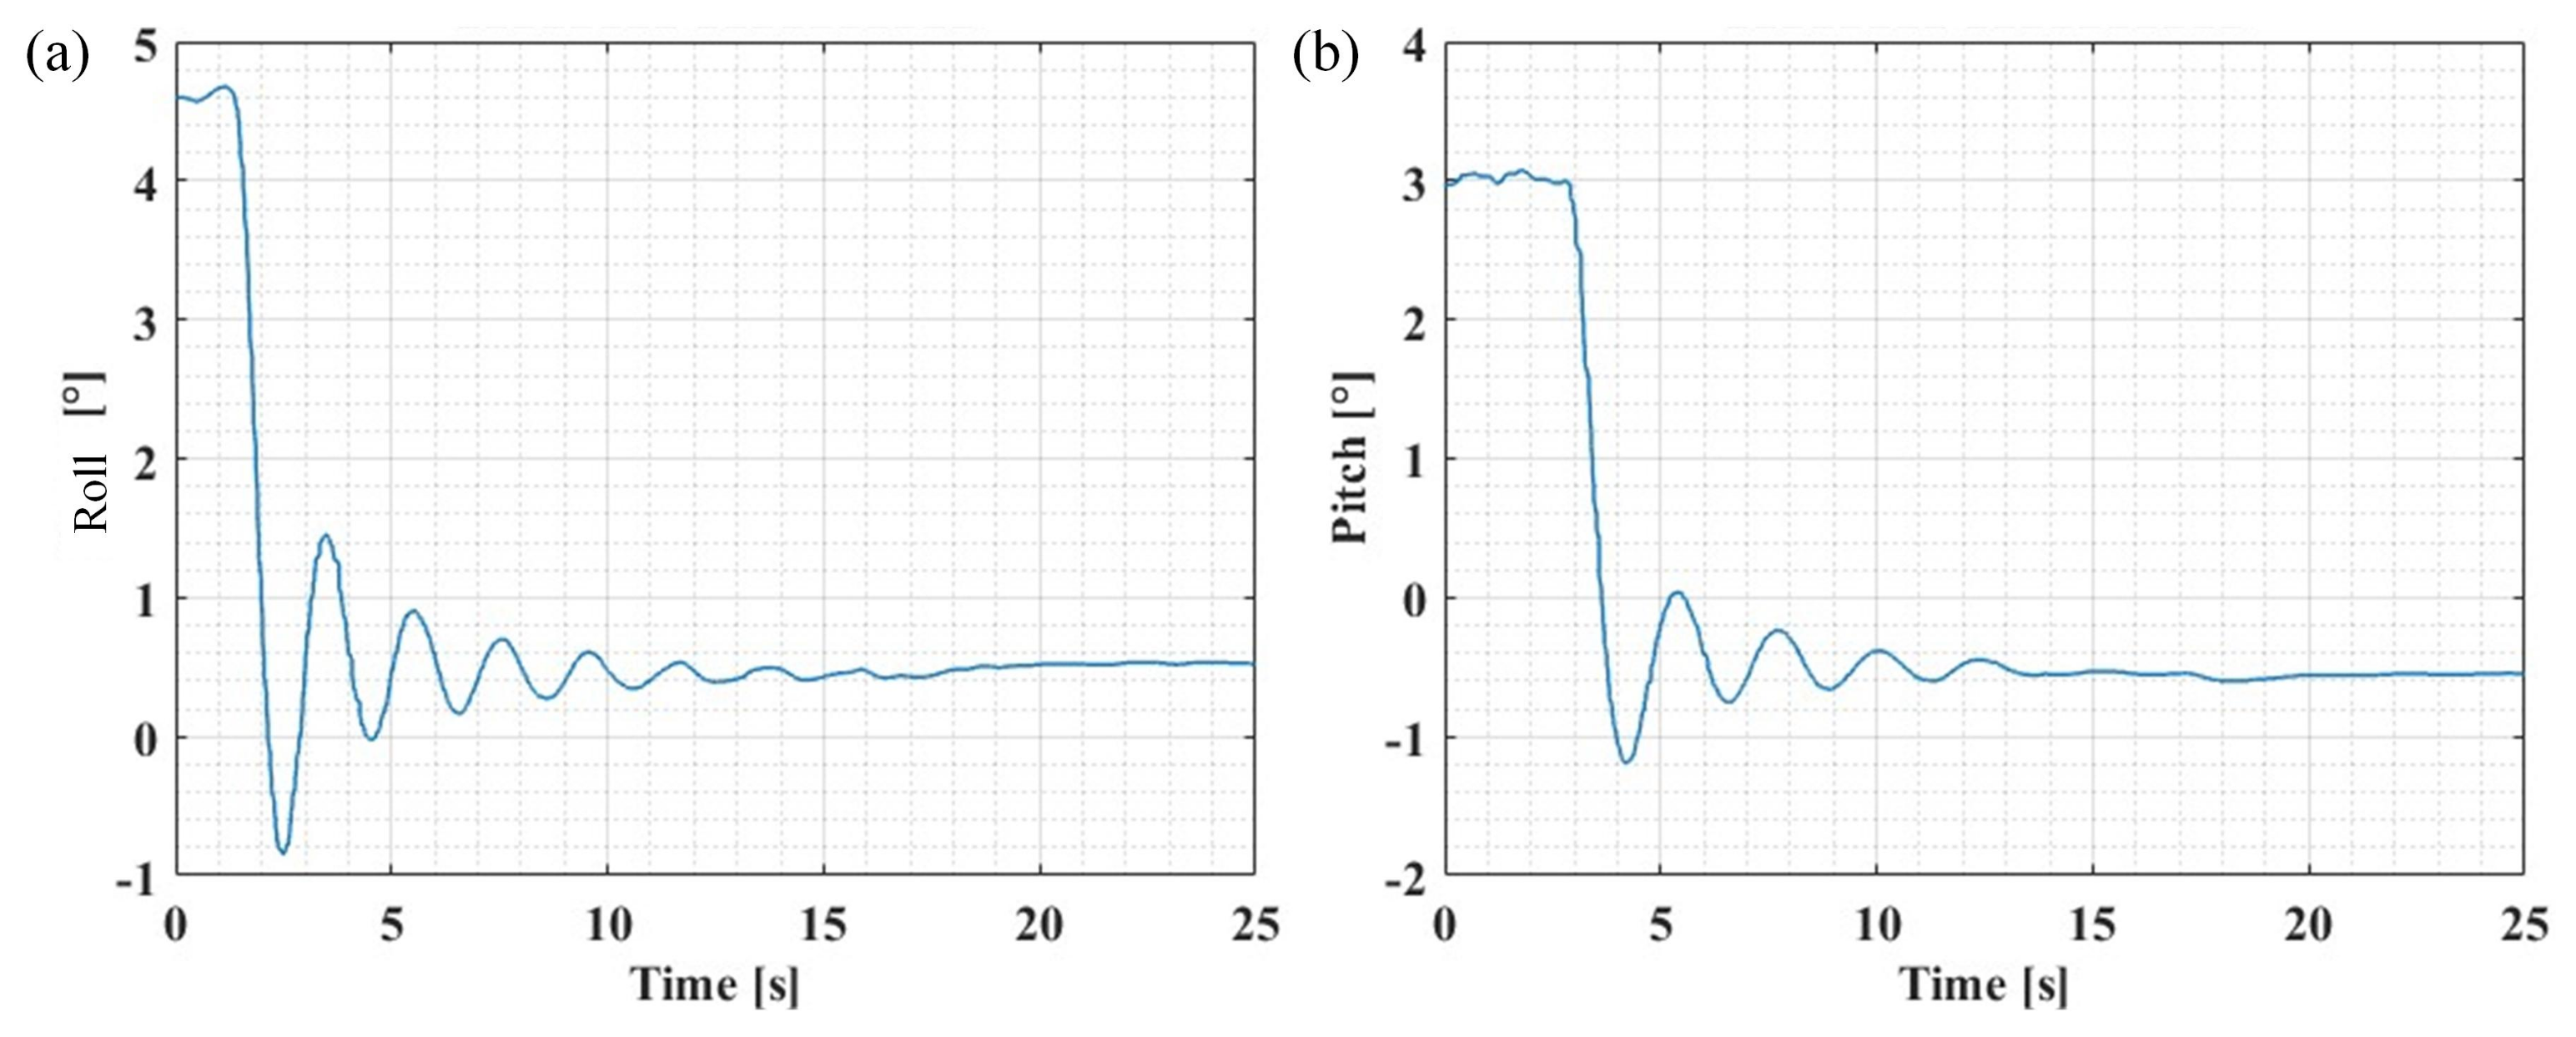
As shown in Figure 4, the Calm-water decay test was performed when the scaled-down prototype of the TSAC was moored. Four sets of experimental tests were conducted to measure the time-series oscillations of the scaled-down model in roll and pitch modes. An initial angle of about was employed in the roll-mode experiments, while a value of about was used in the pitch-mode free-decay tests. As shown in Figure 7, the free decay of the scaled-down prototype in two directions was characterized by a significant exponential decay.
Figure 7.
Calm-water decay test results: (a) Calm-water decay in roll mode; (b) Calm-water decay in pitch mode.
Using the measured data, the Froude method was employed to calculate the natural frequency, and, subsequently, the damping coefficient was determined. As shown in Table 4, the Calm-water decay test results for the prototype show that the mean value of its roll-mode natural period is , and the corresponding natural frequency is . The damping coefficients measured under the two cases are and , respectively. Considering the experimental environment interference and testing accuracy, the order of magnitude of the measured damping coefficient is ; the mean value of its natural period is in the pitch mode; and the corresponding mean value of its natural frequency is . The identified damping coefficients under the two sets of working conditions are and , respectively. These results provide an essential reference for evaluating the hydrodynamic performance of the TSAC.
Table 4.
Free-decay results of the scaled-down TSAC prototype.
The damping coefficient obtained from the free-decay test reflects the comprehensive damping characteristics of the model in the experimental environment. Due to the scale effects associated with viscous damping, this value cannot be directly extrapolated to full scale according to Froude’s law. Its primary purpose is to serve as a critical calibration parameter for subsequent numerical models, ensuring that the numerical models can accurately reproduce the motion responses of the physical model, thereby establishing a reliable predictive tool.
4.2. Hydrostatic Stiffness Test Result
In the hydrostatic stiffness test in the x-direction, the selected counterweight masses were 2 kg, 4 kg, 5 kg, 6 kg, and 7 kg. Multiple measurements were taken for each group, and three sets of reasonable experimental results were selected from each group to calculate the average value. As shown in Table 5, the horizontal stiffness coefficient increased with the increase in counterweight mass, indicating that the model exhibited different horizontal stiffness at different positions. The maximum stiffness measured in the scaled x-direction was 63.38 N/m.
Table 5.
Test results for horizontal stiffness in the x-direction.
In the horizontal stiffness test in the y-direction, the selected counterweight masses were 1 kg, 1.5 kg, and 2 kg. Multiple groups of repeated tests were conducted, and the average value of the reasonable experimental results was selected for each group. As shown in Table 6, the horizontal stiffness coefficient increased with the increase in counterweight mass, indicating that the model exhibited different horizontal stiffness at different positions. The maximum stiffness measured in the scaled y-direction was 22.16 N/m. Compared with the stiffness in the x-direction, the stiffness in the y-direction was significantly lower, indicating that the stiffness of the moored model differed in the x- and y-directions.
Table 6.
Test results for horizontal stiffness in the y-direction.
4.3. RAO Under Regular Waves
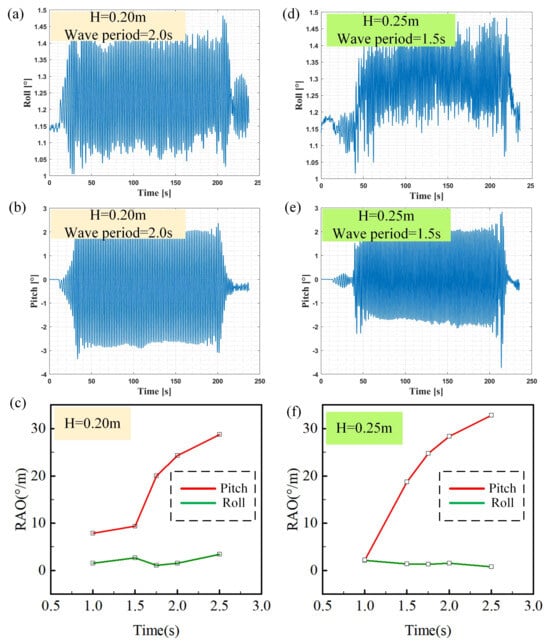
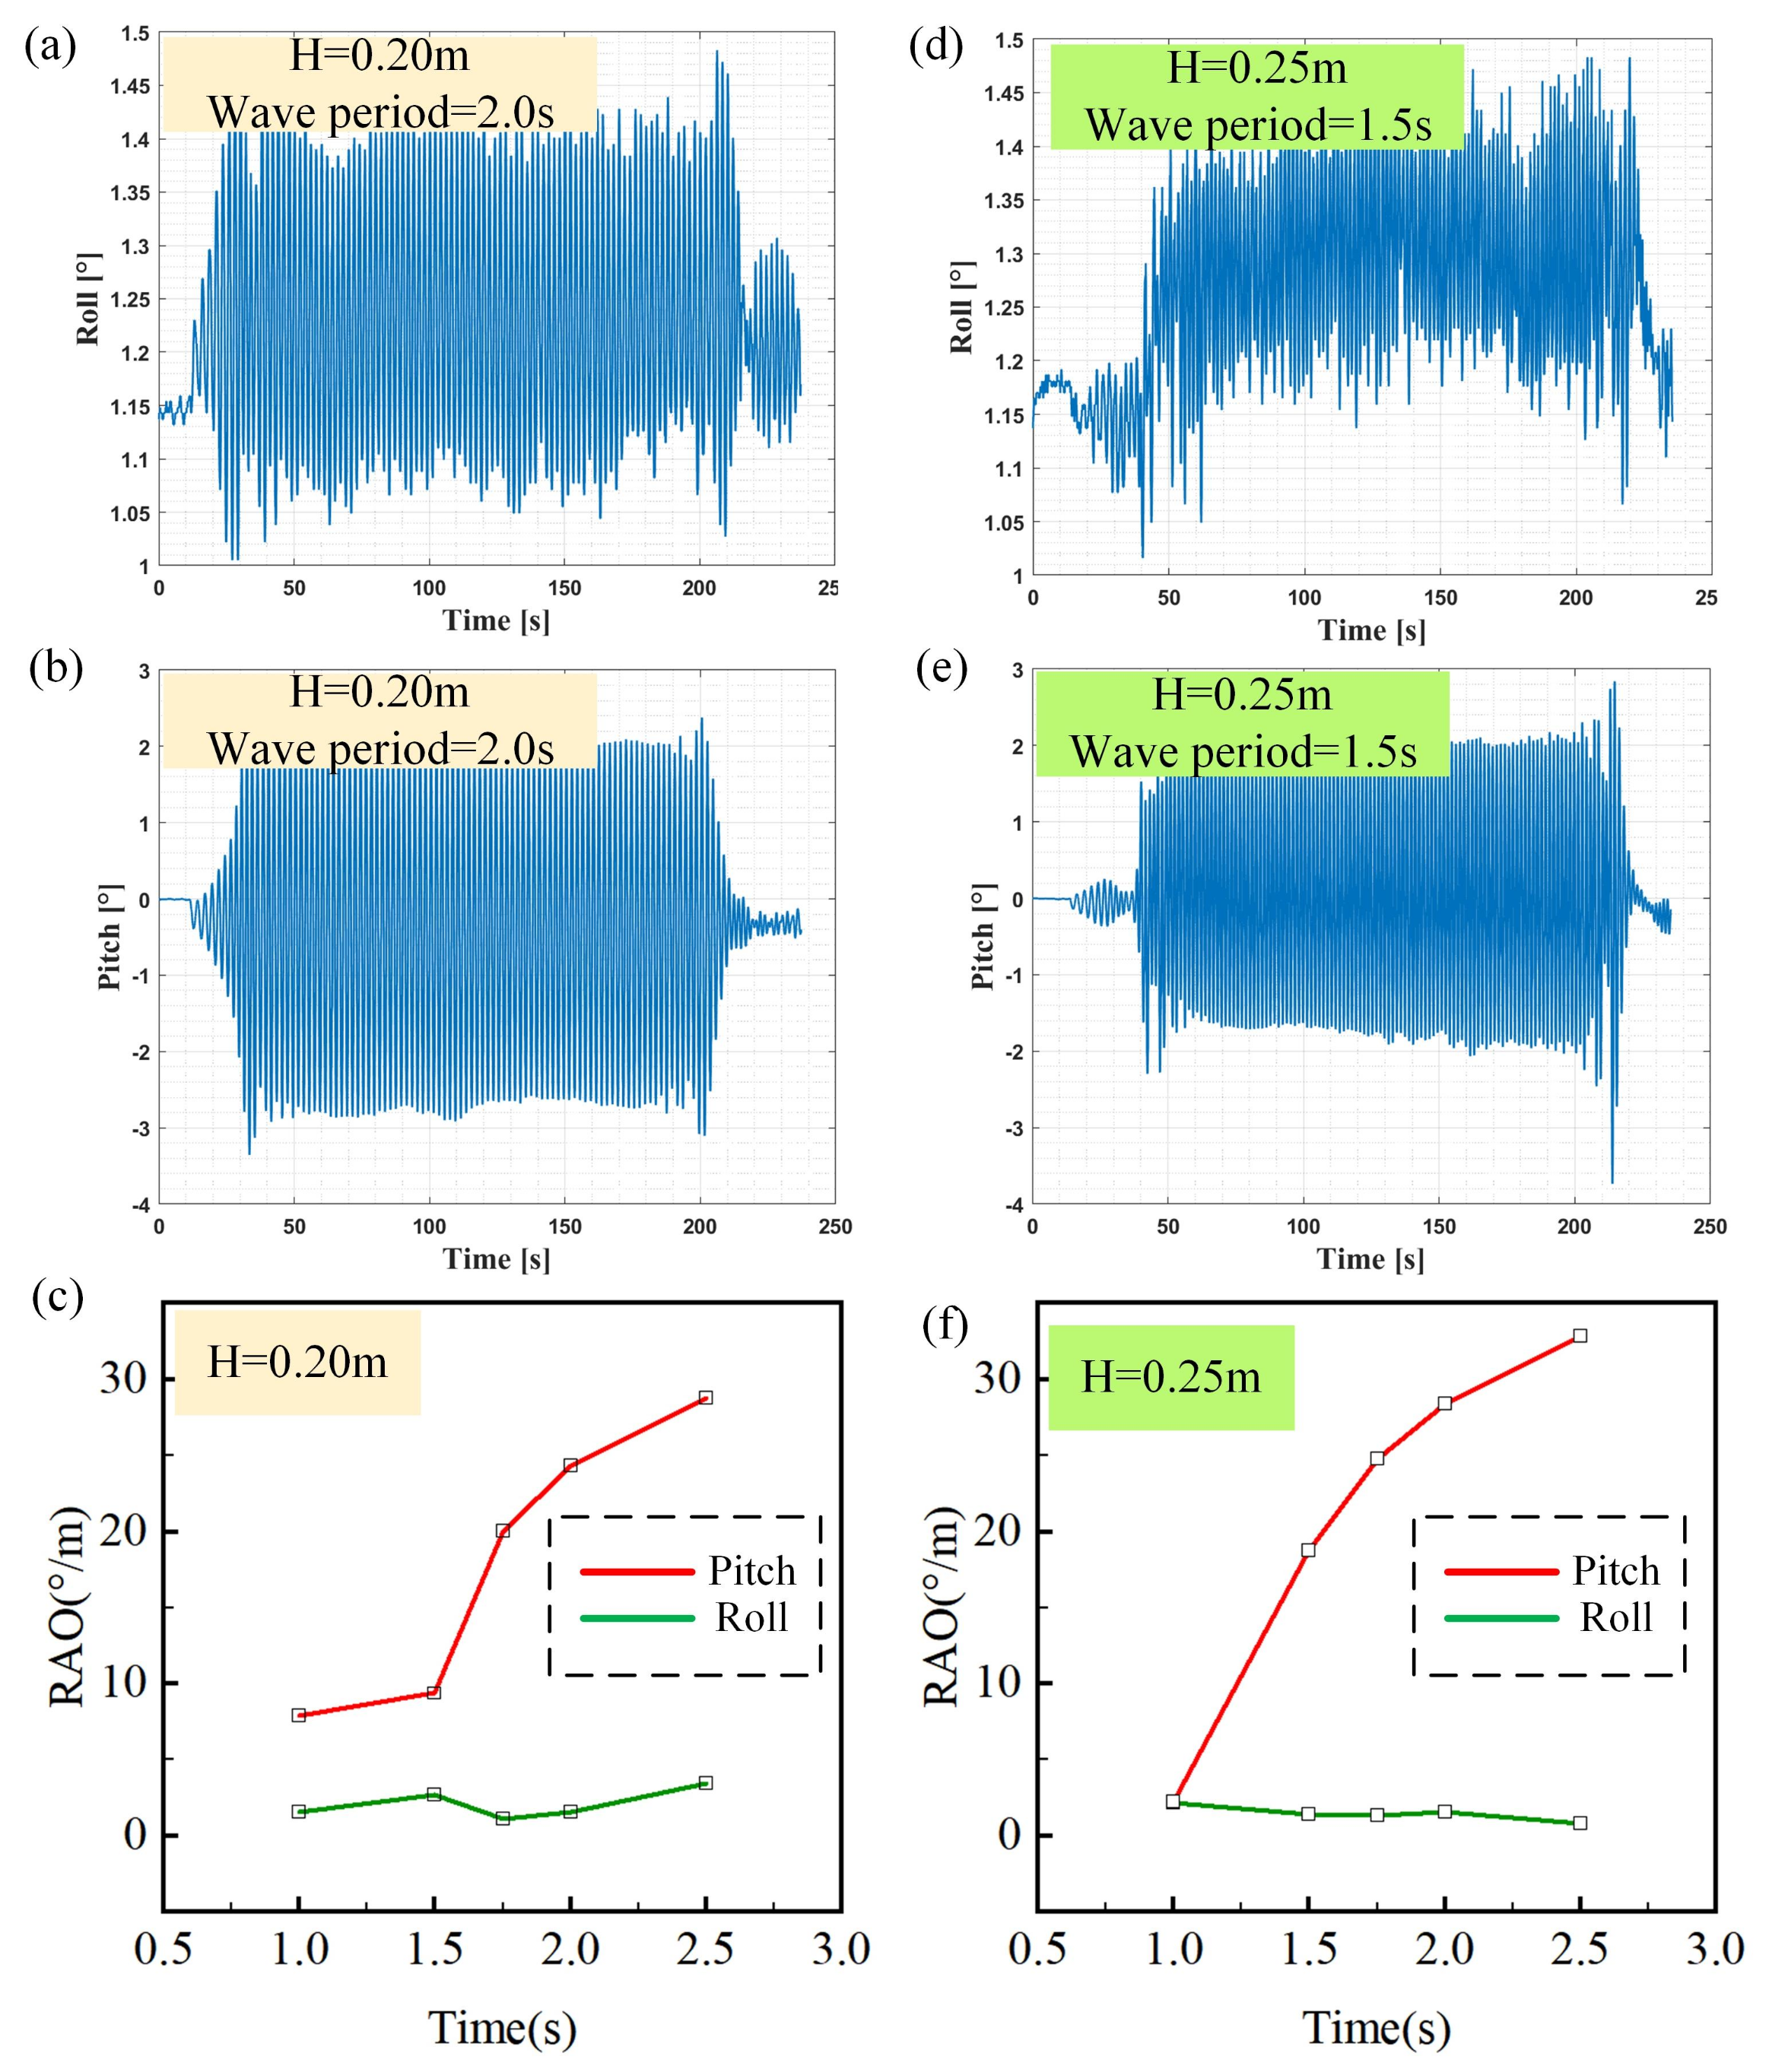
The IMU data recorded during the hydrodynamic tests on the scaled-down prototype of the TSAC with a mooring system are shown in Figure 4. During data processing, data from 50 to 100 cycles in a steady state were selected for amplitude calculations and then averaged for RAO calculations.
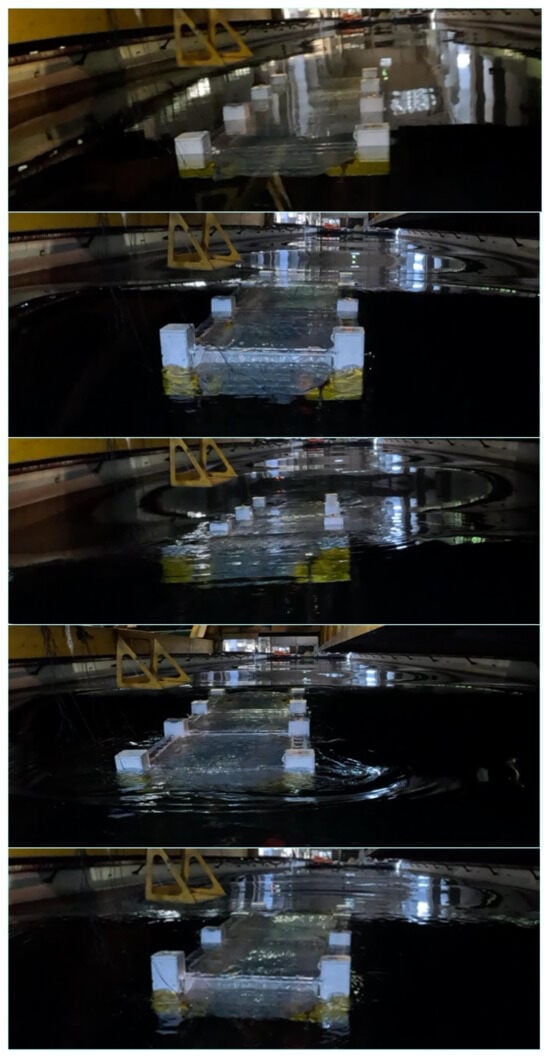
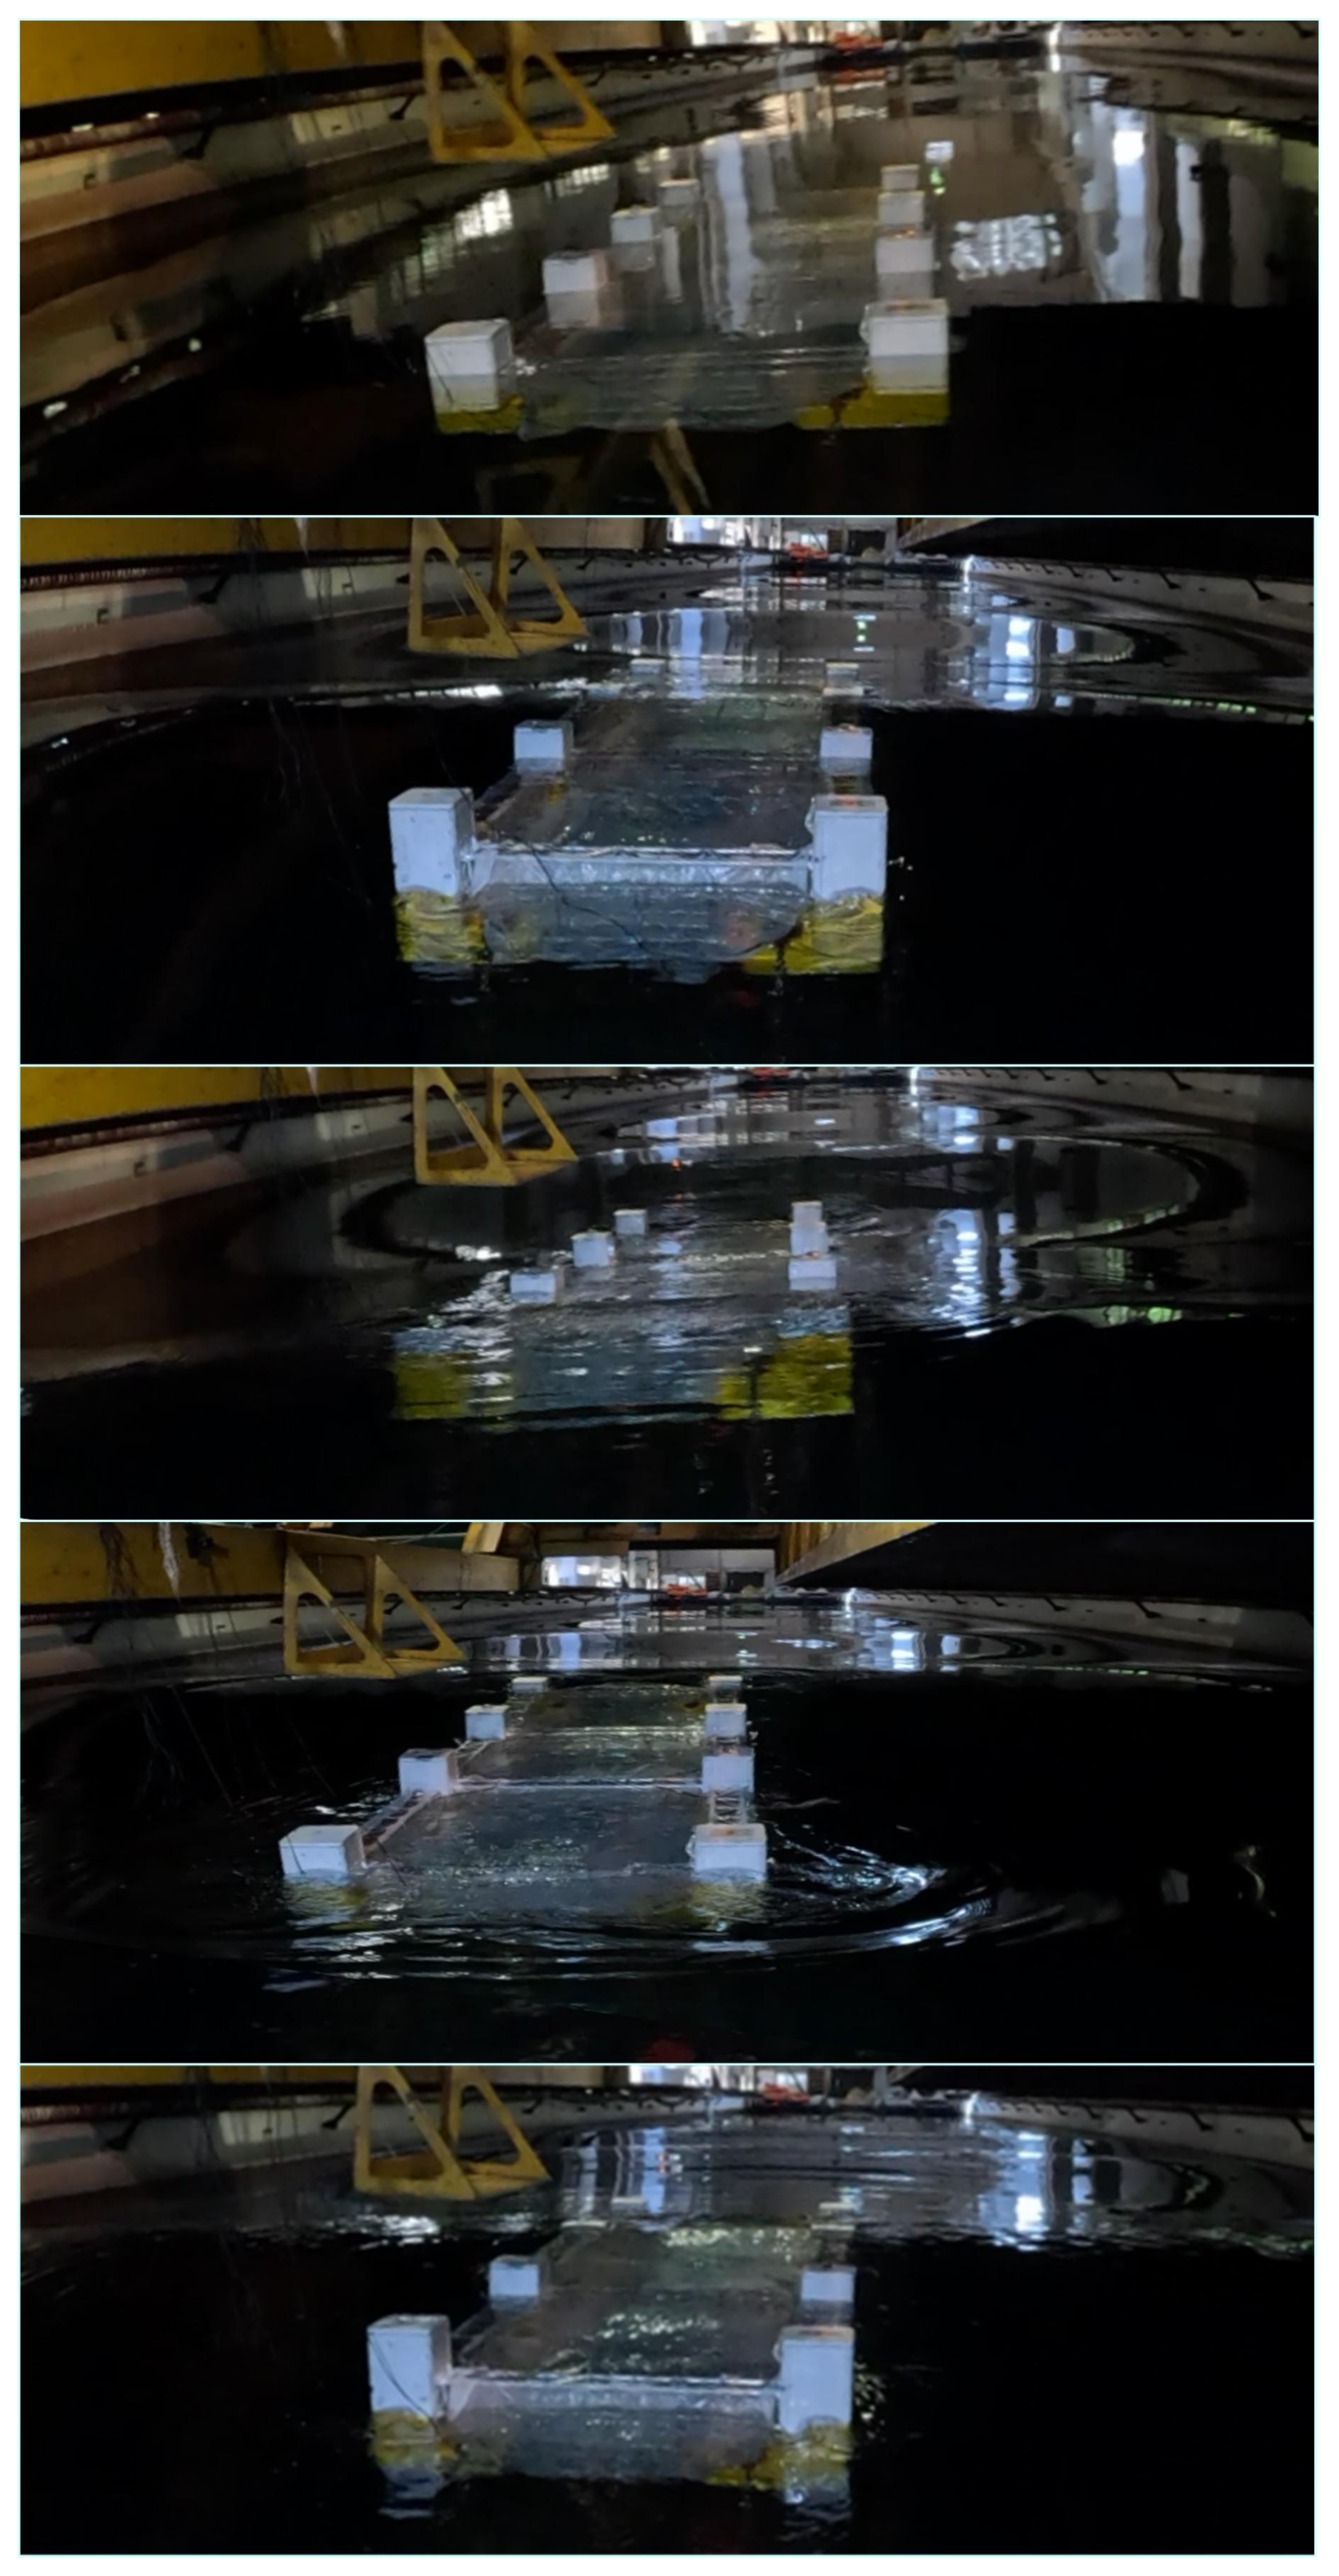
Figure 8 shows the experimental response of the scaled-down prototype with a mooring system under a regular wave excitation with a wave height of and a period of . Considering the extreme conditions, the model played a significant role in the extent to which upwash occurred.
Figure 8.
Response of the scaled-down prototype under regular waves with a period of and a height of .
Figure 9 shows the RAO results for the moored prototype under a wave height of . The roll-mode RAO of the scaled-down prototype in the test period ranged from to , which does not show an evident linear pattern; the pitch-mode RAO of the model increased according to the increase in the period of the excitation wave; the maximum pitch was up to ; and, at this time, the period of the incident wave was . Under the wave height of , the roll-mode RAO of the model in the test cycle ranged from to , which does not show an evident linear pattern; the pitch-mode RAO of the model increased according to the increase in the excitation wave period; the maximum pitch was up to ; and, at this time, the period of the incident wave was .
Figure 9.
RAO results: time history curves of the roll (a,b) and pitch (d,e) of the model under H = 0.20 m, wave period = 2 s and H = 0.25 m, wave period = 1.5 s regular waves; RAO results under the excitation wave heights of 0.20 m (c) and 0.25 m (f).
The roll-mode RAO of the model does not exhibit a clear linear trend, precluding verification of the resonance period ( ) identified in Section 4.1. The main reasons for this are as follows: (i) The wave incidence direction was the same as the -x direction, and the excitation in this direction did not cause the model to produce an obvious roll. (ii) Due to the presence of the mooring system, the roll of the model was controlled in a smaller order of magnitude. The nonmonotonic trend in roll RAO results from the coupled effects of wave directionality and mooring system constraints. The pitch-mode RAO of the model increased according to the increase in the excitation wave period, which is in line with the conclusion of Section 4.1: that the natural period of the model’s pitch is . However, due to the upper limit of the experimental period and the wave height used, it was not possible to perform a more accurate verification.
4.4. Mooring Force Under Regular Waves
In this study, a scaled-down model of the TSAC was tested for mooring tension, and the results were correlated with the results of the RAO analysis described in Section 4.2. The experiment was conducted using two sets of regular wave excitation conditions with wave heights set at and and excitation periods ranging from 1 to . During the experimental implementation, all tension–compression load cells used to measure forces on the anchor chain underwent a rigorous calibration procedure before installation and data acquisition.
The nonuniform distribution of pre-tension, as illustrated in Figure 10 and Figure 11, primarily resulted from the practical challenges in symmetrically tensioning the eight anchor chains within the 4 m deep wave tank. The analysis of pre-tension distribution indicates that the higher pre-tension values were predominantly observed in the near-bottom catenary segments of the mooring chains. This asymmetry can be attributed to the irregular positioning and orientation at the chain–anchor interface during model deployment. However, the resulting pre-tension nonuniformity did not significantly influence the dynamic interaction between the platform and the mooring lines at the fairlead connections, as confirmed by the negligible fluctuations recorded by the near-bottom tension–compression load cells throughout the tests. More importantly, the maximum measured tension was adopted as the design reference. While this approach is conservative, it ensures operational safety and provides a reliable basis for full-scale mooring system design.
Figure 10.
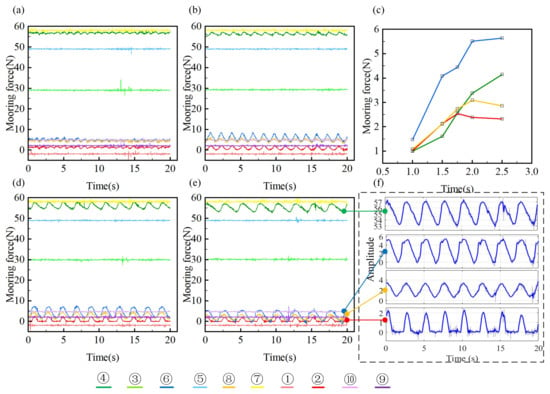
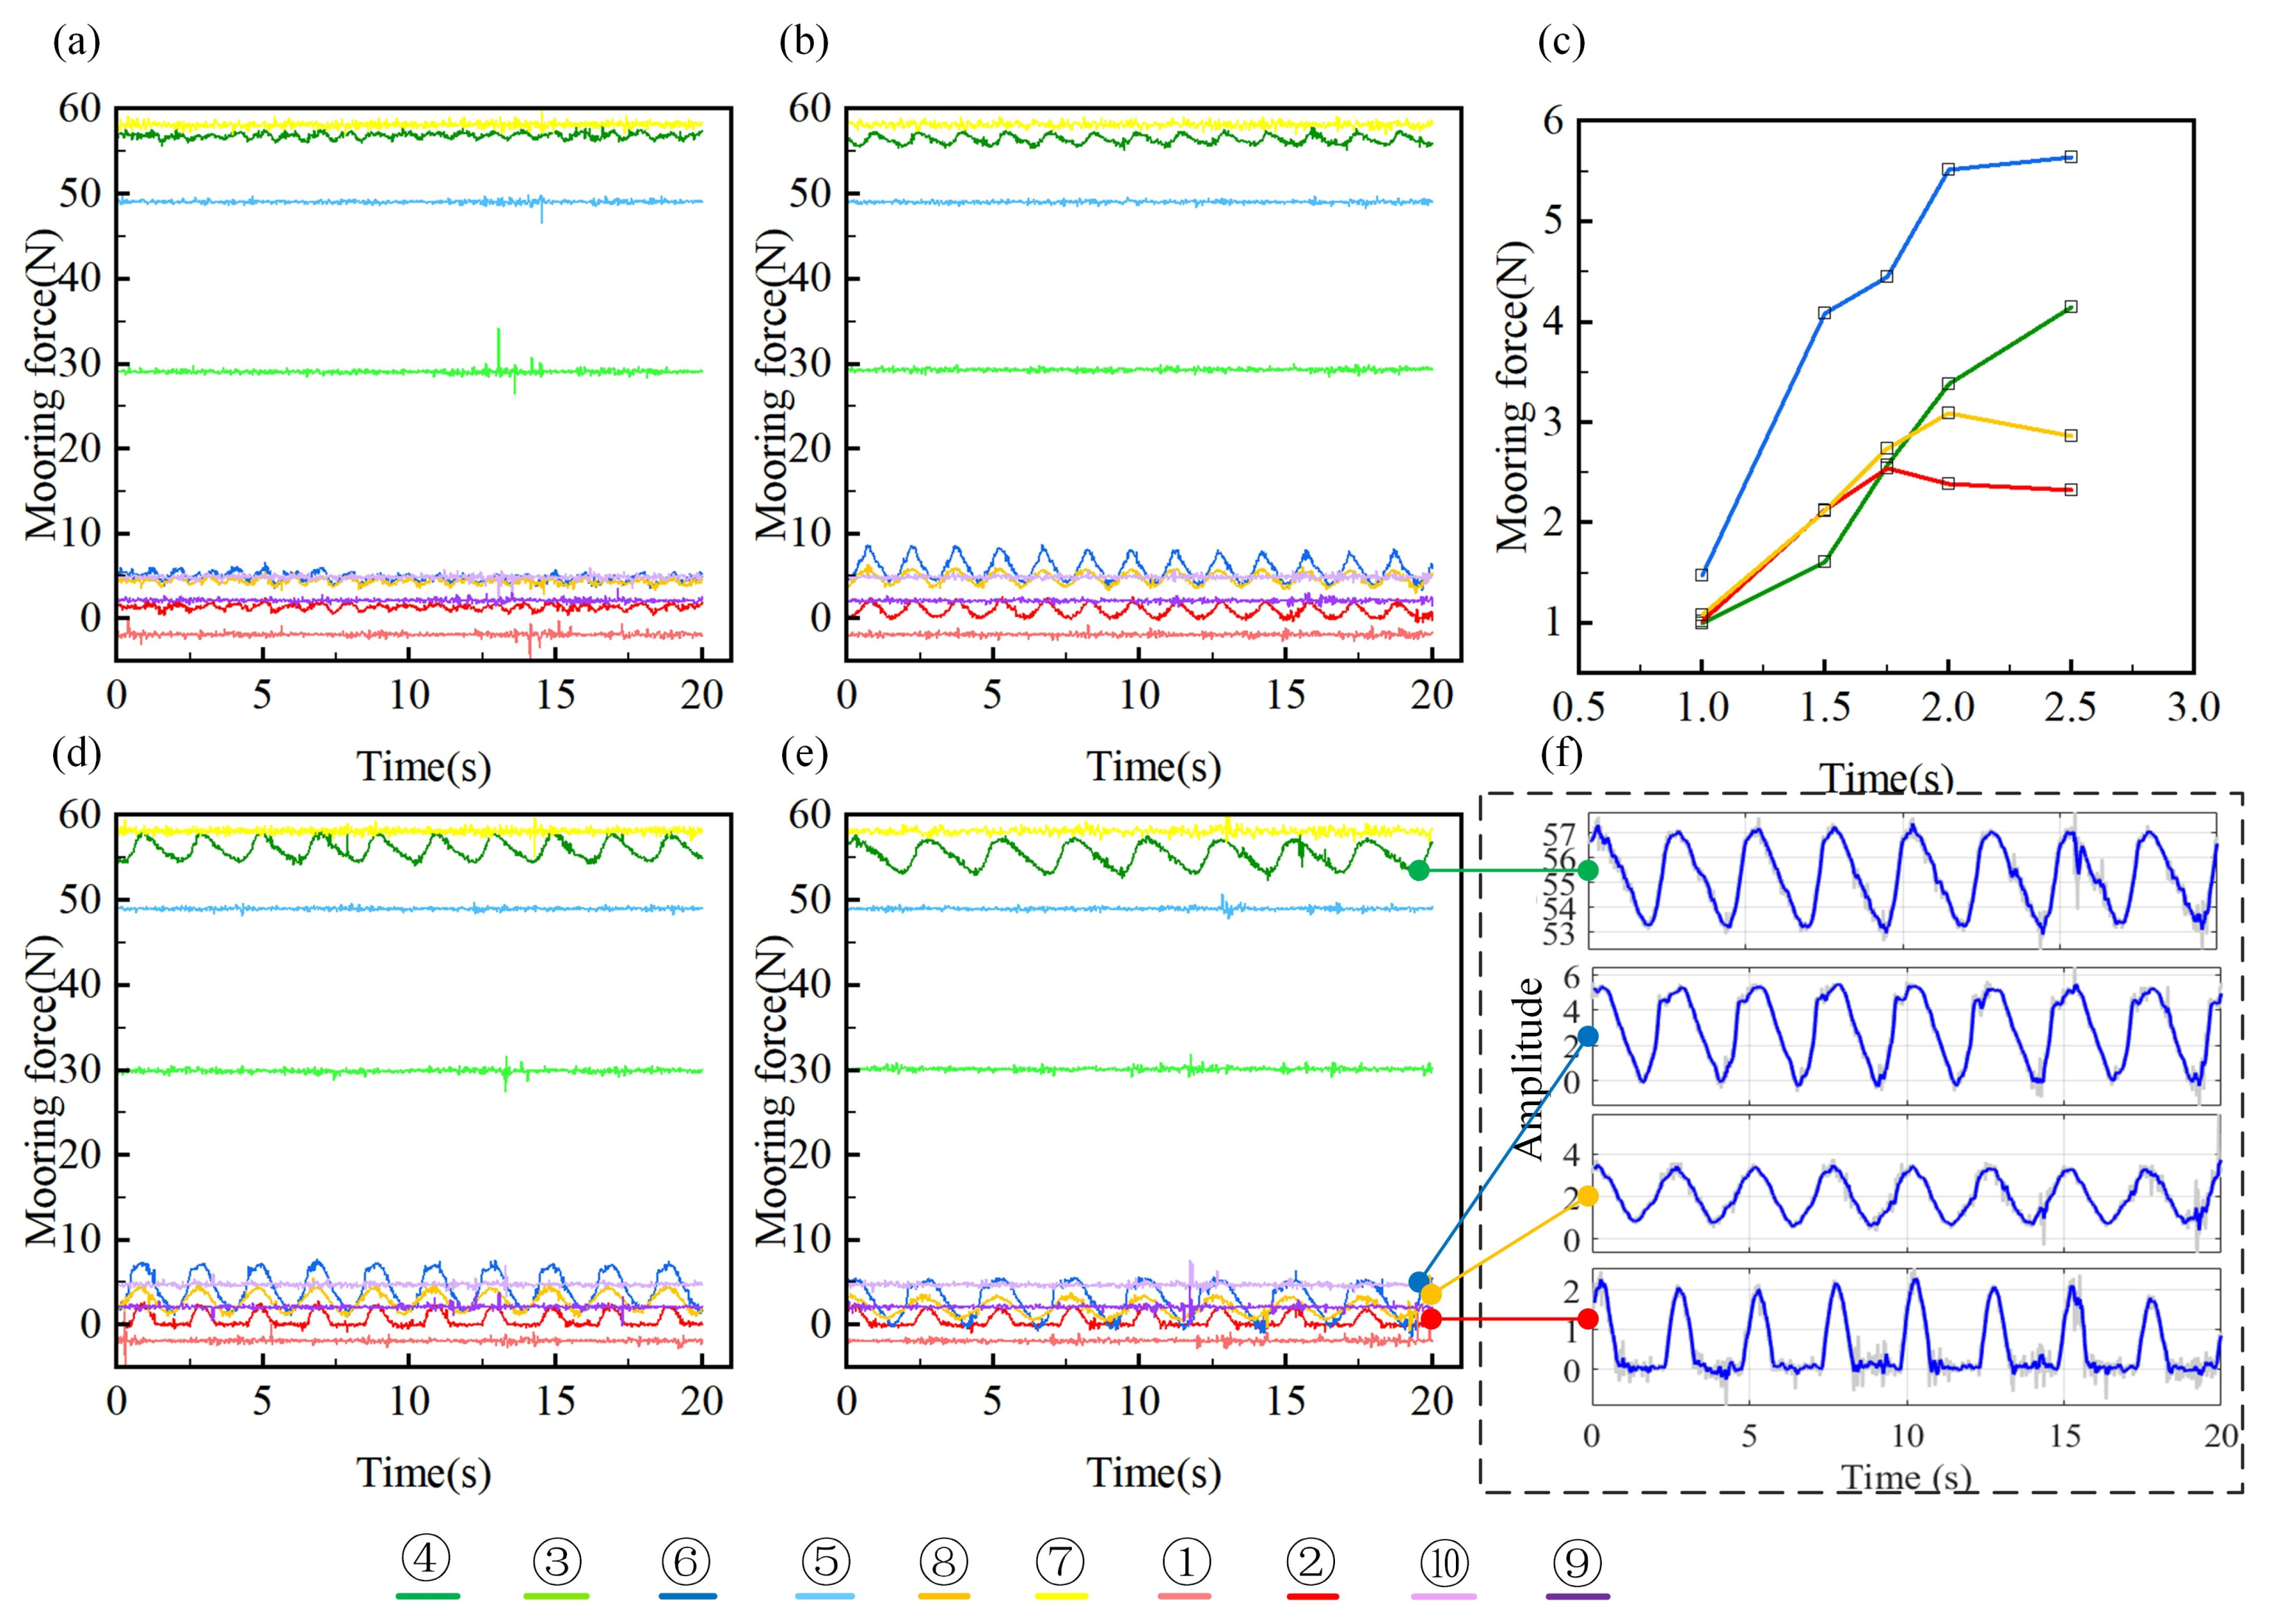
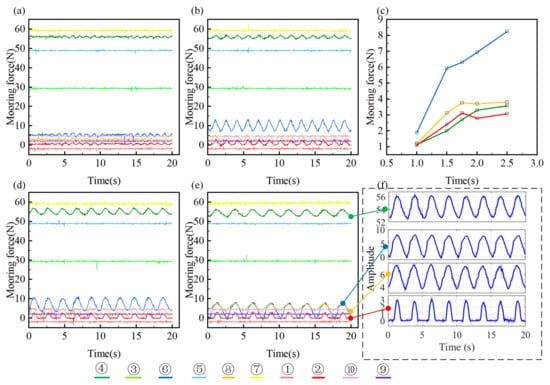
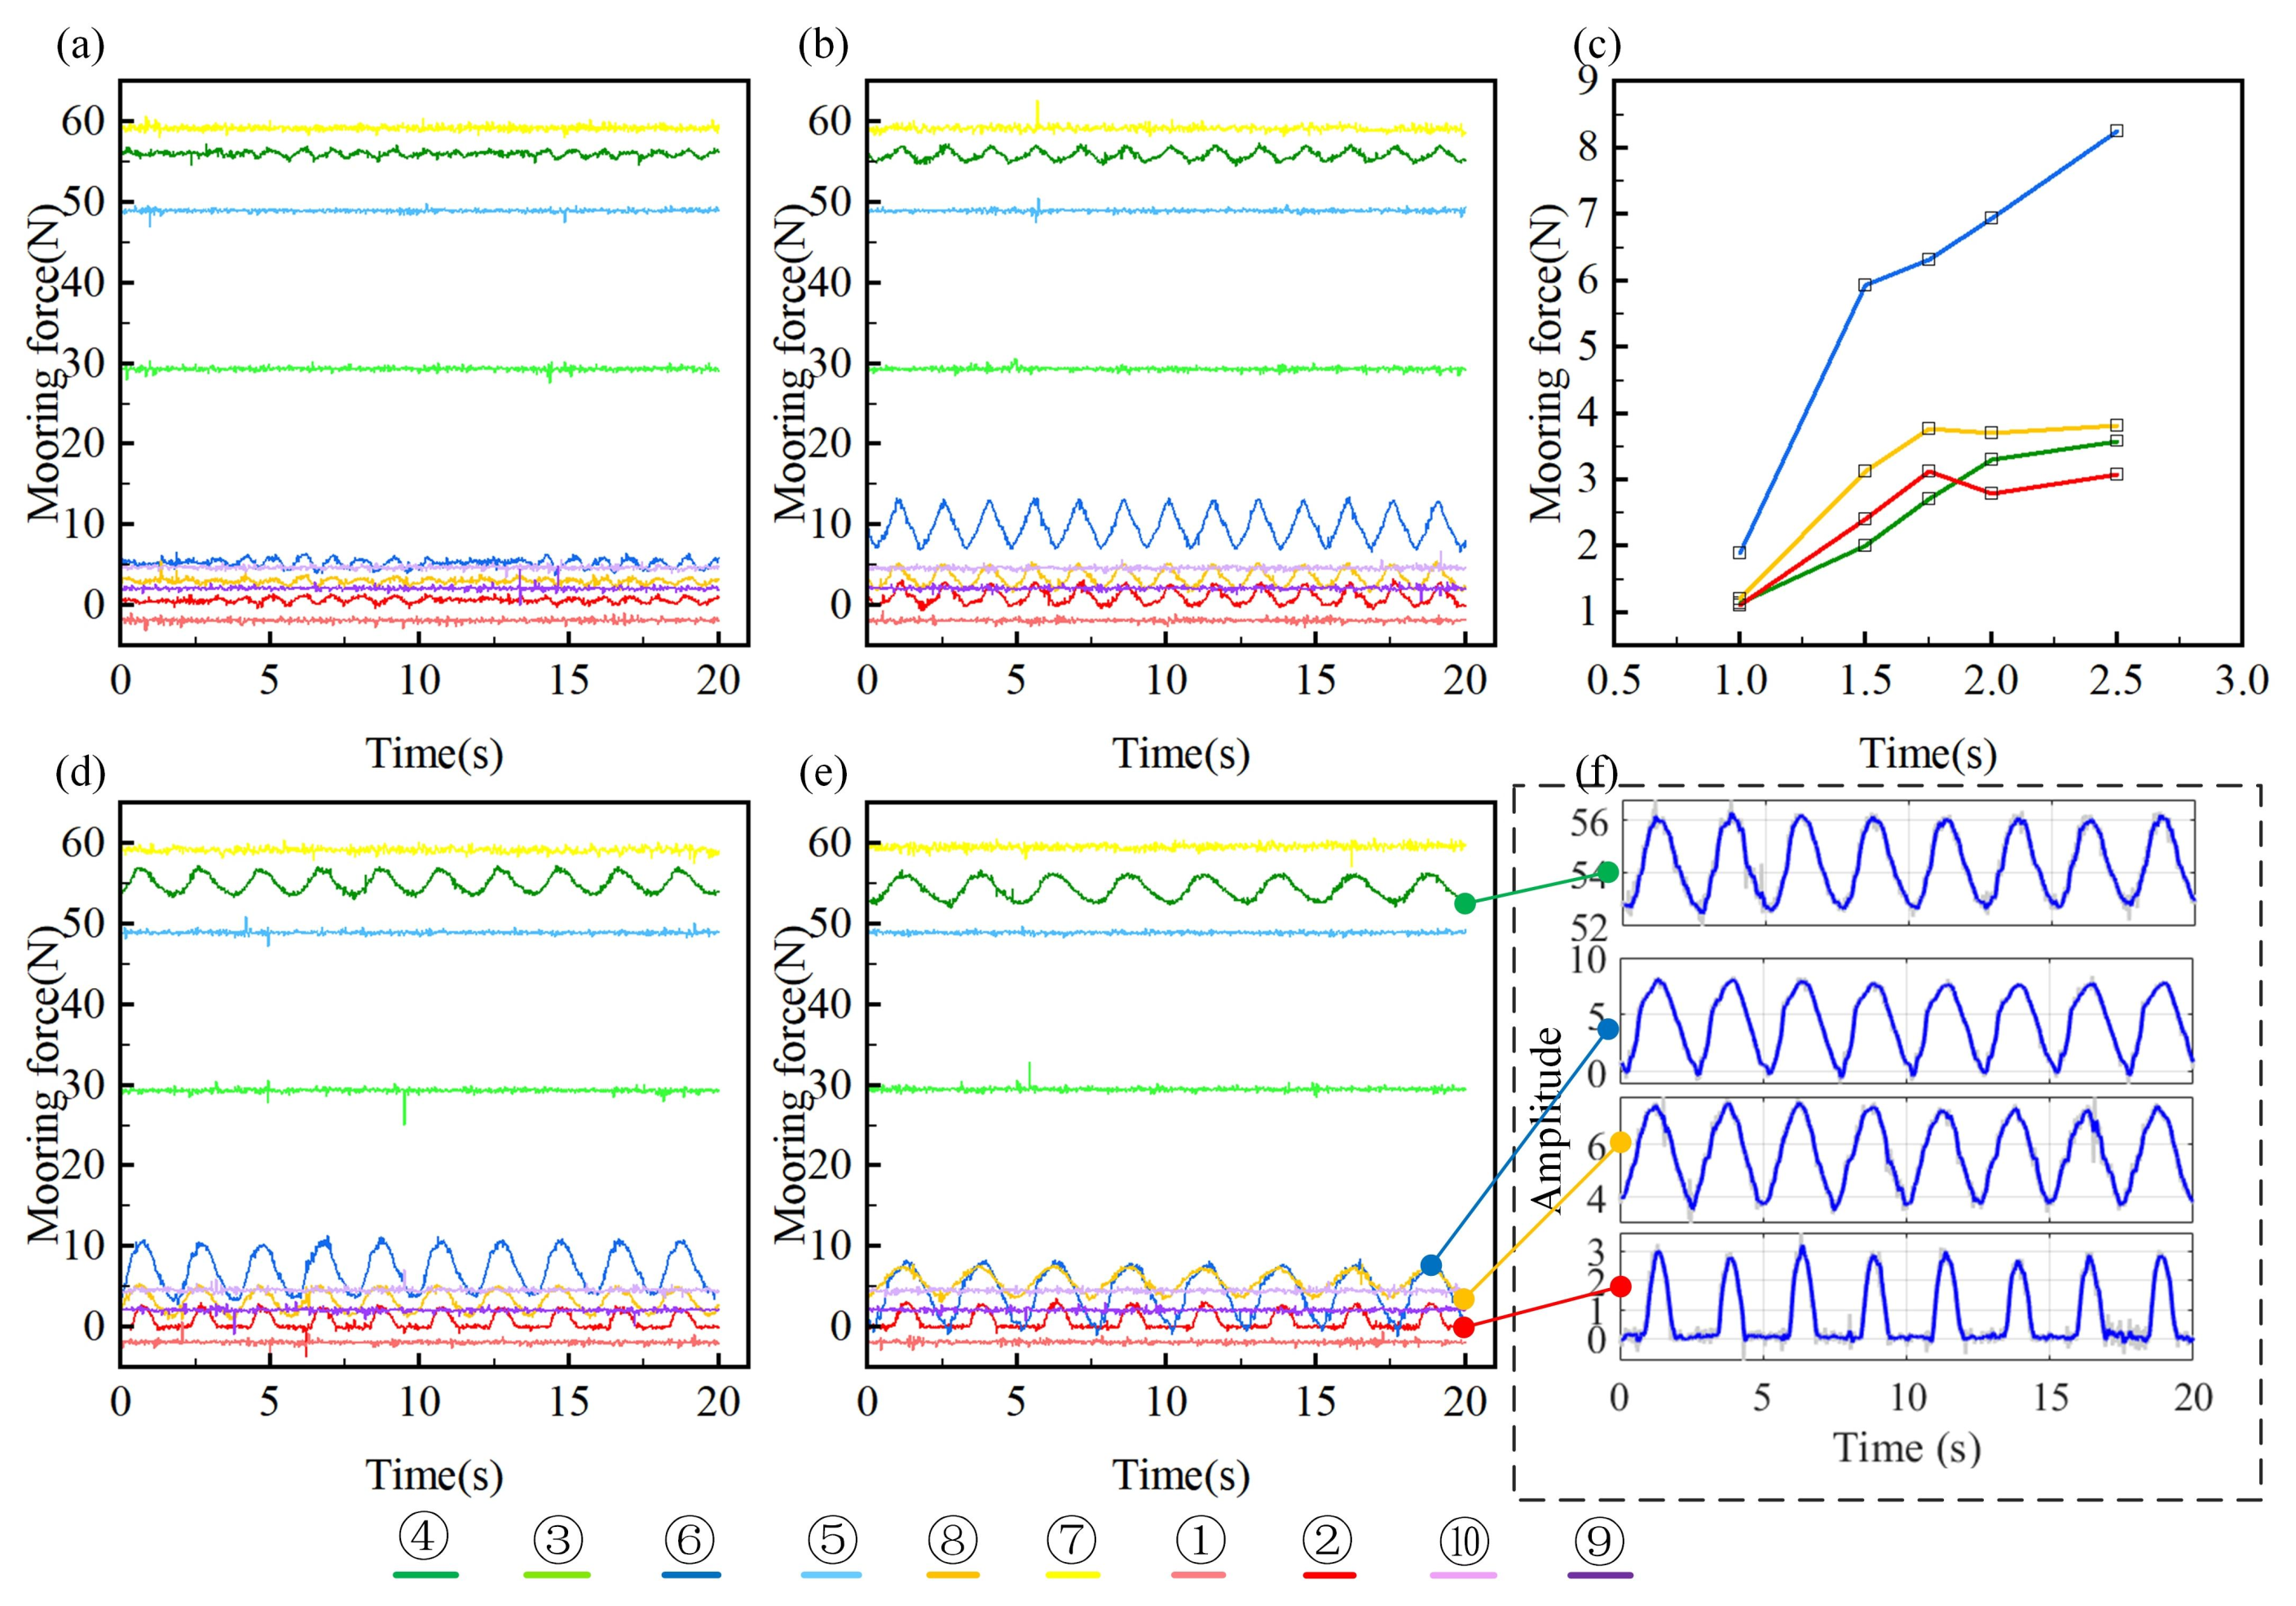
Mooring force of the scaled-down prototype under a wave height of : (a) wave excitation period of ; (b) wave excitation period of ; (d) wave excitation period of ; (e) wave excitation period of ; (c) trends in PPA of mooring forces; (f) mooring forces after applying a filtering process.
Figure 11.
Mooring force of the scaled-down prototype under the wave height of : (a) wave excitation period of ; (b) wave excitation period of ; (d) wave excitation period of ; (e) wave excitation period of ; (c) trends in PPA of mooring forces; (f) mooring forces after applying a filtering process.
Figure 10 demonstrates the test results under a wave height of . Subfigures (a), (b), (d), and (e) present the response tension of the near-bottom tension–compression load cells under a steady state of wave excitation. For ease of analysis, groups of sensors on the same anchor chain are labelled with a uniform color scheme. Initial tension values exist for all sensors; however, due to the influence of various factors (e.g., the initial catenary condition of the mooring chain) during the model deployment process, there are differences in the initial values of each sensor. In particular, the readings of the near-surface sensors and the near-bottom sensors do not show an inevitable correlation, which can be attributed to the structural differences between the two in terms of the linear and horizontal chain segments of the suspension chain, which resulted in an uneven distribution of forces in different segments of the same anchor chain. In particular, the initial mooring force of sensor no. 1 presents a negative value (about ), which may have originated from the sensor zeroing bias. However, the experimental data indicate that this parameter exhibited a small fluctuation range throughout the whole testing process. After confirmation through troubleshooting, it was determined that the tensile force at this position remained relatively stable; thus, its influence on the analysis of the final results was disregarded. Comparing the sensors, sensor no. 7 at the bottom of the water tank on the windward side recorded the maximum initial force ( ) in calm water, and this value was consistent with the force characteristics of the waves on the windward side of the prototype. The initial readings of all sensors can be converted to initial pre-tensions for the full-scale model (see Table 7).
Table 7.
Pre-tension of the scaled-down model and the corresponding full-scale model.
When the wave excitation reached a steady natural state, the sensor readings showed two typical response patterns: (1) some sensors (nos. 1, 3, 5, 7, 9, and 10) maintained constant values; and (2) some sensors (nos. 2, 4, 6, and 8) showed periodic fluctuations. It is worth noting that the sensors with significant sinusoidal response characteristics (nos. 2, 4, 6, and 8) were all located near the surface of the cable guide holes on the windward side of the prototype, and this distribution characteristic indicates that the wave excitation mainly affects the force state of the upper anchor chain on the windward side. The periodic tension fluctuations in the windward chains (sensors 2, 4, 6, and 8) aligned with wave-induced surge motion of the platform. Correspondingly, all sensors near the bottom of the pool and sensor no. 10 on the leeward side did not exhibit significant changes in their readings. In order to quantitatively analyze the dynamic response characteristics, the time-series data of sensors 2, 4, 6, and 8 were extracted in this study (e.g., Figure 10f) and processed using a modified moving-average filtering algorithm. The processed signals were used to calculate the peak-to-peak amplitude (PPA) of each sensor, and its trend is shown in Figure 10c with the excitation period. Table 8 shows a comparison of the PPA of the scaled-down model and the full-scale model for the 0.2 m wave height condition. Results indicate that the PPA of all the dynamic sensors increased monotonically with an increasing excitation period; sensor no. 6 exhibited the largest response amplitude ( ), which was approximately 15 to 20 % higher than that of the remaining sensors (nos. 2, 4, and 8). Based on the results of the RAO analysis in Section 4.1 and Section 4.2, can be identified as the maximum dynamic response value in the whole cycle range under the wave height condition, and this parameter can provide a key reference for the design of the mooring system.
Table 8.
PPA at 0.20 m wave height and its full-scale results (corresponding to full-scale wave height of 6.4 m).
As shown in Figure 11, when the excitation wave height was raised to , the experimental results indicated a similar response pattern to the wave height condition (Figure 10), but the dynamic tension amplitude increased significantly. Among them, the peak value recorded by sensor no. 6 can be regarded as the maximum dynamic response value of the full-cycle excitation under the wave height condition, and also the maximum tension fluctuation observed in all the test conditions of this experiment. Table 9 shows a comparison of the PPA of the scaled-down model and the full-scale model for the wave height condition. The PPA recorded under the wave height of and period of by sensor no. 6 reached , corresponding to a full-scale model force of 270,172.16 under a wave height of and a period of .
Table 9.
PPA at 0.25m wave height and its full-scale results (corresponding to full-scale wave height of 8.0 m).
5. Conclusions
This study presents a comprehensive experimental investigation into the hydrodynamic performance of a scaled-down prototype of a trussed semi-submersible aquaculture cage. The study advances the field in the following ways:
(i) The 1:32 scaled-down prototype demonstrated high fidelity in replicating full-scale hydrodynamic behaviors, ensuring reliable extrapolation to real-world full-scale applications.
(ii) Key findings include the identification of natural frequencies and damping coefficients for roll and pitch motions, with the pitch and roll natural frequencies reaching and .
(iii) The multi-point moorings had different pre-tensions for different anchor chains, and the maximum initial force could reach up to , which corresponds to a full-scale model force of 1,886,126.08 . The PPA recorded under the wave height of and period of by sensor no. 6 reached , corresponding to a full-scale model force of 270,172.16 under a wave height of and period of .
(iv) The RAO and mooring force data under extreme wave conditions fill a gap in the existing literature, offering benchmarks for survivability design.
The key findings of this study provide a robust empirical foundation for constructing high-fidelity theoretical models to predict the hydrodynamic behavior of deep-sea semi-submersible aquaculture platforms under dynamic wave conditions.
Author Contributions
L.W.: concept design, funding acquisition, methodology, physical model design, experiments, writing—original manuscript, writing—reviewing and editing, supervision. W.K.: writing—original manuscript, physical model fabrication, experiments. R.Y.: writing—original manuscript, physical model design. C.Z.: writing—original manuscript, physical model fabrication, experiments. S.Y.: writing—original manuscript, physical model fabrication, experiments. W.D.: concept design, methodology, writing—reviewing and editing, supervision. M.C.: concept design, funding acquisition, methodology, writing—reviewing and editing, supervision. X.Y.: concept design, methodology, writing—reviewing and editing, supervision. K.W.: concept design, funding acquisition, methodology, writing—reviewing and editing, supervision. Z.W.: concept design, methodology, writing—reviewing and editing, supervision. All authors have read and agreed to the published version of the manuscript.
Funding
This research is supported by the 2024 Marine Economy Development Project of Guangdong Province (Project No. GDNRC[2024]21).
Data Availability Statement
The data that support the findings of this study are available from the corresponding author upon reasonable request.
Conflicts of Interest
The authors declare no conflicts of interest.
References
- Fan, Z.Q.; Liang, Y.H.; Yun-Peng, Z. Review of the research on the hydrodynamics of fishing cage nets. Ocean Eng. 2023, 276, 114192. [Google Scholar] [CrossRef] [Scilit]
- Nguyen, T.T.; Heimann, K.; Zhang, W. Protein Recovery from Underutilised Marine Bioresources for Product Development with Nutraceutical and Pharmaceutical Bioactivities. Mar. Drugs 2020, 18, 391. [Google Scholar] [CrossRef] [Scilit]
- Liu, W.; Hao, Z.; Florkowski, W.J.; Wu, L.; Yang, Z. Assuring Food Security: Consumers’ Ethical Risk Perception of Meat Substitutes. Agriculture 2022, 12, 671. [Google Scholar] [CrossRef] [Scilit]
- Tao, Y.; Zhu, R.; Gu, J.; Li, Z.; Zhang, Z.; Xu, X. Experimental and numerical investigation of the hydrodynamic response of an aquaculture vessel. Ocean Eng. 2023, 279, 114505. [Google Scholar] [CrossRef] [Scilit]
- Fredheim, A.; Langan, R. 30—Advances in technology for off-shore and open ocean finfish aquaculture. In New Technologies in Aquaculture; Burnell, G., Allan, G., Eds.; Woodhead Publishing Series in Food Science, Technology and Nutrition; Woodhead Publishing: Sawston, UK, 2009; pp. 914–944. [Google Scholar] [CrossRef] [Scilit]
- Bore, P.T.; Fossan, P.A. Ultimate-and Fatigue Limit State Analysis of a Rigid Offshore Aquaculture Structure. Master’s Thesis, NTNU, Trondheim, Norway, 2015. [Google Scholar]
- Li, L.; Jiang, Z.; Wang, J.; Ong, M.C. Numerical Study on the Heading Misalignment and Current Velocity Reduction of a Vessel-Shaped Offshore Fish Farm. J. Offshore Mech. Arct. Eng. 2019, 141, 051602. [Google Scholar] [CrossRef] [Scilit]
- DeCew, J.; Page, S.; Turmelle, C.A.; Irish, J. Tow Test results of an AquaPod™ fish cage. In Proceedings of the OCEANS 2006, VOLS 1-4, Boston, MA, USA, 18–21 September 2006. [Google Scholar]
- Zhou, X.; Zhao, X.; Zhang, S.; Lin, J. Marine Ranching Construction and Management in East China Sea: Programs for Sustainable Fishery and Aquaculture. Water 2019, 11, 1237. [Google Scholar] [CrossRef] [Scilit]
- Huang, X.H.; Liu, H.Y.; Hu, Y.; Yuan, T.P.; Tao, Q.Y.; Wang, S.M.; Liu, Z.X. Hydrodynamic performance of a semi-submersible offshore fish farm with a single point mooring system in pure waves and current. Aquac. Eng. 2020, 90, 102075. [Google Scholar] [CrossRef] [Scilit]
- Gansel, L.C.; Oppedal, F.; Birkevold, J.; Tuene, S.A. Drag forces and deformation of aquaculture cages—Full-scale towing tests in the field. Aquac. Eng. 2018, 81, 46–56. [Google Scholar] [CrossRef] [Scilit]
- Wu, Y.; Duan, Y.; Wei, Y.; An, D.; Liu, J. Application of intelligent and unmanned equipment in aquaculture: A review. Comput. Electron. Agric. 2022, 199, 107201. [Google Scholar] [CrossRef] [Scilit]
- Zhang, Y.; Li, M.F.; Fang, X.H. Efficiency Analysis of China Deep-Sea Cage Aquaculture Based on the SBM–Malmquist Model. Fishes 2023, 8, 529. [Google Scholar] [CrossRef] [Scilit]
- Yu, J.; Yan, T. Analyzing Industrialization of Deep-Sea Cage Mariculture in China: Review and Performance. Rev. Fish. Sci. Aquac. 2023, 31, 483–496. [Google Scholar] [CrossRef] [Scilit]
- Zhen, X.; Lim, F.; Duan, Q.; Geng, Y.; Huang, Y. Deepwater Artificial Seabed (DAS) Production System: An Innovative Approach to Cost-Effective Deepwater and Ultra-Deepwater Field Developments. J. Mar. Sci. Eng. 2023, 11, 420. [Google Scholar] [CrossRef] [Scilit]
- Cheng, W.; Sun, Z.; Liang, S.; Liu, B. Numerical model of an aquaculture structure under oscillatory flow. Aquac. Eng. 2020, 89, 102054. [Google Scholar] [CrossRef] [Scilit]
- Martin, T.; Kamath, A.; Wang, G.; Bihs, H. Modelling Open Ocean Aquaculture Structures Using CFD and a Simulation-Based Screen Force Model. J. Mar. Sci. Eng. 2022, 10, 332. [Google Scholar] [CrossRef] [Scilit]
- Miao, Y.J.; Ding, J.; Tian, C.; Chen, X.J.; Fan, Y.L. Experimental and numerical study of a semi-submersible offshore fish farm under waves. Ocean Eng. 2021, 225, 108794. [Google Scholar] [CrossRef] [Scilit]
- Ma, C.; Bi, C.W.; Xu, Z.; Zhao, Y.P. Dynamic behaviors of a hinged multi-body floating aquaculture platform under regular waves. Ocean Eng. 2022, 243, 110278. [Google Scholar] [CrossRef] [Scilit]
- Zhuang, Y.; Song, B.w.; Wan, D.c.; Abdel-Maksoud, M. Position-dependent hydrodynamic response of moored container ship under rogue waves. J. Hydrodyn. 2025, 37, 1–11. [Google Scholar] [CrossRef] [Scilit]
- Martin, T.; Tsarau, A.; Bihs, H. A numerical framework for modelling the dynamics of open ocean aquaculture structures in viscous fluids. Appl. Ocean Res. 2021, 106, 102410. [Google Scholar] [CrossRef] [Scilit]
- Dong, S.; Park, S.G.; Kitazawa, D.; Zhou, J.; Yoshida, T.; Li, Q. Model tests and full-scale sea trials for drag force and deformation of a marine aquaculture net cage. Ocean Eng. 2021, 240, 109941. [Google Scholar] [CrossRef] [Scilit]
- Li, N.; Shi, W.; Han, X.; Li, X.; Verma, A.S.; Liu, C. Dynamic analysis of an integrated offshore structure comprising a jacket-supported offshore wind turbine and aquaculture steel cage. Ocean Eng. 2023, 274, 114059. [Google Scholar] [CrossRef] [Scilit]
- Shen, Y.; Firoozkoohi, R.; Greco, M.; Faltinsen, O.M. Experimental investigation of a closed vertical cylinder-shaped fish cage in waves. Ocean Eng. 2021, 236, 109444. [Google Scholar] [CrossRef] [Scilit]
- Chen, C.p.; Zhao, Y.p.; Li, Y.c.; Dong, G.h.; Zheng, Y.n. Numerical Analysis of Hydrodynamic Behaviors of Two Net Cages with Grid Mooring System Under Wave Action. China Ocean Eng. 2012, 26, 59–76. [Google Scholar] [CrossRef] [Scilit]
- Chu, Y.I.; Wang, C.M.; Park, J.C.; Lader, P.F. Review of cage and containment tank designs for offshore fish farming. Aquaculture 2020, 519, 734928. [Google Scholar] [CrossRef] [Scilit]
- Gatto, A.; Sadik-Zada, E.R.; Özbek, S.; Kieu, H.; Huynh, N.T.N. Deep-sea fisheries as resilient bioeconomic systems for food and nutrition security and sustainable development. Resour. Conserv. Recycl. 2023, 197, 106907. [Google Scholar] [CrossRef] [Scilit]
- Yue, K.; Shen, Y. An overview of disruptive technologies for aquaculture. Aquac. Fish. 2022, 7, 111–120. [Google Scholar] [CrossRef] [Scilit]
- Zhao, Y.; Guan, C.; Bi, C.; Liu, H.; Cui, Y. Experimental Investigations on Hydrodynamic Responses of a Semi-Submersible Offshore Fish Farm in Waves. J. Mar. Sci. Eng. 2019, 7, 238. [Google Scholar] [CrossRef] [Scilit]
- Jin, J.; Su, B.; Dou, R.; Luan, C.; Li, L.; Nygaard, I.; Fonseca, N.; Gao, Z. Numerical modelling of hydrodynamic responses of Ocean Farm 1 in waves and current and validation against model test measurements. Mar. Struct. 2021, 78, 103017. [Google Scholar] [CrossRef] [Scilit]
- Li, G.; Li, X.; Xie, Y.; Zhao, C.; Xu, P. Experimental study on hydrodynamic performance of the semi-submersible vessel-shaped fish cage. Aquac. Eng. 2024, 107, 102482. [Google Scholar] [CrossRef] [Scilit]
- Bi, C.W.; Ma, C.; Zhao, Y.P.; Xin, L.X. Physical model experimental study on the motion responses of a multi-module aquaculture platform. Ocean Eng. 2021, 239, 109862. [Google Scholar] [CrossRef] [Scilit]
- Schmitt, P.; Elsäßer, B. The application of Froude scaling to model tests of Oscillating Wave Surge Converters. Ocean Eng. 2017, 141, 108–115. [Google Scholar] [CrossRef] [Scilit]
- Qiao, D.; Zhi, G.; Liang, H.; Ning, D.; Yan, J.; Li, B. Scaling Orchestration in Physical Model Test of Oscillating Buoy Wave Energy Converter. Front. Mar. Sci. 2021, 8, 627453. [Google Scholar] [CrossRef] [Scilit]
- Moe, H.; Fredheim, A.; Hopperstad, O. Structural analysis of aquaculture net cages in current. J. Fluids Struct. 2010, 26, 503–516. [Google Scholar] [CrossRef] [Scilit]
- Chakrabarti, S. Handbook of Offshore Engineering; Elsevier Science: Amsterdam, The Netherlands, 2005; pp. 79–131. [Google Scholar]
- Lim, D.H.; Kim, Y. Design wave method for the extreme horizontal slow-drift motion of moored floating platforms. Appl. Ocean Res. 2018, 71, 48–58. [Google Scholar] [CrossRef] [Scilit]
- Lupton, R.C.; Langley, R.S. Scaling of slow-drift motion with platform size and its importance for floating wind turbines. Renew. Energy 2017, 101, 1013–1020. [Google Scholar] [CrossRef] [Scilit]
- Shahrabi, M.; Bargi, K. Enhancement the Fatigue Life of Floating Breakwater Mooring System Using Tuned Liquid Column Damper. Lat. Am. J. Solids Struct. 2019, 16, e220. [Google Scholar] [CrossRef] [Scilit]

Disclaimer/Publisher’s Note: The statements, opinions and data contained in all publications are solely those of the individual author(s) and contributor(s) and not of MDPI and/or the editor(s). MDPI and/or the editor(s) disclaim responsibility for any injury to people or property resulting from any ideas, methods, instructions or products referred to in the content. |
© 2026 by the authors. Licensee MDPI, Basel, Switzerland. This article is an open access article distributed under the terms and conditions of the Creative Commons Attribution (CC BY) license.