


Abstract
Underwater bridge inspection combines direct observation, acoustic imaging, optical measurement, and data interpretation to examine components that are difficult to access. This review aims to organize the principal inspection methods and explain how their operating principles and technical characteristics relate to bridge condition assessment. The qualitative synthesis covers deployment platforms, optical and acoustic equipment, image and point-cloud processing, representative applications, and assessment practice. Three themes emerge. First, platform accessibility and sensor viewing geometry jointly determine inspection coverage. Second, acoustic methods provide structural and riverbed information under low visibility, while optical, laser, and tactile methods contribute local surface detail. Third, processing methods connect observations to component identification, geometric description, and comparisons across inspections. The review distinguishes the roles of two-dimensional images, three-dimensional point clouds, and visual or contact observations, and relates these information types to scour, surface damage, joint anomalies, and deformation. Its contribution is an integrated account of the technical characteristics and complementary uses of inspection methods across the acquisition-to-assessment process. Future directions include coordinated platform operation, multisensor alignment, processing adapted to underwater data, and integration of repeated inspections into bridge maintenance.
1. Introduction
Underwater components of river-crossing and sea-crossing bridges, including piers, pile foundations, pile caps, and open-caisson foundations, are exposed to hydraulic scour, sediment abrasion, chloride attack, and surface fouling. These components are important targets for bridge safety assessment and durability maintenance. Poor visibility, restricted access, and hydrodynamic disturbances complicate the observation of scour holes, exposed foundations, concrete spalling, steel corrosion, and deformation [1]. As major sea-crossing bridges age, including the Hangzhou Bay Bridge [2] and the Hong Kong–Zhuhai–Macao Bridge [3], inspection tasks increasingly connect damage identification with condition assessment and maintenance planning.
Sea-crossing deployments involve salinity- and temperature-dependent sound speed, tides and currents, waves, platform motion, and vessel traffic. These conditions influence the operating window, sensor configuration, and coverage of underwater components. Riverine, port, and sheltered-water applications provide examples of how inspection methods are deployed under different environmental and structural conditions.
Inspection of underwater structures has evolved from diver-based surveys toward remotely coordinated operations using unmanned platforms [4]. Divers provide close visual observations, tactile examination, and simple measurements. Remotely operated vehicles (ROVs), autonomous underwater vehicles (AUVs), vessel-mounted systems, and unmanned surface vehicles (USVs) carry cameras, sonar, and positioning equipment over different spatial scales. The available working space, water depth, current, visibility, and access to piers or pile groups guide the combination of manual and unmanned approaches.
Inspection sensors fall mainly into optical and acoustic categories. Cameras and laser scanners reveal cracks, spalling boundaries, and joint details [5]; their working range varies with turbidity, illumination, scattering, and refraction [6,7]. Two-dimensional sonar provides target images under low visibility. A multibeam echo sounder (MBES) acquires swath soundings for riverbed mapping and, with suitable mounting and viewing geometry, structural surfaces. Volumetric imaging sonar and mechanically scanned sonar acquire component geometry in other configurations. Optical, laser, and tactile observations complement acoustic inspection where local surface texture or fine boundaries are of interest [8].
Data analysis connects two-dimensional (2D) images and three-dimensional (3D) observations with structural interpretation. Forward-looking sonar (FLS), side-scan sonar (SSS), and synthetic aperture sonar (SAS) produce intensity images for target detection and localization [9,10,11]. MBES integrates soundings with positioning and attitude data; volumetric sonar acquires directions within an observation volume; and mechanically scanned sonar accumulates local point clouds through rotation. Applications range from scour mapping around piers to component reconstruction, local damage description, and repeated surveys [12,13,14].
Inspection data pass through enhancement, filtering, registration, target extraction, and geometric interpretation before they support assessment. Sound-speed variation, multipath reflections, platform motion, and suspended matter influence the appearance and spatial distribution of the observations [15]. Xiong et al. [16] reviewed sonar-based underwater bridge scour inspection and identification. The present review considers a broader set of structural targets and inspection methods, linking deployment platforms, optical and acoustic equipment, processing methods, and maintenance information. Table 1 summarizes the main themes of representative related reviews.
Table 1.
Main themes of representative reviews related to underwater bridge inspection.
The objective of this review is to synthesize underwater bridge inspection methods through their operating principles, technical characteristics, and engineering uses, and to identify future research directions. The discussion brings together three contributions: a qualitative account of platform and sensor roles; an explanation of how image and point-cloud processing supports component and damage interpretation; and a connection between inspection information, condition assessment, and maintenance practice. Figure 1 organizes the review around inspection targets, defects and changes, inspection settings, and information needs. Its four columns correspond to operational approaches (Section 3), inspection equipment (Section 4), data analysis and interpretation (Section 5), and engineering applications and condition assessment (Section 6). The outputs of these stages connect coverage and data acquisition with component geometry, defect descriptions, and maintenance records. The lower band identifies the four future directions discussed in Section 7.
Figure 1.
Organization of the review: inspection scope and tasks, the four connected topics addressed in Section 3, Section 4, Section 5 and Section 6, and the future directions discussed in Section 7. Abbreviations: USV, unmanned surface vehicle; AUV, autonomous underwater vehicle; ROV, remotely operated vehicle; 2D/3D, two-dimensional/three-dimensional; FLS, forward-looking sonar; SSS, side-scan sonar; SAS, synthetic aperture sonar; MBES, multibeam echo sounder; OUT, output.
2. Scope and Organization of the Review
This article is a qualitative narrative review of underwater bridge inspection methods and their use in condition assessment. It covers diver-based and unmanned operations, optical and laser inspection, acoustic imaging and ranging, image and point-cloud processing, and the interpretation of inspection findings for maintenance. The emphasis is on differences in physical principles, information types, deployment conditions, and engineering roles.
The literature is organized around four connected topics: operational approaches, inspection equipment, data analysis, and condition assessment. Representative applications illustrate how these methods examine riverbeds, piers, pile groups, caissons, cofferdams, and local defects. The technical discussion relates method characteristics to inspection tasks and uses published equipment parameters to describe representative configurations. The comparisons concern operating principles, imaging modes, deployment requirements, and inspection uses; the selected equipment specifications describe individual configurations.
3. Operational Approaches for Underwater Bridge Structural Inspection
The inspection task, sensing mechanism, and deployment platform jointly determine how underwater bridge components are observed. Sensors provide different information types, working ranges, and spatial resolutions; platforms determine access, viewing direction, stability, and spatial coverage. Divers and ROVs operate close to components, vessels and USVs survey larger areas, and fixed installations observe selected locations over time. Route-based autonomous systems provide another deployment option in accessible underwater environments [4]. Water depth, current, turbidity, working space, and positioning conditions guide platform selection.
Divers examine suspected cracks, spalling, joint anomalies, and surface conditions through close visual observation, touch, and simple measurements [1]. Their direct access supports flexible local judgments, while depth, current, visibility, and operational windows determine the practical extent of an inspection. Pier bases, pile-group gaps, and pile-cap undersides require particular attention to access and diver safety.
ROVs are controlled from the surface and can carry cameras, sonar, lasers, and tactile sensors. Slow movement and station-keeping near piles, pile caps, or caisson walls support detailed component inspection. AUVs follow autonomous routes, with applications in underwater structure inspection and view planning providing relevant operational approaches [4,18]. Tether management and operator visibility shape ROV operations; navigation, positioning, obstacle avoidance, and mission planning shape AUV operations. Position and orientation records connect observations from either platform to structural locations.
Fixed platforms place sonar, current meters, or other sensors on or near foundations to observe scour or selected structural locations over time. Stable sensor positions and viewing directions support comparisons during floods and other short-term events. Installation access, equipment maintenance, floating debris, fouling, and impact influence their operation, making fixed monitoring particularly relevant to critical locations.
Vessels and USVs carrying MBES or SSS follow planned survey lines to examine bridge-site riverbeds, scour extents, and exposed foundations. An ROV can then approach identified regions with acoustic, optical, or contact sensors. This combination connects area coverage with local component observations through common positioning and component records [19,20,21].
Coordinated inspection links area surveys, component observations, and local verification through common coordinates, timestamps, and component identifiers. Anomaly locations connect surface-platform observations with ROV images and point clouds. Repeated survey lines, control points, and viewing directions provide a consistent spatial basis for comparing inspections.
Acquisition planning specifies coverage, overlap, repeat-survey locations, and areas requiring additional viewpoints. Synchronized records of sound speed, attitude, position, sensor mounting, and operating conditions support subsequent processing and comparisons [22]. Local visual or tactile observations provide complementary surface information [23]. Survey products identify coverage gaps and differences between overlapping observations so that the available information can be traced to the inspection setting.
4. Equipment for Underwater Bridge Structural Inspection
4.1. Underwater Optical, Stereo Vision, and Laser Inspection Equipment
Underwater vision equipment includes monocular video systems, actively illuminated cameras, stereo or multi-camera systems, structured-light systems, laser scanners, and underwater lidar. These systems directly reveal surface texture, cracks, spalling boundaries, and joint details, and can recover local geometry after scale calibration [5,6]. Their main advantage is intuitive visualization of fine details, while their limitations arise from the propagation medium. Turbidity, illumination, suspended particles, refraction, and platform station-keeping all affect image quality and measurement accuracy.
In turbid water, absorption, scattering, color distortion, and artificial-light reflections reduce image contrast. Lighting optimization, descattering, color restoration, contrast enhancement, and segmentation improve the visibility of contours and surface features [6,7,24]. Scale calibration and camera geometry connect the visible features to local dimensions.
Stereo and multi-camera systems recover local three-dimensional morphology through disparity-based triangulation. During near-field ROV operations, they can measure crack widths, spalling boundaries, and bridge pier surface defects [5,25,26]. In combined sonar and stereo vision systems, sonar first locates suspected regions and cameras then capture surface details [20,21]. Reliability depends on underwater calibration, refraction correction, camera baseline, target distance, and synchronized acquisition. Weak texture, surface fouling, and suspended particles may cause matching failures.
Structured-light systems, laser scanners, and underwater light detection and ranging (LiDAR) use active illumination to recover range or surface profiles. Structured light has been applied to underwater pipeline reconstruction [27], and sonar–laser registration has connected above-water and underwater models of partially submerged structures [28]. Multi-camera calibration and refraction correction support bridge-pier surface measurements [25,26,29]. Turbidity, scattering, incidence angle, occlusion, and platform stability govern the usable optical view.
Optical and laser equipment provide local surface detail in clear water or at close range. In turbid-water inspection, acoustic observations can guide the platform toward a selected region before local optical imaging. Tactile imaging offers contact-based surface information where visual access is poor [23]. Common coordinates, scale calibration, and the identification of the same component connect these observations.
4.2. Two-Dimensional Sonar Inspection Equipment
FLS, SSS, and SAS provide different two-dimensional acoustic views [8,30]. FLS images a forward sector, SSS records successive side-looking swaths, and SAS combines coherent observations along a trajectory to form a synthetic aperture. Their characteristic views support near-field target localization, area surveys, and detailed seabed imaging, respectively.
FLS transmits fan-shaped beams and receives echoes at different azimuths and ranges to form two-dimensional acoustic images ahead of the sensor in real time. It is widely used for underwater robot localization, obstacle avoidance, and near-field target searches [30]. A single frame projects the three-dimensional scene onto an azimuth–range plane, losing elevation information and introducing ambiguity in target height and spatial correspondence. Forward-looking sonar odometry addresses this problem by constraining platform motion through frame-to-frame and submap matching. It suppresses accumulated drift and provides a relatively stable pose basis for three-dimensional reconstruction from multiple frames [9]. Method development also includes fractional-order feature propagation for object detection in forward-looking sonar imagery [31].
SSS records bilateral intensity images along a survey track and is used to examine riverbed morphology, pipelines, and component surroundings [32]. Target height can be estimated from acoustic-shadow geometry when sonar altitude and target position are known. Echo intensity describes the strength of the returned signal; it does not directly determine height. Shadow interpretation depends on the viewing geometry, bottom shape, and towfish attitude. Deconvolution improves boundary definition [33], while convolutional neural network (CNN)-based recognition, transfer learning, YOLOv8 variants, and DNTFE-Net support target detection and extraction [10,34,35]. Physics-informed geometric and frequency decoupling has also been used for weak-target perception in side-scan imagery [36].
Recent detector families include Ultralytics YOLO11 [37] and the attention-centric YOLOv12 [38].
SAS synthesizes a virtual aperture through platform motion. When trajectory and coherent-processing requirements are met, it provides high azimuth resolution that is relatively insensitive to range. This makes it suitable for detailed screening over wide riverbed swaths and underwater targets. Semantic segmentation networks enhance target boundary representation in SAS images [11], while deep supervision supports large-area seabed characterization and uncertainty estimation [39]. Object-detection algorithms have also been developed specifically for SAS images [40].
Three-dimensional information can be obtained directly from acoustic ranges and directions or reconstructed from two-dimensional image sequences. Direct acquisition uses MBES, volumetric imaging, or mechanical scanning. Indirect reconstruction combines image observations with platform motion and multi-view geometry. Section 4.3 and Section 5.1 describe the corresponding acquisition and processing approaches.
4.3. Three-Dimensional Sonar Inspection Equipment
Three-dimensional acoustic observations combine range and direction information. MBES acquires swath soundings and forms spatial surfaces by integrating position, attitude, sound speed, and survey-line observations. Volumetric imaging sonar resolves azimuth, elevation, and range within an observation volume. Mechanically scanned sonar accumulates directions as the sonar head rotates. These acquisition mechanisms provide different arrangements of spatial coverage and update rate.
(1) Multibeam echo sounders
In a conventional MBES, the transmitted beam is broad across track and narrow along track. The receiving array electronically forms multiple narrow beams across the swath. Echo travel time and receive-beam direction provide a sounding, which is combined with sound speed, position, roll, pitch, heading, and mounting information. The soundings acquired along adjacent survey lines are calibrated, filtered, and merged to form georeferenced surfaces or point clouds [12,41].
MBES development has gradually shifted from increasing coverage toward improving measurement accuracy and controlling uncertainty. Early systems such as Sea Beam extended seabed surveys from individual lines to fan-shaped swaths [42]. Studies of attitude, sound speed, sidelobes, and beam footprints subsequently clarified the sources of systematic error [43]. The CUBE method uses statistical redundancy in dense observations to handle outliers and estimate uncertainty [44]. MBES measurements are jointly affected by beam count, swath width, positioning, attitude, sound speed, and post-processing parameters [22].
MBES data are now used for seabed morphology interpretation, anomaly identification, backscatter correction, and sediment classification. Cui et al. [45] combined prior constraints with geostatistical prediction to identify anomalous points while preserving terrain features. Hiroji and Clarke [46] corrected system artifacts through radiometric beam-pattern extraction and relative calibration. For sediment classification, CNNs with feature optimization [47], decision fusion of deep and shallow learning [48], and multiple imputation [49] address feature representation, classification, and missing data, respectively. These methods broaden MBES applications, but their results remain dependent on survey-line design, angular response, and field calibration quality.
MBES supports continuous riverbed mapping, scour surveys, and inspection of exposed foundation surfaces. It can also survey vertical or steep structures, including caisson walls and pile sidewalls, when mounting orientation, steering range, and survey geometry provide a suitable view. Coverage of a particular surface depends on beam direction, incidence angle, footprint, and occlusion. Thus, downward-looking and side-looking configurations serve different inspection geometries.
(2) Three-dimensional imaging sonar
Three-dimensional imaging sonar encompasses more than one equipment type. Real-time matrix-array or phased-array sonar uses a two-dimensional transducer array to resolve azimuth, elevation, and range simultaneously within a single transmission. It directly displays volumetric images at relatively high update rates. Three-dimensional mechanically scanned sonar combines a multibeam sonar head with mechanical rotation, progressively accumulating sector or spherical scans to generate a point cloud. The former suits monitoring of dynamic operations and rapid component imaging; the latter suits localized, high-density measurements under stable deployment conditions. Both are three-dimensional sonar systems, but differ in real-time capability, scanning method, and error sources.
Three-dimensional acoustic imaging has developed around array beamforming, computational efficiency, and multi-view fusion. Early research established frameworks for three-dimensional acoustic image generation and processing [50]. Moving acoustic-lens experiments and registration of multiple range views further demonstrated the feasibility of spatial observation and scene reconstruction [51,52]. Subsequently, fast beamforming methods, including the chirp z-transform (CZT), reduced the computational demands of three-dimensional imaging [53]. Online modeling methods converted sequential range images into structural point clouds [54]. Together, these advances established the technical basis for real-time volumetric imaging and multi-view point-cloud fusion.
Matrix-array sonar is a principal form of real-time volumetric acoustic imaging. Its observations can be processed as images or point clouds for component extraction and reconstruction. Sewer point-cloud segmentation provides an example of processing underwater engineering geometry [55]. The real-time detection transformer (RT-DETR) has also been used for image-based underwater bridge-pier crack detection [56]. Mechanically scanned systems accumulate point clouds through rotation, so scan duration and platform stability are integral to their acquisition process.
Bridge engineering cases illustrate these operating roles. Yan et al. [13] used an Echoscope 4G C500 to observe caisson-foundation sidewalls and chamfers from close viewpoints. Zhang et al. [57] investigated denoising of locally acquired three-dimensional sonar point clouds, and Yan et al. [58] used sonar point clouds for steel-structure extraction, reconstruction, and corrosion-pit description. These applications connect acoustic imaging with local component morphology and damage interpretation.
Engineering deployments combine acquisition modes according to the target. Caisson-joint inspection can use MBES for initial coverage and three-dimensional scanning sonar for local observations [59]. Oscillatory FLS provides another route to spatial reconstruction through changing viewpoints [60]. Optical structured-light measurements supply detailed surface geometry [27].
4.4. Technology Selection and Acoustic-Optical Coordination
Equipment selection follows the information required from the target. MBES provides riverbed and structural soundings across a swath; volumetric sonar acquires an observation volume; and mechanically scanned sonar collects directions over a scan. Backscatter and angular response add information about the surveyed surface [61]. Table 2 compares acquisition principles, the information produced, and engineering uses. Acoustic–optical coordination begins with acoustic localization of a region and continues with close optical or laser observation of the same component. Extrinsic calibration, time alignment, refraction correction, and shared coordinates connect the two views. Acoustic geometry describes the broader structural setting, while optical texture and surface boundaries support local interpretation.
Table 2.
Comparison of MBES and three-dimensional imaging sonar for underwater structural inspection.
Table 3 presents representative equipment configurations and selected published parameters. Frequency, range, field of view, and acquisition mode describe how the systems operate and the scale of their intended observations. The entries are organized by technology type to complement the principle-based discussion.
Table 3.
Representative acoustic equipment, acquisition modes, and selected published specifications.
5. Data Analysis and Interpretation
5.1. Two-Dimensional Sonar Image Processing and Indirect Three-Dimensional Reconstruction
Image processing extracts target information from acoustic intensity observations. Enhancement, detection, segmentation, and multi-frame reconstruction address different tasks, from improving visible contours to recovering spatial structure. Table 4 summarizes these methods and their engineering outputs.
(1) Image enhancement and target recognition
SSS and FLS images are affected by sidelobes, water-column reverberation, and noise, producing blurred edges and uneven contrast. Deconvolution and multiscale filtering restore contours [15,33], while simulated noise and near-surface artifact models support targeted denoising [68,69]. The preservation of target boundaries is particularly important when the enhanced image feeds subsequent segmentation or reconstruction.
FLS interpretation is affected by missing elevation information and nonuniform resolution. Conventional recognition methods use histograms of oriented gradients (HOG), local binary patterns (LBP), and acoustic shadows. Deep networks learn multiscale features from training images. FLS odometry provides pose constraints for reconstruction across frames [9], while lightweight segmentation models offer architectures for resource-constrained underwater platforms [70].
Multiscale networks address variation in target size [71]. The convolutional neural network–Receptance Weighted Key Value hybrid (CNN-RWKV) combines local texture with sequence information [72], while imaging and reflection models describe differences among seabed materials [73]. Studies combining sonar recognition with building information modeling (BIM) in bridge applications connect detected regions with structural information [74,75]. Detection and segmentation identify where a target or region occurs; geometric analysis then describes its dimensions and spatial relationship to a reference.
(2) Indirect three-dimensional reconstruction under multi-view constraints
Indirect three-dimensional reconstruction from two-dimensional sonar sequences depends on platform motion, multi-view observations, and pose fusion. Rapidly exploring random tree (RRT) viewpoint planning can optimize multi-view observation paths [18]. Adaptive region-of-interest (ROI) Radon transforms improve the stability of inter-frame rotation estimation at low signal-to-noise ratios [76]. Fusion of Doppler velocity log (DVL) and inertial measurement unit (IMU) data provides pose constraints for multiple two-dimensional observations [77]. Orthogonal dual-sonar and probabilistic reconstruction methods improve the sparsity and incompleteness of single-view point clouds [78,79,80]. Compared with direct three-dimensional sonar measurements, indirect reconstruction reuses existing two-dimensional equipment. However, its point-cloud accuracy is more sensitive to pose drift, observation overlap, and geometric assumptions, making it suitable for cost-constrained applications or localized reconstruction.
(3) Deep learning and foundation models in sonar image processing
Vision Transformers and sonar-adapted Segment Anything Model (SAM) methods have been applied to acoustic image segmentation. Fine-tuning, collaborative prompts, and embedding compensation adapt image representations to blurred boundaries and sonar-specific appearance [81,82]. Acoustic shadows, reverberation, and intensity variation also motivate specialized enhancement and segmentation. Point Transformer, PointNet, and PointNet++ provide point-set representations for subsequent analysis of reconstructed geometry [83,84,85].
Table 4.
Processing tasks, representative approaches, and the interpretation of their outputs.
5.2. Acquisition of Three-Dimensional Sonar Point Clouds
Three-dimensional point clouds represent riverbed and component surfaces as spatial samples. They support contour extraction, damage localization, and geometric description [12,13,14]. Calibration, sound-speed correction, attitude compensation, coordinate transformation, and overlapping views establish their spatial arrangement. Figure 2 connects acoustic scanning of a pier with the Acquire–Align–Extract–Describe sequence and the sensor-to-platform-to-world coordinate transformations.
Figure 2.
Acquisition and processing of three-dimensional sonar point clouds: (a) acoustic scanning of a bridge pier; (b) acquisition of raw scans, alignment through calibration, filtering and registration, extraction through segmentation and outlier removal, and description through geometry fitting and defect measurement; and (c) chained transformations from the sensor frame (s) through the platform frame (p) to the world frame (w). The two transformations represent the calibrated sensor mounting position and orientation and the platform position and attitude, respectively. D and H illustrate component diameter and height. ENU, east–north–up; GNSS, Global Navigation Satellite System; IMU, inertial measurement unit.
(1) Direct acquisition
Direct acquisition of three-dimensional point clouds primarily uses MBES, three-dimensional imaging sonar, three-dimensional mechanically scanned sonar, and real-time three-dimensional acoustic cameras. These systems calculate range from echo travel time. Beam azimuth and elevation, platform attitude, and positioning data are combined to transform observation points from the sonar coordinate system to the engineering coordinate system. Acquisition also requires time synchronization, sound-speed profile correction, and consistent sensor extrinsic parameters. In Figure 2c, the mounting calibration defines the sensor-to-platform transformation. For a surface-based platform, Global Navigation Satellite System (GNSS) positioning and IMU attitude locate the observations in an east–north–up (ENU) world frame.
Huang et al. [12] used MBES riverbed point clouds around bridge piers to describe scour-hole morphology. Xiao [59] used three-dimensional scanning sonar and a measurement bracket for local caisson-joint observations. These examples represent area-scale riverbed inspection and close component inspection. Filtering, registration, and fusion connect observations from different views before target extraction and geometric analysis [14].
(2) Indirect acquisition
Indirect acquisition uses FLS, SSS, or sonar profile sequences to recover three-dimensional morphology. It relies on platform motion, mechanical sweep scanning, multi-view observations, dual-sonar constraints, or pose fusion. The key is to establish correspondence among pixels or range observations, beam geometry, and platform pose. This compensates for the elevation and height information missing from individual two-dimensional sonar frames. Specific methods are discussed in Section 5.1 (2).
The acquisition route follows the target scale, viewing geometry, and deployment setting. MBES provides swath observations of riverbeds and accessible structural surfaces. Volumetric sonar supplies rapid near-field updates, while mechanical scanning accumulates dense local samples over time. Reconstruction from 2D sequences uses platform motion and overlapping views to recover spatial information. Scan duration, accessible viewpoints, and the coordinate reference distinguish the practical use of these routes.
5.3. Three-Dimensional Sonar Point-Cloud Processing and Metric Extraction
Point-cloud processing extracts riverbed and component geometry from observations containing outliers, water-column returns, density variations, and missing regions. Figure 2b groups the processing tasks into four stages. Acquire supplies raw scans from different viewpoints; Align combines calibration, filtering, and multi-scan registration; Extract separates the component from riverbed and outlier points; and Describe fits reference geometry and measures component dimensions or local deviations. Figure 2c shows the coordinate transformations underlying scan alignment, while the methods below address the processing steps within this sequence.
(1) Denoising, registration, and quality control
Preprocessing brings observations into common coordinates and removes isolated or inconsistent points. Filtering, simplification, registration, and fusion retain the surfaces and boundaries relevant to the task, including pier bases, scour edges, corrosion pits, and component contours.
The Point Cloud Library (PCL) provides filtering, feature estimation, registration, and segmentation tools [86]. For bridge applications, Yan et al. [13] examined reconstruction from sonar point clouds, and Luo et al. [87] combined filtering, morphological processing, and wavelet denoising to recover pier contours. Rectangular information granulation [88] and optimized outlier detection [89] address 3D sonar data and MBES outliers. Point density, range, and target scale guide the choice of neighborhoods and filtering parameters.
Registration establishes the spatial relationship among views and across inspections. Iterative closest point (ICP) [90] and multi-view surface registration [91] provide fine alignment based on corresponding geometry. Simultaneous localization and mapping (SLAM) combines sonar, vision, inertial measurements, and pressure information [92]. Sonar–laser registration connects submerged and exposed surfaces [28], while visual–inertial–depth fusion and loop closure address accumulated drift [93]. Probabilistic registration, 3D scan matching, and FLS-based SLAM provide further approaches for sparse acoustic observations [94,95,96,97]. Overlap and stable geometric features influence the resulting alignment.
(2) Target extraction and semantic segmentation
Target extraction and semantic segmentation separate components, riverbed surfaces, fouling, and water-column noise, providing prerequisites for damage localization and geometric quantification. Rule-based methods depend on geometric priors and parameter calibration, whereas learning-based methods depend on samples, class definitions, and stability across scenes.
Geometric-prior methods use component shape to guide extraction with relatively small training requirements. Curve fitting, region growing, minimum cuts, and density-based spatial clustering of applications with noise (DBSCAN) are representative approaches. Applications include separating pile groups from riverbeds [98], locating damage through robust statistics and clustering [14], and extracting pipe cross-sections from multibeam water-column data [99,100]. Point density, range, and target scale determine suitable fitting and clustering settings.
PointNet and PointNet++ model unordered point sets and local neighborhoods, while dynamic graph convolutional neural networks (DGCNNs), RandLA-Net with random sampling and local aggregation, and Point Transformer provide graph, large-scale, and attention-based representations [83,84,85,101,102]. In acoustic point clouds, noise, variable density, and blurred boundaries affect neighborhoods and learned features. These architectures provide modules for methods adapted to underwater inspection data.
Underwater point-cloud methods address bridge foundations, pipelines, and sewer networks. Lightweight graph convolution supports bridge-foundation and terrain segmentation [103]. Cross-scale and convolutional point Transformers represent small targets and variable sampling density [104,105], while semi-supervised learning uses limited annotations and addresses class imbalance [106]. Table 5 summarizes these methodological groups and their characteristic uses.
Table 5.
Comparison of target extraction and semantic segmentation methods for three-dimensional sonar point clouds.
(3) Geometric feature representation and damage quantification
A geometric description links an extracted component to a defined reference. Common quantities include cross-sectional dimensions, surface flatness, scour depth and extent, foundation exposure, surface-loss area, and displacement. Coordinate directions, the analysis region, and the reference surface determine how these quantities are obtained.
Normals, curvature, shape descriptors, and model fitting represent point-cloud geometry. Combined with segmentation, they locate bridge-surface defects [107] and describe pier morphology [25]. Scour is measured relative to a riverbed surface, design elevation, or historical observation [12]. Component sections can be compared with design geometry, fitted intact regions, or earlier models to describe relative deviations [14].
Local damage analysis describes defect location, dimensions, area, depth, and distribution. Multi-distance clustering and adaptive alpha shapes have been used to characterize steel-cofferdam corrosion pits [58], while refraction correction and multi-camera calibration support optical description of pier surfaces [26]. Scour prediction models describe risk trends [108], and field observations provide the corresponding riverbed geometry.
Nonplanar components and irregular defects affect reference fitting and boundary extraction [29]. Acoustic observations locate surface-loss and suspected damage regions, while close optical, laser, or tactile observations reveal fine boundaries and texture [58]. Comparisons with design geometry or historical models describe translation, rotation, and overall component deformation.
Figure 3 summarizes representative deterioration processes and associated geometric changes in water-exposed concrete bridge substructures. Local scour removes surrounding bed material and increases foundation exposure, whereas concrete deterioration modifies the structural surface and cross-section. Surface abrasion involves the progressive removal of cement paste and aggregate, while localized section loss represents a larger-scale reduction in structural geometry. Under suitable exposure conditions, reinforcement corrosion can generate expansive products that promote cover cracking and spalling. These processes may coexist, so similar surface features do not necessarily indicate the same underlying cause. Their geometric manifestations provide inspection targets, but identifying the governing mechanism requires evidence beyond surface geometry alone.
Figure 3.
Representative deterioration in water-exposed concrete bridge substructures: (a) local scour and foundation exposure; (b) localized section loss; (c) surface abrasion; and (d) corrosion-induced cracking and cover spalling. Blue arrows indicate flow, particle transport, or chloride ingress; orange arrows indicate corrosion-product expansion. Dashed lines mark the original bed level in (a) and structural profile in (b). Schematics are not to scale.
Acoustic imaging describes component geometry and the surrounding riverbed, while local optical or contact observations resolve surface texture, cracks, and spalling boundaries. Recording these observations against the same component and coordinate reference connects the location of a geometric anomaly with its surface description.
5.4. Measurement Principles and Interpretation of Inspection Results
Acoustic ranging relates echo travel time to distance. In a homogeneous medium, the two-way travel relation and the ideal bandwidth-limited range resolution are given by Equation (1). For a real aperture at small angles, Equation (2) relates cross-range resolution to range and angular width. These relations explain how bandwidth, aperture, and wavelength influence the detail represented by acoustic observations.
Here, r is range (m), c is sound speed (m/s), t is two-way travel time (s), B is signal bandwidth (Hz), and Δr is ideal range resolution (m).
In Equation (2), δx is cross-range resolution (m), R is target range (m), θ is angular width (rad), λ is wavelength (m), and D is the physical aperture (m). The relation describes real-aperture geometry; SAS forms its along-track aperture through coherent platform motion.
Processing metrics describe different parts of the inspection task. Precision is the fraction of predicted detections that are correct, and recall is the fraction of reference targets detected, under the stated matching rule. Intersection over union (IoU) is the overlap of predicted and reference regions divided by their union; mean IoU (mIoU) averages this value over the evaluated classes. Boundary F1 is the harmonic mean of boundary precision and recall, calculated with a stated spatial matching tolerance. Root-mean-square error (RMSE) is the square root of the mean squared difference between an estimated quantity and its reference. Region and boundary metrics describe segmentation, while dimensional residuals describe geometric measurements.
Spatial resolution describes the separation at which features can be distinguished. Point density describes the number of samples in an area or volume. Repeatability describes the spread of repeated observations under the stated conditions, and measurement accuracy concerns agreement with a reference quantity. These concepts connect the sensing mechanism, sampling pattern, and processing result to different aspects of inspection quality.
Table 6 relates image, point-cloud, contact, and time-series information to inspection tasks. The principal outputs range from visible surface features to component geometry and changes between observations. Table 7 summarizes physical and processing factors that influence these outputs and the corresponding acquisition or processing controls.
Table 6.
Representative inspection outputs and their use in structural interpretation.
Table 7.
Physical and processing factors affecting underwater inspection information.
Scour depth is measured vertically from the reference riverbed level to the scoured bed at the piles, as represented in Figure 3a. The foundation exposure describes the portion of the foundation uncovered by sediment removal. Local section dimensions, surface-loss depth and area, crack width, and spalling extent describe the component changes represented in Figure 3b–d. Joint opening and offset are additional inspection quantities discussed in the engineering applications. Component location, viewing geometry, and the selected reference identify where and how each quantity is measured.
6. Engineering Applications and Condition Assessment
6.1. Engineering Cases of Underwater Bridge Structural Inspection
Three-dimensional sonar has been applied to caisson foundations, bridge piers, steel cofferdams, and bridge-site riverbeds. Yan et al. [13] reconstructed caisson geometry from close acoustic observations of sidewalls and chamfers. Zhang et al. [57] examined denoising of local sonar point clouds, and Yan et al. [58] characterized corrosion pits on steel cofferdams. High-resolution sonar and deep learning have also been used for local damage recognition, concrete-crack detection, and pier-surface interpretation [111,112,113]. Table 8 summarizes representative engineering targets and inspection outputs.
In scour inspection, Huang et al. [12] compared MBES-derived riverbed sections with design references to reconstruct scour morphology and its changes. Zhang et al. [14] separated pile groups from riverbed point clouds using minimum cuts. Xiao [59] combined initial MBES screening with detailed three-dimensional scanning sonar measurements to inspect caisson joints. Field research on Qiantang River bridge piers also demonstrated the applicability of multi-source sonar to scour morphology surveys [114]. These engineering results show that combining broad surveys with detailed local measurements improves anomaly detection efficiency and reduces missed detections caused by limited single-sensor coverage.
Pipeline, offshore-foundation, and harbor-caisson applications provide additional examples of underwater filtering, segmentation, target extraction, and geometric interpretation [32,59,100,115,116]. Guided-wave ultrasonic non-destructive testing (NDT) supplies a different information type, illustrated by void imaging in underwater concrete slabs [117]. These applications show how sensing mechanisms address surface geometry, structural surroundings, and internal features.
Across these applications, acoustic imaging supplies geometry under low visibility, and the acquisition viewpoint determines which surfaces are observed [12,13,14,57,58]. Filtering, registration, and component separation organize the spatial information before local feature analysis. Known dimensions, repeated observations, and other sensing modalities connect the resulting geometry with the inspected component [58,59].
Table 8.
Engineering cases of three-dimensional sonar inspection of underwater bridge components.
6.2. From Inspection Metrics to Condition Assessment
Condition assessment connects inspection information with the structural component and the maintenance question. Coordinates, component identifiers, and timestamps locate the observation. The selected reference surface and geometric variable describe the feature, while calibration and repeat observations characterize measurement quality. Optical, laser, or tactile information adds local surface detail. The resulting record can then be interpreted against inspection guidance, structural assessment criteria, and project requirements.
Table 9 summarizes standards and guidance relevant to these assessment tasks. IHO S-44 Edition 6.2.0 (October 2024) distinguishes a priori uncertainty estimated during survey planning from a posteriori uncertainty evaluated using acquired data [118]. Its survey-quality requirements concern hydrographic observations, while bridge-evaluation and scour guidance address structural interpretation and maintenance decisions [119,120,121,122,123]. The assessment framework depends on the component, damage mechanism, and applicable inspection or maintenance rules.
Table 9.
Standards and guidance relevant to underwater inspection and condition assessment.
Complementary NDT methods provide information about internal defects or material condition, while fixed sonar and other installed sensors record temporal changes [109,117]. Their information can be associated with acoustic and optical surface observations through component-based inspection records.
6.3. Linking Point-Cloud Evidence to Maintenance Decisions
Table 10 links typical inspection findings with condition information and possible maintenance responses. Shared coordinates and component identifiers connect observations from different surveys [92,93]. Scour depth, foundation exposure, surface-loss extent, joint condition, and section geometry can then be considered alongside current, sediment, and foundation information when planning repeat inspections or interventions [126,127].
Table 10.
Connections between inspection findings, condition information, and maintenance responses.
Scour models support interpretation of the environmental and foundation factors associated with an observed riverbed. Explainable machine learning has incorporated current, sediment, foundation geometry, and flood resilience [126], while probabilistic models describe variability in local scour [127]. Inspection data provide riverbed profiles and foundation exposure for comparison with these model outputs.
Digital twins organize component geometry, inspection findings, and maintenance records across the asset life cycle [17,128]. Common coordinates associate raw observations, calibration information, processing versions, point-cloud products, and damage descriptions with the underwater component model [129,130]. This organization supports repeated-survey comparisons and the retrieval of evidence for maintenance decisions.
6.4. Repeated Surveys and Temporal Change Detection
Repeated observations describe the development of scour, surface loss, and deformation. Scour evolution can be examined through direct differences between registered point clouds or through changes in morphological features [16]. Common reference bases, acquisition records, and processing settings support comparisons across surveys, while survey coverage records distinguish newly observed surfaces from previously inspected areas.
Repeated point clouds are aligned through coarse registration and fine ICP registration [90,91]. Multiscale model-to-model cloud comparison (M3C2) estimates changes along surface normals and provides confidence intervals [110]. Density, local roughness, and registration affect this comparison. Continuous fixed observations describe short-period scour processes [109], whereas periodic vessel or USV surveys describe changes across larger areas. Stable components and control points link both types of records.
7. Conclusions and Future Directions
This review organizes underwater bridge inspection around operational approaches, inspection equipment, data analysis, and condition assessment. Platform accessibility and sensor viewing geometry determine how components are observed. Acoustic, optical, laser, and contact methods provide complementary information about the riverbed, component shape, and local surface condition. Image and point-cloud processing connect those observations with target identification, geometric description, and temporal comparison. The resulting synthesis explains the technical roles of inspection methods across the acquisition-to-assessment process.
Coordinated operations connect vessel or USV area surveys, near-field ROV inspection, local diver examination, and fixed monitoring. Shared coordinates, timestamps, and component identifiers provide a basis for this coordination. Future development of autonomous navigation and cooperative positioning can improve route planning and repeated access to the same structural regions.
Multisensor inspection combines acoustic coverage with optical, laser, and tactile surface detail. Joint calibration and the alignment of observations from different viewpoints are central topics for further technical development. The complementary roles of these methods are especially relevant where a single viewing geometry leaves part of a component unobserved.
Data analysis is developing toward models that account for underwater imaging characteristics, variable point density, limited annotations, and component geometry. Method development can connect denoising, registration, segmentation, and geometric interpretation more closely, so that processing preserves the features relevant to the inspection task. Repeated-survey datasets and comparisons across operating settings are useful directions for this work.
Condition assessment benefits from linking component-level observations with inspection history, structural information, and maintenance records. Future work can develop consistent descriptions of defects and temporal changes, and examine how these records inform inspection intervals and intervention priorities. Integration with digital twins offers a practical route for managing this information throughout bridge operation.
Author Contributions
Conceptualization, J.Q. and F.W.; methodology, J.Q., Q.S. and F.W.; investigation, J.Q., Q.S., F.W., Q.L. and W.W.; writing—original draft preparation, J.Q.; writing—review and editing, J.Q., Q.S., F.W., Q.L. and W.W.; visualization, J.Q. and Q.S.; supervision, F.W.; project administration, F.W.; funding acquisition, F.W. All authors have read and agreed to the published version of the manuscript.
Funding
This research was funded by the Ningbo Science and Technology Innovation Leading Talent Project (Grant No. 2025QL068) and Ningbo City’s Major Application Demonstration Program for “Science and Technology Innovation Yongjiang 2035” (Grant No. 2024Z012).
Data Availability Statement
All evidence is derived from the cited literature and standards.
Acknowledgments
During the preparation of this manuscript, the authors used DeepSeek V4.1 Flash to assist with language polishing and typesetting of the manuscript, and Seedream 5.0 Pro (ByteDance) for the conceptual design of Figure 3. The authors have carefully reviewed and revised all AI-generated outputs and take full responsibility for the content of this publication.
Conflicts of Interest
Author Qingbing Li was employed by the company Ningbo Communications Engineering Construction Group Co., Ltd. The remaining authors declare that the research was conducted in the absence of any commercial or financial relationships that could be construed as a potential conflict of interest.
Abbreviations
The following abbreviations are used in this manuscript:
| AUV | autonomous underwater vehicle |
| BIM | building information modeling |
| CNN | convolutional neural network |
| CNN-RWKV | convolutional neural network–Receptance Weighted Key Value hybrid |
| CZT | chirp z-transform |
| DBSCAN | density-based spatial clustering of applications with noise |
| DGCNN | dynamic graph convolutional neural network |
| DVL | Doppler velocity log |
| ENU | east–north–up |
| FLS | forward-looking sonar |
| GNSS | Global Navigation Satellite System |
| HOG | histograms of oriented gradients |
| ICP | iterative closest point |
| IMU | inertial measurement unit |
| IoU | intersection over union |
| LBP | local binary patterns |
| LiDAR | light detection and ranging |
| M3C2 | multiscale model-to-model cloud comparison |
| MBES | multibeam echo sounder |
| mIoU | mean intersection over union |
| NDT | non-destructive testing |
| PCL | Point Cloud Library |
| RMSE | root-mean-square error |
| ROI | region of interest |
| ROV | remotely operated vehicle |
| RRT | rapidly exploring random tree |
| RT-DETR | real-time detection transformer |
| SAM | Segment Anything Model |
| SAS | synthetic aperture sonar |
| SLAM | simultaneous localization and mapping |
| SSS | side-scan sonar |
| USV | unmanned surface vehicle |
References
- Waldner, J.F.; Sadhu, A. A systematic literature review of unmanned underwater vehicle-based structural health monitoring technologies. J. Infrastruct. Intell. Resil. 2024, 3, 100112. [Google Scholar] [CrossRef] [Scilit]
- Lü, Z.D. Research and implementation of key technologies for the Hangzhou Bay Bridge. China Civ. Eng. J. 2006, 39, 78–82, 87. (In Chinese) [Google Scholar]
- Jing, Q.; Zheng, S.C.; Liang, P.; Wang, J.F. Intelligent operation and maintenance technologies and engineering practice for the Hong Kong–Zhuhai–Macao Bridge. China J. Highw. Transp. 2023, 36, 143–156. (In Chinese) [Google Scholar]
- Huy, D.Q.; Sadjoli, N.; Azam, A.B.; Elhadidi, B.; Cai, Y.; Seet, G. Object perception in underwater environments: A survey on sensors and sensing methodologies. Ocean Eng. 2023, 267, 113202. [Google Scholar] [CrossRef] [Scilit]
- Ma, Y.; Wu, Y.; Li, Q.; Zhou, Y.; Yu, D. ROV-based binocular vision system for underwater structure crack detection and width measurement. Multimed. Tools Appl. 2023, 82, 20899–20923. [Google Scholar] [CrossRef] [Scilit]
- Wang, M.; Zhang, K.; Wei, H.; Chen, W.; Zhao, T. Underwater image quality optimization: Researches, challenges, and future trends. Image Vis. Comput. 2024, 146, 104995. [Google Scholar] [CrossRef] [Scilit]
- Li, C.; Guo, C.; Ren, W.; Cong, R.; Hou, J.; Kwong, S.; Tao, D. An underwater image enhancement benchmark dataset and beyond. IEEE Trans. Image Process. 2020, 29, 4376–4389. [Google Scholar] [CrossRef] [Scilit] [PubMed]
- Steiniger, Y.; Kraus, D.; Meisen, T. Survey on deep learning based computer vision for sonar imagery. Eng. Appl. Artif. Intell. 2022, 114, 105157. [Google Scholar] [CrossRef] [Scilit]
- Xu, W.; Yang, J.; Mao, J.; Lu, H.; Lu, C.; Liu, X. Direct forward-looking sonar odometry: A two-stage odometry for underwater robot localization. Remote Sens. 2025, 17, 2166. [Google Scholar] [CrossRef] [Scilit]
- Du, X.; Sun, Y.; Song, Y.; Dong, L.; Tao, C.; Wang, D. Recognition of underwater engineering structures using CNN models and data expansion on side-scan sonar images. J. Mar. Sci. Eng. 2025, 13, 424. [Google Scholar] [CrossRef] [Scilit]
- Li, J.; Wang, Z.; You, Z.; Zhao, Z.; Yuan, Z. U-SAS: U-shape network with multilevel enhancement and global decoding for synthetic aperture sonar image semantic segmentation. IEEE Sens. J. 2025, 25, 1799–1813. [Google Scholar] [CrossRef] [Scilit]
- Huang, Z.; Zhu, Y.; Xiong, W.; Cai, C. Bridge scour morphology identification and reconstruction using 3D sonar point cloud data. Autom. Constr. 2025, 175, 106205. [Google Scholar] [CrossRef] [Scilit]
- Yan, J.; Zhu, Y.; Xiong, W.; Zhang, S.; Zhang, J. High-fidelity 3D sonar point cloud data reconstruction of underwater bridge caisson foundation for scour inspection. Measurement 2025, 244, 116480. [Google Scholar] [CrossRef] [Scilit]
- Zhang, S.; Zhu, Y.; Xiong, W.; Cai, C.; Zhang, J. Bridge substructure damage morphology identification based on the underwater sonar point cloud data. Adv. Eng. Inform. 2024, 62, 102936. [Google Scholar] [CrossRef] [Scilit]
- Zhang, C.; Chai, Y.; Wang, X.; Chen, Y. Enhancing sonar image quality for underwater object recognition in marine environments. Ocean Eng. 2025, 336, 121862. [Google Scholar] [CrossRef] [Scilit]
- Xiong, W.; Yan, J.; Zhu, Y.J. A review of sonar based bridge underwater scour inspection and identification. Ocean Eng. 2026, 355, 125084. [Google Scholar] [CrossRef] [Scilit]
- Mousavi, V.; Rashidi, M.; Mohammadi, M.; Samali, B. Evolution of digital twin frameworks in bridge management: Review and future directions. Remote Sens. 2024, 16, 1887. [Google Scholar] [CrossRef] [Scilit]
- Zacchini, L.; Franchi, M.; Ridolfi, A. Sensor-driven autonomous underwater inspections: A receding-horizon RRT-based view planning solution for AUVs. J. Field Robot. 2022, 39, 499–527. [Google Scholar] [CrossRef] [Scilit]
- Sun, W.; Hou, S.; Wu, G.; Zhang, Y.; Zhao, L. Two-step rapid inspection of underwater concrete bridge structures combining sonar, camera, and deep learning. Comput.-Aided Civ. Infrastruct. Eng. 2025, 40, 2650–2670. [Google Scholar] [CrossRef] [Scilit]
- Zhang, J.; Han, F.; Han, D.; Yang, J.; Zhao, W.; Li, H. Advanced underwater measurement system for ROVs: Integrating sonar and stereo vision for enhanced subsea infrastructure maintenance. J. Mar. Sci. Eng. 2024, 12, 306. [Google Scholar] [CrossRef] [Scilit]
- Pecheux, N.; Creuze, V.; Comby, F.; Tempier, O. Self Calibration of a Sonar–Vision System for Underwater Vehicles: A New Method and a Dataset. Sensors 2023, 23, 1700. [Google Scholar] [CrossRef] [Scilit] [PubMed]
- Sauter, G.; Fabbri, S.C.; Frischknecht, C.; Anselmetti, F.S.; Kremer, K. A systemic approach to managing uncertainties in repetitive multibeam bathymetric surveys. Environ. Model. Softw. 2025, 186, 106333. [Google Scholar] [CrossRef] [Scilit]
- Chen, X.; Wu, G.; Hou, S.; Fan, J.; Dang, J.; Chen, Z. Development of tactile imaging for underwater structural damage detection. Sensors 2019, 19, 3925. [Google Scholar] [CrossRef] [Scilit] [PubMed]
- Talamkhani, S.; Liu, K. Underwater vision-enhanced image segmentation for supporting automated inspection of underwater bridge components. Autom. Constr. 2025, 175, 106230. [Google Scholar] [CrossRef] [Scilit]
- Wu, T.; Hou, S.; Wu, Z.; Xiong, W.; Zhang, J.; Shao, X.; He, X.; Wu, G. Underwater bridge pier morphology measurement method via refraction correction and multi-camera calibration. Comput.-Aided Civ. Infrastruct. Eng. 2025, 40, 2324–2350. [Google Scholar] [CrossRef] [Scilit]
- Wu, T.; Hou, S.; Wu, Z.; Xiong, W.; He, X. Optical measurement method for large-scale surface defects on underwater bridge piers. Eng. Struct. 2026, 350, 121966. [Google Scholar] [CrossRef] [Scilit]
- Hu, Q.; Zhu, H.; Yu, M.; Fan, Z.; Zhang, W.; Liu, X.; Li, Z. A novel 3D detection system with target keypoint estimation for underwater pipelines. Ocean Eng. 2024, 309, 118319. [Google Scholar] [CrossRef] [Scilit]
- Moisan, E.; Charbonnier, P.; Foucher, P.; Grussenmeyer, P.; Guillemin, S.; Koehl, M. Adjustment of sonar and laser acquisition data for building the 3D reference model of a canal tunnel. Sensors 2015, 15, 31180–31204. [Google Scholar] [CrossRef] [Scilit] [PubMed]
- Wu, T.; Hou, S.; Wu, Z.; He, X.; Wu, G. Underwater defect measurement for bridge piers via non-planar refraction correction. Autom. Constr. 2026, 182, 106753. [Google Scholar] [CrossRef] [Scilit]
- Xie, K.B.; Yang, J.; Qiu, K. A dataset with multibeam forward-looking sonar for underwater object detection. Sci. Data 2022, 9, 739. [Google Scholar] [CrossRef] [Scilit] [PubMed]
- Sineglazov, V.; Savchenko, M. FrYOLO: Fractional-Order Feature Propagation for Object Detection in Forward-Looking Sonar. J. Mar. Sci. Eng. 2026, 14, 1102. [Google Scholar] [CrossRef] [Scilit]
- Wang, Y.; Tao, L.; Yuan, M.; Yang, J. Three-dimensional reconstruction and scour volume detection of offshore wind turbine foundations based on side-scan sonar. Sensors 2026, 26, 386. [Google Scholar] [CrossRef] [Scilit] [PubMed]
- Liu, J.; Pang, Y.; Yan, L.; Zhu, H. An image quality improvement method in side-scan sonar based on deconvolution. Remote Sens. 2023, 15, 4908. [Google Scholar] [CrossRef] [Scilit]
- Luo, Y.; Huo, G.; Cheng, Z.; Zhang, W. CSTC-YOLOv8: Underwater object detection model based on improved YOLOv8 for side scan sonar images. J. Electron. Imaging 2025, 34, 023019. [Google Scholar] [CrossRef] [Scilit]
- Zhao, B.Y.; Zhou, Q.; Huang, L.J.; Zhang, Q. DNTFE-Net: Distant Neighboring-Temporal Feature Enhancement Network for side scan sonar small object detection. Expert Syst. Appl. 2024, 258, 125107. [Google Scholar] [CrossRef] [Scilit]
- Yu, B.J.; Lin, R.S.; Zhou, H.X.; Zhang, J.X.; Zhang, X.W. Physics-Informed Side-Scan Sonar Perception: Tackling Weak Targets and Sparse Debris via Geometric and Frequency Decoupling. Sensors 2026, 26, 1938. [Google Scholar] [CrossRef] [Scilit] [PubMed]
- Ultralytics. Ultralytics YOLO11. Available online: https://docs.ultralytics.com/models/yolo11/ (accessed on 22 October 2026).
- Tian, Y.; Ye, Q.; Doermann, D. YOLOv12: Attention-Centric Real-Time Object Detectors. arXiv 2025, arXiv:2502.12524. [Google Scholar] [CrossRef] [Scilit]
- Arhant, Y.; Lopera Tellez, O.; Neyt, X.; Pižurica, A. D4SC: Deep Supervised Semantic Segmentation for Seabed Characterization and Uncertainty Estimation for Large Scale Mapping. IEEE J. Sel. Top. Appl. Earth Obs. Remote Sens. 2024, 17, 18038–18057. [Google Scholar] [CrossRef] [Scilit]
- Su, J.H.; Xu, D.Y.; Qiu, L.; Xu, Z.P.; Lin, L.X.; Zheng, J.C. A High-Accuracy Underwater Object Detection Algorithm for Synthetic Aperture Sonar Images. Remote Sens. 2025, 17, 2112. [Google Scholar] [CrossRef] [Scilit]
- Zhang, J.; Dai, S.; Jiang, W.; Cui, X.; Li, J. GPRAformer: A Geometry-Prior Rational-Activation Transformer for Denoising Multibeam Sonar Point Clouds of Exposed Subsea Pipelines. Remote Sens. 2026, 18, 439. [Google Scholar] [CrossRef] [Scilit]
- Renard, V.; Allenou, J.-P. Sea Beam, Multi-Beam Echo-Sounding in “Jean Charcot”: Description, Evaluation and First Results. Int. Hydrogr. Rev. 1979, LVI, 35–67. [Google Scholar]
- de Moustier, C.; Kleinrock, M.C. Bathymetric artifacts in Sea Beam data. J. Geophys. Res. 1986, 91, 3407–3424. [Google Scholar] [CrossRef] [Scilit]
- Calder, B.R.; Mayer, L.A. Automatic Processing of High-Rate, High-Density Multibeam Echosounder Data. Geochem. Geophys. Geosyst. 2003, 4, 1048. [Google Scholar] [CrossRef] [Scilit]
- Cui, X.; Chang, B.; Zhang, S.; He, J.; Zhi, Z.; Zhang, W. Anomaly detection in multibeam bathymetric point clouds integrating prior constraints with geostatistical prediction. IEEE J. Sel. Top. Appl. Earth Obs. Remote Sens. 2024, 17, 17903–17916. [Google Scholar] [CrossRef] [Scilit]
- Hiroji, A.; Clarke, J.H. Radiometric beam pattern extraction and relative calibration method for backscatter strength data from motion-stabilized multibeam systems. IEEE J. Ocean. Eng. 2025, 50, 2261–2279. [Google Scholar] [CrossRef] [Scilit]
- Anokye, M.; Cui, X.; Yang, F.; Fan, M.; Luo, Y.; Liu, H. CNN multibeam seabed sediment classification combined with a novel feature optimization method. Math. Geosci. 2024, 56, 279–302. [Google Scholar] [CrossRef] [Scilit]
- Wan, J.; Qin, Z.; Cui, X.; Yang, F.; Yasir, M.; Ma, B.; Liu, X. MBES seabed sediment classification based on a decision fusion method using deep learning model. Remote Sens. 2022, 14, 3708. [Google Scholar] [CrossRef] [Scilit]
- Misiuk, B.; Brown, C.J. Multiple imputation of multibeam angular response data for high resolution full coverage seabed mapping. Mar. Geophys. Res. 2022, 43, 7. [Google Scholar] [CrossRef] [Scilit]
- Murino, V.; Trucco, A. Three-Dimensional Image Generation and Processing in Underwater Acoustic Vision. Proc. IEEE 2000, 88, 1903–1948. [Google Scholar] [CrossRef] [Scilit]
- Kamgar-Parsi, B.; Rosenblum, L.J.; Belcher, E.O. Underwater imaging with a moving acoustic lens. IEEE Trans. Image Process. 1998, 7, 91–99. [Google Scholar] [CrossRef] [Scilit] [PubMed]
- Castellani, U.; Fusiello, A.; Murino, V. Registration of multiple acoustic range views for underwater scene reconstruction. Comput. Vis. Image Underst. 2002, 87, 78–89. [Google Scholar] [CrossRef] [Scilit]
- Palmese, M.; Trucco, A. Chirp zeta transform beamforming for three-dimensional acoustic imaging. J. Acoust. Soc. Am. 2007, 122, EL191–EL195. [Google Scholar] [CrossRef] [Scilit] [PubMed]
- Castellani, U.; Fusiello, A.; Murino, V.; Papaleo, L.; Puppo, E.; Pittore, M. A complete system for on-line 3D modelling from acoustic images. Signal Process. Image Commun. 2005, 20, 832–852. [Google Scholar] [CrossRef] [Scilit]
- Liu, W.; Jiang, Y.; Li, H.; Yang, L.; Luo, H. Vector attention-based point cloud network for semantic segmentation of sewer sonar data. Eng. Appl. Artif. Intell. 2026, 163, 112891. [Google Scholar] [CrossRef] [Scilit]
- Lv, Z.; Dong, S.; Xia, Z.; He, J.; Zhang, J. Enhanced real-time detection transformer (RT-DETR) for robotic inspection of underwater bridge pier cracks. Autom. Constr. 2025, 170, 105921. [Google Scholar] [CrossRef] [Scilit]
- Zhang, F.; Li, S.; Gao, H.; Wu, Y. 3D sonar point cloud denoising constrained by local spatial features and global region growth algorithm. J. Mar. Sci. Eng. 2026, 14, 597. [Google Scholar] [CrossRef] [Scilit]
- Yan, J.; Zhu, Y.; Xiong, W.; Cai, C.; Zhang, J. A sonar point cloud driven method for underwater steel structure defects inspection. Ocean Eng. 2025, 325, 120770. [Google Scholar] [CrossRef] [Scilit]
- Xiao, B. Detection method for underwater dock joints: Underwater sonar imaging based on 3D technology. J. Meas. Eng. 2025, 13, 139–151. [Google Scholar] [CrossRef] [Scilit]
- Zhi, H.; Zhou, Z.; Wu, H.; Chen, Z.; Tian, S.; Zhang, Y.; Ruan, Y. Oscillatory forward-looking sonar based 3D reconstruction method for autonomous underwater vehicle obstacle avoidance. J. Mar. Sci. Eng. 2025, 13, 943. [Google Scholar] [CrossRef] [Scilit]
- Brennan, C.; Summers, G.; de Oliveira, L.M.C.; Lim, A. Enhanced angular range analysis: A novel object-based image analysis approach for seafloor characterisation. Mar. Geophys. Res. 2025, 46, 12. [Google Scholar] [CrossRef] [Scilit]
- Haidiying Deep Sea Technology Co., Ltd. Technical Specifications for the FLS800D Forward-Looking Target Detection Sonar. 2024. Available online: https://hdyocean-website.oss-cn-hangzhou.aliyuncs.com/pdfs/product/FLS800D.pdf (accessed on 10 June 2026).
- EDGETECH. 4205 Side Scan System: User Hardware Manual, 0021769_REV_J. 2025. Available online: https://www.edgetech.com/wp-content/uploads/2023/04/0021769_Rev_J.pdf (accessed on 10 June 2026).
- Kongsberg Discovery. HUGIN® 3000: Datasheet, 110-0047668/A. Available online: https://www.kongsberg.com/globalassets/kongsberg/1.-what-we-do/2.-ocean-space/1.-autonomous-and-uncrewed-solutions/hugin/documents/110-0047668-b-hugin_3000_datasheet.pdf (accessed on 10 June 2026).
- Beijing Hydro-Tech Marine Technology Co., Ltd. Hydro-Tech MS400P (Little Sprite) Multibeam Echo Sounder. Available online: https://www.hydro-techmarine.com/product_detail/ms400p (accessed on 10 June 2026).
- Coda Octopus Products Ltd. Echoscope 4G® C500. Available online: https://www.codaoctopus.com/products/3d/echoscope-4G-c500 (accessed on 10 June 2026).
- Teledyne Marine. BV5000 MK2: 3D Mechanical Scanning Sonar Product Datasheet. 2023. Available online: https://www.teledynemarine.com/en-us/products/SiteAssets/BlueView/Blueview%20BV5000%20MK2%20Product%20leaflet.pdf (accessed on 10 June 2026).
- Yang, T.; Zhang, T.; Yao, Y. SimNFND: A Forward-Looking Sonar Denoising Model Trained on Simulated Noise-Free and Noisy Data. Remote Sens. 2024, 16, 2815. [Google Scholar] [CrossRef] [Scilit]
- Liu, Y.; Negahdaripour, S. Ghost removal from forward-scan sonar views near the sea surface for image enhancement and 3-D object modeling. Remote Sens. 2024, 16, 3814. [Google Scholar] [CrossRef] [Scilit]
- Li, Y.; Zhang, X. Lightweight deep learning model for underwater waste segmentation based on sonar images. Waste Manag. 2024, 190, 63–73. [Google Scholar] [CrossRef] [Scilit] [PubMed]
- Wang, Z.; You, Z.; Xu, N.; Wang, B.; Huang, D.-S. Cross-scale feature interaction network for semantic segmentation in side-scan sonar images. IEEE J. Sel. Top. Appl. Earth Obs. Remote Sens. 2025, 18, 5928–5946. [Google Scholar] [CrossRef] [Scilit]
- Liu, X.; Yang, J.; Zhang, E.; Xu, W.; Lu, C. DSM-Seg: A CNN-RWKV hybrid framework for forward-looking sonar image segmentation in deep-sea mining. Remote Sens. 2025, 17, 2997. [Google Scholar] [CrossRef] [Scilit]
- Huang, C.; Zhao, J.H.; Zhang, H.M. Classification and analysis of seafloor sediments using hidden features from combined imaging mechanism and seafloor reflection model. IEEE Trans. Geosci. Remote Sens. 2025, 63, 5902214. [Google Scholar] [CrossRef] [Scilit]
- Hou, S.; Jiao, D.; Dong, B.; Wang, H.; Wu, G. Underwater inspection of bridge substructures using sonar and deep convolutional network. Adv. Eng. Inform. 2022, 52, 101545. [Google Scholar] [CrossRef] [Scilit]
- Cao, W.X.; Li, J.J.; Zhang, X.W.; Kang, F.; Wu, X.B. Sonar combines deep learning and building information modeling for underwater crack detection of concrete structures. Structures 2024, 70, 107834. [Google Scholar] [CrossRef] [Scilit]
- Sim, H.M.; Choi, H.Y.; Joe, H.G. Robust rotation estimation using adaptive ROI radon transformation for sonar images. J. Mar. Sci. Eng. 2025, 13, 2321. [Google Scholar] [CrossRef] [Scilit]
- Pereira, P.; Silva, R.; Marques, J.V.A.; Campilho, R.; Matos, A.; Pinto, A.M. Raya: A bio-inspired AUV for inspection and intervention of underwater structures. IEEE Access 2025, 13, 71253–71274. [Google Scholar] [CrossRef] [Scilit]
- Sadjoli, N.; Cai, Y.; Seet, G.; Elhadidi, B. PCD reconstruction, object classification and pose estimation for underwater vehicles using orthogonal multibeam forward looking sonar fusion. Ocean Eng. 2023, 288, 116019. [Google Scholar] [CrossRef] [Scilit]
- Joe, H.; Kim, J.; Yu, S.C. Probabilistic 3D reconstruction using two sonar devices. Sensors 2022, 22, 2094. [Google Scholar] [CrossRef] [Scilit] [PubMed]
- Sung, M.; Kim, J.; Cho, H.; Lee, M.; Yu, S.-C. Underwater-sonar-image-based 3D point cloud reconstruction for high data utilization and object classification using a neural network. Electronics 2020, 9, 1763. [Google Scholar] [CrossRef] [Scilit]
- Wang, L.; Ye, X.; Zhu, L.; Wu, W.; Zhang, J.; Xing, H.; Hu, C. When SAM meets sonar images. IEEE Geosci. Remote Sens. Lett. 2024, 21, 8001605. [Google Scholar] [CrossRef] [Scilit]
- Li, J.Y.; Wang, Z.; Xu, N.; You, Z.H. Fine-tuning SAM for forward-looking sonar with collaborative prompts and embedding. IEEE Geosci. Remote Sens. Lett. 2025, 22, 3504105. [Google Scholar] [CrossRef] [Scilit]
- Zhao, H.; Jiang, L.; Jia, J.; Torr, P.; Koltun, V. Point Transformer. In Proceedings of the IEEE/CVF International Conference on Computer Vision; IEEE: Piscataway, NJ, USA, 2021; pp. 16259–16268. [Google Scholar]
- Qi, C.R.; Su, H.; Mo, K.; Guibas, L.J. PointNet: Deep learning on point sets for 3D classification and segmentation. In Proceedings of the IEEE Conference on Computer Vision and Pattern Recognition; IEEE: Piscataway, NJ, USA, 2017; pp. 652–660. [Google Scholar]
- Qi, C.R.; Yi, L.; Su, H.; Guibas, L.J. PointNet++: Deep hierarchical feature learning on point sets in a metric space. In Advances in Neural Information Processing Systems; Curran Associates: Red Hook, NY, USA, 2017; pp. 5100–5109. [Google Scholar]
- Rusu, R.B.; Cousins, S. 3D is here: Point Cloud Library (PCL). In 2011 IEEE International Conference on Robotics and Automation; IEEE: Shanghai, China, 2011; pp. 1–4. [Google Scholar]
- Luo, J.; Jiang, S.; Zeng, Y.; Lai, C. Three-Dimensional Reconstruction and Visualization of Underwater Bridge Piers Using Sonar Imaging. Sensors 2024, 24, 4732. [Google Scholar] [CrossRef] [Scilit] [PubMed]
- Gad, A.G.; Hu, Z.H.; Haber, R. Robust filtering for 3-D sonar data via rectangular information granulation. IEEE Trans. Geosci. Remote Sens. 2024, 62, 1–13. [Google Scholar] [CrossRef] [Scilit]
- Ziolkowski, T.; Koschmider, A.; Devey, C.W. An optimized outlier detection function for multibeam echo-sounder data. Comput. Geosci. 2024, 186, 105572. [Google Scholar] [CrossRef] [Scilit]
- Besl, P.J.; McKay, N.D. A method for registration of 3-D shapes. IEEE Trans. Pattern Anal. Mach. Intell. 1992, 14, 239–256. [Google Scholar] [CrossRef] [Scilit]
- Chen, Y.; Medioni, G. Object modelling by registration of multiple range images. Image Vis. Comput. 1992, 10, 145–155. [Google Scholar] [CrossRef] [Scilit]
- Rahman, S.; Quattrini Li, A.; Rekleitis, I. SVIn2: A Multi-Sensor Fusion-Based Underwater SLAM System. Int. J. Robot. Res. 2022, 41, 1022–1042. [Google Scholar] [CrossRef] [Scilit]
- Ding, S.; Zhang, T.; Li, Y.; Xu, S.; Lei, M. Underwater multi-sensor fusion localization with visual-inertial-depth using hybrid residuals and efficient loop closing. Measurement 2024, 238, 115245. [Google Scholar] [CrossRef] [Scilit]
- Palomer, A.; Ridao, P.; Ribas, D. Multibeam 3D underwater SLAM with probabilistic registration. Sensors 2016, 16, 560. [Google Scholar] [CrossRef] [Scilit] [PubMed]
- Ferreira, A.; Almeida, J.; Martins, A.; Matos, A.; Silva, E. 3DupIC: An underwater scan matching method for three-dimensional sonar registration. Sensors 2022, 22, 3631. [Google Scholar] [CrossRef] [Scilit] [PubMed]
- Han, X.; Sun, J.; Zhang, S.; Dong, J.; Yu, H. Sonar-based simultaneous localization and mapping using the semi-direct method. J. Mar. Sci. Eng. 2024, 12, 2234. [Google Scholar] [CrossRef] [Scilit]
- Mu, X.; Yue, G.; Zhou, N.; Chen, C. Occupancy grid-based AUV SLAM method with forward-looking sonar. J. Mar. Sci. Eng. 2022, 10, 1056. [Google Scholar] [CrossRef] [Scilit]
- Zhang, S.; Zhu, Y.; Xiong, W.; Cai, C.; Zhang, J. An USPCD multi-feature fusion method for bridge underwater structure identification. Mech. Syst. Signal Process. 2026, 243, 113724. [Google Scholar] [CrossRef] [Scilit]
- Yan, Z.; Zhou, T.; Zhu, J.; Li, T.; Du, W.; Zhang, B. Point cloud method for detecting suspended pipelines using multi-beam water column data. J. Ocean Univ. China 2025, 24, 1683–1691. [Google Scholar] [CrossRef] [Scilit]
- Liu, W.; Shao, Y.; Chen, K.; Li, C.; Luo, H. Whale optimization algorithm-based point cloud data processing method for sewer pipeline inspection. Autom. Constr. 2022, 141, 104423. [Google Scholar] [CrossRef] [Scilit]
- Wang, Y.; Sun, Y.; Liu, Z.; Sarma, S.E.; Bronstein, M.M.; Solomon, J.M. Dynamic graph CNN for learning on point clouds. ACM Trans. Graph. 2019, 38, 146. [Google Scholar] [CrossRef] [Scilit]
- Hu, Q.; Yang, B.; Xie, L.; Rosa, S.; Guo, Y.; Wang, Z.; Trigoni, N.; Markham, A. RandLA-Net: Efficient semantic segmentation of large-scale point clouds. In Proceedings of the IEEE/CVF Conference on Computer Vision and Pattern Recognition; IEEE: Piscataway, NJ, USA, 2020; pp. 11108–11117. [Google Scholar]
- Huang, Z.; Zhu, Y.; Xiong, W.; Zhang, S. Lightweight learning-based sonar point cloud semantic segmentation for underwater bridge inspection. Autom. Constr. 2025, 178, 106387. [Google Scholar] [CrossRef] [Scilit]
- Cui, X.; Li, Y.; Li, J.; Zhang, J. Cross-PIC: A cross-scale in-context learning network for 3D multibeam point cloud segmentation of submarine pipelines. Ocean Eng. 2025, 315, 119778. [Google Scholar] [CrossRef] [Scilit]
- Li, C.; Li, H.L.; Chen, K. Convolutional point transformer for semantic segmentation of sewer sonar point clouds. Eng. Appl. Artif. Intell. 2024, 138, 109456. [Google Scholar] [CrossRef] [Scilit]
- Li, C.; Li, H.; Chen, K.; Bao, Z. Semi-supervised point cloud semantic segmentation via cross-learning for sewer inspection. Adv. Eng. Inform. 2025, 66, 103399. [Google Scholar] [CrossRef] [Scilit]
- Hou, S.; Shen, H.; Wu, T.; Sun, W.; Wu, G.; Wu, Z. Underwater surface defect recognition of bridges based on fusion of semantic segmentation and three-dimensional point cloud. J. Bridge Eng. 2025, 30, 04024101. [Google Scholar] [CrossRef] [Scilit]
- Nandi, B.; Das, S. Prediction of maximum scour around circular bridge piers using semi-empirical and machine learning models. Water 2025, 17, 2610. [Google Scholar] [CrossRef] [Scilit]
- Hayden, J.T.; Puleo, J.A. Near real-time scour monitoring system: Application to Indian River Inlet, Delaware. J. Hydraul. Eng. 2011, 137, 1037–1046. [Google Scholar] [CrossRef] [Scilit]
- Lague, D.; Brodu, N.; Leroux, J. Accurate 3D Comparison of Complex Topography with Terrestrial Laser Scanner: Application to the Rangitikei Canyon, New Zealand. ISPRS J. Photogramm. Remote Sens. 2013, 82, 10–26. [Google Scholar] [CrossRef] [Scilit]
- Tan, H.; Zheng, L.; Ma, C.; Xu, Y.; Sun, Y. Deep learning-assisted high-resolution sonar detection of local damage in underwater structures. Autom. Constr. 2024, 164, 105479. [Google Scholar] [CrossRef] [Scilit]
- Zheng, L.; Tan, H.; Ma, C.; Ding, X.; Sun, Y. A real-time crack detection approach for underwater concrete structures using sonar and deep learning. Ocean Eng. 2025, 322, 120582. [Google Scholar] [CrossRef] [Scilit]
- Su, Z.; Zhou, F.; Wang, J.; Liu, A.; Liang, J.; Liang, J.; Chen, B.; Fu, J.; Yang, J. Imaging sonar based inspection of underwater bridge pier damages driven by 3D texture information. Eng. Struct. 2025, 344, 121326. [Google Scholar] [CrossRef] [Scilit]
- Li, Z.; Li, R.; Chen, B. Field study of scour around bridge piers in the transitional section of the Qiantang River. Ain Shams Eng. J. 2026, 17, 103924. [Google Scholar] [CrossRef] [Scilit]
- Zhou, Y.X.; Ji, A.K.; Zhang, L.M. Sewer defect detection from 3D point clouds using a transformer-based deep learning model. Autom. Constr. 2022, 136, 104163. [Google Scholar] [CrossRef] [Scilit]
- Fan, S.; Li, G.; Wang, S.; Xiao, C. Linear target extraction from synthetic aperture sonar image based on joint direction weighting. Measurement 2026, 266, 120484. [Google Scholar] [CrossRef] [Scilit]
- Wang, Z.; Wang, K.; Yan, Y.; Peng, Z.; Wu, Z. Voids imaging on underwater concrete slabs based on guide wave transmission and distributed transducer network. J. Nondestruct. Eval. 2025, 44, 46. [Google Scholar] [CrossRef] [Scilit]
- International Hydrographic Organization. IHO Standards for Hydrographic Surveys, Edition 6.2.0; S-44; IHO: Monaco, 2024; Available online: https://iho.int/uploads/user/pubs/standards/s-44/S-44_Edition_6.2.0_adopted.pdf (accessed on 22 October 2026).
- Federal Highway Administration. Bridge Inspector’s Reference Manual; FHWA-NHI-15-055; U.S. Department of Transportation: Washington, DC, USA, 2015.
- American Association of State Highway and Transportation Officials. Manual for Bridge Evaluation, 3rd ed.; AASHTO: Washington, DC, USA, 2018. [Google Scholar]
- Arneson, L.A.; Zevenbergen, L.W.; Lagasse, P.F.; Clopper, P.E. Evaluating Scour at Bridges, 5th ed.; Volume Hydraulic Engineering Circular No. 18, FHWA-HIF-12-003; Federal Highway Administration: Washington, DC, USA, 2012.
- DNV. DNV-ST-0126 Support Structures for Wind Turbines; DNV: Høvik, Norway, 2024. [Google Scholar]
- ISO 19902:2020; Petroleum and Natural Gas Industries—Fixed Steel Offshore Structures. ISO: Geneva, Switzerland, 2020.
- International Marine Contractors Association. IMCA International Code of Practice for Offshore Diving, Rev. 2; IMCA D 014; IMCA: London, UK, 2014. [Google Scholar]
- JTG/T H21-2011; Specifications for Technical Condition Evaluation of Highway Bridges. China Communications Press: Beijing, China, 2011.
- Khan, A.K.A.; Ismael, D.I. Interpretable machine learning for bridge-pier scour prediction and flood resilience. Front. Built Environ. 2026, 11, 1731114. [Google Scholar] [CrossRef] [Scilit]
- Choi, J.; Kim, J.; Kwon, S.; Kim, T. Probabilistic prediction of local scour at bridge piers with interpretable machine learning. Water 2025, 17, 3574. [Google Scholar] [CrossRef] [Scilit]
- Kaewunruen, S.; O’Neill, C.; Sengsri, P. Digital twin-driven strategic demolition plan for circular asset management of bridge infrastructures. Sci. Rep. 2025, 15, 10554. [Google Scholar] [CrossRef] [Scilit] [PubMed]
- Gil, H.; Kang, S.I.; Jang, J.; Kong, M.J. Digital twin for maintenance and disaster management of the cable-stayed bridge. In IABSE Symposium Tokyo 2025: Environmentally Friendly Technologies and Structures: Focusing on Sustainable Approaches; International Association for Bridge and Structural Engineering: Zurich, Switzerland, 2025. [Google Scholar] [CrossRef] [Scilit]
- Tita, E.E.; Watanabe, G.; Tomoeda, Y. BIM-aided digital twin of long-span Pratt truss modeling and GNSS displacement monitoring for bridge lifecycle management. In 2025 IEEE Smart World Congress (SWC); IEEE: Piscataway, NY, USA, 2025. [Google Scholar] [CrossRef] [Scilit]
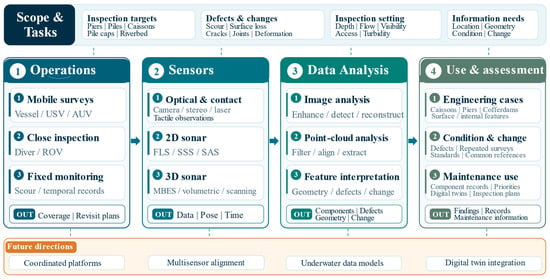
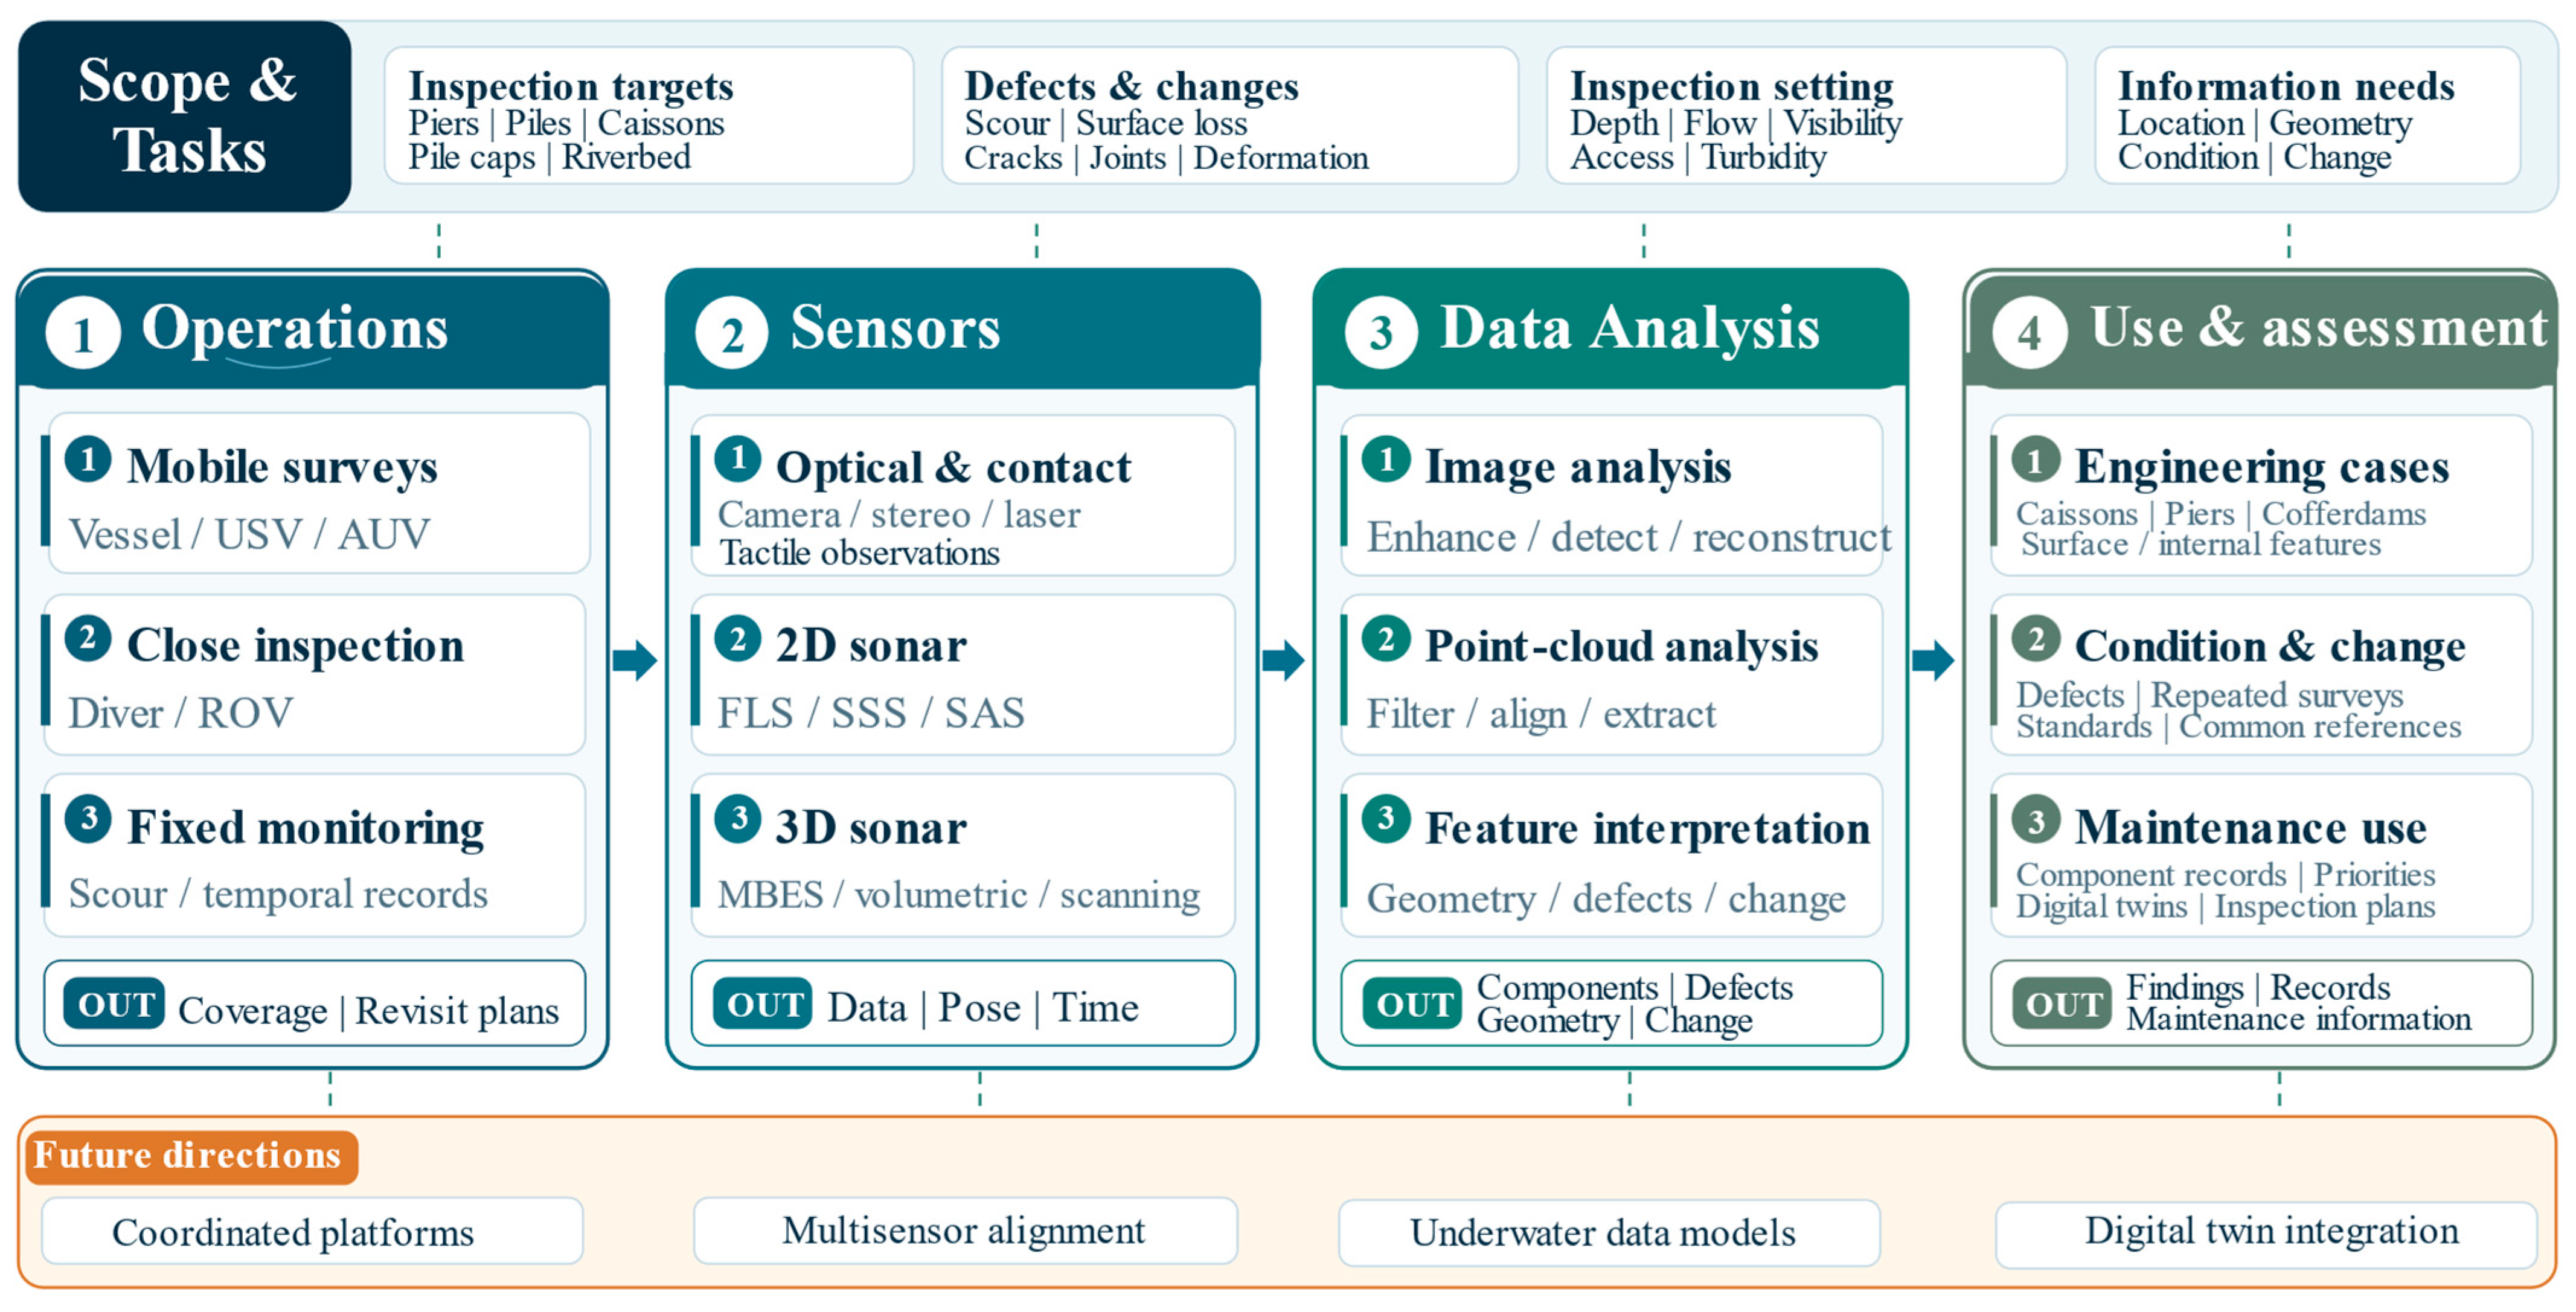
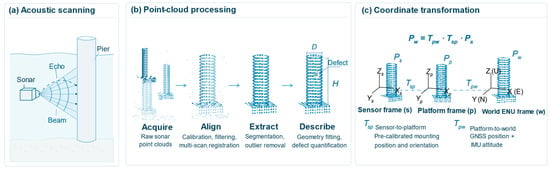
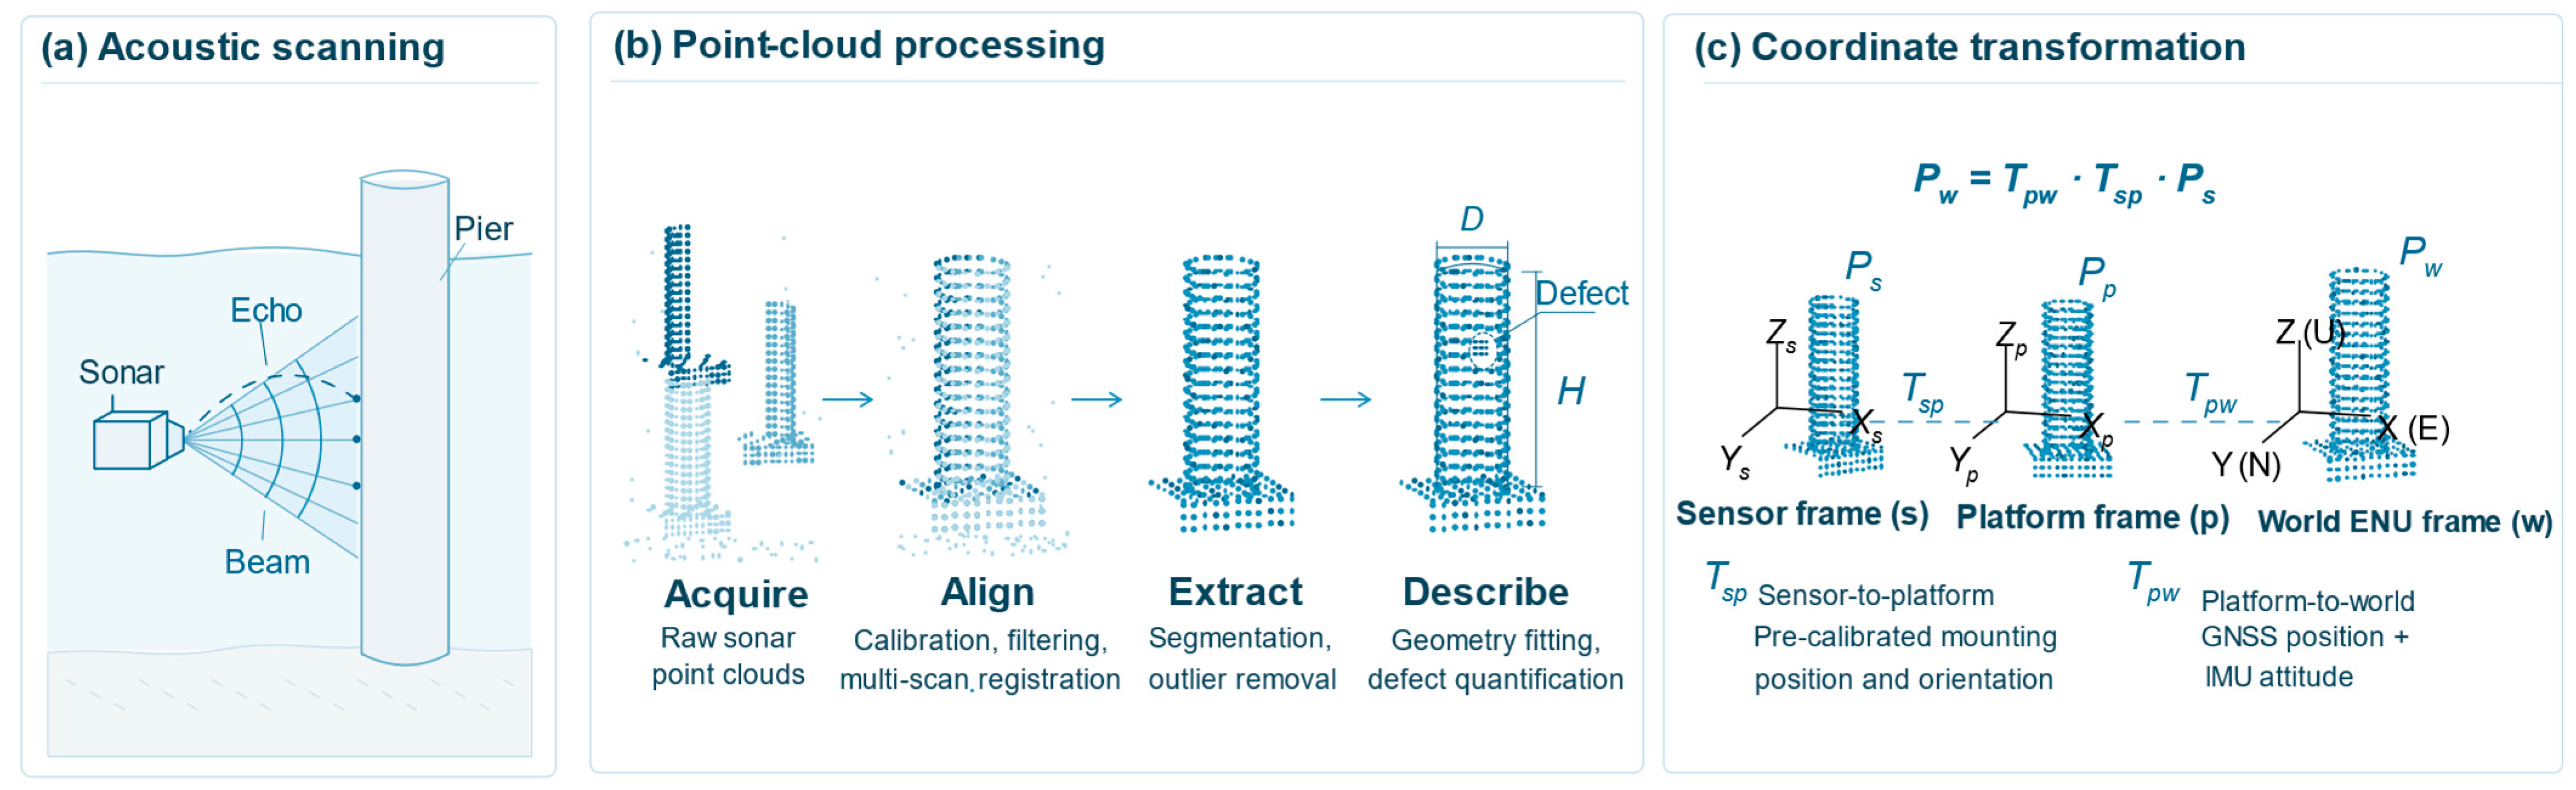
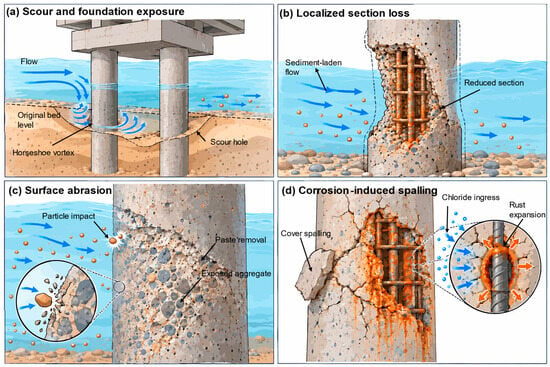
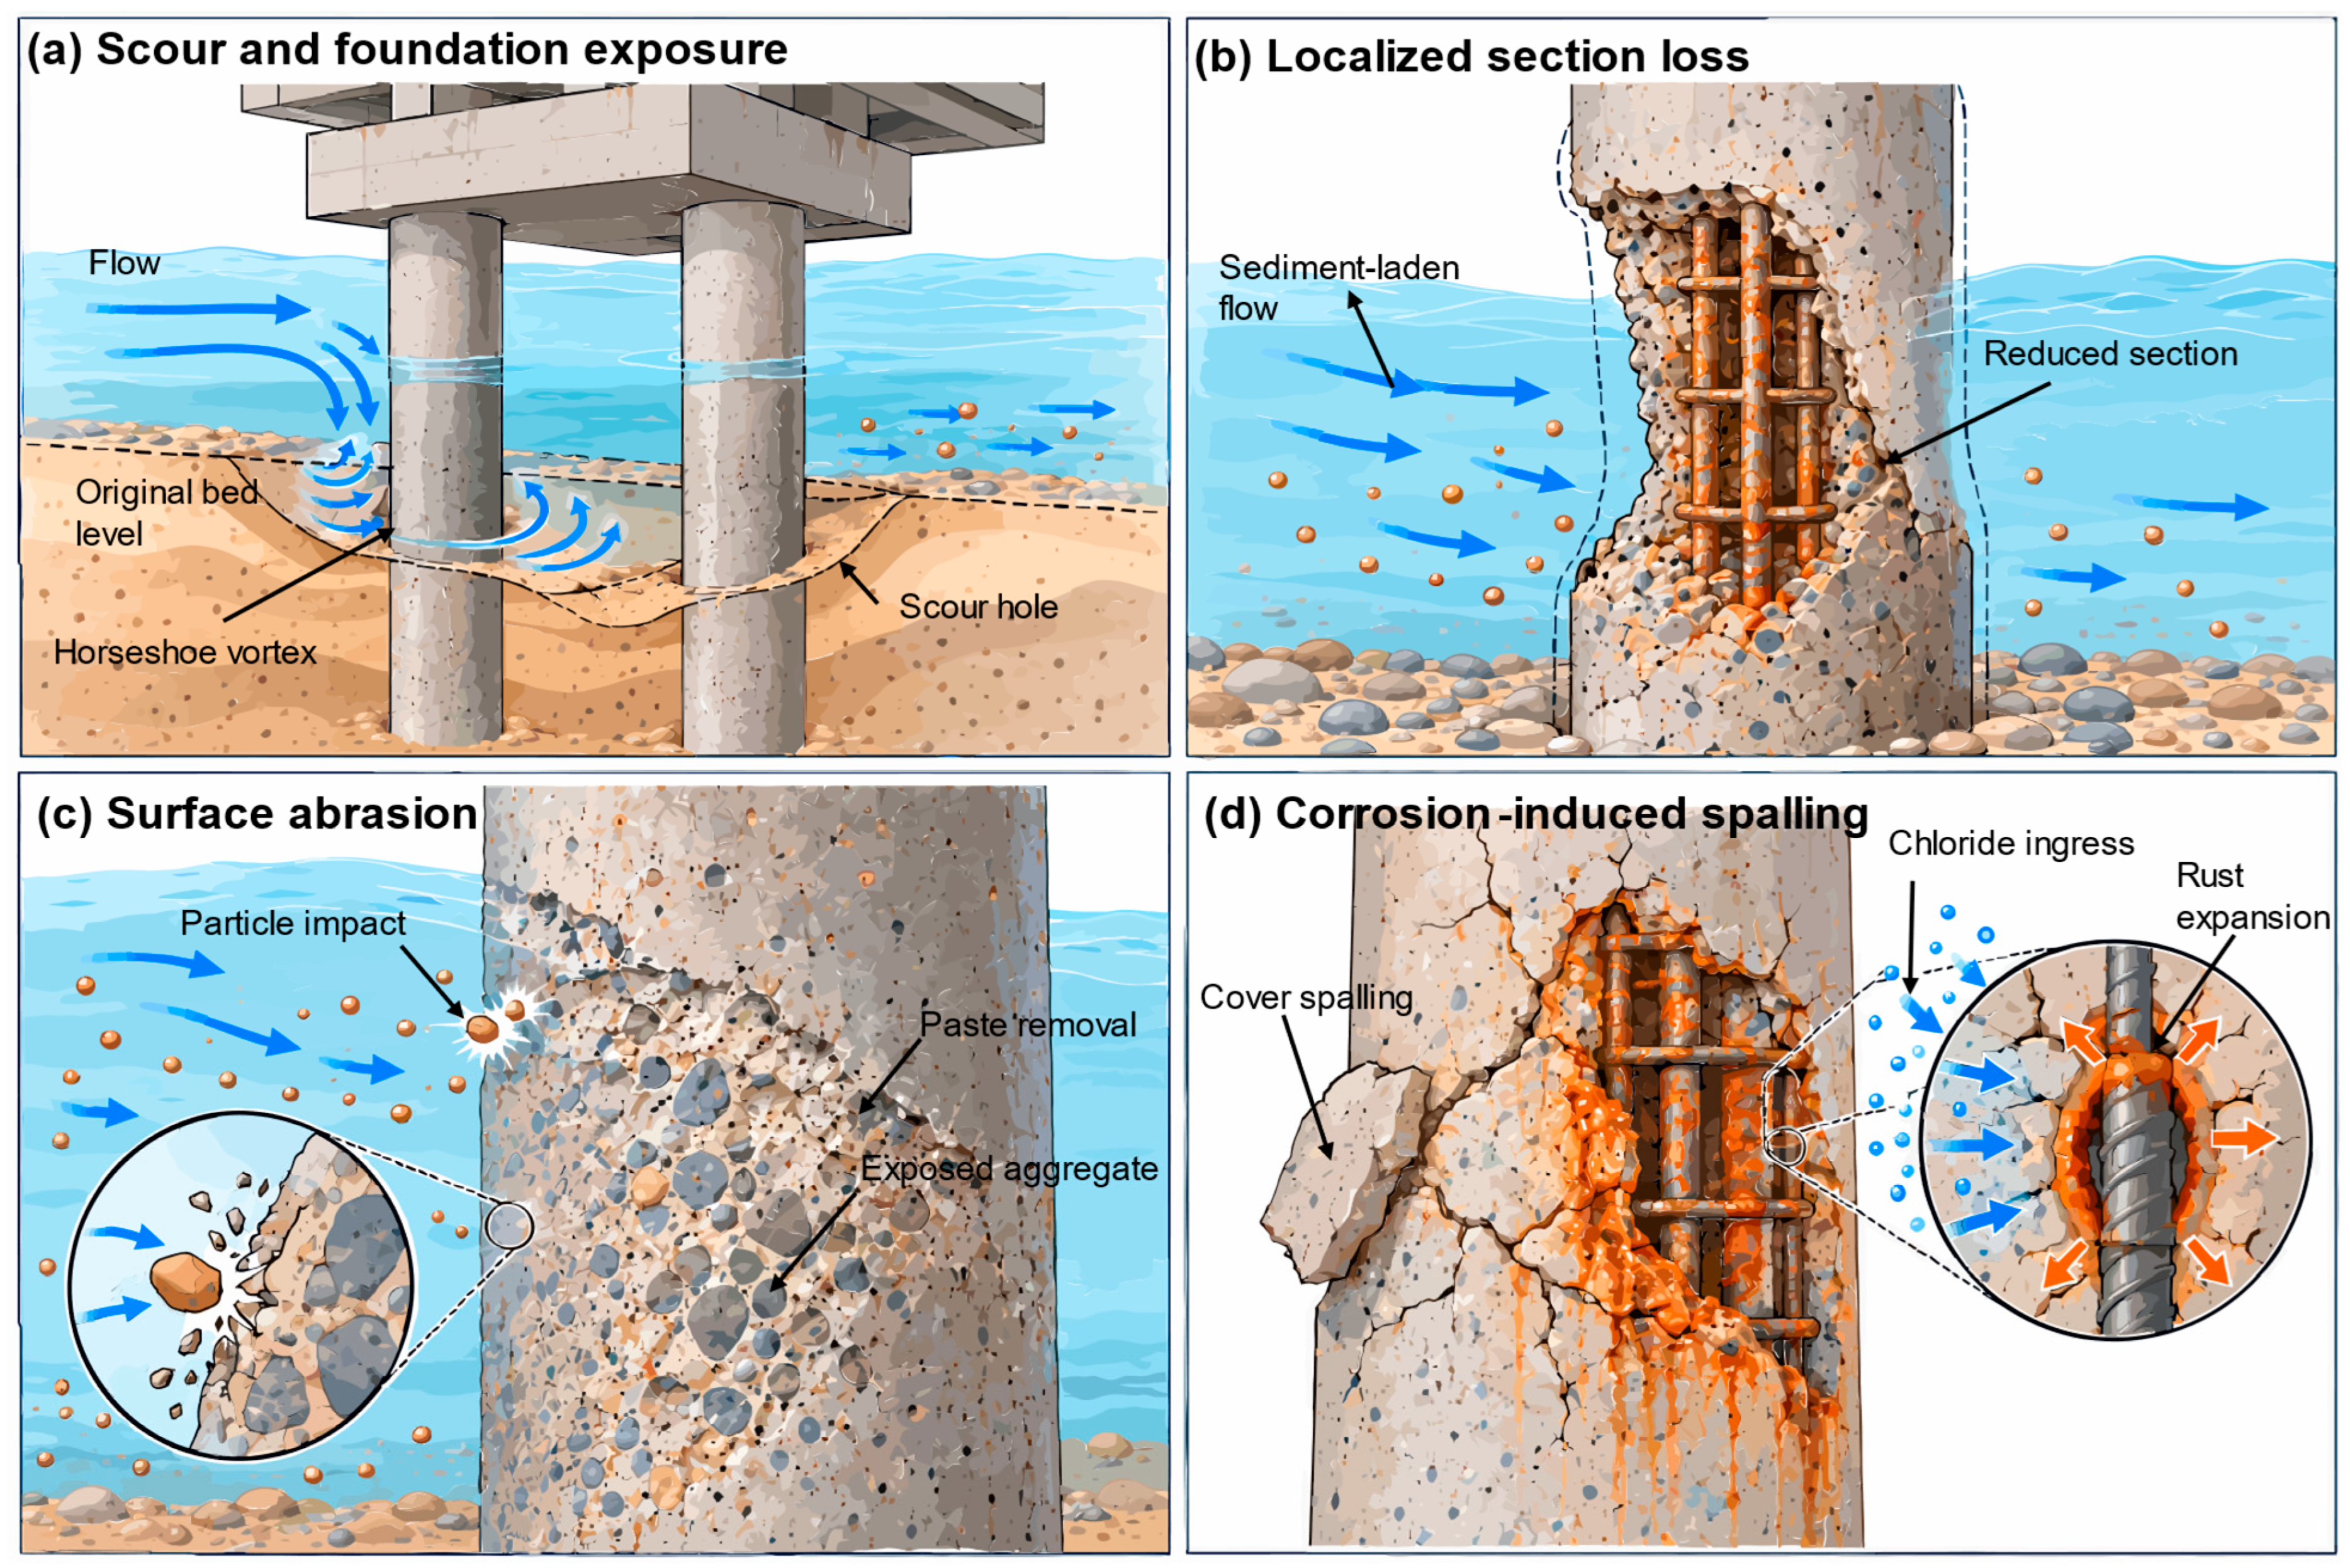

Disclaimer/Publisher’s Note: The statements, opinions and data contained in all publications are solely those of the individual author(s) and contributor(s) and not of MDPI and/or the editor(s). MDPI and/or the editor(s) disclaim responsibility for any injury to people or property resulting from any ideas, methods, instructions or products referred to in the content. |
© 2026 by the authors. Licensee MDPI, Basel, Switzerland. This article is an open access article distributed under the terms and conditions of the Creative Commons Attribution (CC BY) license.