


Abstract
This study evaluates the accuracy of ERA5 10-m wind speed and significant wave height (SWH) using one-year hourly observations from 16 buoys in the Bohai and Yellow Seas. ERA5 agrees closely with the buoys (wind: Bias 0.04 m/s, root-mean-square error (RMSE) 1.40 m/s, scatter index (SI) 0.24, correlation coefficient (r) 0.90; SWH: Bias 0.11 m, RMSE 0.23 m, SI 0.30, r 0.94). Errors decrease offshore, and the control is offshore distance rather than water depth: a 2.5-fold depth change at fixed distance alters wind RMSE by 0.02 m/s, whereas a doubling of distance at fixed depth alters it by 0.22–0.24 m/s. Wind Bias has a marked diurnal cycle whose amplitude decreases offshore and reverses seasonally; SWH Bias stays positive but weakens in summer; both variables overestimate weak and underestimate strong conditions. The absolute errors of the two variables vary out of phase, so their correlation cancels (−0.40 to 0.02), whereas the relative errors remain strongly coupled (0.59–0.80). Above 13 m/s, ERA5 underestimates wind by 11% while overestimating SWH by 6%, an inconsistency that locates the high-sea-state error in the wave model rather than in the forcing. These quantified errors constrain design-wave estimation and Bias correction in coastal engineering.
1. Introduction
Sea-surface wind speed and significant wave height (SWH) are fundamental variables in air–sea interaction, marine engineering design, maritime navigation safety, and climate change research. Accurate long-term, large-scale wind and wave data are indispensable for analyzing shelf-sea dynamic processes, mitigating coastal disaster risks, and assessing offshore wind energy resources [1,2]. Given the sparse distribution of in situ observation stations and the scarcity of long-term continuous measurements [3], global reanalysis datasets have become essential for characterizing wind–wave conditions in coastal waters and supporting marine infrastructure planning. Among these, the ERA5 reanalysis from the European Centre for Medium-Range Weather Forecasts (ECMWF) stands out for its high spatiotemporal resolution and comprehensive multi-source assimilation system. It is one of the most widely used products in global ocean and climate research [4] and has been extensively applied to studies of global and regional wave energy, climate variability, and extreme sea-state evolution [5,6,7].
The Bohai and Yellow Seas are marginal shelf seas of the northwestern Pacific. They are shallow, semi-enclosed basins with complex topography, sinuous coastlines, and numerous islands; water depths predominantly range between 10 and 70 m. The spatiotemporal evolution of wind fields and waves is driven by the seasonal alternation of the East Asian monsoon, local sea–land breezes, and remote swell propagation. It thus exhibits both large-scale climatic signals and localized small-scale perturbations. This combination makes the region a representative natural laboratory for studying offshore marine dynamic processes in China [8,9,10]. Northerly gales induced by winter cold waves, extratropical cyclones, and northward-moving summer typhoons frequently generate extreme wind–wave events, posing persistent threats to coastal ports, offshore platforms, and shoreline protection structures around the Bohai Sea and the Shandong Peninsula coast [11]. Meanwhile, as marine development intensifies in the Bohai Rim and large-scale offshore wind farms are constructed, there is an urgent need for marine environmental assessments and extreme sea-state return-period calculations based on reliable wind–wave datasets [12,13]. Clarifying the spatial error heterogeneity, seasonal evolution, and dynamic dependencies of ERA5 in these waters can provide critical data support and a theoretical basis for reanalysis correction, numerical wind–wave model optimization, and marine disaster mitigation.
Globally, numerous studies have assessed the applicability of ERA5 wind and wave products. The original ERA5 validation against global buoys and satellite observations showed a significant improvement in SWH fit relative to ERA-Interim, with a scatter index (SI) of approximately 0.12–0.14 versus 0.14–0.17 [4]. Validation using 103 long-term buoys from the U.S. NDBC network indicated that, in open ocean areas, the mean Bias for SWH was −0.058 m with a root-mean-square error (RMSE) of 0.325 m. Errors increased notably in coastal regions due to topographic and sub-grid effects, while accuracy improved steadily with offshore distance [14]. Studies based on six typical tall-tower sites worldwide confirmed that ERA5 wind speeds over flat, open areas achieved correlation coefficients of 0.93–0.96. However, errors increased substantially over complex terrain (e.g., dense forests) and coastal land–sea transition zones, primarily because the native 31 km grid cannot resolve local circulations [15]. A systematic assessment using 444 buoys worldwide further revealed that ERA5 substantially underestimates SWH under extreme conditions (SWH > 5 m). Its accuracy improves with offshore distance but shows no substantial water-depth dependence. This suggests that SWH errors in shelf seas are governed more by offshore distance than by water depth [16].
Regional validation studies in Chinese coastal waters have also been conducted. At three sites in the South China Sea (two deep-water buoys and one nearshore subsurface mooring), ERA5 SWH yielded correlation coefficients of 0.87–0.93 and RMSE of 0.22–0.57 m. Errors increased nearshore, mainly due to inadequate local wind-field representation and neglect of wave propagation [17]. An evaluation based on six buoys along the Chinese coast reported that ERA5 SWH exhibited substantial shallow-water Biases (from −0.35 to 0.30 m) but nearly zero Bias in deep water, with water depth and topographic features (e.g., islands) exerting notable influence on accuracy [18]. Specific validation in the Bohai Sea and northern Yellow Sea confirmed that ERA5 sea-level pressure and wind speed correlated well with observations. However, the Biases depended on wind speed magnitude: ERA5 wind speeds tended to be lower than observations under high-wind conditions. The applicability was better in winter than in summer, and performance degraded during extreme weather events [19]. Comparative studies between ERA5 and ERA-Interim showed similar performance under normal winds, with slight overestimation relative to in situ measurements and agreement indices exceeding 0.9. However, ERA5 substantially outperformed ERA-Interim in typhoon simulations, though it still generally underestimated typhoon wind speeds [20]. Long-term observations from 12 buoys in the two Seas further confirmed that among three reanalysis products (CFSv2, MERRA-2, and ERA5), ERA5 exhibited the best overall performance, though its accuracy varied with season and wind speed [21]. A recent validation along the west coast of India using directional buoy observations further confirmed the seasonal dependence of ERA5 wave spectra accuracy. Performance was good during the monsoon, but notable limitations appeared in pre- and post-monsoon periods for localized wave features, while cyclone-induced extreme wave conditions were successfully captured [22].
To date, dedicated assessment studies specifically targeting the Bohai and Yellow Seas remain rather limited. Existing studies have mostly relied on a small number of scattered buoys or short-term observations at individual sites, focusing solely on typhoon cases or specific seasons. They thus lack systematic quantitative assessments covering the entire sea area and all seasons. Most published results provide only domain-averaged metrics, without resolving spatial gradient patterns across the four subregions: the Bohai Sea, the northern Yellow Sea, the central Yellow Sea, and the southern Yellow Sea. Systematic quantification is lacking regarding diurnal error evolution, seasonal discrepancies, and dependencies across different wind speed and wave height bins. Moreover, where wind and wave errors have been compared jointly, the comparison has almost always been made on absolute errors, although the two absolute-error series peak in different seasons and therefore correlate weakly even when the underlying errors are physically linked. These research gaps impede the refined correction and practical engineering application of ERA5 in this study region.
To address these deficiencies, this study systematically evaluates the accuracy of ERA5 10-m wind speed and SWH using one-year hourly buoy observations from 16 stations of the China National Marine Stereo Observation Network in the Bohai and Yellow Seas. The evaluation is conducted across four dimensions: spatial distribution, seasonal evolution, diurnal variation, and dependence on wind speed and SWH bins. We quantify the inter-comparison relationship between wind and wave errors, investigate the potential influences of environmental factors—including offshore distance and water depth—on simulation errors, and clarify the systematic Bias patterns under weak versus strong wind and low versus high wave conditions. Our findings will enhance the baseline database of ERA5 applicability in the study region, support the construction of region- and season-dependent correction schemes, and refine wind forcing in coastal wave models [3,23]. Beyond their oceanographic significance, the quantified error structures provide essential constraints for engineering design basis, extreme event return-period calculations, and operational safety assessments. Offshore wind farms, platforms, and coastal protection works in these waters all demand reliable forcing data. By systematically characterizing ERA5 errors and offering region-specific correction guidelines, this study bridges global reanalysis products with local engineering requirements, while also serving as a reference for evaluating reanalysis data over other Chinese shelf seas.
2. Materials and Methods
2.1. Observational Data
The observational data used in this study consist of hourly measurements of 10-m wind speed (precision: 0.01 m/s) and SWH (precision: 0.1 m) from 16 buoy stations of the China National Marine Stereo Observation Network. It should be explicitly noted that all buoy observations used in this study are internal data. They were not transmitted through the Global Telecommunication System (GTS) and none of the 16 buoys were assimilated into ERA5. The present evaluation is therefore an independent validation.
These buoys cover the entire study region, with offshore distances ranging from 19.3 to 203.5 km (Table A1). Due to periodic maintenance and site replacement (many stations ceased operations by the end of 2020), the continuity and completeness of the buoy data have been partially compromised. To include as many stations as possible while maintaining comparable temporal coverage, we first selected stations with relatively complete observations spanning March 2024–February 2025 and then extended the selection retroactively to stations with relatively complete records covering the period from March to February of earlier years. Stations A03 and D02 were also included despite data gaps, owing to their representative locations. Previous studies have identified a long-term trend in ERA5 SWH accuracy, with approximately 10-year linear changes in SWH Bias, RMSE, SI, and correlation coefficient (r) of 0.016 m, 0.025 m, 0.0087, and 0.026, respectively [14]. The temporal span of the selected buoy data was therefore constrained to no more than 10 years. The observation periods vary across stations (one provides data for 2014–2015, six for 2019–2020, one for 2023–2024, and eight for 2024–2025; Table A1). Nevertheless, the spatial and seasonal error patterns reported in this study are substantially larger than the documented decadal trend, so mixing data from different years is unlikely to compromise our main conclusions.
2.2. ERA5 Reanalysis Data
The ERA5 hourly reanalysis product, released by the ECMWF [4], was evaluated against buoy observations. ERA5 is the fifth-generation global atmospheric reanalysis dataset, produced using the IFS Cy41r2 model and the 4D-Var data assimilation system, with an hourly temporal resolution. The 10-m wind speed data are provided at a spatial resolution of 0.25° × 0.25°, whereas the SWH data are output on a 0.5° × 0.5° grid. Bilinear interpolation was applied to extract ERA5 wind speed and SWH values at the buoy locations, ensuring spatiotemporal matching for comparative validation.
2.3. Evaluation Metrics
Following common practice in the oceanographic community, five statistical metrics were adopted for accuracy evaluation [14,24]:
3. Results and Discussion
3.1. Spatial Error Patterns and Diurnal Variation in Wind Speed Errors
3.1.1. Overall Statistical Performance and Spatial Distribution
The ERA5 reanalysis wind speed and SWH agree generally with buoy observations across the study region, although regional heterogeneity is evident (Figure 1, Table 1). Across the 16 stations, the mean Bias, RMSE, SI, and r for wind speed are 0.04 m/s, 1.40 m/s, 0.24, and 0.90, respectively. For SWH, the corresponding statistics are 0.11 m, 0.23 m, 0.30, and 0.94. The overall correlation for SWH is approximately 4.4% higher (in terms of mean r) than that for wind speed, whereas the SI for SWH is roughly 25% higher. The former arises because waves represent a spatiotemporal integral response to wind forcing, which naturally smooths high-frequency noise and enhances phase consistency. The latter, in contrast, is mainly attributable to the much lower mean SWH in the region (typically 0.5–1.0 m at most buoy sites). This low mean value amplifies the relative error and consequently elevates the SI. This mechanism is consistent with the seasonal pattern discussed below, where the SWH SI is higher in summer than in winter.
Figure 1.
Scatter plots of (a) 10-m wind speed and (b) SWH from ERA5 reanalysis versus buoy observations over the Bohai and Yellow Seas. The x-axis represents buoy measurements, and the y-axis represents ERA5 values. The red solid line denotes the 1:1 reference line. The color bar indicates the normalized density of scatter points, ranging from 0 to 1. The measurement accuracies of buoy-observed wind speed and SWH are 0.01 m/s and 0.1 m, respectively.
Table 1.
Statistical metrics of ERA5 10-m wind speed and SWH validated against buoy observations at 16 stations over the Bohai and Yellow Seas. For each station, the number of valid samples (Count), Bias, MAE, RMSE, SI, and r are listed. The bottom rows present station-averaged statistics for each subregion, with units of m/s for wind speed and m for SWH.
The spatial distributions of the statistical metrics for wind speed and SWH show notable north-to-south gradients (Figure 2 and Figure 3, and Table 1). Wind speed RMSE (Figure 2b and Table 1) decreases progressively from the Bohai Sea (Region A, 1.52 m/s) to the northern Yellow Sea (Region B, 1.50 m/s), the central Yellow Sea (Region C, 1.29 m/s), and the southern Yellow Sea (Region D, 1.28 m/s). The difference between the maximum (Station B01, 1.60 m/s) and minimum (Station C05, 1.13 m/s) values is 0.47 m/s. The SI pattern (Figure 2c) is consistent with that of RMSE, showing larger errors in the north and smaller errors in the south. The SI values at all stations are at or below 0.28, indicating generally good applicability of ERA5 wind speeds over the study region. The wind speed r exhibits a gradual north-to-south increasing trend (Figure 2d and Table 1), with higher values in Regions C and D (both averaging 0.91) and lower values in Regions A and B (both averaging 0.88). For SWH, the SI (Figure 3c and Table 1) decreases from 0.38 in the Bohai Sea to 0.21 in the southern Yellow Sea, representing a factor of about 1.8. Among all stations, A02 has the highest SI (0.51), suggesting the largest scatter of ERA5 SWH at this site. Wind speed Bias (Figure 2a) is negative in Region A (−0.14 m/s), near zero in Regions B and D (0.07 m/s and 0.02 m/s, respectively), and positive in Region C (0.17 m/s). SWH Bias (Figure 3a) is positive at all stations, indicating a general ERA5 overestimation, and tends to decrease from north to south (from 0.13 m in Region A to 0.09 m in Region D). The largest positive Bias occurs at Station A02 in the central Bohai Sea (0.23 m). SWH RMSE (Figure 3b) also shows a north-high–south-low pattern, averaging approximately 0.25 m in Regions A and B and decreasing to 0.21 m in Regions C and D. SWH r (Figure 3d) generally exhibits higher values in the south and lower values in the north, with Region D averaging 0.96 and Region B the lowest at 0.92.
Figure 2.
Spatial distributions of statistical metrics for ERA5 10-m wind speed validation against buoy observations over the Bohai and Yellow Seas: (a) Bias, (b) RMSE, (c) SI, and (d) r. For each subfigure, the left panel shows the spatial distribution of the metric, with filled circles color-coded according to the magnitude of the statistical value. The right panel presents the latitudinal distribution of the metric, where the horizontal axis represents the statistical value and the vertical axis represents latitude. Circles are color-coded according to the four subregions: A (Bohai Sea), B (northern Yellow Sea), C (central Yellow Sea), and D (southern Yellow Sea). The black dashed line indicates the linear fit, with the corresponding correlation coefficient r and p-value indicated within each panel.
Figure 3.
Same as Figure 2, but for the statistical metrics of ERA5 SWH validation against buoy observations: (a) Bias, (b) RMSE, (c) SI, and (d) r.
To explore the relationship between ERA5 wind speed and SWH errors, we computed the correlation coefficient between the station-wise RMSE of SWH and that of 10-m wind speed (from Table 1). These two metrics are significantly positively correlated (r = 0.62, p = 0.01). Wind and SWH errors thus share a consistent spatial pattern: in the nearshore areas of the Bohai Sea and northern Yellow Sea, where wind speed errors are larger, the corresponding SWH errors are also larger; conversely, in the offshore areas of the southern Yellow Sea, both are smaller. The SI also shows a strong positive correlation (r = 0.70, p = 0.003), suggesting high consistency in the spatial pattern of relative errors, where regional differences in wind speed SI can effectively explain those in SWH SI. The correlation between the two r-value sets is the strongest (r = 0.83, p < 0.001). Given that wind forcing is the primary driver of wave simulations [25], the agreement between wind speed and observations is closely associated with that between SWH and observations, reflecting the strong dependence of SWH accuracy on wind field performance [26].
Figure A1 presents Taylor diagrams for ERA5 10-m wind speed and SWH against buoy observations over the four subregions, with both the standard deviation and the centered RMSE normalized by the standard deviation of buoy observations. For wind speed, the normalized standard deviations range from 0.88 (Region A) to 0.93 (Region C), indicating that ERA5 slightly underestimates wind variability in all regions. The correlation coefficients range from 0.88 to 0.91, with Region C exhibiting the highest value (0.91). The normalized centered RMSE decreases from 0.47 in Region A to 0.41 in Region C, consistent with the offshore improvement seen in the spatial error metrics. For SWH, the normalized standard deviations are closer to unity (0.96–1.04), with a slight overestimation in Region A and slight underestimation in Regions B and D. The correlation coefficients are consistently higher than those for wind speed, ranging from 0.92 (Region B) to 0.96 (Region D). The normalized centered RMSE is smallest in Region D (0.27) and largest in Region B (0.40). Overall, the Taylor diagrams confirm that ERA5 reproduces SWH variability and phase more accurately than wind speed and that both variables perform better in the offshore regions (C and D) than in the nearshore regions (A and B).
Before attributing the north-to-south gradient to latitude, the three candidate controls can be separated directly, because the four subregions form two natural pairs. Regions A and B lie at similar mean offshore distances (54 and 60 km) but differ by a factor of 2.5 in mean water depth (21 and 52 m); regions C and D likewise lie at similar distances (115 and 123 km) while differing by a factor of two in depth (49 and 25 m). Within these pairs the wind RMSE is essentially unchanged (1.52 versus 1.50 m/s, and 1.29 versus 1.28 m/s). The complementary pairs hold depth nearly fixed and vary distance instead: A and D differ by less than 4 m in depth but by a factor of 2.3 in distance, and B and C by 3 m in depth but a factor of 1.9 in distance; their wind RMSE differs by 0.24 and 0.22 m/s. Partial correlations across the sixteen stations confirm the same ordering: with offshore distance controlled, latitude loses significance for SI (r = 0.09, p = 0.74) and for r (r = −0.003, p = 0.99), and water depth contributes to no metric (|r| ≤ 0.21, p ≥ 0.45). The north-to-south gradient in Figure 2 and Figure 3 is therefore a projection of the offshore-distance gradient rather than an independent latitudinal effect.
3.1.2. Effects of Geographic Environmental Factors on Statistical Metrics
Unlike the open ocean, the Bohai and Yellow Seas are typical shelf seas characterized by complex surrounding geography and pronounced topographic variations. Offshore distance and water depth are two important factors reflecting the degree of geographic complexity. In this study, we analyzed the relationships between the statistical error metrics and these two geographic variables.
Offshore distance influences the statistical metrics for both wind speed and SWH (Figure 4 and Figure 5). The correlation coefficient between wind speed RMSE and offshore distance is −0.83 (Figure 4b), that between wind speed SI and offshore distance is −0.82 (Figure 4c), and wind speed r exhibits a strong positive correlation with distance (r = 0.78, Figure 4d). In nearshore areas (<50 km), the average wind speed RMSE, SI, and r are 1.54 m/s, 0.27, and 0.87, respectively. In offshore areas (>100 km), these metrics improve to 1.24 m/s, 0.21, and 0.92. For SWH, the correlation coefficients of RMSE, SI, and r with offshore distance are −0.41 (Figure 5b), −0.70 (Figure 5c), and 0.61 (Figure 5d), respectively. Compared with wind speed, SWH RMSE is less sensitive to offshore distance. A plausible but unverified explanation is that wave errors reflect the combined influence of wind forcing and nearshore wave transformation, including depth-induced shoaling and swell propagation [3,27]. However, the present buoy-based analysis cannot separate the role of seabed morphology from other nearshore effects. This interpretation is therefore tentative and should be tested through dedicated numerical sensitivity experiments, such as high-resolution wave simulations with controlled bathymetry and bottom-friction settings. The correlation between SI and offshore distance (r = −0.70) is substantially stronger than that for RMSE (r = −0.41); thus, SI is more sensitive to offshore distance.
Figure 4.
Relationships between wind speed statistical metrics and geographic factors (offshore distance and water depth) over the Bohai and Yellow Seas. Panels (a–d) show scatter plots of Bias, RMSE, SI, and r against offshore distance, respectively; panels (e–h) show the same metrics against water depth, respectively. The horizontal axis represents offshore distance (km) in (a–d) and water depth (m) in (e–h). Filled circles are color-coded by subregion: A, B, C, and D. The black dashed line denotes the linear fit, with the corresponding correlation coefficient r and p-value indicated within each panel.
Figure 5.
Same as Figure 4, but for SWH statistical metrics against offshore distance (a–d) and water depth (e–h).
In contrast to the correlations with offshore distance, the relationships between the statistical metrics and water depth are much weaker for both wind speed and SWH (Figure 4e–h and 5e–h). Wind speed RMSE correlates weakly with water depth (r = −0.28, Figure 4f), SI correlates at −0.18 (Figure 4g), and r at 0.34 (Figure 4h). Although the signs of these coefficients are consistent with those for offshore distance, their magnitudes are greatly reduced. For SWH, the correlations of RMSE and r with water depth are near zero (r = −0.02 and −0.05, respectively; Figure 5f,h), and the correlation between SI and water depth is only −0.19 (Figure 5g). Our results reveal that, in the specific environment of the Bohai and Yellow Seas, the accuracy of wind speed and SWH improves with increasing offshore distance. The regulating effect of offshore distance far exceeds that of water depth. This finding is consistent with a global assessment based on 444 buoys [16], which reported that SWH accuracy depends more on offshore distance than on water depth.
The native grid resolution of the ERA5 atmospheric component is approximately 31 km, whereas that of the wave component is about 40 km [4]. The Bohai and Yellow Seas feature dense islands and sinuous coastlines, with typical inter-island spacing of only 10–20 km, which is smaller than the 31 km resolution of the ERA5 atmospheric grid. A direct consequence of this scale mismatch is that the model grid cannot resolve these small-scale coastal features. A plausible contributor is land–sea contamination: nearshore ERA5 grid cells may contain mixed land–sea-surface types, and their influence may propagate to adjacent ocean grid cells through interpolation and boundary-layer processes, potentially contributing to the degradation of nearshore wind speed simulations. However, as discussed in Section 4.3, this interpretation remains a preliminary hypothesis rather than a definitive attribution. Gualtieri [15], based on evaluations at six tall towers worldwide, confirmed that the ~31 km resolution of ERA5 is insufficient to resolve sub-grid processes caused by complex nearshore topography and land-cover heterogeneity. Studies in the Baltic Sea coastal region also demonstrated that ERA5’s coarse spatial resolution leads to land–sea contamination in nearshore grid cells, preventing the correct resolution of coastal atmospheric phenomena and small-scale wind variations [28]. A comparison study using ASCAT satellite data and ship-borne lidar found that beyond 40 km from the coast, the mean wind speeds from ASCAT and ERA5 agreed well [28]. Although water depth and offshore distance are generally correlated, the strong correlation with offshore distance is likely attributable to the model grid’s insufficient resolution of topographic features with spatial scales smaller than 31 km, rather than directly to variations in water depth. This physical interpretation is internally consistent with the statistical conclusion of “offshore distance dominance and greatly reduced correlation with water depth.” Nevertheless, based solely on observational error statistics, this interpretation remains a plausible hypothesis rather than a definitive attribution. Dedicated numerical sensitivity experiments, such as running a high-resolution regional model with modified land–sea masks, are needed to isolate the specific contribution of land–sea contamination to the nearshore errors.
In summary, both ERA5 wind speed and SWH exhibit better performance offshore than nearshore, with wind speed error metrics showing a larger response gradient to offshore distance. This comparison suggests that improvements in nearshore wind field simulations should focus on enhancing the parameterization of topography and the atmospheric boundary layer (e.g., by introducing high-resolution local models for dynamical downscaling). Wave simulations, in addition to wind field improvements, require separate enhancement of shallow-water physical processes (e.g., bottom friction, wave breaking, and swell propagation). These relationships can serve as a reference for model error tracing and the optimization of nearshore forecasting systems. From an engineering perspective, the strong offshore-distance dependence implies that a single global correction factor for ERA5 is insufficient; instead, distance-based, stratified Bias adjustments should be applied when using ERA5 data for nearshore structure design in this region.
3.1.3. Diurnal Variation in Wind Speed Errors
ERA5 wind speed errors vary diurnally (Figure 6, Table A2 and Table A3). The Bias shows two pronounced negative troughs (ERA5 lower than buoy observations) during local time (Beijing Time, BT) at 06:00–10:00 and 18:00–20:00, with rapid decreases occurring at 05:00 and 17:00; this feature is consistently observed at nearly all stations (Figure 6). These troughs may be associated with discontinuities in the ERA5 near-surface wind speed analysis field at the assimilation cycle boundaries (09:00–10:00 UTC and 21:00–22:00 UTC), as documented in the ECMWF official documentation [29]. The RMSE shows higher values at night (20:00–08:00 BT, approximately 1.44 m/s) and lower values during the daytime (08:00–20:00 BT, approximately 1.36 m/s). This minimum occurs in the early afternoon at 13:00 BT (Table A3).
Figure 6.
Diurnal variations in ERA5 wind speed Bias and RMSE against buoy observations over the Bohai and Yellow Seas. The horizontal axis represents local time (BT; unit: h). The left vertical axis denotes Bias (m/s), and the right vertical axis denotes RMSE (m/s). The solid black line indicates the overall mean Bias, the solid red line indicates the overall mean RMSE, and the gray dashed lines show the Bias curves for 16 individual buoys.
The diurnal amplitude of wind speed Bias is closely related to offshore distance. The station-wise diurnal amplitude of Bias exhibits a significant negative correlation with offshore distance (r = −0.69, p = 0.003). For nearshore stations with offshore distances less than 40 km, the mean diurnal amplitude is approximately 0.60 m/s, whereas for offshore stations beyond 150 km, it decreases to about 0.41 m/s (Table A1 and Table A2). The diurnal fluctuation of Bias at nearshore stations is considerably larger than that at offshore stations, suggesting that the model grid may not effectively resolve topographic features with spatial scales smaller than 31 km, thereby rendering the variations in nearshore wind speed errors more complex. This diurnal signal is present only in the wind speed field and is absent in the SWH field. As a temporal integral response to wind forcing, waves have response timescales ranging from hours to days; however, this diurnal signal is not substantially reflected in the diurnal errors of wave simulations. As will be further discussed in Section 3.2.3, the temporal error correlation between wind speed and SWH is not consistently significant. In summary, ERA5 wind speed errors exhibit a distinct diurnal variation, a feature that warrants particular attention when utilizing ERA5 wind speed data for studies involving diurnal variability.
3.2. Seasonal Characteristics
3.2.1. Seasonal Variations in Wind Speed Statistical Metrics
The errors of ERA5 reanalysis wind speed over the Bohai and Yellow Seas exhibit pronounced seasonal fluctuations and notable regional differences (Figure 7). The Bias (Figure 7a) follows a unimodal annual cycle, peaking during April–May and reaching its minimum in November. This pattern corresponds to a systematic overestimation in spring (March–May) and summer (June–August) and a systematic underestimation in autumn (September–November) and winter (December–February). Region B exhibits the most pronounced Bias fluctuation, with a maximum of 0.73 m/s in May and a minimum of −0.30 m/s in November, yielding an annual amplitude of 1.03 m/s. In contrast, Region D shows the mildest variation, with an annual amplitude of only 0.58 m/s and Biases remaining closer to zero from March to July.
Figure 7.
Seasonal variations of (a) Bias, (b) RMSE, (c) SI, and (d) r for ERA5 10-m wind speed versus buoy observations over the four subregions of the Bohai and Yellow Seas. The horizontal and vertical axes denote the month (1–12) and the corresponding metric value, respectively. Colored lines represent the four subregions (A, B, C, and D).
The RMSE (Figure 7b) peaks between May and September across all regions, with the highest value of 1.71 m/s occurring in May and the lowest of 1.39 m/s in October in the Bohai Sea. The SI (Figure 7c) exhibits a seasonal pattern similar to that of the Bias, with higher values in spring and summer and lower values in autumn and winter. The r (Figure 7d) shows an opposing trend, higher in autumn–winter and lower in spring–summer, with the lowest value of 0.73 in the Bohai Sea in July and the highest of 0.94 in October. This indicates that the linear consistency between simulated and observed wind speeds is poorest in summer and improves markedly in autumn and winter under the influence of large-scale winter monsoon circulation.
This seasonal pattern, characterized by better performance in autumn–winter and worse performance in spring–summer, is linked to the phased transition of the East Asian monsoon over the Bohai and Yellow Seas and the associated local forcing. Spring (April–May) falls within the transitional period between the winter and summer monsoons. During this season, local thermal convection is active and sea–land breeze processes are frequent. A plausible but unverified explanation is that the ~31 km atmospheric grid may not fully resolve these meso- and small-scale processes, which could contribute to the larger errors. Because the present study is observational, this mechanism cannot be isolated from other error sources; it should be regarded as a preliminary hypothesis to be tested through numerical sensitivity experiments with finer-resolution atmospheric downscaling. In summer, although the summer monsoon prevails, the large-scale flow is relatively weak and susceptible to local circulation effects, resulting in persistently low simulation accuracy. In autumn, large-scale weather systems gradually strengthen while local convective activity weakens; in winter, the East Asian winter monsoon dominates, with large-scale circulation forcing prevailing and the wind field becoming relatively homogeneous. These factors collectively contribute to improved model simulation accuracy [30]. The seasonal reversal of Bias reflects the differential systematic response of the ERA5 model to varying wind speed magnitudes. Spring and summer are dominated by weak winds, for which the model tends to overestimate, whereas autumn and winter feature more frequent high-wind events, for which it tends to underestimate. This magnitude-dependent mechanism will be further quantified in Section 3.3.
To verify that the seasonal patterns described above are not artifacts of monthly variance, we additionally computed normalized monthly metrics: normalized Bias (NBias) and normalized RMSE (NRMSE). The normalized results, shown in Figure A2a,b, closely follow the original seasonal evolution: NBias still reverses from positive in spring–summer to negative in autumn–winter, and NRMSE is still larger in spring. This confirms that the seasonal characterization of wind speed errors is robust to normalization.
3.2.2. Seasonal Variations in SWH Statistical Metrics
The seasonal variations in ERA5 SWH errors (Figure 8) exhibit features similar to those of wind speed errors, along with distinct evolution patterns attributable to differences in wave physical processes. The Bias (Figure 8a) remains positive throughout the year (indicating a general overestimation by ERA5), with larger overestimation in spring and winter and smaller overestimation in summer and autumn. Region B exhibits the largest Bias fluctuation (from 0.18 m in April to 0.02 m in November), whereas Region D maintains relatively stable Biases between 0.04 and 0.12 m across the year, representing the smallest Bias range of the four regions. The RMSE shows a seasonal pattern similar to that of the Bias (Figure 8b). In Regions A and B, it decreases to 0.18 m and 0.15 m in summer (August) but increases to 0.29 m and 0.32 m in spring (May) and winter (December), respectively; in Regions C and D, the RMSE exhibits relatively mild intra-annual variations, remaining between 0.15 and 0.24 m. The RMSE minima across all regions are concentrated in summer, indicating that the RMSE of SWH simulations is smallest during this season.
Figure 8.
As in Figure 7, but for the statistical metrics of ERA5 SWH versus buoy observations.
The SI (Figure 8c) reaches its highest values in spring and early summer, ranging from 0.49 to 0.55 during March to May in Region A and reaching 0.61 in April in Region B. It then decreases continuously through autumn and winter, dropping to 0.29 in Region A and 0.16 in Region D in November.
This suggests that, although the RMSE is smallest in summer, the relatively low mean SWH during this season substantially amplifies the relative error. In autumn and winter, under the enhanced monsoon regime, wave heights increase and the model captures the wave height magnitude more accurately, leading to a sharp decline in SI. The seasonal variation in r (Figure 8d) further corroborates this interpretation: in June, Regions A and B record their lowest r values of the year (0.76 and 0.75, respectively), whereas from September to October, r generally exceeds 0.96 across most regions. During autumn and winter, r values in all regions are mostly above 0.93, demonstrating that ERA5 exhibits a high capability for reproducing the temporal phase evolution of SWH. In summary, although the RMSE of reanalysis SWH is smallest in summer, the overall accuracy (as measured by SI and r) is lower than that in winter, when the RMSE is larger.
Similarly, for SWH, the normalized monthly metrics (Figure A2c,d) reproduce the same seasonal features as the original metrics: NBias remains positive year-round, and NRMSE is larger in spring and winter. Only a few extreme months show minor changes, which do not affect the overall seasonal interpretation.
3.2.3. Monthly Covariation of Wind and Wave Errors
Regarding seasonal evolution, wind speed and SWH errors exhibit both similarities attributable to the same large-scale dynamic background and distinct differences arising from their respective physical processes (Figure 7 and Figure 8).
In terms of similarities, the accuracy of both wind speed and SWH follows a seasonal pattern—better in the cold season and worse in the warm season—with SI markedly higher in spring and summer, decreasing rapidly in autumn, and remaining at its lowest annual level in winter, whereas r peaks in autumn, followed by winter, and reaches its minimum in late spring and early summer. The monthly SI and r of wind speed and SWH are highly positively correlated (Table 2), with regional correlation coefficients for SI ranging from 0.59 (Region C) to 0.80 (Region A) and those for r from 0.79 (Region B) to 0.92 (Region A). This indicates that the monthly variations in relative error (SI) and phase-capturing ability of wind speed are nearly synchronously reflected in wave simulations. In the offshore regions (Regions C and D), all metrics exhibit milder seasonal fluctuations and more favorable magnitudes, further confirming that both offshore distance and the quality of wind forcing jointly modulate the seasonal error expression.
Table 2.
Correlation coefficients between monthly ERA5 wind speed and SWH statistical metrics across the four subregions of the Bohai and Yellow Seas.
The wind–wave error differences manifest in three key aspects. One key difference is that the Bias direction and magnitude exhibit different responses. Wind speed Bias exhibits a pronounced seasonal reversal, whereas SWH Bias remains positive year-round. The monthly correlation between wind speed and SWH Bias is moderately positive (0.38–0.71, Table 2), indicating that the two Biases tend to vary in the same direction on monthly timescales, although the magnitude of the SWH Bias response is attenuated. Meanwhile, another possible contributor to the year-round positive Bias in SWH is hypothesized to be the inadequate parameterization of bottom friction dissipation in the ERA5 wave model. This hypothesis is qualitatively consistent with the observed fact that ERA5 tends to underestimate wind speeds but overestimate wave heights under many high-wind conditions (Figure A3). In these shallow shelf seas (water depths 10–70 m), the contribution of bottom friction to wave attenuation is non-negligible. If the model indeed underestimates the dissipative effect of bottom friction, simulated wave heights would be systematically overestimated, which qualitatively aligns with the persistently positive wave height Bias observed in this study. This interpretation is supported by previous studies on wave modeling in shallow seas and inland waters. Padilla-Hernández and Monbaliu [31], using the SWAN model in Lake George, showed that wave dynamics there are dominated by the interaction with the bottom and that the simulated wave parameters are highly sensitive to the choice of bottom friction formulation: in their high-wind case, switching bottom friction off raised the combined scatter index from about 0.07 to 0.12. They concluded that formulations that explicitly account for bottom roughness should be preferred when modeling waves in shallow water. For the Yellow Sea and East China Sea, Wang et al. [32] evaluated three bottom friction schemes (JONSWAP, Collins and Madsen) in SWAN simulations of typhoon waves against two shallow-water buoys, with wind input and white-capping fixed to the Komen scheme. The Madsen scheme produced obviously smaller wave heights than the other two during the high-wave period, and its RMSE was roughly 1.7–1.8 times that of JONSWAP (0.73 m and 0.82 m versus 0.43 m and 0.45 m at the two buoys), whereas JONSWAP agreed best with the measurements overall. These results confirm that bottom friction parameterization can substantially affect simulated wave heights in this region, although the sensitivity has so far been quantified at only a few shallow-water locations. However, because the present observational analysis does not directly constrain the ECMWF model’s bottom friction parameter settings or their regional tuning, this interpretation remains tentative and requires targeted numerical experiments for confirmation.
A second distinction lies in the sensitivity of SWH SI in shallow-water regions, which is substantially higher than that of wind speed and accompanied by a larger seasonal amplitude. In Region A, SWH SI decreases from 0.55 in May to 0.29 in November, whereas wind speed SI only declines from 0.29 to 0.20. This is because the mean SWH is extremely low in summer (typically below 0.5 m), so that a small RMSE is amplified into a high SI; in winter, the mean SWH increases and the SI narrows considerably. The seasonal relative variability of wind speed is smaller than that of SWH, resulting in relatively milder SI fluctuations.
Furthermore, the correlation between monthly RMSE of SWH and that of wind speed is markedly weakened or even reversed. In contrast to the strong positive correlations between monthly SI and r (Table 2) and the significant positive spatial correlation between station-wise RMSE values (Section 3.1.1), the monthly SWH RMSE versus wind speed RMSE correlations are substantially weaker or even negative. They are only −0.03 and 0.02 in Regions A and D, respectively, but reach −0.40 in Region C (Table 2). This occurs because wind speed RMSE is relatively large in summer (second only to spring), whereas SWH RMSE reaches its minimum in summer. Specifically, wind speed RMSE exhibits anomalously high values in the south-central Yellow Sea in July (C02–C05) and September (D01–D03) (Figure 7b, Table A4). More generally, the two absolute-error series vary out of phase: wind RMSE is largest in the season when the mean wind is weakest, whereas SWH RMSE is largest when the waves are largest. Correlating the regional monthly RMSE with the corresponding monthly mean state gives negative coefficients for wind speed in all four subregions (r = −0.72, −0.38, −0.61, and −0.51) but positive coefficients for SWH (r = 0.49, 0.73, 0.90, and 0.42), so their correlation cancels. ERA5 also assimilates satellite altimeter SWH globally, including over the study region [4], so part of the SWH error is set by the observing system rather than by the wind; this may modulate the decoupling in Region C, but it is not required to explain it. This seasonal negative correlation reveals the limitation of using RMSE as a sole metric for evaluating SWH or wind speed accuracy over short timescales: error sources are subject to multiple constraints, and different conditions may lead to considerable fluctuations in the results. A wave-side factor may also contribute, since nearshore wave simulations are controlled by processes beyond wind forcing alone. Although the primary driver of waves is surface wind, and waves as a spatiotemporal integral response to wind forcing are largely governed by the accuracy of the wind field [26,33], wave generation parameterizations and propagation processes also exert significant influence in nearshore areas. Consequently, during certain periods, wind speed and SWH RMSE may exhibit an antiphase relationship, whereas their correlations in terms of SI and r remain largely unaffected, and the impact on Bias correlations is relatively weak. The seasonal antiphase characteristics of wind speed and SWH RMSE, as well as the anomalously high RMSE values in July and September, warrant further in-depth analysis in future work.
The above analysis reveals a distinct characteristic of wind–wave error inter-comparison in the Bohai and Yellow Seas: SI and phase consistency (r) exhibit strong coherence and can serve as sensitive indicators for jointly assessing wind and wave simulations. RMSE, however, requires consideration of the filtering and non-local effects inherent to wave processes; SWH RMSE should not therefore be linearly inferred from wind speed RMSE. This insight offers a reference for model improvement on a region- and metric-specific basis: improving the simulation accuracy of the wind field in terms of SI and r tends to be accompanied by improvements in SWH simulations. Reducing SWH RMSE, in contrast, requires independent refinement of shallow-water physical processes (bottom friction, wave breaking) and swell propagation parameterization within the wave model.
3.3. Magnitude Dependence of Wind Speed and SWH Errors
3.3.1. Wind Speed Error Metrics Grouped by Magnitude Intervals
ERA5 wind speed errors show systematic dependencies on wind speed magnitude (Figure 9, Table A5). The Bias transitions from positive to negative as wind speed increases, with the dispersion range widening correspondingly. In the [0, 3] m/s bin, the Bias across all buoy stations (Table A5) remains positive (0.52–1.17 m/s), indicating a systematic overestimation of weak winds by ERA5. For the (3, 6] and (6, 10] bins, the median Bias shifts from positive to negative, changing from 0.22 to −0.29 m/s. For wind speeds exceeding 10 m/s, the Bias becomes strongly negative, with its absolute magnitude increasing with wind speed and reaching a median of −2.59 m/s in the >16 m/s bin. The boxplot (Figure 9a) reveals that the Bias dispersion range expands markedly with increasing wind speed, suggesting that the model exhibits sharply increasing uncertainty in simulating extreme wind events.
Figure 9.
Boxplots of wind speed statistical metrics for wind speed magnitude intervals over the study region. Panels (a) through (d) present Bias, RMSE, SI, and r, respectively. The horizontal and vertical axes denote wind speed bins (m/s) and the corresponding metric values, respectively. The box, line, and whiskers represent the interquartile range (IQR), the median, and the 5th and 95th percentiles, respectively.
The RMSE exhibits a pronounced overall increasing trend with wind speed (Figure 9b, Table A5). In the [0, 3] bin, the median RMSE is approximately 1.44 m/s (Table A5), with relatively small interstation variability. In the (3, 6] and (6, 10] bins, the median RMSE stabilizes at 1.30–1.33 m/s. For the (10, 13] bin, it rises to about 1.57 m/s. It further increases to 2.07 m/s and 2.88 m/s in the (13, 16] and >16 m/s bins, respectively. Regarding regional differences, the RMSE in Regions A and B is notably higher than that in Regions C and D under high-wind conditions (Table A5), suggesting larger RMSE values in the Bohai Sea and northern Yellow Sea during strong wind events.
The SI exhibits a decreasing trend with increasing wind speed (Figure 9c, Table A5). In the [0, 3] bin, the median SI is 0.74, indicating substantial relative errors; it decreases to approximately 0.28 in the (3, 6] bin and further to 0.17 in the (6, 10] bin. For wind speeds >10 m/s, the median SI mainly ranges between 0.14 and 0.17. This implies that, although the RMSE increases under strong wind conditions, the higher wind speeds themselves contribute to a substantial reduction in the relative error metric (SI).
The r initially increases and then decreases with rising wind speed (Figure 9d, Table A5). In the [0, 3] bin, the median r is 0.35, indicating a generally low correlation between ERA5 and buoy wind speeds across all stations. It rises to 0.52 in the (3, 6] bin and further to 0.57 in the (6, 10] bin, then declines slightly in the (10, 13] and (13, 16] bins, before rebounding slightly in the >16 m/s bin.
In addition to the fixed wind speed bins, we also computed the 95th percentile threshold of buoy-observed wind speed at each station and calculated the error metrics for samples exceeding this threshold (Table A5). Compared with the >16 m/s bin, the 95th percentile results show a consistent pattern: ERA5 systematically underestimates high wind speeds, as indicated by the negative Bias in both cases. However, the magnitude of the negative Bias for the 95th percentile samples is generally smaller than that for the >16 m/s bin, and the correlation coefficients are noticeably higher. This indicates that ERA5 performs relatively better for moderately extreme high-wind samples than for the most extreme ones, while the overall tendency to underestimate strong winds remains evident. The 95th percentile results are therefore consistent with the negative Bias found in the high-value bins, confirming that ERA5 underestimates wind speed under extreme conditions.
3.3.2. SWH Error Metrics Grouped by Magnitude Intervals
ERA5 SWH errors also show systematic dependencies on SWH magnitude bins (Figure 10, Table A6). The Bias is positive (ERA5 overestimation) in the low SWH bin (<1.5 m), slightly positive in the moderate-to-high SWH bin (1.5–3.0 m), and shows a tendency toward negative values under high SWH (>3.0 m), albeit with considerable dispersion (Figure 10a). Bessonova et al. [16] also found a significant negative Bias of ERA5 SWH under high sea states in their global validation, corroborating the negative Bias pattern observed in the >3.0 m bin of this study.
Figure 10.
As in Figure 9, but for SWH statistical metrics across SWH magnitude bins (m).
The RMSE exhibits an increasing trend with SWH magnitude (Figure 10b), rising from a median of approximately 0.18 m in the [0, 0.5] bin to about 0.38 m in the (2.0, 3.0] bin. The SI displays a decreasing trend with increasing SWH (Figure 10c), with the median range decreasing from 0.45–0.65 in the [0, 0.5] bin to 0.16–0.20 in the (2.0, 3.0] bin. This trend indicates that, although RMSE increases with SWH, the faster increase in mean SWH itself leads to a substantial reduction in SI. In the low SWH bin, the SI dispersion in Region A is the largest among all regions (Table A6), reflecting the pronounced spatial heterogeneity of SI under small-wave conditions in shallow waters. The r first decreases slightly with increasing SWH and then gradually recovers after SWH exceeds 2 m (Figure 10d).
Similarly, we computed the 95th percentile threshold of buoy-observed SWH at each station and evaluated the error metrics for samples above this threshold (Table A6). In contrast to the >3 m bin, where Biases are mixed in sign and some stations show pronounced negative Biases, the 95th percentile samples exhibit Biases closer to zero, without a clear systematic underestimation or overestimation. Nevertheless, both approaches indicate relatively small RMSE and SI values, and the correlation coefficients for the 95th percentile samples are generally higher than those for the >3 m bin. This suggests that ERA5 reproduces the variability of extreme wave heights reasonably well, although the most extreme cases (>3 m) show larger and more variable Biases. Overall, the 95th percentile results are broadly consistent with the high-value bin statistics, but ERA5 does not display the same systematic underestimation for extreme SWH as it does for extreme wind speed.
3.3.3. Comparative Error Characteristics of Wind Speed and SWH Across Magnitude Intervals
The bin-wise validation results for wind speed and SWH show both similarities and differences. In terms of similarities, the RMSE of both variables generally increases with variable magnitude, reflecting the magnitude dependence of model errors. The SI tends to decrease with increasing magnitude, indicating that relative accuracy improves under stronger dynamic conditions. The Bias of both variables generally decreases with increasing magnitude, with the sign shifting from positive to negative at thresholds of 6–10 m/s for wind speed and >3.0 m for SWH, respectively. In terms of key discrepancies, the correlation contrast is particularly pronounced in the low-value ranges: the median wind speed r in the weak-wind bin (<3 m/s) is only 0.25–0.40, whereas the median SWH r in the low SWH bin (<0.5 m) still reaches 0.60–0.70 (Figure 9d and Figure 10d).
Several factors may explain these magnitude-dependent patterns. Under low-wind-speed conditions, the systematic overestimation by ERA5 [34] may be associated with inherent Biases in the model’s simulation of near-surface turbulent mixing under stable boundary layer stratification. In addition, the dissipation parameterization in the wave model under low sea states may also contribute to the errors. Under high-wind-speed conditions, the sea-state-dependent Charnock parameterization scheme adopted in ERA5 may lead to an overestimation of surface drag under strong-wind and young-wave conditions [35]. This excessive drag extracts momentum from the atmosphere, resulting in a systematic underestimation of near-surface wind speeds. The RMSE of SWH also increases under high sea states, though this error source requires further independent verification. These patterns suggest that the magnitude dependence of errors may be associated with the differential responses of the model’s physical parameterization schemes under varying dynamic conditions. However, given the limitations of observational data in directly constraining the model’s internal physical processes, this inference warrants further validation through dedicated numerical experiments. This systematic error pattern is characterized by overestimation at low magnitudes and underestimation at high magnitudes for both wind speed and SWH. It should therefore be addressed separately in correction strategies, with priority given to eliminating systematic overestimation in the lower ranges while compensating for systematic underestimation in the higher ranges. Several mechanisms may contribute to the magnitude-dependent errors, but they are proposed here as preliminary hypotheses rather than established causes. In particular, the possible roles of near-surface turbulent mixing under stable boundary-layer stratification, sea-state-dependent Charnock drag, and wave dissipation parameterizations cannot be diagnosed from our buoy-based error statistics alone. Controlled numerical sensitivity experiments—perturbing boundary-layer and surface-drag schemes in the atmospheric model and dissipation/bottom-friction schemes in the wave model—are required to test these hypotheses.
3.3.4. Sign Inconsistency Between Wind and Wave Errors at High Wind Speeds
A joint sample conditioned on the observed wind speed exposes an inconsistency between the two error fields. For the 4183 h at which the buoy wind exceeds 13 m/s, the mean ERA5 wind speed is 13.15 m/s against an observed 14.85 m/s, a relative deficit of 11%, yet the mean ERA5 SWH is 2.78 m against an observed 2.63 m, a surplus of 6% (Table 3); the SWH Bias is positive at 13 of the 16 stations (sign test, p = 0.02), the exceptions being B02 and C01, at −0.32 and −0.14 m, and D02, which is essentially zero. Selecting the same hours by wave height gives the same picture from the other side: for SWH > 3 m the wind is underestimated by 1.06 m/s while the SWH Bias is close to zero. A wind deficit alone would produce a negative SWH Bias, so the two Biases cannot both originate in the atmospheric forcing. The inconsistency therefore locates the high-sea-state error on the wave-model side—an over-energetic response of the growth and dissipation terms in these shallow, fetch-limited waters—rather than in the wind field. The practical corollary is immediate: applying a wind-speed Bias correction before driving a wave model would enlarge, not reduce, the positive SWH Bias at high sea states.
Table 3.
ERA5 Biases in two high-energy subsamples at the 16 buoy stations: hours with buoy wind speed above 13 m/s and hours with buoy SWH above 3 m. Three stations contribute fewer than 30 h to the SWH > 3 m subsample.
3.4. Sensitivity Analysis and Robustness Assessment Using the 8-Station Subset
To evaluate whether the main conclusions of this study are sensitive to the temporal heterogeneity of the buoy observations, and to account for the potential influences of interannual climate variability such as ENSO and variations in monsoon strength, a dedicated sensitivity analysis was performed using only the eight buoys with data spanning March 2024–February 2025 (A01, A02, B01, B04, C02, C03, C04, and C05). These eight stations share a common observation period, thereby minimizing the confounding effects of different years. They cover the Bohai Sea (Region A), the northern Yellow Sea (Region B), and the central Yellow Sea (Region C), but do not include the southern Yellow Sea (Region D). The full 16-station dataset, which combines observations from different years within a 10-year window, was used as the reference. In addition to the standard error metrics (Bias, RMSE, SI, and Pearson correlation ), the sensitivity analysis also incorporates the MAE and Spearman rank correlation () as robust alternatives, to account for non-normal distributions and outlier sensitivity.
3.4.1. Overall Statistical Comparison
Table A7 compares the overall statistical metrics derived from the 16-station dataset and the 8-station subset. For wind speed, the 8-station subset yields a Bias of −0.01 m/s, MAE of 1.06 m/s, RMSE of 1.41 m/s, SI of 0.23, of 0.90, and of 0.88, all of which are nearly identical to the 16-station results (Bias = 0.04 m/s, MAE = 1.06 m/s, RMSE = 1.40 m/s, SI = 0.24, = 0.90, = 0.88). The absolute relative differences are below 1.5% for all metrics except Bias, whose relative difference is large (119.36%) simply because the 16-station mean Bias is very close to zero; the absolute difference is only 0.05 m/s. For SWH, the 8-station subset gives Bias = 0.13 m, MAE = 0.18 m, RMSE = 0.24 m, SI = 0.33, = 0.94, and = 0.92, again consistent with the 16-station values (Bias = 0.11 m, MAE = 0.17 m, RMSE = 0.23 m, SI = 0.30, = 0.94, = 0.92). The absolute relative differences range from 0.10% to 18.25%, with the largest difference found for Bias due to its small magnitude. Overall, the two datasets produce very similar error statistics, indicating that the mixing of different years does not substantially alter the overall accuracy assessment.
3.4.2. Relationship Between Error Metrics and Offshore Distance
The relationship between error metrics and offshore distance was re-examined using the 8-station subset, and the results are summarized in Table A8. For wind speed, the 8-station subset shows stronger negative correlations between offshore distance and MAE (, ), RMSE (, ), and SI (, ), as well as a stronger positive correlation with (, ), compared with the 16-station dataset. For SWH, the 8-station subset also exhibits stronger correlations with offshore distance, especially for RMSE (, ) and SI (, ). Although the 8-station subset lacks Region D, the overall tendency of decreasing errors with increasing offshore distance remains robust. The consistent sign and significance of these correlations confirm that offshore distance remains the primary spatial control on ERA5 errors in this region.
3.4.3. Diurnal Variations in Wind Speed
Figure A4 compares the diurnal variations in wind speed Bias and RMSE between the 16-station dataset and the 8-station subset. Both datasets exhibit two negative Bias troughs in the morning (06:00–10:00 BT) and evening (18:00–20:00 BT), as well as higher RMSE at night and lower RMSE during the day. The 8-station subset reproduces these features closely, with only minor differences in amplitude. For example, the daytime mean Bias is −0.005 m/s for the 16-station dataset and −0.051 m/s for the 8-station subset, while the nighttime mean Bias is 0.091 m/s and 0.044 m/s, respectively. The corresponding RMSE values are also similar (daytime: 1.364 vs. 1.368 m/s; nighttime: 1.431 vs. 1.445 m/s). These results indicate that the diurnal error characteristics are not an artifact of combining data from different years.
3.4.4. Seasonal Variations and Monthly Wind–Wave Error Correlations
Figure A5 and Figure A6 present the seasonal variations in wind speed and SWH error metrics for the 16-station dataset and the 8-station subset, respectively. The seasonal cycles are highly consistent between the two datasets. For wind speed, both show a Bias reversal from positive in spring–summer to negative in autumn–winter, with SI peaking in spring–summer and peaking in autumn–winter. For SWH, both exhibit a persistent positive Bias that weakens in summer and strengthens in winter. MAE is an important metric that provides a robust measure of absolute deviation, particularly in the presence of outliers. In the present study, the seasonal MAE curves closely follow the RMSE curves, indicating that the two metrics convey similar information regarding seasonal error variability. Given this similarity, focusing the main analysis on RMSE is reasonable, while MAE is retained as a complementary diagnostic.
Table A9 compares the monthly wind–wave error correlations between the 16-station dataset and the 8-station subset, reporting both Pearson () and Spearman () coefficients. For the 16-station dataset, the correlations between wind and SWH errors are strong for SI and (e.g., for SI in Region A, for in Region A), and weaker or negative for RMSE. The 8-station subset reproduces these patterns, although some regional differences appear due to the smaller sample size. For example, in Region A, the 8-station Pearson correlation for SI is 0.78, and for it is 0.94. In Region B, the correlations are lower but still qualitatively similar. The Spearman coefficients generally agree with the Pearson coefficients, with significant correlations for SI and in most regions. Given that the Pearson and Spearman results are largely consistent, and that the present analysis primarily employs Pearson , the Pearson coefficients are retained for the main analysis, while the Spearman results are provided as a robustness check. This confirms that the main conclusions are not sensitive to the choice of correlation method.
3.4.5. Magnitude-Binned Error Statistics
Figure A7 and Figure A8 compare the boxplots of wind speed and SWH error metrics across magnitude bins for the 16-station dataset and the 8-station subset. The two datasets yield strikingly similar distributions. For wind speed, both show a transition from positive to negative Bias as wind speed increases, a general increase in RMSE with wind speed, a decrease in SI with increasing wind speed, and a non-monotonic pattern in that first increases and then decreases. For SWH, both exhibit positive Bias at low wave heights and a tendency toward negative Bias at high wave heights, with RMSE increasing and SI decreasing with wave height. The close agreement between the two datasets indicates that the magnitude-dependent error characteristics are robust and not an artifact of the temporal aggregation.
3.4.6. Summary of the Sensitivity Analysis
The sensitivity analysis using the 8-station subset confirms that the main conclusions of this study are robust to the temporal heterogeneity of the buoy observations. The overall error statistics, the offshore-distance dependence, the diurnal cycle, the seasonal evolution, the monthly wind–wave error correlations, and the magnitude-dependent error patterns are all reproduced with good fidelity. The inclusion of MAE and Spearman rank correlation further strengthens the robustness of the findings and provides a more comprehensive assessment of ERA5 performance. The only notable limitation is the absence of Region D in the 8-station subset, which prevents independent verification of the seasonal cycle in the southern Yellow Sea; however, the consistency observed in Regions A–C suggests that the full 16-station results are reliable. Therefore, the mixing of observations from different years within the 10-year window does not compromise the primary conclusions of this study.
4. Limitations and Outlook
4.1. Spatiotemporal Representativeness of Observational Data
The 16 buoy stations used in this study cover the entire Bohai and Yellow Seas spatially; however, the station distribution in the southeastern Yellow Sea remains relatively sparse, which may not fully represent the spatial error characteristics in these areas. The observation period for each buoy station is limited to one full year—a trade-off between including more stations, comparable temporal coverage, and keeping all time series within a 10-year window. This may introduce uncertainties due to the relatively short record length (Table A1).
4.2. Seasonal Weakness in the SWH–Wind Speed RMSE Correlation
This study reveals that SWH RMSE and wind speed RMSE exhibit a moderately positive spatial correlation (r = 0.62, Table 1), but show no correlation—or even a negative one—on a seasonal scale (r = −0.03 to −0.40, Table 2). Most of this discrepancy is accounted for by the opposite seasonal phasing of the two absolute errors (Section 3.2.3), although non-local swell components and SWH data assimilation may add to it. Owing to observational limitations, this study does not perform a quantitative separation or validation of wind sea and swell, and this possible explanation warrants further verification.
4.3. Implications for Model Refinement and Engineering Applications
Based on the systematic diagnosis of this study, the priorities for model improvement and data application in the Bohai and Yellow Seas should be differentiated as follows.
Two approaches are recommended to improve nearshore wind simulations. One is enhancing the responsiveness of nearshore atmospheric boundary layer parameterization schemes to nearshore circulations. Alternatively, high-resolution local models (e.g., the Weather Research and Forecasting Model (WRF) at 1–3 km) could be incorporated for dynamical downscaling atop the native grid to resolve sub-grid-scale processes. This recommendation is supported by two independent lines of evidence: the strong correlation between offshore distance and wind speed RMSE (r = −0.83), and the significant correlation between the diurnal amplitude of nearshore Bias and offshore distance (r = −0.69). Wave simulation improvements cannot be achieved through enhanced wind forcing inputs alone: the weak seasonal correlation between SWH RMSE and wind speed RMSE suggests that the internal physical processes in the wave model must be optimized independently.
At the data application level, the region-, season-, and magnitude-dependent error patterns reported here support the construction of a stratified Bias correction scheme. In the low-value ranges (wind < 6 m/s, SWH < 1.5 m), systematic overestimation should be removed to avoid over-conservative design loads. In the high-value ranges (wind > 13 m/s, SWH > 3.0 m), systematic underestimation must be compensated to prevent under-design and ensure structural safety. Such differentiated corrections are particularly critical for offshore wind turbine foundation design and extreme wave run-up calculations on coastal protection works. In these applications, both overestimation and underestimation carry significant economic and safety consequences. Because the high-wind error is a surplus of wave height rather than a deficit, the two corrections must also be applied in the right order: a wind-speed correction alone will enlarge the SWH Bias above about 13 m/s, so any adjustment intended for design-wave estimation should be applied to the wave height directly, or accompanied by a re-tuning of the shallow-water dissipation terms.
It should be emphasized that the physical interpretations proposed in Section 3.1.2, Section 3.2.1, Section 3.2.3 and Section 3.3.3—including land–sea contamination, unresolved coastal topography and seabed morphology, boundary-layer parameterization, bottom friction, and drag parameterization—are inferred from error statistics and the existing literature rather than from direct model sensitivity experiments. They therefore remain preliminary hypotheses. Dedicated numerical sensitivity experiments, such as high-resolution atmospheric downscaling and controlled wave-model perturbations of bathymetry, bottom friction, and dissipation, are required before these mechanisms can be treated as established.
5. Conclusions
Using one-year hourly observational data from 16 buoy stations, we evaluate the accuracy characteristics of ERA5 reanalysis 10-m wind speed and SWH over the Bohai and Yellow Seas. We characterize the spatial distribution, seasonal evolution, and magnitude dependence of the errors, and we quantify the inter-comparison relationship between wind and wave errors. The main conclusions are as follows:
- (1)
- ERA5 demonstrates generally good applicability over the entire study region; however, the errors are closely related to offshore distance, while the relationship with water depth is relatively weak. The correlation coefficient between wind speed RMSE and offshore distance reaches −0.83, while that between SWH RMSE and offshore distance is −0.41, and the correlation between SWH RMSE and water depth is only −0.02. Water depth is not a control variable in this region: at fixed offshore distance a 2.5-fold change in depth alters wind RMSE by 0.02 m/s, and once distance is accounted for the partial correlation with depth is negligible for every metric.
- (2)
- Wind speed Bias exhibits a seasonal reversal, characterized by overestimation in spring and summer and underestimation in autumn and winter. SWH Bias remains positive throughout the year but is weaker in summer and stronger in winter. The feature of “larger RMSE in winter but larger SI in summer” for SWH over shelf seas is quantitatively characterized. Wind speed and SWH exhibit strong coherence in terms of SI and r, serving as sensitive indicators for the joint diagnostic assessment of wind–wave accuracy. The spatial correlation coefficients of SI and r between wind and waves are 0.70 and 0.83, respectively, while the monthly correlation coefficients range from 0.59 to 0.80 and from 0.79 to 0.92, respectively. Wind speed RMSE and SWH RMSE are strongly spatially correlated (r = 0.62), but exhibit weak or even negative correlations on a seasonal timescale (with a minimum r of −0.40, Table 2). The strong coherence of SI and r indicates that ERA5 reliably captures the temporal variability and phase evolution of wind and waves. These metrics are therefore suitable for engineering applications requiring accurate wave timing (e.g., operation window forecasting). The decoupling of RMSE is instead a consequence of the opposite seasonal phasing of the two absolute errors—wind RMSE is largest when the mean wind is weakest, SWH RMSE when the waves are largest—so that absolute error reduction for wave height still requires separate model improvements, but these cannot be diagnosed from an RMSE correlation with wind speed.
- (3)
- Both wind speed and SWH exhibit pronounced magnitude dependence. Wind speed Bias shifts from positive to negative at 6–10 m/s, while SWH Bias shifts from positive to negative at >3.0 m. This suggests that both variables are characterized by overestimation at low values and underestimation at high values. Under low-energy conditions, the temporal consistency of SWH (r = 0.60–0.70, Figure 10d) is substantially better than that of wind speed (r = 0.25–0.40, Figure 9d), consistent with the natural smoothing/filtering effect of waves on wind variability. The systematic overestimation at low magnitudes and underestimation at high magnitudes imply that engineering designs based on uncorrected ERA5 data would be either overly conservative (at low energy states) or potentially unsafe (at extreme conditions). Bias correction strategies must therefore be magnitude-dependent to ensure both economy and safety. The sign of the two Biases is itself informative: above 13 m/s the wind is underestimated by 11% while SWH is overestimated by 6% at 13 of the 16 stations, an inconsistency that cannot originate in the wind forcing and that locates the high-sea-state error in the wave model.
- (4)
- Wind speed errors vary diurnally. The ERA5 wind speed Bias shows two troughs during 06:00–10:00 and 18:00–20:00, and the diurnal amplitude of Bias at nearshore stations is significantly correlated with offshore distance (r = −0.69). When ERA5 wind data are used for engineering analyses involving diurnal cycles (e.g., fatigue loading of offshore wind turbines), this diurnal error variation must be explicitly accounted for to avoid biased cumulative load estimates.
Author Contributions
Conceptualization, X.Y. and S.L.; methodology, S.L. and A.L.; software, X.Z.; validation, S.L. and X.Z.; formal analysis, S.L. and Y.W.; investigation, S.L. and X.Z.; resources, X.Y. and Y.Y.; data curation, S.L. and X.Z.; writing—original draft, S.L. and Y.W.; writing—review and editing, X.Y. and X.W.; visualization, X.Z. and Y.Y.; supervision, X.Y., Y.W. and X.W.; project administration, X.Y.; funding acquisition, X.Y. and Y.W. All authors have read and agreed to the published version of the manuscript.
Funding
This research was funded by the State Key Laboratory of Spatial Datum (Project No. SKLSD2025-KF-14), the Tianjin Natural Science Foundation (Grant No. 23JCYBJC01120), the Open Project of Tianjin Key Laboratory of Oceanic Meteorology (Project No. 2024TKLOM03), and the National Natural Science Foundation of China (Grant Nos. 42476028, 42406009, 42405048, and 42405166).
Data Availability Statement
The ERA5 data can be obtained from https://cds.climate.copernicus.eu/datasets/reanalysis-era5-single-levels?tab=overview (accessed on 05 June 2026). The in situ observational data are available from the National Marine Data and Information Service upon reasonable request: https://mds.nmdis.org.cn/pages/aboutUs.html (accessed on 05 June 2026).
Acknowledgments
During the preparation of this manuscript, the authors used DeepSeekV4 to refine language expression and polish grammar. The AI tool was used under the authors’ supervision. All research ideas, experimental design, core data analysis, and scientific conclusions were independently completed by the authors. The authors have reviewed and edited the output and take full responsibility for the content of this publication.
Conflicts of Interest
The authors declare no conflicts of interest.
Abbreviations
The following abbreviations are used in this manuscript:
| ECMWF | European Centre for Medium-Range Weather Forecasts |
| ERA5 | ECMWF Reanalysis v5 |
| SWH | Significant wave height |
| RMSE | Root-mean-square error |
| SI | Scatter index |
| r | Correlation coefficient |
Appendix A
Table A1.
Information of the 16 buoy stations used in this study, including buoy ID, longitude (°E), latitude (°N), water depth (m), offshore distance (km), observation period (day/month/year), and data availability statistics: Missing (%), QC-Rejected (%), and Availability (%). Bold values indicate stations located within the ERA5 native resolution limits (<31 km for the atmospheric grid and <40 km for the wave model grid).
Table A2.
Diurnal variations in mean Bias (m/s) of ERA5 10-m wind speed at each buoy station, averaged over the observation period.
Table A3.
Diurnal variations in mean RMSE (m/s) of ERA5 10-m wind speed at each buoy station, averaged over the observation period.
Table A4.
Monthly variations in wind speed RMSE (m/s) for ERA5 at stations in Regions C and D. Data are shown for each month from March to February. Dashes (—) indicate limited or no comparative data.
Table A5.
Statistical metrics of ERA5 10-m wind speed errors stratified by wind speed bins at each buoy station. For each bin, Bias, RMSE, SI, and r are presented.
Table A6.
Statistical metrics of ERA5 SWH errors stratified by SWH bins at each buoy station. For each bin, Bias, RMSE, SI, and r are presented.
Table A7.
Comparison of overall statistical metrics between the full 16-station dataset and the 8-station subset (2024–2025) for ERA5 wind speed and SWH. Values are averaged over stations for each dataset, except for Count, which is the total number of valid samples. The absolute relative difference is also provided.
Table A8.
Correlation between error metrics and offshore distance for ERA5 wind speed and SWH, based on the full 16-station dataset and the 8-station subset. Values are given as correlation coefficient (p-value). Pearson and Spearman rank correlations are reported separately.
Table A9.
Pearson and Spearman rank correlations between monthly ERA5 wind speed and SWH statistical metrics across the four subregions (A–D) of the Bohai and Yellow Seas. For each metric pair, the first value corresponds to the full 16-station dataset, and the value in parentheses corresponds to the 8-station subset. The upper panel reports Pearson correlation coefficients and their -values (), while the lower panel reports Spearman rank correlation coefficients and their -values ().
Figure A1.
Taylor diagrams for ERA5 (a) 10-m wind speed and (b) SWH validated against buoy observations over the Bohai and Yellow Seas. Four subregions are shown: A, B, C, and D. The black star denotes the reference point (buoy observations). Both the standard deviation and the centered RMSE are normalized by the standard deviation of buoy observations.
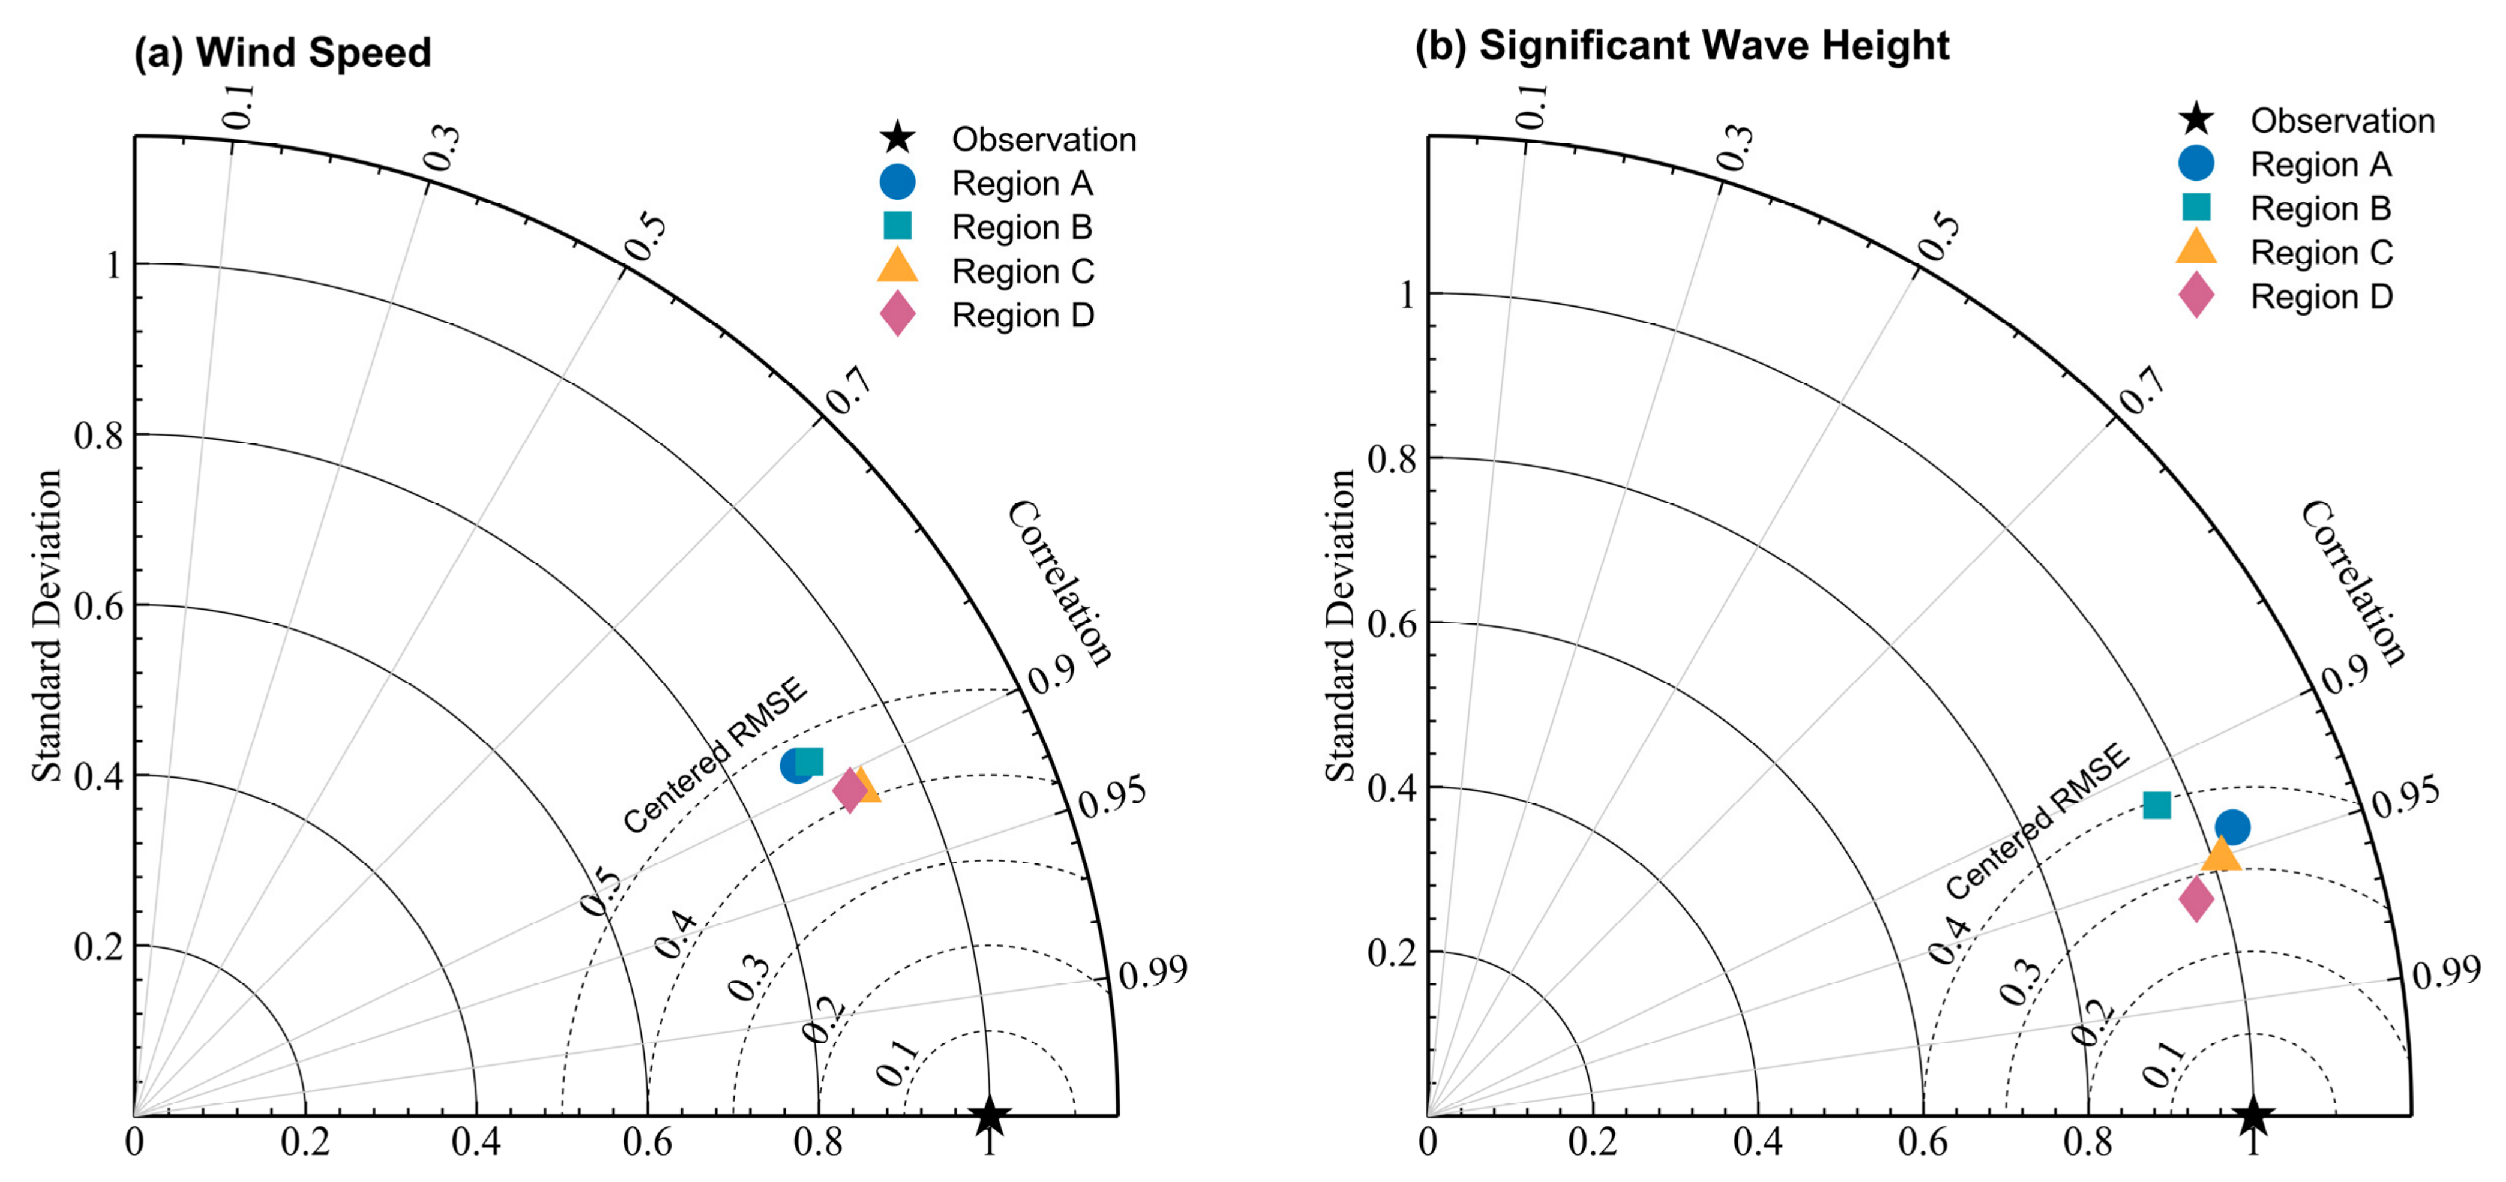
Figure A2.
Regional mean monthly normalized error metrics of ERA5 wind speed (top row) and SWH (bottom row) against buoy observations in the Bohai and Yellow Seas. (a) Normalized Bias (NBias) and (b) normalized RMSE (NRMSE) for wind speed; (c) NBias and (d) NRMSE for SWH. NBias is defined as the Bias divided by the monthly mean buoy observation, and NRMSE as the RMSE divided by the monthly standard deviation of buoy observations. Colored lines denote the four subregions: A, B, C, and D. Each point represents the average of station-wise monthly metrics within each region. The horizontal axis runs from March to February of the following year.
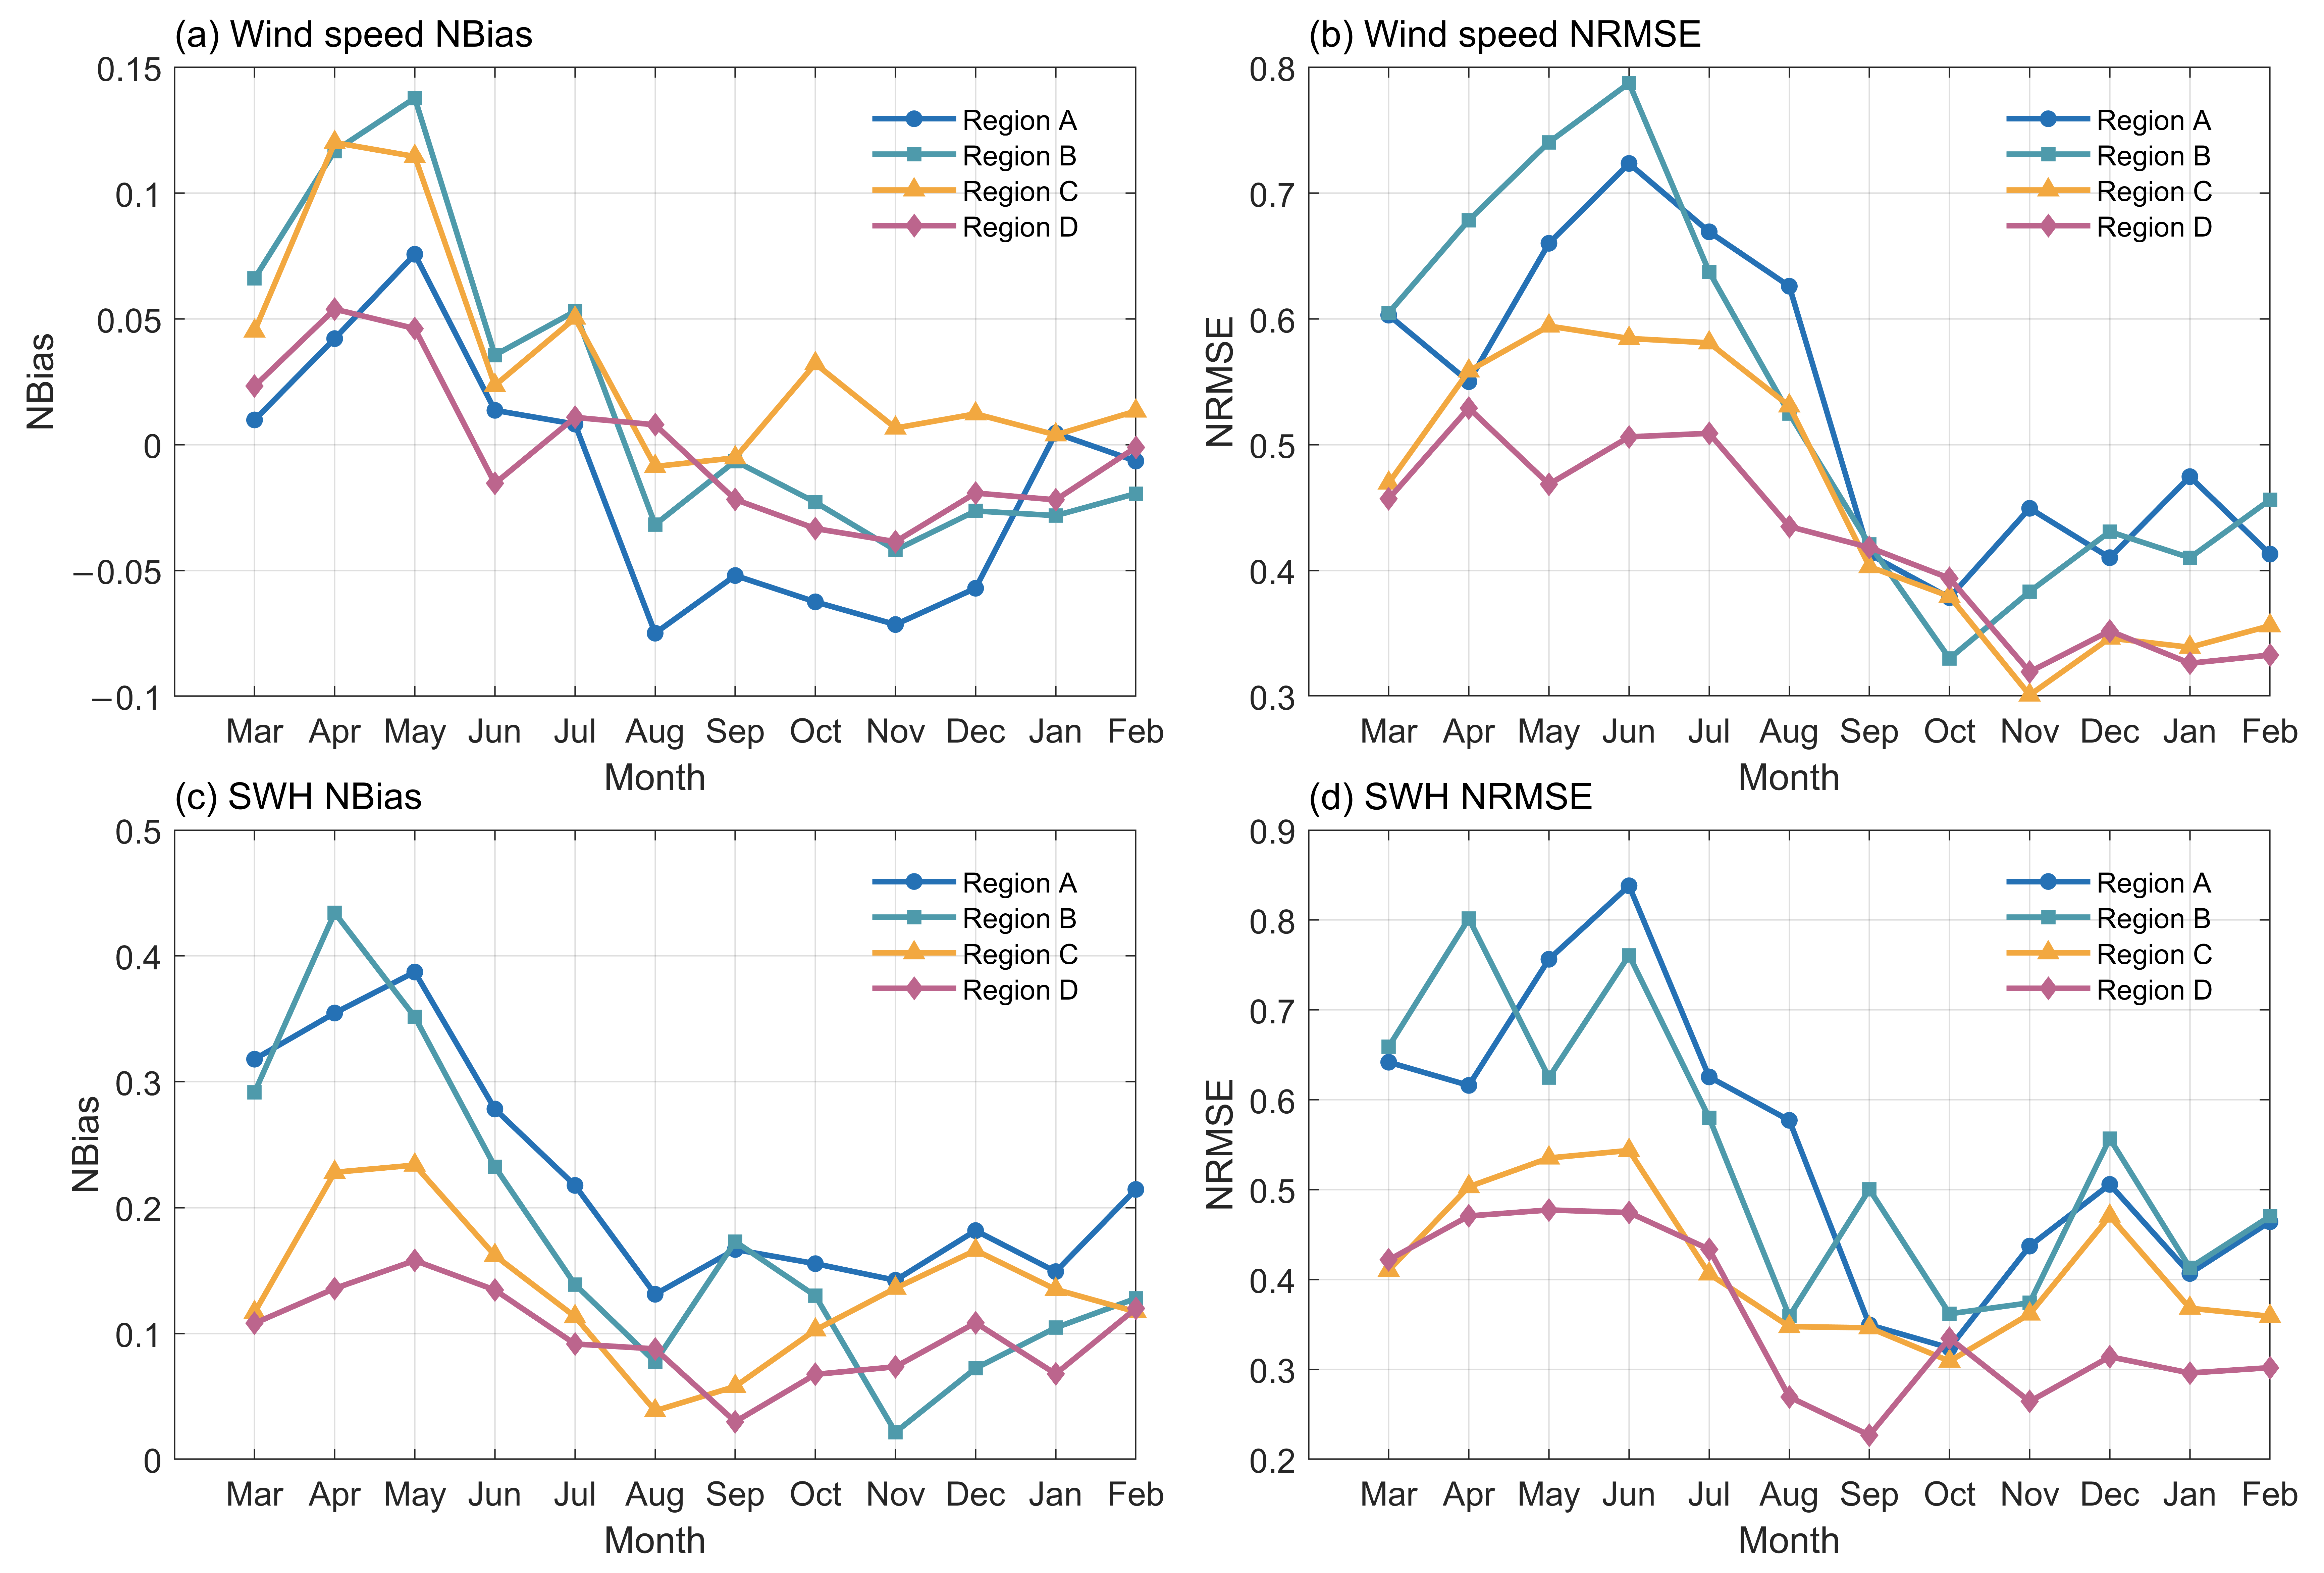
Figure A3.
Time series comparisons of ERA5 reanalysis and buoy observations for wind speed and SWH at selected stations: (a) wind speed at Station A01, (b) wind speed at Station B01, (c) SWH at Station A01, (d) SWH at Station B01, (e) wind speed at Station C02, (f) wind speed at Station D01, (g) SWH at Station C02, (h) SWH at Station D01. Red lines denote buoy measurements, and blue lines denote ERA5 data. Notably, during periods with large SWH (>3.0 m), ERA5 tends to underestimate wind speeds but overestimate wave heights.
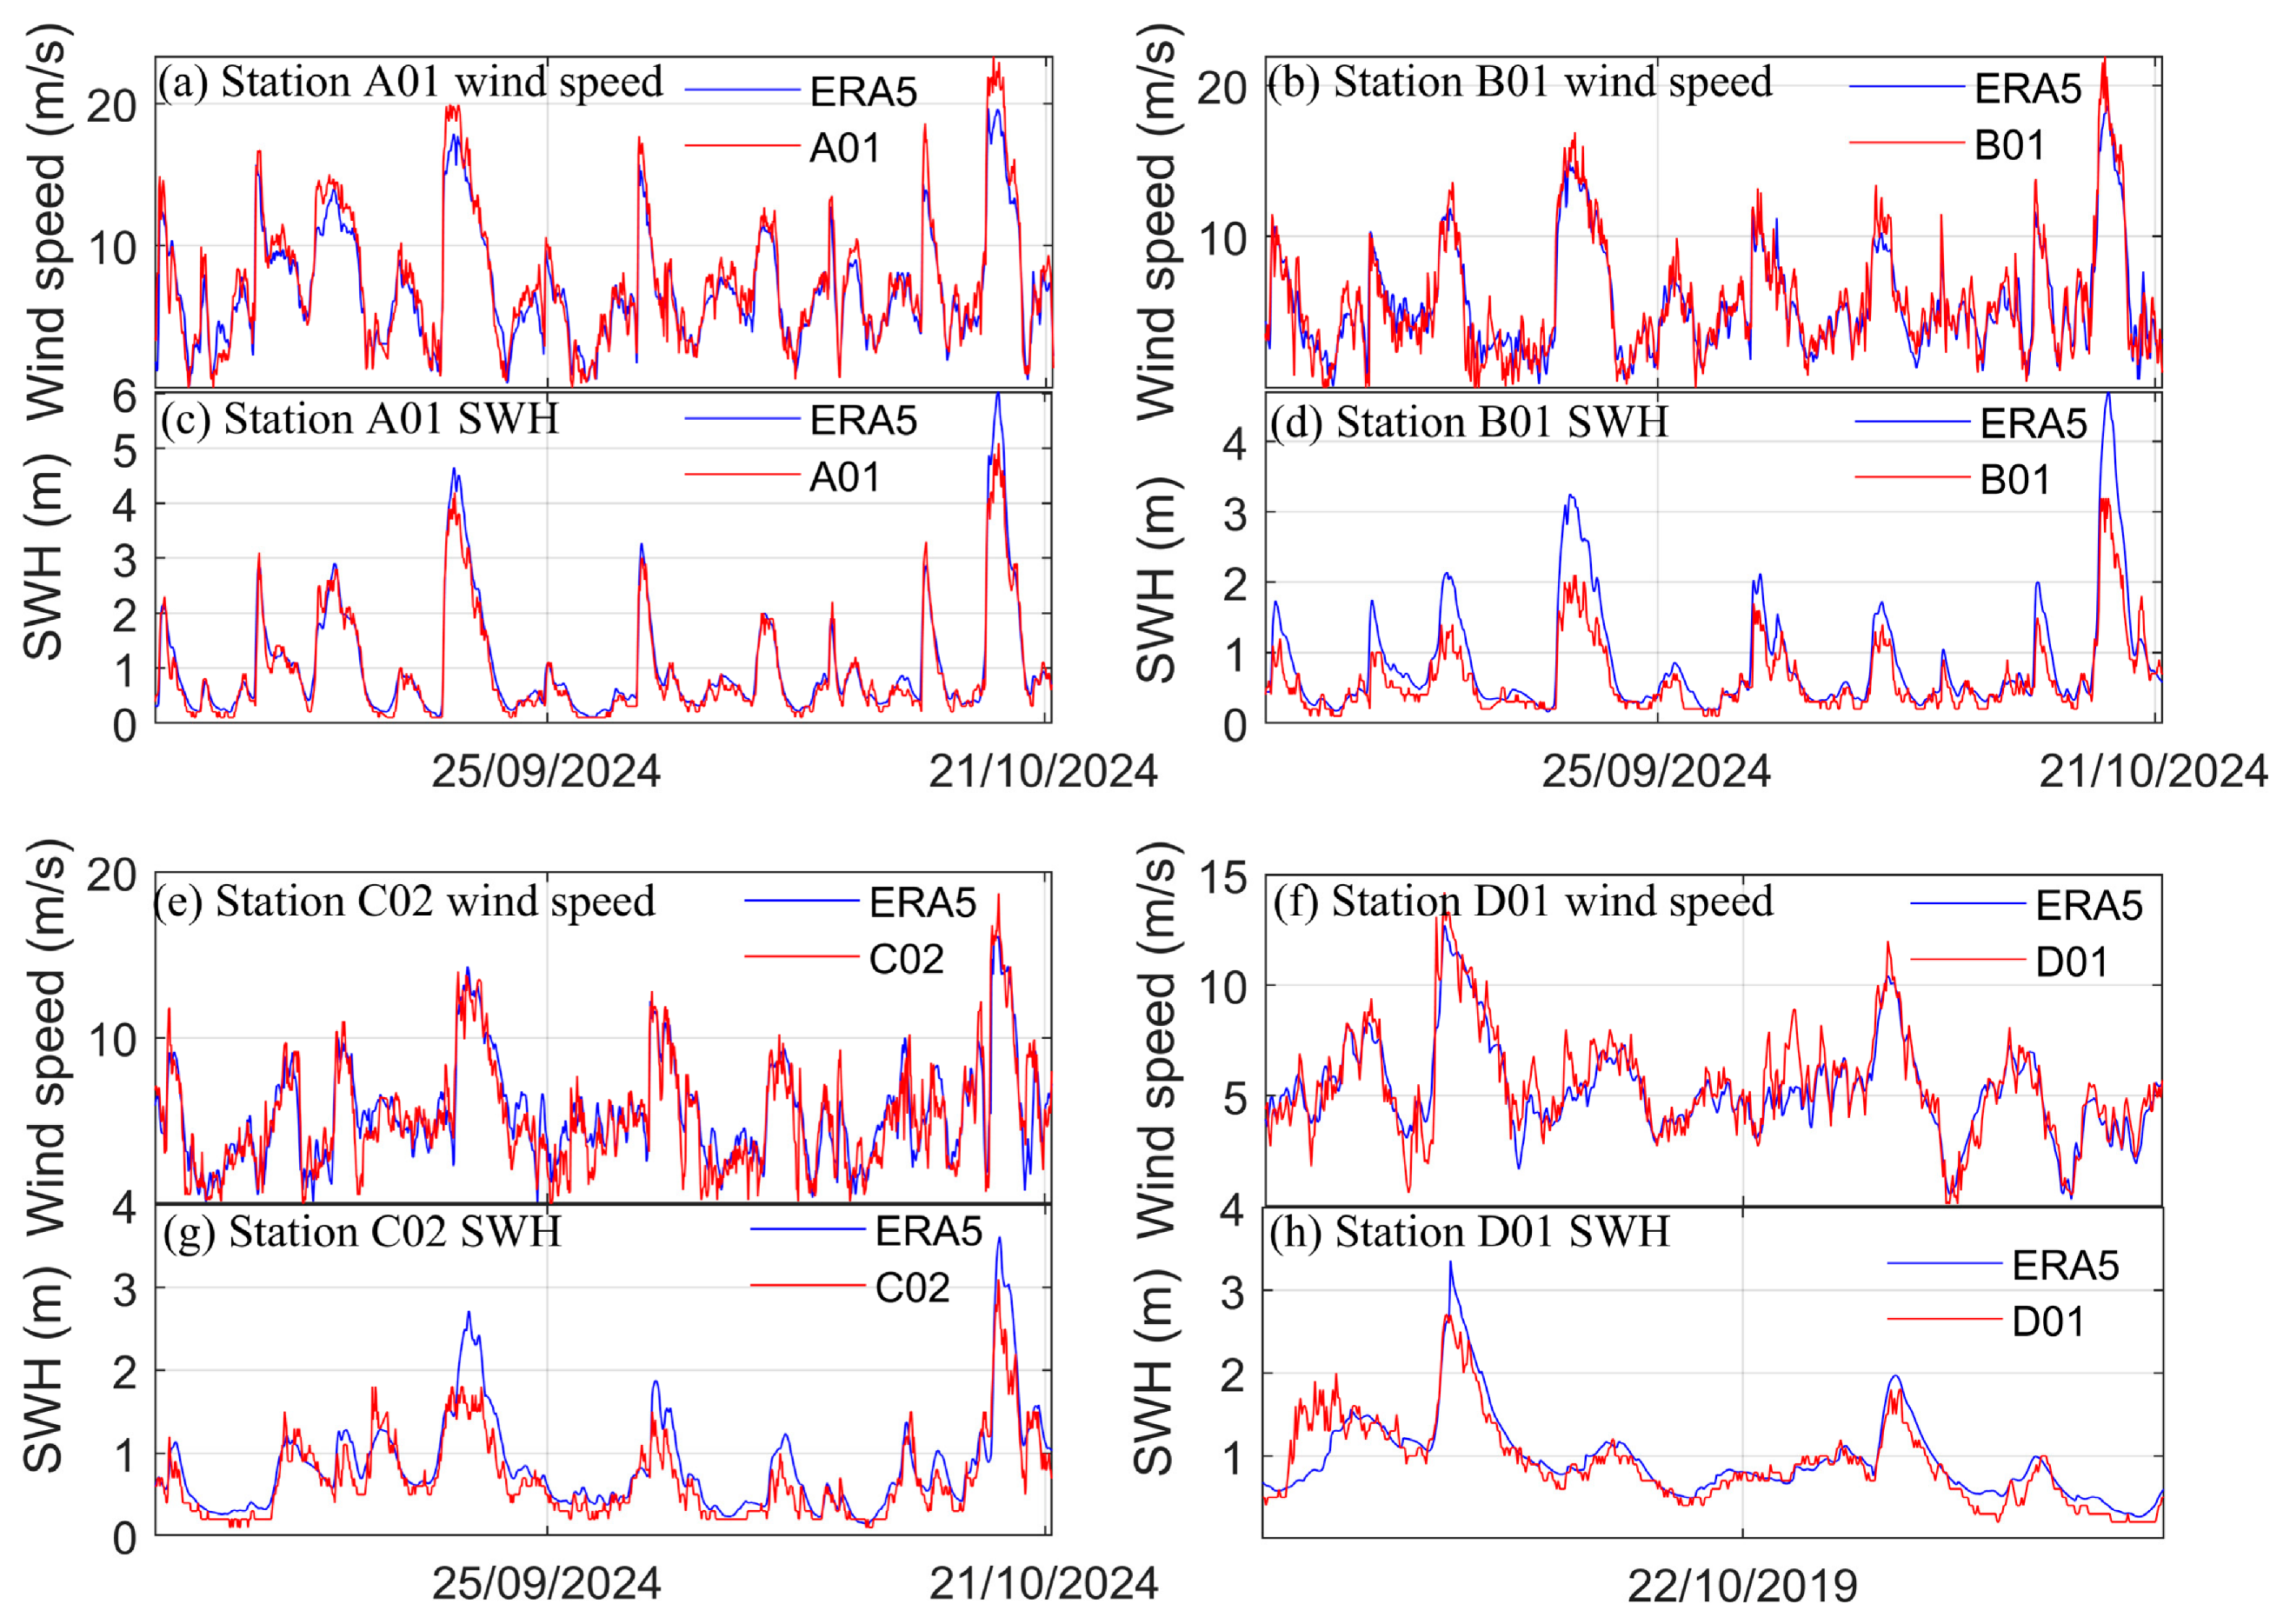
Figure A4.
Diurnal variations in ERA5 wind speed Bias and RMSE against buoy observations over the Bohai and Yellow Seas. The horizontal axis represents local time (BT; unit: h). The left vertical axis denotes Bias (m/s), and the right vertical axis denotes RMSE (m/s). Solid lines represent the overall mean values for the 16-station dataset, while dashed lines represent the 8-station subset (2024–2025). Black lines denote Bias, and red lines denote RMSE.
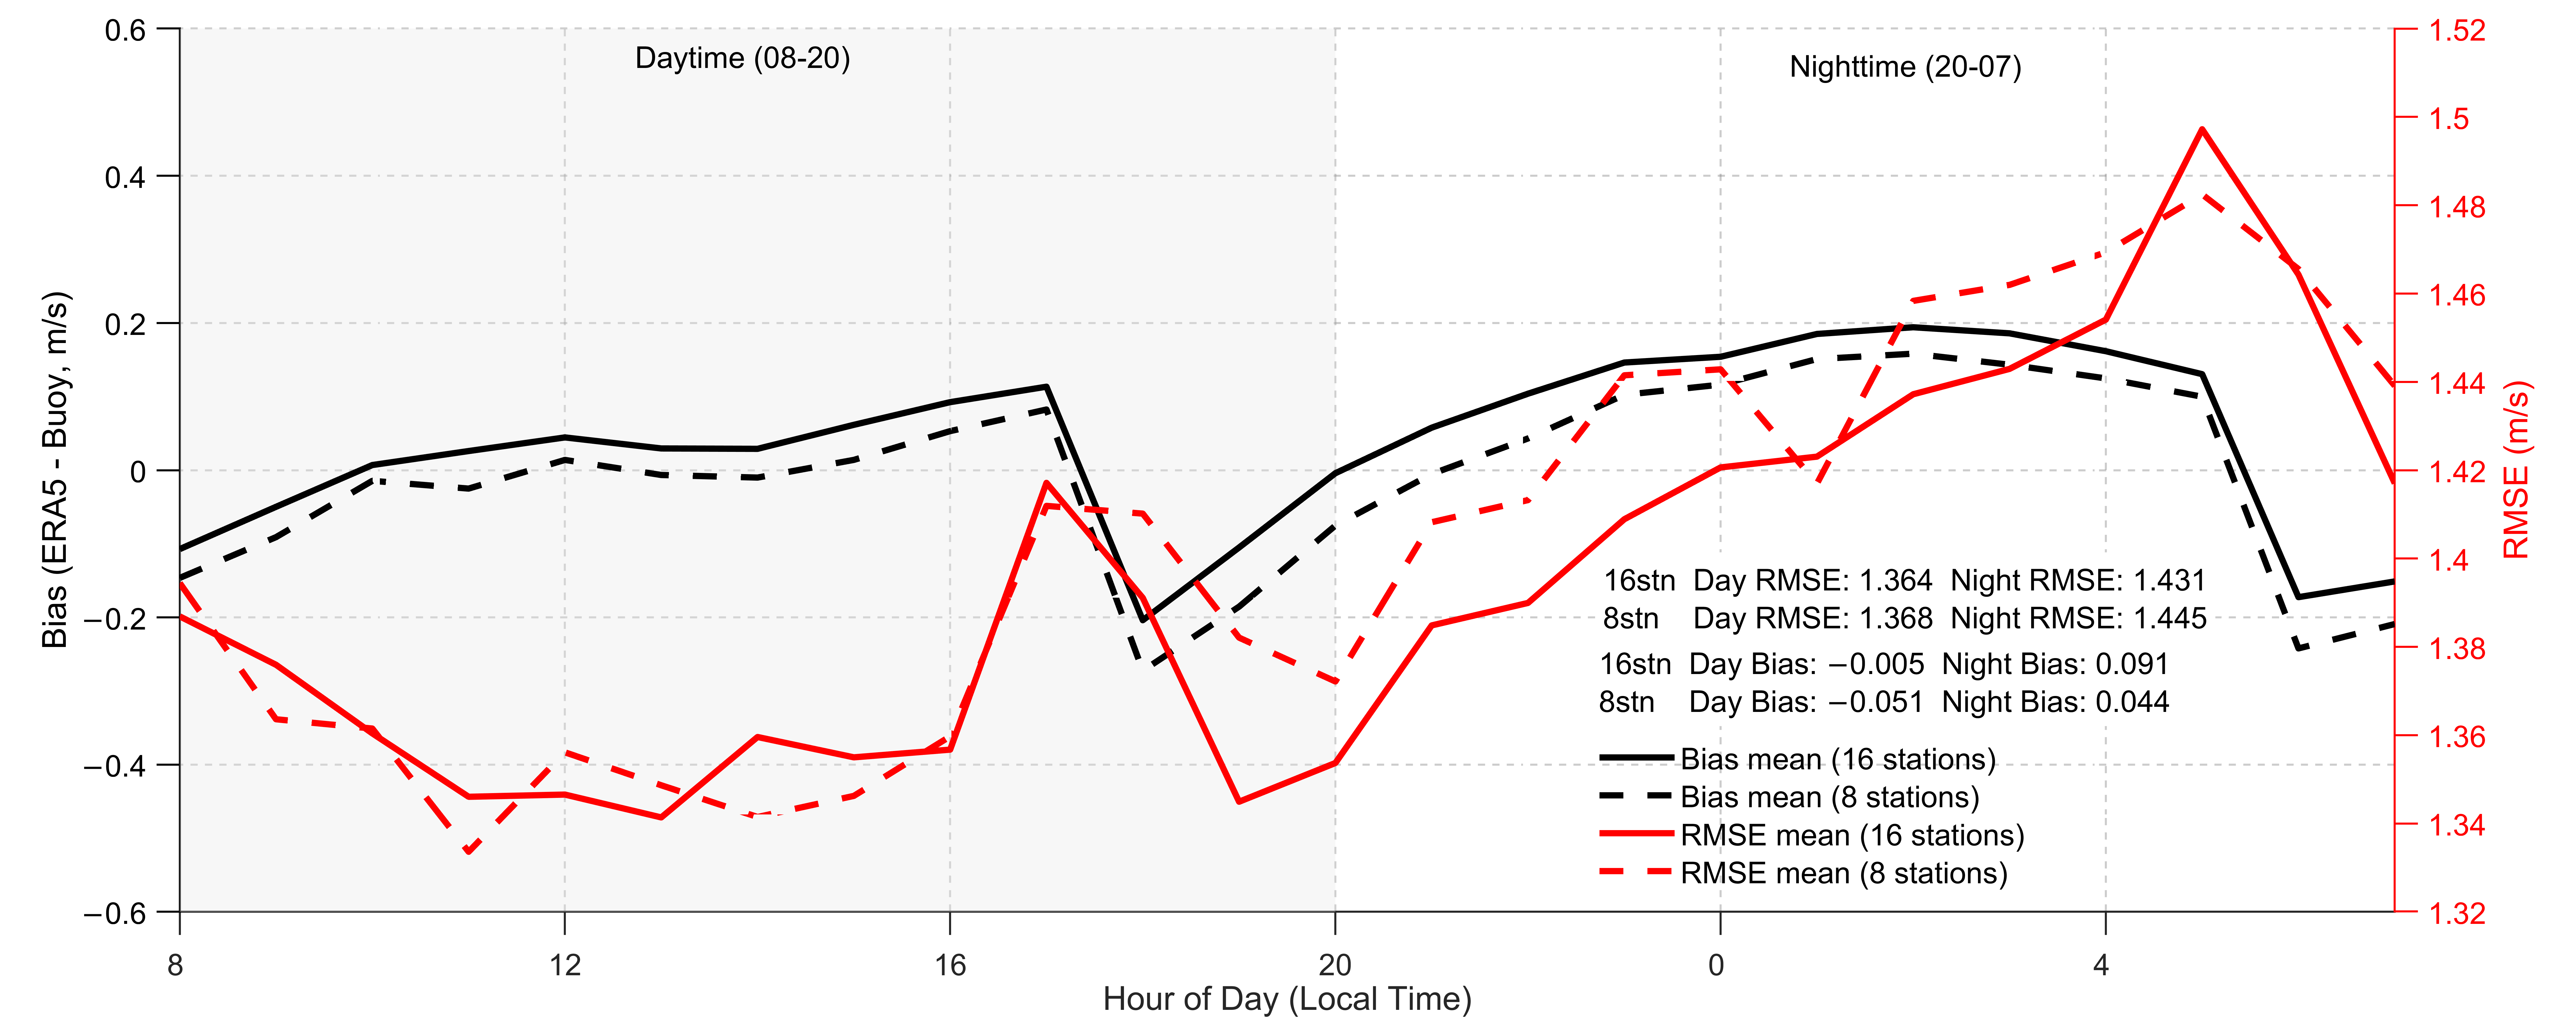
Figure A5.
Seasonal variations of (a) Bias, (b) RMSE, (c) SI, and (d) r, and (e) MAE for ERA5 10-m wind speed against buoy observations over the Bohai and Yellow Seas. The horizontal axis denotes month (March–February), and the vertical axes denote the corresponding error metrics. Solid lines represent the full 16-station dataset, whereas dashed lines represent the 8-station subset. Colors indicate the four subregions: A (Bohai Sea), B (northern Yellow Sea), C (central Yellow Sea), and D (southern Yellow Sea). Note that Region D is not available in the 8-station subset.
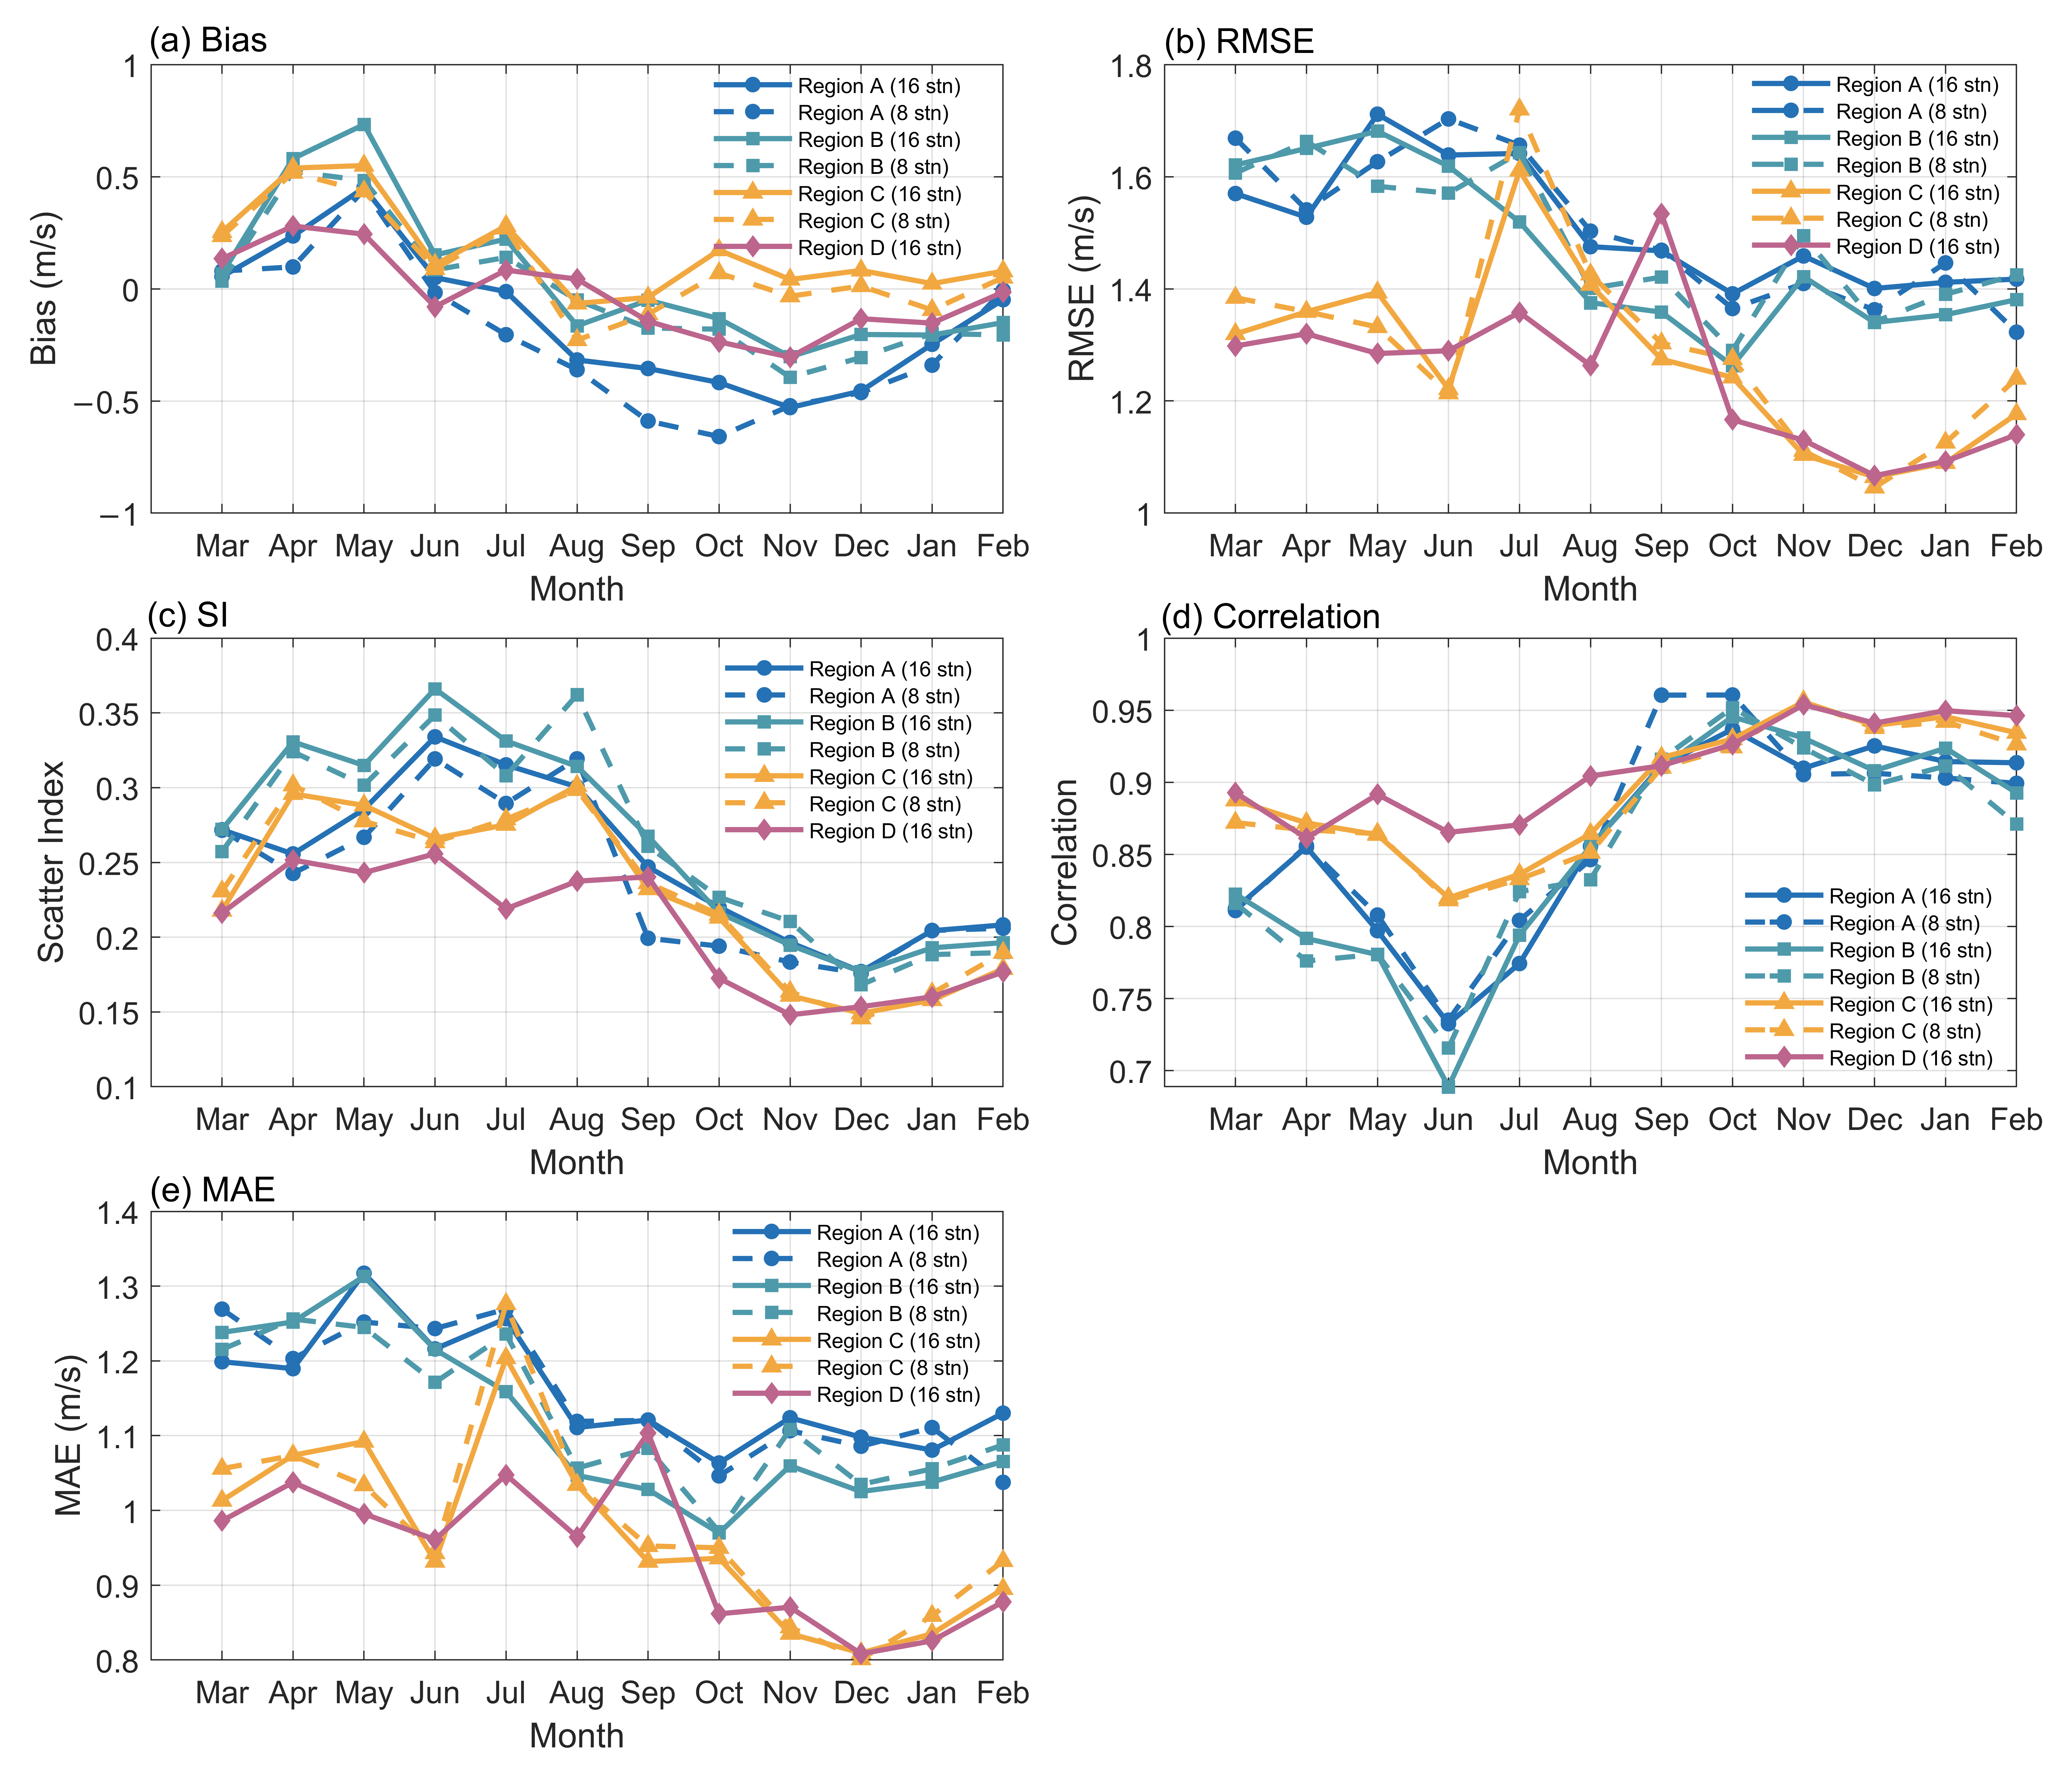
Figure A6.
As in Figure A5, but for the statistical metrics of ERA5 SWH versus buoy observations.
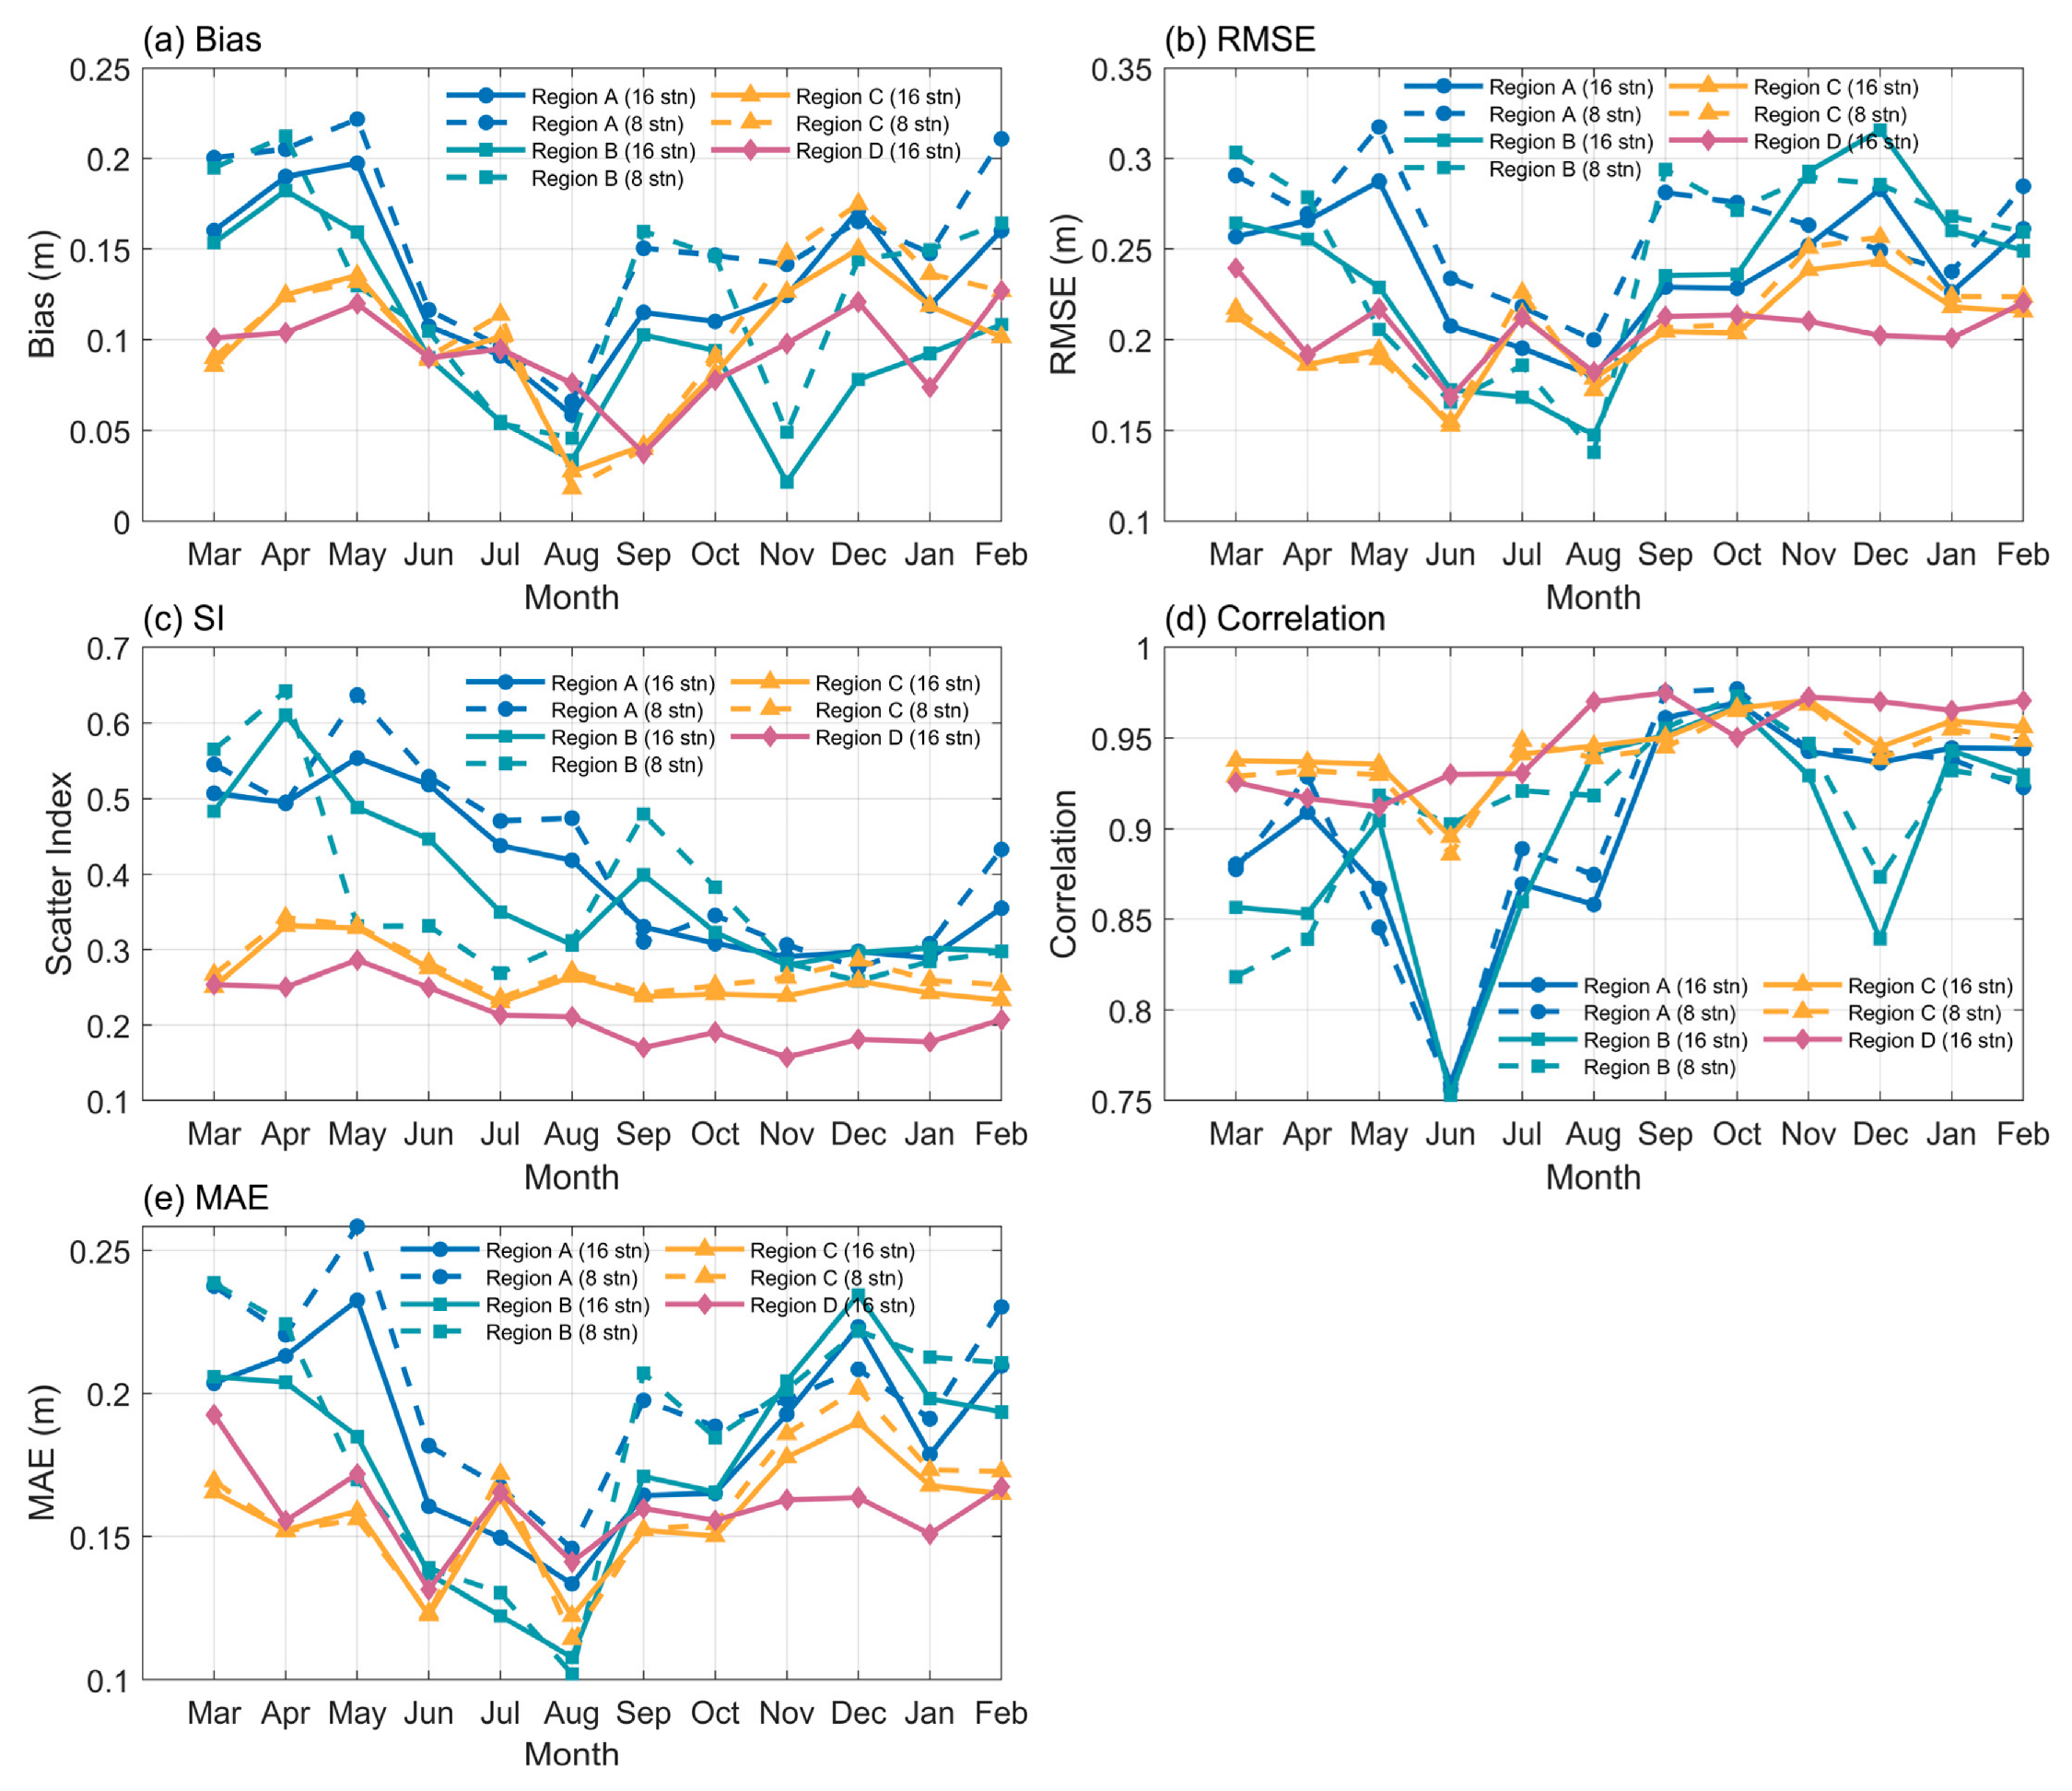
Figure A7.
Boxplots of ERA5 wind speed error metrics as a function of observed wind speed bins over the Bohai and Yellow Seas. Panels (a–d) present Bias, RMSE, SI, and r, respectively. For each wind speed bin, two boxplots are shown side by side: blue boxes correspond to the full 16-station dataset, and orange boxes correspond to the 8-station subset. In each boxplot, the box represents the interquartile range (IQR), the horizontal line inside the box denotes the median, and the whiskers extend to the 5th and 95th percentiles. The horizontal axes indicate wind speed bins (m/s), and the vertical axes indicate the corresponding error metrics.
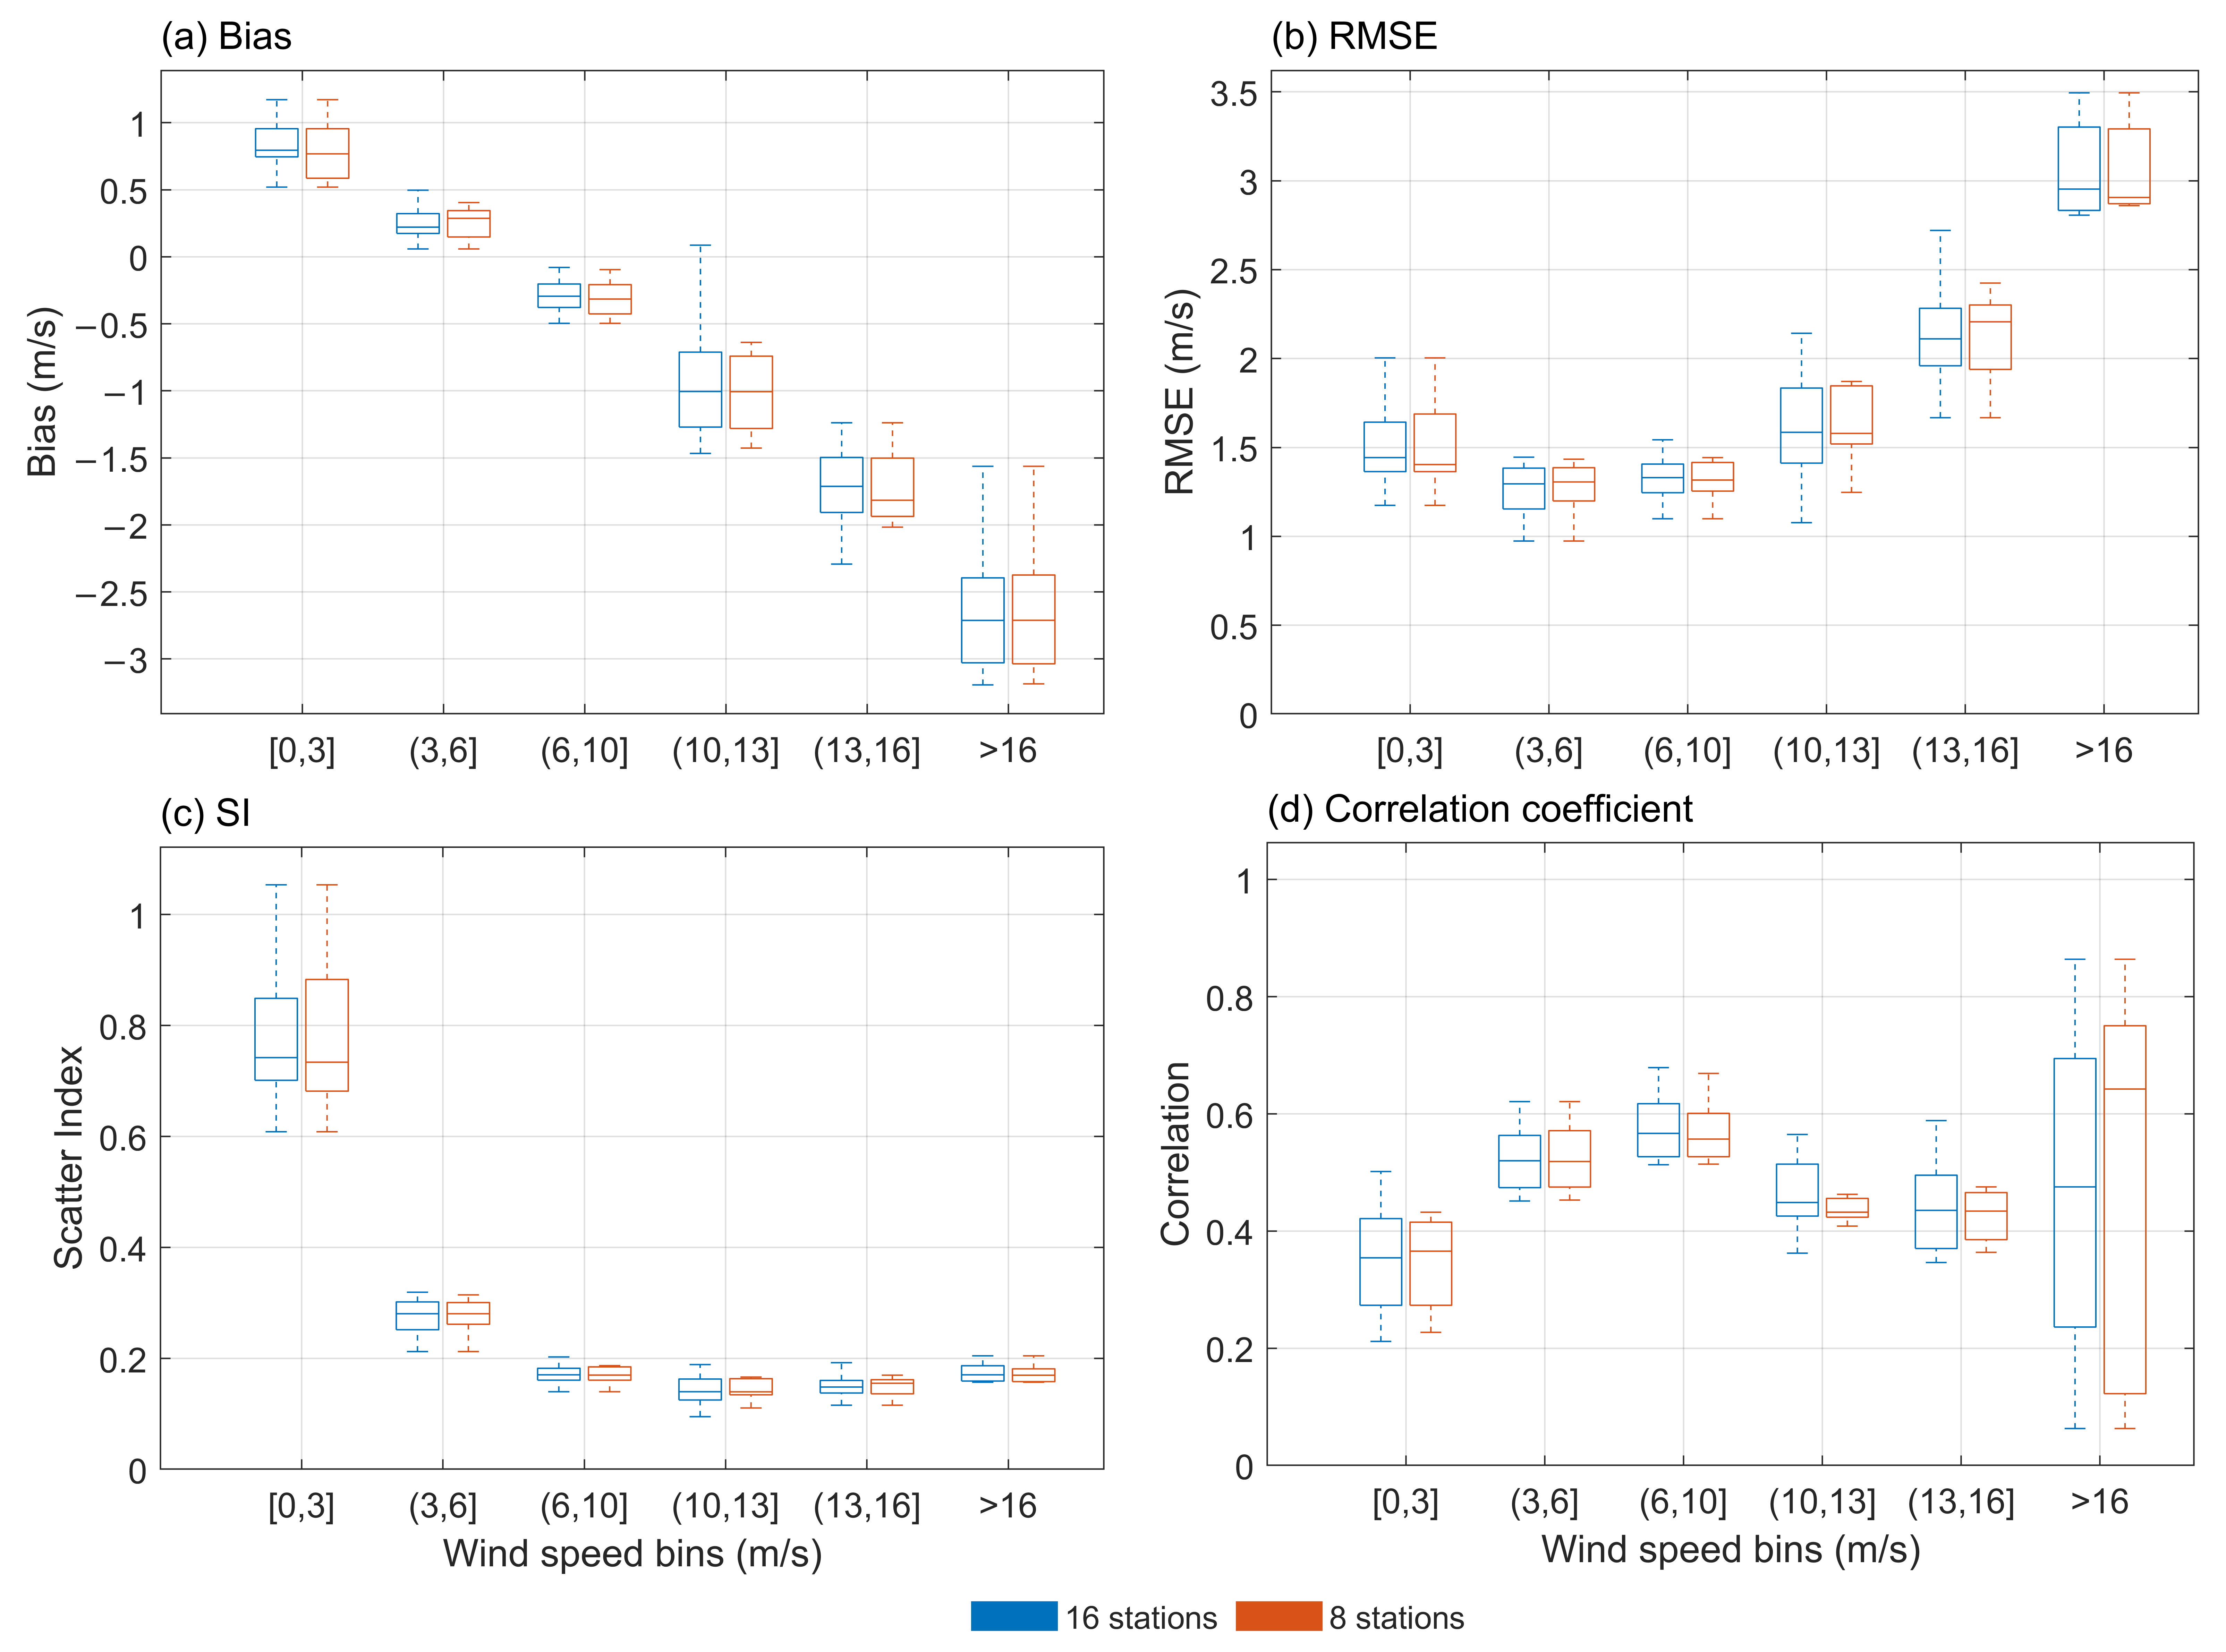
Figure A8.
As in Figure A7, but for SWH statistical metrics across SWH magnitude bins (m).
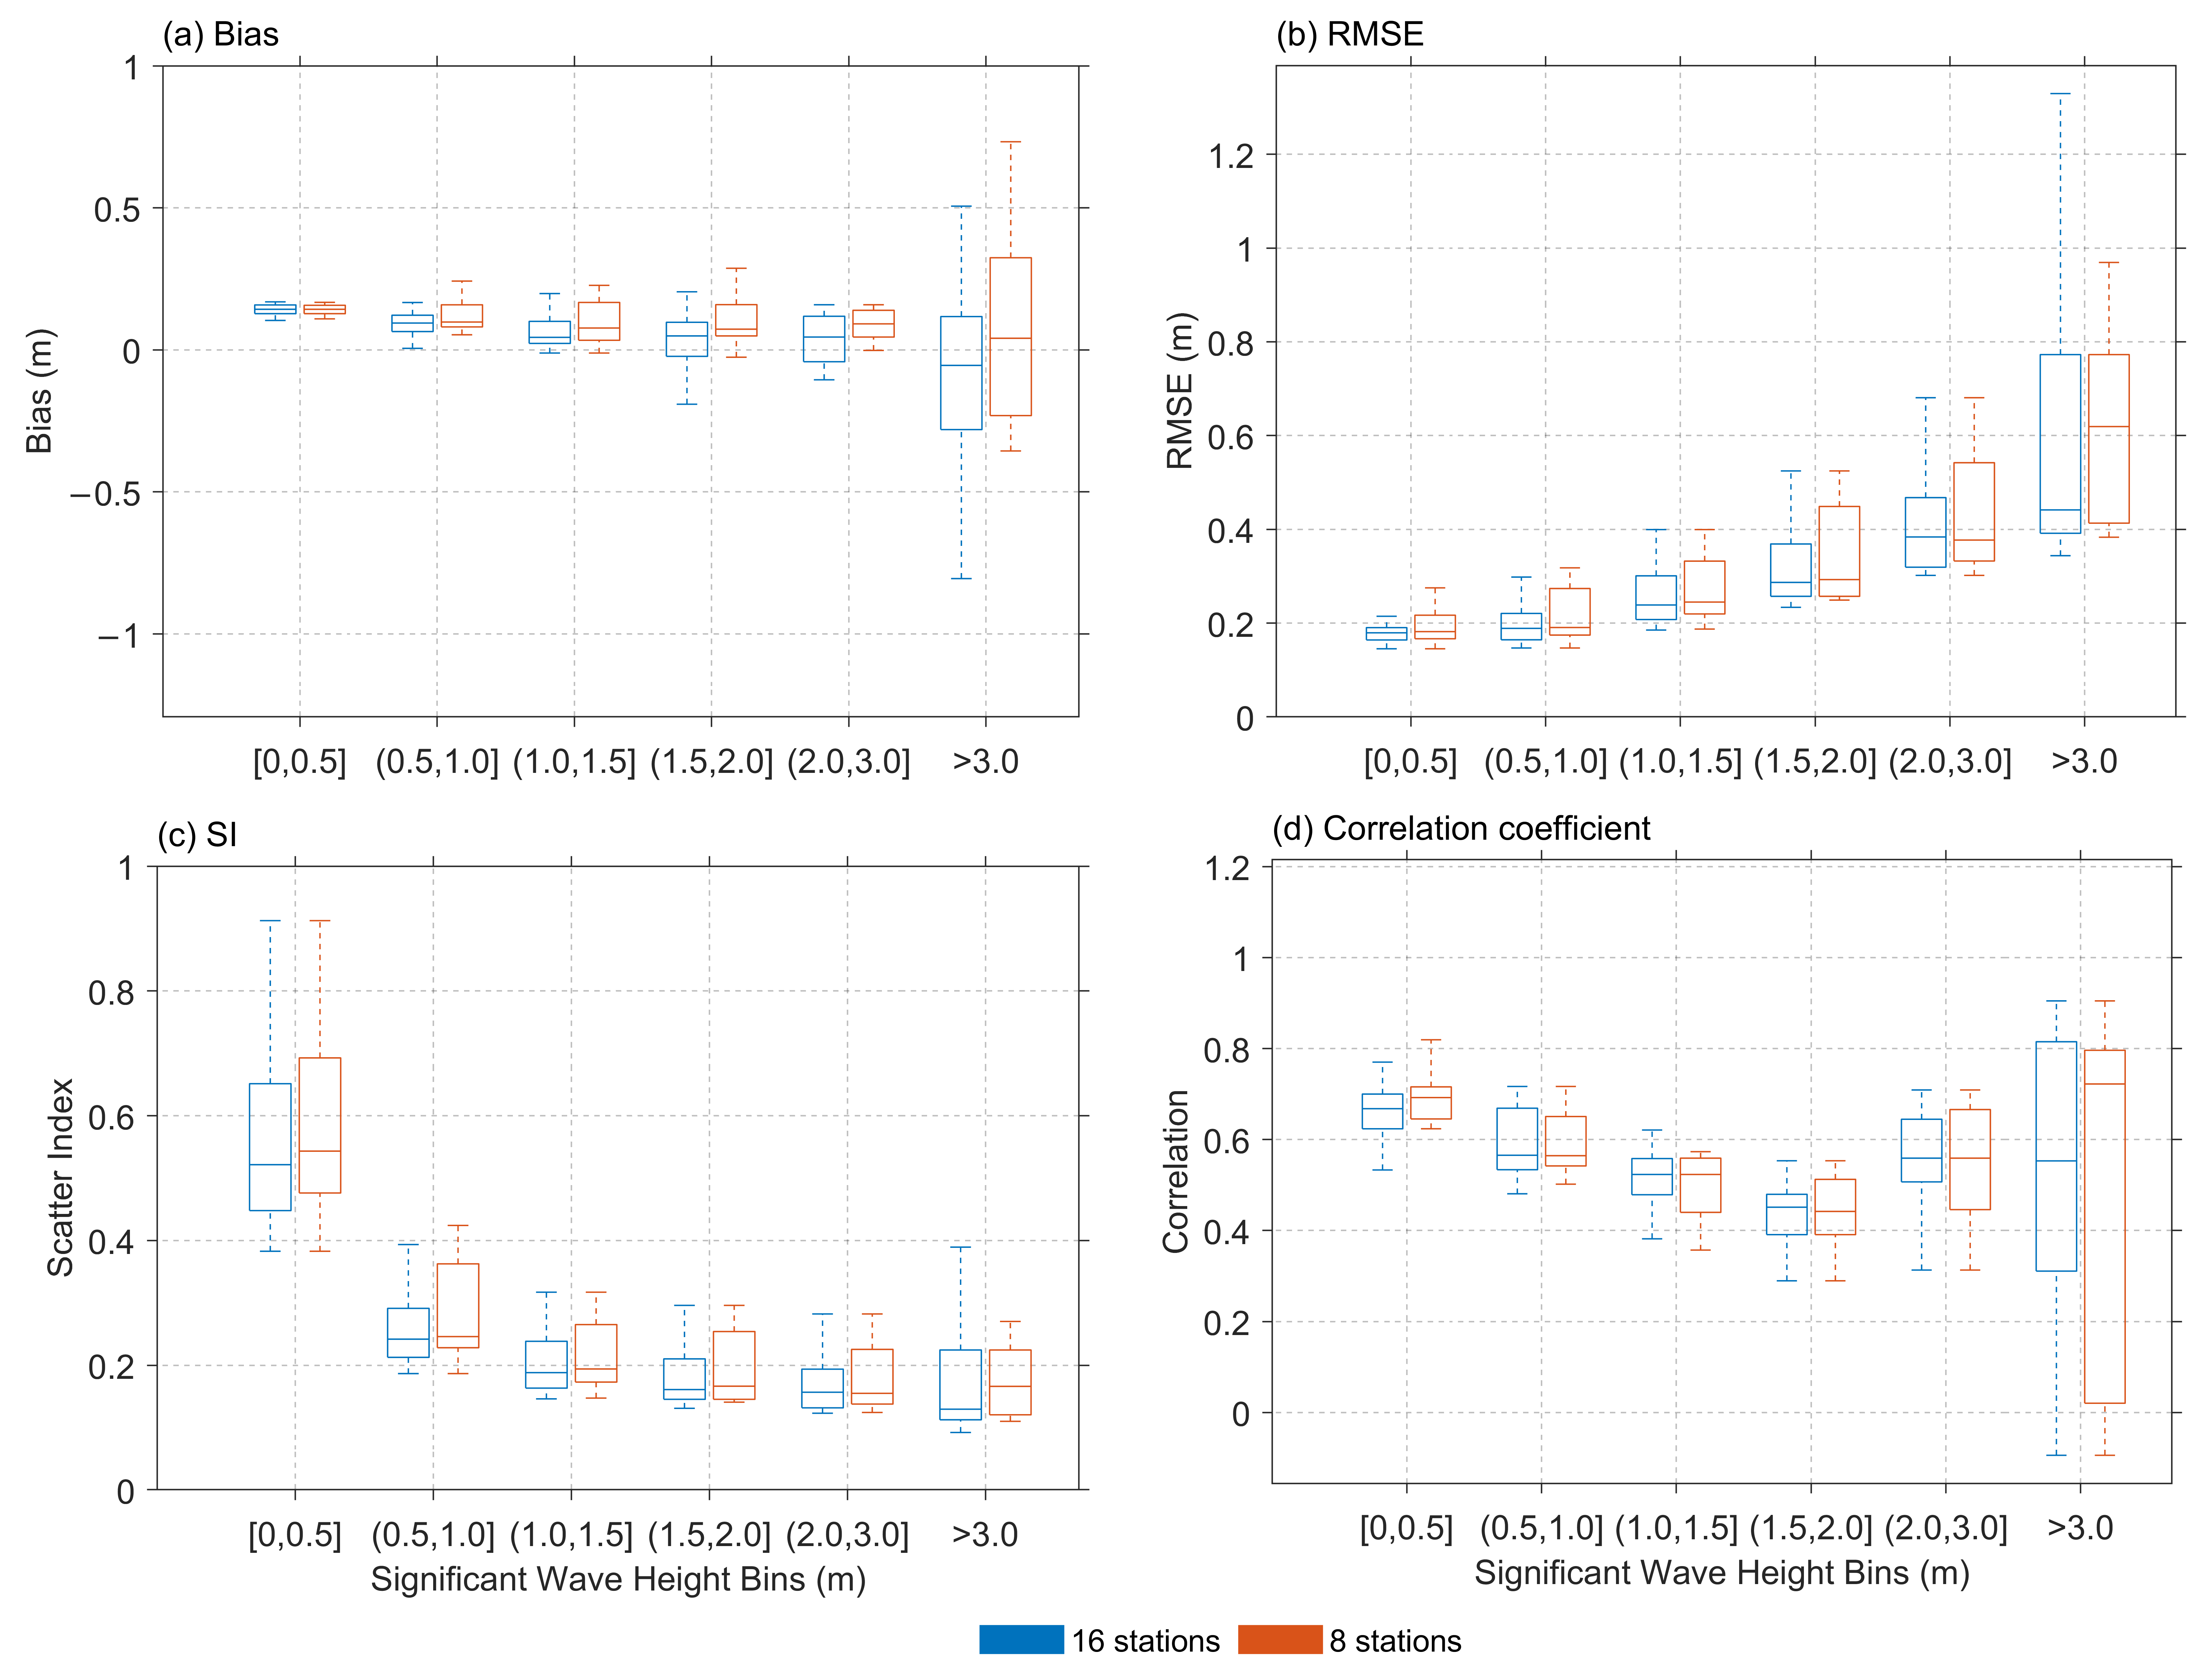
References
- Caires, S.; Sterl, A. 100-year return value estimates for ocean wind speed and significant wave height from the ERA-40 data. J. Clim. 2005, 18, 1032–1048. [Google Scholar] [CrossRef] [Scilit]
- Zheng, C.W. Global oceanic wave energy resource dataset—With the Maritime Silk Road as a case study. Renew. Energy 2021, 169, 843–854. [Google Scholar] [CrossRef] [Scilit]
- Cavaleri, L.; Abdalla, S.; Benetazzo, A.; Bertotti, L.; Bidlot, J.-R.; Breivik, Ø.; Carniel, S.; Jensen, R.E.; Portilla-Yandun, J.; Rogers, W.E.; et al. Wave modelling in coastal and inner seas. Prog. Oceanogr. 2018, 167, 164–233. [Google Scholar] [CrossRef] [Scilit]
- Hersbach, H.; Bell, B.; Berrisford, P.; Hirahara, S.; Horányi, A.; Muñoz-Sabater, J.; Nicolas, J.; Peubey, C.; Radu, R.; Schepers, D.; et al. The ERA5 global reanalysis. Q. J. R. Meteorol. Soc. 2020, 146, 1999–2049. [Google Scholar] [CrossRef] [Scilit]
- Timmermans, B.W.; Gommenginger, C.P.; Dodet, G.; Bidlot, J.R. Global wave height trends and variability from new multi-mission satellite altimeter products, reanalyses and wave buoys. Geophys. Res. Lett. 2020, 47, e2019GL086880. [Google Scholar] [CrossRef] [Scilit]
- Rusu, L.; Rusu, E. Evaluation of the worldwide wave energy distribution based on ERA5 data and altimeter measurements. Energies 2021, 14, 394. [Google Scholar] [CrossRef] [Scilit]
- Kumar, P.; Kaur, S.; Weller, E.; Young, I.R. Influence of natural climate variability on extreme wave power over Indo-Pacific Ocean assessed using ERA5. Clim. Dyn. 2022, 58, 1613–1633. [Google Scholar] [CrossRef] [Scilit]
- Chen, C.-T.A. Chemical and physical fronts in the Bohai, Yellow and East China seas. J. Mar. Syst. 2009, 78, 394–410. [Google Scholar] [CrossRef] [Scilit]
- Li, J.; Chen, Y.; Pan, S.; Pan, Y.; Fang, J.; Sowa, D.M.A. Estimation of mean and extreme waves in the East China Seas. Appl. Ocean Res. 2016, 56, 35–47. [Google Scholar] [CrossRef] [Scilit]
- Zhang, X.; Shi, L.; Liang, B.; Wu, G.; Wang, Z.; Lin, Q.; Wu, Y. High winds associated with cold surges and their relevance to climate patterns in the Yellow and Bohai Seas. Clim. Dyn. 2024, 62, 7399–7416. [Google Scholar] [CrossRef] [Scilit]
- Zhou, C.; Xu, C.; Zhang, J.; Fu, X.; Yin, Y. Coastal hazards caused by different extreme storms in the Bohai Sea, China. J. Coast. Res. 2018, 85, 816–820. [Google Scholar] [CrossRef] [Scilit]
- Yang, M.Y.; Shao, H.; Zhao, X.; Cheng, G.; Dai, S.; Wang, L.; Mao, X.Z. Spatiotemporal distribution, evolution, and complementarity of wind and waves in China’s offshore waters and its implications for the development of green energy. Energy Convers. Manag. 2024, 312, 118567. [Google Scholar] [CrossRef] [Scilit]
- Wang, F.; Zhang, J.; Guo, Y.; Ji, Y.; Liu, S. Numerical study on the effects of combined wave, current, and wind on the tide and wave hydrodynamic field in the Yellow-Bohai Sea area, China. Appl. Ocean Res. 2025, 165, 104794. [Google Scholar] [CrossRef] [Scilit]
- Wang, J.; Wang, Y. Evaluation of the ERA5 significant wave height against NDBC buoy data from 1979 to 2019. Mar. Geod. 2022, 45, 151–165. [Google Scholar] [CrossRef] [Scilit]
- Gualtieri, G. Reliability of ERA5 reanalysis data for wind resource assessment: A comparison against tall towers. Energies 2021, 14, 4169. [Google Scholar] [CrossRef] [Scilit]
- Bessonova, V.; Tapoglou, E.; Dorrell, R.; Dethlefs, N.; York, K. Global evaluation of wave data reanalysis: Comparison of the ERA5 dataset to buoy observations. Appl. Ocean Res. 2025, 157, 104490. [Google Scholar] [CrossRef] [Scilit]
- Liu, J.; Li, B.; Chen, W.; Li, J.; Yan, J. Evaluation of ERA5 wave parameters with in situ data in the South China Sea. Atmosphere 2022, 13, 935. [Google Scholar] [CrossRef] [Scilit]
- Shi, H.; Cao, X.; Li, Q.; Li, D.; Sun, J.; You, Z.; Sun, Q. Evaluating the accuracy of ERA5 wave reanalysis in the water around China. J. Ocean Univ. China 2021, 20, 1–9. [Google Scholar] [CrossRef] [Scilit]
- Geng, S.S.; Han, C.H.; Xu, S.S.; Yang, J.K.; Shi, X.X.; Liang, J.F.; Wu, S.Q. Applicability analysis of ERA5 sea surface pressure and wind speed reanalysis data in the Bohai Sea and northern Yellow Sea. Mar. Sci. Bull. 2023, 42, 159–168. (In Chinese) [Google Scholar]
- Li, J.X.; Zhu, Y.; Xu, J.; Yao, Y. A comparative study on the applicability of ERA-Interim and ERA5 reanalysis wind data in the coastal waters of China. Mar. Sci. Bull. 2023, 42, 260–271. (In Chinese) [Google Scholar]
- Liu, A.; Lu, B.; Sun, J.; Ji, C.; Shang, J.; Qian, C. Evaluation of CFSv2, MERRA2, and ERA5 sea surface wind field reanalysis data in the Bohai and Yellow Seas. J. Ocean Univ. China 2026, 25, 480–488. [Google Scholar] [CrossRef] [Scilit]
- Samiksha, S.V.; Harikrishnan, R.; Sudheesh, K.; Kumar, V.S. Evaluation of ERA5 reanalysis wave spectra with observations during seasonal and extreme conditions along the west coast of India. Ocean Eng. 2026, 351, 124374. [Google Scholar] [CrossRef] [Scilit]
- Li, D.; Feng, J.; Zhu, Y.; Staneva, J.; Qi, J.; Behrens, A.; Lee, D.; Min, S.-K.; Yin, B. Dynamical projections of the mean and extreme wave climate in the Bohai Sea, Yellow Sea and East China Sea. Front. Mar. Sci. 2022, 9, 844113. [Google Scholar] [CrossRef] [Scilit]
- Costa, M.O.; Campos, R.M.; Soares, C.G. Enhancing the accuracy of metocean hindcasts with machine learning models. Ocean Eng. 2023, 287, 115724. [Google Scholar] [CrossRef] [Scilit]
- Wang, T.; Yang, Z.; Wu, W.-C.; Grear, M. A sensitivity analysis of the wind forcing effect on the accuracy of large-wave hindcasting. J. Mar. Sci. Eng. 2018, 6, 139. [Google Scholar] [CrossRef] [Scilit]
- Bidlot, J.R.; Holmes, D.J.; Wittmann, P.A.; Lalbeharry, R.; Chen, H.S. Intercomparison of the performance of operational ocean wave forecasting systems with buoy data. Weather Forecast. 2002, 17, 287–310. [Google Scholar] [CrossRef] [Scilit]
- Liao, Y.P.; Kaihatu, J.M. Numerical investigation of wind waves in the Persian Gulf: Bathymetry effects. J. Atmos. Ocean. Technol. 2016, 33, 17–31. [Google Scholar] [CrossRef] [Scilit]
- Rubio, H.; Hatfield, D.; Hasager, C.B.; Kühn, M.; Gottschall, J. Ship-based lidar measurements for validating ASCAT-derived and ERA5 offshore wind profiles. Atmos. Meas. Tech. 2025, 18, 4949–4968. [Google Scholar] [CrossRef] [Scilit]
- ECMWF. ERA5: Data Documentation. ECMWF Confluence. 2025. Available online: https://confluence.ecmwf.int/x/wv2NB (accessed on 24 July 2026).
- Wu, S.; Liu, J.; Zhang, G.; Han, B.; Wu, R.; Chen, D. Evaluation of NCEP-CFSv2, ERA5, and CCMP wind datasets against buoy observations over Zhejiang nearshore waters. Ocean Eng. 2022, 259, 111832. [Google Scholar] [CrossRef] [Scilit]
- Padilla-Hernández, R.; Monbaliu, J. Energy balance of wind waves as a function of the bottom friction formulation. Coast. Eng. 2001, 43, 131–148. [Google Scholar] [CrossRef] [Scilit]
- Wang, N.; Hou, Y.; Li, S.; Li, R. Numerical simulation and preliminary analysis of typhoon waves during three typhoons in the Yellow Sea and East China Sea. J. Oceanol. Limnol. 2019, 37, 1805–1816. [Google Scholar] [CrossRef] [Scilit]
- Ardhuin, F.; Rogers, E.; Babanin, A.V.; Filipot, J.-F.; Magne, R.; Roland, A.; Van Der Westhuysen, A.; Queffeulou, P.; Lefevre, J.-M.; Aouf, L.; et al. Semiempirical dissipation source functions for ocean waves. Part I: Definition, calibration, and validation. J. Phys. Oceanogr. 2010, 40, 1917–1941. [Google Scholar] [CrossRef] [Scilit]
- Ji, W.; Li, R.; Xue, W.; Cao, Z.; Yang, H.; Ning, Q.; Hu, X.; Liao, G. Evaluation of ERA5 wind parameter with in-situ data offshore China. PLoS ONE 2025, 20, e0317751. [Google Scholar] [CrossRef] [Scilit]
- Gandoin, R.; Garza, J. Underestimation of strong wind speeds offshore in ERA5: Evidence, discussion and correction. Wind Energy Sci. 2024, 9, 1727–1745. [Google Scholar] [CrossRef] [Scilit]
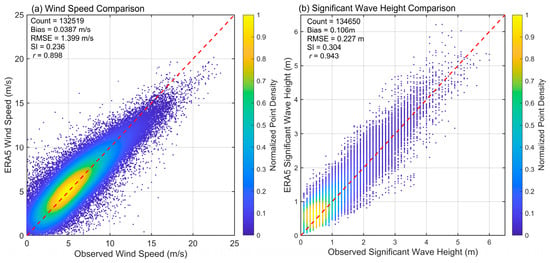
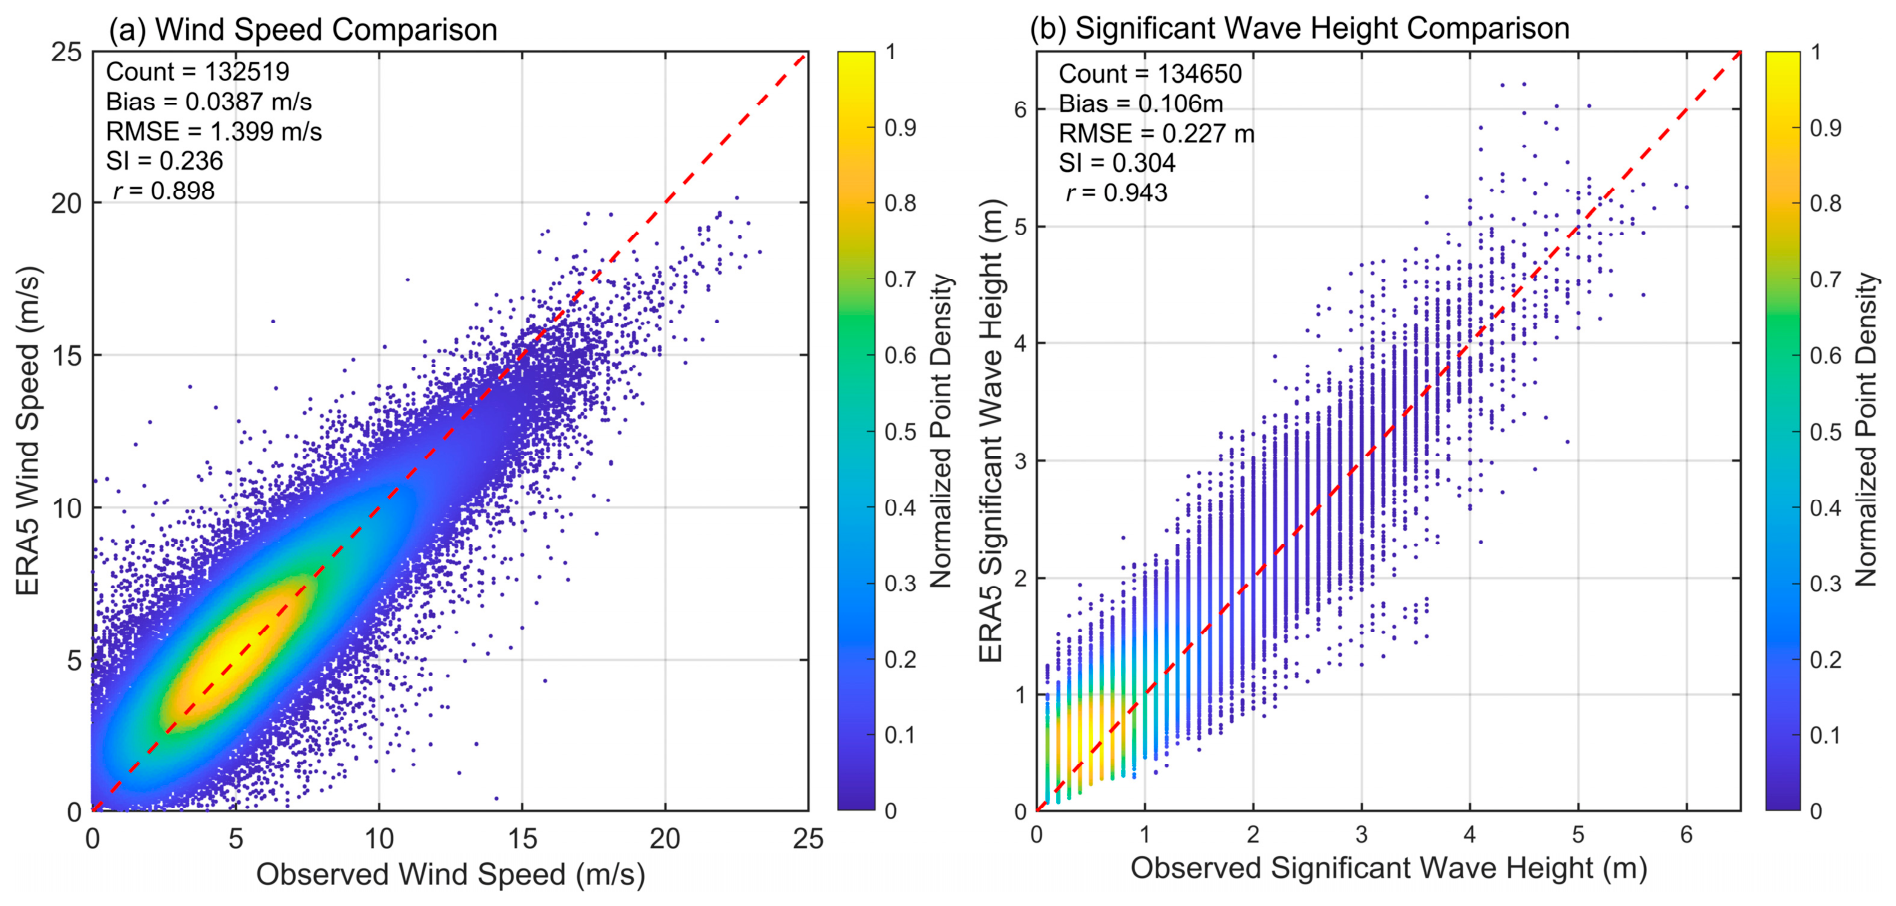
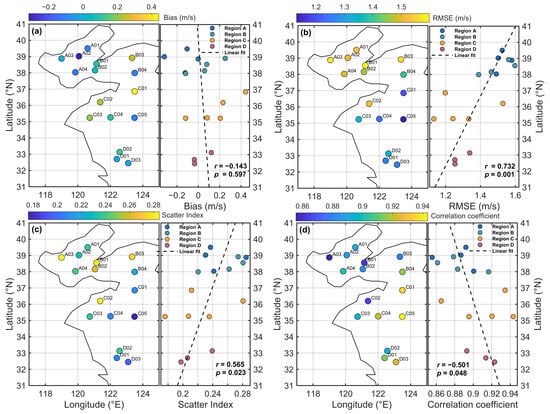
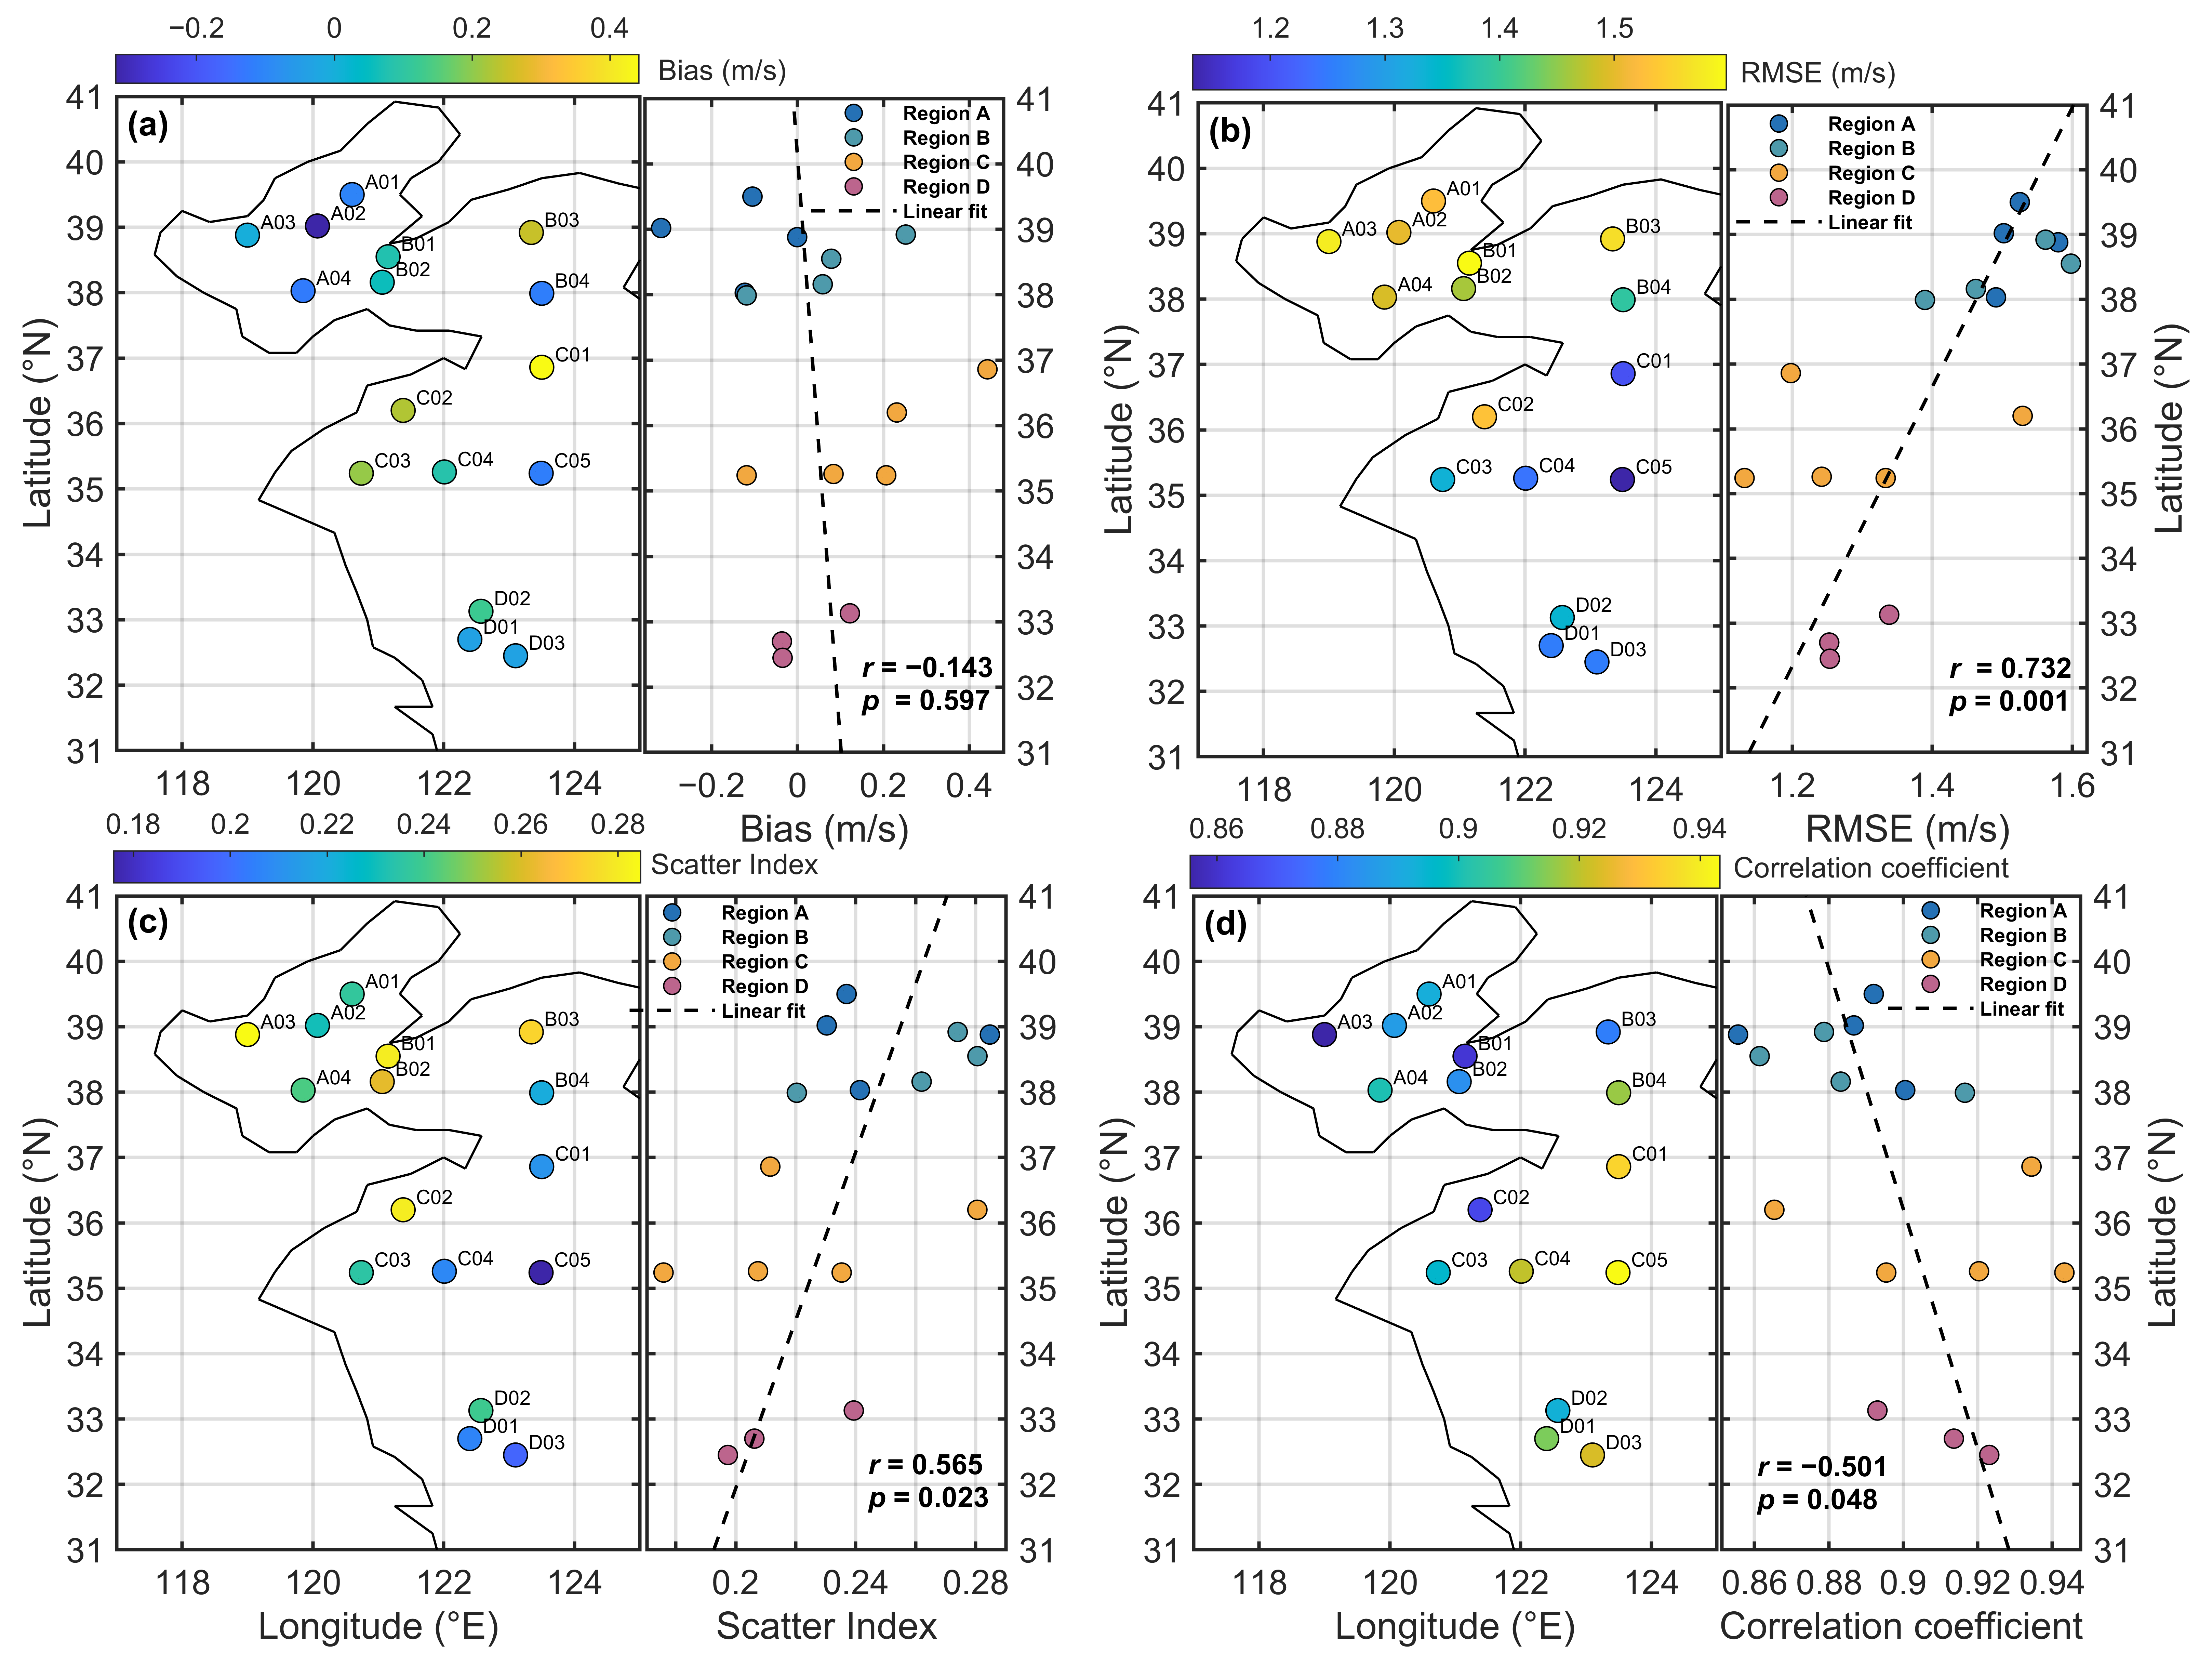
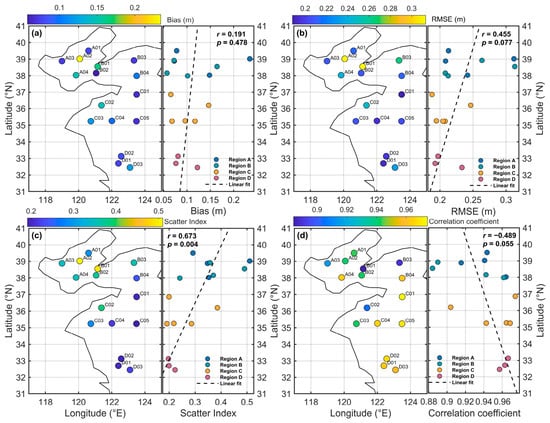
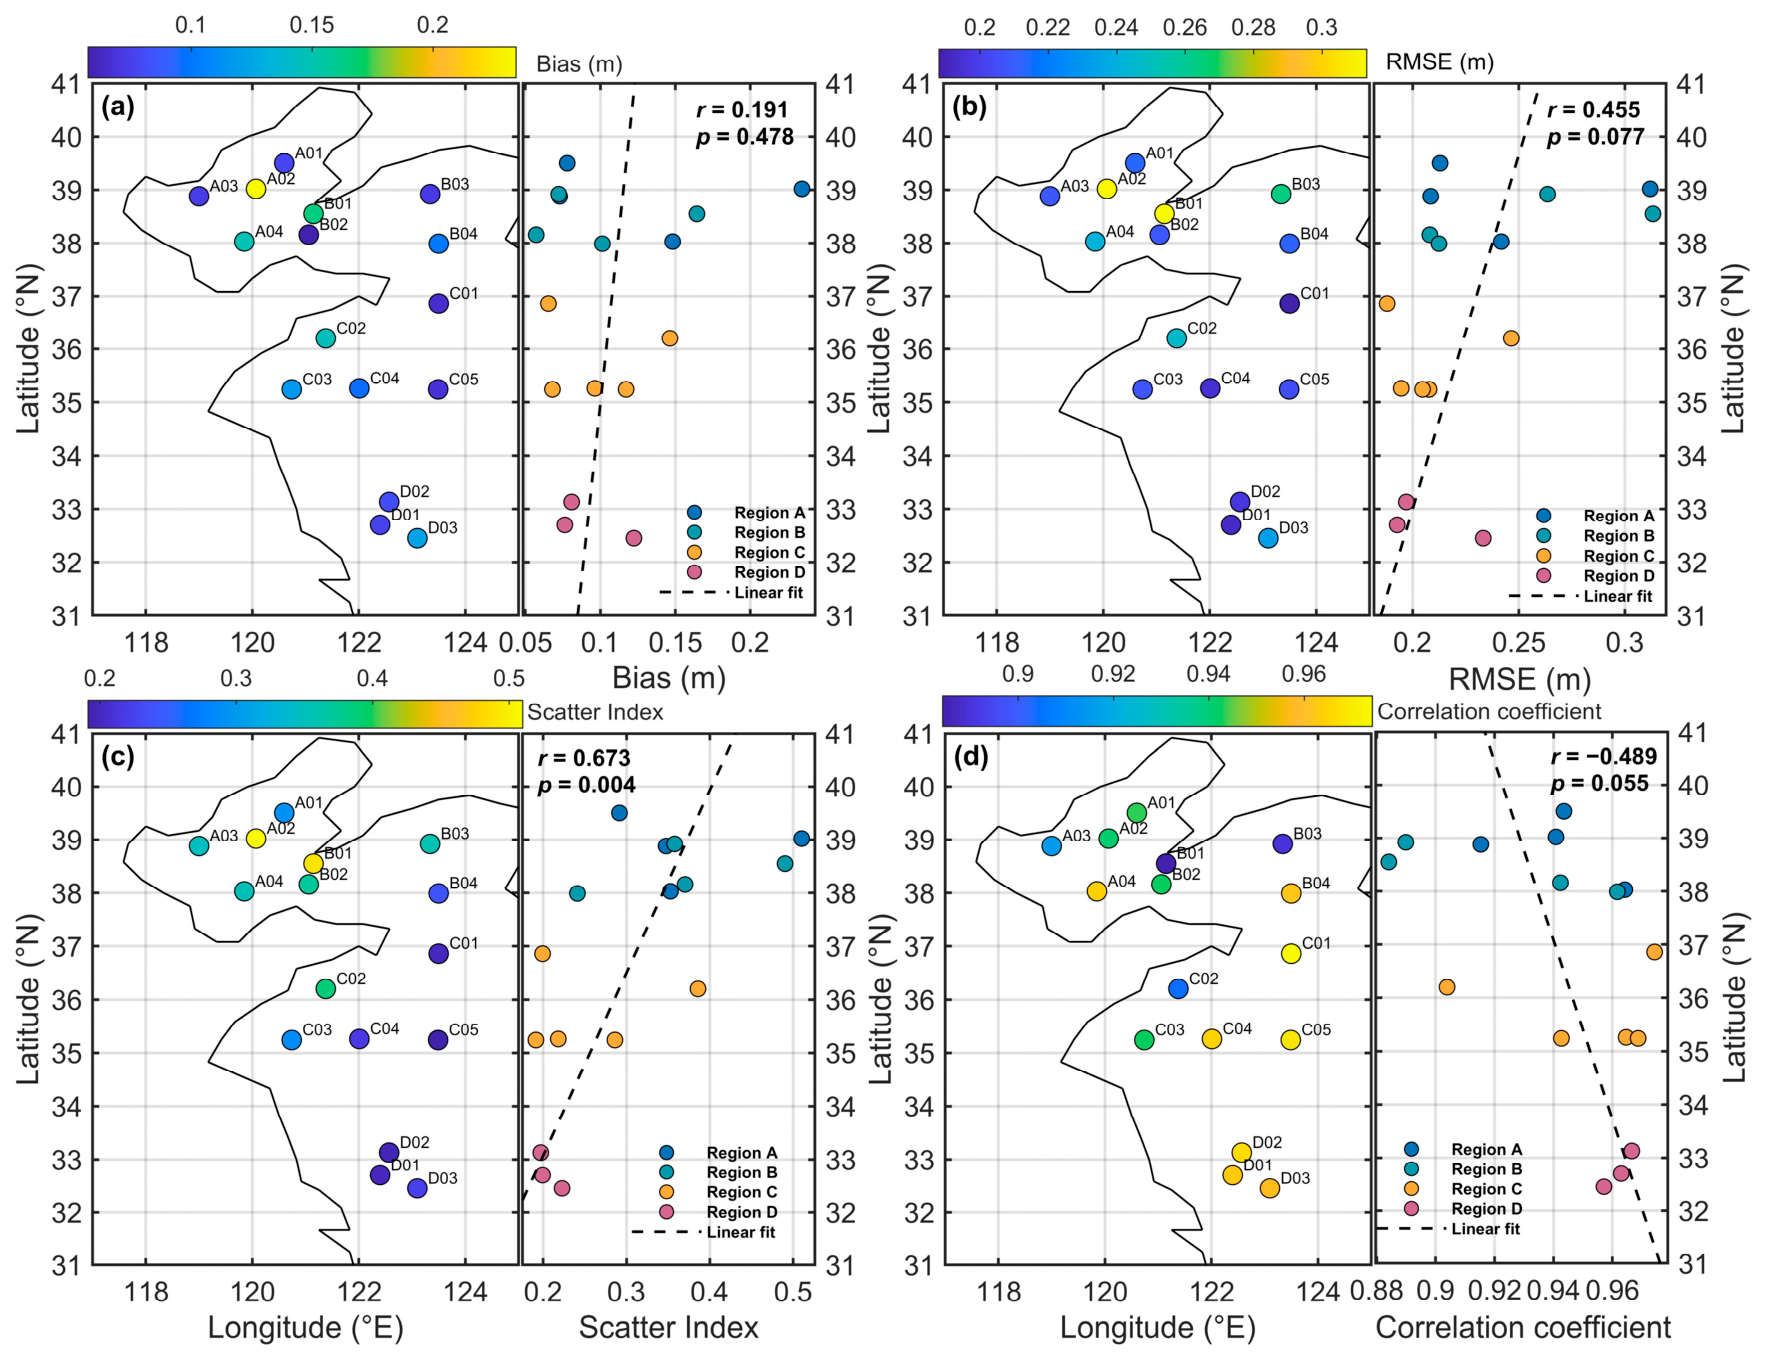
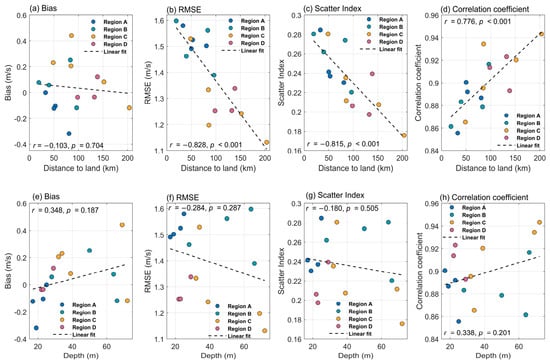
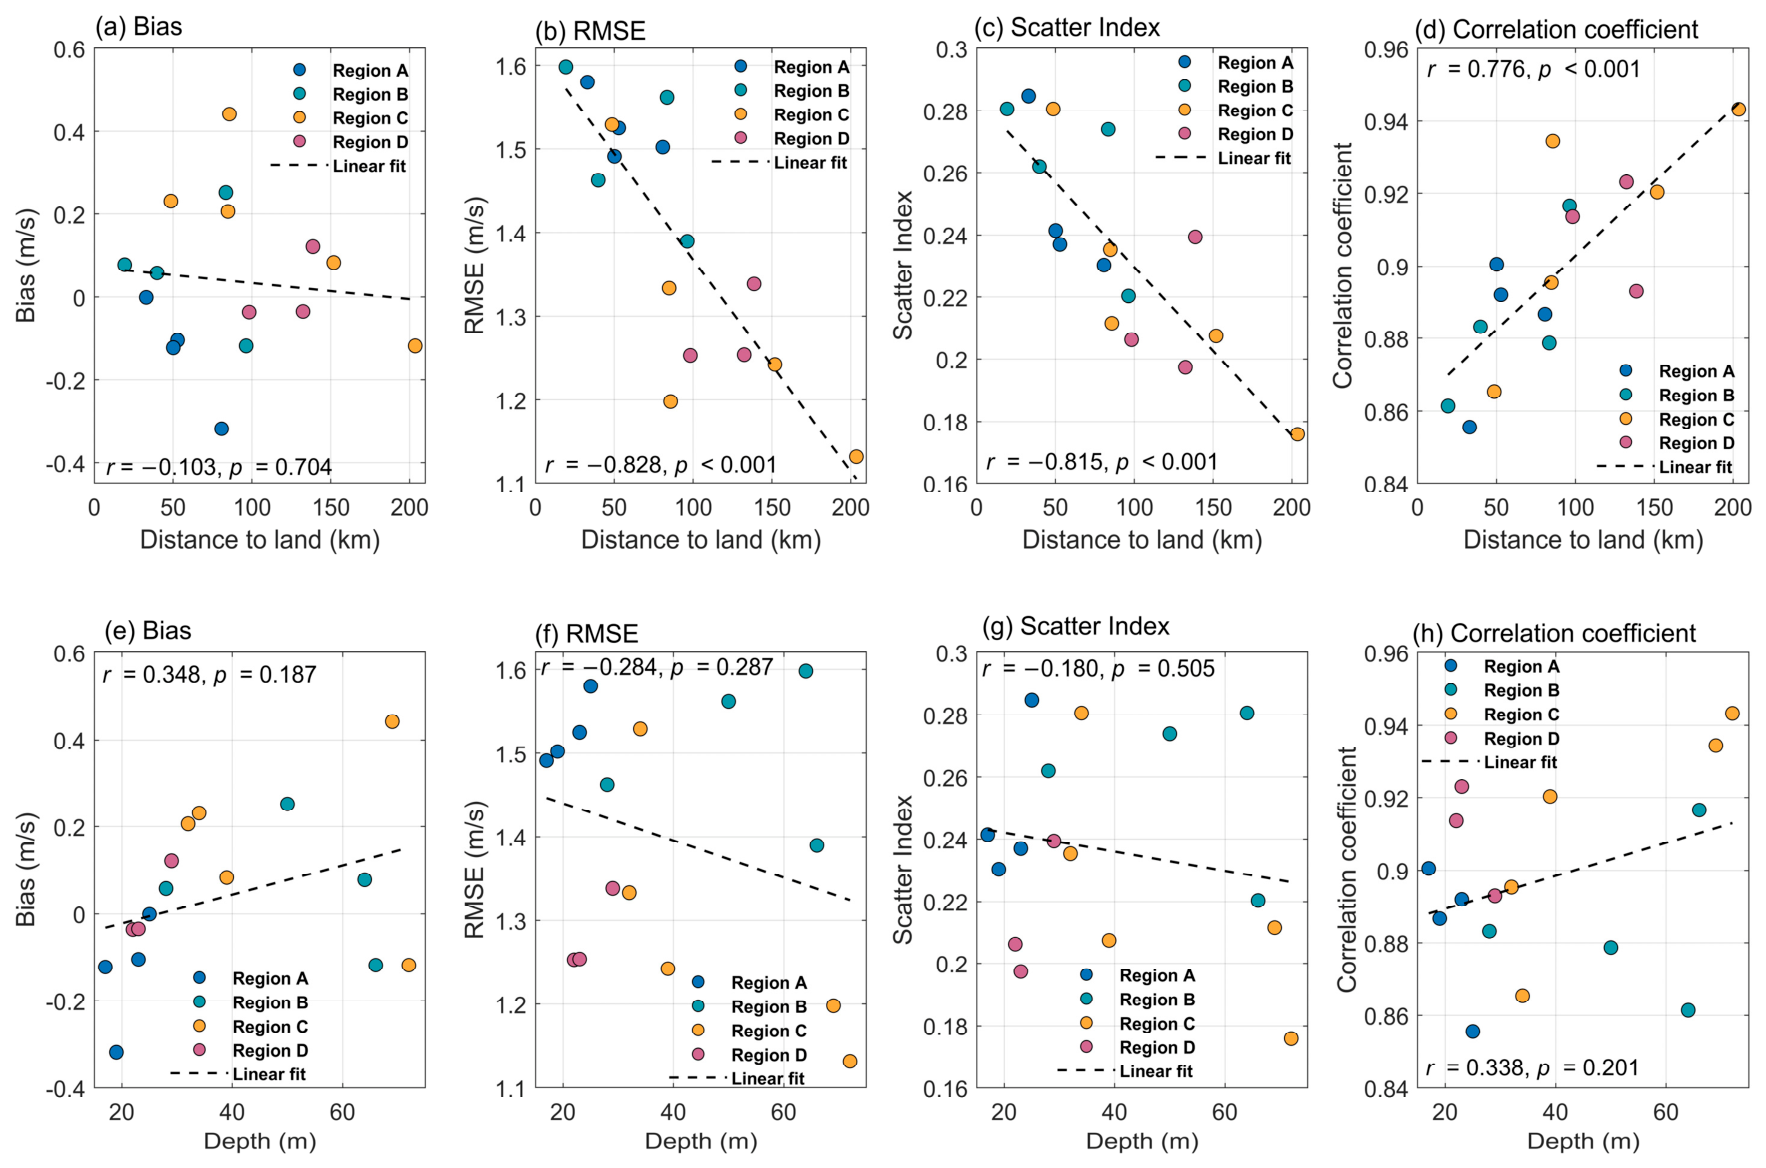
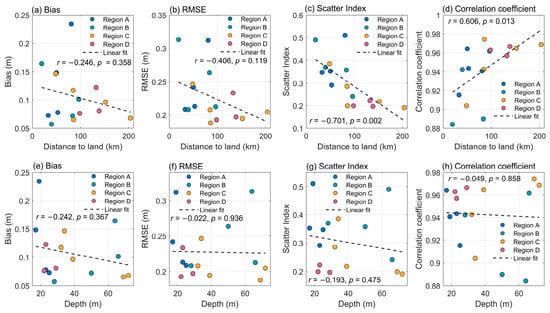
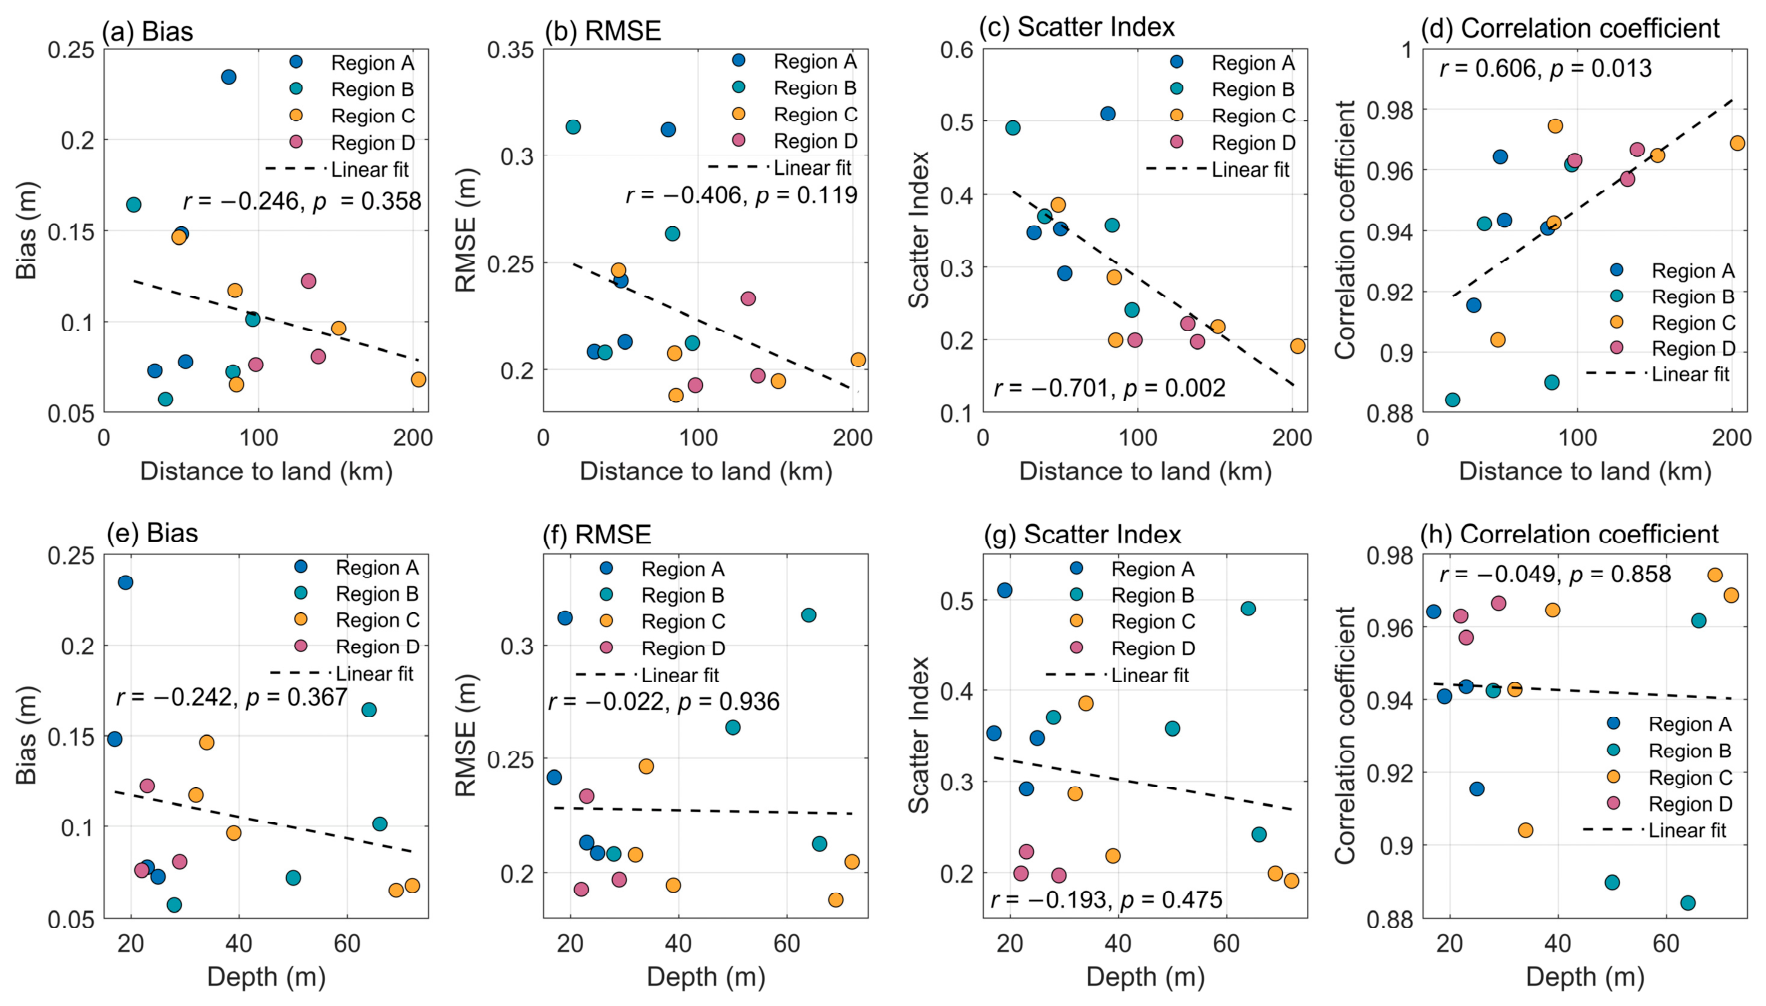
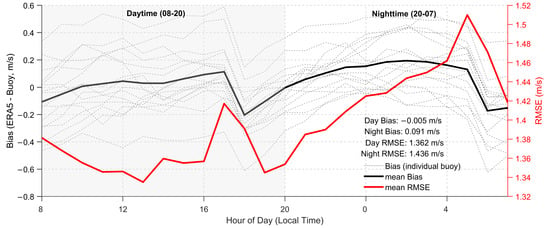
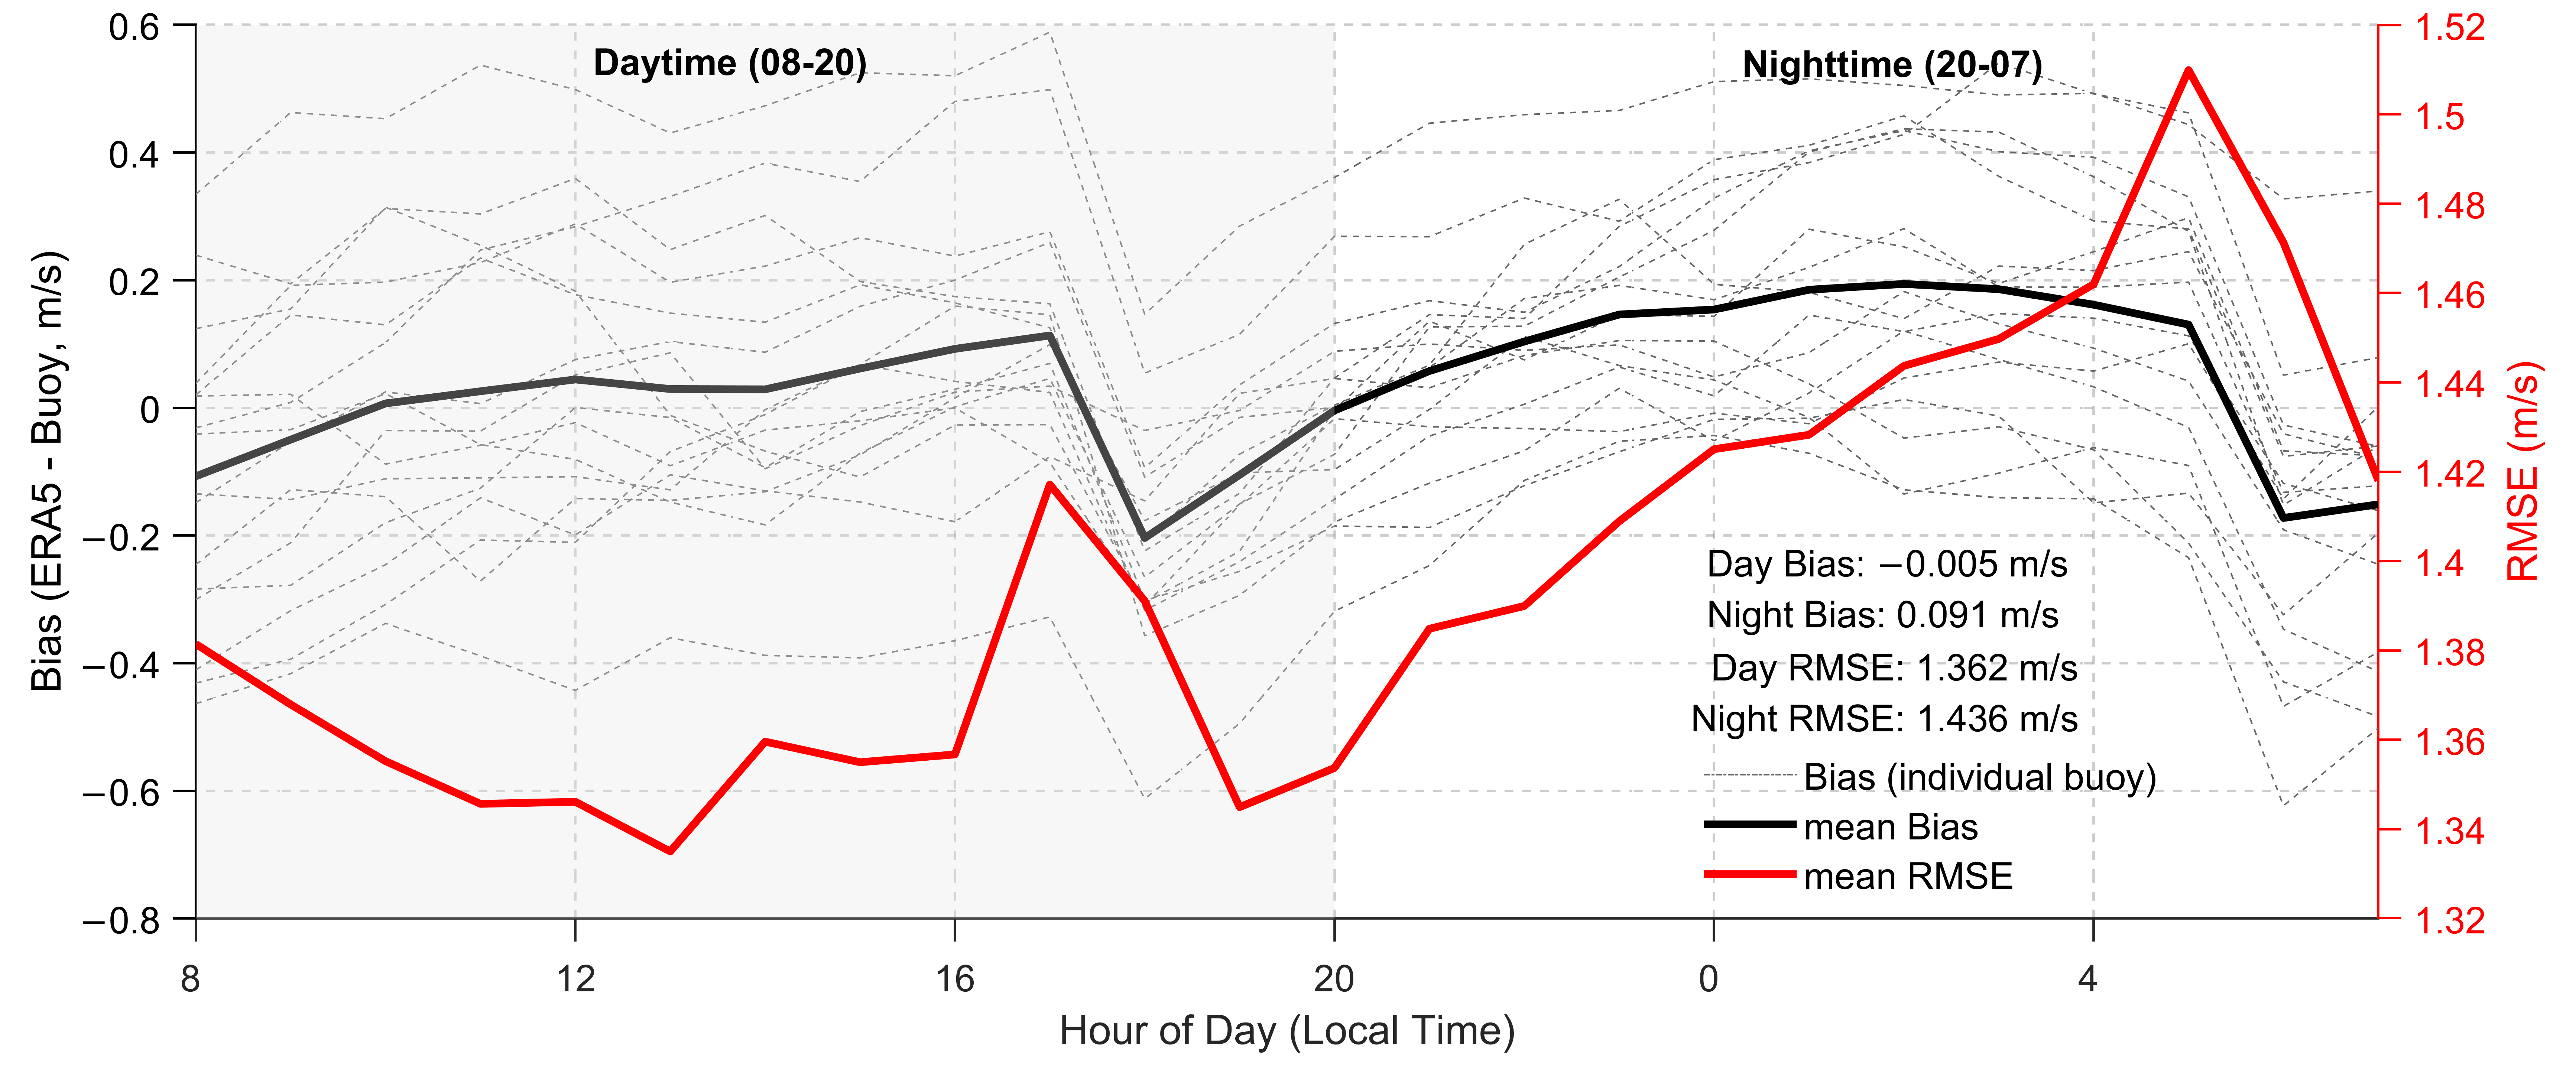
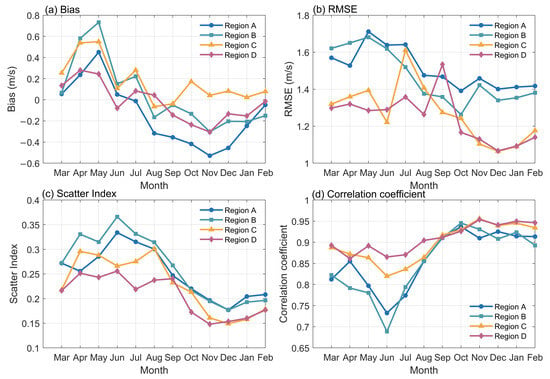
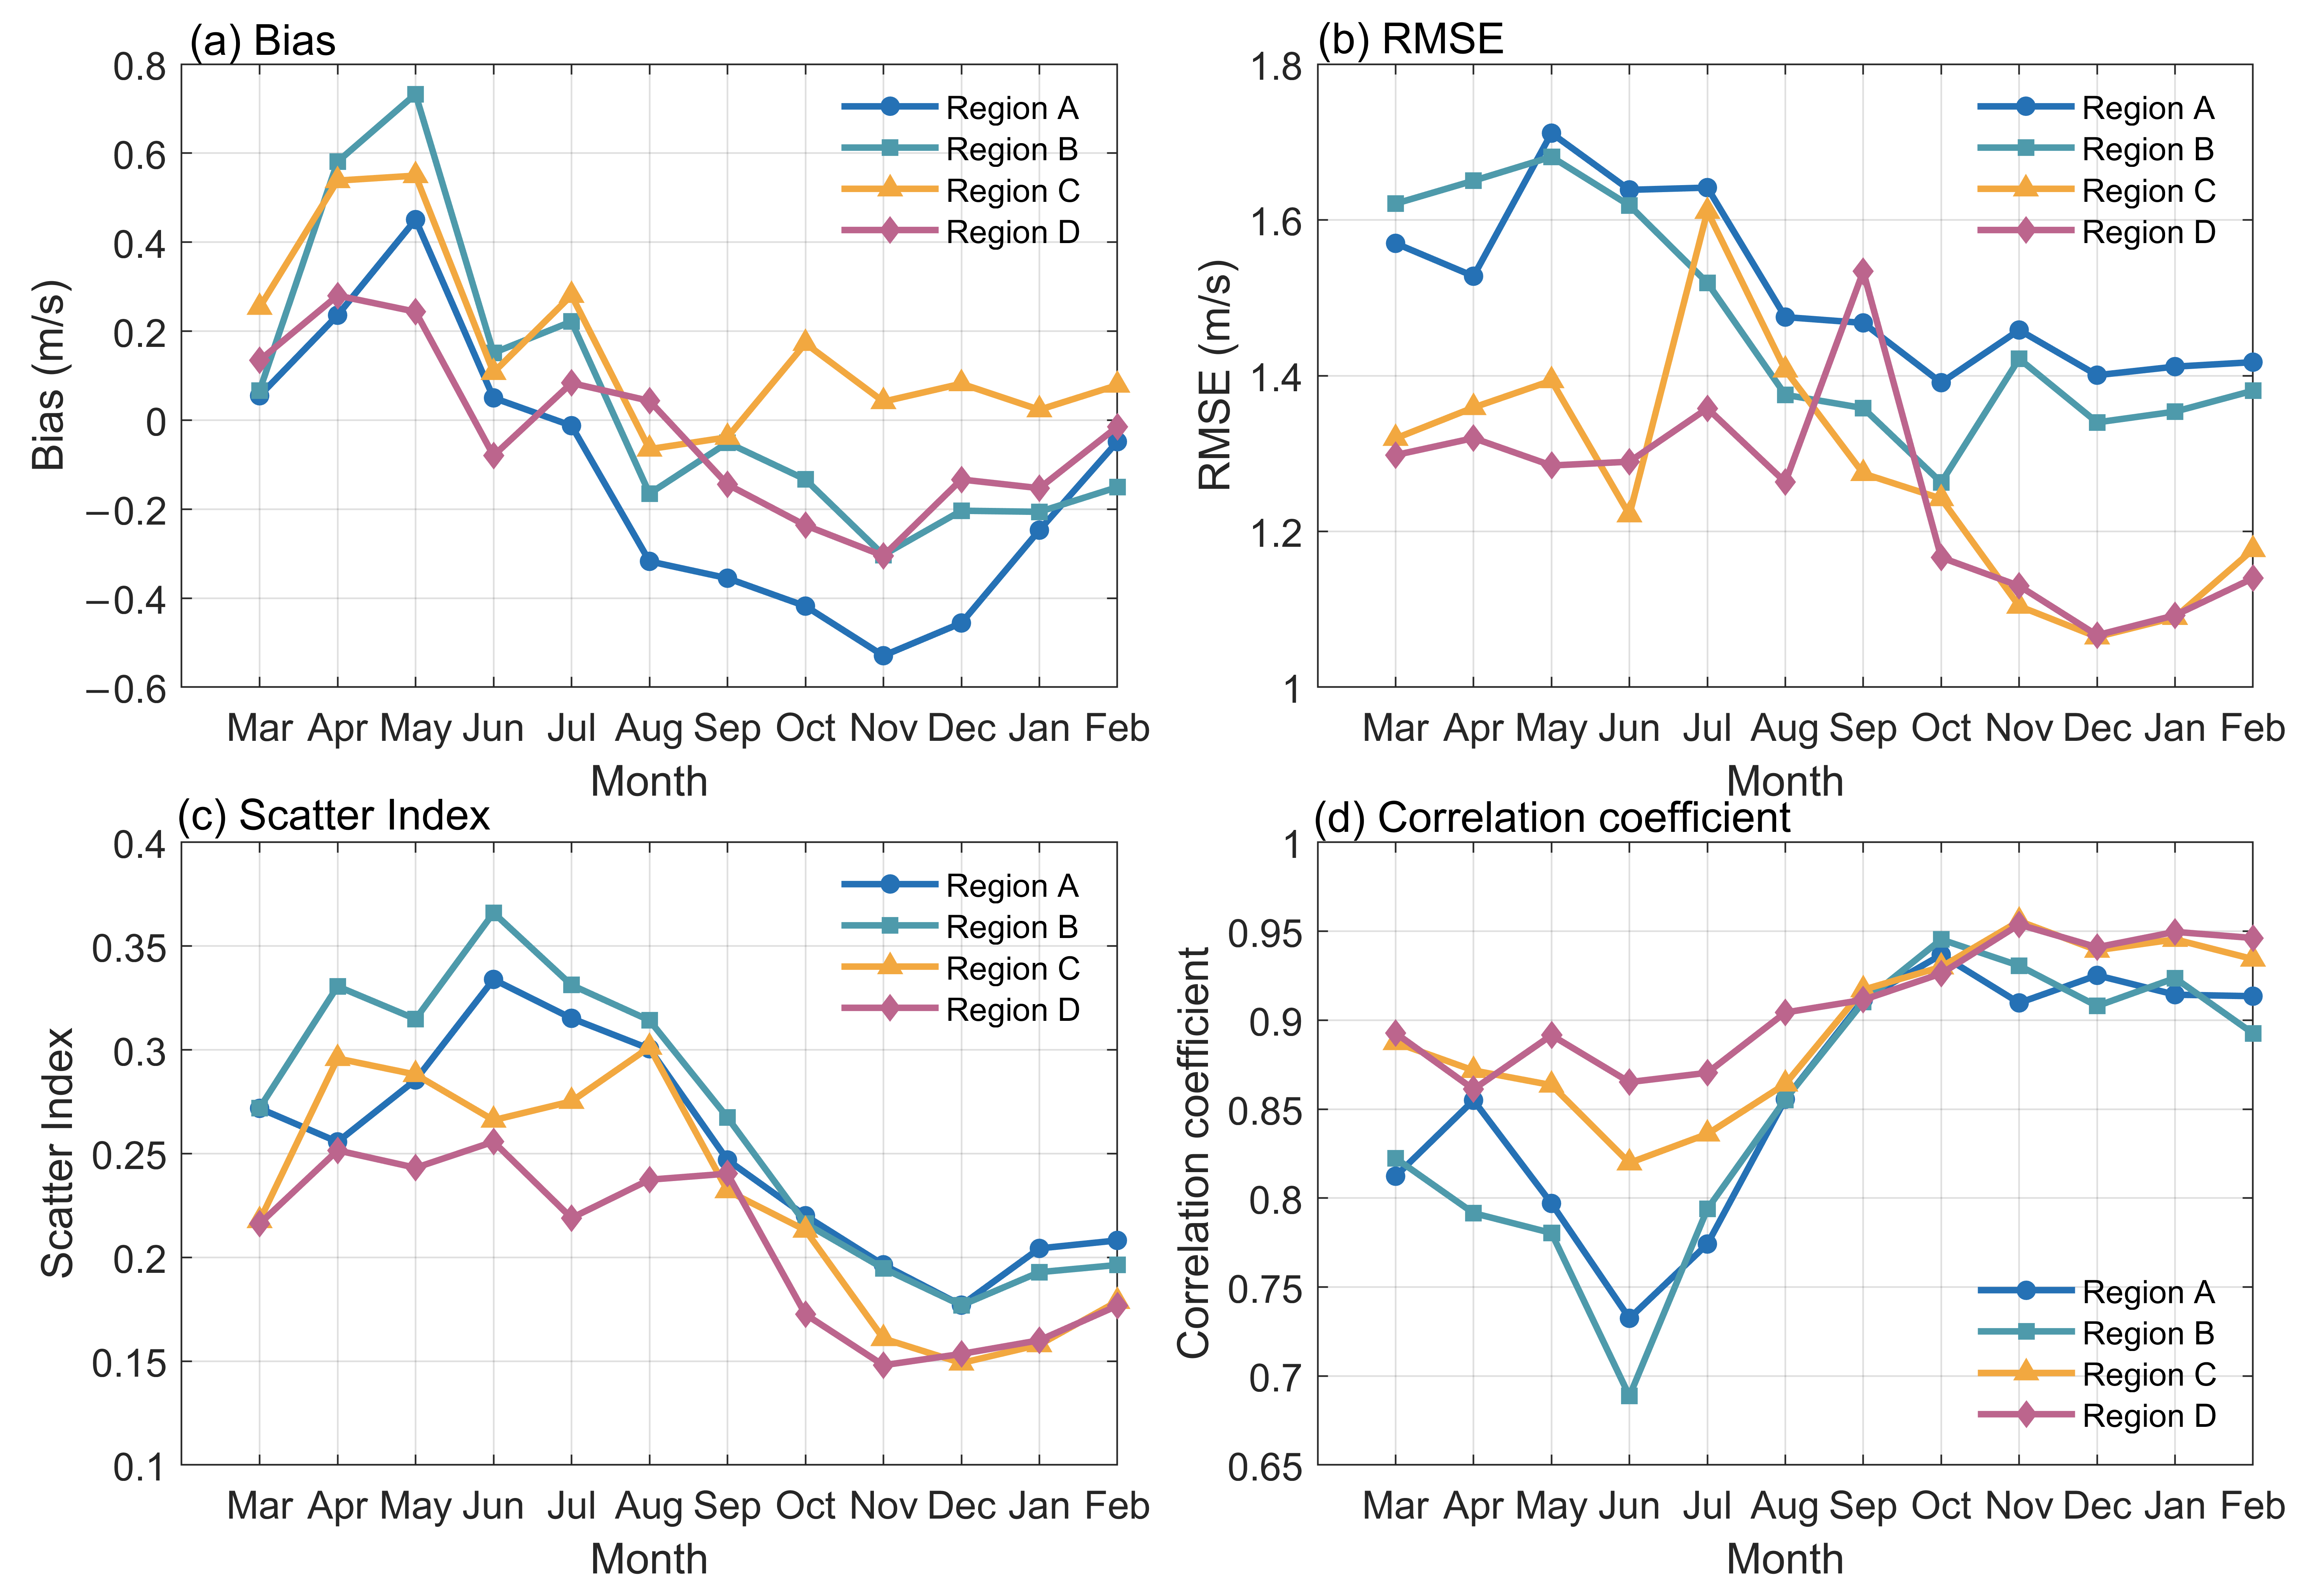
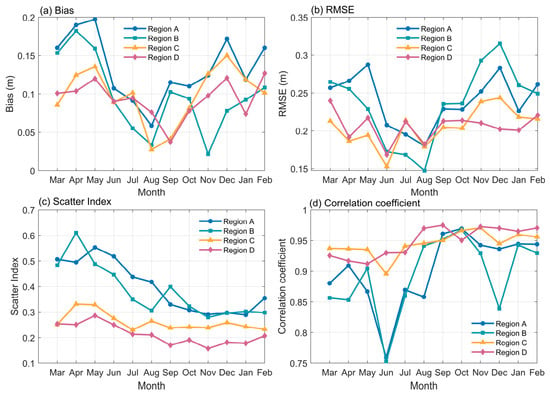
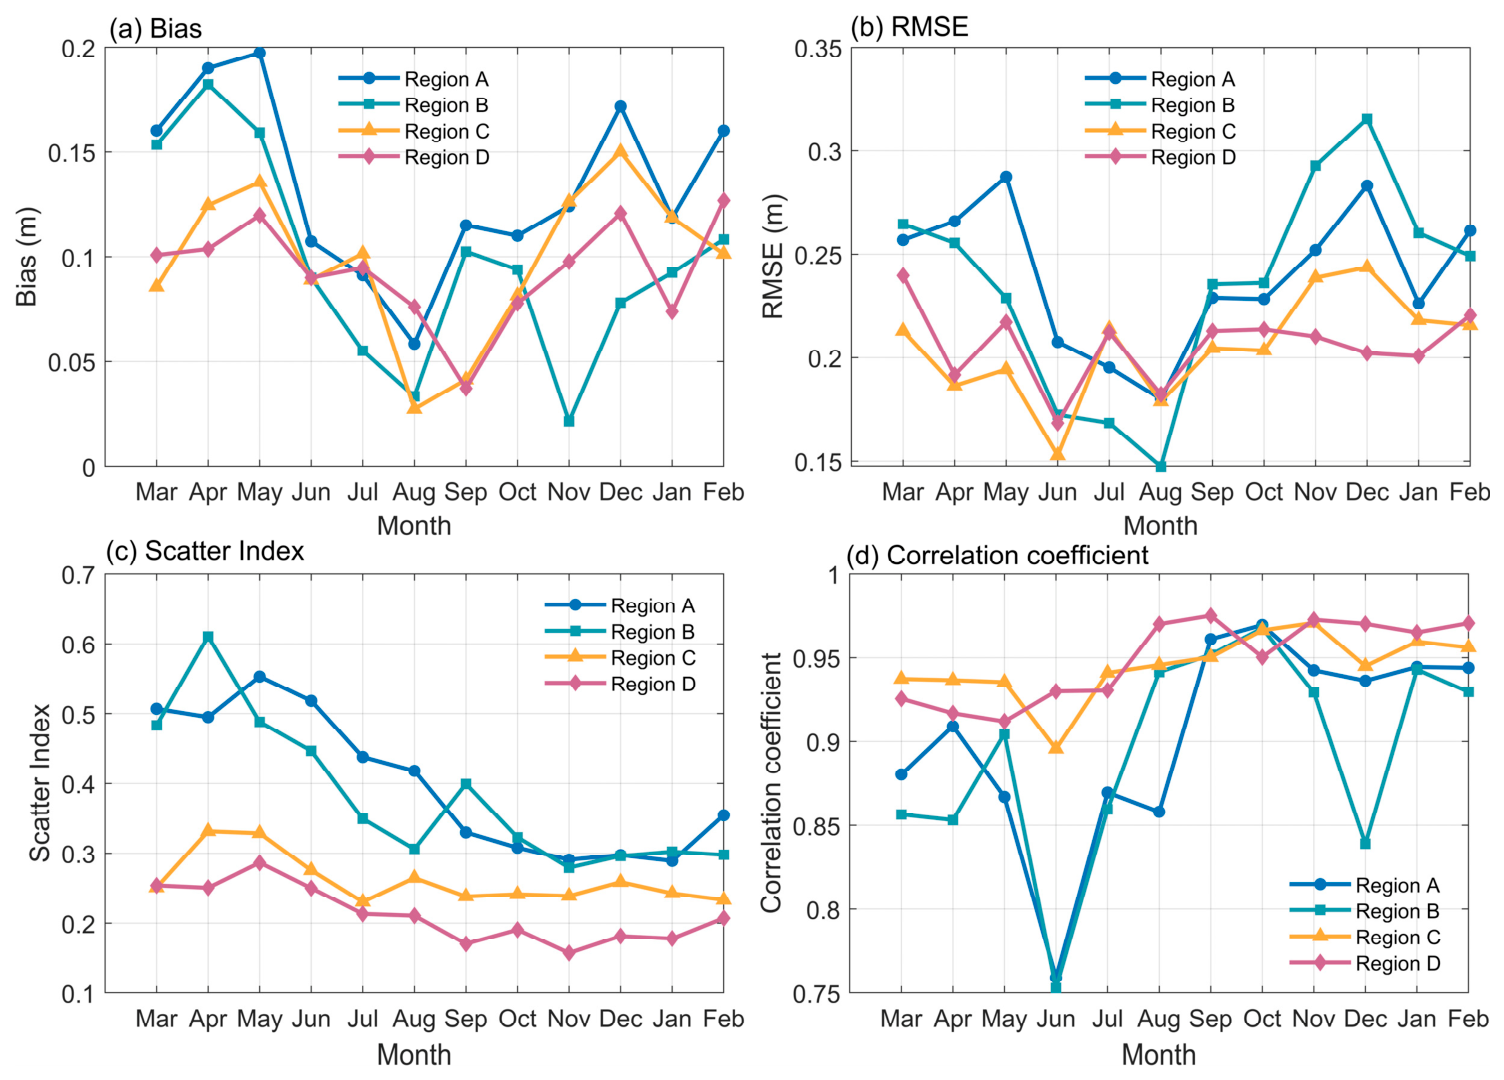
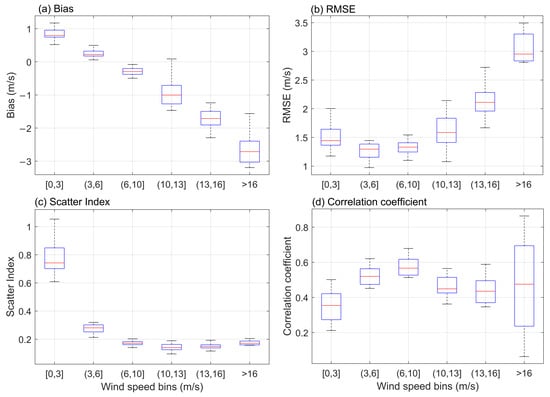
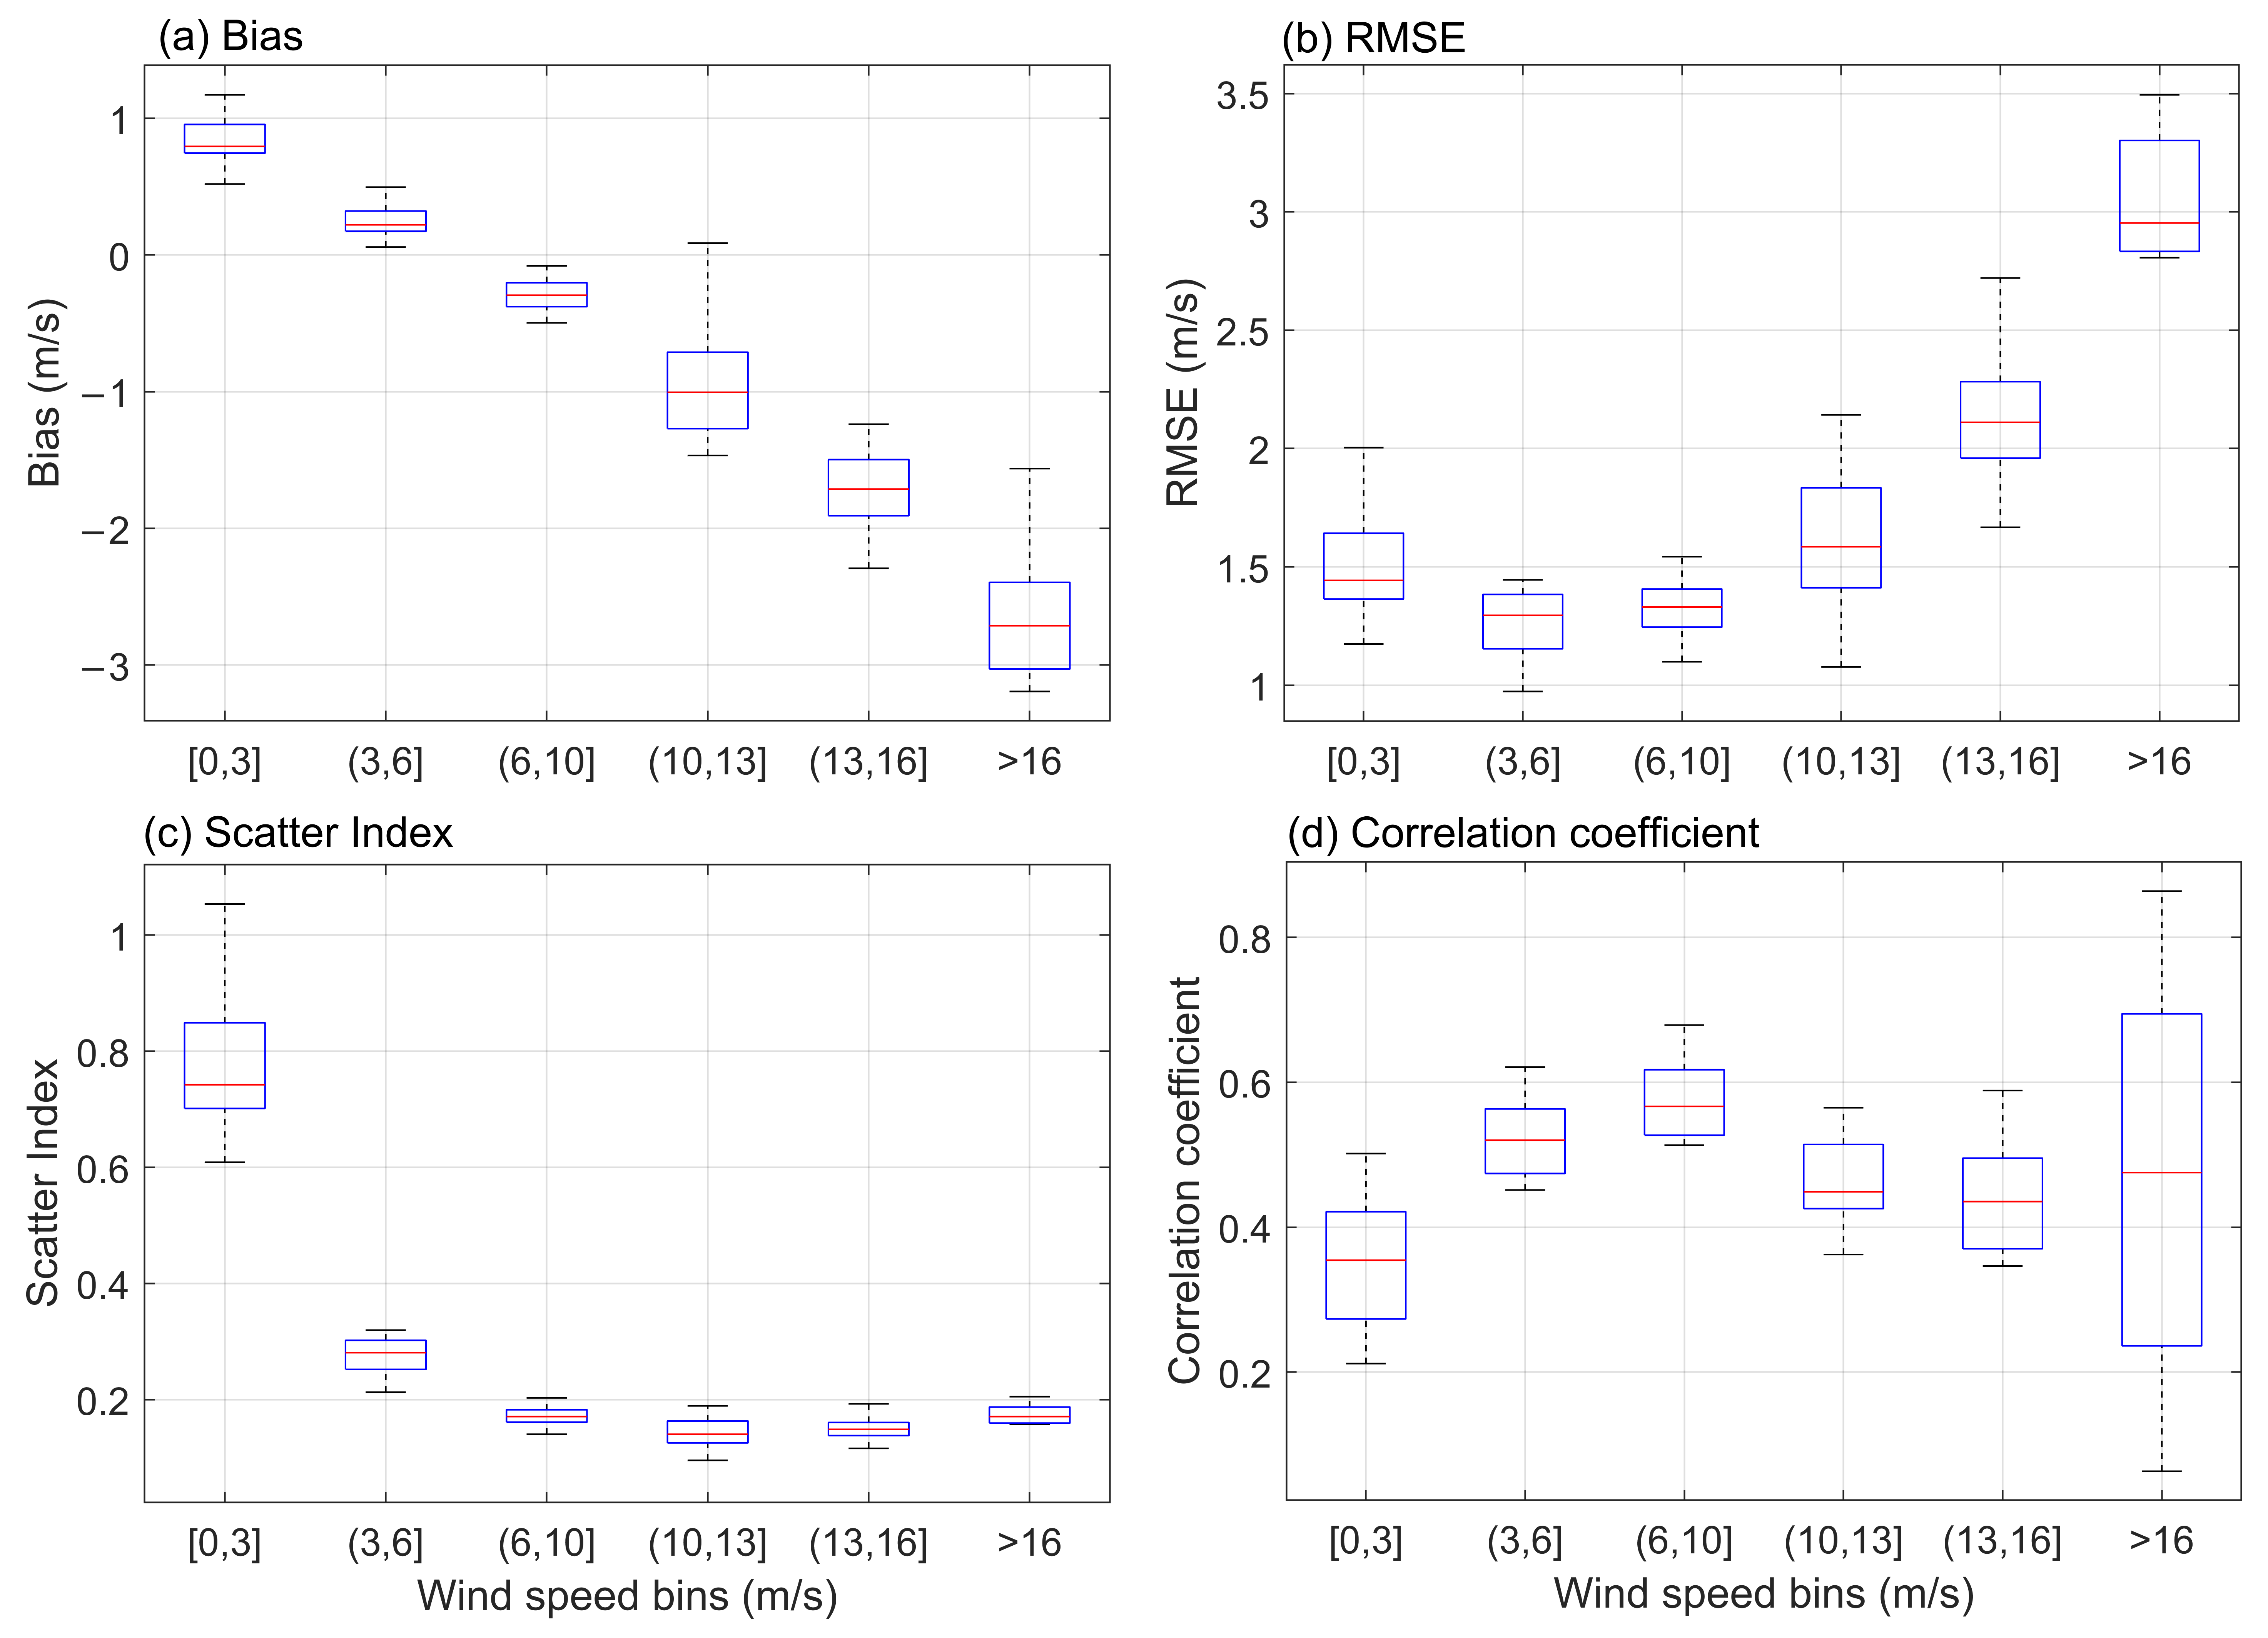
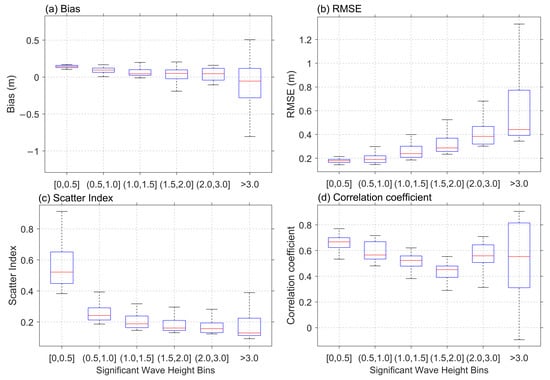
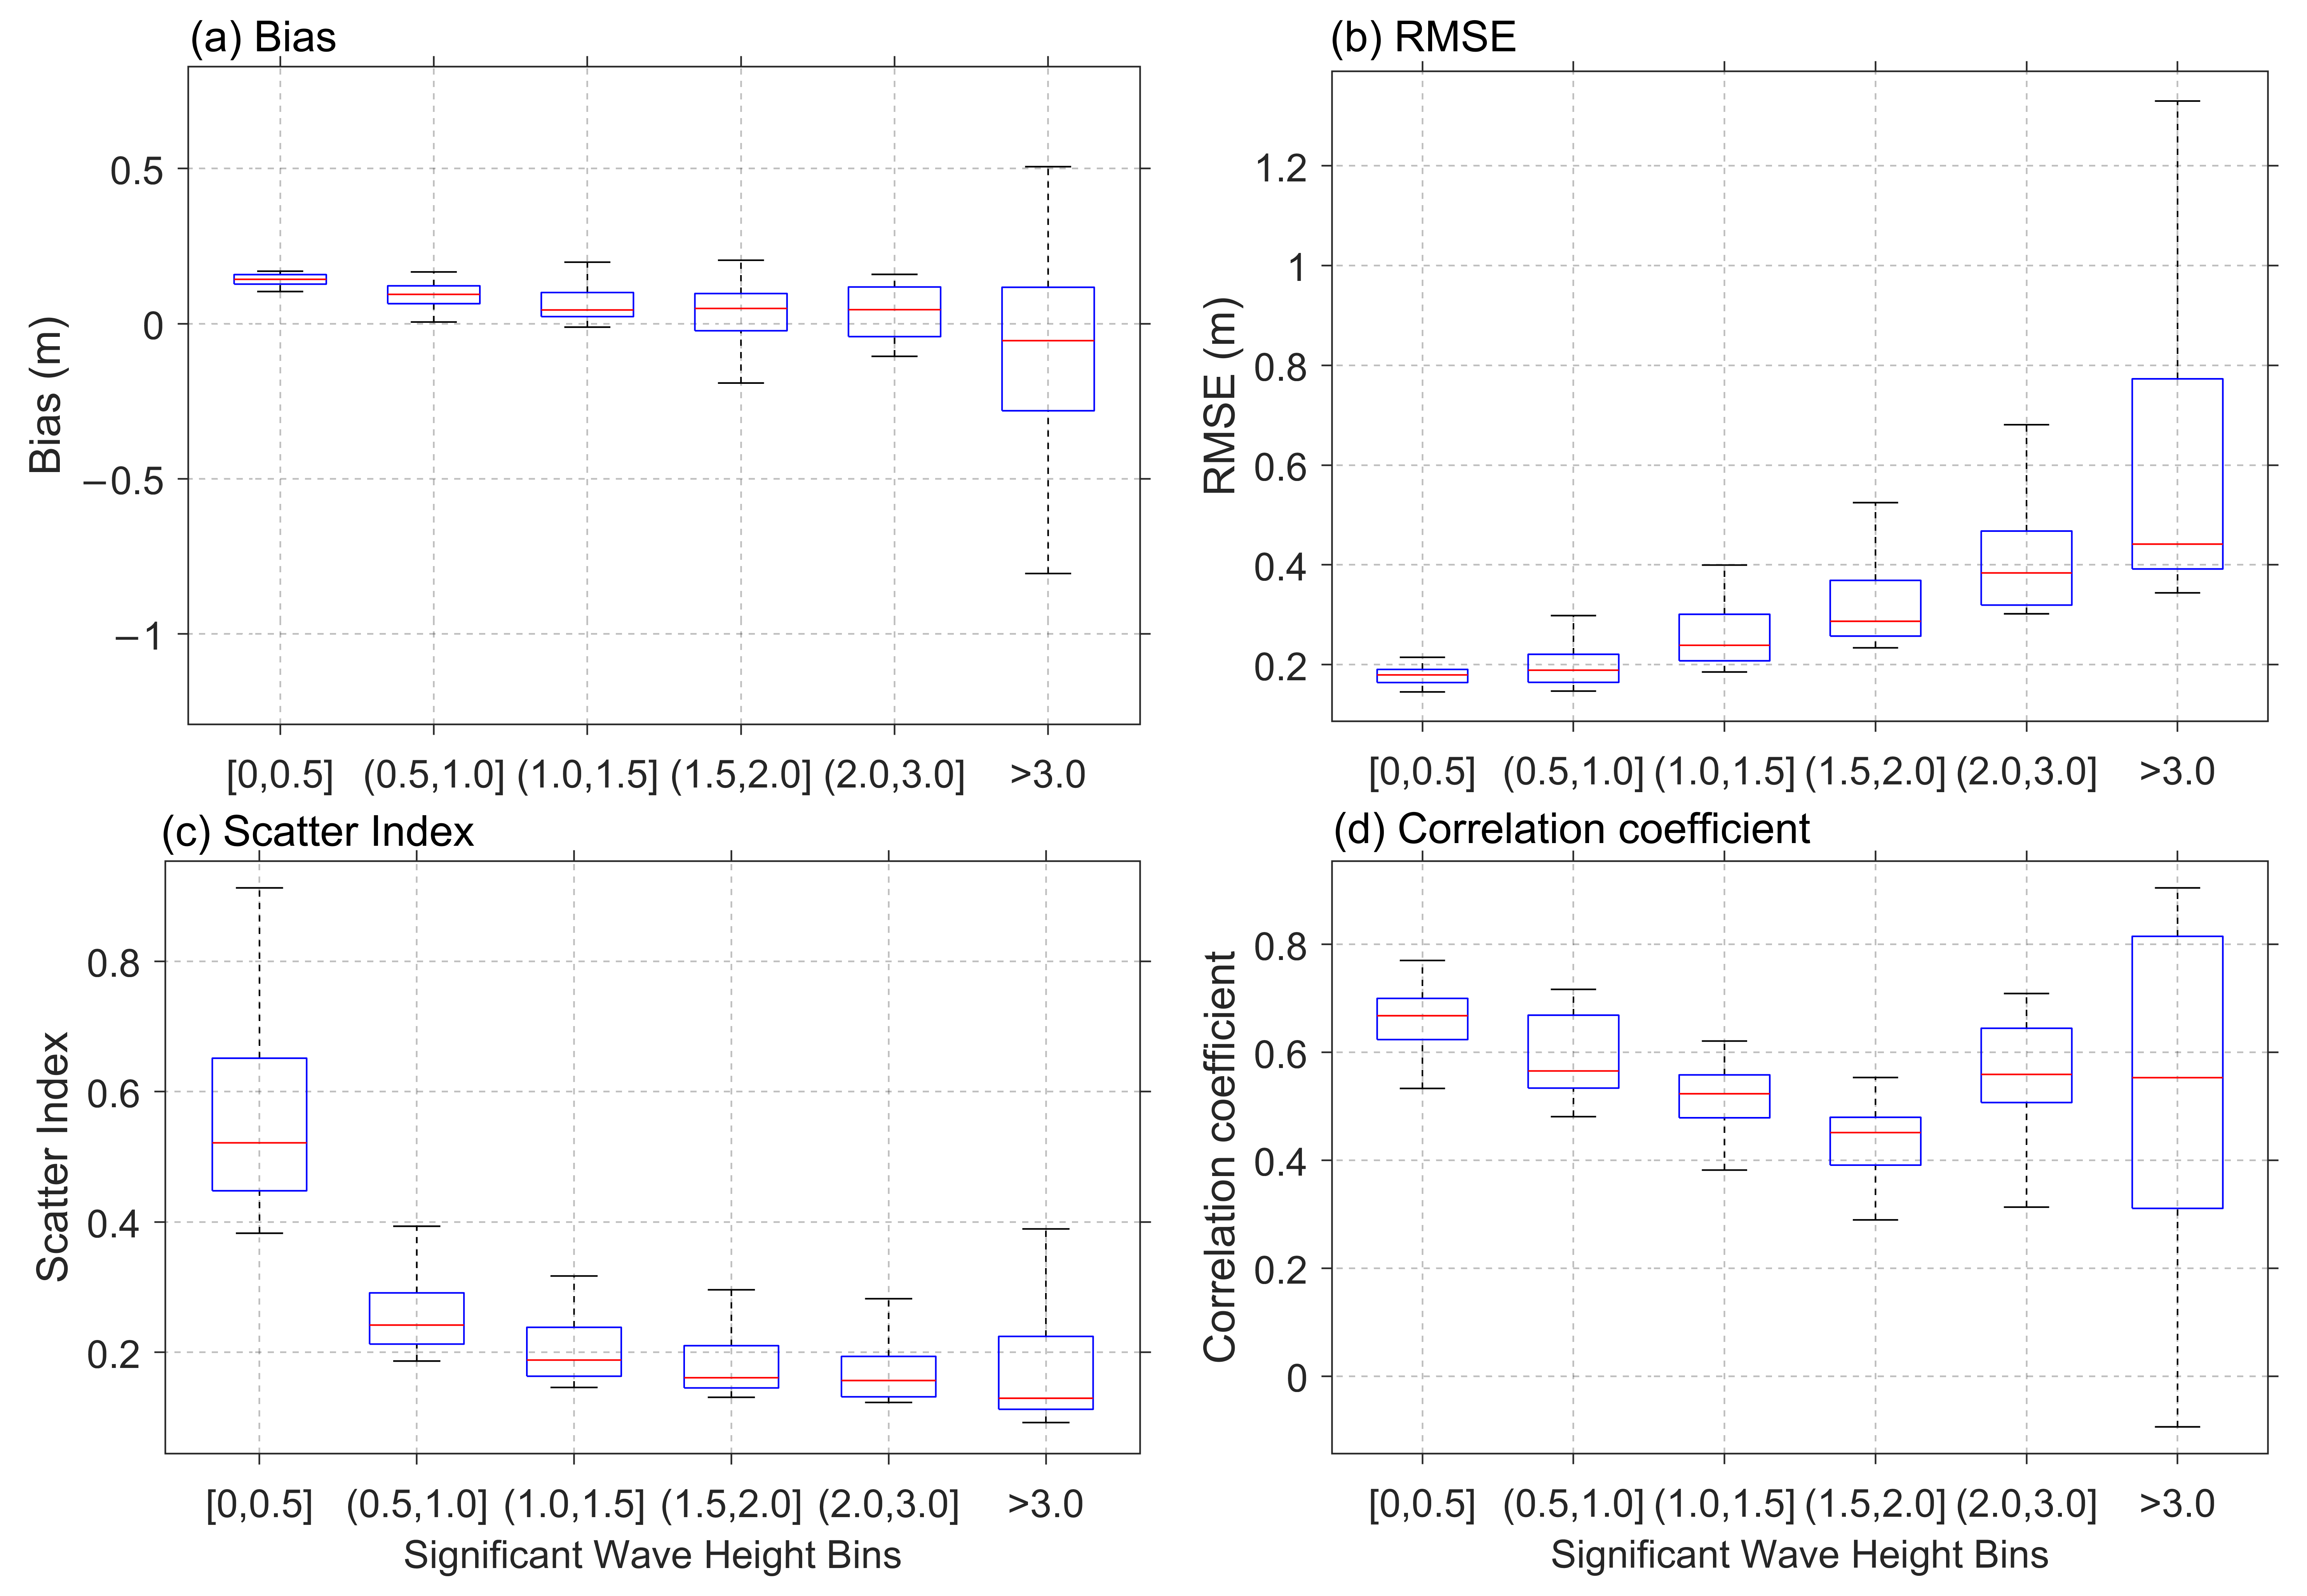

Disclaimer/Publisher’s Note: The statements, opinions and data contained in all publications are solely those of the individual author(s) and contributor(s) and not of MDPI and/or the editor(s). MDPI and/or the editor(s) disclaim responsibility for any injury to people or property resulting from any ideas, methods, instructions or products referred to in the content. |
© 2026 by the authors. Licensee MDPI, Basel, Switzerland. This article is an open access article distributed under the terms and conditions of the Creative Commons Attribution (CC BY) license.