


Abstract
Scour around a tripod foundation under a steady current is investigated experimentally. Experiments are conducted on three tripod foundation models and three flow-angle-of-attack conditions. The three tripod foundations differ only in the size of the top braces. The mechanisms of scour are discovered both experimentally by scanning the scour profiles at various stages of scour progression and conducting numerical simulations of flow around the foundations. The scour is found to be a combination of global and local scour, with three local maximum scour depths occurring at each of the three legs. Although the scour below the main column is shallower than the three legs, its contribution is significant to global scour: the scour below the main column of the tripods ranged from 38–72% of the maximum scour depth. Compared with the case of three truncated piles only, the global scour caused by the main column and the braces dramatically increases the volume of eroded sand. Scour below the main column develops more slowly than the three legs because of its greater diameter. The top brace size has a significant effect on scour; although the braces are located well above the sand surface, their effect is greatest at a 30° angle of attack. In addition to horseshoe vortices, other scour mechanisms, i.e., flow amplification and weak vortex shedding, are also identified.
Keywords:
scour; cylinder; pile; tripod; steady current; sediment transport; offshore foundation; erosion; local scour; pier 1. Introduction
Scour around offshore foundations is a considerable hazard to structural stability. With an increase in offshore wind and tidal energy production, the geometries of subsea foundations have become increasingly complex to ensure that structures can withstand severe environmental conditions. Therefore, understanding the scour mechanism around complex foundations, particularly the popularly used tripod foundations, is essential for a safer design. Tripod foundations offer enhanced structural stability compared to monopiles. Their complex flow–structure interactions significantly affect scour development [1,2,3].
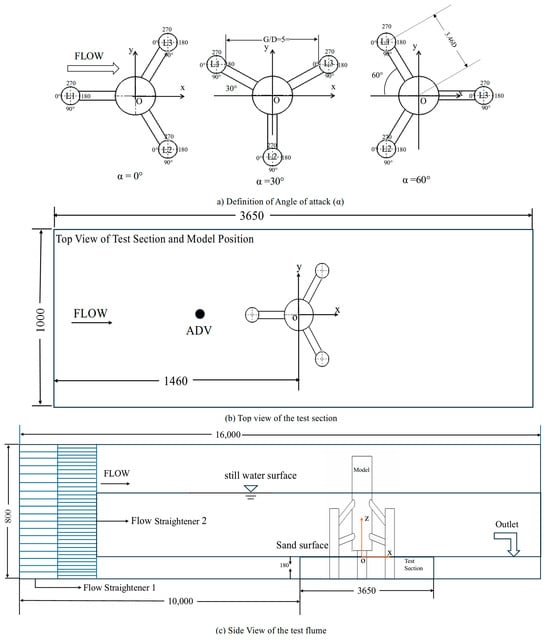
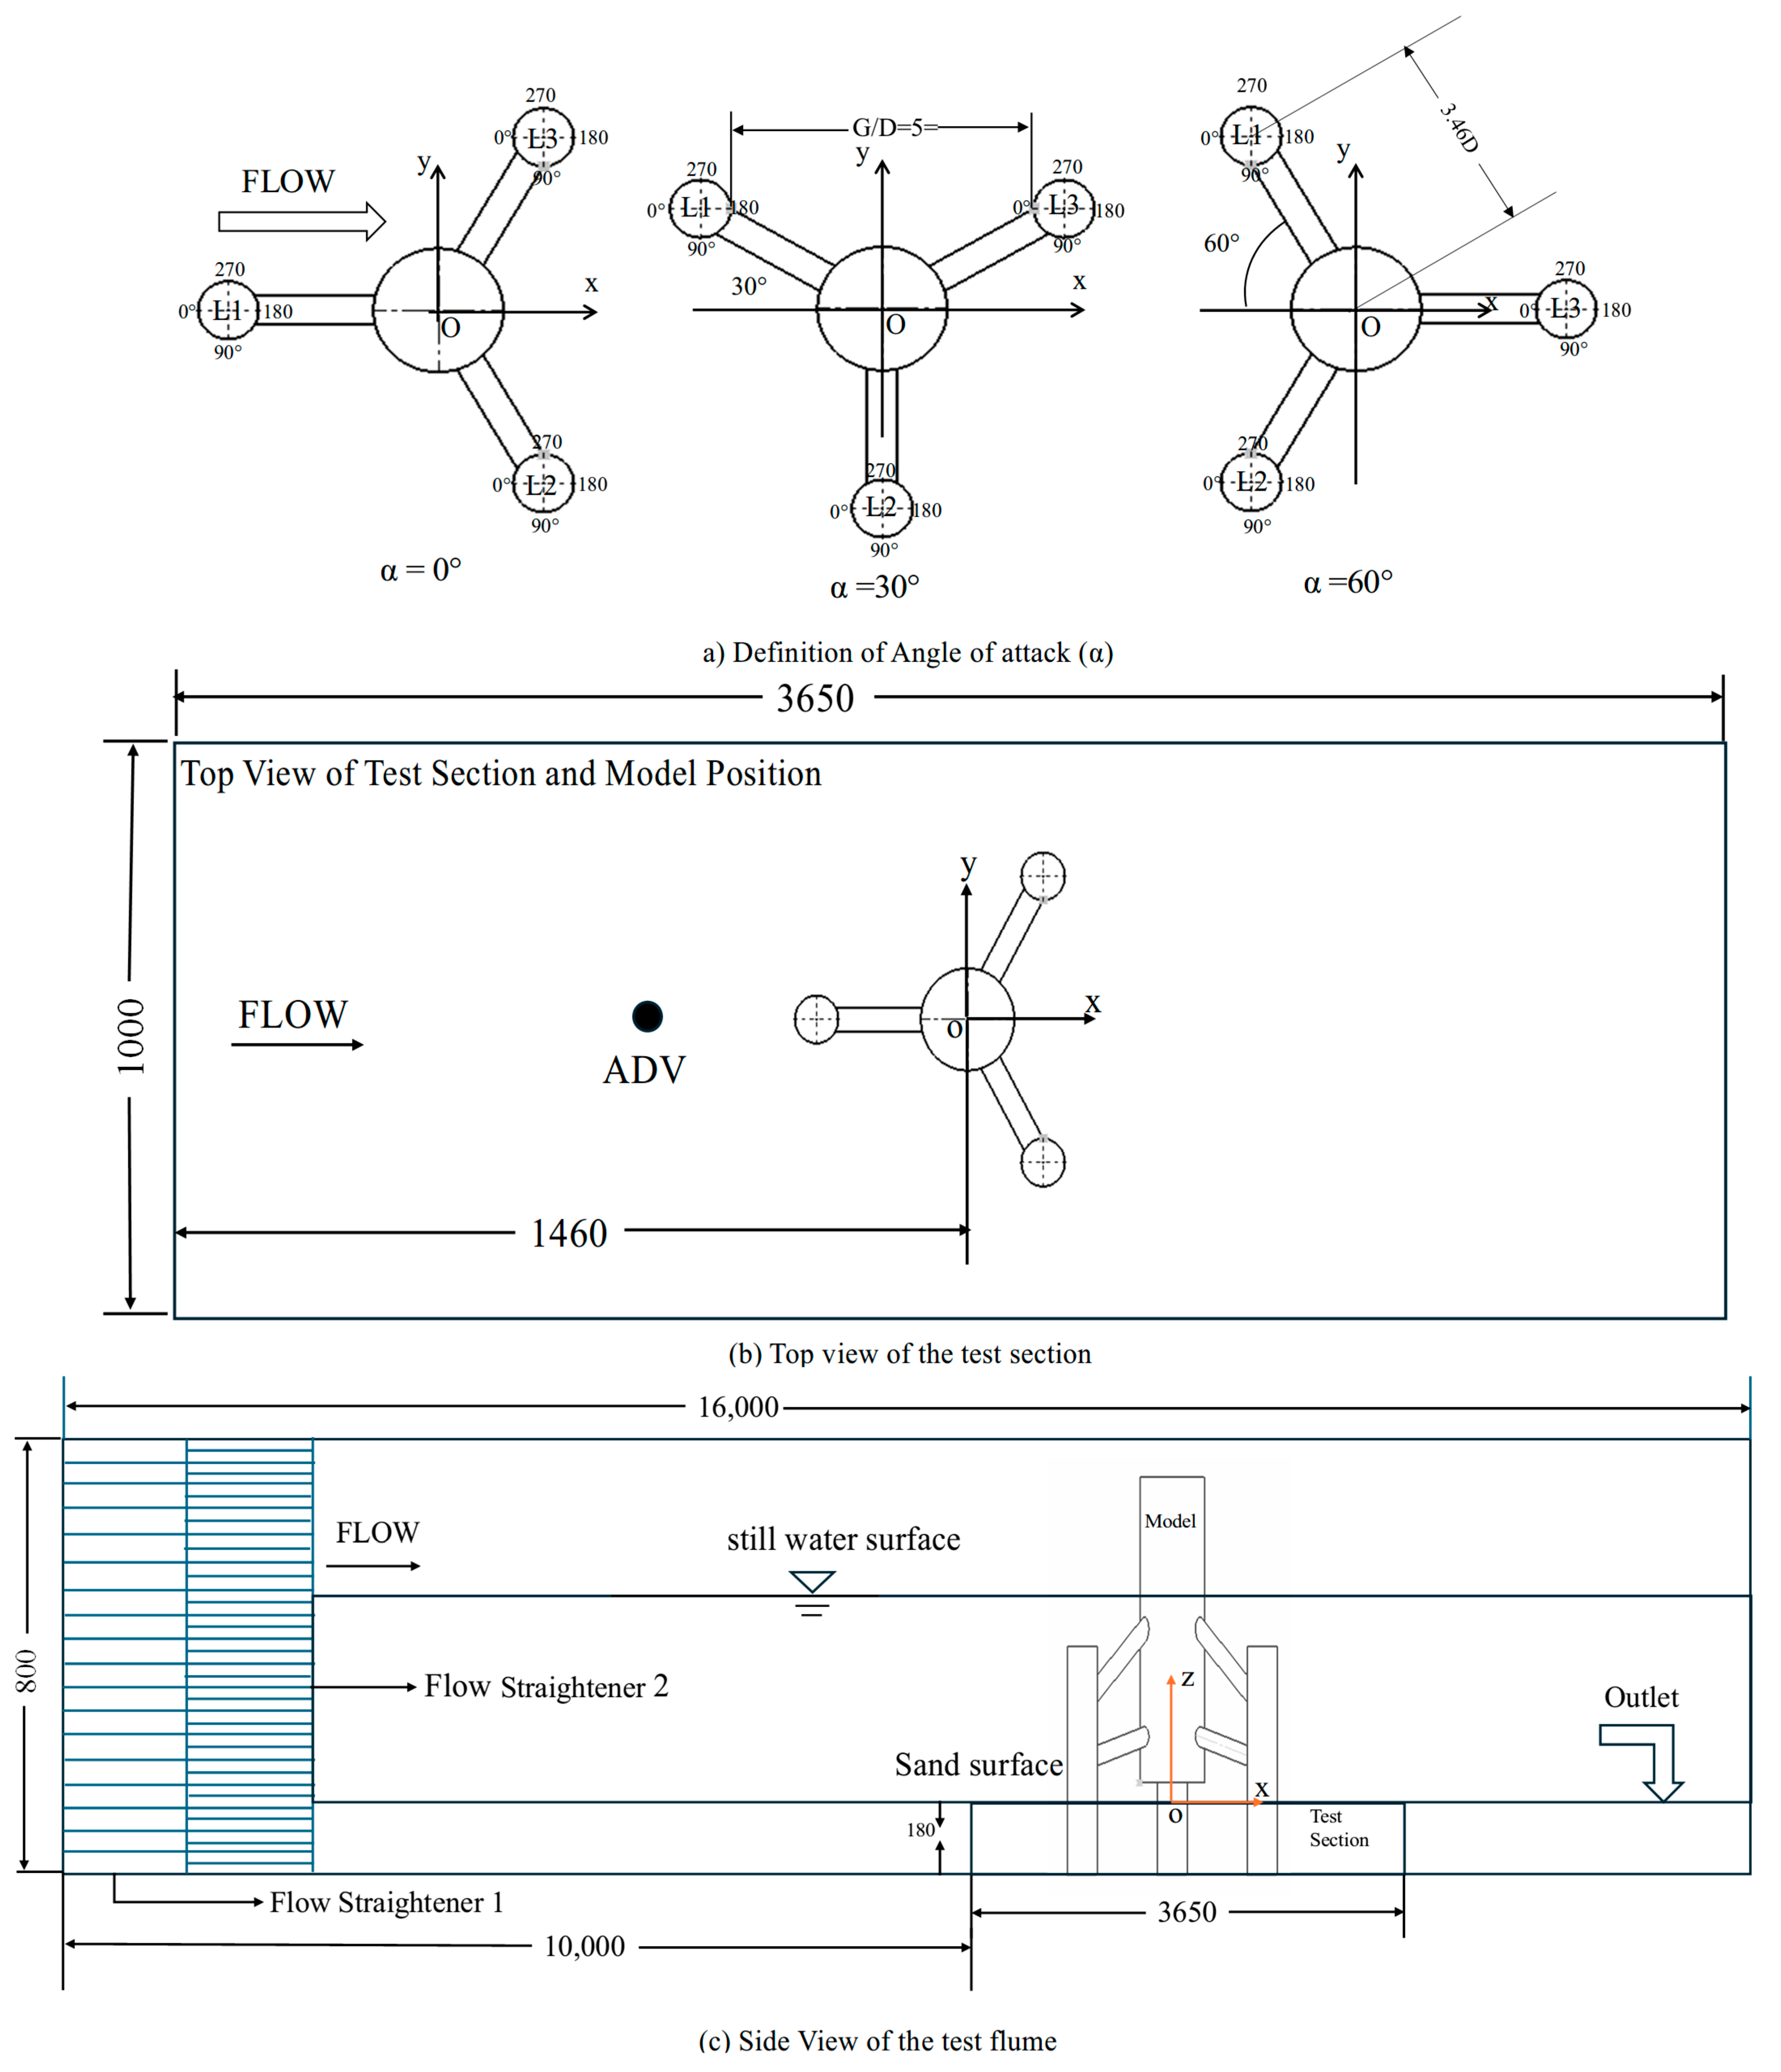
Figure 1 shows a sketch of a tripod foundation and defines the angle of attack when in unidirectional steady flow. The tripod has a main column supported by three legs and six braces. Unlike monopile foundations, the incoming flow direction affects scour development in tripod foundations, resulting in both symmetrical and asymmetrical scour patterns [1,3,4]. This dependence of scour on angle of attack complicates the design of tripod foundations as compared to monopile foundations.
Figure 1.
A sketch of a tripod model installed in the test flume: (a) definition of the angle of attack (α) and measuring point location (θ); (b) top view with ADV position; (c) side view and flume dimensions (mm).
When flow-induced seabed shear stress around the structure increases, the enhancement of the flow’s capacity for sediment erosion locally around the structure causes local scour [5,6,7]. The temporal evolution of scour around both simple and complex foundations follows three stages: (1) a rapid initial phase with a high erosion rate; (2) an intermediate stage with slower erosion rates, where the scour hole deepens and turbulent characteristics inside the scour hole decrease; and (3) a final phase when scour reaches an equilibrium depth [1,8]. The time required to attain the equilibrium depth depends on the flow conditions, sediment properties, and structural parameters, and can range from hours to days in laboratory experiments [3,4].
At the base of a simple pile foundation, a horseshoe vortex with high turbulence and velocity is the primary mechanism of scour on the upstream side of the foundation [9,10]. On the lee side, the lift forces on the sand and turbulent fluctuations from wake vortices enhance scour downstream of the foundation [11,12]. Generally, scour around a simple pile typically depends upon the diameter (D), flow velocity (U), water depth (h), and median particle size of the sand (d50) [13]. In terms of dimensional analysis, normalised scour depth (S/D) is a function of dimensionless parameters, i.e., Froude number, Reynolds number, relative flow depth (h/D), and sediment coarseness (D/d50) [13,14]. When a truncated pile with a small height is installed on the seabed, its height hc affects the scour depth due to different scour mechanisms. A decrease in pile height weakens the horseshoe vortex, thereby reducing the scour depth [7]. Yao et al. [15] found that the scour of a submerged monopile in a steady flow is almost the same as a surface-piercing pile when its aspect ratio (hc/D) exceeds 4. For a monopile, scour initiates at the lateral sides and extends to the front and rear sides of the pile [16,17].
When multiple piles are placed in a group, the shielding between piles in tandem and the jet effect through the gap between two side-by-side piles becomes important [18]. When two piles are in a tandem configuration, the downstream piles experience reduced velocity due to the shielding effect and ultimately have a shallower scour depth [1,19,20]. The shielding effect decreases with increasing pile-to-pile spacing up to 5D [21,22]. When two piles have a small spacing between them, they behave as a combined pile. In a side-by-side arrangement with a spacing greater than 3D, independent scour forms around each pile with individual dunes on its lee side [23,24]. In addition, flow between the piles accelerates due to contraction, creating a jet effect that enhances scour in the inter-pile region [1,19,20,25]. The contraction effect is pronounced when the pile-to-pile spacing is less than 2.5D [19,20]. The effect of the flow contraction of two piles in a staggered arrangement also depends upon the angle of attack [4]. On the lee side of two side-by-side cylinders, asymmetrical flow structures develop due to jet flow (at a lower gap ratio) and bias towards the narrow wake region [26]. The scour development pattern of two piles in a staggered arrangement exhibits characteristics intermediate between tandem and side-by-side arrangements [26,27,28,29]. The contributions of the mechanisms of partial sheltering and skewed contraction are dependent on the angle of attack [23,30] The scour depth at the rear pile increases with increasing skew angle [31]. For three piles in a triangular arrangement at 0° angle of attack, scour is severest at the downstream piles rather than at the upstream pile, and scour holes develop independently when the pile–pile spacing is large, indicating local scour behaviour [32]. The scour is driven by the combined effects of mechanisms observed in two piles arranged in staggered, tandem, and side-by-side configurations, including blockage, sheltering, and flow contraction.
Experimental investigations of scour around tripod foundations shown in Figure 1 are mostly conducted in recirculating flumes with widths ranging from 0.5 to 2.0 m and lengths from 10 to 30 m [3,4,14]. To attain flow uniformity and lower turbulent fluctuations, flow straighteners and honeycomb sections are installed, and inlet and outlet conditions are controlled [11,12]. In scour experiments, flow velocities are maintained from 0.2 to 0.5 m/s, equivalent to a Froude number (Fr < 1) corresponding to a subcritical flow condition [13,14]. Total test duration ranges from 6 to 48 h, depending on the time scale, study objectives and experimental conditions to reach the equilibrium depth [3,4]. Similarly, the presence of other structural members induces the formation of new flow structures. These new flow–structure interactions are complex, three-dimensional, and depend on various geometric parameters, such as angle of attack, geometry, and inter-pile spacing [3,4].
For tripod foundations, the incoming flow direction and tripod orientation change the horseshoe vortex system. Depending on the angle of attack, either one or two piles that face the flow directly have horseshoe vortices like a monopile [1,3]. For asymmetric orientation (α = 30°), the interaction between the three horseshoe vortices from the three legs is the strongest [4]. At the symmetrical orientation with α = 60°, the jet through the spacing between the two upstream piles causes an increase in the scour depth of the downstream pile [1]. For a range of angles of attack of a tripod from 0° to 60°, a variation of 20–40% in maximum scour depth (MSD) has been reported in experimental studies [1,3,4]. The MSD occurs at an angle of attack between 30° and 60°, where a combination of strong direct downflow and jet effects between the piles results in severe scour [3]. This angle of attack dependence highlights the need for scour monitoring and effective design of tripod foundations [8].
A tripod foundation has additional scour mechanisms that are not present in the case of three piles arranged in a triangular arrangement. Stahlmann and Schlurmann [33] studied the effect of structural bracing on scour patterns. They found that the horizontal braces near the sand bed cause flow obstruction and increase the scour depths by 10–20%. This scour enhancement depends on the brace diameter, its position relative to the sand bed, and the angle of attack. Similarly, vertical or inclined brace elements alter the flow interaction and modify the scour pattern [33]. Aminoroayaie Yamini et al. [34] estimated that the scour depth increases by a factor of 4.45 when the leg diameter increases by 100%. For tripod foundations, local and global scour develops around the legs, under the main column, and along the connecting braces, with severe scour at the rear legs. The main mechanism of scour in tripod foundations is the combination of local flow acceleration and enhanced turbulence under the main column and the mechanisms of scour around multiple piles [35,36]. This enhanced scour affects structural stability, as Ma et al. [37] estimated that a 26% decrease in the tension capacity of the tripod foundation is caused by scour hole depth, and scour hole dimensions can be effectively correlated with the foundation’s tension capacity.
Based on the major studies conducted on tripods, different objectives were achieved in each study. Refs. [33,35] determined the equilibrium scour depth mainly in the wave-dominated regime, while Yuan et al. [14] studied it under steady current. Ni and Xue [4] proposed equivalent approaches and methodologies, using a new formula for the projected area. These studies are important and have paved the way for a better understanding of scour around complex foundations. However, limited attention has been paid to the influence of tripod brace configuration and flow incidence angle on the temporal evolution and spatial morphology of scour under steady-current conditions. In particular, the interaction between the main column, supporting legs, and brace members may substantially alter local flow acceleration, vortex formation, and sediment transport processes, leading to scour patterns that differ from those reported for conventional tripod geometries. Therefore, an experimental investigation is required to quantify the effects of variations in tripod configuration on scour initiation, development, and final bed morphology. The present study addresses this knowledge gap through a series of clear-water scour experiments on tripod foundations with different brace dimensions subjected to multiple flow-incidence angles, providing new insights into the mechanisms governing scour evolution around offshore tripod foundations. A comparison of tripod scour with the scour of three legs arranged in a triangle is useful for quantifying the contributions of the main column and braces to scour. Furthermore, detailed spatial distributions of scour in the early phase were not examined in previous studies, necessitating the capture of scour profiles during this phase. In this study, experiments on scour around three tripods, three simple piles, and three truncated piles (representing only the three legs) are conducted. The aim is to identify the fundamental mechanisms responsible for scour and the effects of brace geometry and the main column on scour under different angles of attack. The contributions of the braces and the main column to scour are quantified, and the scour mechanisms are identified through numerical flow simulation and monitoring of the bed elevation at various stages.
2. Experimental Set-Up and Methods
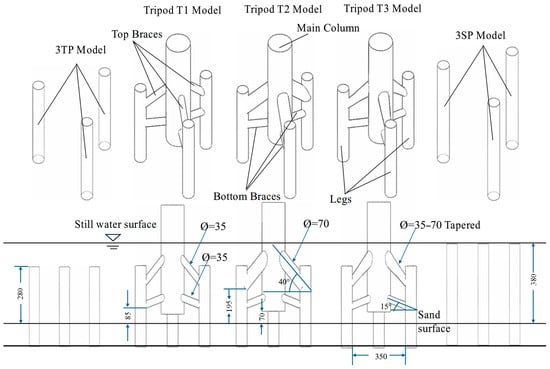
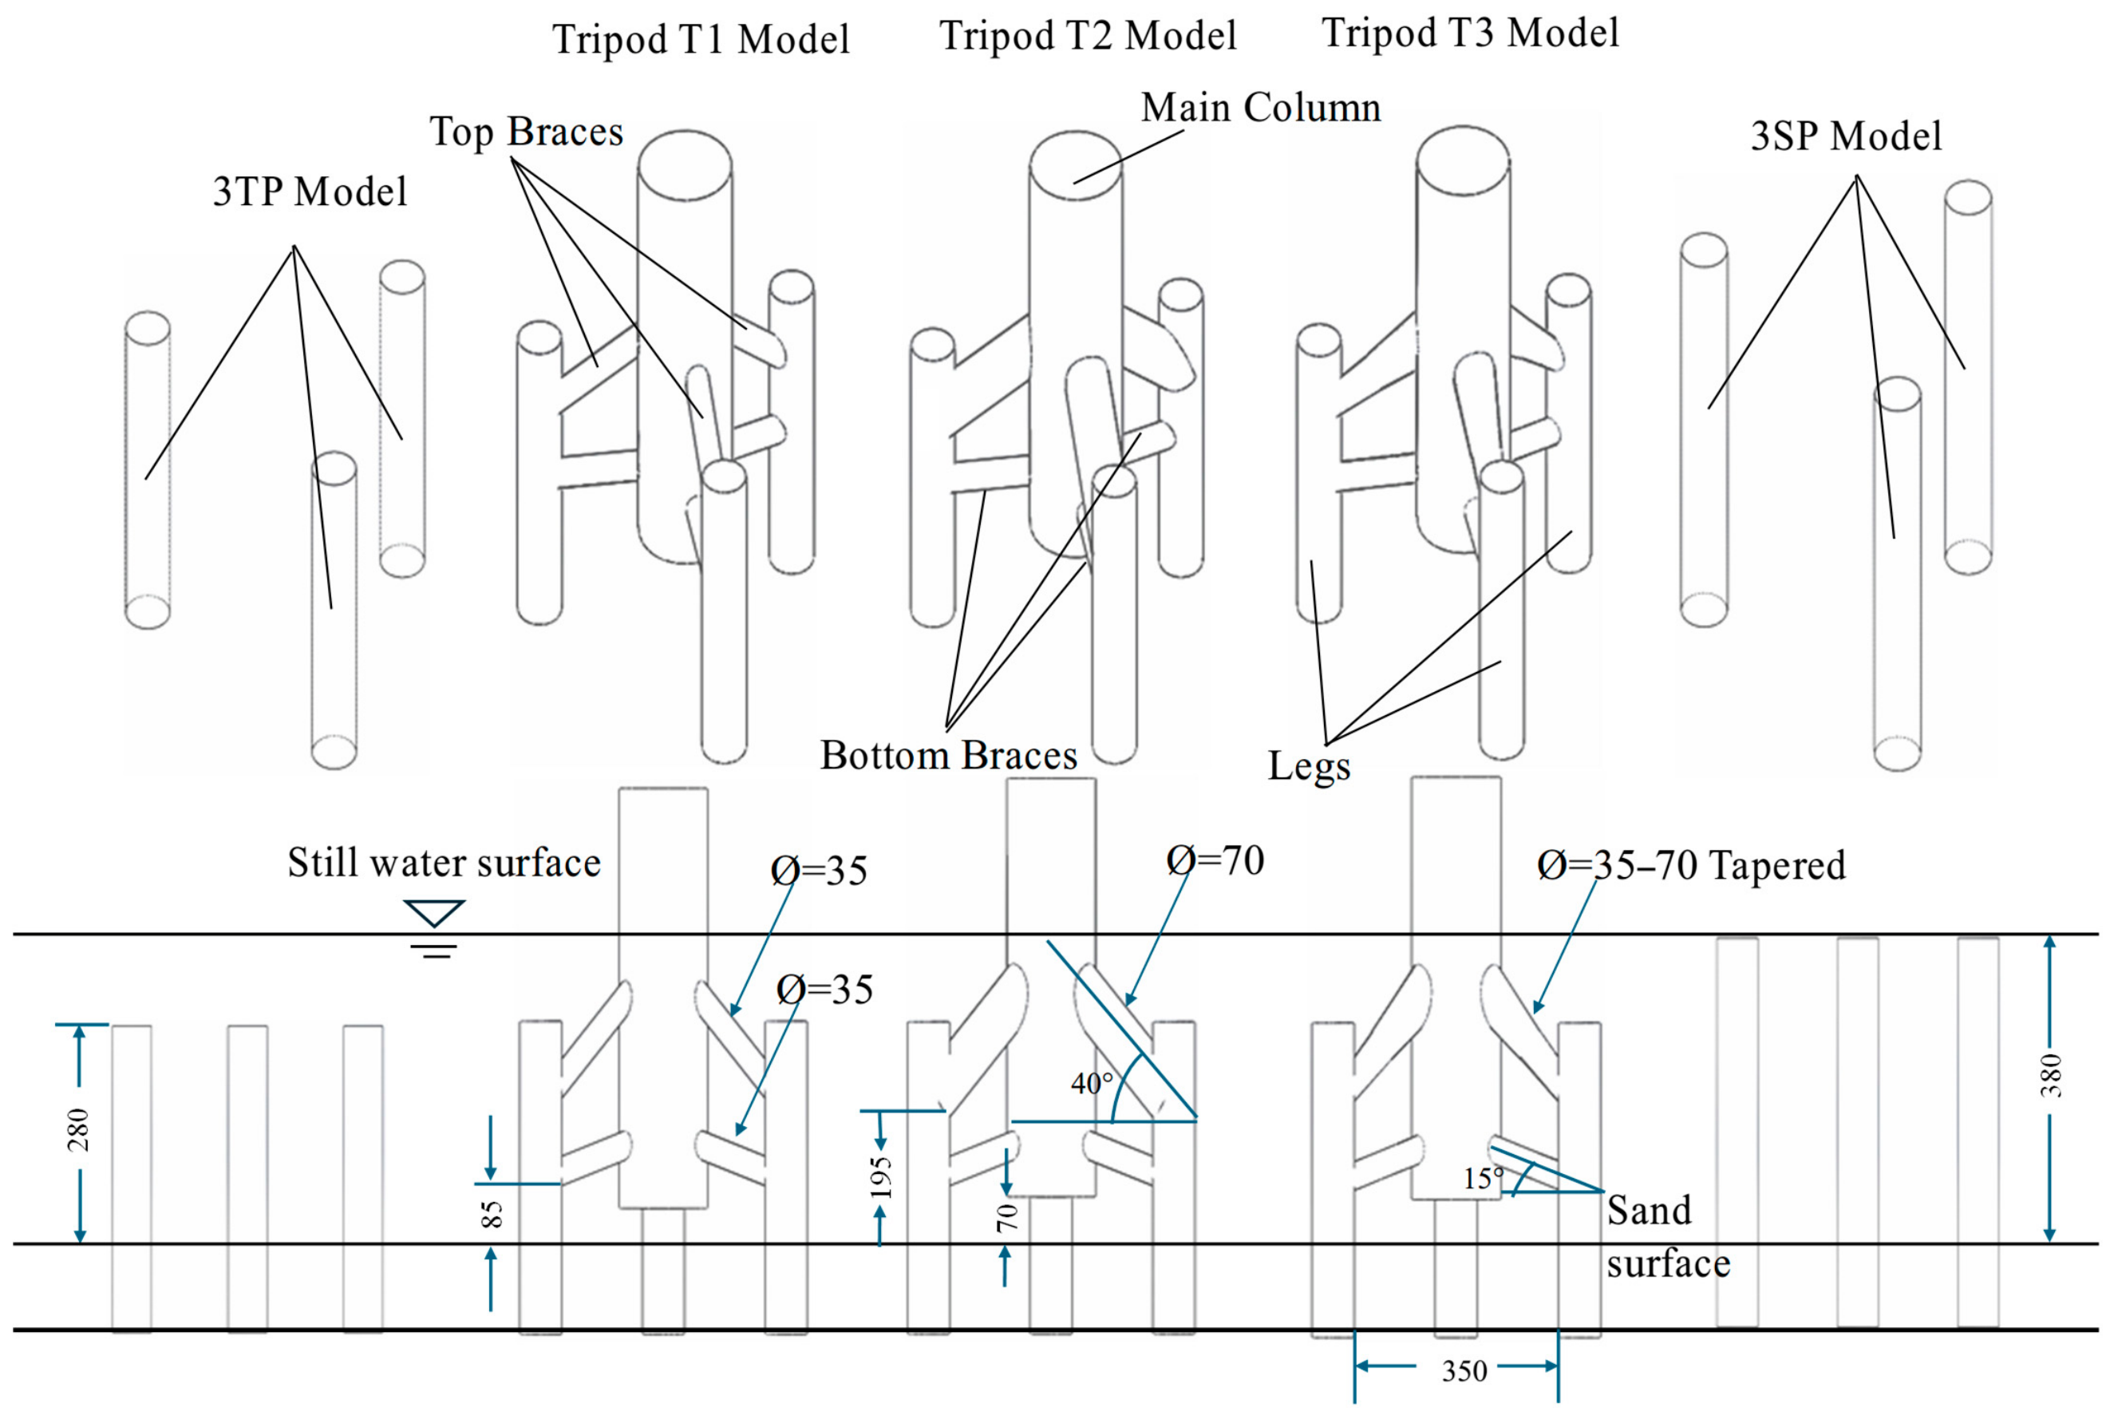
The scour experiments were conducted in an open-channel recirculating water flume at Western Sydney University. The flume has a total length of 16 m, a width of 1 m, and a total depth of 0.8 m. The 3.65 m-long test section has a 1 m-wide, 0.18 m-deep sand basin located 10 m from the inlet. The distance between the model and the upstream edge of the sand basin is 1.5 m. To minimise turbulence intensity and secondary currents, two flow straighteners are installed in series at the inlet of the flume. Figure 2 shows the three tripod models studied in this work, referred to as T1, T2, and T3, respectively. The three tripods share the same main columns and bottom braces but differ in their top braces. The diameter of the top braces of T2 is twice that of T1, while T3 has tapered top braces, whose larger and smaller diameters are the same as the braces of T2 and T1, respectively. To further investigate the combined effects of the braces and the main column on the scour, two additional models are used: (1) 3TP: a model with only three legs, i.e., three truncated piles whose sizes are the same as the three legs of a tripod and (2) 3SP: a model with three simple piles whose height is equal to the water depth. All five models are summarised in Table 1. The model legs and main column were made of acrylic cylinders, while the braces were 3D printed. The final model is fabricated using strong acrylic glue and made in a way that can be divided into an upper and a lower half, making it easier to do the final bed scan.
Figure 2.
3D and 2D schematics of 3TP, 3SP and three tripod models. Top row: three-dimensional parametric view; bottom row: side view (all dimensions are in mm).
Table 1.
List of tested models and major dimensions.
Tripod model dimensions are adopted: (1) to mimic the actual geometry of tripod foundations used in offshore installations with the essential structural elements; (2) to keep the blockage in the flume to a minimum while maintaining the attainment of maximum scour. Non-dimensional scour depth (S/D) based on the leg diameter D is adopted for analysis, making the results applicable for actual foundations installed under a similar Froude Number (Fr) of 0.21, which indicates a subcritical flow region.
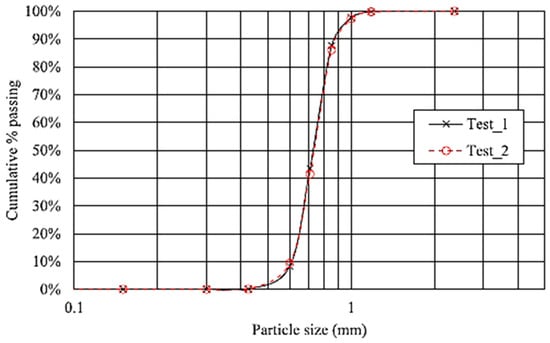
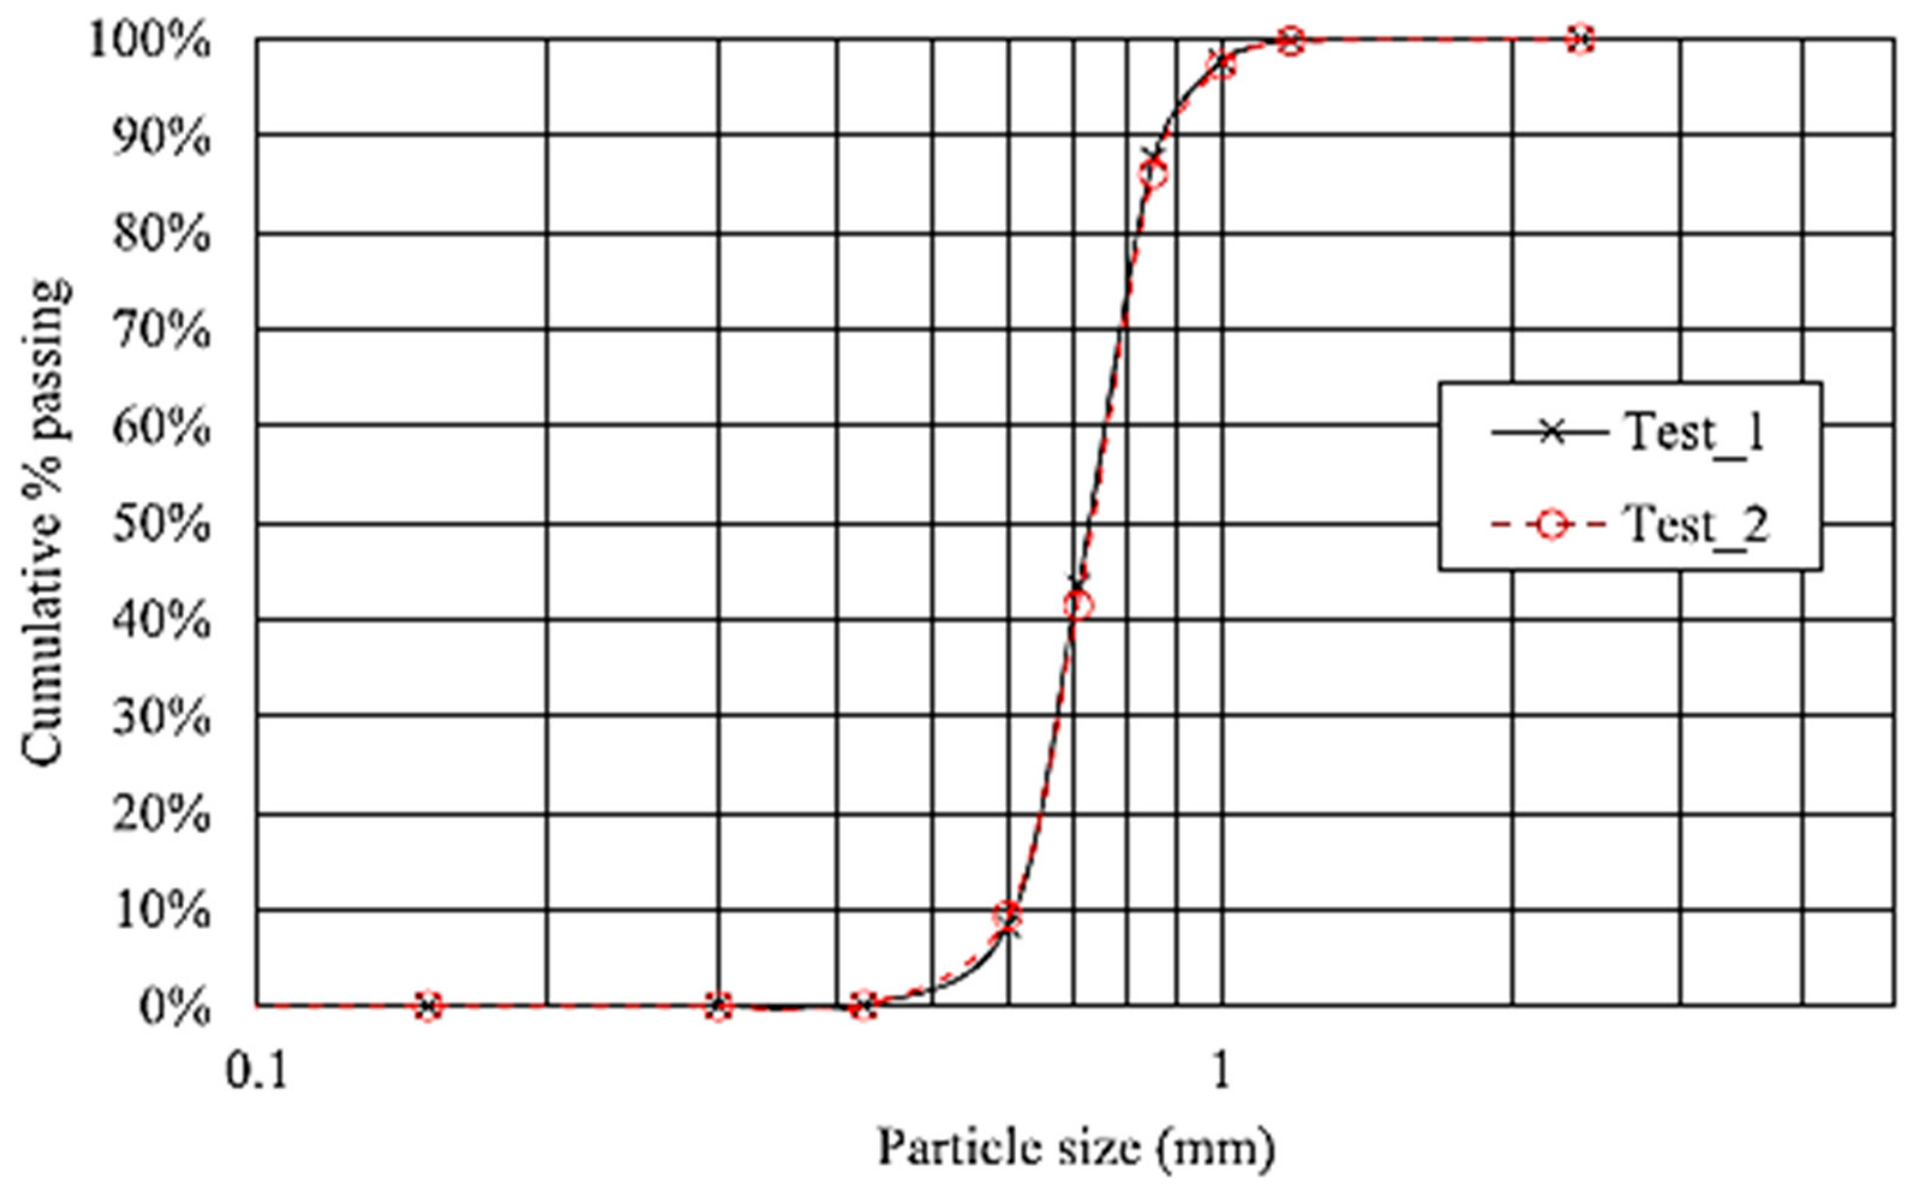
All tests were conducted under steady-current conditions, with a constant water depth (h) of 0.38 m and a constant depth-averaged flow velocity (U) of 0.40 m/s. The Froude number, defined as is approximately 0.21, indicating subcritical flow conditions. A Vectrino Profiler acoustic Doppler velocimeter (Nortek AS, Rud, Norway) was placed right above the sand bed to record the incoming flow velocity. The particle size distribution of the sand is shown in Figure 3. The sediment used consisted of sand with a median particle size (d50) of 0.73 mm (Figure 3) and a geometric standard deviation ) of 1.15, indicating uniform sediment gradation [27,38]. Initial bed thickness was maintained at 0.18 m. The flow and sand parameters are summarised in Table 2.
Figure 3.
Grain size distribution of the sand used in the study (two repeated tests obtained the same result).
Table 2.
Flow and sand parameters adopted for the study.
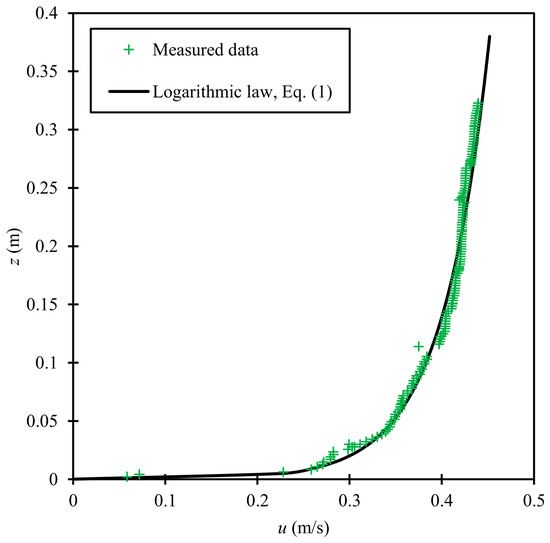
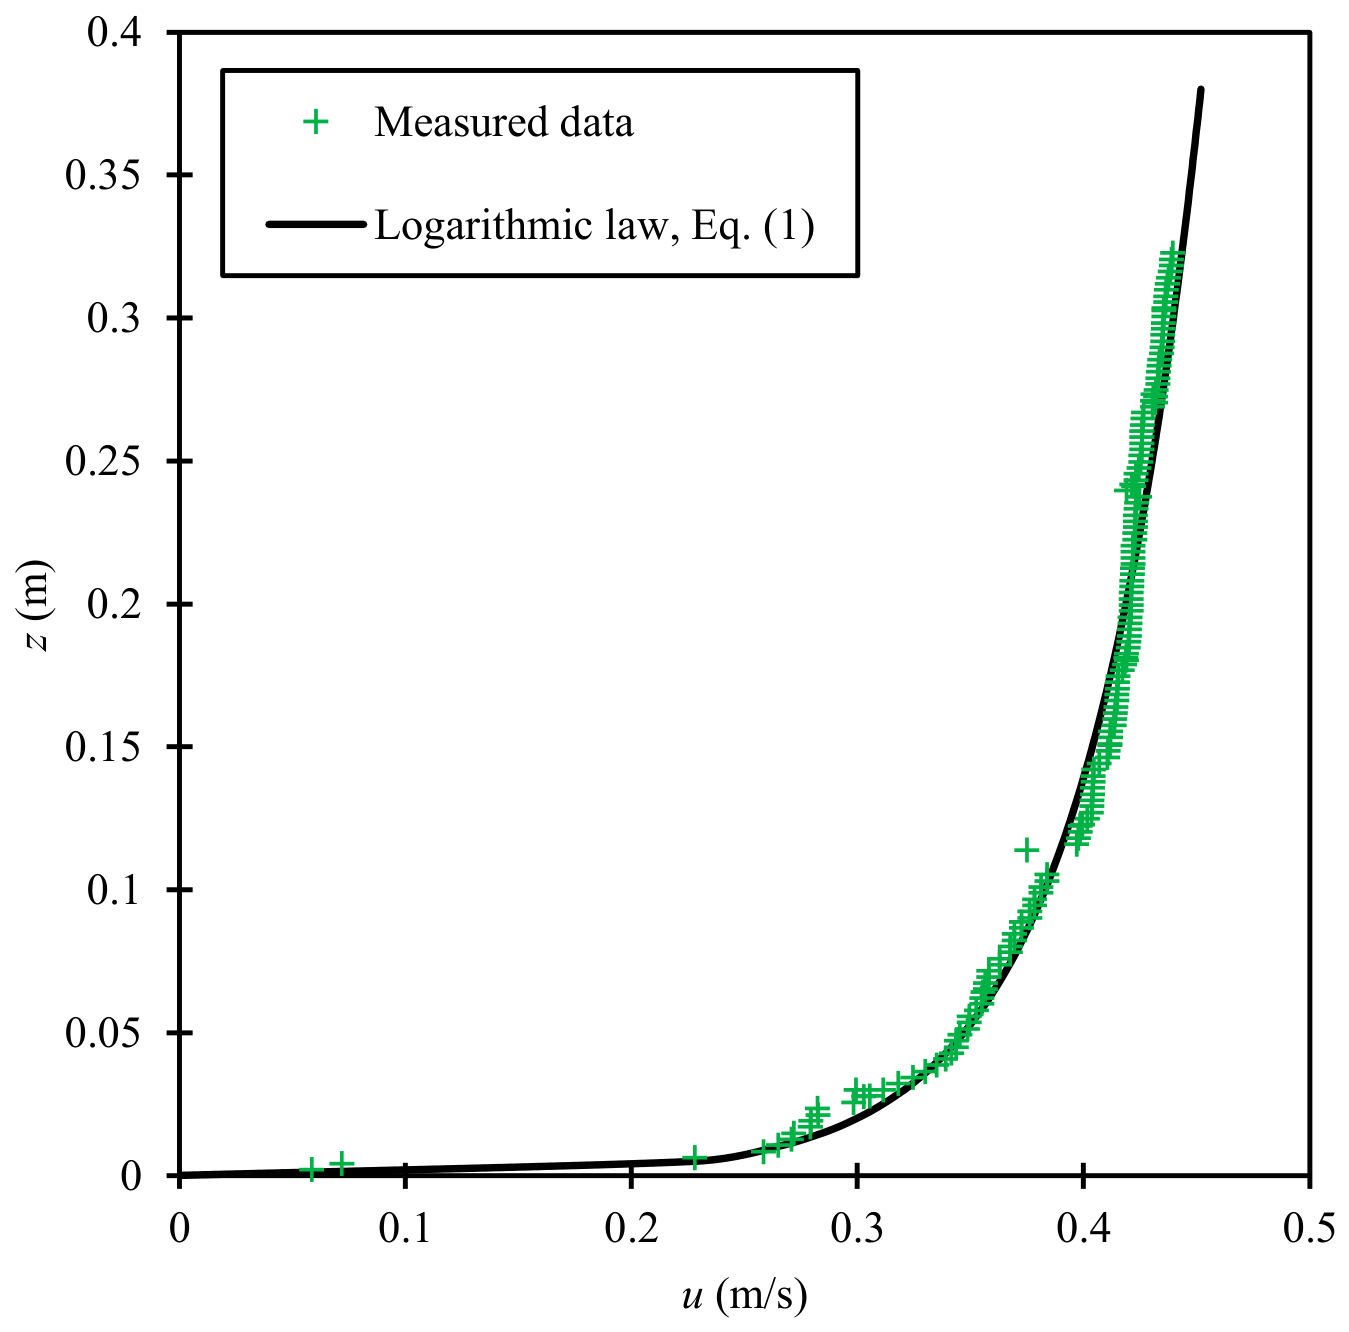
A Cartesian coordinate system, Oxyz, is defined with its origin located at the centre of the main column, horizontally, and at the unscoured sand surface level, vertically; the x-direction follows the flow direction, and the z-direction points upwards. Figure 4 shows the agreement between the measured velocity (u) and the logarithmic velocity profile:
where uf is the friction velocity defined as , the Von Kármán constant (κ) = 0.41, water depth above the sand bed (z) with datum z = 0 at the sand bed and the roughness length (z0) is z0 = d50/12. The best agreement between the measured and logarithmic velocities was achieved at uf = 0.0212 m/s. As per the velocity profile, the shear stress τs developed on the bed due to flow is related to the depth-averaged velocity (U) as proposed by [39]:
where Cd is the friction coefficient, which is calculated by:
τs = ρCdU2
Figure 4.
Measured streamwise velocities along the water depth and logarithmic profile fit.
The Shields parameter θs is defined as:
The value of θs for the given experimental flow conditions is 0.039. The critical Shields parameter for erosion θcr = 0.030 is calculated using the empirical formula proposed by [39]:
where the non-dimensional sand particle size , and ν = 1×10⁻⁶ m2/s is the kinematic viscosity of water at 20 °C. The ratio θs/θcr is 1.29 in this study, which is above the threshold for a clear-water-to-live-bed scour regime. All the experimental, sediment, and flow parameters are listed in Table 2. The pump capacity of the water flume is sufficient to generate a flow velocity that is slightly greater than the critical value at the water depth listed in Table 2. Further increase in the water depth would result in clear water scour. The ratio of water depth to the main column diameter is h/Dc≈2.5, which is smaller than the water depth in practice. The scour depth is almost independent of h/D if this ratio is greater than 2.5 for a monopile [40].
The characteristic leg diameter “D” was adopted for normalisation instead of the main column diameter Dc for the following reasons: (1) 3TP and 3SP models have no main column, so the analysis will be consistent; (2) the main column is not embedded into the sand bed, hence its contribution to scour depth is due to a different scour mechanism as compared to the established horseshoe vortex formation at the base of an embedded pile.
Marked grids were attached to the inner side of each leg, which is hollow with a transparent wall, and an Insta360 GO3 camera (Insta360, Shenzhen, China) was used to record video from the inner side of each leg. The scour readings were taken at 4 measuring points around each leg: the most upstream point, the most downstream point and the two side points corresponding to 0°, 180°, 90°, and 270°, respectively. Scour development was monitored using the internal camera, with scour-depth readings obtained at t = 0, 5, 10, 15, 20, 25, 30, 40, 50, 60, 70, 80, 90, 100, 120, 140, 160, 180, 210, 240, 270, 300, 330, and 360 min. The shorter sampling intervals during the initial stage were selected to capture the rapid development of scour, while progressively longer intervals were adopted as the scour rate decreased. Scour depth was determined from the camera recordings using a graduated reference scale with a minimum graduation of 1 mm; accordingly, the uncertainty of the camera-based scour-depth readings was conservatively taken as ±1 mm. The angular positions of the measuring points are indicated in Figure 1.
The measurement uncertainty is about ±1 mm, which is less than 2% of the maximum scour depth recorded in most cases, indicating that it did not affect the qualitative results. The scour at t = 6 h has not reached equilibrium, but the temporal development of the scour depth exhibits asymptotic behaviour. Sumer and Fredsøe [40] proposed an empirical formula for predicting the time history of a monopile:
where Se is the equilibrium scour depth and T is the time scale, which is defined as:
where Lc is the characteristic length of the structure, which is the diameter of a monopile. For a boundary layer flow, the non-dimensional time scale T∗ is related to the boundary layer thickness and shear stress parameter as [41]:
where δ is the boundary layer thickness, which is equal to the water depth for a fully developed boundary layer. The time scale T increases with an increase in the characteristic length Lc based on Equation (7). Considering that the flow is a fully developed boundary layer flow in this study and using the largest horizontal dimension Lc = G + 2D = 0.49 m, the scour time scale is T = 24.6 min, and the time for the scour to reach 95% of the equilibrium scour depth is 73.6 min (=1.22 h). Based on the above calculation, a time of t = 6 h is sufficient for the scour to reach more than 95% of the equilibrium scour depth. Please note that this is an approximation, as the empirical formula of a simple monopile has been used to predict the scour depth of a much more complex case. Because the main objective of the study was to assess the effects of geometrical complexity and angle of attack, we did not aim to reach equilibrium scour depth. Instead, many cases were conducted for a fixed duration to ensure a reasonable comparison.
The following procedure was adopted to complete each experiment:
- The initial sediment bed was flattened, and the tripod model was then installed in the middle of the sediment bed. The models were rigid, stationary, and placed firmly in the sand bed. No gravity load due to the superstructure and no lateral loads due to wind will affect the scouring.
- Water was pumped into the flume to the tested water depth. Initially, the flow rate was kept very slow to prevent initial bed disturbance.
- Once the water depth reached the desired level, the flow velocity was increased to the target value by increasing the pump speed, and the scour experiment started. Scour depths around legs were recorded at predefined time intervals.
- At the end of each test, water was drained, and the bed was scanned using a high-resolution 3D LED scanner EinScan Pro 2X Plus (Shining 3D, Hangzhou, China), with a resolution of 0.05 mm [27,28]. To gain a detailed understanding of the scour process at the initial stages, the bed profiles of tripod T3, as the representative model, at 1 min, 5 min, 15 min, and 60 min for all three angles of attack are scanned.
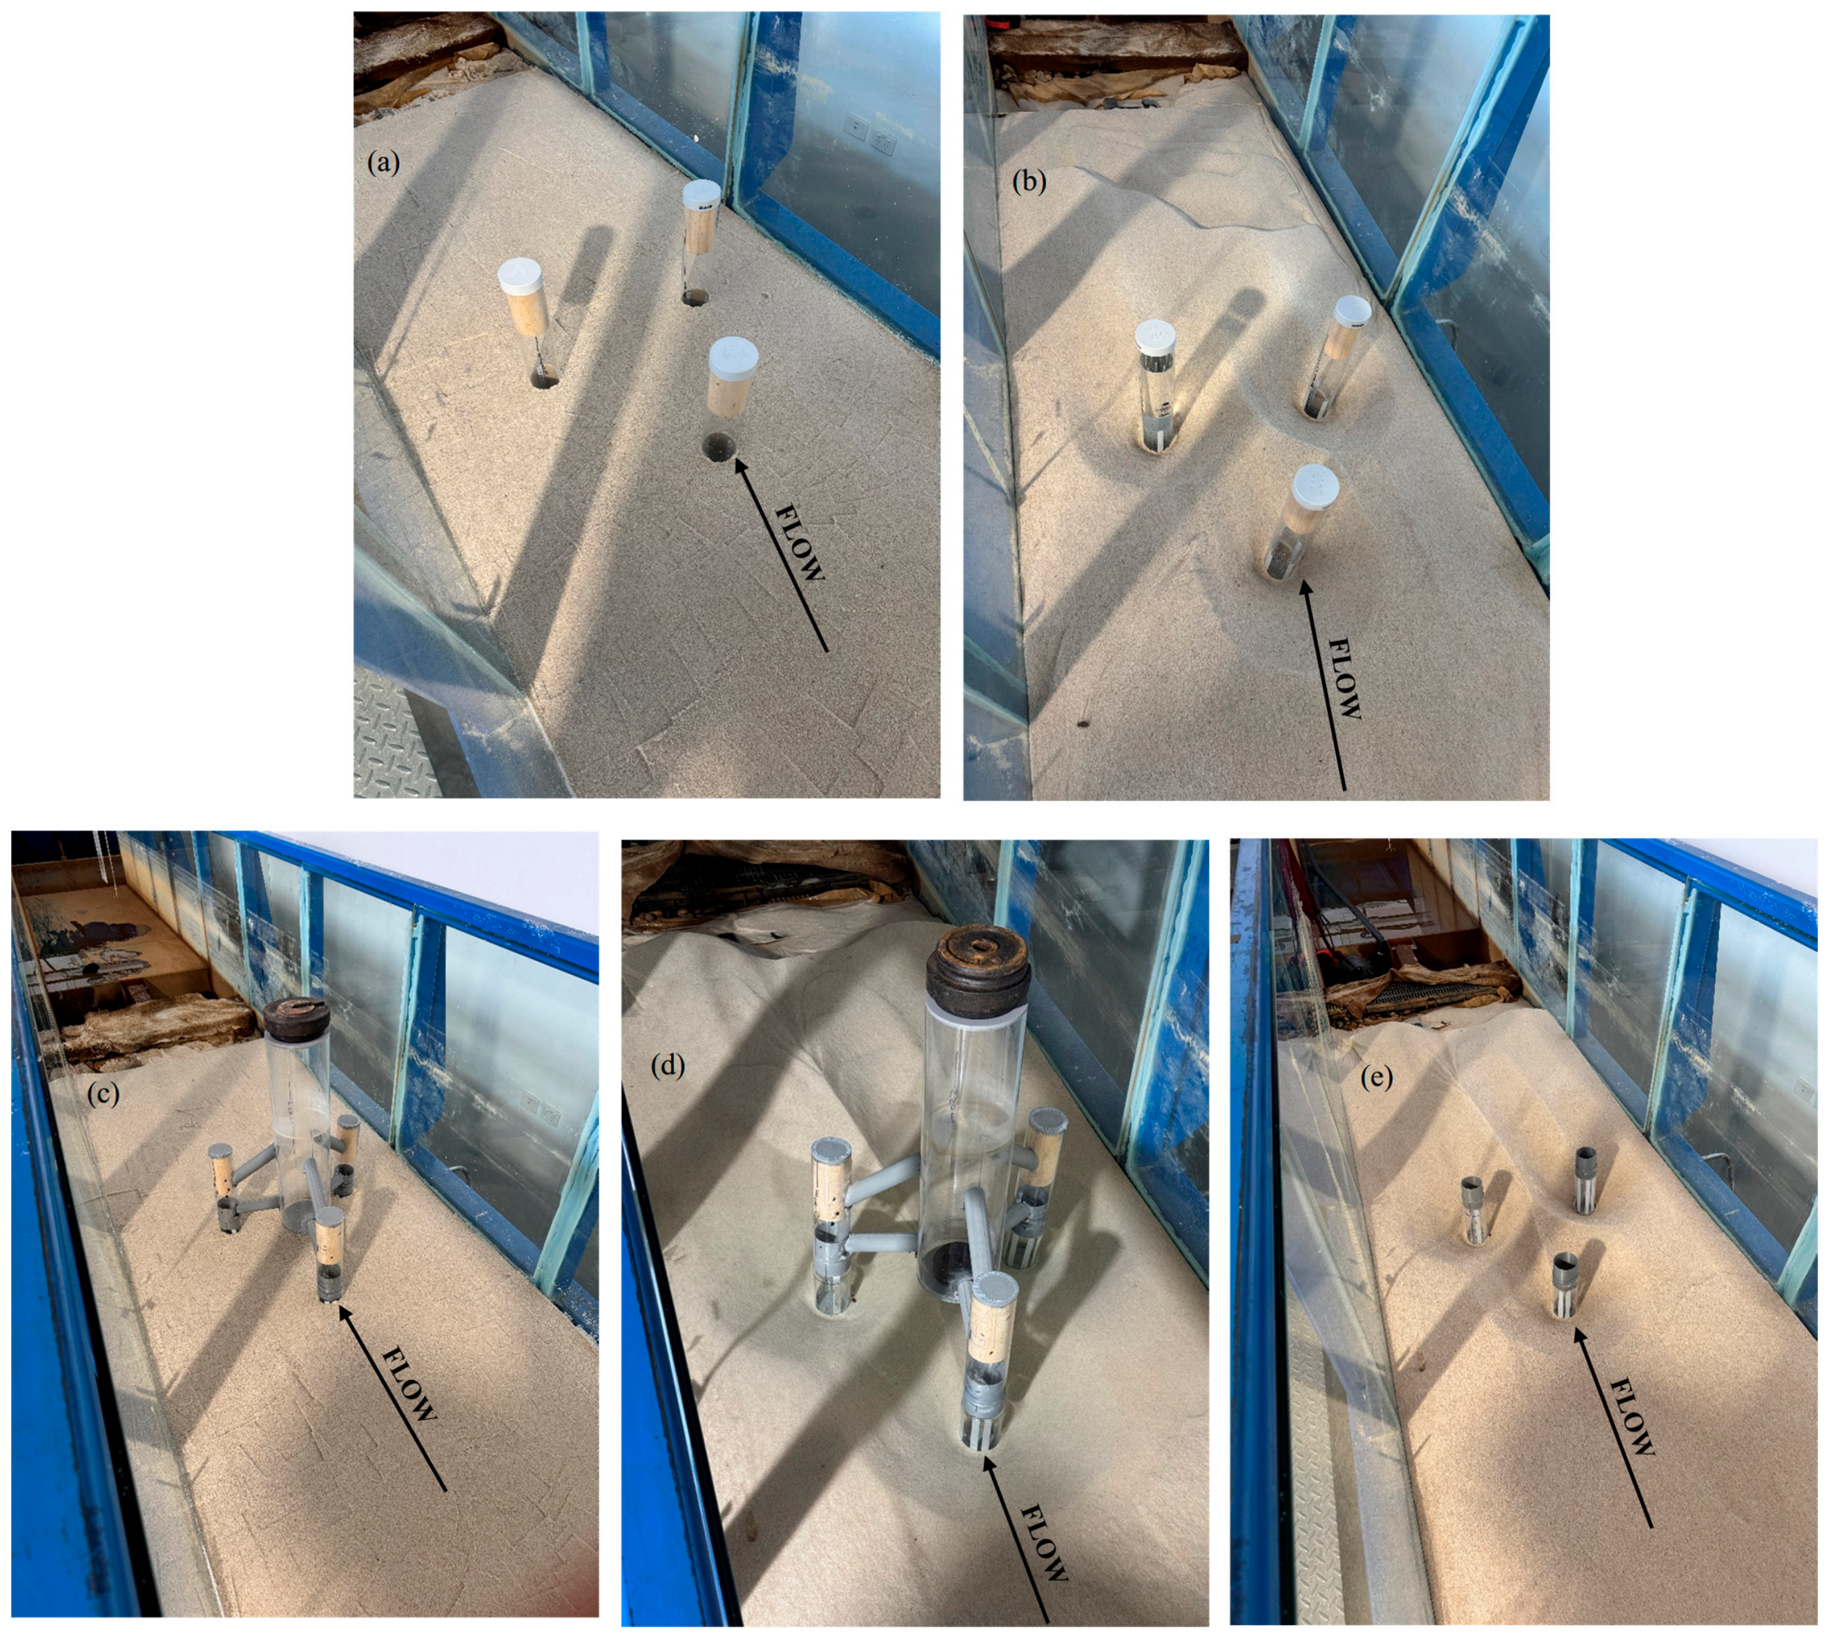
Figure 5 shows the placement of a 3TP and a tripod model T1 in the test section and the eroded bed after the tests. It shows the formation of three distinct scour holes around each leg and a jointly eroded region between the legs and underneath the main column of the tripod. The scour is concentrated around the structure, while very limited grain movement or bed-load transport was observed outside the foundation during the experiments, as the Shields parameter ratio was slightly above the threshold for sediment motion initiation.
Figure 5.
(a) 3TP model placed in test section. (b) Eroded bed after test of 3TP model. (c) Tripod model placed in the test section. (d) Eroded bed after test of tripod model. (e) Tripod model with upper part removed for 3D bed scanning.
3. Results and Discussion
3.1. Scour Profiles at 6 h of Scour
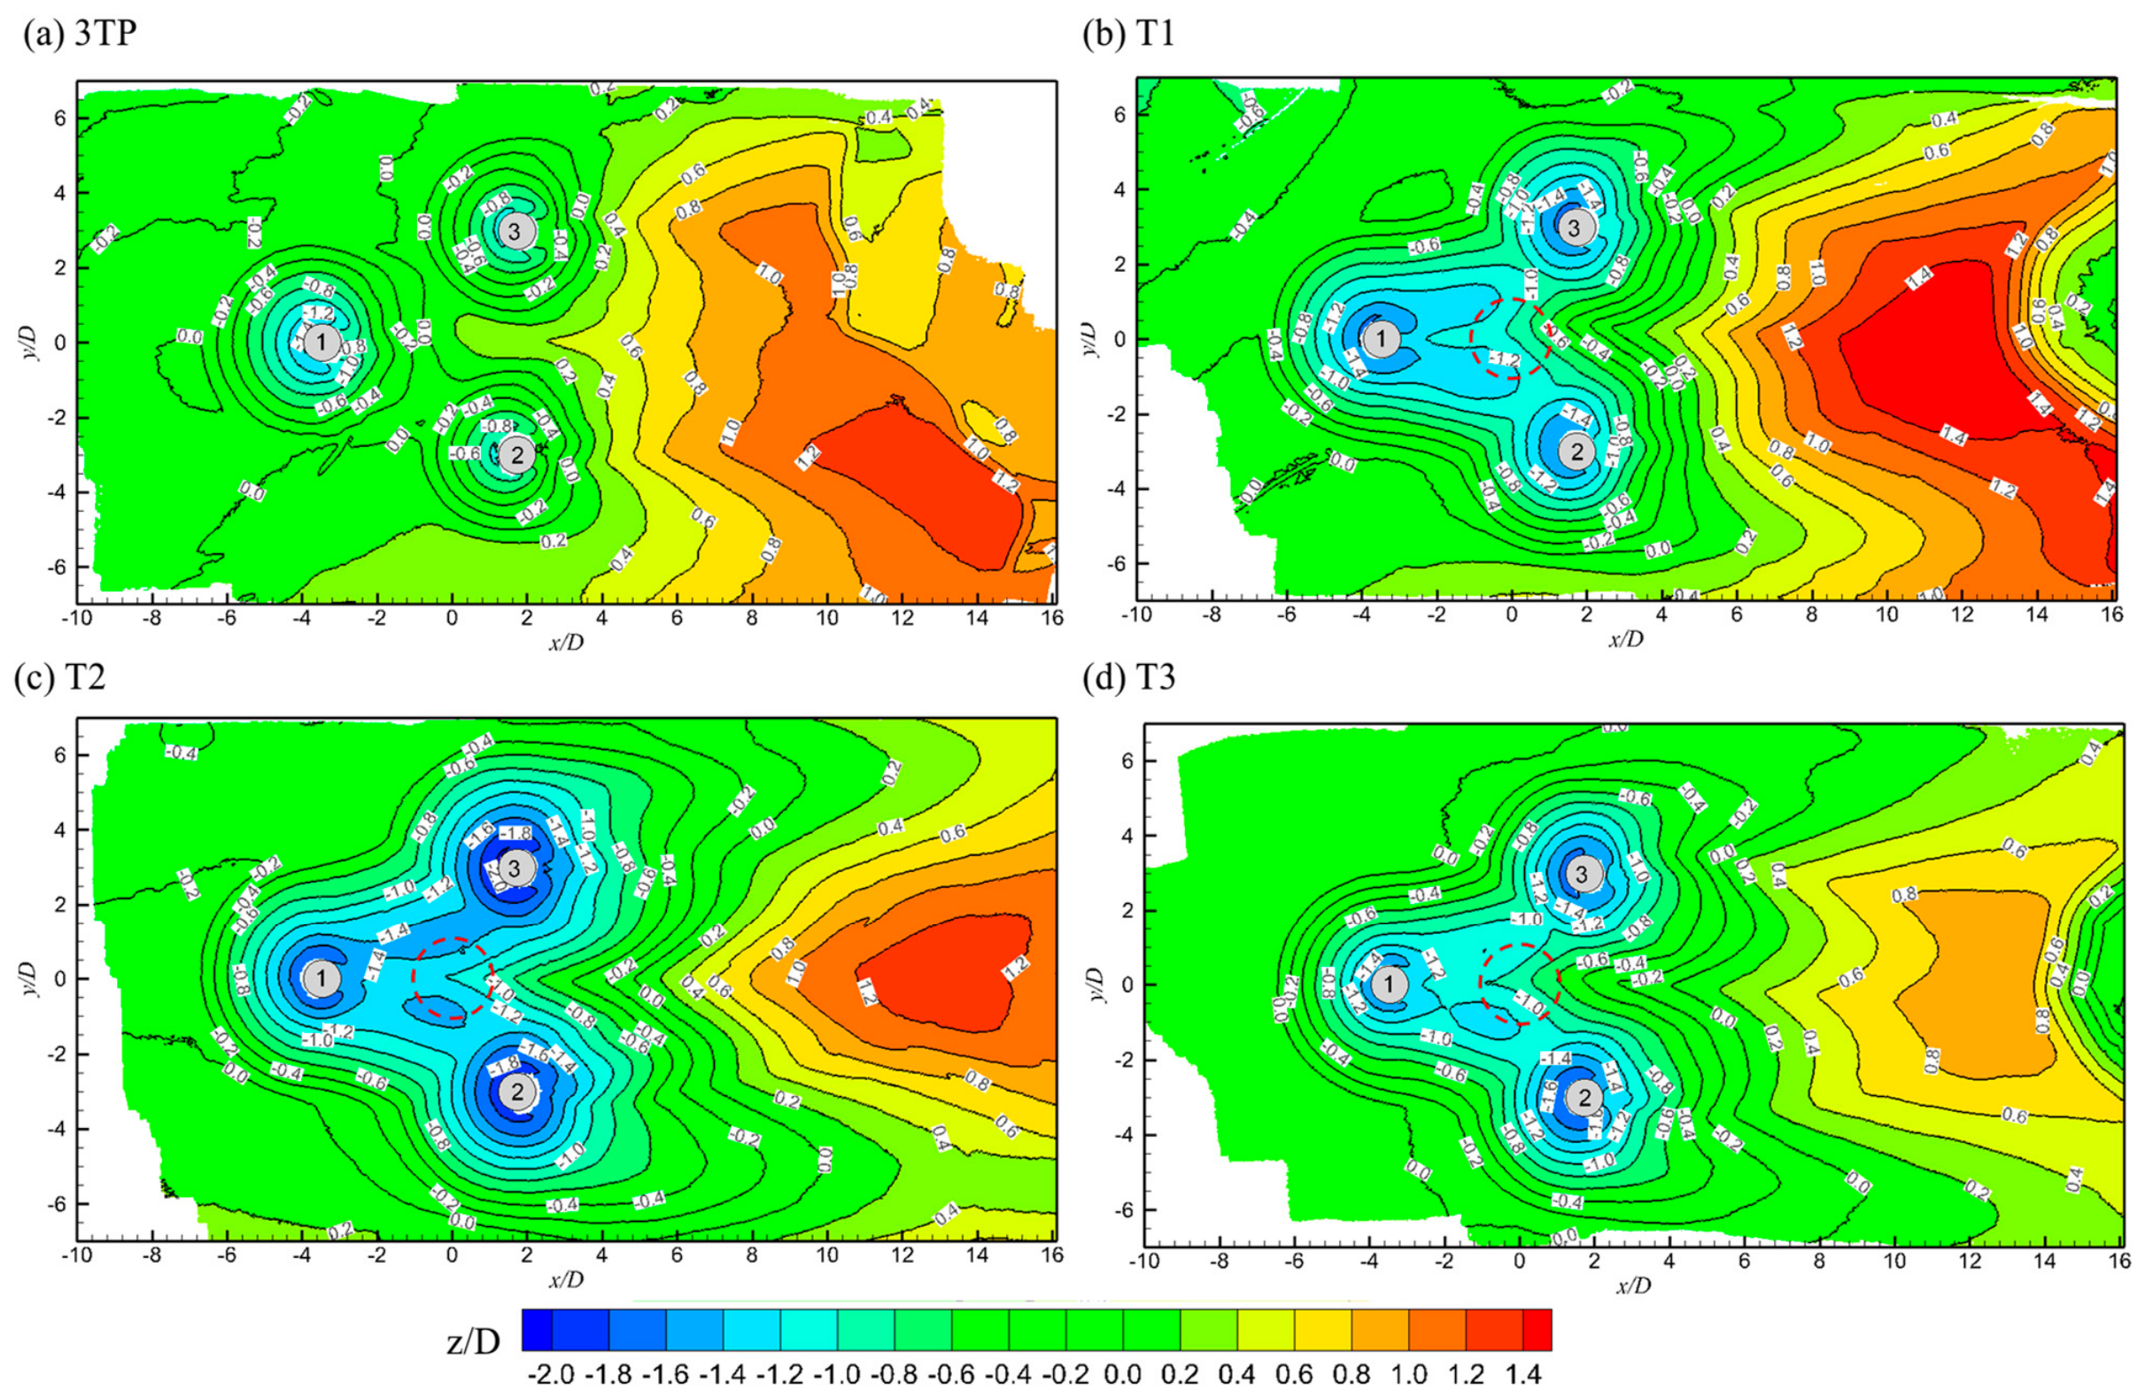
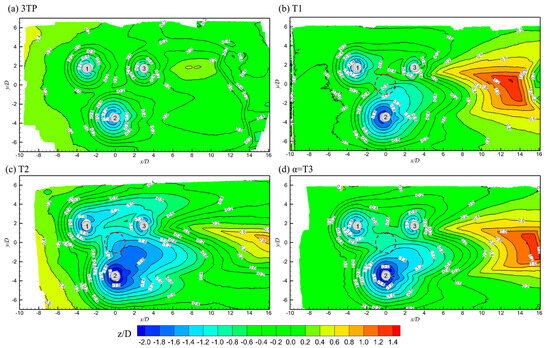
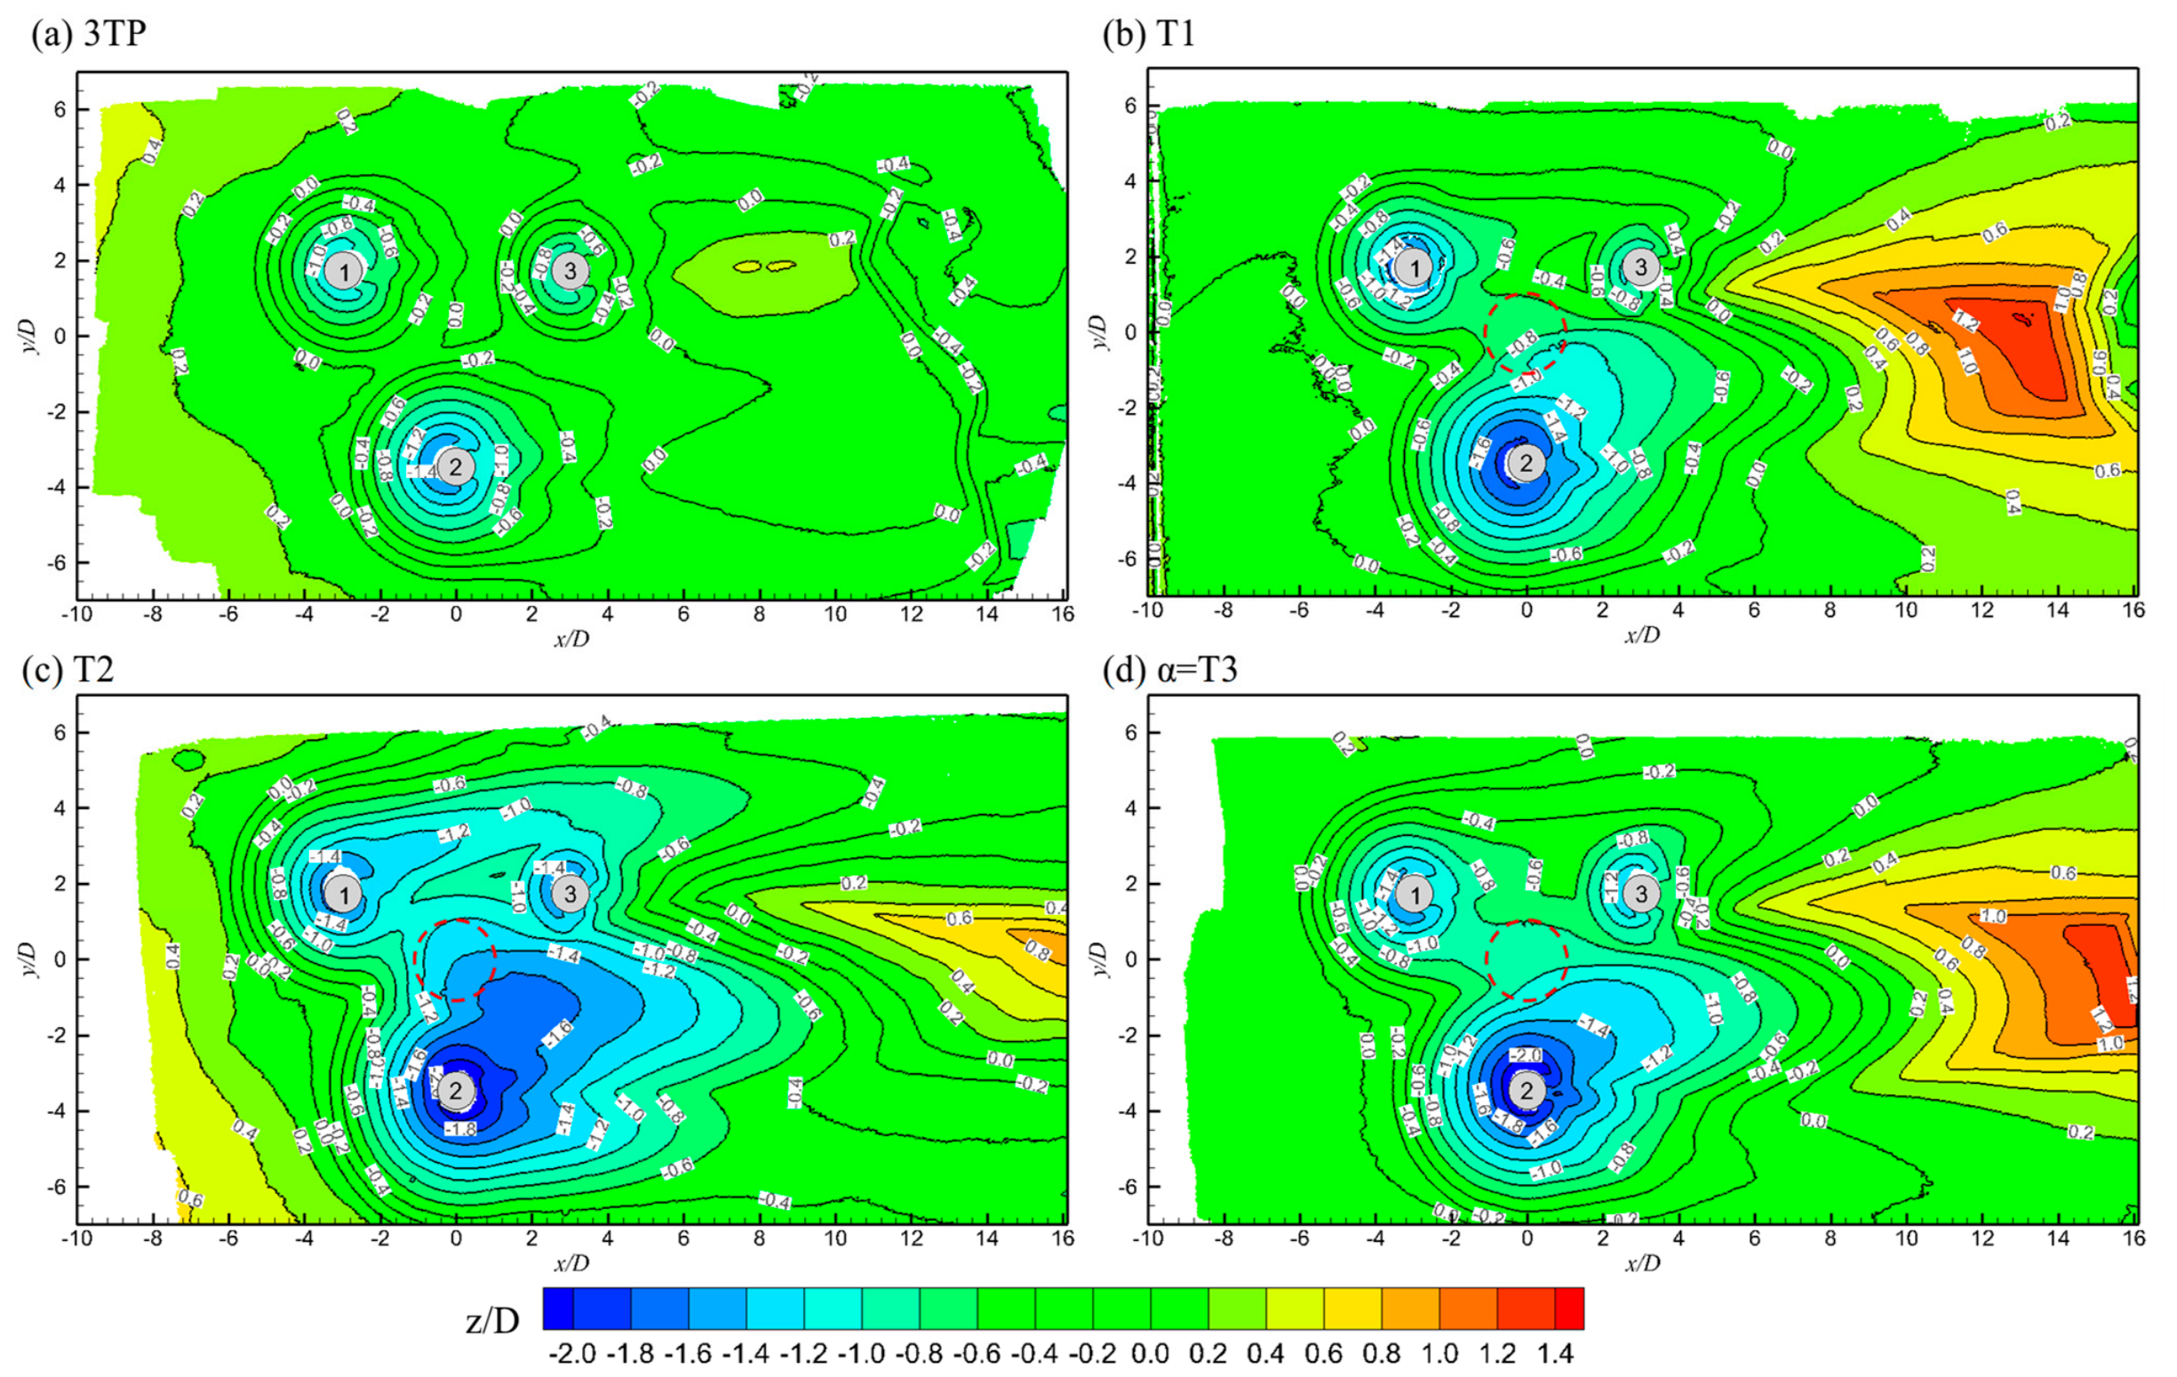
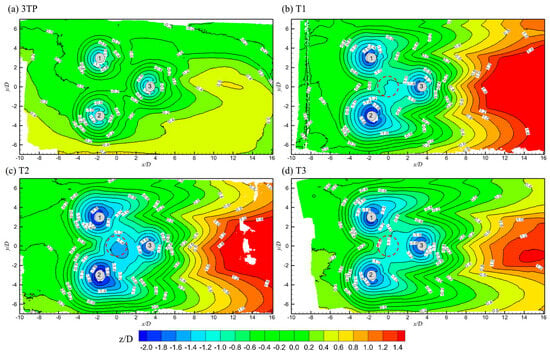
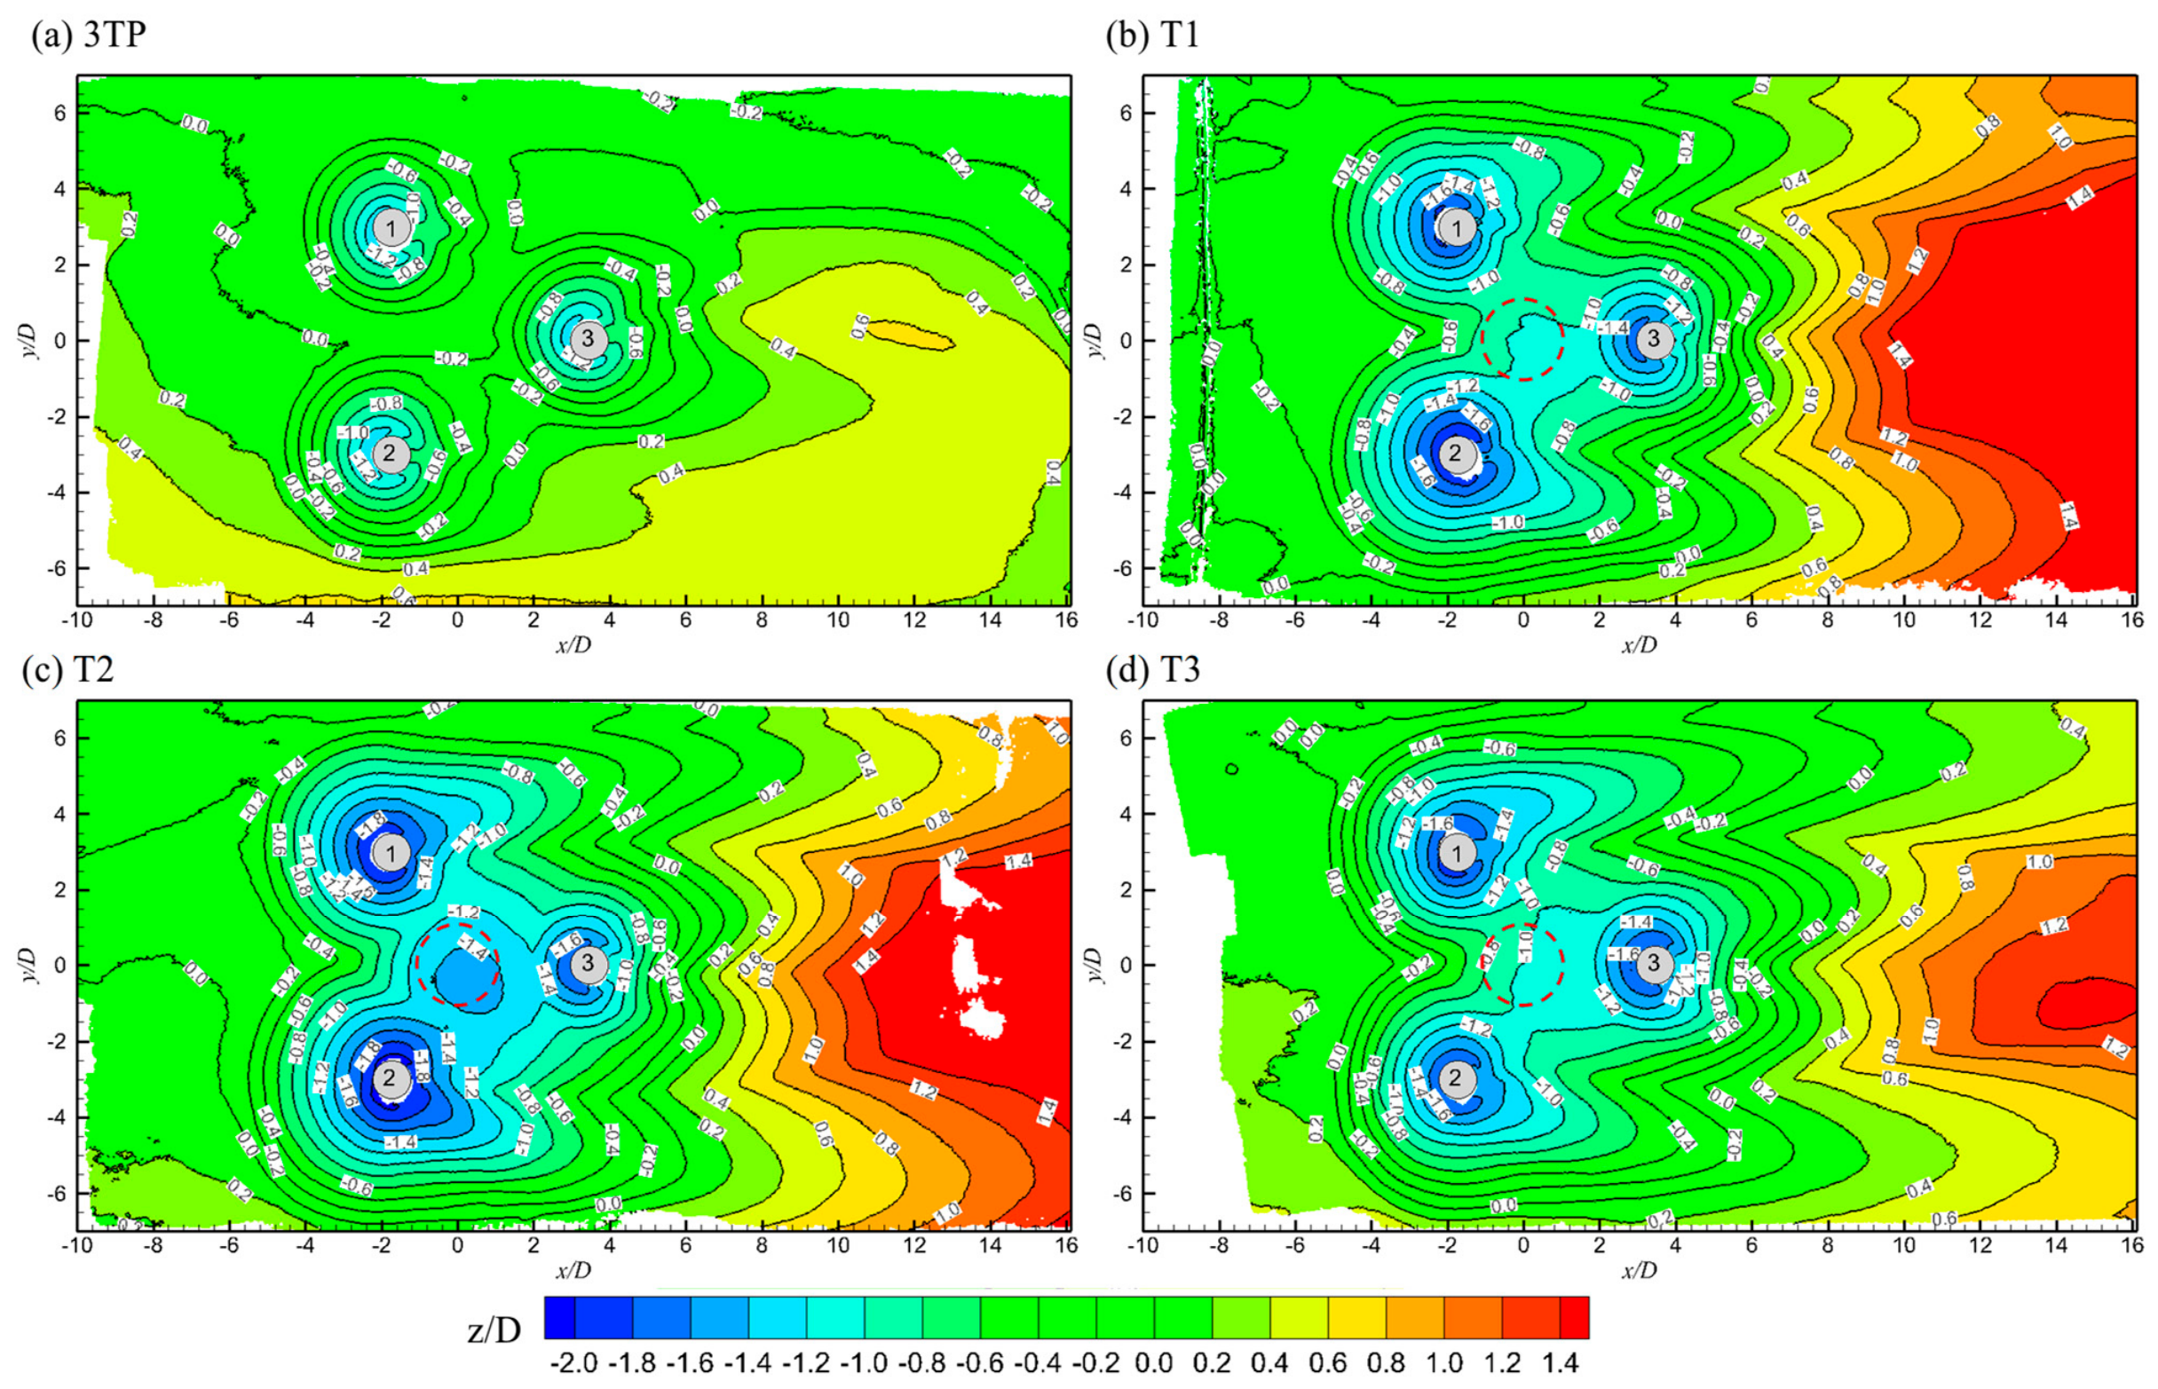
Figure 6, Figure 7 and Figure 8 show the scanned bed profile presented by the contours of the sand surface level at 6 h of scour for three angles of attack, α = 0°, 30° and 60°, respectively. Non-dimensional sand bed level (z/D), measured from the flat sand bed, is used to compare the bed morphologies of all the cases. For each angle of attack, the three scour pits around the three isolated truncated piles in model 3TP are almost independent of one another. Qi et al. [11] reported that the group effect on the scour of two piles under various arrangements is negligible as the pile-to-pile gap is greater than 3 diameters. The grouping effect was weak in the experiments of scour around three piles with a spacing ratio of 5 [19]. The interaction among the three truncated piles in the 3TP case is weakest across all investigated angles of attack. Under all angles of attack, the scour depth at the centre of the triangular arrangement (x, y) = (0, 0) is nearly zero, indicating very weak overlap between the three scour holes.
Figure 6.
Contours of scour profiles 6 h after scour at angle of attack of α = 0°.
Figure 7.
Contours of scour profiles 6 h after scour at angle of attack of α = 30°.
Figure 8.
Contours of scour profiles 6 h after scour at angle of attack of α = 60°.
At t = 6 h, the maximum scour depth across the tripods, below the centre of the main column of T1, T2 and T3, is Sc/D = 1.01, 1.19 and 0.91 at an angle of attack of α = 0°, respectively. Underneath the main columns of T1 to T3, significant scour is observed, but the scour depth is smaller than the scour depth around the three legs. The scour below the main column is affected not only by the diameter of the column but also by the size of the three bottom braces. In the study conducted by Yuan et al. [14] where the geometry of the tripod is close to that of the tripods in this study, the scour depth under the main column is about 30% smaller (as measured from their curves) than that under the legs, consistent with the current observation. In the experiments by [2], where the leg spacing is about 8.6D, and the diameter of the bottom braces is only D/3, the scour depth below the main column is negligibly smaller than that below the three legs. The much larger bottom braces in the experiments of Hu et al. [3] caused the scour depth below the main column to exceed that of the legs.
Compared with model 3TP, which does not have a main column or braces, the scour depths of the three legs of tripods T1 to T3 are significantly increased, indicating the significant impact of the braces and main column. At α = 0°, the scour depths of the two downstream legs are slightly deeper than the upstream leg in all four cases (Figure 6). At this angle of attack, either legs 1 and 2 or legs 1 and 3 are equivalent to two piles arranged in a skewed arrangement. It has been reported that the downstream pile has a deeper scour depth than the upstream pile when two truncated piles are in a staggered arrangement [27]. In addition, the velocity acceleration below the main column also contributes to the enhancement of the scour of the two downstream legs. The three tripod models have the same bottom braces but different top braces. Although their elevation is high (about 2.8D above the sand surface), the size of the top braces still significantly affects the scour depth. The observed effect of brace size on near-bed scour is interpreted as an indirect consequence of brace-induced modification of the overall three-dimensional flow field rather than direct interaction between the braces and the sediment bed. It redistributed the flow between the main column and supporting legs, and an increase in upper brace size intensified the flow alteration. The largest size of the top braces of T2 results in the deepest scour. T3 has tapered-top braces whose lower diameter matches the top brace diameter of T1. Its scour depths are close to T1, indicating that the scour is mainly affected by the brace size close to the bottom.
The angle of attack α = 30° has its maximum scour depth at leg 2 in Figure 7 for all four models, which is deeper than the maximum scour depth of the other two angles of attack. This is consistent with other studies of the tripod foundation [2,14]. At a 30° angle of attack, legs 1 and 3 are arranged in tandem, and due to the shielding effect, the downstream leg 3 has a shallower scour depth than leg 1 [28,42,43]. At α = 30°, the scour depths below the main column are about 0.56, 1.39 and 0.94 for T1, T2 and T3, respectively. Leg 3 has much more deposition in its wake than leg 2 because of the smaller wake velocity behind it. Severe scour at leg 2 is due to the absence of any protection from the upstream leg and flow amplification due to exposed braces directly deflecting the flow towards leg 2.
At α = 60°, the downstream leg 3 has a shallower scour depth than T1 and T2, mainly because of the blockage of the main column. However, the scour depth of T3 remains greater than that in the 3TP case because flow acceleration through the gap below the bottom end of the main column mitigates the blockage effect. The scour depths below the centre of the main column are approximately 1.04, 1.44, and 1.01 for T1, T2, and T3, respectively.
Comparing Figure 6, Figure 7 and Figure 8, it can be seen that the scour below the 3TP cases is mainly localised around individual legs. In contrast, the scour of cases T1, T2 and T3 is a combination of global scour and three localised maximum scour pits at the three legs, respectively. The scour depths of the three legs of all three tripods are deeper as compared with the case of 3TP, indicating that the size of the top braces and presence of bottom braces significantly affect scour depth and should be considered when evaluating scour. Table 3 and Table 4 list the main scour metrics, i.e., the scour depth below the centre of the main column and the eroded sand volume and scour depths at 6 h at four locations (θ = 0°, 90°, 180°, and 270°) around each leg, respectively. For the cases 3TP and 3SP, where there are no main columns or legs, the scour below the main column is the scour depth at the centre (x, y) = (0, 0) of the three-pile system. The eroded sand volume VE is defined as the integration of the volume over the eroded sand surface area, i.e., the area where the sand surface level is negative. Excluding the positive bed-level change (z > 0), corresponding to sediment deposition, VE is calculated by:
Table 3.
Maximum scour depth Sm/D, scour below the main column Sc/D, and eroded volume at 6 h for all the tested models (Rc = Sc/Sm represents the intensity of scour under the main column as compared to the maximum scour depth).
Table 4.
Scour depth S/D at 6 h measured at four angular positions of each leg for all the tested models (see Figure 1 for the definition of position angle (θ)).
The integration is only performed over the eroded area where the bed elevation is negative.
The three-truncated-pile group model (3TP) has only slightly smaller scour depths than the 3SP model because a shorter pile height resulted in smaller horseshoe vortices. The height-to-diameter ratio of the truncated pile in the case of the 3TP model is 4. For a low truncated pile, a decrease in its height weakens the scour depth because the strength of the horseshoe vortex is weakened [44]. It has been found that the scour depth of a truncated pile is the same as that of a simple pile when the height-to-diameter ratio is greater than 4 [15]. The scour depth S/D of the upstream leg of model 3SP and 3TP at θ = 0° are 1.41 and 1.39, respectively. Overall, for tripod models, the scour depths of all three legs of T2 are the deepest because of its largest top braces, and those of T1 are the smallest.
The maximum scour depth of every leg occurs at the most upstream point θ = 0° of the leg, with a small number of exceptions. The location of the scour depths of all legs can also be visualised in Figure 6, Figure 7 and Figure 8. Out of the 45 legs in the total experimental matrix, 13 have their maximum scour depth located at their sides (either θ = 90° or 270°) but only slightly greater than the scour depths at θ = 0°. The maximum scour depths of all these exceptional cases are less than 8% greater than their corresponding scour depth at θ = 0°. For example, the scour depth at θ = 90° of L3 of T1 is about 8% deeper than at θ = 0°. The maximum scour depth for each tripod exceeds that of case 3TP. Compared to case 3TP, the increase in the scour depth of L2 at α = 30° is the largest among all models, T1, T2, and T3. In all the configurations, the most upstream leg is the least affected by the braces and main column.
From Table 3, of the three tripods, T2 has the largest eroded volume, and T1 has the smallest, except at α = 60°, where the eroded volume of T3 is slightly smaller than that of T1. Compared with 3TP, the eroded volume of T2 was increased by 270%, 198% and 198%, at 0°, 30° and 60°, respectively. The eroded volumes of all three tripods are much greater than the values measured in the 3TP cases. The significant increase in the eroded volume of a tripod compared with case 3TP is due to global erosion that encompasses the erosion below the main column. The eroded volume of case 3TP is smaller than that of case 3SP at all three angles of attack, indicating some effect of the pile height on the sand erosion.
3.2. Spatial–Temporal Development of Scour in the First Hour of the Test
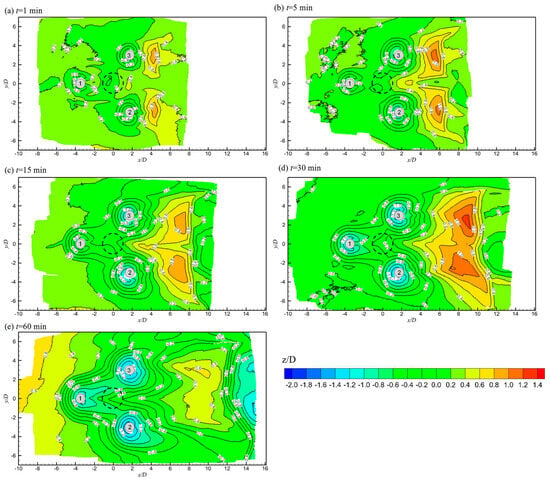
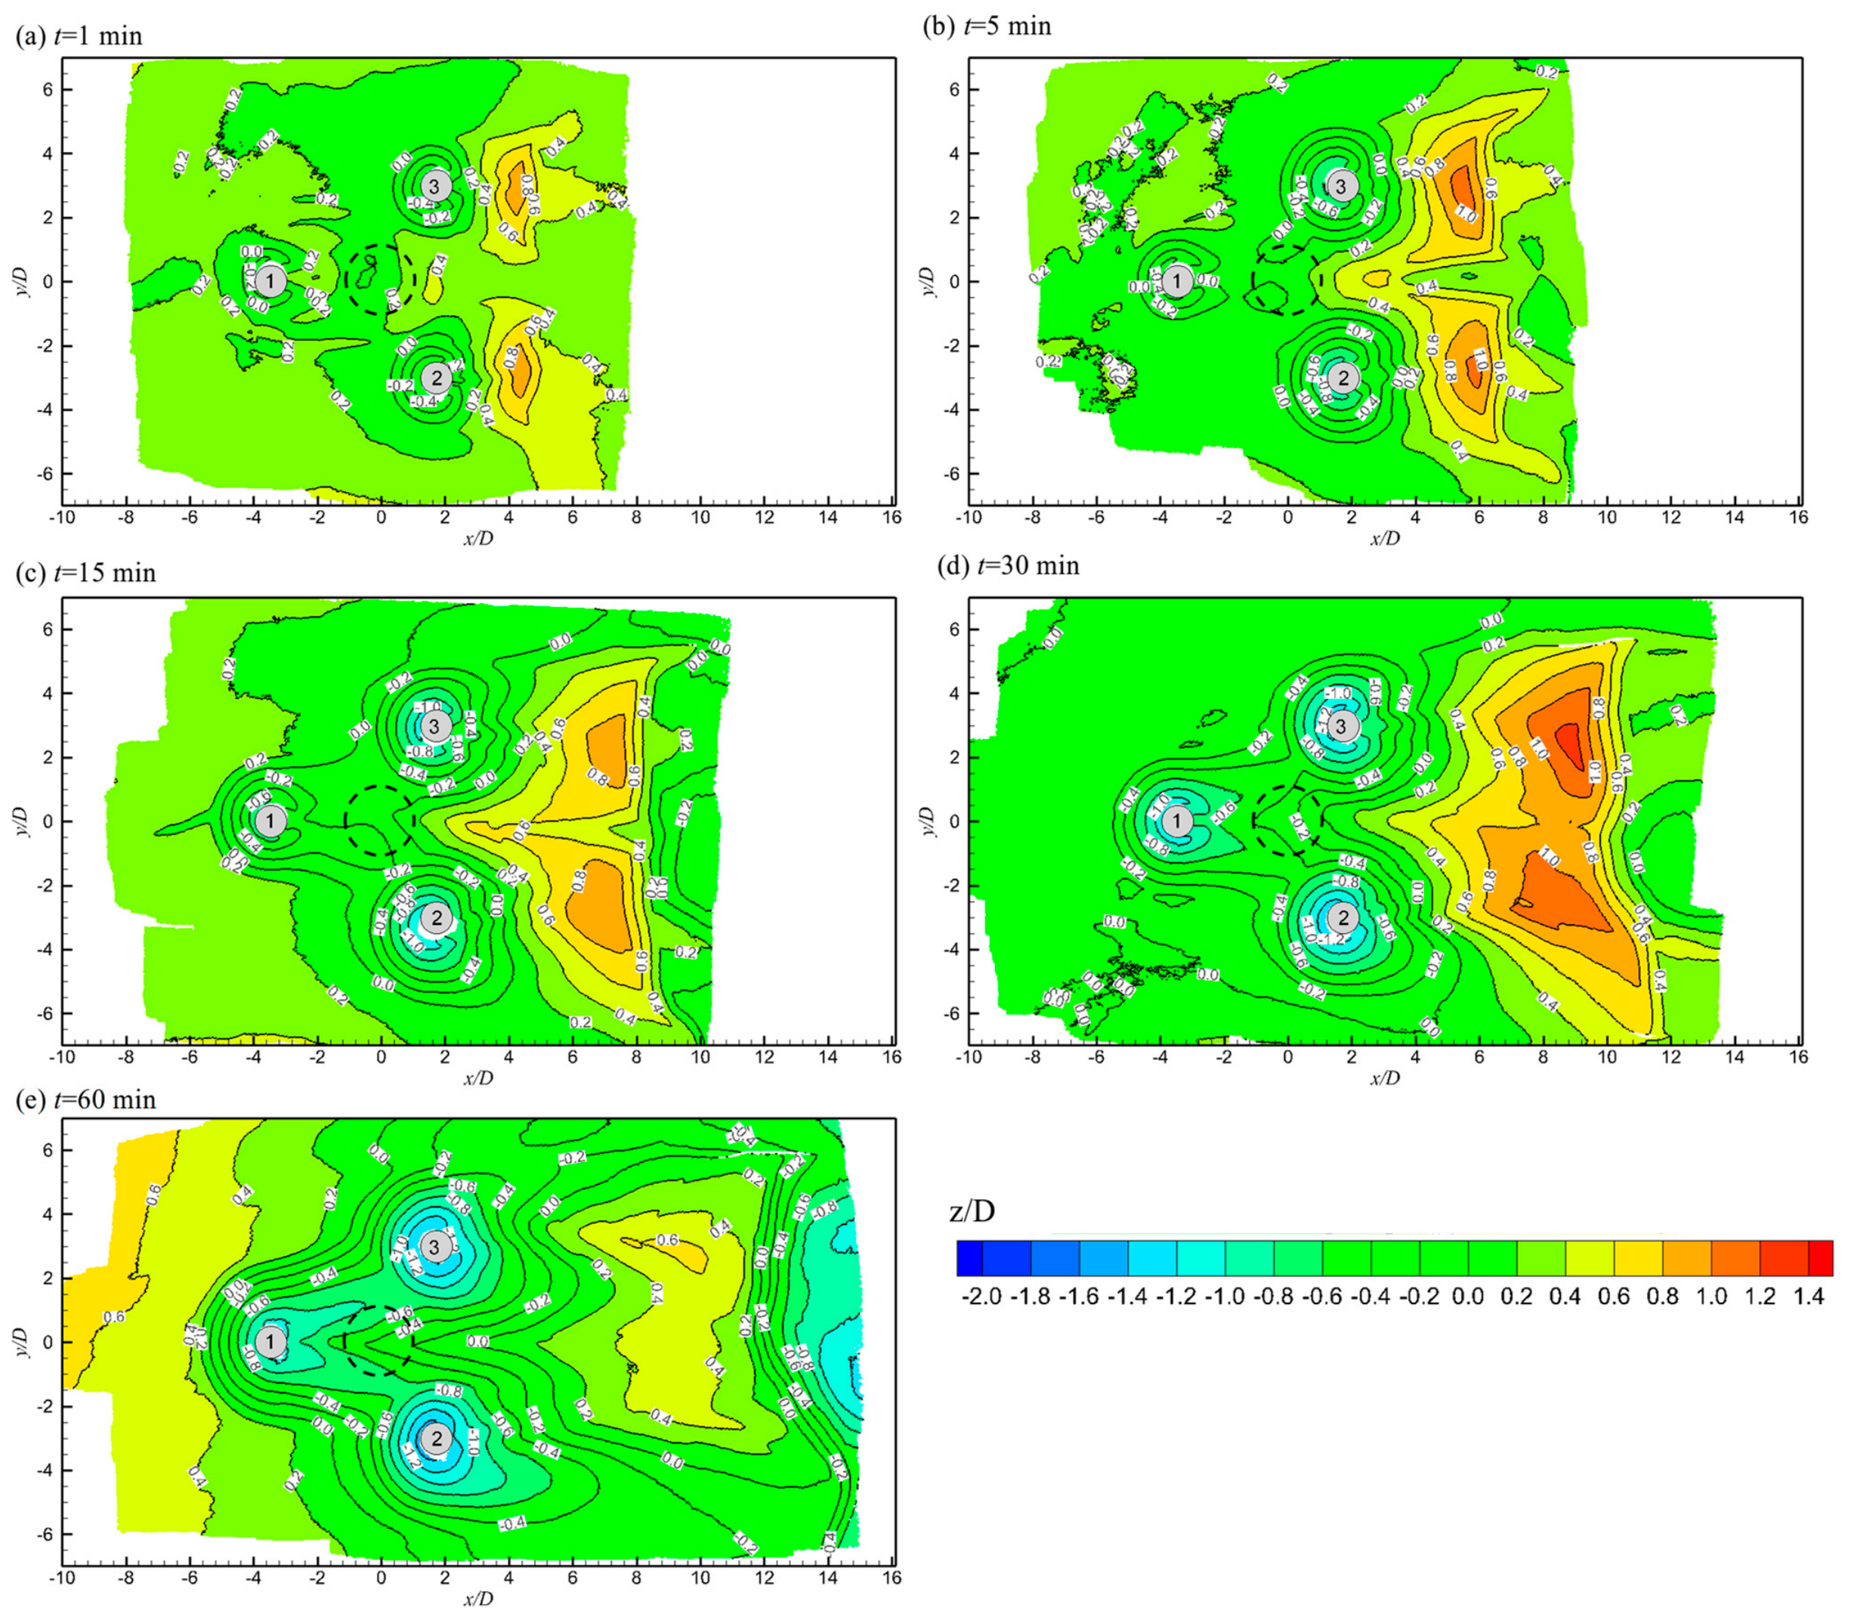
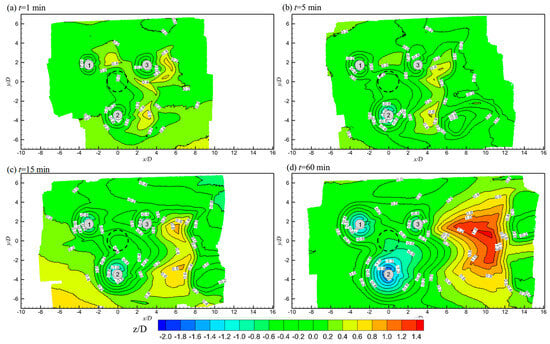
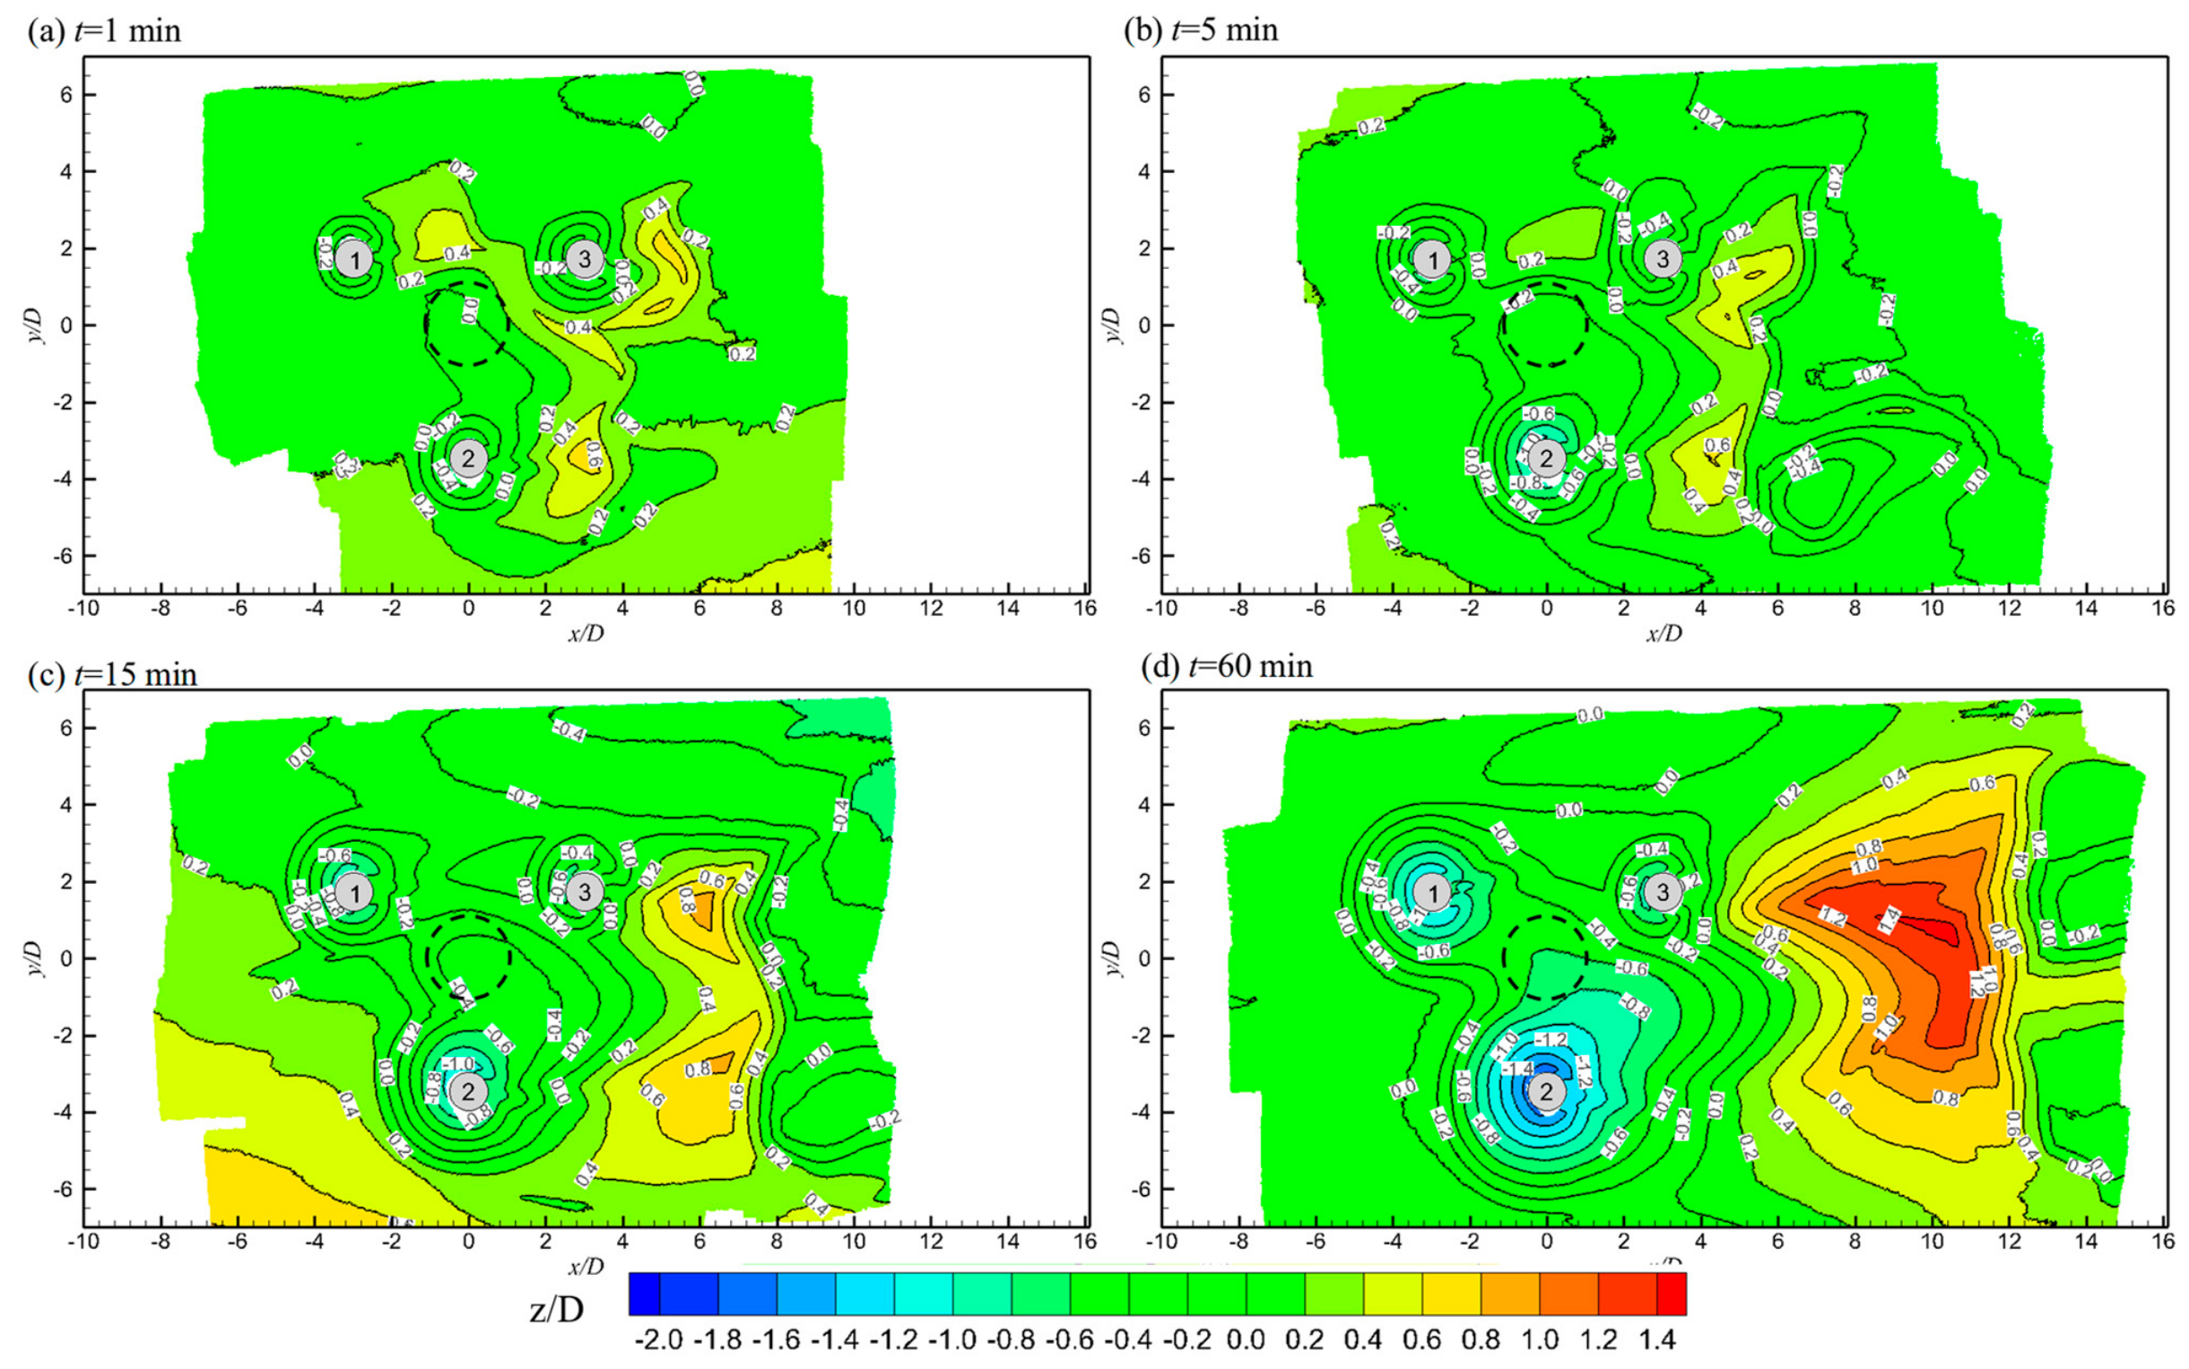
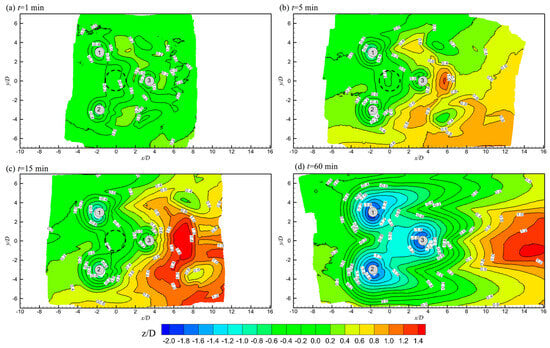
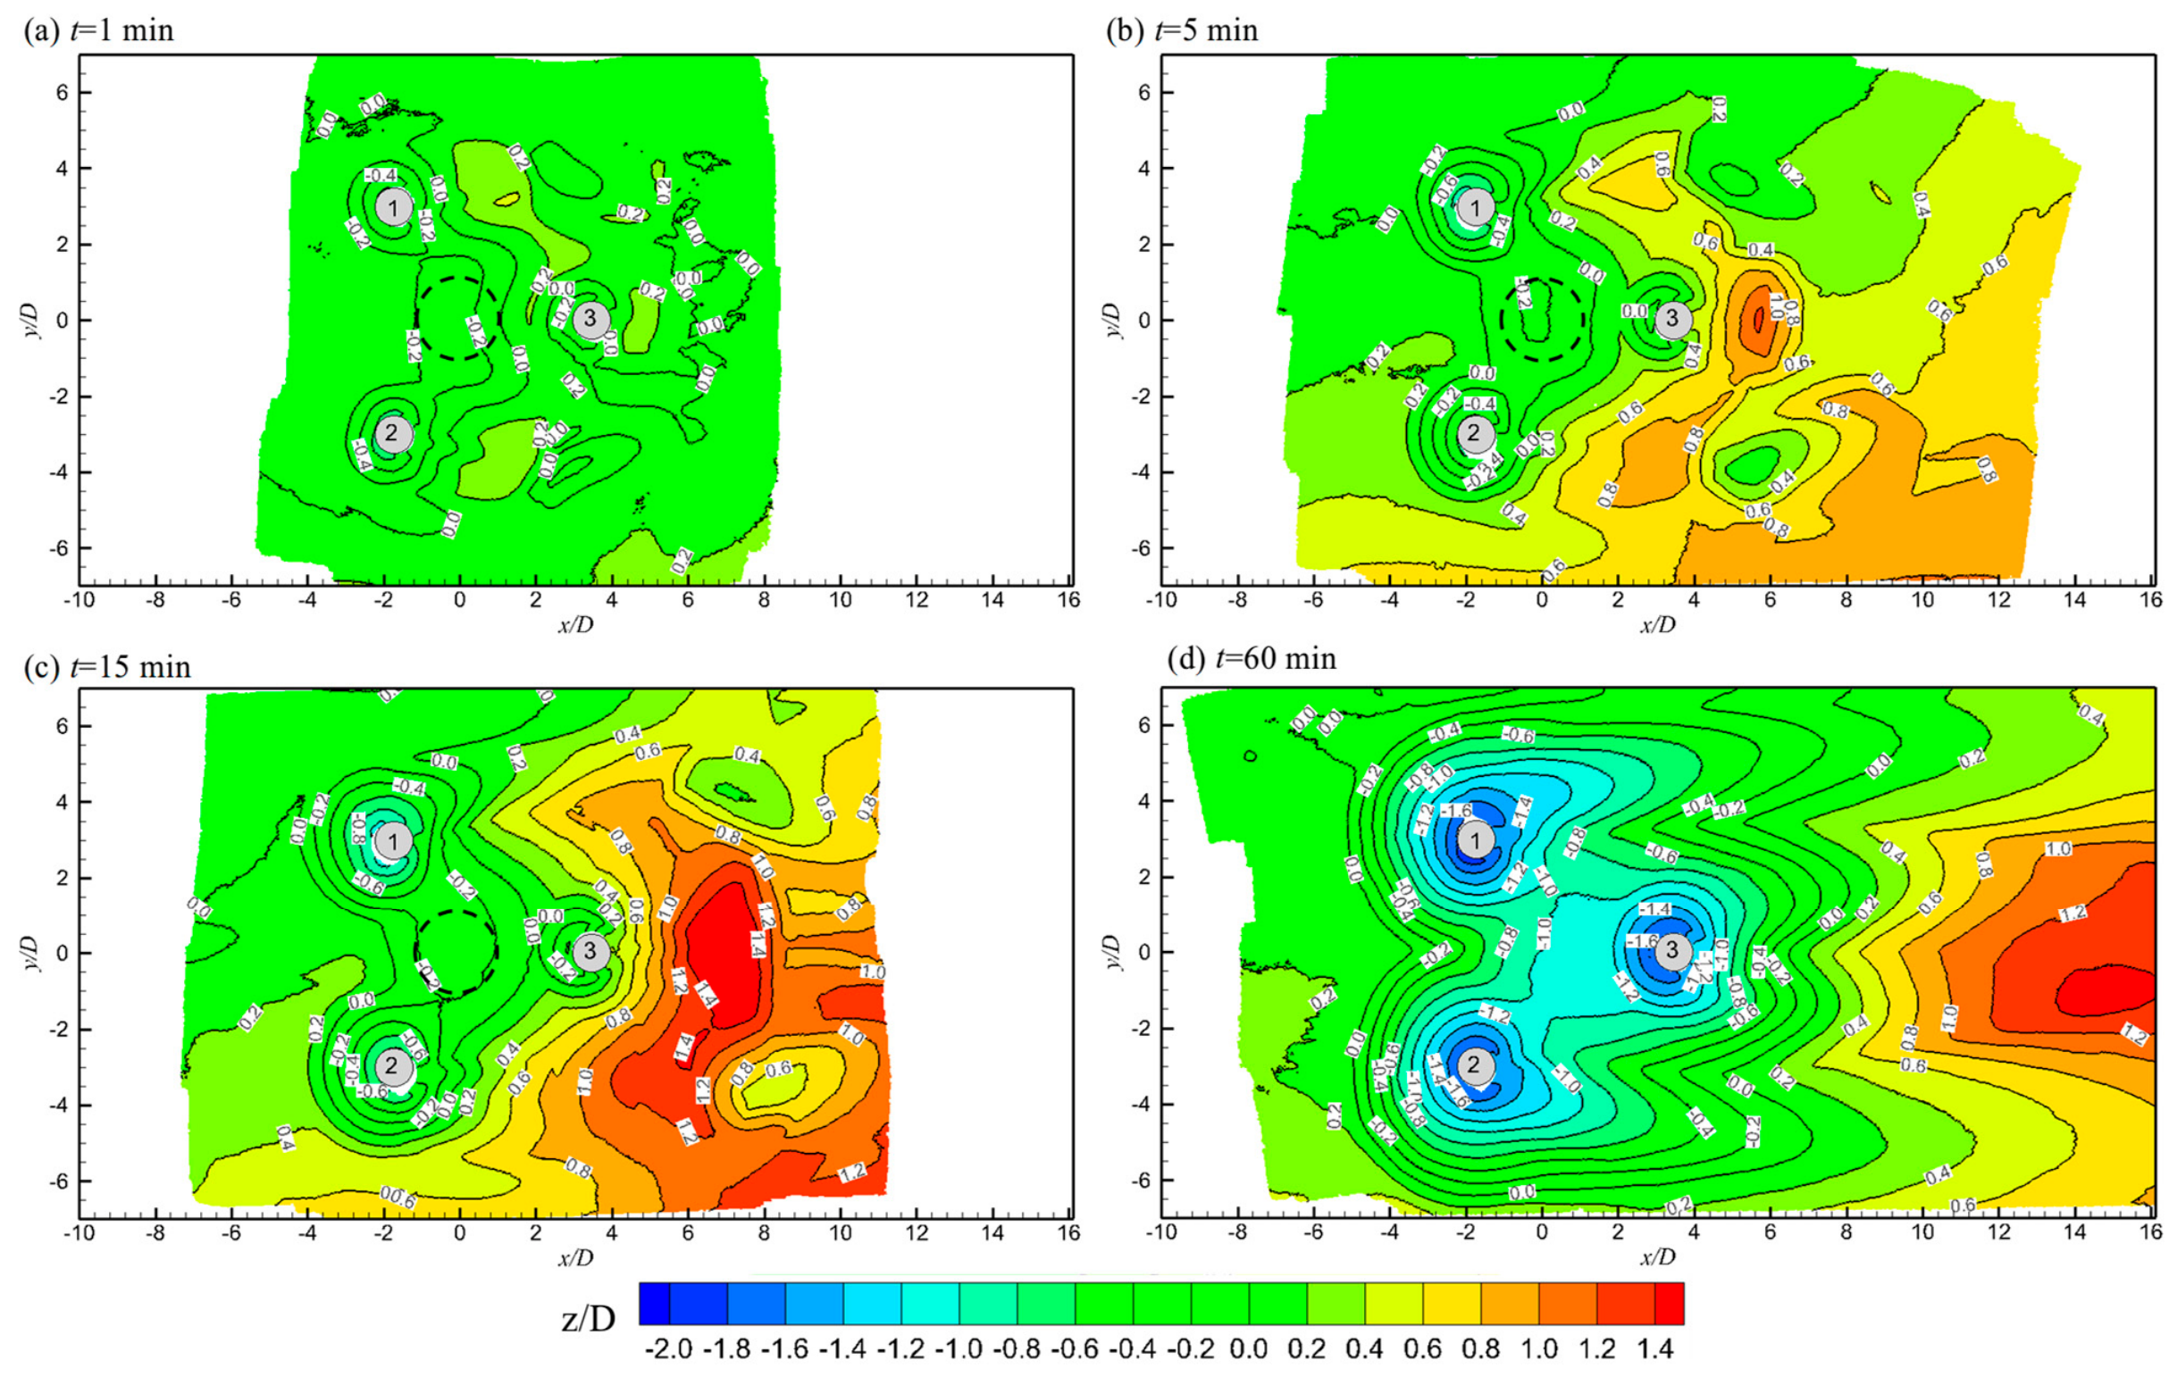
Although the three tripods T1 to T3 have different top brace sizes, they exhibit similar scour patterns but with varying scour depths, as discussed in Section 3.1. In this section, the evolution of the scour profiles of T3 at α = 0°, 30°, and 60°, and at different scour stages, is measured to identify the scour mechanisms. Figure 9, Figure 10 and Figure 11 show the scour profiles of T3 for three angles of attack α = 0°, 30° and 60°, respectively. A dashed circle line in the figures indicates the position of the main column.
Figure 9.
Contours of scour profiles of T3 with α = 0° at various stages within one hour of scour time.
Figure 10.
Contours of scour profiles of T3 with α = 30° at various stages within one hour of scour time.
Figure 11.
Contours of scour profiles of T3 with α = 60° at various stages within one hour of scour time.
To visualise the flow, numerical simulations of flow past T3 are conducted using computational fluid dynamics. Simulations are conducted using the software ANSYS Fluent 2024. The Reynolds-Averaged Navier–Stokes (RANS) equations and the k-ω SST turbulent model are used as the governing equations. In the numerical simulation, the computational domain is the same as the water volume used in the experimental water flume, starting from the entrance of the flume to the exit. On the inlet boundary, the flow velocity is uniformly distributed, and the turbulent intensity is 0.0616, which was measured in our previous study [38]. On the water surface, the symmetric boundary condition is used. On the two side-wall boundaries, a symmetric boundary condition is used instead of a non-slip boundary condition to avoid excessively dense mesh requirements for the side-wall boundary layer. The sand surface boundary is a rough, non-slip boundary with a roughness ks = 2.5d50. The smallest thickness of the mesh next to the bed and tripod boundaries is Δ1= 0.2 mm, the same as the one used in our previous study [45] where the same sand sample, same water flume and similar flow velocity were used. resulting in a non-dimensional wall unit of , which is nearly at the top of the laminar layer of a smooth boundary layer.
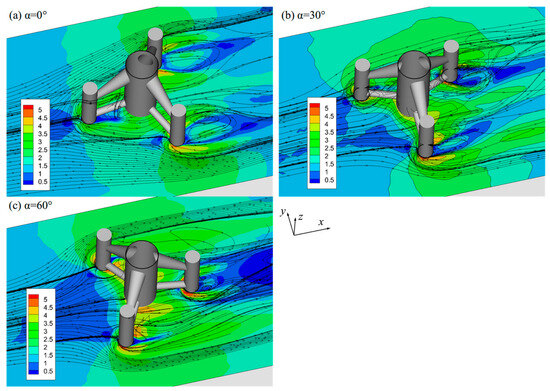
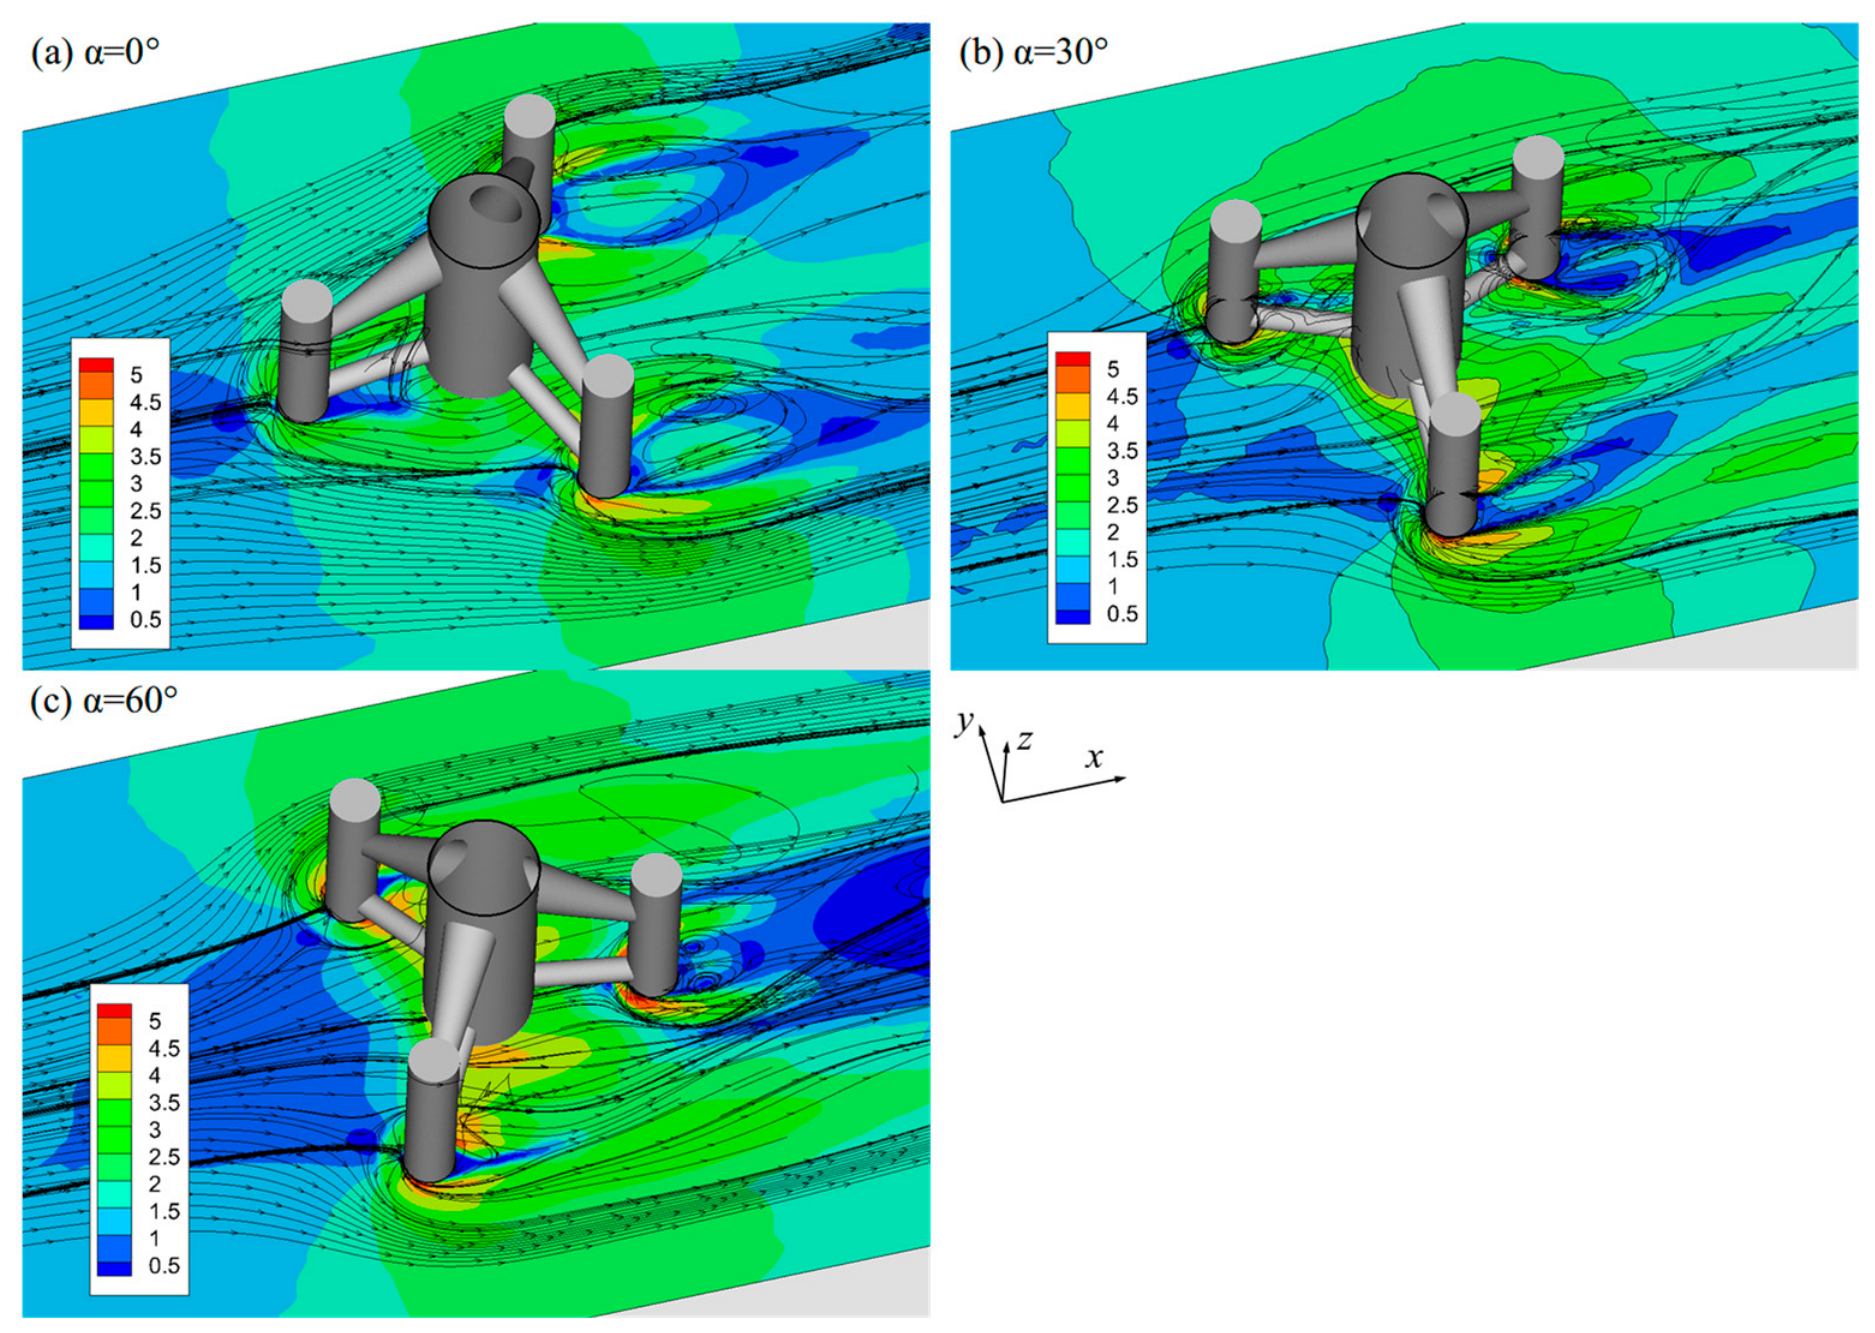
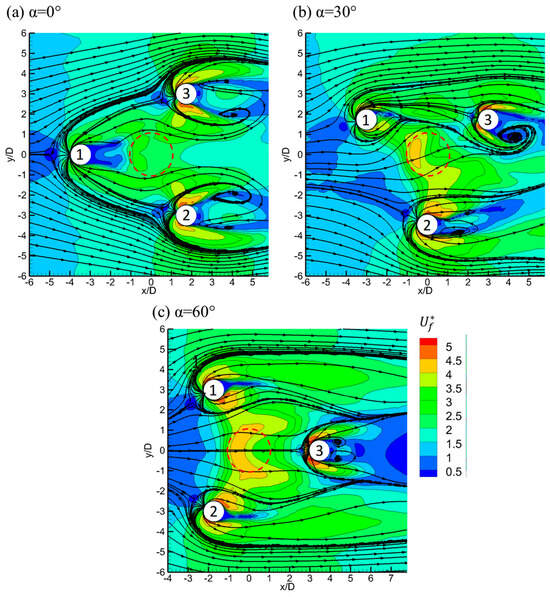
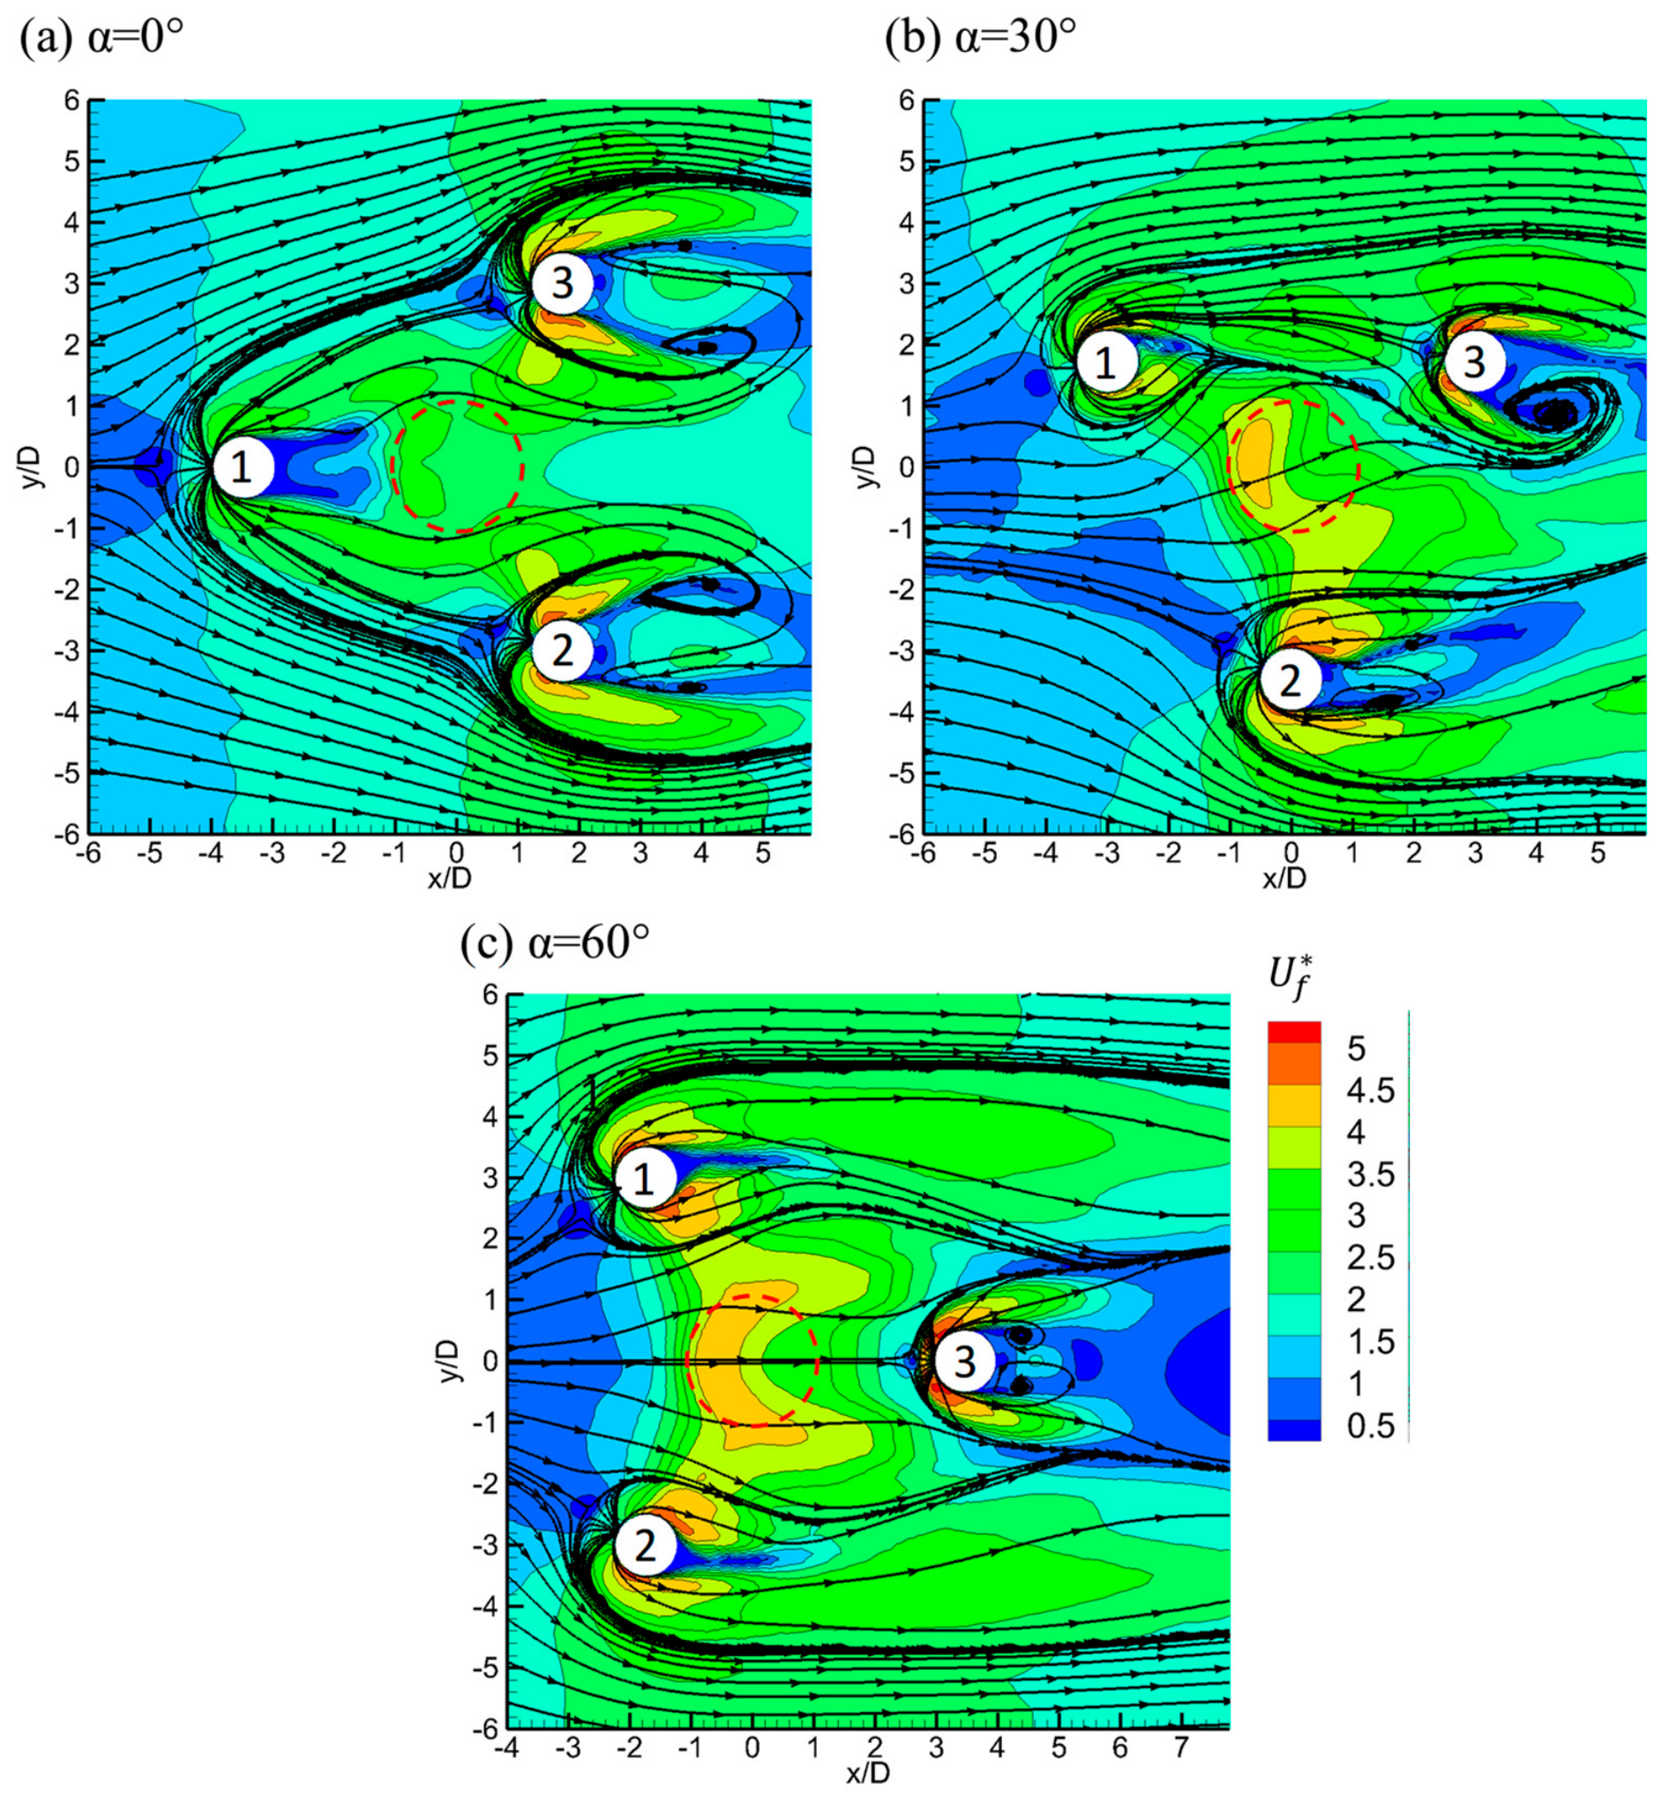
Figure 12 shows the distribution of the non-dimensional friction velocity on the flat sand surface and three-dimensional streamlines. The non-dimensional friction velocity is defined as , where uf0 is the friction velocity on the flat sand surface without the tripod. To have a clear view of the flow near the sand surface without the view blockage from the tripod, the non-dimensional friction velocity and streamline on a 2D flat sand surface are shown in Figure 13.
Figure 12.
Three-dimensional streamlines and contours of the non-dimensional friction velocity on the flat sand surface before scour (numerical simulation).
Figure 13.
Two-dimensional streamlines and contours of the non-dimensional friction velocity on the flat sand surface before scour (numerical simulation).
The friction velocity in the reverse flow direction in front of a leg indicates that a horseshoe forms there. At all angles of attack, horseshoe vortices are found in front of all three legs. The magnitude of the friction velocity can be used to judge the strength of a horseshoe vortex. At α = 0°, the scour of the two downstream legs is deeper than that of the upstream leg because the upstream leg and one downstream leg are in a staggered arrangement. In addition to the horseshoe vortices, the following mechanisms for two piles in a staggered arrangement contribute to the scour at α = 0°.
- (1)
- The flow velocity is amplified on the two sides of the upstream legs before it reaches the two downstream legs. As a result, the two downstream legs (2 and 3) have stronger horseshoe vortices than the upstream leg. The flow in front of the two legs becomes more turbulent after it passes the upstream pile. It has been demonstrated that stronger turbulence of the incoming flow causes deeper scour depth [38,46].
- (2)
- The vortex shedding-induced scour is absent for the upstream L1. The two braces of L1 stop L1 from forming vortex shedding; as a result, the shear stress amplification caused by vortex shedding does not exist in the wake of L1 (see Figure 13a).
In front of the main column, no horseshoe vortex forms because of the 1D gap between the bottom end of the main column and the sand surface. A horseshoe vortex in front of a vertical pile forms when the downward flow meets the bottom surface [40]. Instead of forming a horseshoe vortex, the downward flow goes through the gap beneath the main column, forming a strong flow. At α = 0°, the friction velocity was amplified beneath the main column, even though there is a shadowing effect from the upstream leg L1, as seen in Figure 13a. In the wake of a single pile, scoured sediment generally deposits in the wake and forms a dune at the early stage of scour. At α = 0°, the accelerated velocity beneath the main column makes the eroded sediment from L1 move downstream quickly, leaving no dune forms in the wake of L1 after 5 min in Figure 9b.
At α = 0°, Figure 9 indicates that scour below the main column is very slow and does not reach S/D = 0.2 until t = 15 min and only reaches 0.2D at t = 30 min. The scoured sand below the main column piles up immediately after the column, forming a very small dune in Figure 9a,b. At the early stage of the scour, three separate deposition areas are found behind the three legs and the main column. After 15 min, a global scour area forms, and deposition occurs only in the wake of the entire tripod. The scour below the main column at α = 0° is much slower than the other two angles of attack because of L1 and the braces of L1. The shadowing effect of L1 weakens the incoming velocity relative to the main column, causing weakened velocity amplification beneath the main column, as seen in Figure 13a. The braces of L1 stop the formation of vortices from L1. So, there is no vortex-induced erosion immediately after L1, where the main column is located. The only erosion mechanism below the main column is velocity amplification due to the weakened incoming flow.
At α = 30°, L2 and L3 have the greatest and smallest scour depths, respectively, as shown in Figure 10. L3 has the smallest scour depth because L1 and L3 are arranged tandemly [27,28,42,43]. Firstly, the shadowing effects of L1 weaken the incoming flow relative to L3. Secondly, the eroded sediment from L1 that deposits between L1 and L3 slows the scour process of L3. At α = 30°, L2 has the greatest scour depth of all models considered. L2 has a greater scour depth than L1 because it is in a staggered arrangement with L1 and follows the same mechanisms discussed for α = 0°. In addition, L2 is arranged side by side with the main column. It was found that the scour of two side-by-side piles was deeper than that of a single pile [25]. Although the main column was not a buried pile, its existence still enhances the incoming flow velocity relative to L2, evidenced by the stronger friction velocity around L2 than L1 in Figure 13b. A similar finding of a higher scour depth at L2 was supported by greater flow penetration towards Leg 2 at α = 30° [2].
The non-dimensional friction velocity below the main column at α = 30° was found to be significantly higher than that at α = 0°, as shown in Figure 13 and it increased from roughly 2.5 to 4.5 at the centre. As a result, scour beneath the main column began immediately after the test started, but at a slower rate than the three legs. At the early stage of scour, four separate deposition areas are seen behind the three legs and the main column. Finally, deposition was only seen in the wake of the global scour area. Although the value of scour depth under the main column is less than the value at the legs, its contribution towards the global scour is significant due to its larger diameter. This contribution is evident from the increase in the eroded volume under the tripod geometries as compared to the 3TP model, as shown in Table 3, When tripods are compared with the 3TP model, a 270% increase in eroded sand volume under the tripod is observed in the strongest scour case. This significant contribution can be attributed to the main column and braces.
At α = 60 °, the three legs are in a staggered arrangement. The downstream L3 has the smallest scour depth initially, as seen in Figure 11, mainly because the eroded sand from the bottom of the main column continuously fills into the scour pit of L3. After the scour below the main column slows, the scour at L3 accelerates and eventually reaches a depth as in the case of scour at L1 and L2. The global scour pit has formed at t = 5 min.
3.3. Temporal Development of Scour at Different Angles of Attack
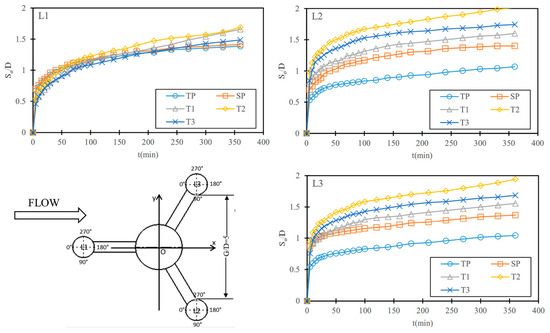
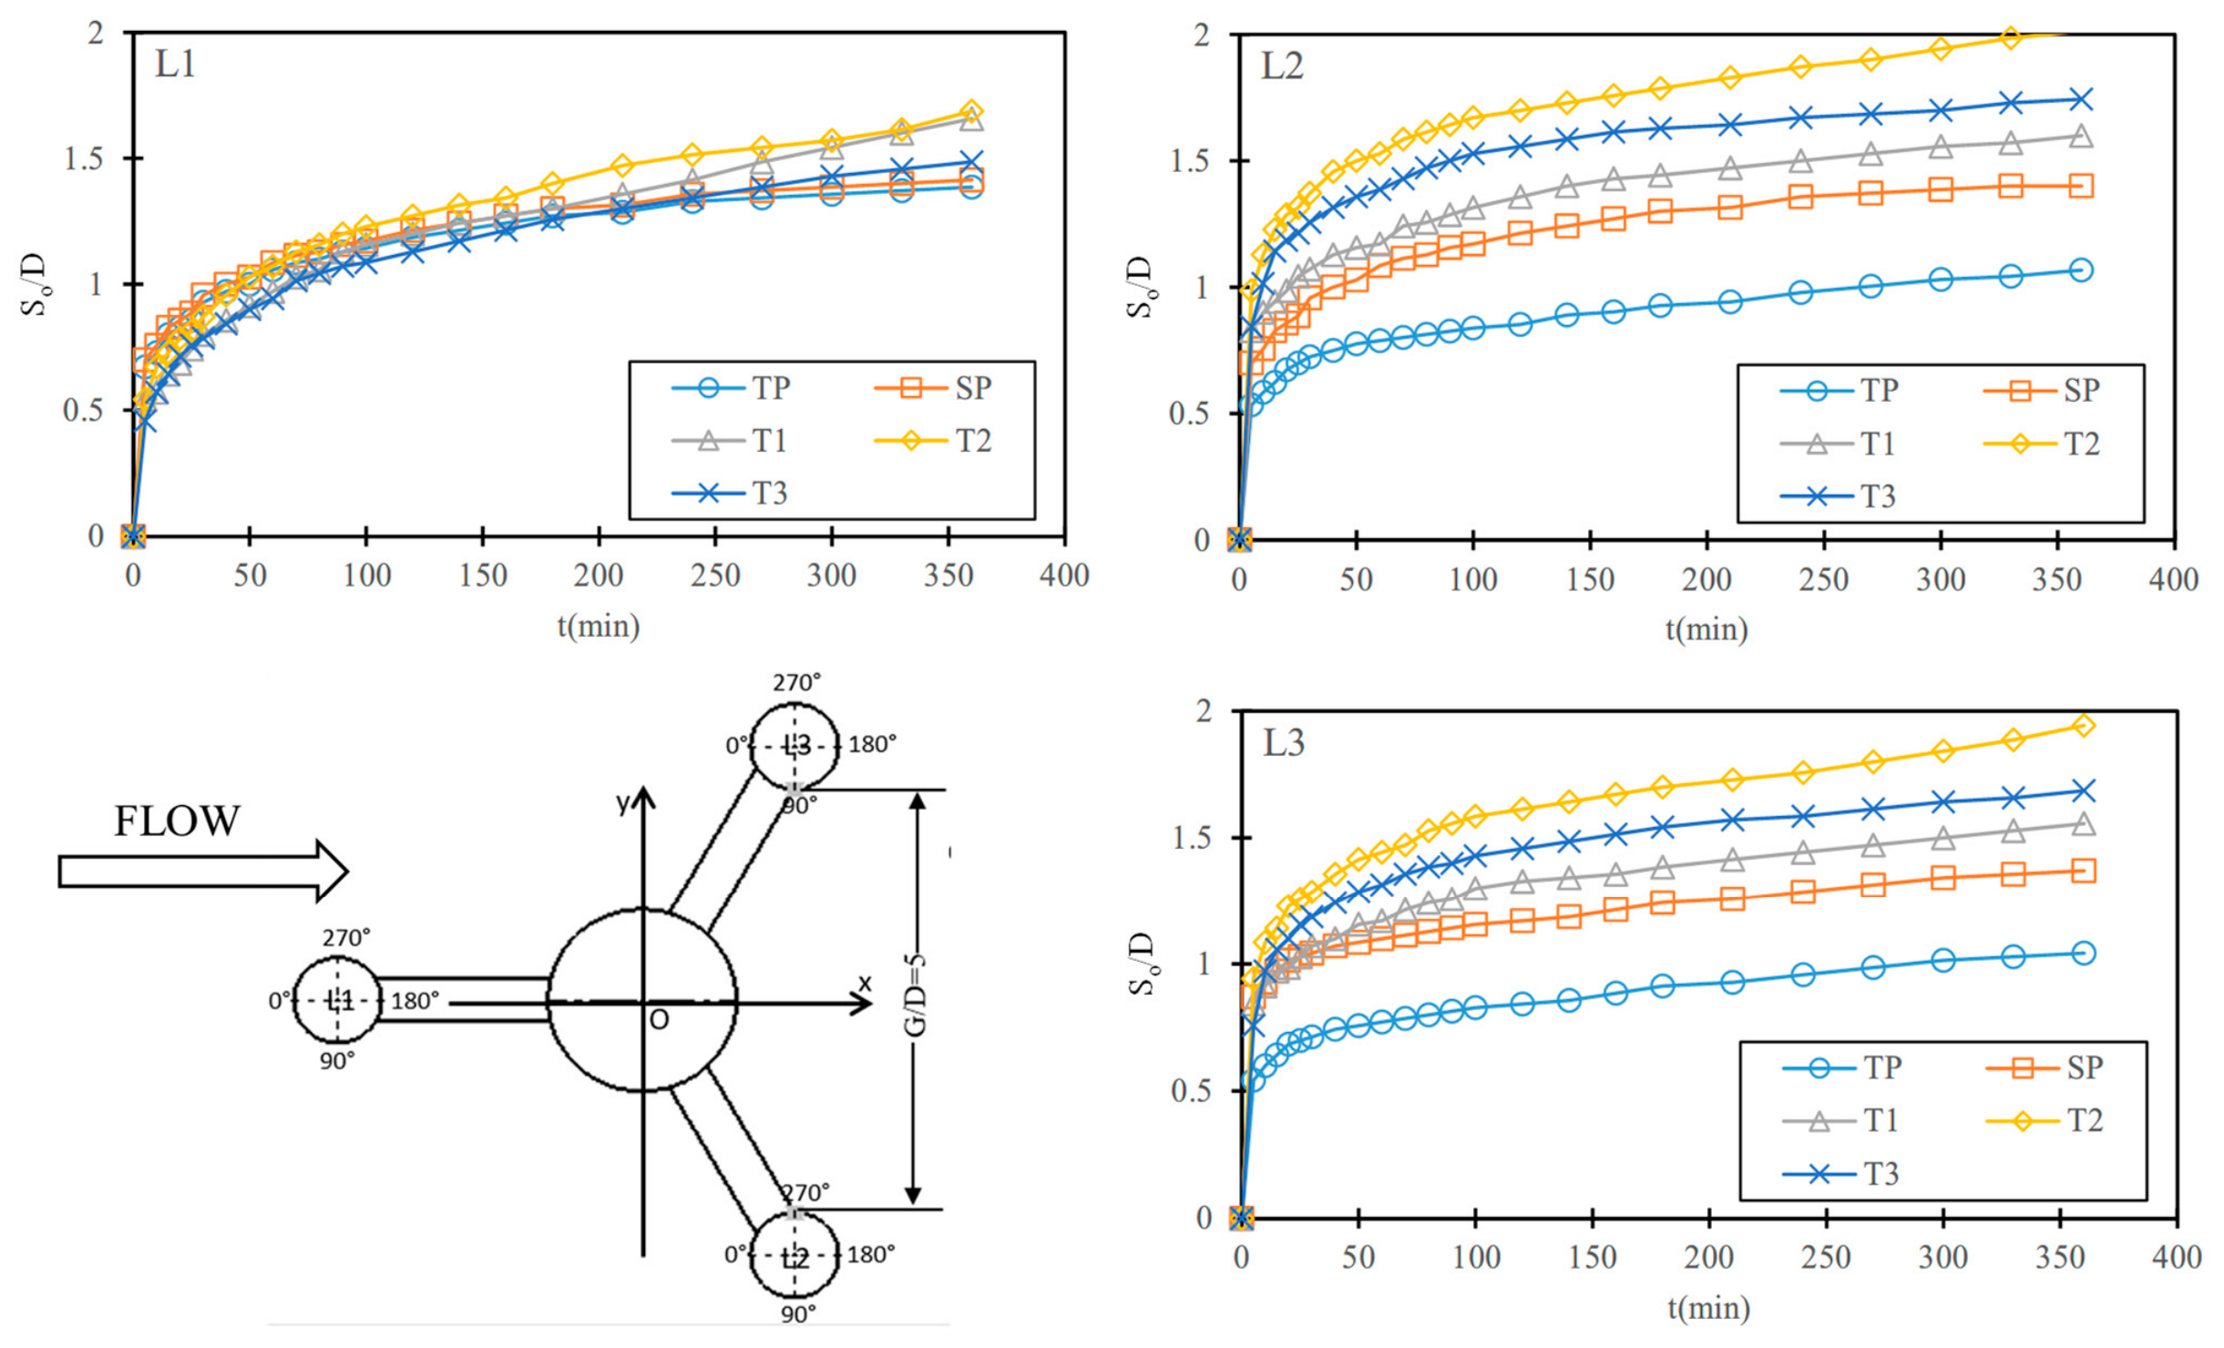
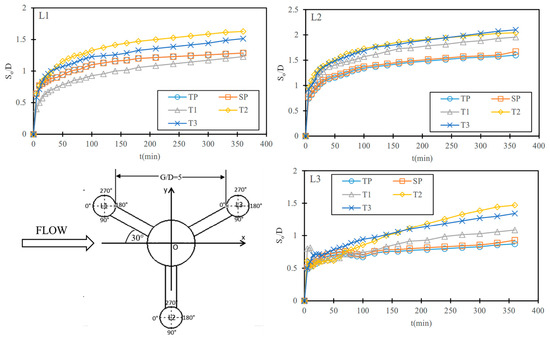
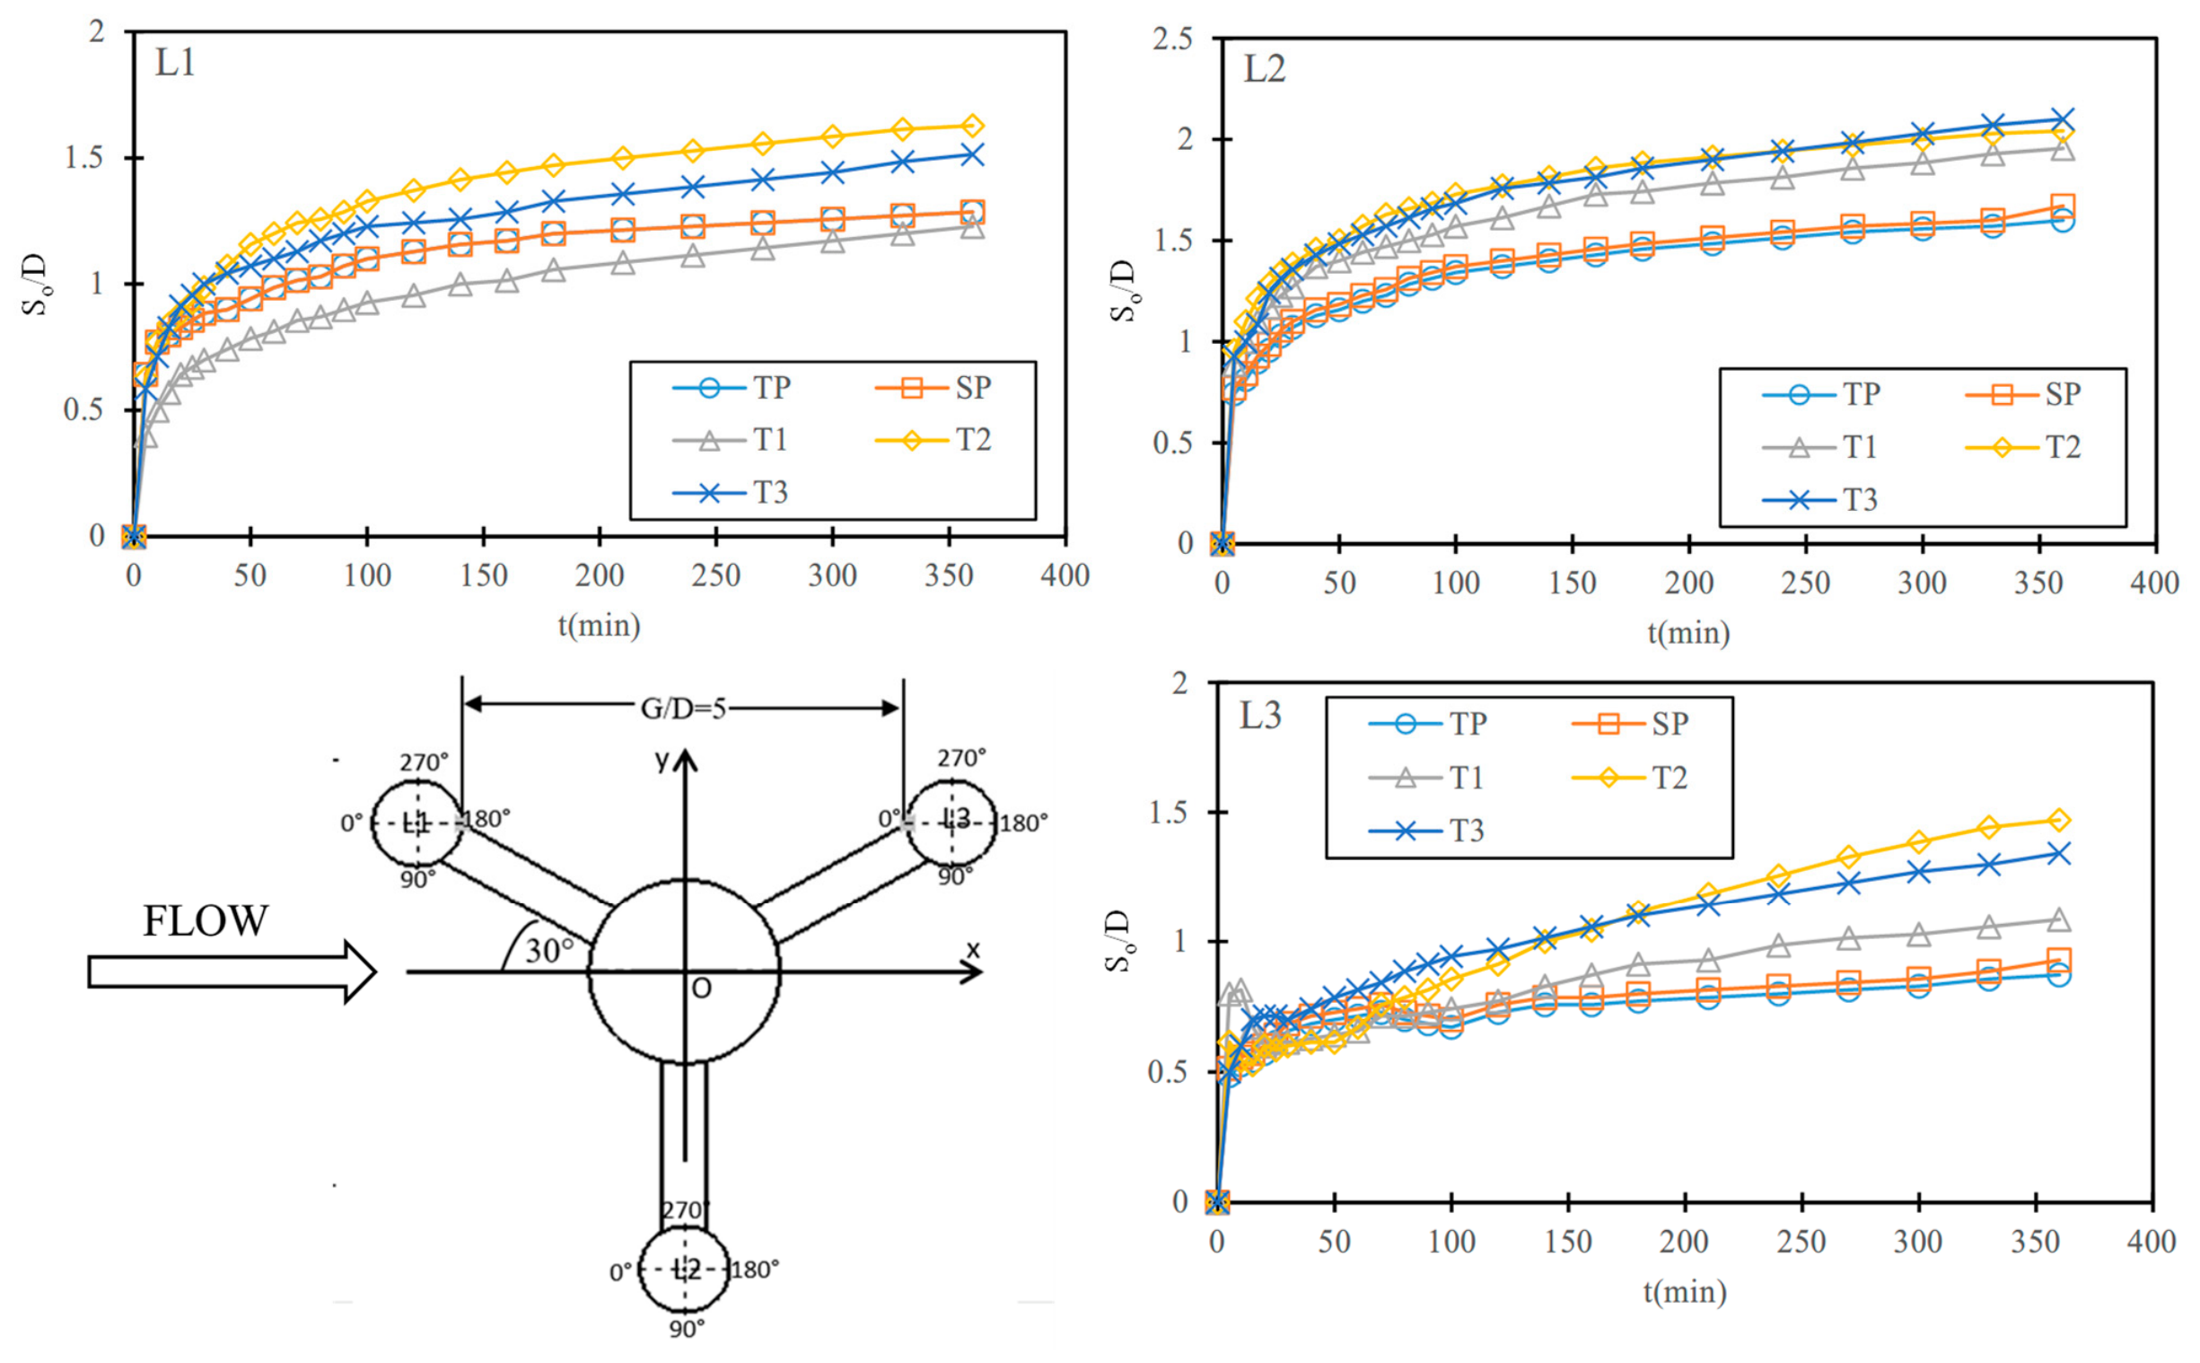
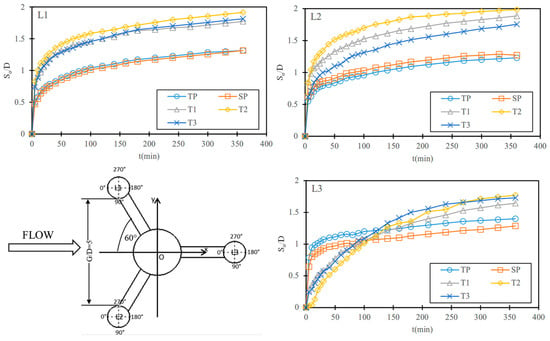
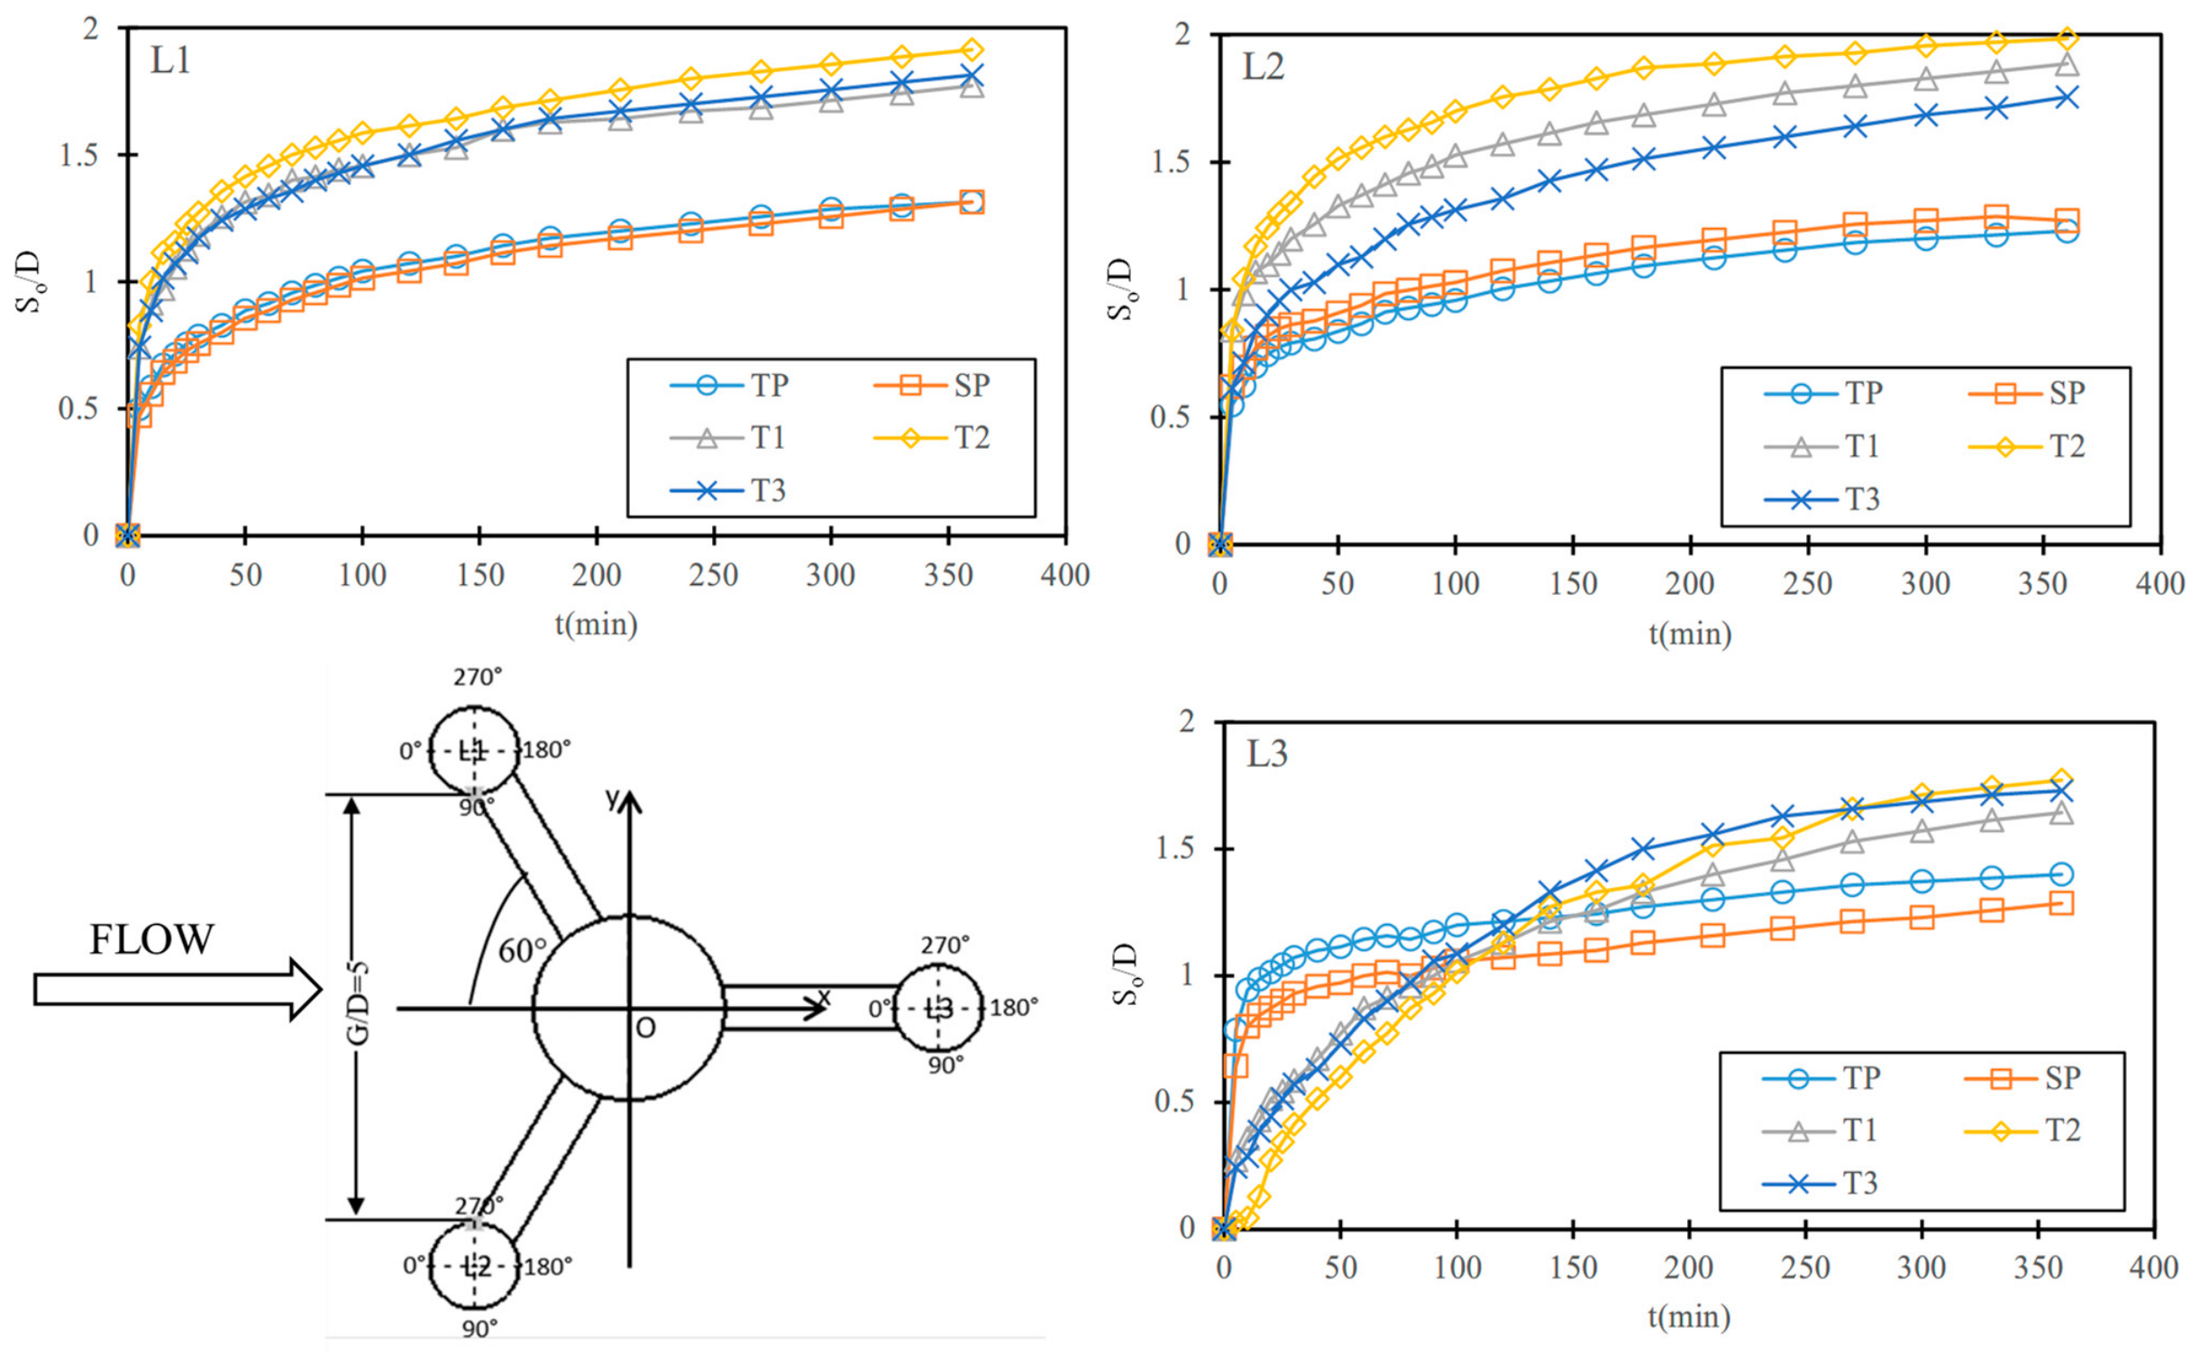
Figure 14, Figure 15 and Figure 16 show the temporal development of scour at the most upstream point of each leg for α = 0°, 30° and 60°, respectively. At α = 0°, every leg is exposed to the incoming flow directly and is not shielded by any upstream object. The initial phase of scour development is rapid, followed by a progressively decreasing rate, consistent with local scour around a single vertical structure. The scour of each leg is dominated by a horseshoe vortex, especially at the early stage of scour evolution, and major scour happens in the early phase [38,47]. Across all tests, the scour rate during the early phase for tripod structures is higher than for TP and SP. It indicates a greater flow obstruction and acceleration caused by the other structural elements, thereby enhancing the scour rate.
Figure 14.
Temporal Development of Scour Depth at the Most Upstream Point of Each Leg for α = 0°.
Figure 15.
Temporal Development of Scour Depth at the Most Upstream Point of Each Leg for α = 30°.
Figure 16.
Temporal Development of Scour Depth at the Most Upstream Point of Each Leg for α = 60°.
Although the equilibrium scour depth is not attained within the 6 h duration, the curves indicate a trend towards asymptotic behaviour, suggesting that the dominant scour mechanisms were adequately captured and that sufficient scour depth has been reached, ranging from 1.6D to 2.1D for tripods and from 1.3D to 1.6D for TP. The scour depths of cases 3TP and 3SP are comparable to the equivalent scour depth of about 1.3D for a monopile [40].
For the triangular arrangement with α = 30°, L1 and L3 are in tandem. It was found that when two piles are in a tandem arrangement, the shadowing effect has a big impact on the scour of the rear pile [48,49,50]. Zhao et al. [49] demonstrated that the shadowing effect is weak when G/D is greater than 3. In this study, where G/D = 5, the scour depth of the downstream L3 is equivalent to the upstream L1, as seen in Figure 15 for the cases of 3TP and 3SP, indicating a weak shadowing effect. For the three tripods T1 to T3, the scour depth of the downstream L3 is much lower than that of L1, indicating that the braces introduced more shadowing effects on T3. The shielding effect from the upstream leg (L1) weakens the scour of L3. The scour rate of L3 is initially high but then suddenly decreases at about t = 10 min. Lastly, the downstream leg (L3), which lies in the wake region of L1, will receive a deflected flow from L2 and a weak flow from L1. Based on the asymmetry and protection from leg L1, a velocity reduction and a lower shear stress near the bed can be expected in front of L3.
At α = 60°, the scour histories of L1 and L2 for all 5 models follow the trend of a single pile because they are facing undisturbed incoming flow. The initial scour rate of L3 is much slower than that of L1 and L2 because of the deposited sand, which eroded from the bottom of the main column and filled into the sand pit of L3. The scour rate of L3 is slow because it is essentially the rate of the combined main column and L3. After a certain time, the scour depth at the downstream L3 of the three tripods exceeds that of cases 3SP and 3TP. After sufficient scour has developed at the bottom of the main column, accelerated flow below the main column provides a stronger incoming flow to L3. However, the scour depth at L3 remains smaller than at L1 and L2. At α = 60°, L1 and L2 are in a side-by-side arrangement with G/D = 5. Such a large gap ratio would have an insignificant effect on the scour between two side-by-side piles [51,52,53]. The increase in scour depths at L1 and L2 compared with the 3TP case is mainly due to blockage by the braces.
4. Conclusions
An experimental investigation was conducted to examine the scour development around three tripod foundation configurations under steady current conditions. The tripod models shared the same overall geometry but differed in the dimensions of the top braces. The study evaluated the influence of foundation geometry and angle of attack on scour morphology, scour distribution, and sediment removal patterns. Based on the experimental observations, the following conclusions can be drawn:
- Scour around tripod foundations is governed by the interaction of local and global scour processes. Initially, scour develops locally around the individual legs, producing three distinct scour holes associated with flow contraction and horseshoe-vortex activity at each pile. As the scour holes expand and merge, the scour process transitions into a global scour stage characterised by continuous sediment erosion around the entire foundation system. Although the deepest scour does not occur beneath the main column, it plays a critical role in connecting the local scour holes and controlling the overall scour morphology.
- At α = 0°, the two downstream legs experienced deeper scour than the upstream leg (L1). This behaviour is attributed to flow acceleration and increased turbulence generated around L1, which enhanced sediment entrainment downstream. In addition, the braces modified the local flow field around L1, reducing scour at the upstream leg and promoting greater scour development at the downstream legs.
- At α = 0°, scour beneath the main column was shallower than at α = 30° and 60°, likely due to the shielding effect of the upstream leg (L1) and its braces, which reduced flow intensity reaching the main column.
- At α = 60°, the downstream leg (L3) exhibited lower scour depth than the upstream legs (L1 and L2), likely due to flow blockage by the main column. However, its scour depth remained higher than that of the 3TP case, which can be attributed to flow acceleration through the gap beneath the main column.
- At α = 30°, the maximum scour depth occurred at L2, where the combined effects of the staggered arrangement between L1 and L2 and the side-by-side alignment of L2 with the main column intensified local flow interaction and sediment erosion.
- At all angles of attack, the eroded sand volumes of T1 and T2 are the smallest and the greatest, respectively. The size of the top braces has a greater effect on scour at α = 30° than at α = 0° or 60°. At α = 30°, the eroded sand volume of T2 with the largest top braces is about twice that of T1 with the smallest top braces. It is about 5.2 times the eroded sand volume in the three-leg-only case (3TP). The effect of the top brace on the scour below the main column follows the same trend as its effect on the eroded sand volume.
Author Contributions
Conceptualization: M.A. and M.Z.; Data curation: M.A.; Formal analysis: M.A.; Investigation: M.A.: Methodology: M.A. and M.Z.; Project administration: M.A. and M.Z.; Resources: M.Z. and J.Z.; Supervision: M.Z. and H.W.; Validation: M.A.; Visualization: M.Z.; Writing—original draft: M.A.; Writing—review & editing: M.Z., H.W., V.D., J.Z., H.P.; Funding acquisition: J.Z. All authors have read and agreed to the published version of the manuscript.
Funding
Education Reform Project (No.: Z2024285) funded by Shandong Education Department, China.
Institutional Review Board Statement
Not applicable.
Data Availability Statement
Data will be made available on request.
Acknowledgments
The authors acknowledge the support from the Education Reform Project funded by Shandong Education Department, China.
Conflicts of Interest
The authors declare that they have no known competing financial interests or personal relationships that could have appeared to influence the work reported in this paper.
References
- Zhao, X.; Chen, X.; Sui, S.; Deng, W.; Shen, K. Experimental study of local scour around bucket foundation in sand. Ocean Eng. 2023, 286, 115482. [Google Scholar] [CrossRef] [Scilit]
- Lin, X.; Zhang, J.; Guan, D.; Zheng, J.; Zhang, Y.; Fernandez-Rodriguez, E.; Gao, L. Scour processes around a horizontal axial tidal stream turbine supported by the tripod foundation. Ocean Eng. 2024, 296, 116891. [Google Scholar] [CrossRef] [Scilit]
- Hu, R.; Wang, X.; Liu, H.; Lu, Y. Experimental study of local scour around tripod foundation in combined collinear waves-current conditions. J. Mar. Sci. Eng. 2021, 9, 1373. [Google Scholar] [CrossRef] [Scilit]
- Ni, X.; Xue, L. Experimental investigation of scour prediction methods for offshore tripod and hexapod foundations. J. Mar. Sci. Eng. 2020, 8, 856. [Google Scholar] [CrossRef] [Scilit]
- Zhao, M. A review on recent development of numerical modelling of local scour around hydraulic and marine structures. J. Mar. Sci. Eng. 2022, 10, 1139. [Google Scholar] [CrossRef] [Scilit]
- Gong, M.; Wu, G.; Du, S.; Pan, X.; Lv, Y.; Sun, Y.; Ding, G.; Liang, B. Experimental investigations of local scour around piles in a single-column and three-columns with multiple rows in steady current. Appl. Ocean Res. 2025, 159, 104608. [Google Scholar] [CrossRef] [Scilit]
- Dey, S.; Raikar, R.V.; Roy, A. Scour at Submerged Cylindrical Obstacles under Steady Flow. J. Hydraul. Eng. 2008, 134, 105–109. [Google Scholar] [CrossRef] [Scilit]
- Link, O.; Zanke, U. On the time-dependent scour-hole volume evolution at a circular pier in uniform coarse sand. In Proc. 2nd International Conference on Scour and Erosion (ICSE-2), Singapore; Chiew, Y.-M., Lim, S.-Y., Cheng, N.-S., Eds.; Nanyang Technological University: Singapore, 2004; pp. 14–17. [Google Scholar]
- Yao, Z.; Guan, D.; Jin, S.; Melville, B.W.; Chiew, Y.-M.; Shamseldin, A.Y. Clear-Water Scour Mechanism at Vibrating Monopile Foundations. J. Hydraul. Eng. 2024, 150, 04024014. [Google Scholar] [CrossRef] [Scilit]
- Dey, S.; Sumer, B.M.; Fredsøe, J. Control of scour at vertical circular piles under waves and current. J. Hydraul. Eng. 2006, 132, 270–279. [Google Scholar] [CrossRef] [Scilit]
- Qi, W.-G.; Li, Y.-X.; Xu, K.; Gao, F.-P. Physical modelling of local scour at twin piles under combined waves and current. Coast. Eng. 2019, 143, 63–75. [Google Scholar] [CrossRef] [Scilit]
- Ni, X.; Xue, L.; An, C. Experimental investigation of scour around circular arrangement pile groups. Ocean Eng. 2021, 219, 108096. [Google Scholar] [CrossRef] [Scilit]
- Qi, W.; Gao, F. Equilibrium scour depth at offshore monopile foundation in combined waves and current. Sci. China Technol. Sci. 2014, 57, 1030–1039. [Google Scholar] [CrossRef] [Scilit]
- Yuan, C.; Melville, B.W.; Adams, K.N. Scour at wind turbine tripod foundation under steady flow. Ocean Eng. 2017, 141, 277–282. [Google Scholar] [CrossRef] [Scilit]
- Yao, W.; An, H.; Draper, S.; Cheng, L.; Harris, J.M. Experimental investigation of local scour around submerged piles in steady current. Coast. Eng. 2018, 142, 27–41. [Google Scholar] [CrossRef] [Scilit]
- Zhao, M.; Zhu, X.; Cheng, L.; Teng, B. Experimental study of local scour around subsea caissons in steady currents. Coast. Eng. 2012, 60, 30–40. [Google Scholar] [CrossRef] [Scilit]
- Du, S.; Wang, Z.; Wang, R.; Liang, B.; Pan, X. Effects of flow intensity on local scour around a submerged square pile in a steady current. Phys. Fluids 2022, 34, 085126. [Google Scholar] [CrossRef] [Scilit]
- Liang, F.; Wang, C.; Wang, Y.; Huang, M. A preliminary experimental study on the mechanism of local scour at pile groups in steady currents. In Frontiers in Offshore Geotechnics III: Proceedings of the 3rd International Symposium on Frontiers in Offshore Geotechnics (ISFOG 2015); Taylor & Francis Books Ltd: Abingdon, UK, 2015; pp. 599–604. [Google Scholar]
- Wang, D.; Niu, G.; Du, S. Study of local scour around multiple-arranged piles in unidirectional flow. Phys. Fluids 2025, 37, 075153. [Google Scholar] [CrossRef] [Scilit]
- Lu, Y.; Wang, Z.; Yin, Z.; Wu, G.; Liang, B. Experimental and numerical studies on local scour around closely spaced circular piles under the action of steady current. J. Mar. Sci. Eng. 2022, 10, 1569. [Google Scholar] [CrossRef] [Scilit]
- Zhou, Y.; Yiu, M. Flow structure, momentum and heat transport in a two-tandem-cylinder wake. J. Fluid Mech. 2006, 548, 17–48. [Google Scholar] [CrossRef] [Scilit]
- Kumari, S.; Tiwari, H.; Chavan, R. Analyzing the effectiveness of turbulence models in predicting flow around tandem piers. Ocean Eng. 2025, 321, 120467. [Google Scholar] [CrossRef] [Scilit]
- Sumner, D. Two circular cylinders in cross-flow: A review. J. Fluids Struct. 2010, 26, 849–899. [Google Scholar] [CrossRef] [Scilit]
- Yang, Y.; Qi, M.; Wang, X.; Li, J. Experimental study of scour around pile groups in steady flows. Ocean Eng. 2020, 195, 106651. [Google Scholar] [CrossRef] [Scilit]
- Ataie-Ashtiani, B.; Aslani-Kordkandi, A. Flow field around side-by-side piers with and without a scour hole. Eur. J. Mech.-B/Fluids 2012, 36, 152–166. [Google Scholar] [CrossRef] [Scilit]
- Akilli, H.; Akar, A.; Karakus, C. Flow characteristics of circular cylinders arranged side-by-side in shallow water. Flow Meas. Instrum. 2004, 15, 187–197. [Google Scholar] [CrossRef] [Scilit]
- Mamoon, A.-A.; Zhao, M.; Wu, H.; Keshavarzi, A. Experimental investigation of local scour around two submerged short square piles under tandem, side-by-side and staggered arrangements in steady current. Ocean Eng. 2022, 261, 112156. [Google Scholar] [CrossRef] [Scilit]
- Adnan, M.; Zhao, M.; Wu, H.; Munir, A.; Dhamelia, V. Experimental Study of Local Scour Around Two Compound Piles in Tandem, Side-by-Side and Staggered Arrangements Under Steady Current. J. Mar. Sci. Eng. 2025, 14, 27. [Google Scholar] [CrossRef] [Scilit]
- Pasupuleti, L.N.; Timbadiya, P.V.; Patel, P.L. Flow fields around tandem and staggered piers on a mobile bed. Int. J. Sediment Res. 2022, 37, 737–753. [Google Scholar] [CrossRef] [Scilit]
- Sohankar, A.; Harandifasih, K.; Mashhadi, A. Numerical investigation of gap spacing and Reynolds number effects on unconfined flow around staggered square cylinders. Phys. Fluids 2025, 37, 013632. [Google Scholar] [CrossRef] [Scilit]
- Rout, A.; Sarkar, A. Local scour around submerged tandem and offset cylinders due to change in alignment angle. In Proceedings of the Institution of Civil Engineers-Water Management; Thomas Telford Ltd.: London, UK, 2020; pp. 14–30. [Google Scholar]
- Yagci, O.; Yildirim, I.; Celik, M.F.; Kitsikoudis, V.; Duran, Z.; Kirca, V.O. Clear water scour around a finite array of cylinders. Appl. Ocean Res. 2017, 68, 114–129. [Google Scholar] [CrossRef] [Scilit]
- Stahlmann, A.; Schlurmann, T. Investigations on scour development at tripod foundations for offshore wind turbines: Modeling and application. In Proceedings of the Coastal Engineering Conference, Santander, Spain, 1–6 July 2012. [Google Scholar]
- Aminoroayaie Yamini, O.; Mousavi, S.H.; Kavianpour, M.R.; Movahedi, A. Numerical modeling of sediment scouring phenomenon around the offshore wind turbine pile in marine environment. Environ. Earth Sci. 2018, 77, 776. [Google Scholar] [CrossRef] [Scilit]
- Stahlmann, A. Experimental and Numerical Modeling of Scour at Foundation Structures for Offshore Wind Turbines; Franzius-Institute for Hydraulic, Estuarine and Coastal Engineering, Leibniz Universität Hannover: Hannover, Germany, 2013. [Google Scholar]
- Hu, R.; Wang, X.; Liu, H.; Chen, D. Numerical study of local scour around tripod foundation in random waves. J. Mar. Sci. Eng. 2022, 10, 475. [Google Scholar] [CrossRef] [Scilit]
- Ma, H.; Yang, J.; Chen, L. Effect of scour on the structural response of an offshore wind turbine supported on tripod foundation. Appl. Ocean Res. 2018, 73, 179–189. [Google Scholar] [CrossRef] [Scilit]
- Adnan, M.; Zhao, M.; Wu, H.; Dhamelia, V. Experimental study of local scour around a compound pile under steady current. Ocean Eng. 2025, 318, 120151. [Google Scholar] [CrossRef] [Scilit]
- Soulsby, R.L. Dynamics of marine sands: A manual for practical applications. Oceanogr. Lit. Rev. 1997, 9, 947. [Google Scholar] [CrossRef] [Scilit]
- Sumer, B.M.; Fredsøe, J. The Mechanics of Scour in the Marine Environment; Advanced Series on Ocean Engineering; World Scientific: Singapore, 2002. [Google Scholar]
- Sumer, B.M.; Fredsøe, J.; Christiansen, N. Scour around vertical pile in waves. J. Waterw. Port Coast. Ocean Eng. 1992, 118, 15–31. [Google Scholar] [CrossRef] [Scilit]
- Malik, R.; Setia, B.; Banik, A. Mechanism of Scouring Around Group of Bridge Piers in Tandem Arrangement. J. Inst. Eng. India Ser. A 2023, 104, 633–642. [Google Scholar] [CrossRef] [Scilit]
- Devi, G.; Kumar, M. Experimental study of the local scour around the two piers in the tandem arrangement using ultrasonic ranging transducers. Ocean Eng. 2022, 266, 112838. [Google Scholar] [CrossRef] [Scilit]
- Zhao, M.; Cheng, L.; Zang, Z. Experimental and numerical investigation of local scour around a submerged vertical circular cylinder in steady currents. Coast. Eng. 2010, 57, 709–721. [Google Scholar] [CrossRef] [Scilit]
- Mamoon, A.-A.; Zhao, M.; Wu, H.; Keshavarzi, A.; Hu, P.; An, H. Local scour around a pipeline sleeper system under different flow directions. Coast. Eng. 2023, 183, 104335. [Google Scholar] [CrossRef] [Scilit]
- Ettema, R.; Kirkil, G.; Muste, M. Similitude of large-scale turbulence in experiments on local scour at cylinders. J. Hydraul. Eng. 2006, 132, 33–40. [Google Scholar] [CrossRef] [Scilit]
- Yao, W.; Draper, S.; An, H.; Cheng, L.; Harris, J.M.; Whitehouse, R.J.S. Experimental study of local scour around submerged compound piles in steady current. Coast. Eng. 2021, 165, 103831. [Google Scholar] [CrossRef] [Scilit]
- Ma, H.; Zhang, S.; Li, B. Numerical investigation of local scour around twin piles under steady current using CFD-DEM coupling method. Comput. Geotech. 2023, 164, 105805. [Google Scholar] [CrossRef] [Scilit]
- Zhao, S.; Ji, C.; Sun, Z.; Yu, H.; Zhang, Z. Effects of the gap on the local scour around two tandem piles in shallow flows. Ocean Eng. 2022, 246, 110575. [Google Scholar] [CrossRef] [Scilit]
- Ataie-Ashtiani, B.; Aslani-Kordkandi, A. Flow field around single and tandem piers. Flow Turbul. Combust. 2013, 90, 471–490. [Google Scholar] [CrossRef] [Scilit]
- Devi, G.; Kumar, M. Characteristics assessment of local scour encircling twin bridge piers positioned side by side (SbS). Sādhanā 2022, 47, 109. [Google Scholar] [CrossRef] [Scilit]
- Malik, R.; Setia, B. Interference between pier models and its effects on scour depth. SN Appl. Sci. 2020, 2, 68. [Google Scholar] [CrossRef] [Scilit]
- Yang, Y.; Melville, B.W.; Macky, G.H.; Shamseldin, A.Y. Local scour at complex bridge piers in close proximity under clear-water and live-bed flow regime. Water 2019, 11, 1530. [Google Scholar] [CrossRef] [Scilit]

Disclaimer/Publisher’s Note: The statements, opinions and data contained in all publications are solely those of the individual author(s) and contributor(s) and not of MDPI and/or the editor(s). MDPI and/or the editor(s) disclaim responsibility for any injury to people or property resulting from any ideas, methods, instructions or products referred to in the content. |
© 2026 by the authors. Licensee MDPI, Basel, Switzerland. This article is an open access article distributed under the terms and conditions of the Creative Commons Attribution (CC BY) license.