


Abstract
Battery-powered propulsion offers a pathway for reducing inland shipping emissions. However, low battery energy density limits sailing range and may require energy replenishment during a voyage, thereby complicating energy and voyage planning for inland electric vessels. Time-of-use (TOU) pricing creates cost-saving opportunities but further complicates planning because energy replenishment and sailing speed are closely coupled. This study develops a joint optimization framework for an inland electric vessel under TOU pricing that determines replenishment ports, technologies, amounts, and leg-specific sailing speeds to minimize total replenishment costs. The problem is formulated as a mixed-integer nonlinear programming model and reformulated as a mixed-integer linear programming approximation through equivalent linearization and speed discretization. A Yangtze River case study with five operating conditions evaluates the proposed framework. The results show that, under the proposed framework, TOU pricing reduces total replenishment costs by 42.4–43.4% compared to fixed pricing. Relative to a sailing-speed optimization benchmark, joint optimization under TOU pricing reduces replenishment costs by 9.8–12.5% and energy consumption by 4.2–5.6%. The cost-saving potential also varies with the voyage time limit, voyage start time, relative charging and battery swapping rates, and the availability of opportunity charging.
1. Introduction
The shipping sector carries over 80% of global trade volume but remains heavily dependent on fossil fuels, accounting for nearly 3% of global greenhouse gas emissions [1]. The environmental impacts of inland shipping are particularly direct at the regional level, as diesel-powered vessels often operate close to densely populated communities and ecologically sensitive areas, directly affecting local air quality and public health while also contributing to climate change [2,3]. Against this background, electrification has attracted growing attention as a means of reducing emissions from inland shipping: shore power can reduce emissions during port stays [4,5], while battery-powered propulsion enables zero direct emissions during navigation [6,7]. Recent advances in battery and renewable power generation technologies have made electric vessels technically viable for inland shipping and increasingly competitive on high-frequency short-haul routes [8,9]. Electric vessels are therefore regarded as an important pathway in the energy transition of inland shipping [10].
However, the energy density of batteries remains substantially lower than that of conventional fuels, limiting the sailing range of battery-powered electric vessels, which is typically less than 200 nautical miles [9]. For inland electric vessels engaged in round-trip cargo transport, the energy stored in onboard batteries may therefore be insufficient to cover a complete voyage. Increasing the number of onboard batteries can extend the sailing range. Nevertheless, this may also increase capital costs, and the additional weight and space requirements of onboard battery systems may reduce the vessel’s allowable cargo load [11]. En-route energy replenishment through charging or battery swapping can substantially reduce the onboard battery capacity required to complete the voyage and alleviate the associated impact on allowable cargo load [12,13]. However, such en-route replenishment also complicates energy and voyage planning because replenishment and sailing speed decisions are closely coupled. Owing to the nonlinear relationship between sailing speed and propulsion power, sailing speed affects sailing time, energy consumption, and consequently replenishment requirements, while replenishment decisions affect both the energy available for subsequent sailing and the additional time required for replenishment. Existing studies have therefore optimized replenishment and sailing speed decisions, either separately or jointly, to reduce replenishment costs while satisfying energy and time constraints. Most of them assume fixed electricity prices, whereas in practice electricity prices may vary over time, with time-of-use (TOU) pricing as a representative scheme. Under TOU pricing, the coupling between replenishment and sailing speed decisions becomes more complex because sailing speed affects not only energy consumption and replenishment requirements but also replenishment timing and the corresponding electricity price. Meanwhile, replenishment decisions influence subsequent sailing schedules and replenishment timing, thereby affecting the applicable electricity prices and the potential to utilize low-price electricity periods. Although electric vessels can reduce replenishment costs by optimizing their responses to TOU electricity price variations, existing studies have focused mainly on adjusting sailing speed to shift replenishment timing. The coordinated decision-making between sailing speed and multidimensional replenishment decisions under TOU pricing remains insufficiently addressed, and its cost-saving potential has yet to be fully explored.
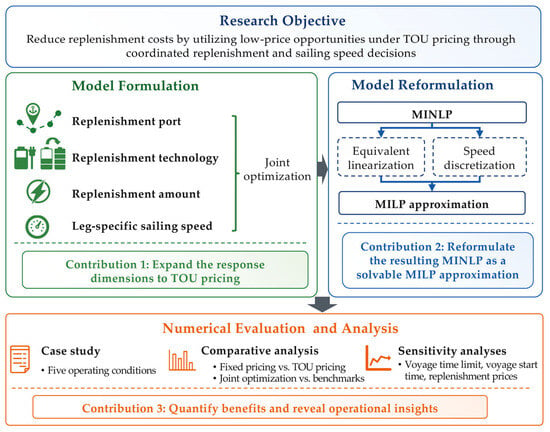
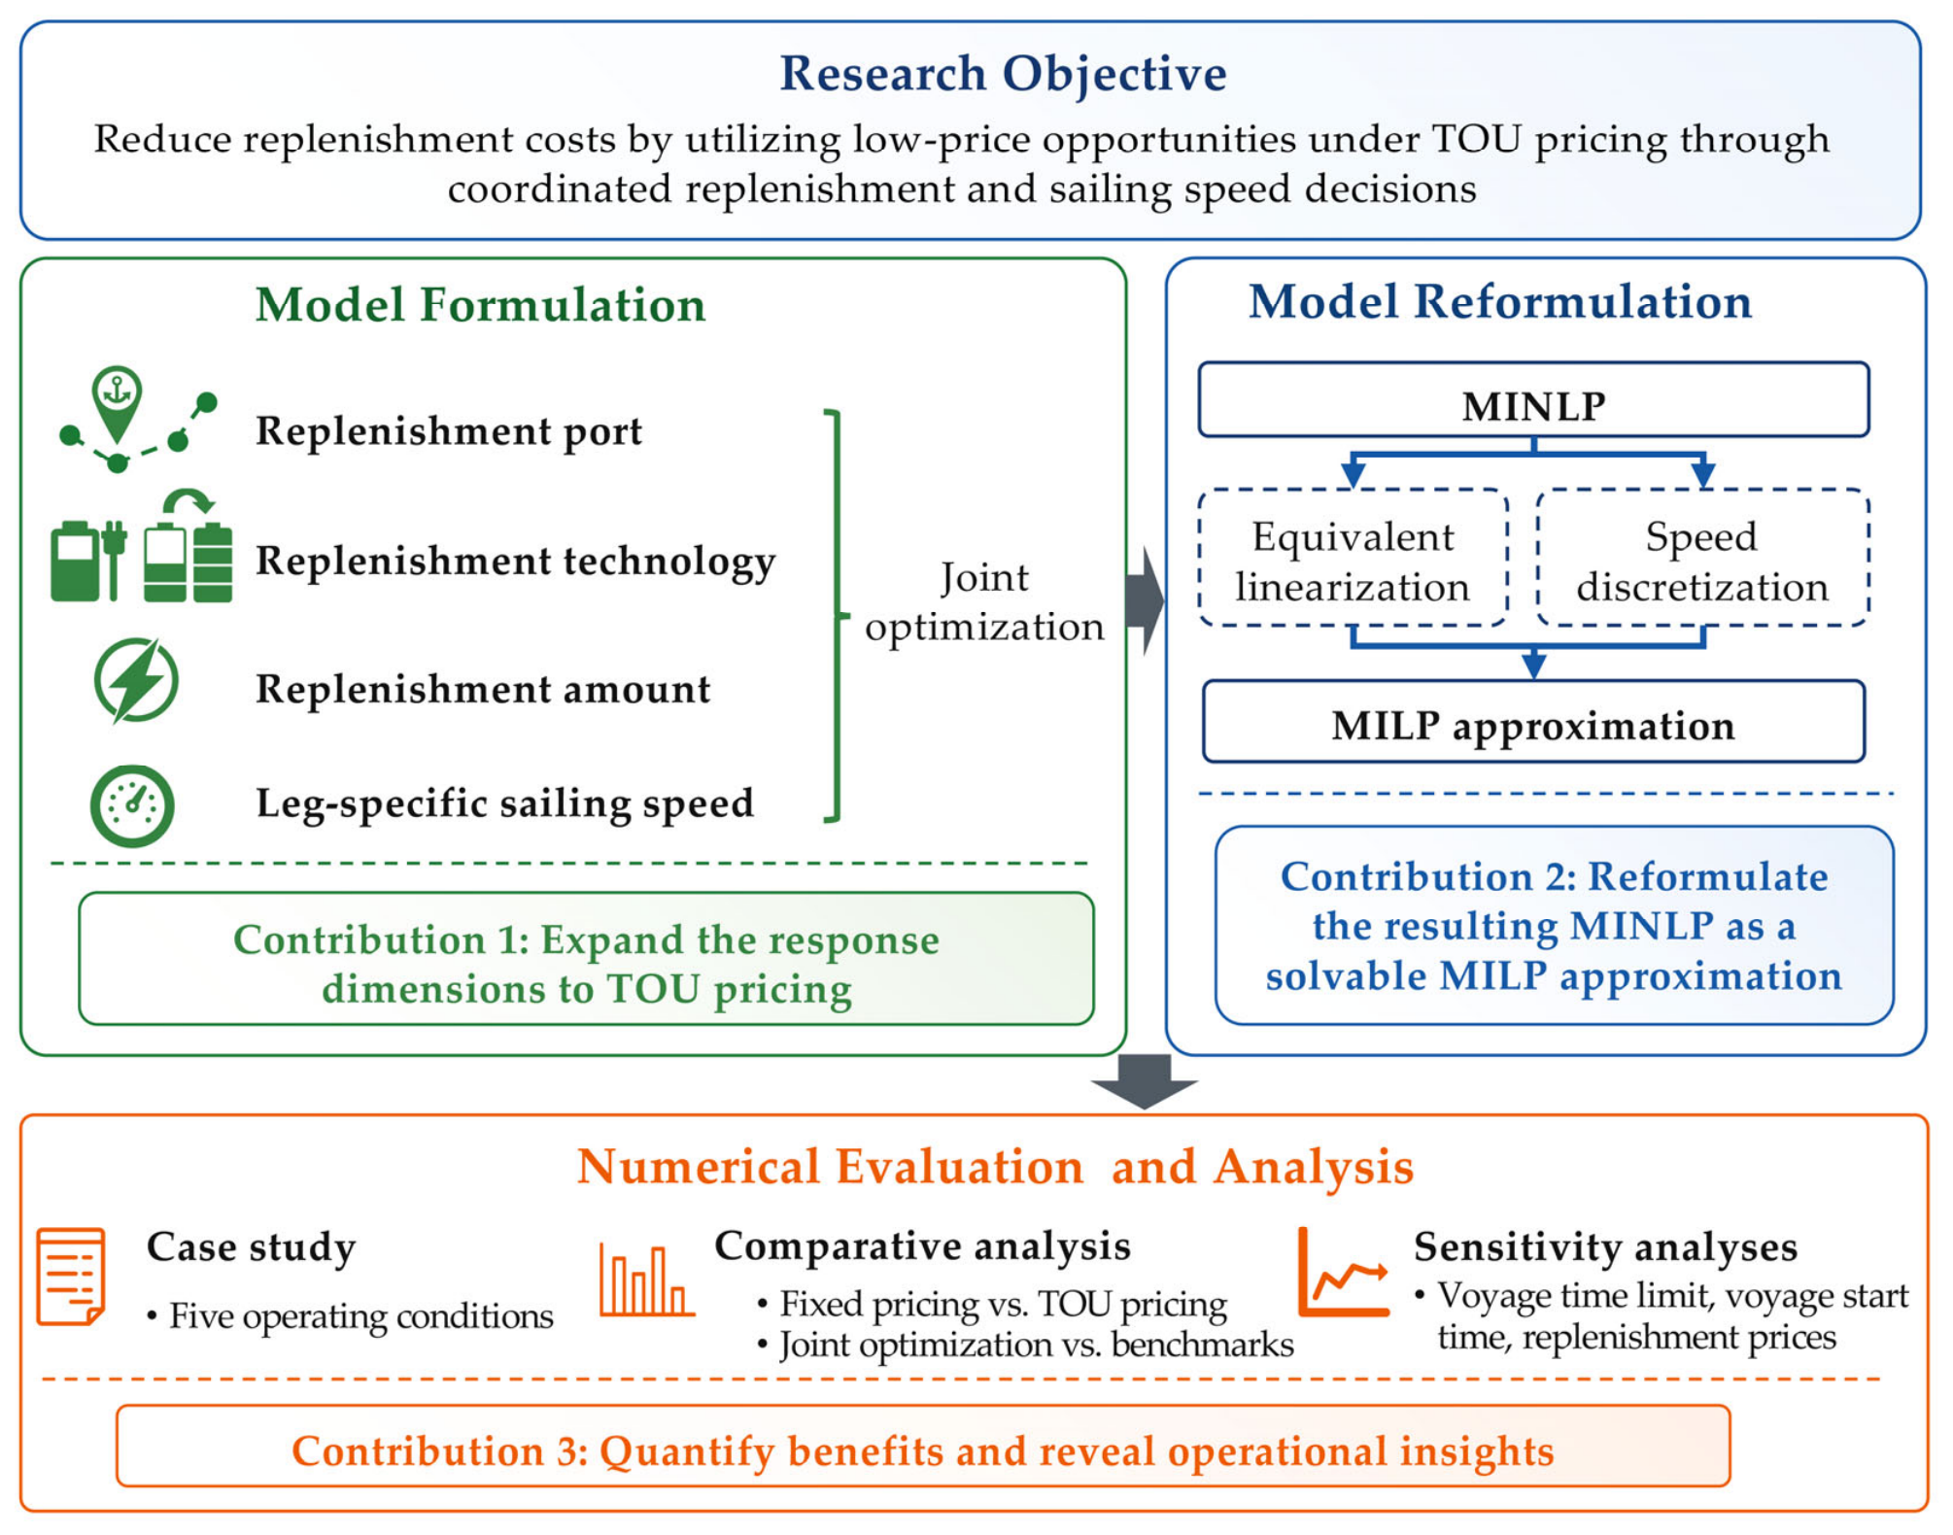
The main contributions of this study are summarized as follows. First, this study develops a coordinated operational response framework that jointly determines where to replenish, how to replenish, how much energy to replenish, and the sailing speed on each leg. Compared to existing studies that respond to time-varying electricity prices mainly through sailing speed adjustments, the proposed framework extends the vessel’s response to TOU pricing beyond sailing speed adjustments to include multidimensional replenishment decisions, thereby improving its ability to utilize low-price replenishment opportunities. Second, this study develops a tractable solution approach that reformulates the resulting mixed-integer nonlinear programming (MINLP) model as a mixed-integer linear programming (MILP) approximation solvable by commercial solvers. The nonlinearities associated with opportunity charging, discrete battery swapping decisions, the coordination of charging and battery swapping, and TOU pricing are reformulated exactly, while those associated with sailing speed are handled through speed discretization. Third, a comprehensive case study comprising a series of numerical experiments and in-depth analyses is conducted to evaluate the cost-saving potential of responding to TOU pricing and demonstrate the advantages of the proposed framework. The results further reveal how operational conditions and replenishment pricing structures shape the vessel’s optimal response to TOU pricing. Figure 1 summarizes the overall research framework, with the three main contributions highlighted at the corresponding stages.
Figure 1.
Research framework and main contributions of this study.
2. Literature Review
In conventional shipping, bunker fuel management typically involves three interrelated decisions: where to bunker, how much fuel to bunker, and how to adjust sailing speed [14,15,16]. These decisions are often optimized jointly to reduce bunker fuel consumption and related costs. For electric vessels, the corresponding decisions are where to replenish energy, how much energy to replenish, and how to adjust sailing speed. Specifically, the replenishment amount is represented differently in the charging and battery swapping modes: the charging mode involves determining a continuous charging amount, whereas the battery swapping mode involves determining a discrete number of batteries to be swapped [17]. Moreover, the limited onboard battery capacity and the substantial time required for energy replenishment, especially charging, make these decisions particularly important for electric vessels. These decisions may directly determine whether a vessel can complete its voyage while satisfying both energy and time constraints. Existing studies have therefore optimized replenishment and sailing speed decisions, either separately or jointly, to ensure voyage feasibility while reducing replenishment costs, energy consumption, and voyage time.
Zhang et al. [18] considered a charging scenario in which the vessel could charge only at the departure and destination ports. To maximize profit over the battery life cycle, they developed a bilevel optimization framework, with the upper level optimizing sailing speed and the lower level determining battery capacity and charging amounts. A differential evolution (DE) algorithm was used to solve the resulting problem. Gu et al. [19] formulated an MINLP model to jointly optimize battery swapping station selection and hourly sailing speeds, with the objective of minimizing battery swapping costs. Using piecewise linearization and the big-M method, the model was reformulated as an MILP model and then solved using a commercial solver. Zhang et al. [20] proposed a sailing speed optimization framework integrating K-means-based waterway segmentation, dynamic energy consumption modeling, and bi-objective optimization to balance energy consumption and voyage time. This framework enabled more refined sailing speed optimization by accounting for varying navigational conditions and multiple objectives, although it did not consider energy replenishment. Complementing these studies, Guo et al. [17] focused on improving replenishment flexibility and proposed a multi-technology partial replenishment (MT-PR) strategy. The strategy allows vessels equipped for both charging and battery swapping to select from multiple replenishment options, including charging technologies with different power ratings and battery swapping. It also allows vessels to determine the amount of energy charged or the number of batteries swapped at each replenishment operation, rather than requiring full replenishment. Based on this strategy, replenishment ports, technologies, and amounts were jointly optimized to minimize total replenishment costs, without considering sailing speed decisions.
As pricing mechanisms for charging and battery swapping services continue to evolve, exploiting temporal electricity price variations to reduce replenishment costs has become an increasingly important consideration in operational planning. This is particularly relevant to commercial electric vehicles and vessels, whose frequent replenishment needs make their operating costs highly sensitive to electricity prices. For example, Deng et al. [21] jointly optimized vehicle routing and charging schedules for a fleet of electric logistics vehicles under TOU pricing. The results showed that temporal price differentials incentivized the fleet to shift its charging activities from high-price to low-price periods, reducing charging costs by approximately 7% compared with a fixed price scenario. For electric vessels, Zhang et al. [22] developed a speed and energy optimization approach under TOU pricing. By adjusting the sailing speed on each leg, the vessel could arrive at battery swapping stations during low-price periods, thereby reducing battery swapping costs. Using a differential evolution algorithm incorporating neighborhood search, the study obtained a battery swapping cost reduction of approximately 14% compared to a fixed price scenario. Sun et al. [23] and Yang et al. [24] further jointly optimized voyage start time and leg-specific sailing speeds to adjust vessel arrival and replenishment times in response to time-varying electricity prices, thereby reducing charging and battery swapping costs, respectively.
Recent studies have also extended this line of research from the individual-vessel level to the fleet level, particularly by coordinating shared replenishment resources and integrating fleet operations with replenishment infrastructure planning [25,26,27,28,29]. Detailed vessel-level models nevertheless provide an operational foundation for representing individual-vessel decisions in such system-level optimization.
Overall, prior studies have examined energy replenishment and sailing speed optimization for electric vessels across different replenishment modes, combinations of decision variables, optimization objectives, and operational levels. Recent studies considering TOU pricing have mainly optimized sailing speeds, sometimes jointly with departure times, to align vessel arrivals and replenishment operations with low-price periods. However, limited attention has been paid to how sailing speed and multidimensional replenishment decisions can be coordinated in response to TOU pricing. This limitation is particularly relevant because sailing speed and replenishment decisions are closely coupled. Moreover, under fixed price scenarios, simultaneous determination of replenishment ports, technologies, and amounts has already shown considerable cost-saving potential. Building on these findings, this study develops a joint optimization model for an inland electric vessel under TOU pricing by extending the decision space to include leg-specific sailing speeds. The resulting model captures price variations across ports and time periods together with the differences in replenishment duration and pricing rules between charging and battery swapping.
3. Problem Formulation
3.1. Problem Description
This study investigates the joint optimization of energy replenishment and sailing speed for an inland electric vessel under TOU electricity pricing. We consider a vessel performing round-trip cargo transport on a fixed route, sailing from the departure port to the destination port and then returning to the departure port. The vessel departs with fully charged batteries to supply power to the propulsion and service loads. Upon returning to the departure port, the onboard battery system is fully replenished through charging or battery swapping before the next voyage. During the voyage, scheduled cargo handling operations are performed at designated ports along the route, including the departure and destination ports. A complete voyage begins when cargo handling starts at the departure port and ends when the vessel returns to the departure port and completes the scheduled cargo handling and final energy replenishment there. The voyage must be completed within a given time limit.
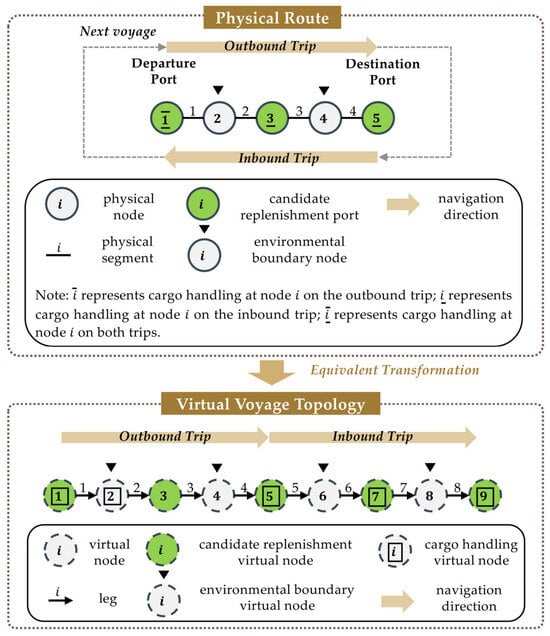
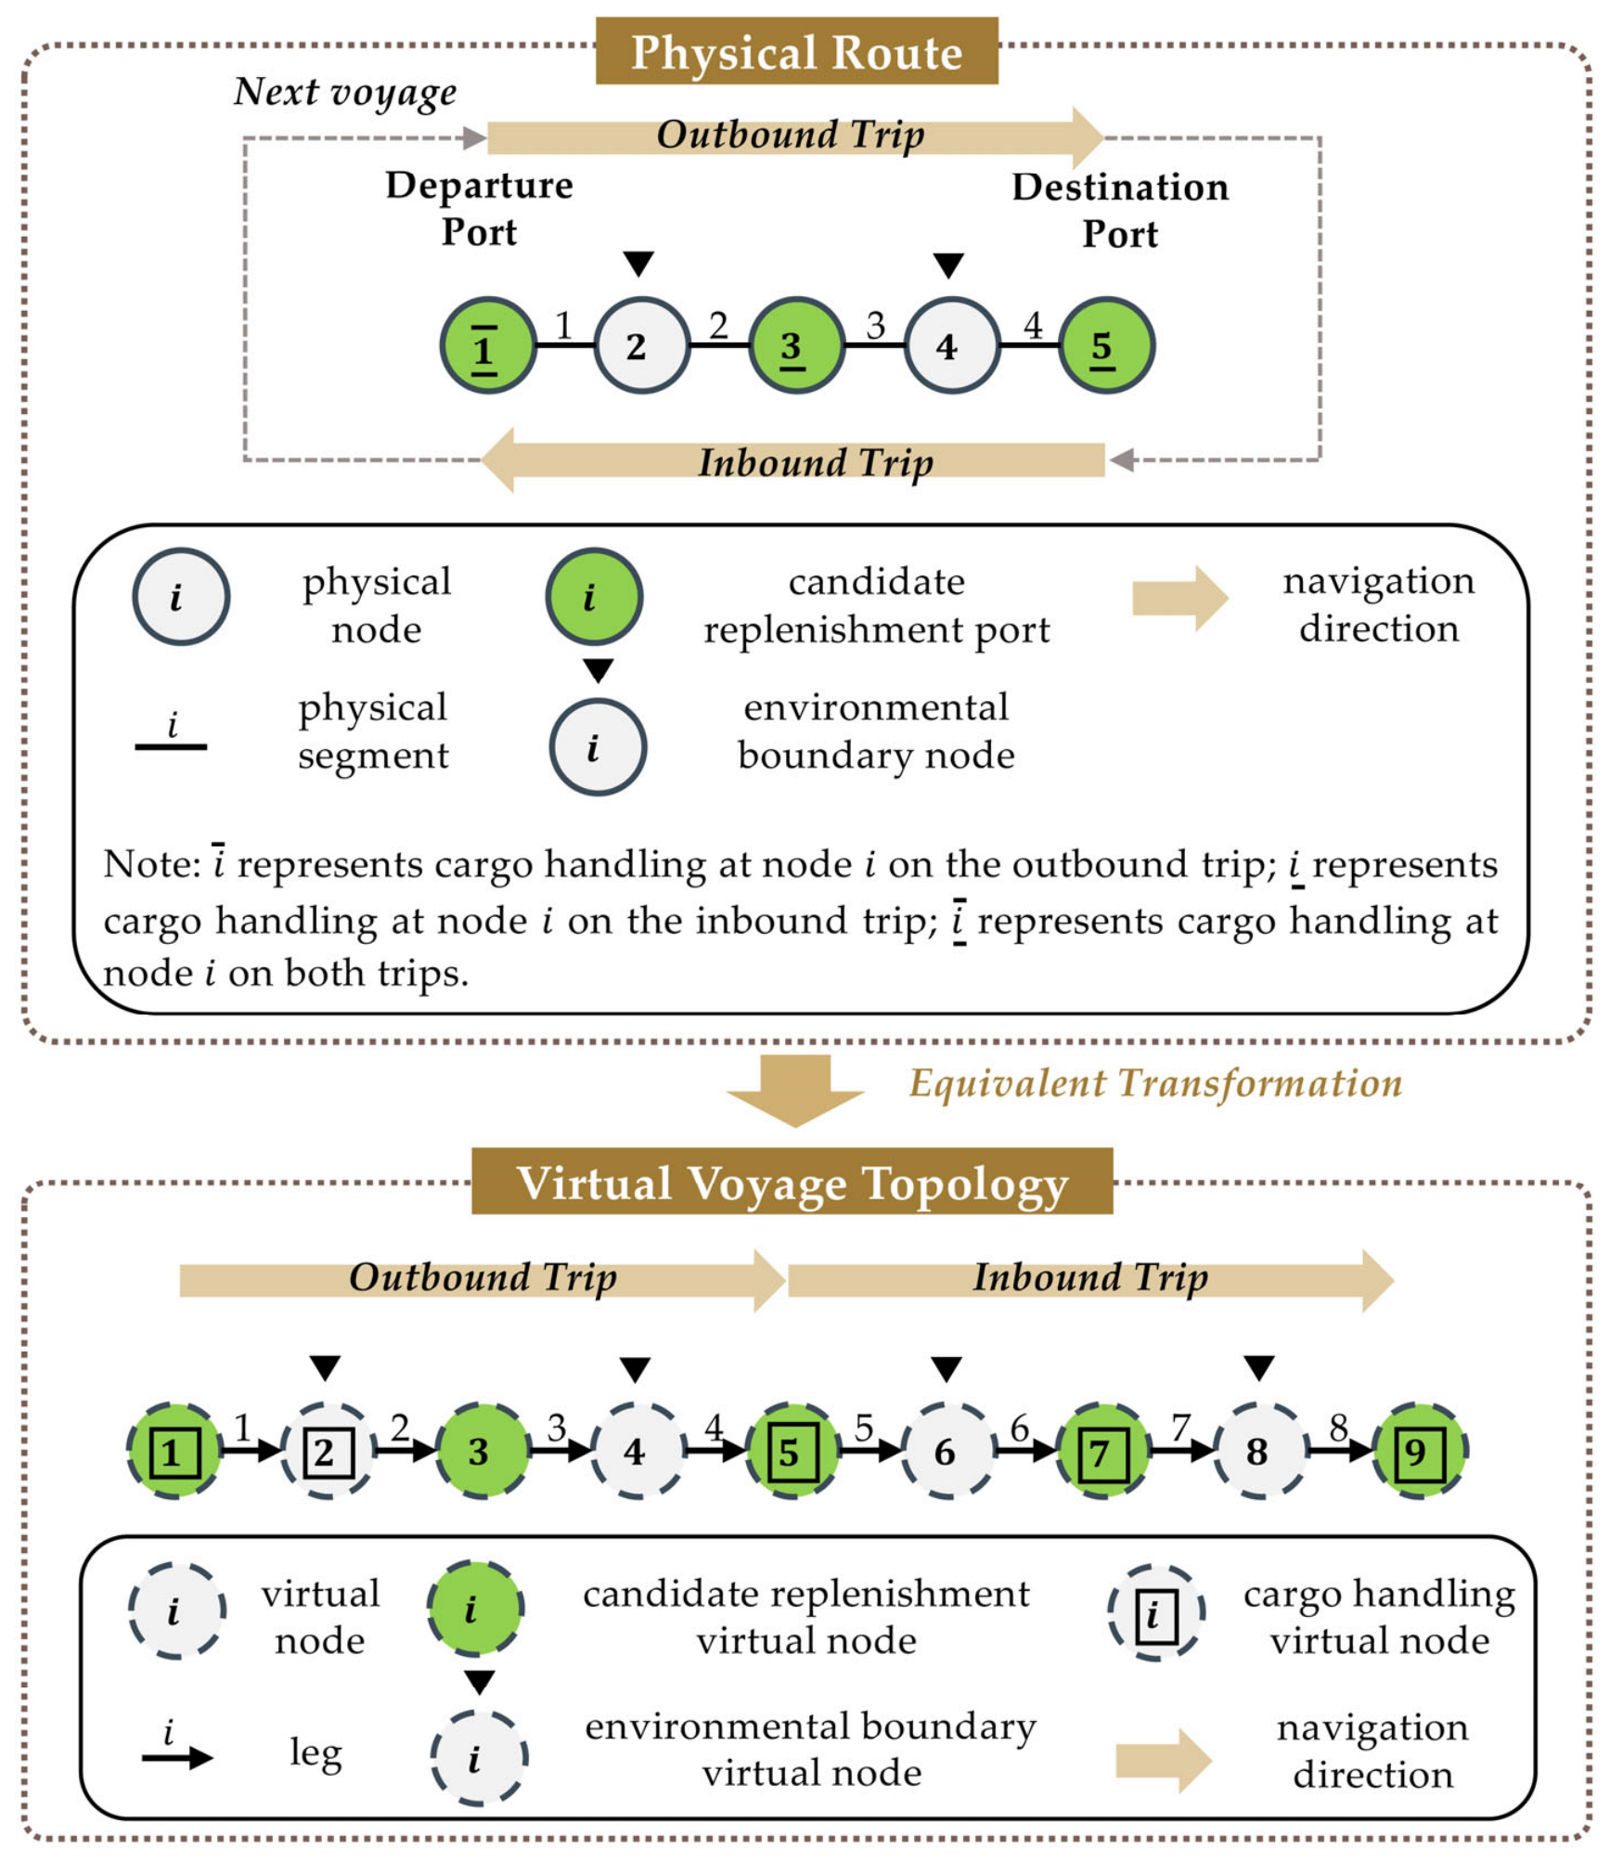
The physical route consists of physical nodes and physical segments, where physical segment connects physical nodes and (). Each physical node may represent a port, an environmental boundary, or both. Ports where scheduled loading and unloading operations are performed are defined as cargo handling ports, while ports equipped with charging facilities, battery swapping facilities, or both are defined as candidate replenishment ports. A physical node, whether or not it represents a port, is defined as an environmental boundary node if it marks a change in navigational conditions, such as water speed, water depth, or speed limits. During a complete round trip, the vessel visits the physical nodes in the sequence . Except for node , where the outbound trip ends and the inbound trip begins, each physical node is visited twice, corresponding to the outbound and inbound visits. The two visits may involve different arrival times, remaining battery energy, cargo handling requirements, and replenishment decisions. Similarly, the same physical segment is traversed in opposite directions and may involve different sailing speeds, sailing times, and energy consumption. To represent these visit-specific states and decisions in chronological order, the closed round-trip route is transformed into a directed path consisting of virtual nodes and directed legs. For each physical node (), virtual nodes and represent its outbound and inbound visits, respectively, while physical node corresponds to a single virtual node . Accordingly, physical segment corresponds to outbound leg and inbound leg . Each virtual node thus represents a unique visit to a physical node in the voyage sequence, allowing the associated time, energy, and replenishment states to be indexed and updated sequentially, thereby facilitating the formulation of the optimization model. Figure 2 illustrates the mapping of physical nodes and segments to virtual nodes and directed legs, including the inheritance of node attributes.
Figure 2.
Equivalent transformation of the round-trip physical route into a virtual voyage topology.
The unit replenishment rate depends on the selected replenishment technology and the applicable TOU electricity price, which varies across ports and time periods. The vessel can therefore respond to rate variations by coordinating its replenishment decisions with the sailing speed on each leg.
The replenishment decisions considered include where to replenish, how to replenish, and how much energy to replenish. Specifically, at each candidate replenishment virtual node, the vessel may choose charging, battery swapping, or no replenishment, subject to the facilities available at the corresponding port. The amount charged is treated as a continuous variable, while the number of batteries swapped is modeled as an integer variable. Compared to charging, battery swapping generally requires less time but incurs a higher unit replenishment cost. At a cargo handling node equipped with charging facilities, charging may be performed concurrently with cargo handling in the form of opportunity charging, whereas battery swapping must be performed separately for safety reasons. If a charging operation spans multiple TOU periods, its cost is calculated by summing the energy charged in each period at the corresponding rate. By contrast, the battery swapping cost is calculated using the rate applicable at the start of the operation, regardless of the TOU periods spanned. This reflects the fact that replacement batteries are generally charged in advance and managed as station inventory.
The sailing speed on each leg determines sailing time and energy consumption, and thus the vessel’s arrival time and remaining energy at subsequent nodes. Arrival time determines the applicable TOU rate, while remaining energy affects whether and how much replenishment is needed. Together with facility availability and operation time requirements, these factors influence the choice of replenishment location, technology, and timing. Conversely, the selected replenishment technology and amount determine replenishment duration, which in turn influences the remaining sailing time. This creates a close coupling between sailing speed and energy replenishment decisions.
The objective is to minimize total replenishment costs by jointly optimizing the sailing speed on each leg and the replenishment decisions under TOU electricity pricing, subject to constraints on energy management, voyage scheduling, and replenishment operations.
3.2. Summary of Assumptions
- (1)
- The problem is formulated as a deterministic optimization problem. The route, cargo handling plan, navigation conditions, TOU electricity prices, and other operating parameters are assumed to be known before departure. Accordingly, the water speed on each physical segment is treated as a known deterministic parameter and is assumed not to vary over time during the voyage, while uncertainties such as queueing at replenishment ports are not considered.
- (2)
- The vessel maintains a constant speed through water on each leg. The propulsion power is generally approximated by a cubic polynomial in sailing speed under a given operating condition, while the service power during sailing is constant.
- (3)
- Each onboard battery operates within predefined lower and upper state of charge (SOC) limits throughout the voyage to ensure safe and reliable operation. Battery degradation over a single voyage is not considered in this study.
- (4)
- Batteries are discharged sequentially in ascending order of SOC and charged sequentially in descending order of SOC. Under these rules, at most one battery can have an SOC between the lower and upper limits at any time [17].
- (5)
- Except for the final replenishment upon return to the departure port, only batteries at the lower SOC limit may be swapped, and each charging operation is subject to a minimum charging amount.
- (6)
- The preparation time before energy replenishment is assumed to equal half of the port auxiliary time. At ports with scheduled cargo handling, charging begins after preparation, whereas battery swapping begins only after cargo handling is completed.
3.3. Mathematical Model
3.3.1. Notation
Since the optimization model is formulated on the transformed voyage topology, all nodes appearing in the formulation below refer to virtual nodes unless stated otherwise. The model uses the following indices and sets:
- : index of nodes; also used to denote the leg originating from the corresponding node;
- : index of electricity price periods;
- : set of all nodes in a complete voyage, {1}, where denotes the number of physical nodes of the route;
- : set of cargo handling nodes, ;
- : set of candidate replenishment nodes, ;
- : sets of candidate charging and battery swapping nodes, respectively, , , ;
- : set of electricity price periods.
Based on the above indices and sets, the model jointly optimizes the sailing speed on each leg and the energy replenishment decisions under TOU electricity pricing. The corresponding decision variables are as follows:
- : charging selection indicator at node (1 if charging is selected; 0 otherwise);
- : battery swapping selection indicator at node (1 if battery swapping is selected; 0 otherwise);
- : amount of energy charged at node (kWh);
- : number of batteries swapped at node ;
- : sailing speed through water on leg (km/h).
According to Assumption (2), represents the propulsion power (kW) on leg at sailing speed .
Table 1 summarizes the remaining model notation.
Table 1.
Model parameters and auxiliary variables.
3.3.2. Objective Function
The objective function (1) minimizes total replenishment costs, which consist of charging and battery swapping costs:
where the first term represents the charging cost calculated based on the energy charged in each TOU period, and the second term represents the battery swapping cost determined by the TOU price applicable at the start of the swapping operation.
3.3.3. Constraints
- (1)
- Sailing speed and power constraints
Constraints (2) and (3) impose the feasible ranges of the vessel’s sailing speed through water and speed over ground, respectively. Under the sign convention defined for , the speed over ground is expressed as on outbound legs and on inbound legs. Constraint (4) determines the sailing time for each leg from its distance and speed over ground. Constraint (5) determines the total battery discharge power by considering the propulsion load, service load, and corresponding transmission efficiencies. Constraint (6) ensures that the battery discharge power remains within its allowable range.
- (2)
- Voyage and replenishment time constraints
Constraint (7) sets the arrival time at the first node equal to the voyage starting time. Constraint (8) determines the arrival time at each subsequent node based on the arrival time at the preceding node, accounting for sailing time, scheduled port time, and additional time associated with energy replenishment. Constraint (9) decomposes the additional replenishment time into the additional port call time and the additional operation times associated with charging and battery swapping. Constraint (10) accounts for the additional port auxiliary time incurred when replenishment is conducted at a node without scheduled cargo handling. Thus, when the vessel makes an additional visit to such a node for replenishment, both the replenishment operation time and the port auxiliary time associated with the additional visit are included in the voyage time. Constraints (11) and (12) determine the additional operation times caused by charging beyond the scheduled cargo handling time and by battery swapping, respectively. Accordingly, when the charging duration at a cargo handling node is fully accommodated within the scheduled cargo handling time, charging does not add any additional operation time to the voyage. If the charging duration exceeds the scheduled cargo handling time, only the excess charging time is counted as additional operation time. For non-cargo-handling nodes, . Constraints (13)–(16) define the starting and ending times of the charging and battery swapping operations. Constraint (17) ensures that the voyage is completed within the given time limit.
- (3)
- TOU charging allocation constraints
Constraint (18) calculates the overlap duration between the charging interval at node and TOU period . Constraint (19) determines the charging energy allocated to each TOU period based on the corresponding overlap duration. Constraint (20) ensures that the total charging energy at each node equals the sum of the charging energy allocated across all TOU periods.
- (4)
- Battery energy balance constraints
Constraint (21) specifies the vessel’s initial energy level, with all onboard batteries at their upper SOC limit. Constraint (22) defines the energy balance between consecutive nodes by accounting for energy consumption and replenishment through charging and battery swapping. Constraint (23) ensures that the vessel reaches each node without its remaining energy falling below the lower energy bound.
- (5)
- Replenishment decision constraints
Constraints (24)–(27) jointly determine the replenishment technology and replenishment amount at the final node, ensuring that the vessel’s battery energy is replenished to its upper limit. Constraint (24) requires the vessel to select either charging or battery swapping. When charging is selected, Constraint (25) determines the charging amount. When battery swapping is selected, Constraint (26) determines the number of batteries to be swapped, where denotes the ceiling of , i.e., the smallest integer greater than or equal to . Constraint (27) calculates the corresponding amount of energy replenished.
Constraints (28)–(31) jointly define the replenishment decisions at the intermediate candidate replenishment nodes. Constraint (28) ensures that at most one replenishment technology is selected. When charging is selected, Constraint (29) bounds the charging amount between the minimum allowable amount and the amount required to bring the vessel’s battery energy to its upper limit. When battery swapping is selected, Constraint (30) requires at least one battery to be swapped and limits the number swapped to the number of batteries at the lower SOC limit. Here, denotes the largest integer not exceeding . Constraint (31) calculates the corresponding amount of energy replenished.
Constraints (32) and (33) set the variables associated with charging and battery swapping decisions to zero, respectively, at nodes where the corresponding technology is unavailable.
- (6)
- Variable domains and zero-fixing constraints
Constraints (34)–(42) specify the domains of the model variables. For notational convenience, replenishment-related variables are indexed over the entire node set; this indexing convention does not affect the feasible set owing to Constraints (32) and (33).
3.4. Solution Approach
The proposed formulation is an MINLP with three main sources of nonlinearity: energy replenishment decisions, the representation of TOU price periods and pricing rules, and sailing speed decisions. These nonlinearities, together with the discrete decisions, make the model more computationally demanding. They are commonly handled through linearization, transforming the original model into an MILP formulation that can be solved by commercial solvers. For problems with more complex structures or substantially larger instances, heuristic or metaheuristic algorithms are often adopted to obtain high-quality solutions, although global optimality is generally not guaranteed.
Since the vessel considered in this study operates on a fixed route without routing decisions, the problem scale remains manageable. Therefore, a combination of exact reformulation and speed discretization is adopted. The nonlinearities associated with energy replenishment decisions and TOU price periods and pricing rules are reformulated exactly, while those associated with sailing speed are handled through speed discretization. The resulting MILP approximation is solved using Gurobi.
3.4.1. Exact Reformulation of Replenishment-Related Nonlinearities
Nonlinearities related to replenishment arise from the maximum operator in Constraint (11), products involving binary and continuous variables in Constraints (25), (27), and (29), and the ceiling and floor operators in Constraints (26) and (30). These nonlinearities are exactly reformulated using auxiliary binary variables and the big- method, together with the integrality of .
By introducing a binary variable , Constraint (11) can be equivalently reformulated as:
where is a valid upper bound derived from the feasible range of the charging duration. Together with , Constraint (43) is equivalent to Constraint (11).
Using the big- method, Constraints (25), (27), and (29) are exactly reformulated as Constraints (44)–(46), respectively:
where is a valid upper bound on the energy required to replenish the onboard batteries to their upper SOC limit and is set to .
By exploiting the integrality of , Constraints (26) and (30) are exactly reformulated as Constraints (47) and (48), respectively:
where is a sufficiently small positive constant, and is a valid upper bound on the number of batteries that can be swapped and is set to .
3.4.2. Exact Reformulation of TOU-Related Nonlinearities
Nonlinearities related to TOU pricing arise from the piecewise electricity price in Objective Function (1) and the nested maximum, minimum, and positive part operators in Constraint (18). These nonlinearities are exactly reformulated using auxiliary variables and the big- method.
To determine the TOU period applicable to each battery swapping operation, a binary variable is introduced, which equals 1 if , and 0 otherwise:
The relationship between and is enforced by:
where is a sufficiently small positive constant, and is a valid upper bound derived from the voyage time horizon and is used to deactivate the time interval constraints when . The applicable electricity price can then be expressed as .
To linearize the resulting product , a nonnegative auxiliary variable is introduced:
where is a valid upper bound on and is set to .
Objective Function (1) can therefore be equivalently reformulated as:
For Constraint (18), the overlap calculation is decomposed and reformulated layer by layer. First, auxiliary variables and are introduced to represent :
Next, auxiliary variables and are introduced to represent :
Finally, by introducing a binary variable , the overlap duration is reformulated as:
Here, and are valid upper bounds derived from the voyage time horizon. Constraints (53)–(55) constitute an exact linear reformulation of Constraint (18).
3.4.3. Sailing Speed Discretization
Nonlinearities related to sailing speed arise from the fractional sailing time function in Constraint (4), the nonlinear power–speed relationship in Constraint (5), and the product of battery discharge power and sailing time in Constraint (22). These nonlinearities are all functions of the sailing speed through water and are handled uniformly through speed discretization. Specifically, speed discretization approximates the continuous feasible speed range by a finite set of candidate speeds and introduces binary variables to indicate the speed selected for each leg. This approach has been widely used in ship scheduling to handle nonlinear relationships among sailing speed, sailing time, and energy consumption [30,31,32,33].
The feasible speed range is uniformly discretized into candidate speeds, denoted by , where , . A binary variable is introduced to indicate whether candidate speed is selected on leg . Exactly one candidate speed is selected for each leg:
The sailing speed through water on leg is then expressed as:
For each leg and candidate speed , the corresponding sailing time and battery discharge power are calculated in advance using Constraints (4) and (5), respectively. They are therefore treated as constants in the reformulated model. The sailing time and battery discharge power can be represented as:
Accordingly, the product in Constraint (22) can be directly replaced by . Constraint (22) is therefore reformulated as:
After the exact reformulation of the replenishment and TOU related nonlinearities and the discretization of sailing speed, the original MINLP is reformulated as an MILP approximation. The resulting MILP is given as:
subject to
Constraints (2), (3), (6)–(10), (12)–(17), (19)–(21), (23), (24), (28), (31)–(51), and (53)–(60), where , , , , , are binary variables, and , are nonnegative continuous variables.
4. Case Study
All computations are performed on a laptop with an Intel Core i5-1135G7 processor (2.40 GHz) and 16 GB of memory. The model is coded in Python 3.12.9 and solved with Gurobi 12.0.2. Each instance is given a maximum runtime of 3600 s, with the relative MIP optimality gap fixed at 0.01%.
4.1. Case Description and Parameter Settings
The case study builds on the operational setting presented by Zhang et al. [22], which considers an inland electric vessel operating between Chenglingji Port and Nantong Port along the Yangtze River for round-trip cargo transport. Table 2 lists the principal particulars of the target vessel.
Table 2.
Principal particulars of the target vessel.
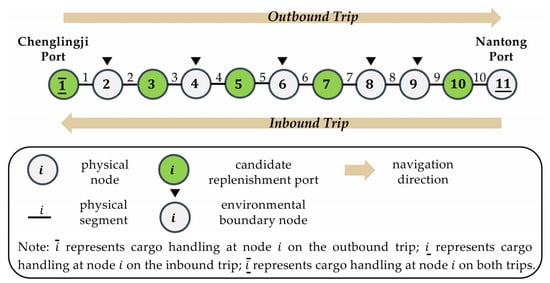
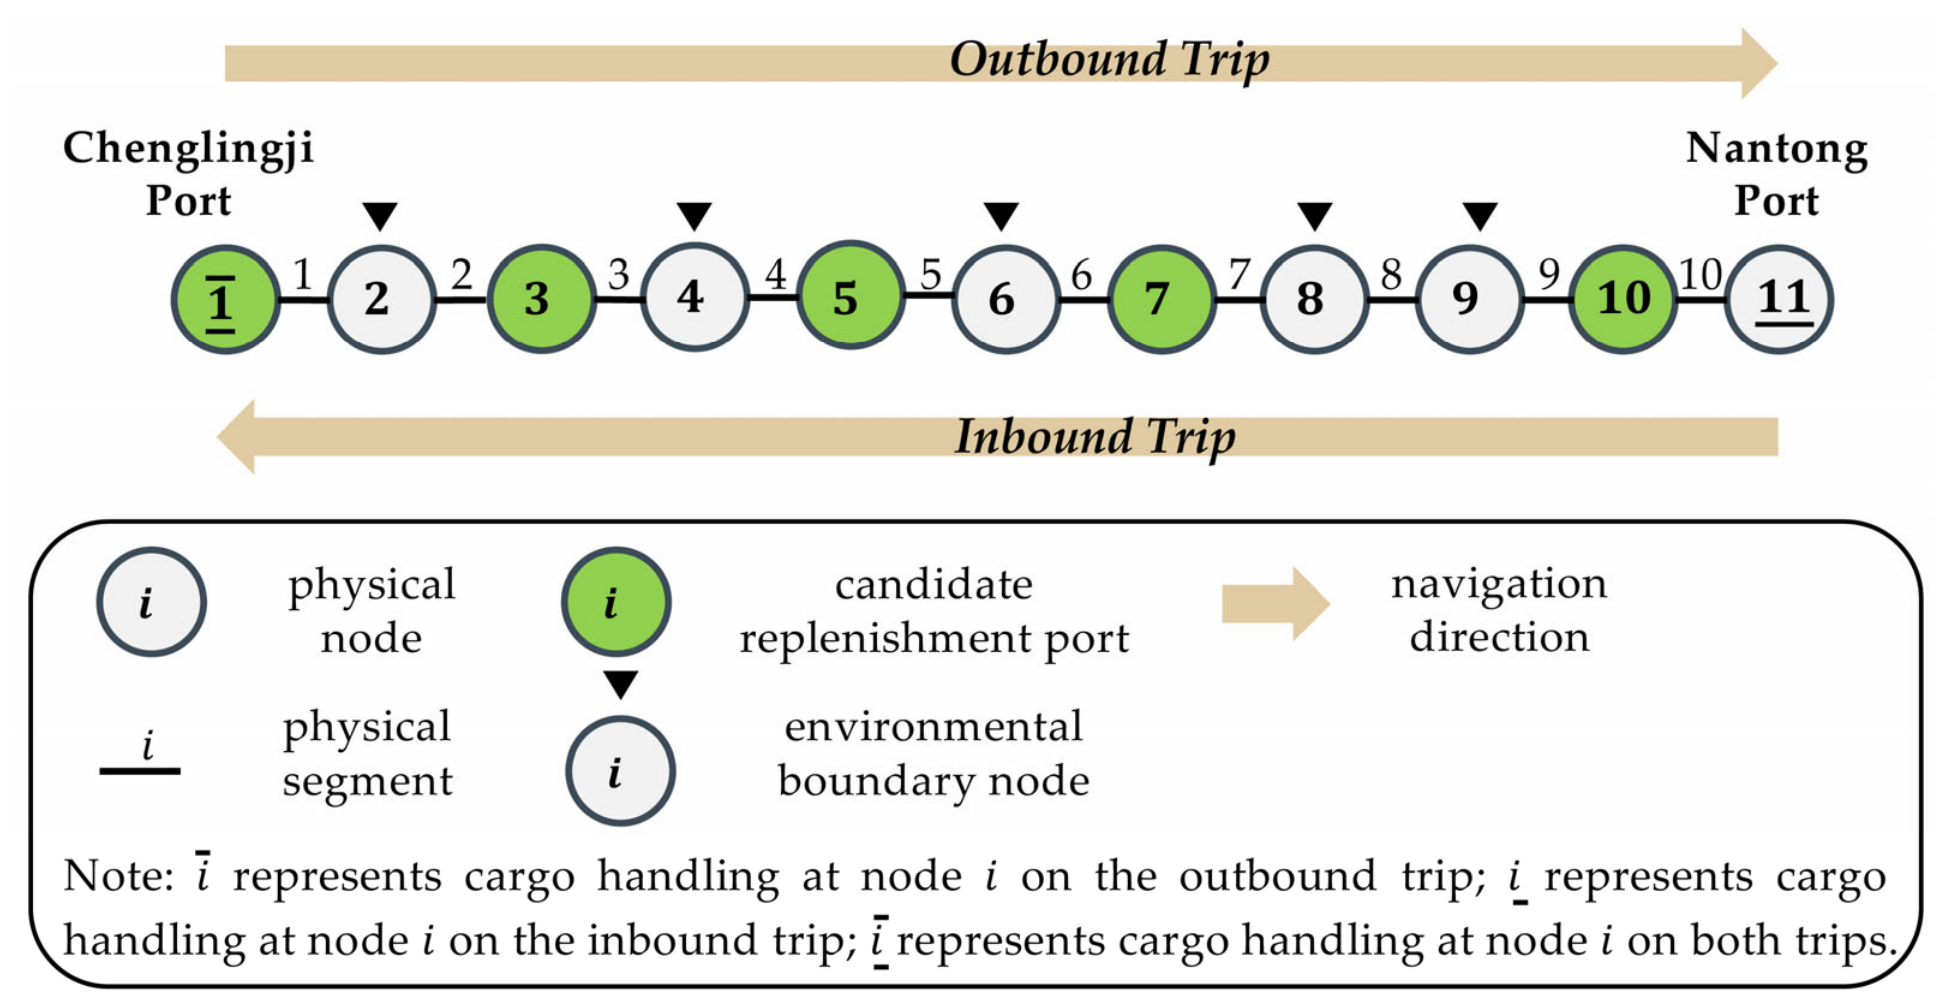
The distance between the two ports is 1155 km, and the route contains ten physical segments and five candidate replenishment ports, as illustrated by Figure 3. The round trip is therefore represented as a linear sequence of 21 virtual nodes and 20 directed legs. The target vessel is equipped with 12 batteries, each with a rated capacity of 1940 kWh. This setting is well suited for evaluating the proposed model. Its long voyage, multiple segments and candidate replenishment ports, and large number of onboard batteries provide substantial flexibility for optimizing replenishment and sailing speed decisions. Moreover, the seasonal and spatial variations in water speed and water depth are represented by five typical operating conditions. Under the given battery configuration, the allowable cargo load is determined by the minimum water depth along the route, and separate propulsion power-speed functions are used for different cargo loads. These characteristics allow the proposed model to be evaluated under diverse navigation and loading conditions.
Figure 3.
Illustration of the target route.
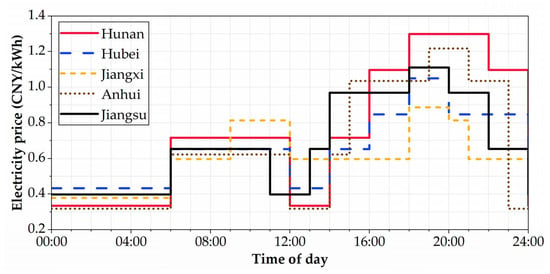
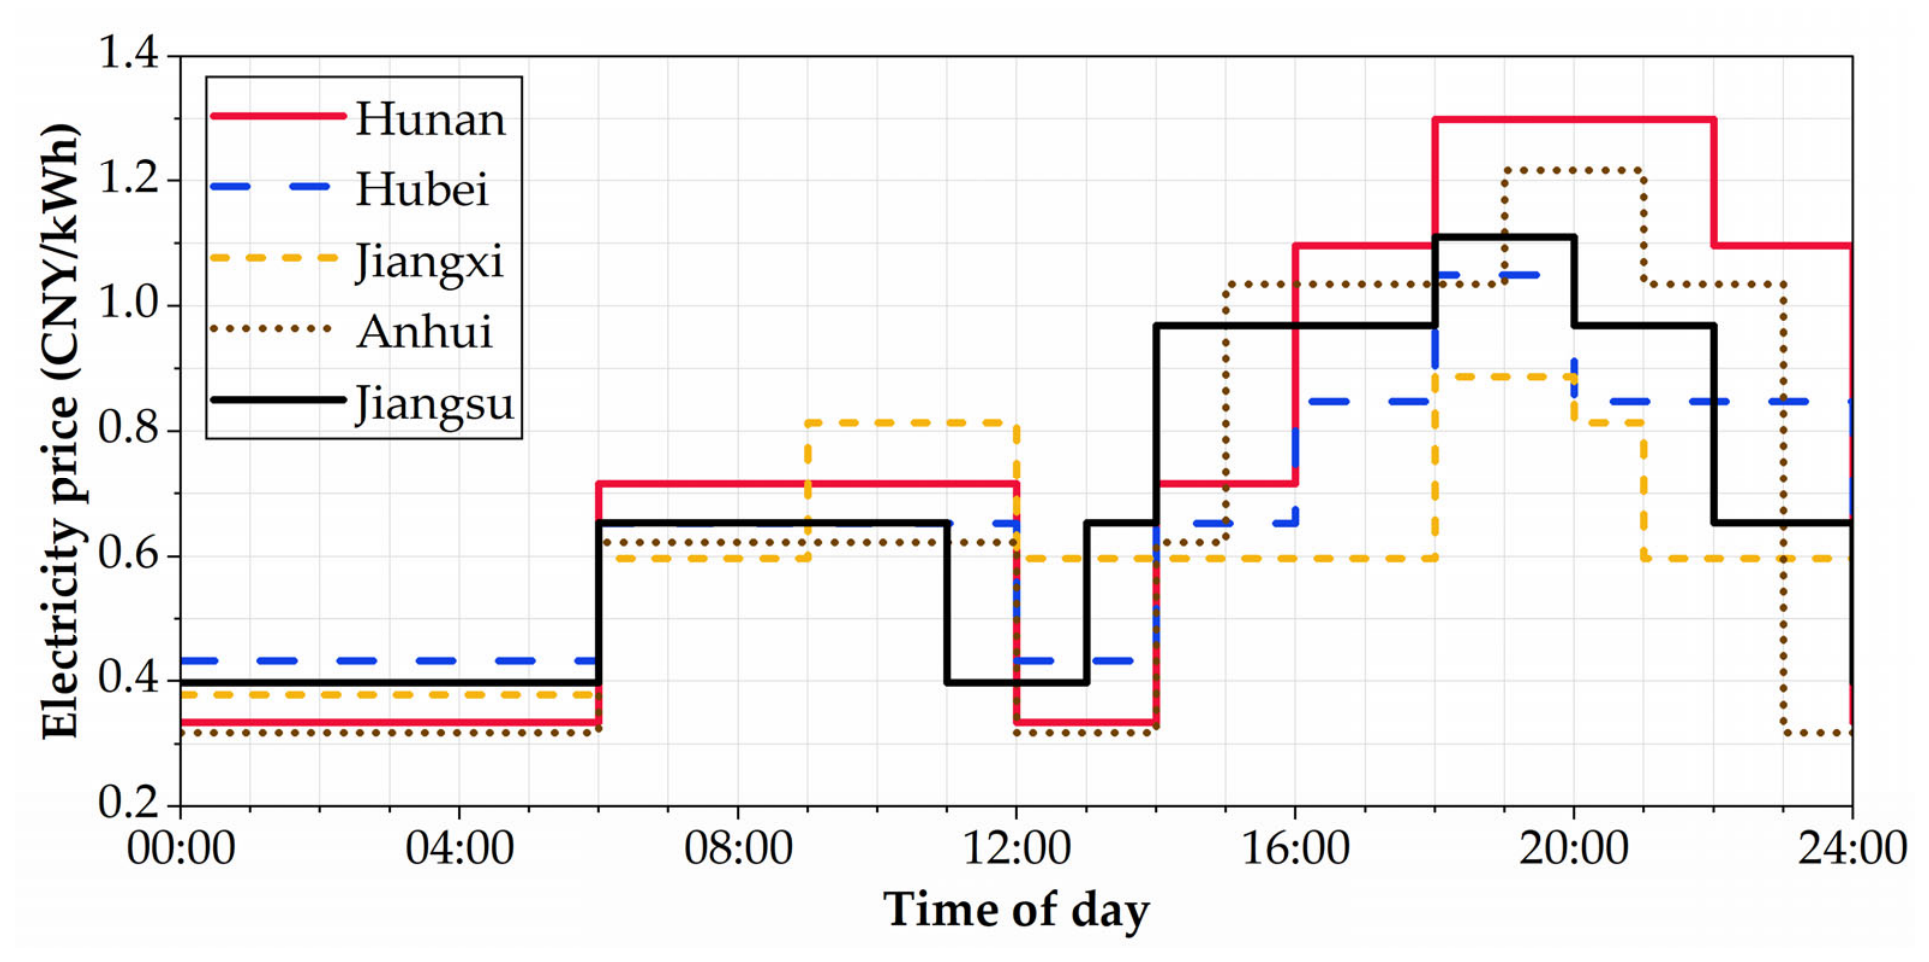
In the original setting, the five replenishment ports are located in Hunan, Hubei, Jiangxi, Anhui, and Jiangsu, respectively, and provide battery swapping services. The time required for swapping each battery is set to 10 min. Each of these ports is further assumed to provide an 800 kW charging service. Therefore, at each candidate replenishment port, the vessel may choose charging, battery swapping, or no replenishment. The proposed model does not assume a fixed replenishment operation time: charging time varies with the charging amount under the specified charging power, whereas battery swapping time depends on the number of batteries swapped. In this study, the TOU electricity price at each port is determined according to its location and the applicable tariff category and voltage level in the electricity price schedules published by State Grid, as shown in Figure 4.
Figure 4.
TOU electricity price profiles in the five provinces.
As Figure 4 shows, the daily TOU electricity price for each province is divided into four price levels, namely valley, flat, peak, and critical peak, in ascending order of price. The charging and battery swapping rates are set to 1.8 and 2.5 times the applicable local TOU electricity price, respectively. These pricing coefficients allow the rates paid by the vessel operator to account for service-related costs such as infrastructure investment and operation and maintenance [21,34]. Specifically, the charging coefficient of 1.8 is close to the values adopted in [21,35], while the higher battery swapping coefficient reflects the additional requirements for dedicated swapping equipment and spare battery inventory [34].
The higher pricing coefficient for battery swapping is intended to reflect the additional infrastructure and spare battery inventory costs incurred by swapping station operators, which are partly recovered through the charges paid by vessel operators [34,36].
The main characteristics and cargo loads of the five operating conditions adopted from Zhang et al. [22] are summarized in Table 3. The corresponding propulsion power–speed functions under different cargo loads are given as:
Table 3.
Five typical operating conditions 1.
- 7900 t: , ;
- 10,000 t: , ;
- 12,500 t: , .
In this study, the speed through water on each leg is selected from 8 to 15 km/h in increments of 0.2 km/h. The vessel can adjust its sailing speed independently on each leg, subject to the speed limits imposed by navigation regulations. Table 4 lists the physical segment distances and the applicable speed over ground limits for the corresponding legs.
Table 4.
Physical segment distances (km) and corresponding leg speed limits (km/h).
Table 5 gives the values adopted for the other key parameters in the case study.
Table 5.
Parameter values adopted for the case study.
4.2. Results
4.2.1. Optimal Energy Replenishment and Sailing Speed Decisions Under TOU Pricing
Table 6 summarizes the total replenishment costs and energy consumption for the five operating conditions (OC1–OC5). Both the total replenishment costs and total energy consumption generally increase from OC1 to OC5. Specifically, the total replenishment costs rise from CNY 61,187 to CNY 84,327, while the total energy consumption increases from 70,414 to 93,741 kWh, corresponding to increases of 37.8% and 33.1%, respectively. This trend is mainly associated with differences in the cargo load on the outbound trip and water speed among the operating conditions. A higher cargo load generally increases propulsion energy requirements, while higher water speed may require higher speeds through water during the inbound trip under the voyage time limit.
Table 6.
Total replenishment costs and energy consumption under TOU pricing.
Table 7 presents the optimal energy replenishment decisions. Although both charging and battery swapping are available at each candidate replenishment port, battery swapping is exclusively selected under all five operating conditions. This result reflects the trade-off between the lower unit replenishment rate of charging and the shorter replenishment time of battery swapping. Under the baseline facility configuration, opportunities to overlap charging with cargo handling are limited. Most en-route charging would occupy additional voyage time. The resulting reduction in available sailing time may require higher sailing speeds and increase sailing energy consumption. Battery swapping avoids much of this time penalty and therefore becomes more favorable within the overall voyage optimization, despite its higher unit replenishment rate. The conditions under which charging becomes more competitive with battery swapping are further examined in Section 4.3.
Table 7.
Optimal numbers of batteries swapped at each replenishment node under TOU pricing 1.
The selected battery swapping nodes and the number of batteries swapped also vary across the operating conditions. While several replenishment nodes are consistently selected, the use of other nodes changes with the vessel’s operating condition. For example, Node 10 is selected only in OC1, whereas Node 12 is selected in OC2–OC5. The total number of swapped batteries increases from 46 in OC1 to 61 in OC5, consistent with the increase in voyage energy consumption. At Node 21, the final replenishment node, all 12 batteries are swapped under every operating condition to prepare the vessel for the next voyage. These variations in replenishment locations and the number of batteries swapped further demonstrate the value of optimizing replenishment decisions for different operating conditions rather than applying a fixed scheme.
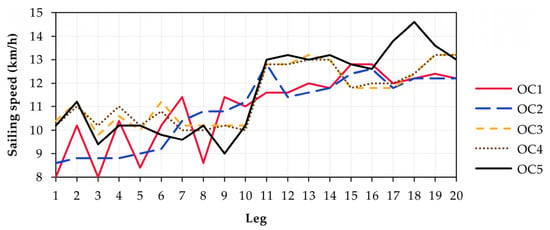
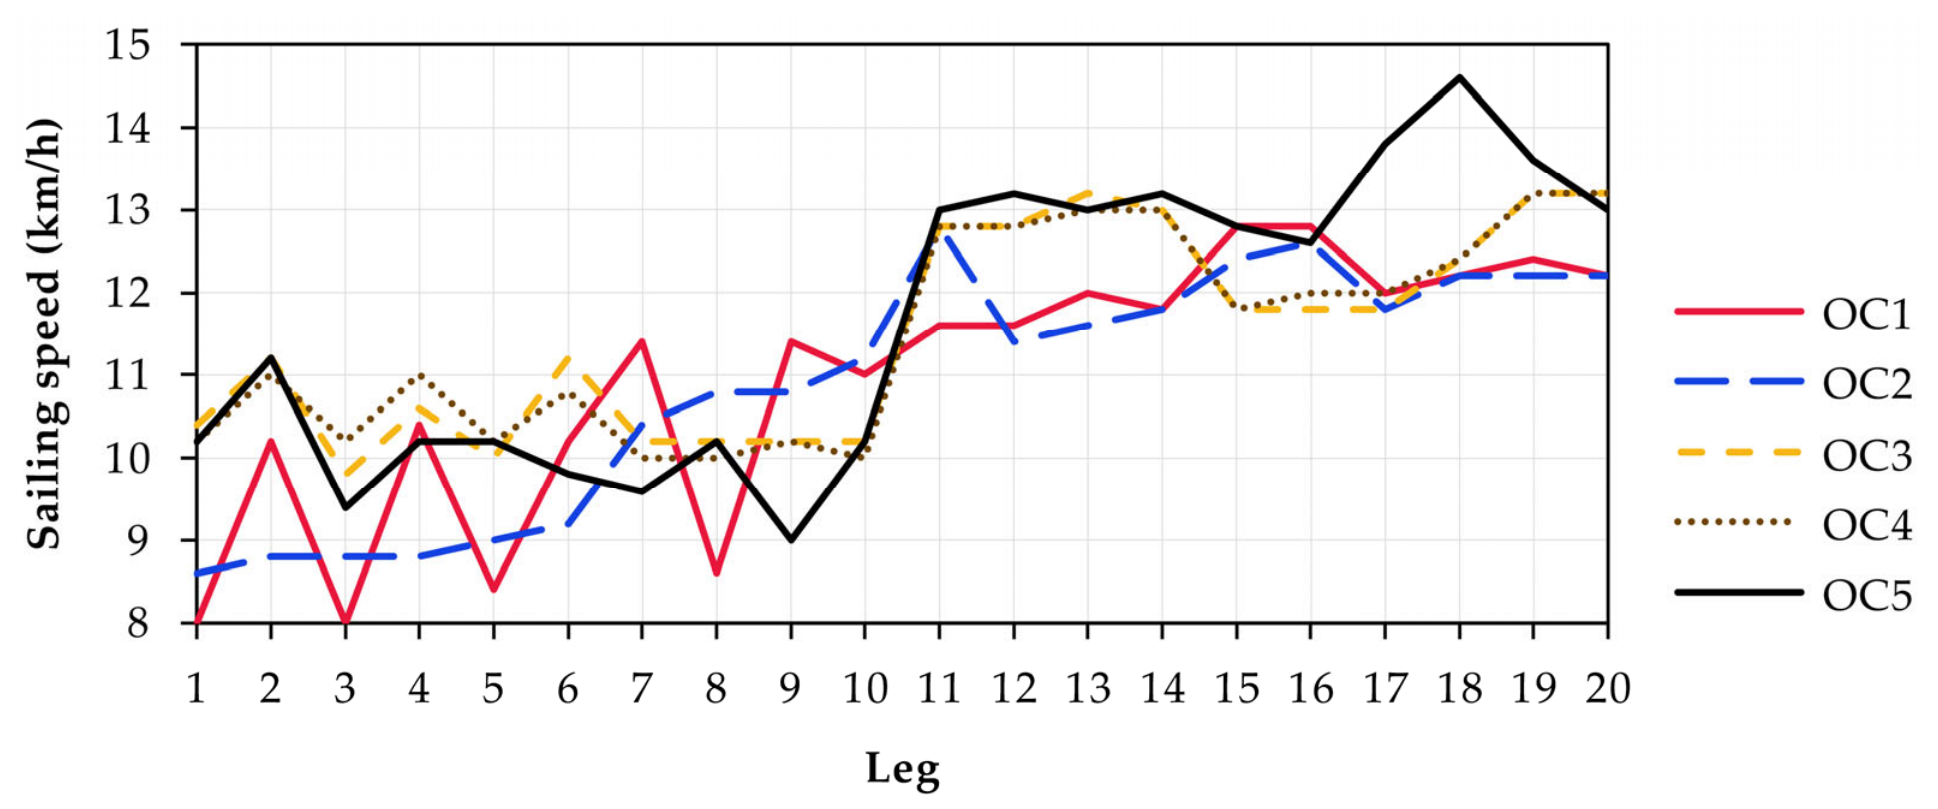
Figure 5 shows that the optimal speed through water varies considerably across individual legs. In general, speeds are lower on the first ten outbound legs than on the last ten inbound legs. In the case study, the water current is aligned with the outbound sailing direction. Therefore, during the outbound trip, it increases the vessel’s speed over ground for a given speed through water, allowing the vessel to maintain the required speed over ground at relatively low speeds through water. In contrast, during the inbound trip, the water current acts against the sailing direction, and higher speeds through water are generally required to satisfy the voyage time and regulatory speed constraints. This contrast is most pronounced in OC5, which has the highest water speed level.
Figure 5.
Optimal sailing speeds under TOU pricing.
To isolate the effect of water speed, an additional test is conducted based on OC1, with the cargo load fixed at 7900 t for both the outbound and inbound trips and all other parameters unchanged. When the water speed increases from the low level to the medium and high levels adopted in the case study, the outbound sailing time decreases by 15.3% and 15.9%, respectively, whereas the inbound sailing time increases by 9.8% and 9.6%. Because the battery discharges continuously during sailing, these changes in sailing time directly correspond to shorter battery discharge durations during the outbound trip and longer discharge durations during the inbound trip. Although the changes in the two directions partly offset each other, total sailing energy consumption increases by 11.4% and 21.2%, respectively. This increase occurs mainly because the stronger opposing current requires higher speeds through water during the inbound trip. Given the nonlinear relationship between speed through water and propulsion power, the resulting increase in inbound propulsion energy consumption is not fully offset by the reduction in outbound energy consumption. By adjusting the speeds on individual legs, the vessel can also alter its arrival and battery swapping times at subsequent replenishment nodes, thereby coordinating sailing and replenishment decisions under TOU pricing.
4.2.2. Benefits of TOU Pricing and Joint Optimization
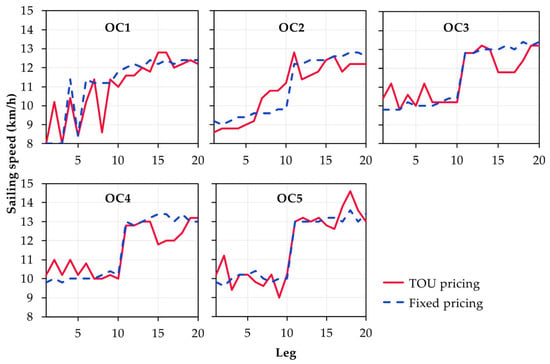
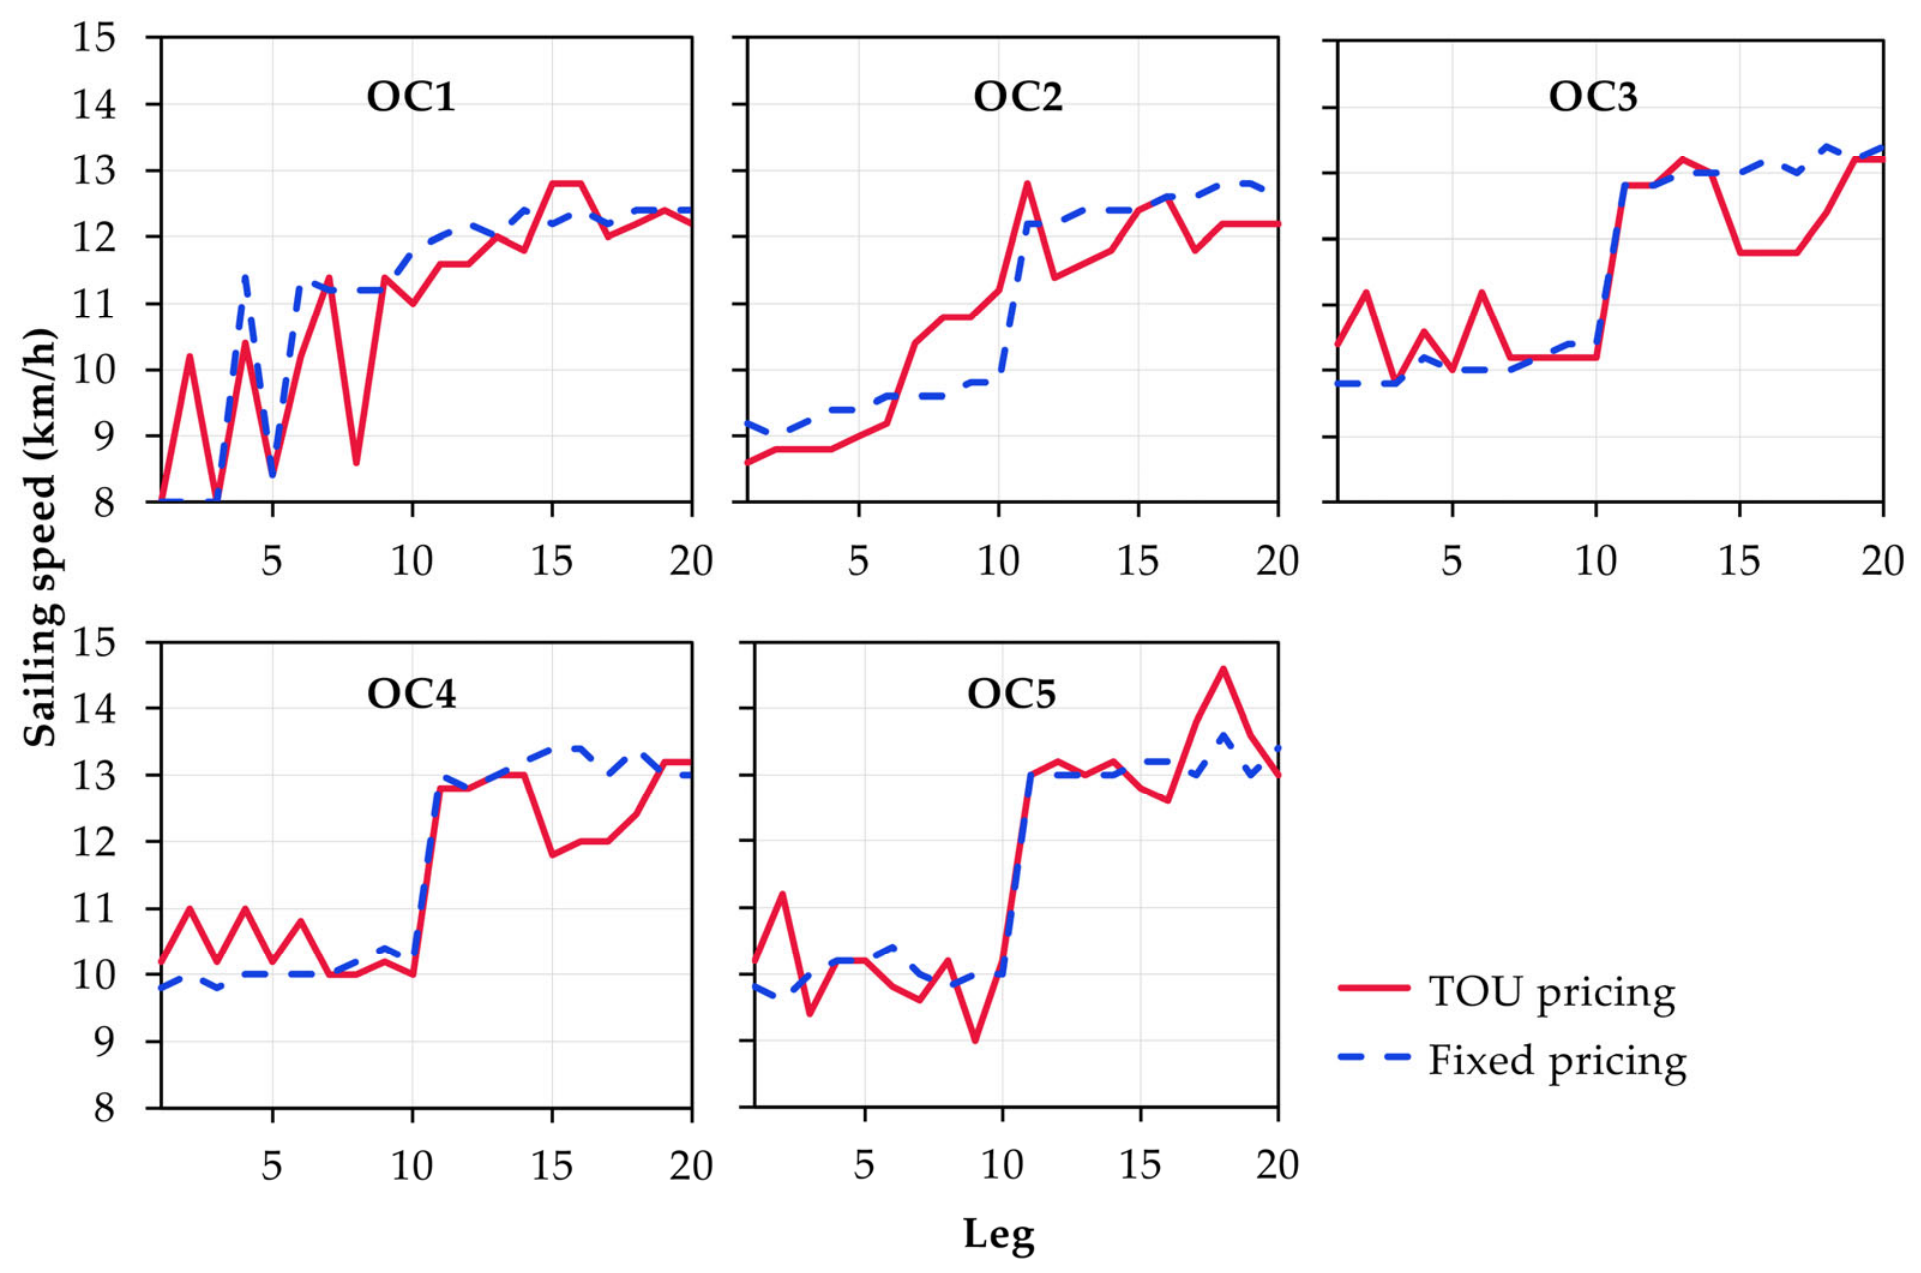
To assess how the vessel responds to TOU pricing and the resulting cost savings, the joint optimization model is also solved under a fixed electricity price scenario, in which the fixed electricity price at each replenishment node is set equal to the corresponding flat period price under TOU pricing. Table 8 shows that TOU pricing reduces the total replenishment costs by 42.4–43.4% across the five operating conditions. As shown in Figure 6, the optimal speed profiles under TOU pricing generally exhibit more pronounced variations across individual legs than those under fixed pricing. These variations allow the vessel to shift its arrival times and the start times of replenishment operations at subsequent replenishment nodes. Table 9 further shows that the optimal replenishment decisions differ between the two pricing scenarios. In particular, charging is selected at Node 21 in OC1–OC4 under fixed pricing, whereas all selected replenishment operations are performed through battery swapping under TOU pricing. These results show that the vessel responds to TOU pricing by adjusting both its sailing speeds and replenishment decisions. Consequently, all battery swapping operations under TOU pricing begin during valley periods and are charged at the corresponding valley period rates. Since the swapping rate is determined by the operation start time and remains unchanged throughout the swapping process, the vessel can fully utilize valley price periods and substantially reduce its replenishment costs.
Table 8.
Total replenishment costs (CNY) under fixed and TOU pricing 1.
Figure 6.
Optimal sailing speeds under fixed and TOU pricing.
Table 9.
Optimal energy replenishment amounts (kWh) under TOU and fixed pricing 1.
To further evaluate how joint optimization improves the vessel’s response to TOU pricing, four strategies are compared under TOU pricing. Strategy 1 optimizes the replenishment decisions while fixing the speed through water at 12 km/h. Strategies 2 and 3 optimize the sailing speeds but require full charging and full battery swapping, respectively, at every candidate replenishment node. Strategy 4 is the proposed strategy, which jointly optimizes energy replenishment and sailing speed.
Table 10 shows that the proposed strategy achieves the lowest total replenishment costs and energy consumption among the feasible strategies for each operating condition. Compared with Strategy 1, the proposed strategy reduces the total replenishment costs by 10.8% and 25.3% and the total energy consumption by 5.4% and 9.1% in OC1 and OC2, respectively. Strategy 1 is infeasible in OC3–OC5, indicating that fixing the speed through water at 12 km/h does not provide sufficient flexibility to satisfy the operational constraints in these operating conditions. Strategy 2 is infeasible under all five operating conditions, indicating that full charging at every candidate replenishment node cannot satisfy the voyage time limit. Compared to Strategy 3, the proposed strategy reduces the total replenishment costs by 9.8–12.5% and the total energy consumption by 4.2–5.6%. Since Strategy 3 and the proposed strategy both optimize the sailing speeds, these improvements mainly result from optimizing replenishment decisions in coordination with sailing speeds, rather than responding to TOU pricing through sailing speed adjustments alone. Overall, the results demonstrate that the coordinated optimization of energy replenishment and sailing speed enables the vessel to respond more effectively to TOU pricing, thereby reducing replenishment costs and energy consumption while improving voyage feasibility.
Table 10.
Comparison of total replenishment costs and energy consumption under different strategies and TOU pricing 1.
4.3. Discussion
4.3.1. Effect of Voyage Time Limit and Start Time
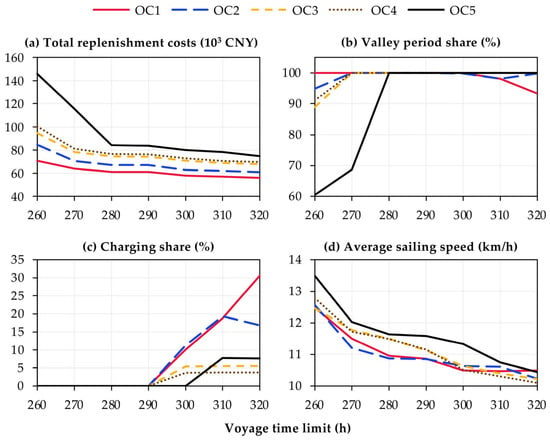
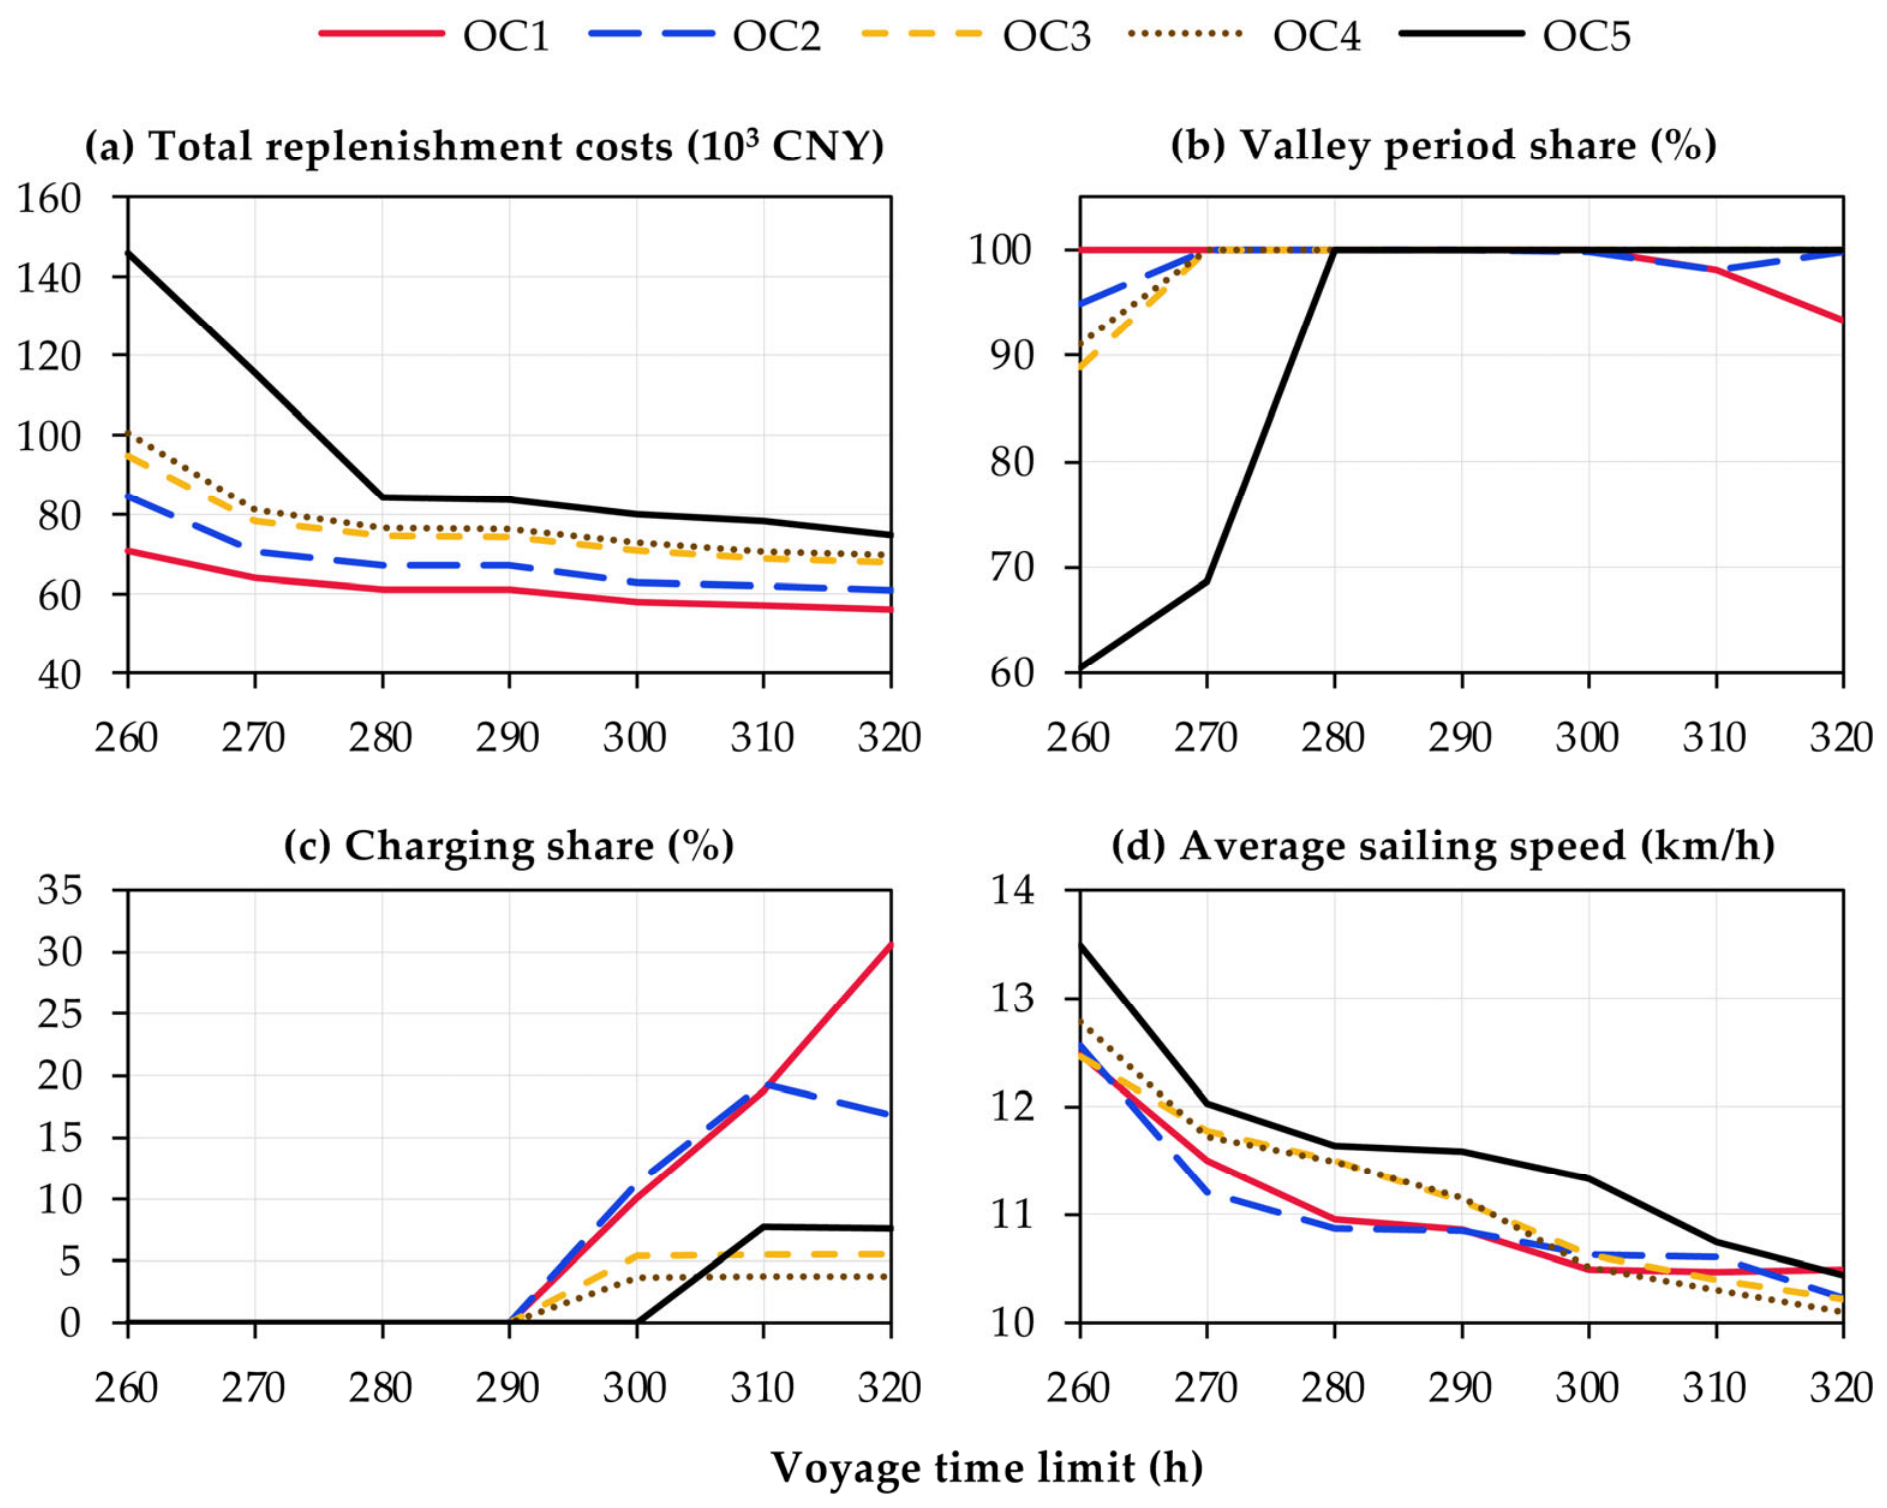
To examine the effect of schedule flexibility, the voyage time limit is varied from 260 to 320 h at 10 h intervals, while all other parameters remain unchanged. As shown in Figure 7, the total replenishment costs decrease across all five operating conditions as the time limit is relaxed. Relative to the 280 h baseline, tightening the limit to 260 h increases the costs by 15.6–73.0%, whereas extending it to 320 h reduces them by 8.3–11.4%. Under tight time limits, the vessel relies entirely on battery swapping, and some swapping operations may begin outside valley periods. This effect is most evident in OC5, where valley period rates apply to only 60.5% of the total replenishment amount at 260 h. Relaxing the voyage time limit gives the vessel greater flexibility to schedule replenishment during valley periods. Charging subsequently enters the optimal solution at 300 h in OC1–OC4 and at 310 h in OC5. At 320 h, the charging share ranges from 3.8% to 30.6% across the five operating conditions. Across the tested voyage time limits, the average duration of the charging operations actually selected in each operating condition ranges from 1.96 to 5.89 h, while that of battery swapping ranges from 1.38 to 1.64 h.
Figure 7.
Effects of the voyage time limit on: (a) total replenishment costs; (b) replenishment amount under valley period rates as a share of total replenishment amount; (c) charging amount as a share of total replenishment amount; and (d) average speed through water.
The average speed through water across all legs also generally decreases as the time limit is relaxed, falling by 1.99–3.05 km/h from 260 to 320 h across the five operating conditions. However, this overall downward trend does not mean that the speed on every leg decreases steadily as the time limit is relaxed. Speeds on some legs fluctuate because sailing speeds are adjusted not only to reduce energy consumption but also to align replenishment timing with valley periods.
The preceding sensitivity analysis shows that charging enters the optimal solution as the voyage time limit is relaxed. However, all selected charging operations are performed at non-cargo-handling nodes, and opportunity charging is not observed. This is attributable to the facility configuration and resulting replenishment decisions in the case study rather than a restriction of the proposed formulation. Of the cargo handling ports, only the departure port is equipped with replenishment facilities. Since the vessel departs with fully charged batteries, replenishment at the departure port is therefore required only after the vessel returns, when the onboard energy must reach the prescribed upper limit. Under the tested settings, battery swapping is selected at this node.
To further examine the role of opportunity charging, an additional test is conducted for OC1 with a 300 h voyage time limit by adding charging and battery swapping facilities at Node 11, using the same TOU prices and replenishment parameters as those at Nodes 10 and 12. In the original solution, charging occurs at Nodes 10 and 12, neither of which involves cargo handling. With replenishment facilities available at Node 11, the vessel shifts charging from Node 12 to Node 11, where 5015.24 kWh is charged during cargo handling. The resulting 6.46 h charging operation is fully accommodated within the 11 h cargo handling period and therefore does not add any additional operation time to the voyage. If charging were to extend beyond the cargo handling period, only the excess charging time would be accounted for by Constraint (11). The time flexibility provided by opportunity charging allows the vessel to adopt lower sailing speeds, reducing sailing energy consumption by 1.2%. Compared with the original solution, total replenishment costs decrease by 0.6%.
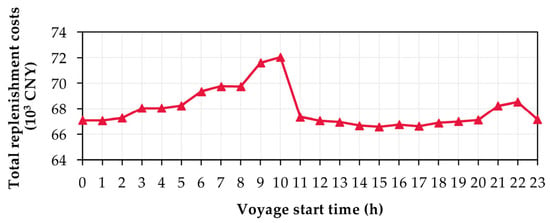
In addition to the voyage time limit, the voyage start time is another temporal factor that may affect the vessel’s response to TOU pricing. Changing the voyage start time shifts the entire voyage schedule relative to the recurring TOU price cycle and may therefore change the electricity price periods applicable to replenishment operations [23,24]. Accordingly, this study conducts a sensitivity analysis by varying the voyage start time from 0 to 23 h at 1 h intervals to assess this effect and identify a more favorable start time among the tested alternatives. OC2 is selected as a representative operating condition, with the voyage time limit fixed at 280 h and all other parameters remaining unchanged.
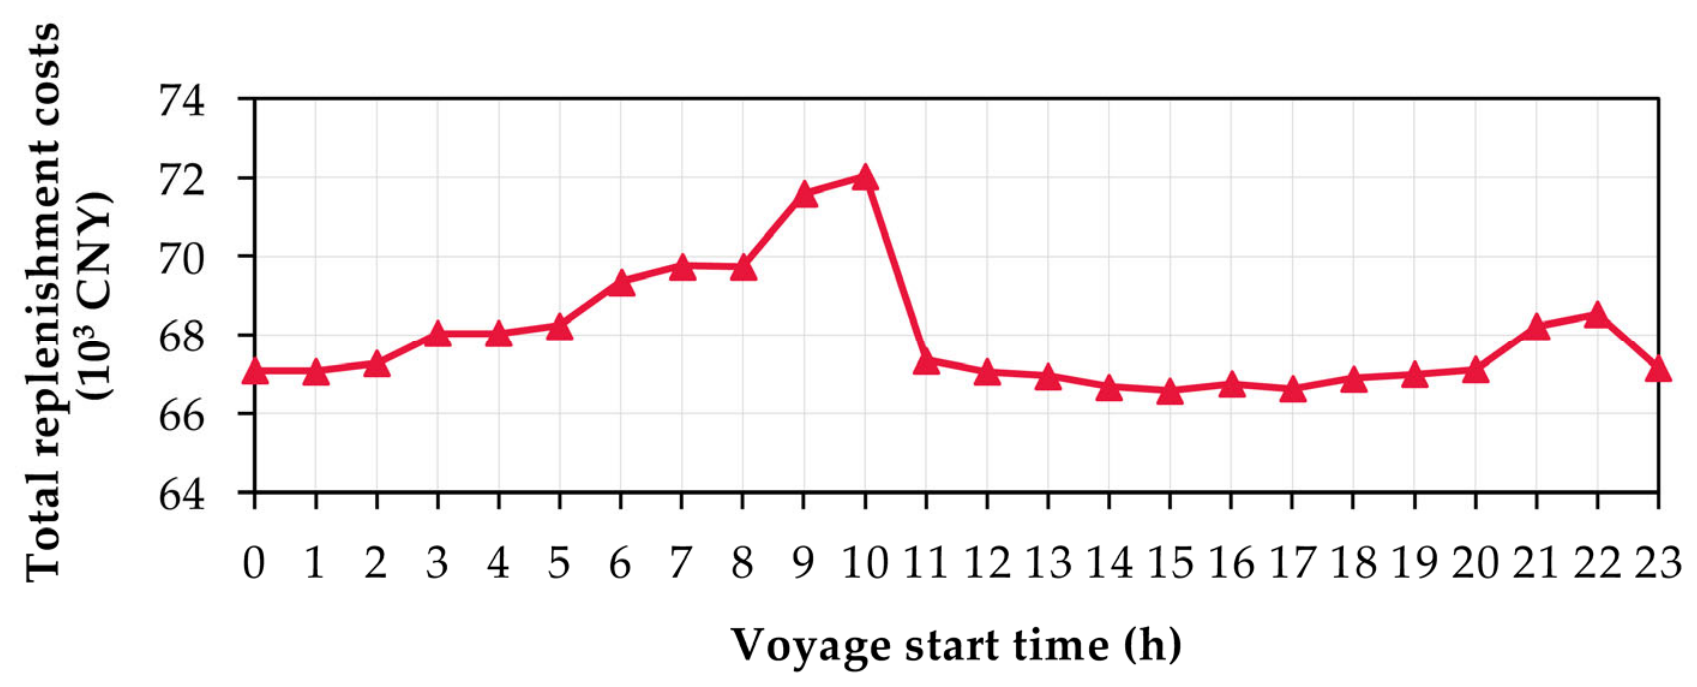
As shown in Figure 8, the total replenishment costs fluctuate between CNY 66,576 and CNY 72,037. The costs are lowest at 15 h and highest at 10 h, with a difference of 8.2%. Further examination of the replenishment and sailing speed decisions shows that battery swapping is selected in all scenarios, while charging is not used. The joint optimization of energy replenishment and sailing speed enables all swapping operations to begin during valley periods, thereby mitigating the effect of voyage start time on replenishment costs. The remaining cost differences mainly arise from variations in sailing energy consumption, total replenishment demand, and the allocation of replenishment amounts among nodes with different valley period prices.
Figure 8.
Effect of voyage start time on total replenishment costs.
4.3.2. Effect of Replenishment Rates
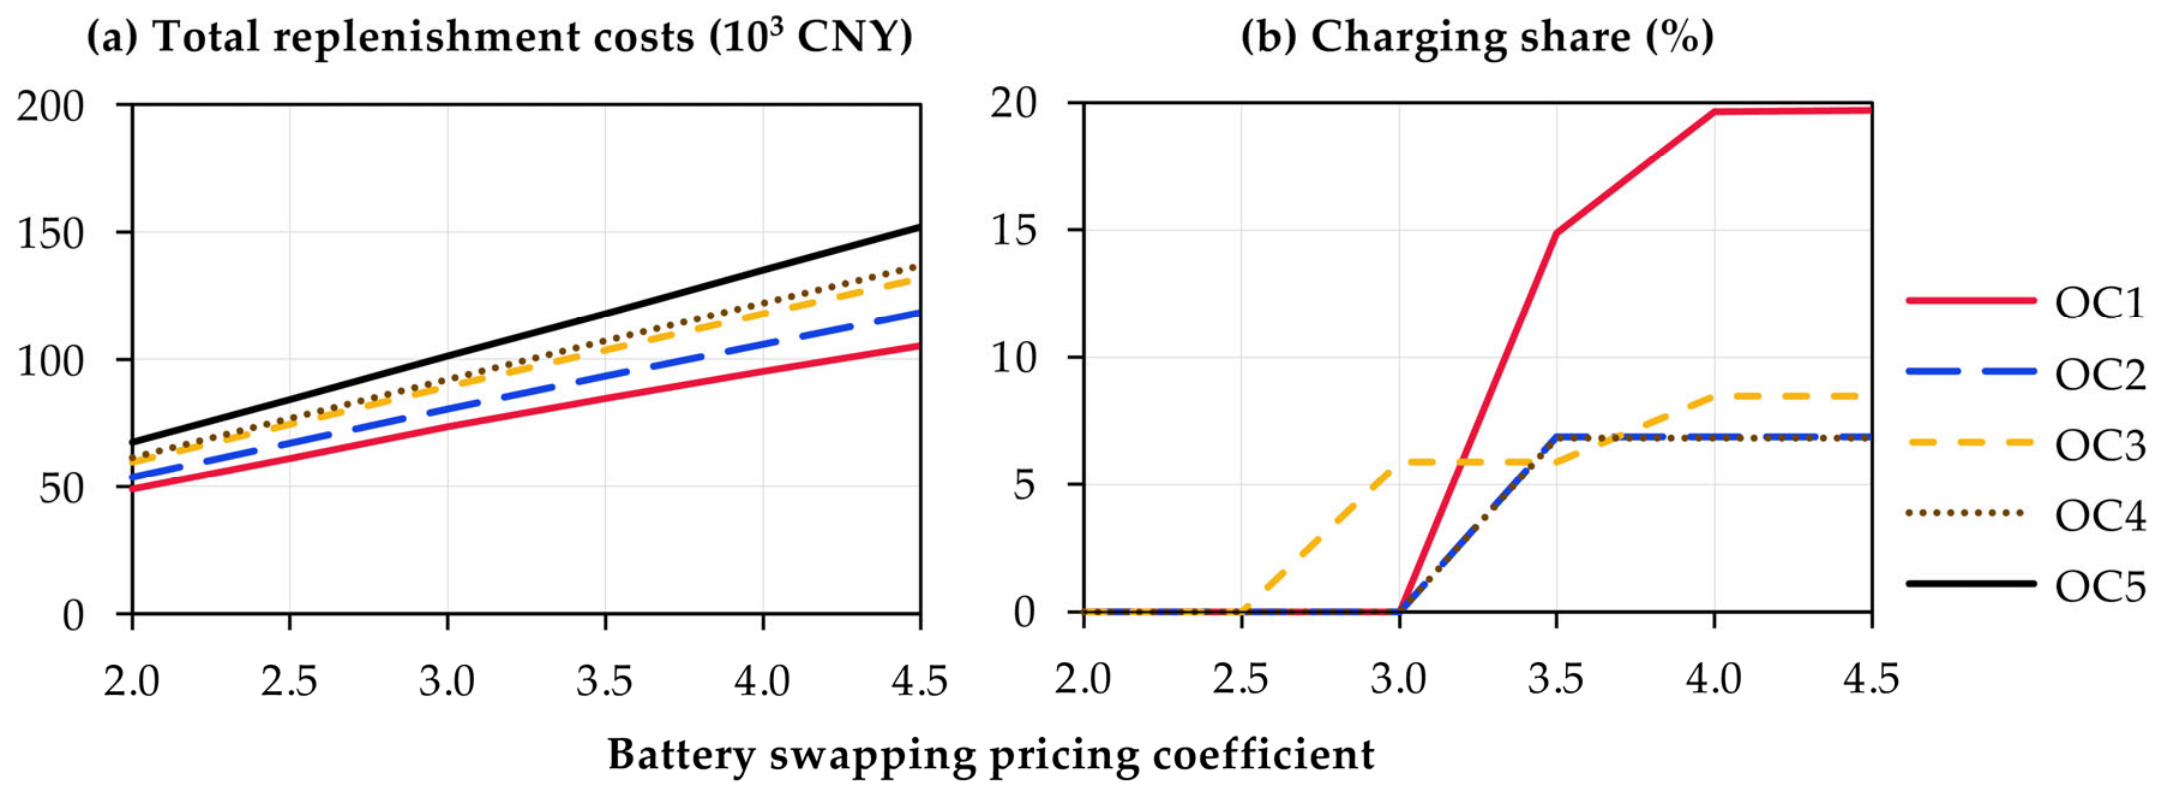
The relative rates of charging and battery swapping may affect both total replenishment costs and the choice between the two replenishment technologies. To examine this effect, the battery swapping pricing coefficient is varied from 2.0 to 4.5 in increments of 0.5, while the charging pricing coefficient is fixed at 1.8. This range ensures that the battery swapping rate remains higher than the charging rate throughout the analysis and covers a range of relative replenishment rates broadly comparable to that examined by Verma [36].
As shown in Figure 9a, the total replenishment costs increase with under all five operating conditions. When increases from 2.0 to 4.5, the total replenishment costs increase by 115.0–125.1% across the five operating conditions. Figure 9b shows that battery swapping is selected exclusively in all operating conditions at and . As increases, charging becomes more cost competitive and enters the optimal solution in OC1–OC4. Based on the tested values, the transition from exclusive battery swapping to the combined use of charging and battery swapping is observed between and in OC3 and between and in OC1, OC2, and OC4. OC5 continues to rely exclusively on battery swapping throughout the tested range. At , the charging shares in OC1–OC5 are 19.7%, 6.9%, 8.5%, 6.8%, and 0.0%, respectively. Although charging has a lower pricing coefficient, it does not completely replace battery swapping within the tested range because it requires substantially more time and its use is constrained by the voyage time limit.
Figure 9.
Effects of the battery swapping pricing coefficient on: (a) total replenishment costs; and (b) charging amount as a share of total replenishment amount.
4.3.3. Effect of Sailing Speed Discretization Interval
In this study, speed discretization is used to approximate the continuous feasible speed range, and the choice of discretization interval affects both approximation accuracy and model size [37]. A smaller interval provides finer sailing speed choices, which can reduce the effect of discretization on the resulting total replenishment costs, but it also increases the number of candidate sailing speeds and the associated binary variables. Therefore, a sensitivity analysis is conducted to examine the effects of the discretization interval on total replenishment costs and replenishment decisions, while also assessing the associated changes in model size and the suitability of the 0.2 km/h interval adopted in the preceding analysis. Keeping the feasible speed range and all other parameters unchanged, six discretization intervals of 0.01, 0.05, 0.1, 0.2, 0.5, and 1.0 km/h are considered.
As shown in Table 11, reducing the interval from 1.0 to 0.01 km/h increases the number of candidate sailing speeds from 8 to 701. Taking the 0.01 km/h interval as the fine-grid reference, the relative deviations in total replenishment costs under the 0.2 km/h interval are only 0.02–0.13% across the five operating conditions, while the selected replenishment nodes and numbers of batteries swapped remain unchanged. The relative differences in total replenishment costs between the 0.05- and 0.01 km/h intervals do not exceed 0.025%, further indicating that the results become stable as the discretization interval decreases. In contrast, when the interval is increased to 0.5 and 1.0 km/h, the cost deviations relative to the 0.01 km/h interval increase to 0.17–0.63% and 0.89–2.27%, respectively. Moreover, at an interval of 0.5 km/h, the selected replenishment nodes or numbers of batteries swapped change in some operating conditions, indicating that a coarser discretization can alter the resulting replenishment decisions. Overall, the results support the use of the 0.2 km/h interval in the preceding analysis, as further refinement yields only marginal changes in total replenishment costs, whereas coarser intervals lead to more noticeable deviations and may alter the resulting replenishment decisions.
Table 11.
Number of candidate sailing speeds and total replenishment costs under different sailing speed discretization intervals.
5. Conclusions
This study develops a joint optimization framework for energy replenishment and sailing speed for an inland electric vessel under TOU pricing. The main novelty lies in extending the vessel’s response to TOU pricing beyond sailing speed adjustments to include the coordinated optimization of sailing speed and multidimensional replenishment decisions, thereby broadening the decision space for responding to time-varying electricity prices. Specifically, the framework jointly determines where to replenish, how to replenish, how much energy to replenish, and the sailing speed on each leg, while accounting for the distinct operational characteristics of charging and battery swapping. A tailored model reformulation approach is developed for the resulting joint optimization problem: the nonlinearities associated with replenishment decisions and TOU pricing for charging and battery swapping are reformulated exactly, while those related to sailing speed are handled through speed discretization, yielding an MILP approximation solvable by commercial solvers. A comprehensive case study covering five operating conditions, strategy comparisons, and sensitivity analyses not only evaluates the proposed framework but also reveals how different operating conditions and key parameters affect the vessel’s coordinated response to TOU pricing and its cost-saving potential.
The results show that coordinating replenishment and sailing speed decisions enables the vessel to make better use of low-price replenishment opportunities while satisfying energy and voyage time constraints. Responding to TOU pricing reduces total replenishment costs by 42.4–43.4% compared to the fixed price scenario. Compared to the benchmark that fixes the battery swapping scheme and optimizes only sailing speed, the proposed framework reduces replenishment costs by 9.8–12.5% and sailing energy consumption by 4.2–5.6%, even though it still selects only battery swapping under the baseline settings. The cost-saving potential of TOU pricing is also influenced by the voyage time limit, voyage start time, relative charging and battery swapping rates, and the availability of opportunity charging. Charging may become more competitive when the voyage time limit is relaxed, battery swapping becomes more expensive, or charging facilities are available at more cargo handling ports, allowing charging to overlap with cargo handling and thereby reducing the additional voyage time caused by charging.
However, the current model assumes deterministic operating conditions and focuses on vessel responses to given price signals. Future research could relax the deterministic assumption by incorporating factors such as random delays, time-varying water speed, and queueing at replenishment ports. The current MILP approximation could also provide a basis for rolling-horizon optimization to update the remaining voyage plan as new information becomes available. In addition, when multiple vessels share limited replenishment resources, ports may adjust replenishment rates according to resource availability and aggregate replenishment demand, creating feedback between vessel demand and port pricing. Future research could examine fleet-level responses to endogenous replenishment pricing under shared resource constraints.
Author Contributions
Conceptualization, L.D., H.H. and S.G.; methodology, S.G. and L.D.; software, S.G. and M.Y.; validation, S.G. and Y.W.; data curation, S.Z. and Y.L.; writing—original draft preparation, S.G.; writing—review and editing, L.D. and H.H.; visualization, S.G.; resources, S.Z. and Y.L.; project administration, S.Z. and Y.L. All authors have read and agreed to the published version of the manuscript.
Funding
This research was funded by National Natural Science Foundation of China: 52477108; Oriental Talent Program of Shanghai: QNCX2024006; China COSCO Shipping Corporation: SZ0100439.
Data Availability Statement
The original contributions presented in this study are included in the article. Further inquiries can be directed to the corresponding author.
Conflicts of Interest
Authors Shaosong Zhu and Yuni Li were employed by COSCO SHIPPING Ports Limited. The remaining authors declare that the research was conducted in the absence of any commercial or financial relationships that could be construed as a potential conflict of interest.
References
- IMO Fourth Greenhouse Gas Study 2020. Available online: https://www.imo.org/en/ourwork/environment/pages/fourth-imo-greenhouse-gas-study-2020.aspx (accessed on 28 July 2026).
- Xu, L.; Di, Z.; Chen, J. Evolutionary Game of Inland Shipping Pollution Control under Government Co-Supervision. Mar. Pollut. Bull. 2021, 171, 112730. [Google Scholar] [CrossRef] [Scilit] [PubMed]
- Barros, B.R.C.d.; Carvalho, E.B.d.; Brasil Junior, A.C.P. Inland Waterway Transport and the 2030 Agenda: Taxonomy of Sustainability Issues. Clean. Eng. Technol. 2022, 8, 100462. [Google Scholar] [CrossRef] [Scilit]
- Chen, J.; Xiong, W.; Xu, L.; Di, Z. Evolutionary Game Analysis on Supply Side of the Implement Shore-to-Ship Electricity. Ocean Coast. Manag. 2021, 215, 105926. [Google Scholar] [CrossRef] [Scilit]
- Daniel, H.; Trovão, J.P.F.; Williams, D. Shore Power as a First Step toward Shipping Decarbonization and Related Policy Impact on a Dry Bulk Cargo Carrier. eTransportation 2022, 11, 100150. [Google Scholar] [CrossRef] [Scilit]
- Kersey, J.; Popovich, N.D.; Phadke, A.A. Rapid Battery Cost Declines Accelerate the Prospects of All-Electric Interregional Container Shipping. Nat. Energy 2022, 7, 664–674. [Google Scholar] [CrossRef] [Scilit]
- Moon, H.S.; Park, W.Y.; Hendrickson, T.; Phadke, A.; Popovich, N. Exploring the Cost and Emissions Impacts, Feasibility and Scalability of Battery Electric Ships. Nat. Energy 2025, 10, 41–54. [Google Scholar] [CrossRef] [Scilit]
- Chatelier, J.M. Entering a New Era for Electrical Vessel on Inland Waterways. Ship Sci. Technol. 2023, 16, 21–32. [Google Scholar] [CrossRef] [Scilit]
- Wang, Z.; Liao, P.; Long, F.; Wang, Z.; Ji, Y.; Han, F. Maritime Electrification Pathways for Sustainable Shipping: Technological Advances, Environmental Drivers, Challenges, and Prospects. eTransportation 2025, 26, 100462. [Google Scholar] [CrossRef] [Scilit]
- Feng, Y.; Dai, L.; Yue, M.; Hu, H.; Fang, S. Assessing the Decarbonization Potential of Electric Ships for Inland Waterway Freight Transportation. Transp. Res. Part D Transp. Environ. 2024, 129, 104151. [Google Scholar] [CrossRef] [Scilit]
- Wang, H.; Boulougouris, E.; Theotokatos, G.; Zhou, P.; Priftis, A.; Shi, G. Life Cycle Analysis and Cost Assessment of a Battery Powered Ferry. Ocean Eng. 2021, 241, 110029. [Google Scholar] [CrossRef] [Scilit]
- Li, R.; Li, H.; Huang, W.; Tao, H.; Xu, W.; Tai, N.; Li, C. Accelerating Green Shipping with Spatially Optimized Offshore Charging Stations. Nat. Energy 2025, 10, 243–254. [Google Scholar] [CrossRef] [Scilit]
- Kistner, L.; Bensmann, A.; Hanke-Rauschenbach, R. Potentials and Limitations of Battery-Electric Container Ship Propulsion Systems. Energy Convers. Manag. X 2024, 21, 100507. [Google Scholar] [CrossRef] [Scilit]
- Zhen, L.; Wang, S.; Zhuge, D. Dynamic Programming for Optimal Ship Refueling Decision. Transp. Res. Part E Logist. Transp. Rev. 2017, 100, 63–74. [Google Scholar] [CrossRef] [Scilit]
- Aydin, N.; Lee, H.; Mansouri, S.A. Speed Optimization and Bunkering in Liner Shipping in the Presence of Uncertain Service Times and Time Windows at Ports. Eur. J. Oper. Res. 2017, 259, 143–154. [Google Scholar] [CrossRef] [Scilit]
- Yao, Z.; Ng, S.H.; Lee, L.H. A Study on Bunker Fuel Management for the Shipping Liner Services. Comput. Oper. Res. 2012, 39, 1160–1172. [Google Scholar] [CrossRef] [Scilit]
- Guo, S.; Wang, Y.; Yue, M.; Dai, L.; Fang, S.; Zhang, S.; Hu, H. Optimization of Energy Replenishment for Inland Electric Ships Considering Multi-Technology Adoption and Partial Replenishment. J. Mar. Sci. Eng. 2025, 13, 2092. [Google Scholar] [CrossRef] [Scilit]
- Zhang, Y.; Sun, L.; Ma, F.; Wu, Y.; Jiang, W.; Fu, L. Collaborative Optimization of the Battery Capacity and Sailing Speed Considering Multiple Operation Factors for a Battery-Powered Ship. World Electr. Veh. J. 2022, 13, 40. [Google Scholar] [CrossRef] [Scilit]
- Gu, M.; Wen, S.; Zhu, M.; Chen, C.; Huang, Y. Voyage Optimization for All-Electric Vessels Integrated with Swappable Containerized Battery. In Proceedings of the 2021 11th International Conference on Power and Energy Systems (ICPES), Shanghai, China, 18–20 December 2021; IEEE: New York, NY, USA, 2021; pp. 586–591. [Google Scholar]
- Zhang, K.; Liu, C.; He, Z.; Chen, H.; Xiang, Q.; Chu, X. Optimization of Sailing Speed for Inland Electric Ships Based on an Improved Multi-Objective Particle Swarm Optimization (MOPSO) Algorithm. J. Mar. Sci. Eng. 2024, 12, 1417. [Google Scholar] [CrossRef] [Scilit]
- Deng, J.; Hu, H.; Gong, S.; Dai, L. Impacts of Charging Pricing Schemes on Cost-Optimal Logistics Electric Vehicle Fleet Operation. Transp. Res. Part D Transp. Environ. 2022, 109, 103333. [Google Scholar] [CrossRef] [Scilit]
- Zhang, Y.; Sun, L.; Fan, T.; Ma, F.; Xiong, Y. Speed and Energy Optimization Method for the Inland All-Electric Ship in Battery-Swapping Mode. Ocean Eng. 2023, 284, 115234. [Google Scholar] [CrossRef] [Scilit]
- Sun, L.; Zhang, Y.; Ma, F.; Ji, F.; Xiong, Y. Energy and Speed Optimization of Inland Battery-Powered Ship with Considering the Dynamic Electricity Price and Complex Navigational Environment. Energy Rep. 2023, 9, 293–304. [Google Scholar] [CrossRef] [Scilit]
- Yang, S.; Ma, F.; Sun, H.; Sun, L. Optimal Voyage Scheduling of Battery-Swapping Based Inland All-Electric Ship Fleet Considering Environmental Factors and Time-of-Use Electricity Price. In Proceedings of the 2024 9th Asia Conference on Power and Electrical Engineering (ACPEE), Shanghai, China, 11–13 April 2024; IEEE: New York, NY, USA, 2024; pp. 1814–1822. [Google Scholar]
- Zhang, Y.; Sun, L.; Sun, W.; Ma, F.; Xiao, R.; Wu, Y.; Huang, H. Bilevel Optimal Infrastructure Planning Method for the Inland Battery Swapping Stations and Battery-Powered Ships. Tsinghua Sci. Technol. 2024, 29, 1323–1340. [Google Scholar] [CrossRef] [Scilit]
- Liu, Y.; He, J.; Tan, C. Energy Replenishment Optimization for Inland Liner Electric Container Ships Using Benders Decomposition. Transp. Res. Part E Logist. Transp. Rev. 2026, 211, 104867. [Google Scholar] [CrossRef] [Scilit]
- Ma, G.; Huang, Y.; Zhang, G.; Fan, P. Logic-Based Benders Decomposition for Unmanned Electric Tugboat Scheduling Considering Battery-Swapping Operations. J. Mar. Sci. Eng. 2025, 13, 1633. [Google Scholar] [CrossRef] [Scilit]
- Qiao, X.; Yang, Y.; Sun, Q.; Wang, S. A Branch-and-Price Approach for Optimizing All-Electric Ship Scheduling in Waterborne Transport. Transp. Res. Part B Methodol. 2026, 211, 103517. [Google Scholar] [CrossRef] [Scilit]
- Wang, W.; Liu, Y.; Zhen, L.; Wang, H. How to Deploy Electric Ships for Green Shipping. J. Mar. Sci. Eng. 2022, 10, 1611. [Google Scholar] [CrossRef] [Scilit]
- Zhen, L.; Hu, Z.; Yan, R.; Zhuge, D.; Wang, S. Route and Speed Optimization for Liner Ships under Emission Control Policies. Transp. Res. Part C Emerg. Technol. 2020, 110, 330–345. [Google Scholar] [CrossRef] [Scilit]
- Li, Y.; Jin, J.G.; He, P.; Lu, C. Optimizing Bunkering and Speed for Dry Bulk Carriers Considering Biofuel Storage Period Limitation. Ocean Coast. Manag. 2025, 260, 107482. [Google Scholar] [CrossRef] [Scilit]
- Yan, R.; Wang, S.; Du, Y. Development of a Two-Stage Ship Fuel Consumption Prediction and Reduction Model for a Dry Bulk Ship. Transp. Res. Part E Logist. Transp. Rev. 2020, 138, 101930. [Google Scholar] [CrossRef] [Scilit]
- He, P.; Jin, J.G.; Pan, W.; Chen, J. Route, Speed, and Bunkering Optimization for LNG-Fueled Tramp Ship with Alternative Bunkering Ports. Ocean Eng. 2024, 305, 117957. [Google Scholar] [CrossRef] [Scilit]
- Zhu, F.; Li, L.; Li, Y.; Li, K.; Lu, L.; Han, X.; Du, J.; Ouyang, M. Does the Battery Swapping Energy Supply Mode Have Better Economic Potential for Electric Heavy-Duty Trucks? eTransportation 2023, 15, 100215. [Google Scholar] [CrossRef] [Scilit]
- Peng, Y.; Wei, M.; Lin, Y.; Huang, M. Research on the Optimal Allocation of Charging Facilities in Inland River Ports Considering the Charging Demand of Electric Ships. In Proceedings of the International Conference Optoelectronic Information and Optical Engineering (OIOE2024), 15 January 2025; SPIE: Bellingham, WA, USA, 2025; Volume 13513, pp. 644–654. [Google Scholar]
- Verma, A. Electric Vehicle Routing Problem with Time Windows, Recharging Stations and Battery Swapping Stations. EURO J. Transp. Logist. 2018, 7, 415–451. [Google Scholar] [CrossRef] [Scilit]
- Fagerholt, K.; Laporte, G.; Norstad, I. Reducing Fuel Emissions by Optimizing Speed on Shipping Routes. J. Oper. Res. Soc. 2010, 61, 523–529. [Google Scholar] [CrossRef] [Scilit]

Disclaimer/Publisher’s Note: The statements, opinions and data contained in all publications are solely those of the individual author(s) and contributor(s) and not of MDPI and/or the editor(s). MDPI and/or the editor(s) disclaim responsibility for any injury to people or property resulting from any ideas, methods, instructions or products referred to in the content. |
© 2026 by the authors. Licensee MDPI, Basel, Switzerland. This article is an open access article distributed under the terms and conditions of the Creative Commons Attribution (CC BY) license.