


Abstract
In automated container terminals, Autonomous Rail-guided Transporters (ARTs) are responsible for horizontal transportation tasks between quay cranes and yard blocks during unloading operations. Their charging strategies directly affect operational continuity, charging resource utilization, and road traffic load. To improve the consistency between the simulation environment and the actual terminal layout, this study constructs a DXF-based directed traffic network based on the CAD/DXF layout of Tianjin Port Second Container Terminal. A coupled discrete-event simulation model integrating ART operations, charging behavior, and traffic dynamics is developed using SimPy. The study further compares several charging strategies, including threshold charging, conventional opportunity charging, safe opportunity charging, interval charging, and Distance-Aware Interval Charging (DAIC). The results indicate that the conventional opportunity charging strategy suffers from battery depletion failures under continuous unloading task flows due to the absence of mandatory low-battery protection. After introducing a safety threshold, the safe opportunity charging strategy effectively eliminates the risk of battery depletion. Considering comprehensive performance indicators, including operational success rate, task completion time, charging travel distance, charging frequency, minimum State of Charge (SOC), and road congestion level, the 40%/70% interval charging strategy demonstrates strong overall robustness, while the 40%/80% interval charging strategy shows advantages in completion time and charging resource utilization. Both strategies can therefore be regarded as key candidate charging schemes for ART operations in Tianjin Port Second Container Terminal.
1. Introduction
Automated container terminals realize unmanned, intelligent, and green cargo-handling operations through the coordinated operation of quay cranes, horizontal transport vehicles, yard equipment, and terminal operating systems (TOSs). Early studies established a relatively systematic foundation in automated terminal system design, Automated Guided Vehicle (AGV) dispatching rules, vehicle control, and simulation-based evaluation, highlighting the critical role of horizontal transport vehicles in terminal throughput efficiency and equipment coordination. Liu et al. [1] conducted simulation and cost analyses of four automated container terminal solutions, namely AGV, LMCS, GR, and AS/RS. The results demonstrated that automation technologies can significantly improve terminal operational efficiency, among which the AGV-based solution achieved the best performance in terms of both operational effectiveness and economic feasibility. Kim and Bae [2] investigated the AGV dispatching problem in automated container terminals by developing a mixed-integer programming model and proposing a heuristic algorithm for its solution. Simulation results showed that the proposed algorithm effectively improved AGV dispatching efficiency and enhanced the coordination performance among the terminal equipment. Vis [3] reviewed the design and control issues of AGV systems in manufacturing, warehousing, container terminals, and other application domains. The study pointed out that large-scale AGV systems require the development of new analytical and simulation models to address challenges such as high computational complexity, congestion, and deadlock. Le-Anh and De Koster [4] provided a comprehensive review of the design and control of AGV systems, covering key issues including path design, vehicle scheduling, battery management, and deadlock resolution. The authors also proposed a new classification of dispatching rules and identified several directions for future research.
These classical studies laid the groundwork for automated terminal modeling and vehicle scheduling; however, most of them primarily focused on operational efficiency and vehicle dispatching, while paying insufficient attention to battery constraints, charging timing, and competition for charging resources in electric vehicles.
Artificial Intelligence Robots of Transportation (ART) are container transport vehicles equipped with Level 4 autonomous driving capabilities. By utilizing technologies such as high-precision positioning, LiDAR perception, and intelligent scheduling, ART enables autonomous operation in port environments. Compared with traditional AGVs, ART does not rely on fixed guidance infrastructures such as magnetic nails and is capable of autonomous path planning, dynamic obstacle avoidance, and cooperative scheduling, thereby improving the efficiency and flexibility of terminal transportation systems. With the increasing application of electric AGV and ART in terminal horizontal transportation, energy management has gradually become an important component of automated terminal scheduling problems. Existing studies have investigated battery-driven AGV system simulation, comparisons of charging mechanisms, AGV scheduling under battery constraints, and integrated operation-charging optimization under fast-charging conditions. Ma and Zhou [5] investigated the impact of charging station layouts and charging strategies on the performance of battery-powered AGV systems in automated container terminals. Simulation results indicated that a decentralized charging station layout combined with a progressive charging strategy could achieve superior operational performance. Chen et al. [6] proposed a two-stage metamodel-based simulation optimization approach for AGV systems with charging mechanisms. The method optimized the number of vehicles, charging infrastructure, and dispatching strategies to improve AGV utilization and overall system throughput. Boccia et al. [7] studied the AGV scheduling problem under battery constraints and developed a mixed-integer programming model together with a matheuristic solution approach. The proposed method jointly optimized transportation tasks and charging operations. Computational experiments demonstrated its effectiveness and scalability. Li et al. [8] addressed the integrated charging and operation scheduling problem for battery-powered AGVs in automated container terminals. They formulated the problem as a mixed-integer programming model and proposed a solution method combining decomposition-based iteration and simulation optimization. Experimental results showed that the approach could effectively reduce charging costs and improve terminal operational efficiency.
In recent years, charging station capacity constraints, dual-threshold charging, coordinated charging-and-battery-swapping strategies, and battery lifetime management have further been incorporated into AGV scheduling models for automated ports, indicating that charging strategies have evolved from simple vehicle recharging rules into comprehensive operational decisions affecting system efficiency, energy cost, and equipment utilization. Gao et al. [9] proposed a digital twin-based decision support approach for AGV scheduling and integrated mathematical programming with a Q-learning algorithm to optimize scheduling decisions under battery constraints. Experimental results demonstrated that the proposed method outperformed genetic algorithms and particle swarm optimization across problem instances of different scales. Song et al. [10] investigated the resilient scheduling problem of AGVs with battery constraints and proposed a dual-threshold charging strategy together with an adaptive large neighborhood search algorithm. The results showed that the proposed strategy could effectively enhance both operational efficiency and system resilience in automated container terminals. Zhou et al. [11] studied the resilient AGV scheduling problem considering charging constraints and energy consumption costs. A large neighborhood search-based metaheuristic algorithm was developed to solve the problem. Experimental results indicated that the proposed approach could effectively reduce energy consumption costs and provide valuable insights for charging area layout design and vehicle fleet configuration in automated container terminals. Zhang et al. [12] investigated the integrated scheduling problem of AGVs and yard cranes under charging constraints. They formulated a mixed-integer programming model and proposed a solution approach combining heuristic algorithms with dynamic programming. Experimental results demonstrated that the method could improve terminal operational efficiency and reveal the impacts of AGV fleet size and charging strategies on system performance.
At the algorithmic level, digital twins, rolling scheduling, resilient scheduling, multi-equipment collaborative optimization, and multi-agent reinforcement learning have been adopted to address dynamic task release, path conflicts, and competition for charging resources. Li et al. [13] investigated the integrated task allocation and path planning problem for AGVs in automated container terminals. They proposed a hierarchical scheduling framework based on reinforcement learning, which effectively reduced task delays and path conflicts. Kong et al. [14] studied the coordinated scheduling problem between tandem quay cranes and AGVs. A mixed-integer programming model was developed and solved using a multi-start local search algorithm. Experimental results demonstrated that the proposed method could effectively improve unloading efficiency and highlighted the importance of considering traffic congestion and buffer capacity constraints. Wang et al. [15] addressed the integrated scheduling problem of yard cranes and AGVs by formulating an integer programming model and developing a genetic algorithm-based solution method. The results showed that a hybrid transfer mode combining direct handover and buffer-assisted handover could effectively improve system operational efficiency. Zhou et al. [16] investigated the recharging scheduling problem of electric AGVs under charging station capacity constraints. The problem was modeled as a Markov decision process and solved using a multi-agent Q-learning approach. Experimental results indicated that the proposed method could effectively reduce task delays and improve system performance. Che et al. [17] studied the scheduling problem of electric AGVs with charging constraints and proposed a solution method based on graph neural networks and multi-agent deep reinforcement learning. Experimental results demonstrated that the proposed approach outperformed conventional heuristic methods in both solution quality and computational efficiency while exhibiting strong generalization capability. Yang et al. [18] focused on the optimization of charging strategies for battery-powered AGVs in U-shaped automated container terminals. They proposed a simulation-based optimization method using an improved proximal policy optimization (PPO) algorithm. The results showed that the proposed method achieved faster convergence and better adaptability to dynamic operating environments. Zhou et al. [19] investigated the co-optimization problem of AGV operations and energy management under a battery-swapping mechanism. A multi-objective optimization model was established and solved using a discrete multi-objective whale optimization algorithm. Experimental results showed that the proposed method could improve operational efficiency while reducing energy system costs. Xiong et al. [20] studied the task allocation and path planning problem of AGVs in automated container terminals and proposed a rolling scheduling model based on container urgency and an improved A* algorithm. The model enabled efficient conflict-free path planning and scheduling. Xing et al. [21] investigated the AGV charging scheduling problem under charging station capacity constraints. They formulated a mixed-integer programming model and proposed a solution framework combining mathematical programming and heuristic algorithms. Experimental results demonstrated that flexible charging strategies could effectively reduce both total AGV operating time and task completion time. Zhao and Liang [22] addressed the charging scheduling problem of electric AGVs by proposing a shallow charging and discharging strategy based on idle time and charging thresholds. A bi-objective optimization model considering both task completion time and battery degradation was developed. The results showed that the proposed strategy could improve AGV utilization while reducing battery degradation. Xie et al. [23] studied the AGV scheduling problem in U-shaped automated container terminals and proposed a dual-threshold charging strategy together with a hybrid algorithm integrating a genetic algorithm and adaptive large neighborhood search. Experimental results indicated that the proposed approach could effectively improve AGV utilization and shorten task completion times. Zhen et al. [24] investigated the AGV scheduling problem under a hybrid battery charging and swapping mode. They established a mathematical model and proposed a column-generation-based solution approach. Experimental results demonstrated that the proposed method could effectively improve terminal operational efficiency and provide guidance for AGV fleet configuration under different battery management strategies. Zhou et al. [25] studied the AGV scheduling problem considering battery constraints and uncertainty in energy consumption. They proposed a resilient and adaptive charging strategy and employed a reinforcement learning approach for optimization. Experimental results showed that the proposed method could effectively improve AGV operational efficiency and revealed the existence of an optimal relationship between AGV fleet size and system performance. Jiang et al. [26] investigated the joint scheduling problem of quay cranes, yard cranes, and AGVs under a charging-on-the-go mode. An optimization model aimed at minimizing the makespan was developed and solved using an improved deep reinforcement learning algorithm. Experimental results demonstrated that the proposed method could effectively enhance the operational efficiency of automated container terminals. Yang et al. [27] analyzed the challenges faced by equipment management and operational control in automated container terminals and explored the application of digital twin technology for terminal operation optimization. Using the fully automated terminal at Qingdao Port as a case study, the authors verified the effectiveness of a digital twin system in real-time monitoring, operational analysis, and anomaly detection. Li et al. [28] investigated the integrated scheduling problem of quay cranes, rail-mounted gantry cranes, and Artificial Intelligence Transport Robots (ARTs) in automated container terminals. They developed an optimization model aimed at minimizing ART energy consumption and proposed a multi-agent deep deterministic policy gradient algorithm integrated with the A* algorithm. Experimental results demonstrated that the method could effectively reduce system energy consumption and improve operational efficiency. These studies have improved the ability of models to represent complex operational environments; however, they also suffer from issues such as high training costs, insufficient interpretability of decision rules, and strong dependence on scenario-specific parameters. From the perspective of practical industrial deployment, rule-based strategies such as threshold charging, opportunity charging, and interval charging still possess advantages in interpretability, implementation simplicity, and parameter tuning convenience. Therefore, it remains necessary to systematically compare their operational performance within a unified simulation framework.
Meanwhile, research on port intelligence is expanding from operational scheduling toward perception, detection, safety assessment, and autonomous navigation. Reviews on sustainable shipping and intelligent ports have emphasized the systematic coupling among green and low-carbon operations, intelligent equipment, and operational safety [29]. Studies on multi-view point cloud registration, sparse-line-constrained point cloud surface registration, improved PointNet++ based truck lifting accident detection, virtual reality-based quay crane driver risk behavior evaluation, and Unmanned Surface Vehicle (USV) path planning have further extended the technological boundaries of intelligent ports in terms of equipment perception, on-site safety, and autonomous water-surface operations [30,31,32,33,34]. Although these studies do not directly address ART charging strategies, they provide technical background for the DXF-based modeling, operational safety constraints, and intelligent port data closed-loop considered in this paper. In the future, if on-site perception, vehicle positioning, and safety warning data are integrated into scheduling systems, ART charging decisions may further evolve from static rule-based approaches into comprehensive decision-making mechanisms driven by real-time operational states.
In summary, substantial progress has been achieved in automated terminal AGV/ART scheduling, battery-constrained modeling, intelligent optimization algorithms, and intelligent port perception. Nevertheless, three major limitations remain. First, some studies focus primarily on optimization models themselves, while paying insufficient attention to implementation differences among rule-based charging strategies in discrete-event simulation environments. Second, threshold settings in opportunity charging, threshold charging, and interval charging may significantly influence strategy performance under continuous task flows, yet related model auditing and comparative analysis remain limited. Third, open-source and reproducible experiments oriented toward specific terminal layouts and traffic-flow structures are still insufficient. To address these gaps, this study takes the automated container terminal of Tianjin Port Second Container Terminal as the research object, constructs an ART-oriented directed traffic network based on DXF drawings, and conducts operation-charging coupled simulation experiments in SimPy. Multiple charging strategies are systematically compared in terms of task completion time, charging travel distance, charging frequency, minimum State of Charge (SOC), and road congestion performance.
2. ART Operational Scenario and Charging Strategies in the Target Terminal
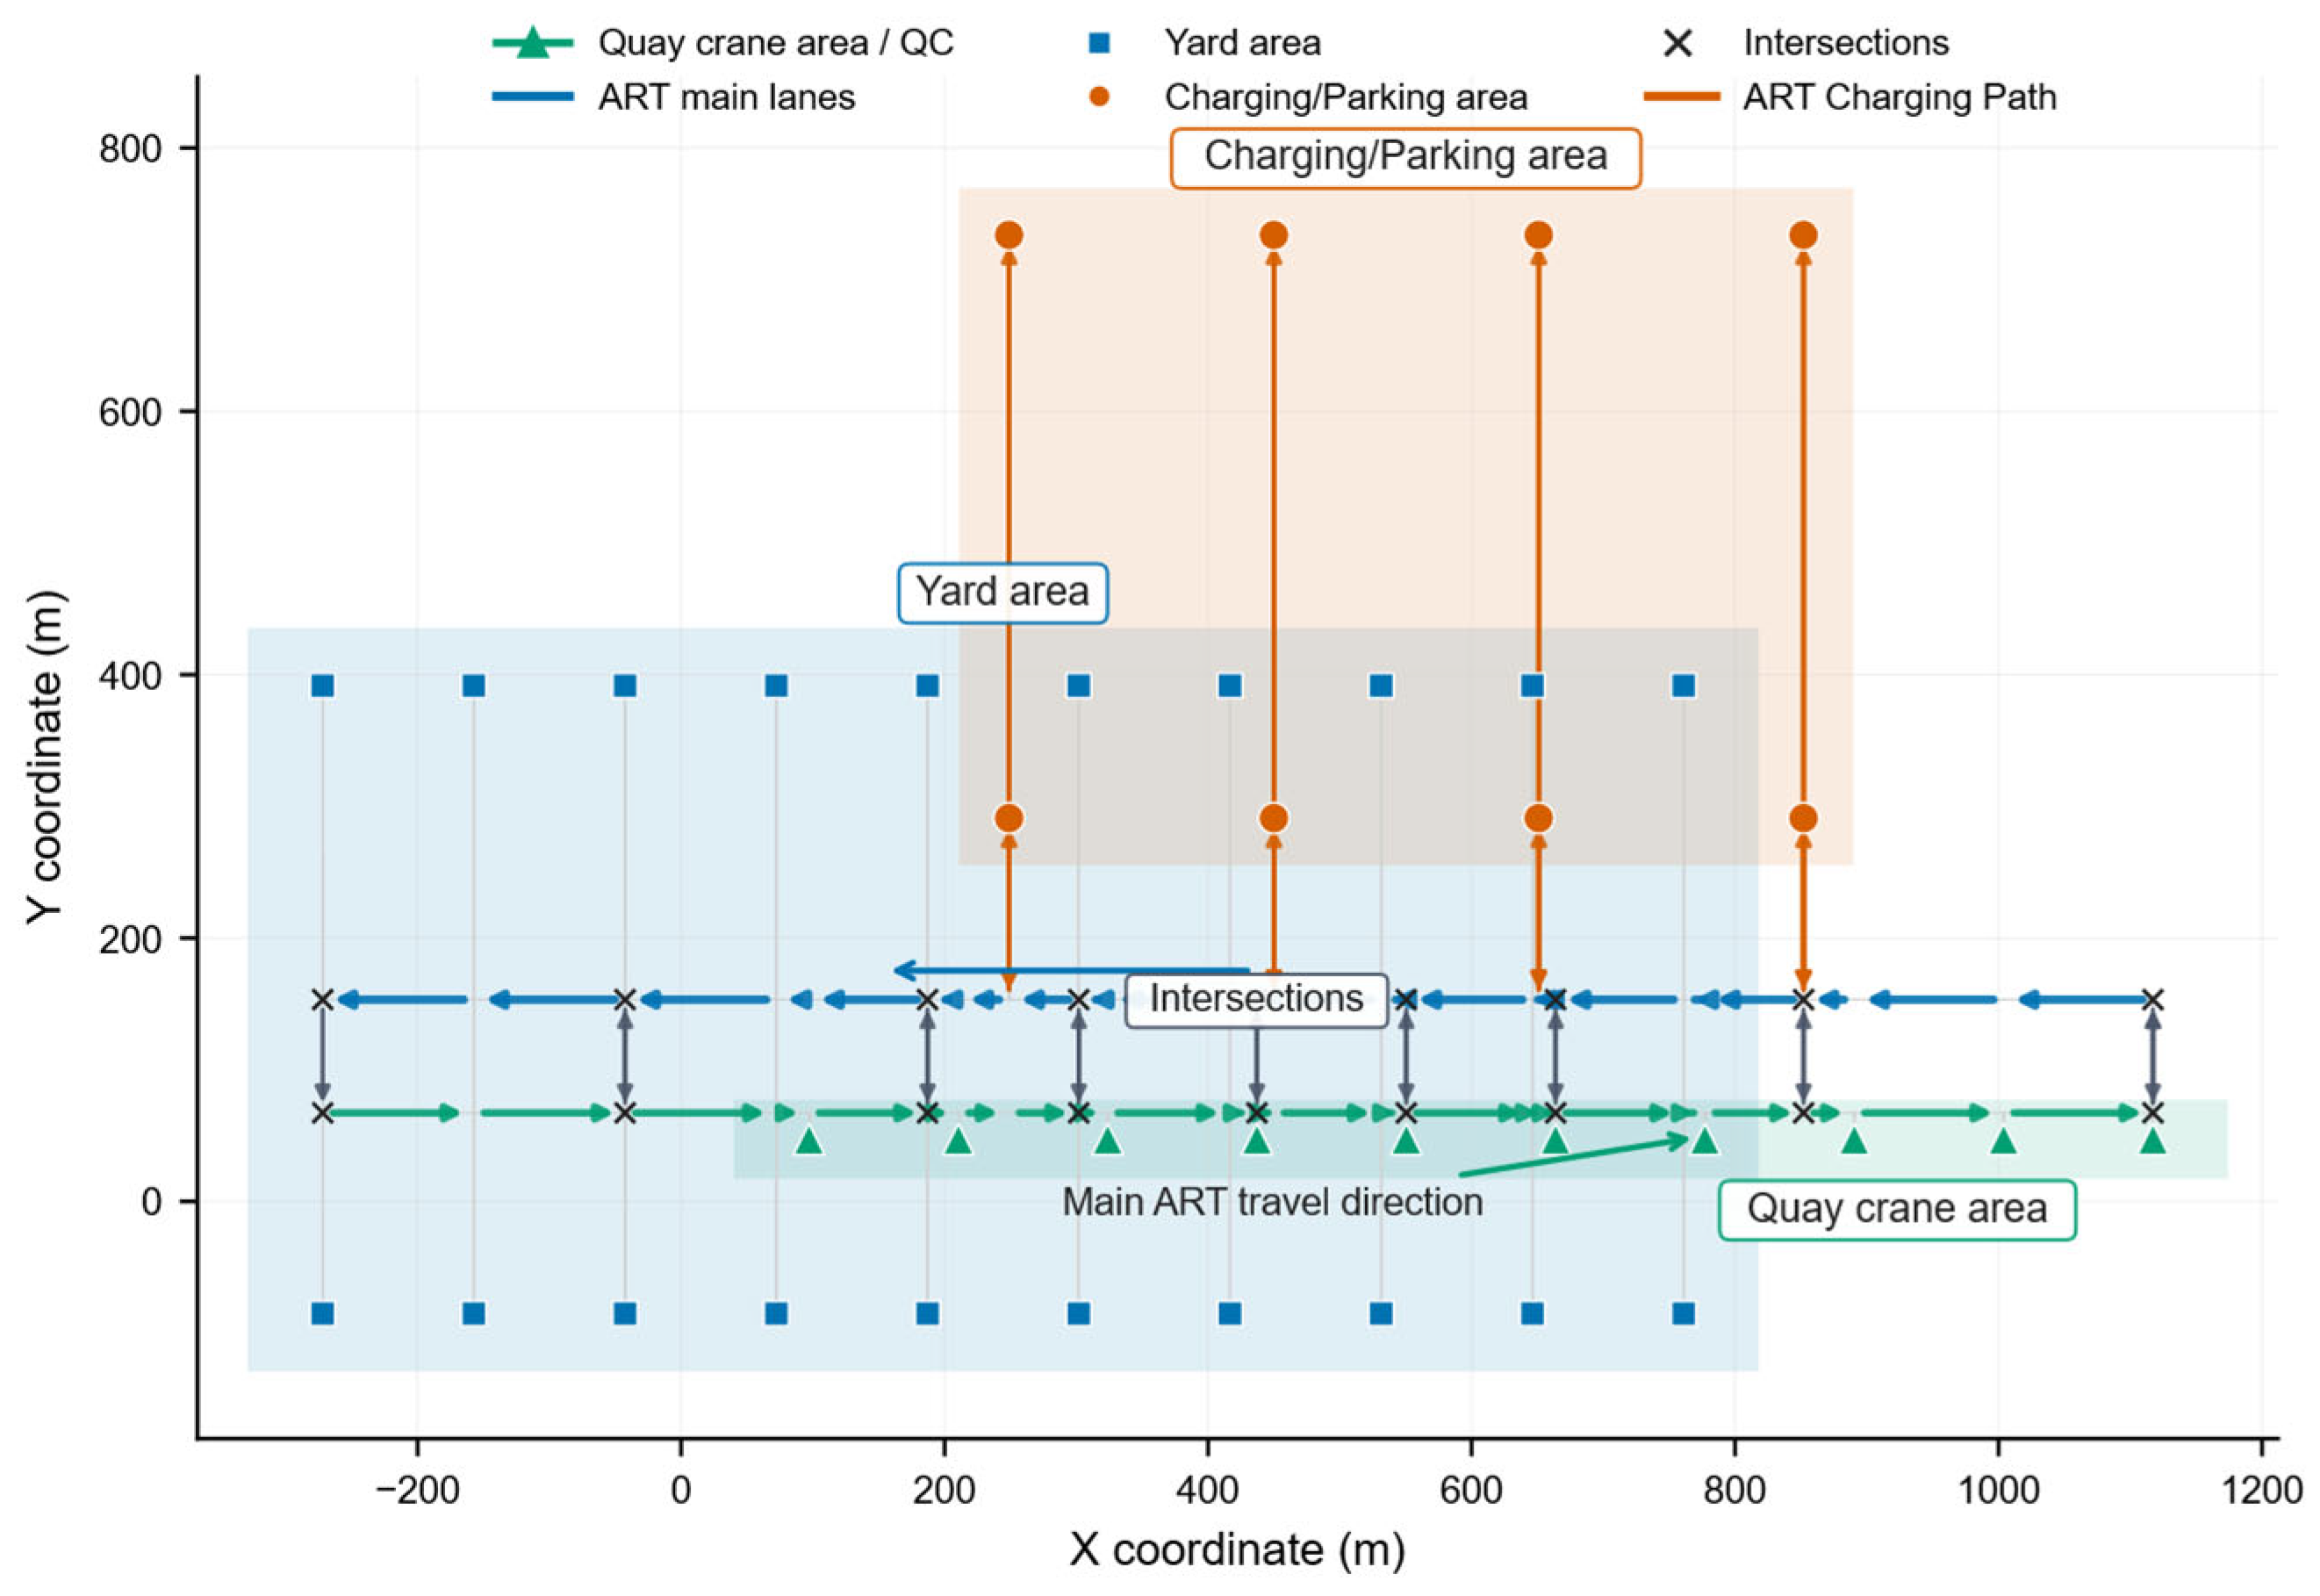
The Tianjin Port Second Container Terminal adopts a coordinated operational mode integrating quay cranes, ARTs, automated yard equipment, and information systems. This study focuses on the horizontal transportation stage during vessel unloading operations. After containers are discharged from the vessel side by quay cranes, ARTs transport the containers to yard entrances or yard handover nodes. Unlike abstract single-loop models, the actual operational space of the target terminal includes quay-side roads, unmanned truck/ART operating lanes, yard connection roads, parking and charging areas, intersections, and local turning zones. Vehicle routes are therefore constrained by road directions and traffic flow organization. Accordingly, the terminal layout is abstracted as a directed graph network in this study, where nodes represent quay cranes, yard entrances, charging interfaces, waiting areas, and intersections, while directed edges represent road segments accessible to ARTs.
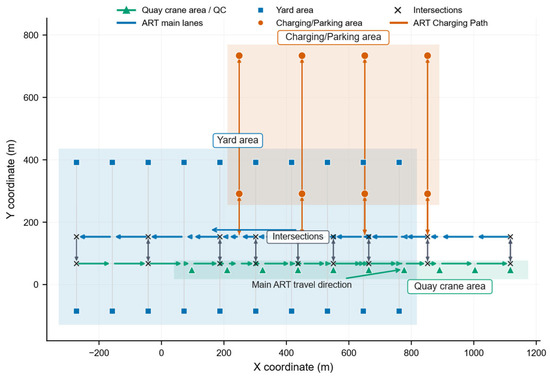
Figure 1 illustrates the simplified layout of the target terminal. The green area represents the quay crane operation zone, the semi-transparent blue area denotes the yard operation zone, and the semi-transparent orange area indicates the charging and parking service zone. Blue square nodes correspond to yard nodes, orange circular nodes represent charging and parking nodes, and black cross symbols denote intersection nodes. Arrows indicate the primary travel directions of the ARTs. The coordinates shown in the figure are based on the local terminal coordinate system, with units expressed in meters (m).
Figure 1.
ART-directed road network layout of the target terminal.
Five rule-based charging strategies are compared in this study. First, under the threshold charging strategy, an ART travels to the nearest charging interface after completing a task whenever its State of Charge (SOC) falls below the lower threshold , and it is then forcibly charged to 100%. Second, the conventional opportunity charging strategy allows ARTs to charge to 100% whenever an idle charging interface is available after task completion, without enforcing any low-battery protection mechanism. This strategy is introduced to analyze the operational risks of pure opportunity charging under continuous task flows. Third, the safe opportunity charging strategy incorporates a low-battery protection mechanism into the opportunity charging framework, forcing the ART to recharge to 100% once the SOC falls below a predefined threshold. Fourth, the interval charging strategy defines a mandatory charging lower bound and an opportunity charging upper bound . ARTs are forced to charge when , while opportunity charging is performed when and a charging interface is available. Charging terminates once the SOC reaches . Fifth, the Distance-Aware Interval Charging (DAIC) strategy estimates the SOC required for completing the route “current position → quay crane → yard block → nearest charging interface” before task assignment, with an additional safety margin . If the current SOC is insufficient to satisfy this estimated requirement, the ART is prioritized for charging before task execution.
The charging strategies and their corresponding parameter settings are summarized in Table 1.
Table 1.
Charging strategy and parameter settings.
3. Simulation Model and Experimental Design Based on DXF
3.1. Directed Road Network Modeling of the Target Terminal
The Computer-Aided Design (CAD) drawings and their Drawing Exchange Format (DXF) files for Section C of Tianjin Port were used as the geometric basis for model construction. To transform the original CAD/DXF structure into an ART-oriented directed traffic network suitable for simulation, the DXF layers, line segments, polylines, text annotations, and traffic-flow-related objects were first extracted. Layers associated with the horizontal transportation system of the terminal, including ART operating lanes, main roads, directional arrows, quay crane areas, yard areas, and charging/parking areas, were then identified and retained.
Based on the selected layers, coordinate normalization and geometric calibration were performed on the original DXF data. According to the coordinate range and the engineering scale of the terminal, the original DXF coordinates were interpreted in millimeters and uniformly converted into meters. Geometrically distorted objects caused by abnormal oversized boundary-box layers were removed to avoid their influence on network distance calculations. Subsequently, according to the spatial distribution of quay cranes, yard blocks, charging interfaces, main lanes, and intersections, the corresponding network nodes were extracted, including Quay Crane (QC), Yard, Charger, Intersection, and Main Lane (ML) nodes.
During network generation, directed edges were established based on traffic-flow layers and lane directions, forming a directed graph represented by node and edge tables. The node table records the node type, coordinates, source layer, and additional remarks, while the edge table stores attributes such as origin, destination, length, number of lanes, speed limit, travel direction, and road type. A DirectedTerminalNetwork was then constructed using ‘networkx.DiGraph’. Based on this network, the accessibility of representative routes, such as those from quay cranes to yard blocks and from yard blocks to charging interfaces, was verified. Shortest-path distances and travel times were subsequently calculated, and the resulting directed network was incorporated into the SimPy discrete-event simulation model.
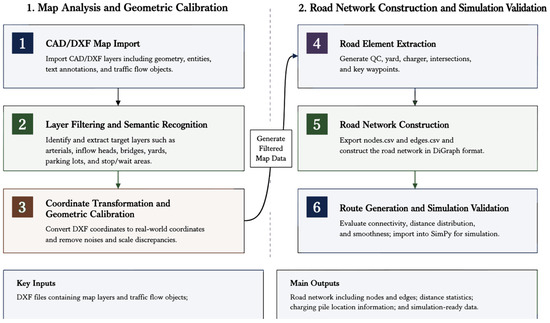
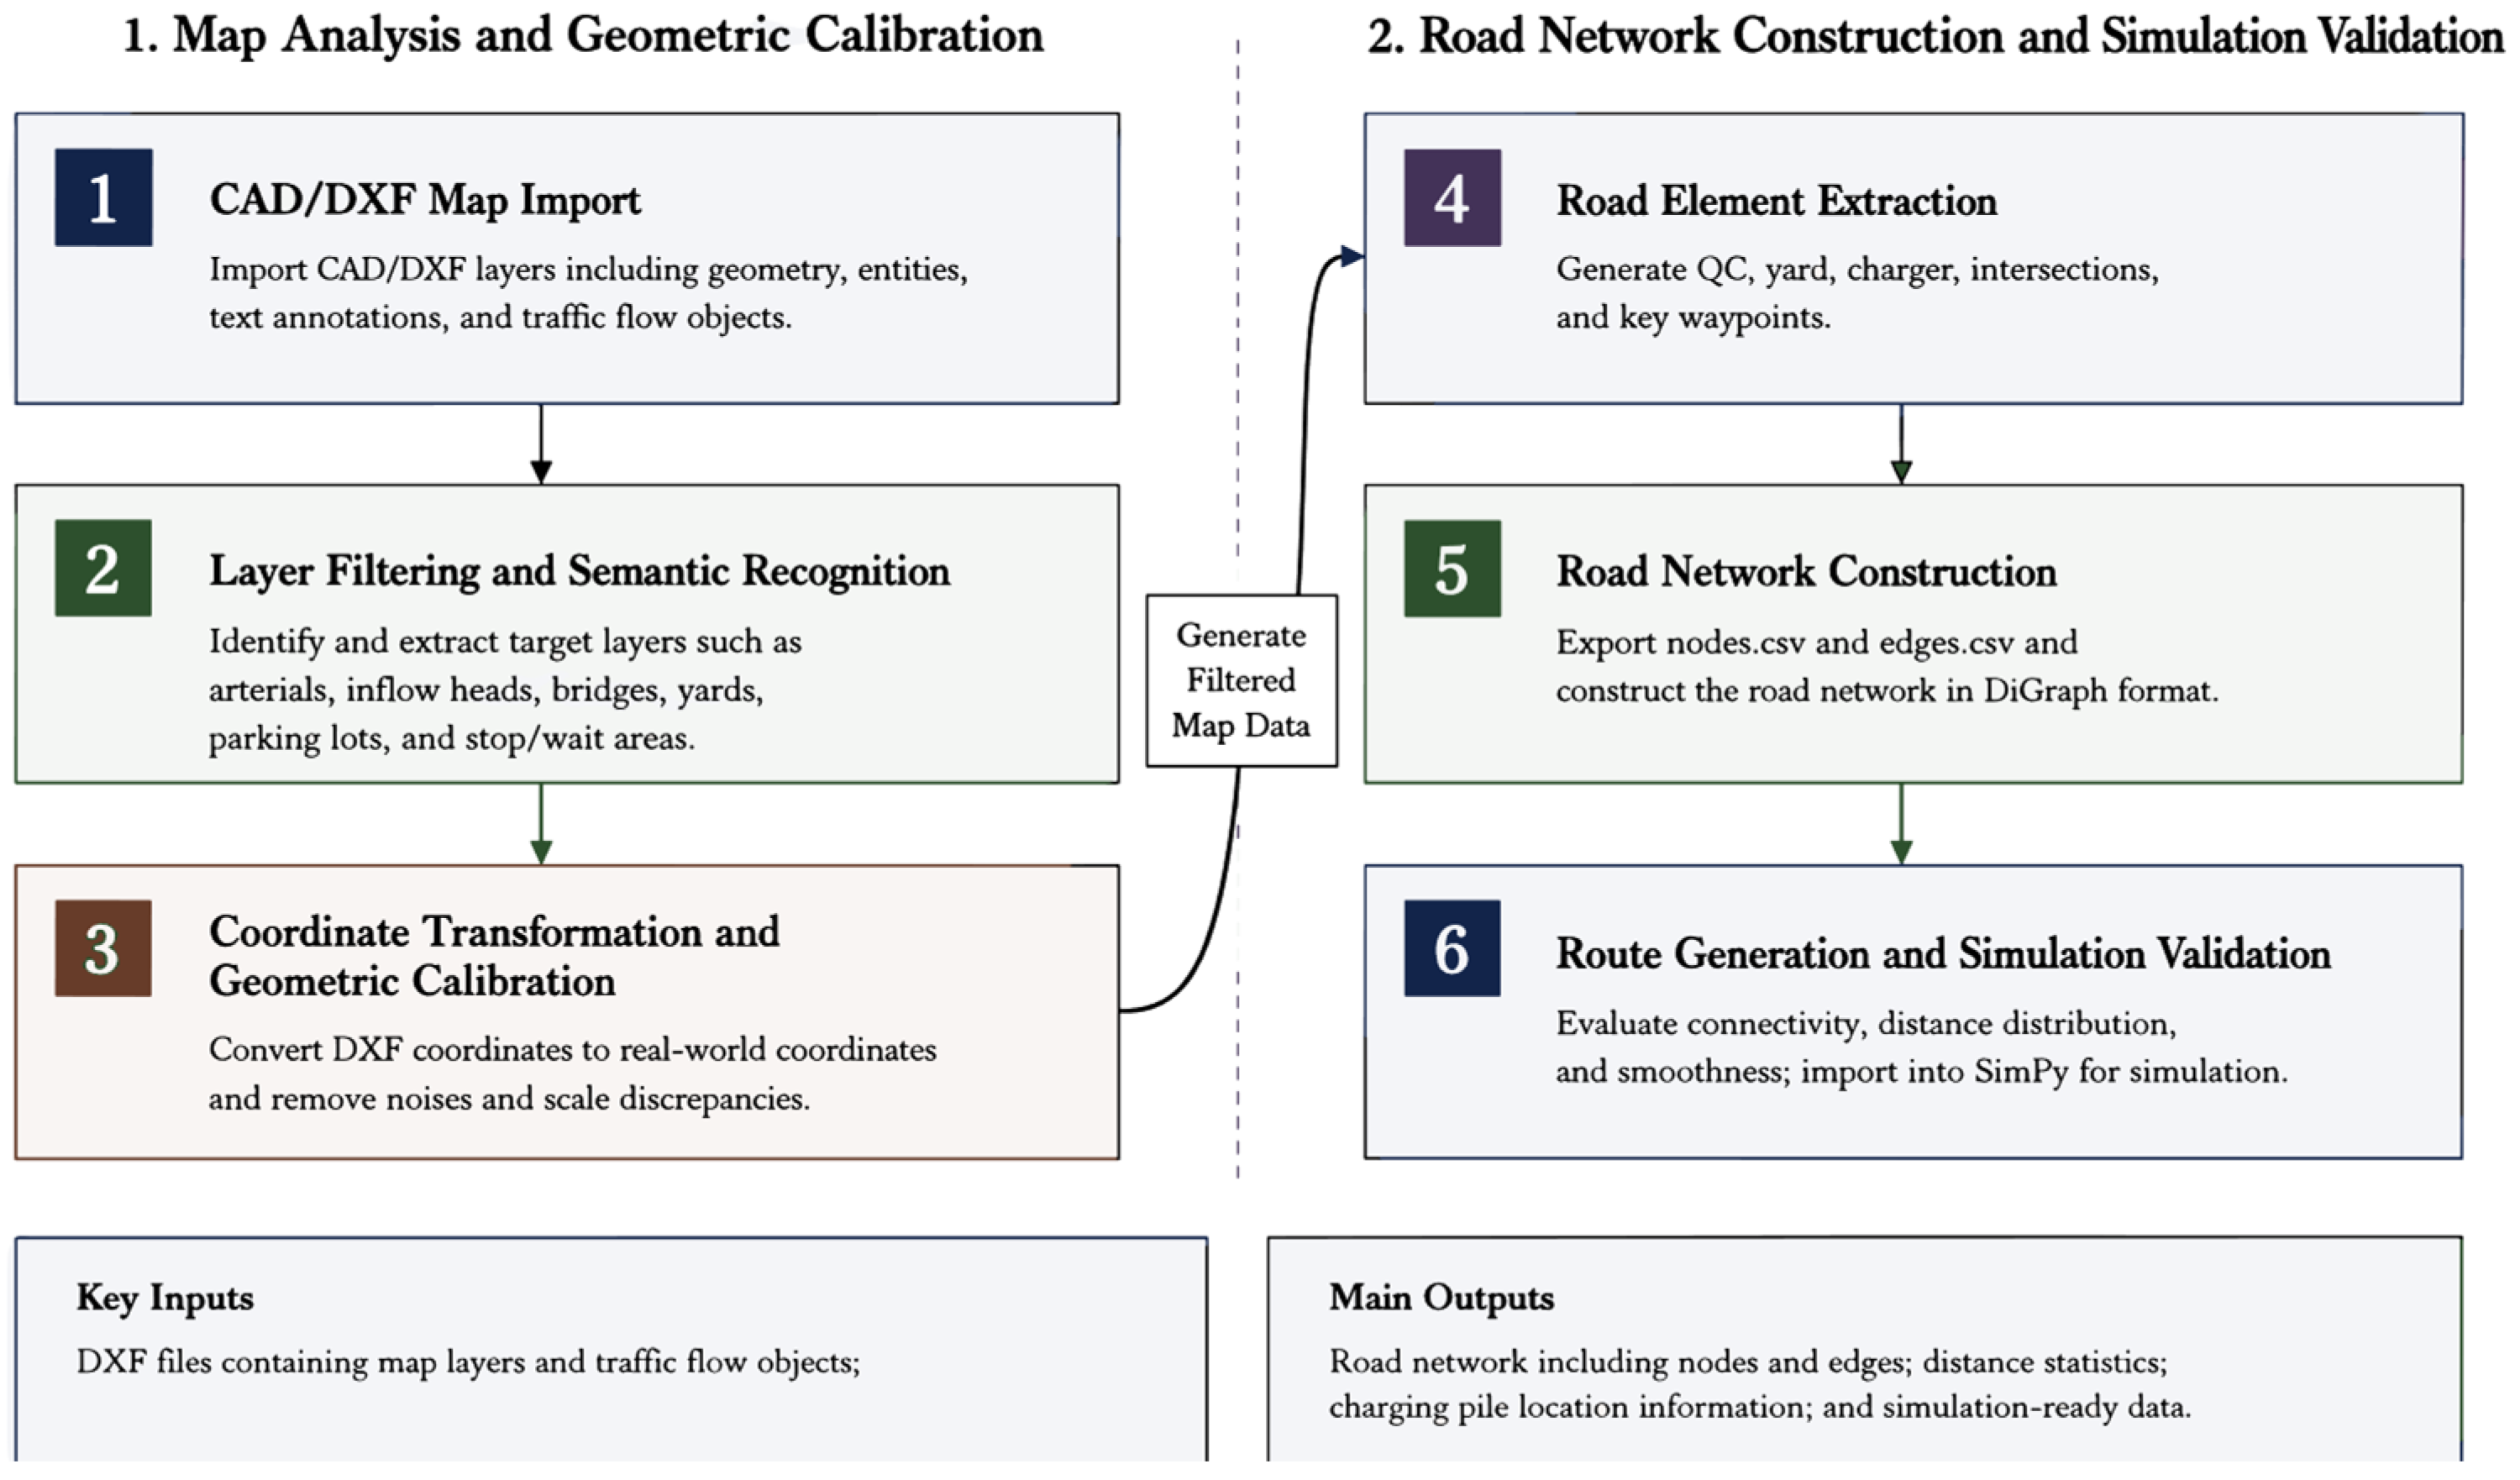
Figure 2 illustrates the conversion process from CAD/DXF drawings to the ART-oriented directed traffic network. First, DXF layers and entities are extracted, and objects related to ART lanes, traffic-flow directions, quay cranes, yard blocks, and charging/parking areas are identified. Coordinate unit conversion and geometric calibration are then performed, followed by the extraction of network elements including quay cranes, yard blocks, charging interfaces, main lanes, and intersections. Finally, node and edge tables are generated to construct the directed road network, and its connectivity, distance distribution, and suitability for simulation are validated.
Figure 2.
Conversion process from CAD/DXF to the ART-oriented directed traffic network.
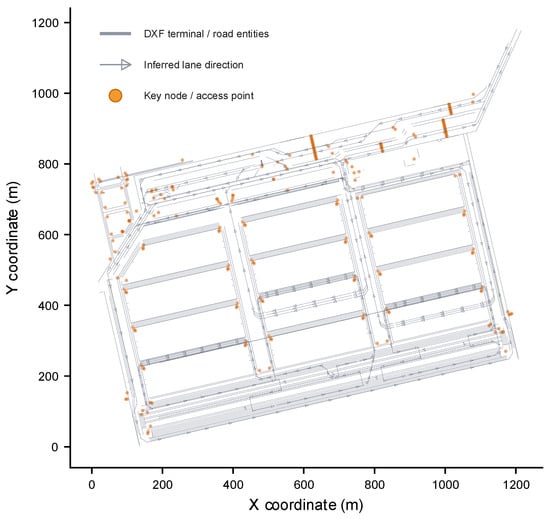
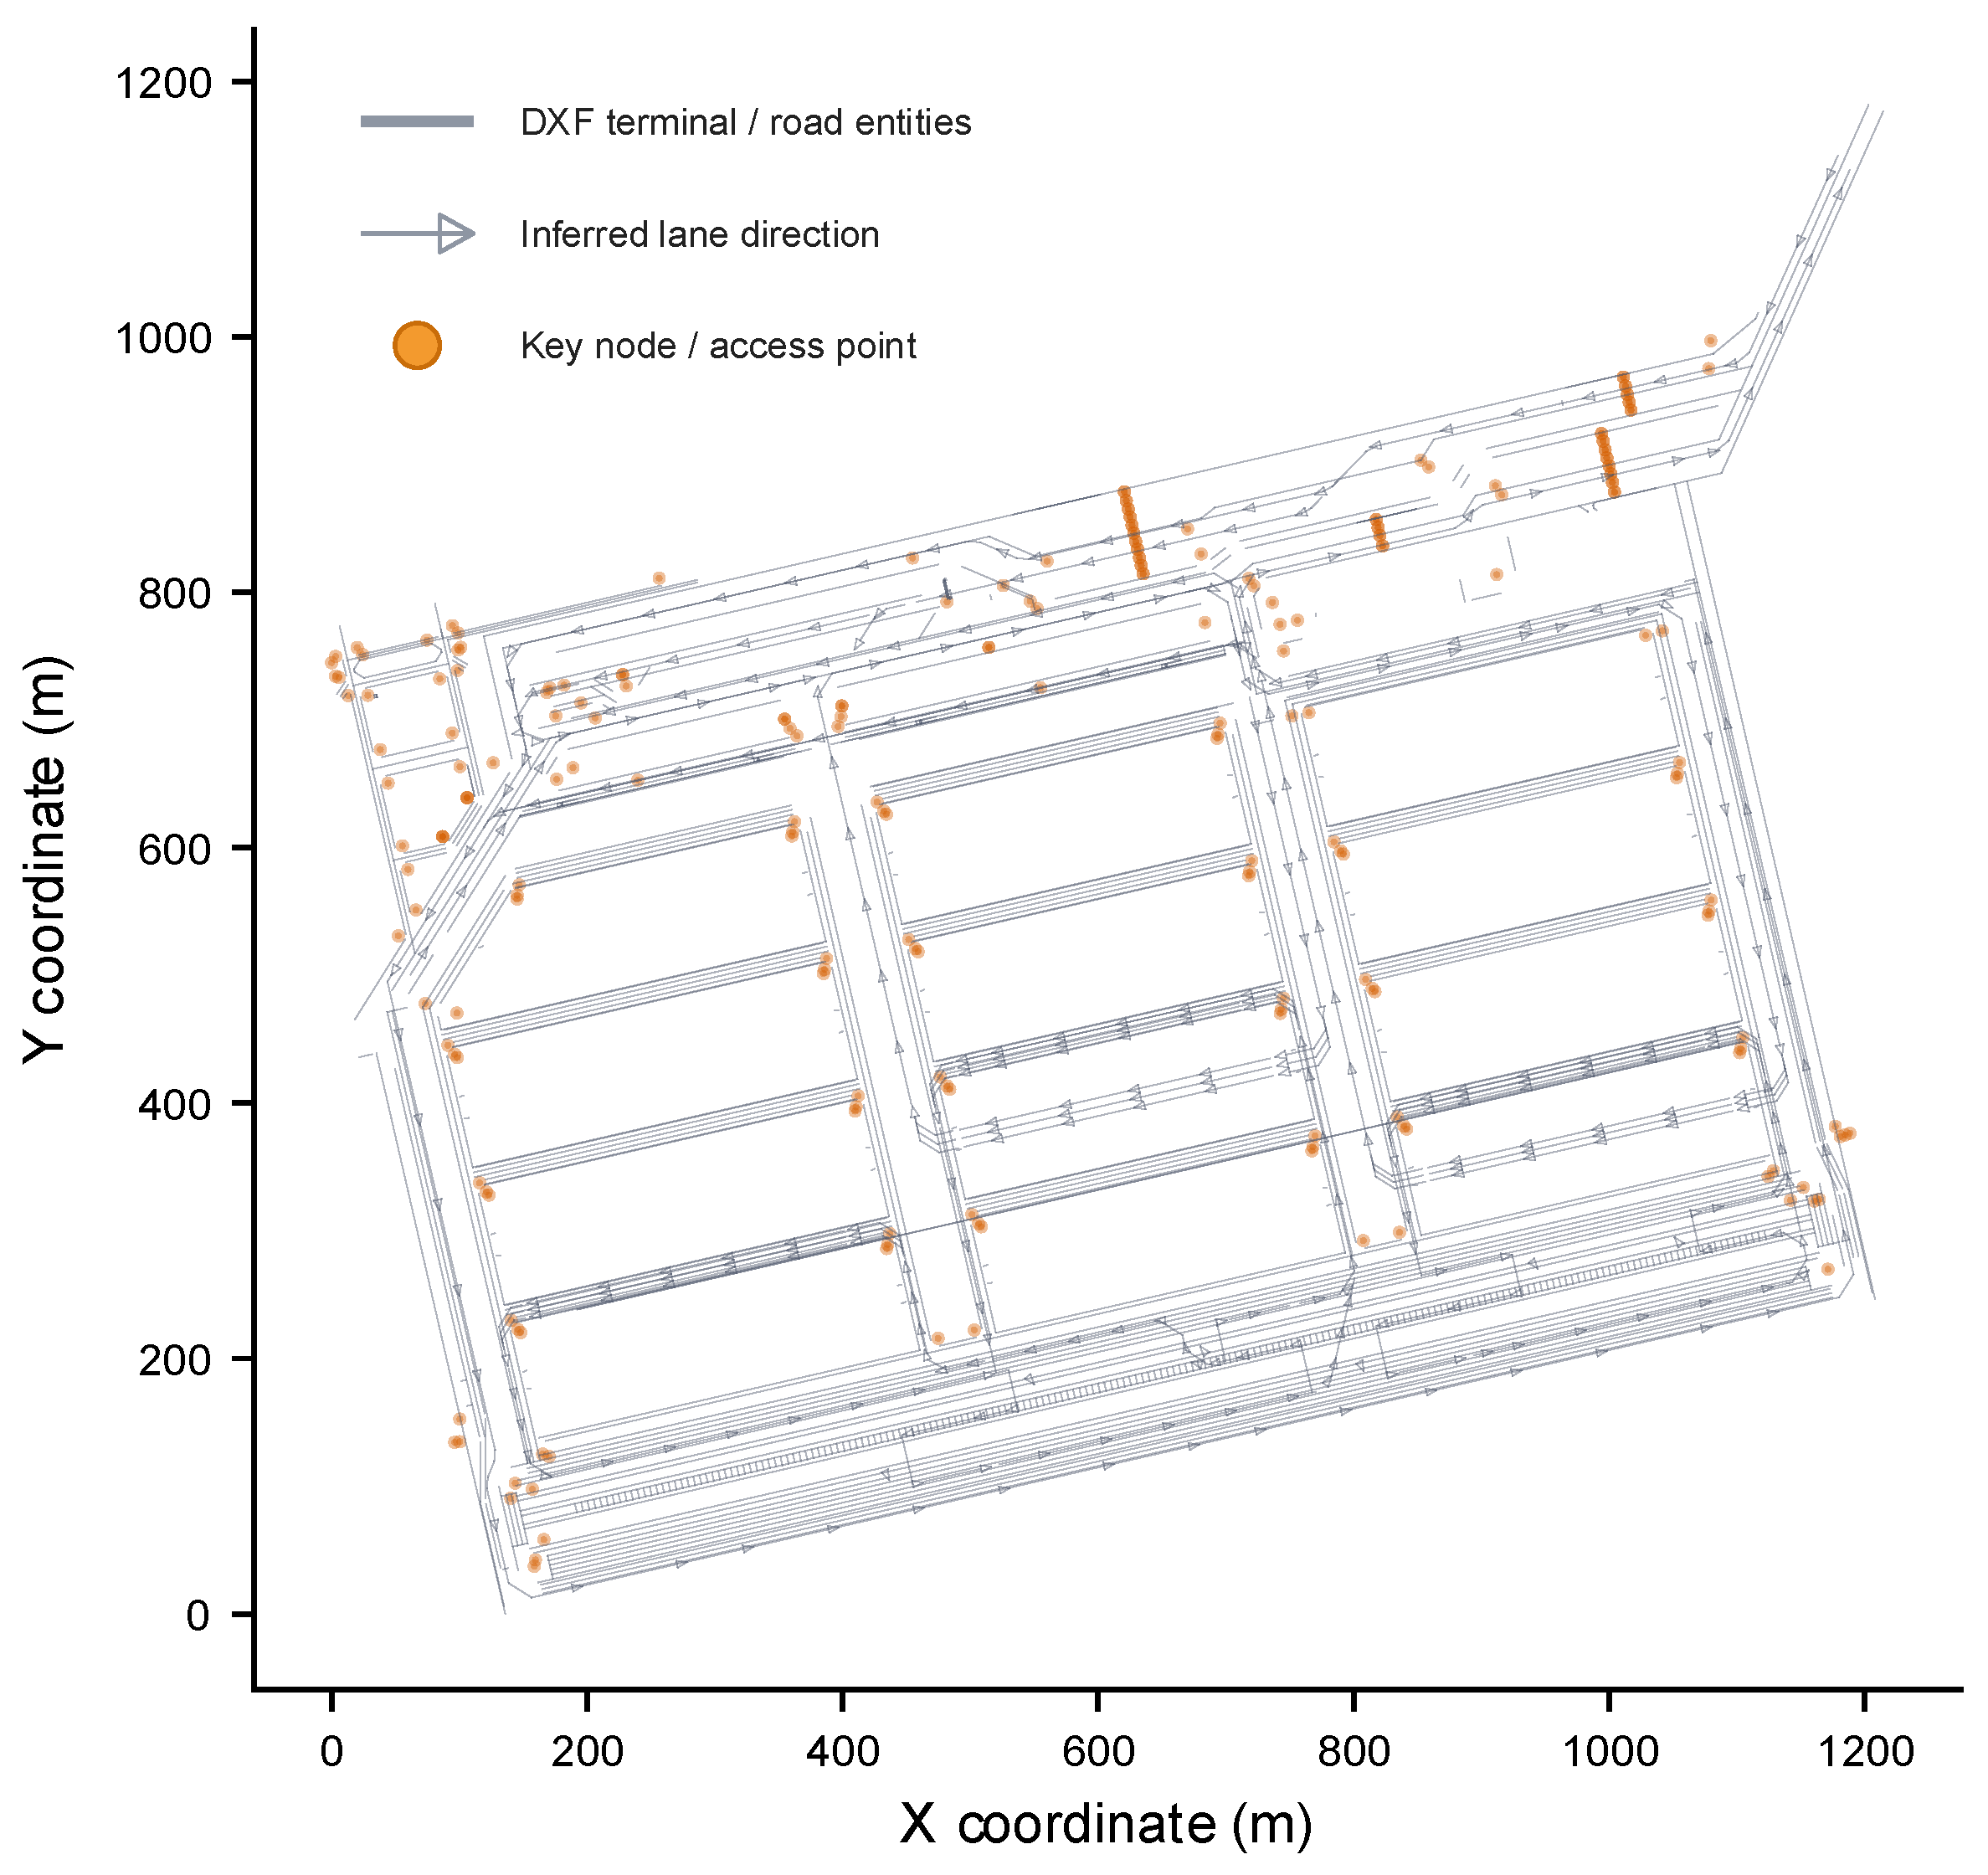
Figure 3 presents a preview of the DXF layers associated with the traffic network and terminal structures.
Figure 3.
DXF traffic and terminal structure.
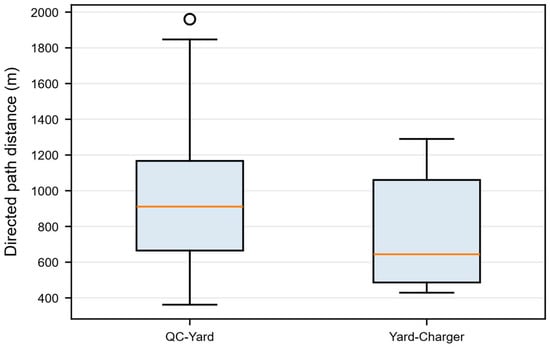
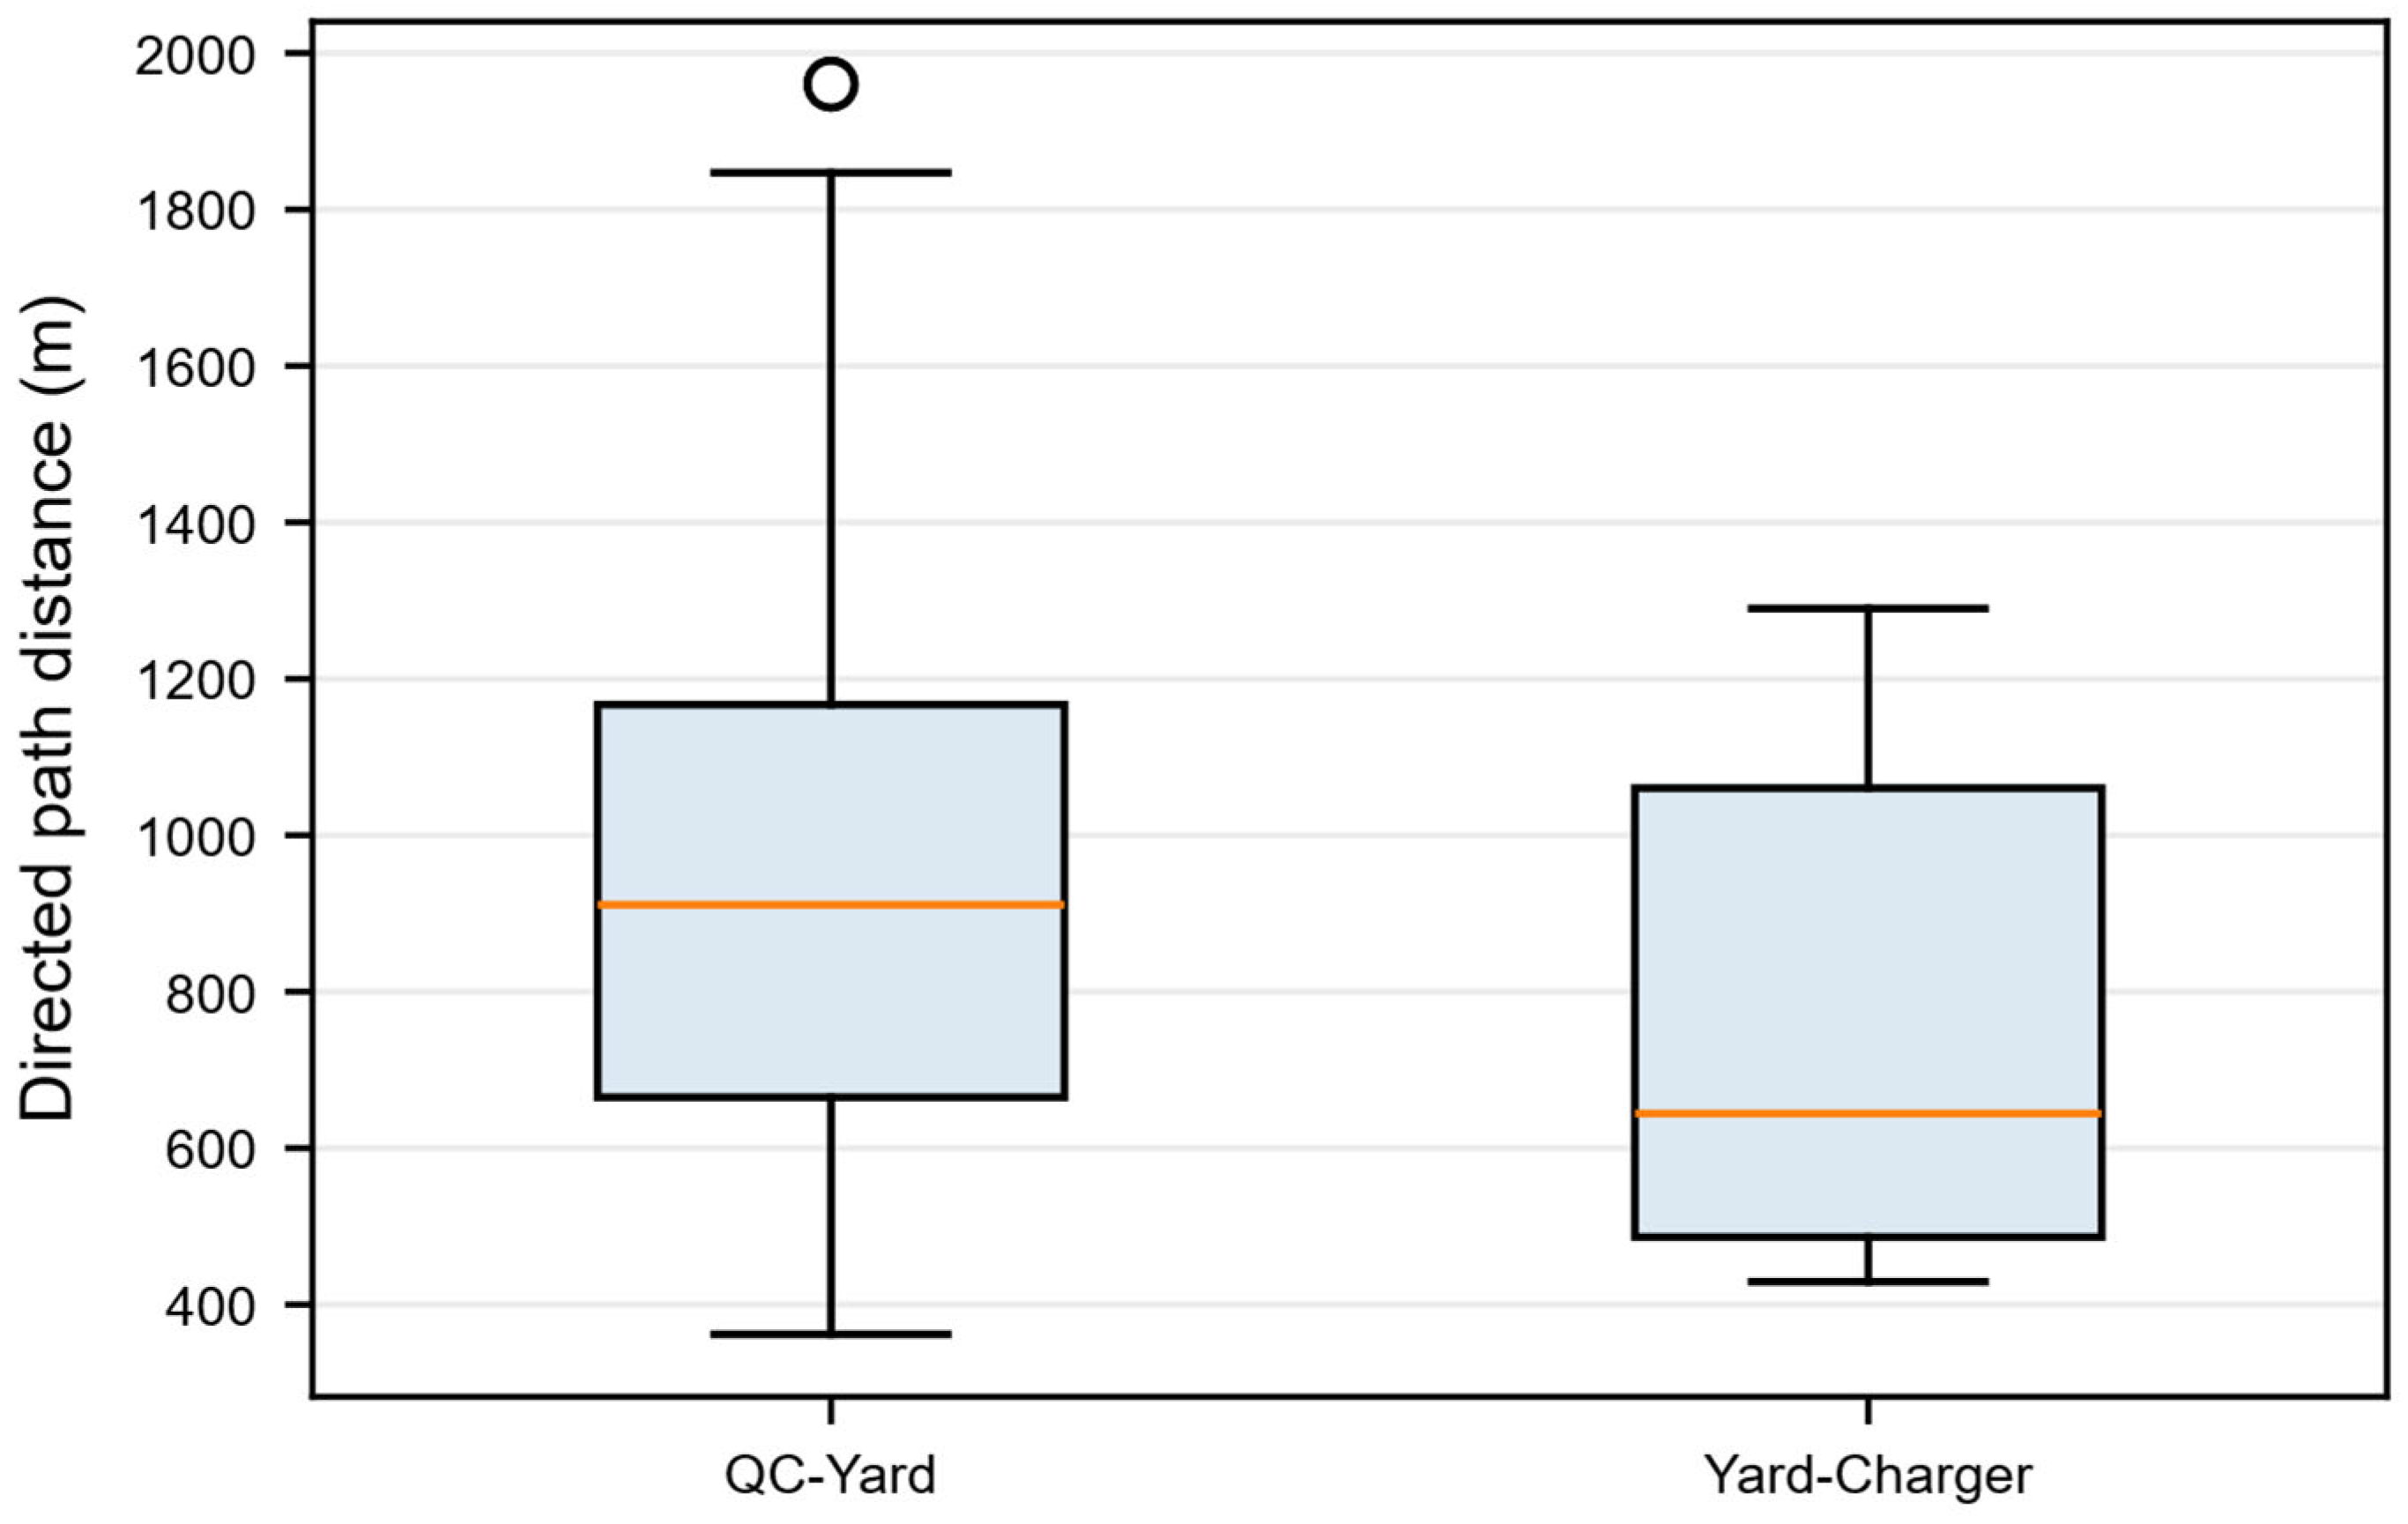
Based on the DXF layers and entity ranges, a directed terminal road network model is constructed, consisting of 88 nodes, 144 directed edges, 10 quay crane nodes, 20-yard block nodes, and 8 charging interfaces. All routes from quay cranes to yard blocks and from yard blocks to charging interfaces are reachable. In the calibrated road network, the average loaded transport distance between quay cranes and yard blocks is 954.552 m, with a median value of 911.091 m, a minimum value of 361.956 m, and a maximum value of 1960.335 m. This distance distribution indicates significant spatial heterogeneity in ART horizontal transportation paths within the target terminal. Consequently, the geometric characteristics of the road network directly influence energy consumption levels, charging trigger frequency, and charging strategy evaluation results.
The statistics of road network size and transport distances in the target terminal are summarized in Table 2. The ART typical path distance distribution under the DXF-calibrated road network is shown in Figure 4.
Table 2.
Statistics of road network size and transport distances in target terminal.
Figure 4.
ART typical path distance distribution under the DXF-calibrated road network.
3.2. ART Energy Consumption, Charging and Traffic Capacity Model
The simulation model treats each ART as an active process, while task queues, charging interfaces, and road resources are modeled as constrained resources. Since this study focuses on vessel unloading operations, each ART repeatedly executes the operational cycle of “empty travel to quay crane → container loading → loaded travel to yard block → unloading → charging decision”. The corresponding pseudocode is provided in Algorithm 1.
| Algorithm 1: ART operation cycle and charging decision process |
| step1 Input: Task queue Q, Charging interfaces C, Road and intersection resources G, Initial SOC of each ART, Charging strategy π; step2 Initialize all ART states and system clock; step3 While unfinished tasks exist do step4 Select an idle ART i; step5 Retrieve the next transport task Tk from task queue Q; step6 Request the required road and intersection resources; step7 Travel empty from the current position to the assigned quay crane; step8 Update SOC according to empty-travel distance; step9 Load container at the quay crane; step10 Request the road and intersection resources along the loaded path; step11 Travel loaded from the quay crane to the assigned yard node; step12 Update SOC according to loaded-travel distance; step13 Unload container at the yard node; step14 Execute charging strategy π; step15 If charging is triggered then step16 Select an available charging interface; step17 Travel to the charging interface; step18 Update SOC according to charging-trip distance; step19 Request charging resource; step20 Charge until the stopping condition of π is satisfied; step21 Release the charging interface; step22 End if step23 Release occupied road and intersection resources; step24 Set ART i to idle state; step25 End while step26 Return system performance indicators (completion time, charging distance, charging frequency, minimum SOC, average charging waiting time, average road waiting time, average intersection waiting time, and operation success rate). |
Two simulation modes are designed in this study: the distance-calculation mode and the traffic-capacity mode. Under the distance-calculation mode, empty-travel energy consumption is calculated based on the empty-driving current and the baseline power consumption current, while loaded-travel energy consumption is calculated using the loaded-driving current and the baseline power consumption current. Loading, unloading, waiting, and road queuing processes consume energy according to the baseline power consumption current. Charging energy is determined by the charging current and charging duration. All energy consumption calculations are based on the product of current and operating time, using a simplified model to calculate the energy consumption during unloaded and loaded driving. The model simultaneously records indicators including empty-travel energy consumption, loaded-travel energy consumption, and replenished charging energy, thereby enabling verification of energy-calculation consistency throughout the simulation process.
Under the traffic-capacity mode, key road segments and intersections are represented using SimPy Resource objects. Before entering a capacity-constrained road segment, an ART must request the corresponding road resource and occupy the resource while traversing that segment. This mode outputs indicators such as average road waiting time, average intersection waiting time, major congested edges, and major congested intersections. These indicators are used to evaluate whether a charging strategy may aggravate road congestion due to frequent ART movements between operational areas and charging zones.
The key parameters of the simulation are summarized in Table 3.
Table 3.
Key parameters of simulation.
3.3. Experiment Design
3.3.1. Experimental Method Design
Six groups of experiments are conducted in this study based on the DXF-calibrated road network. The first group consists of a DXF-based road network calibration experiment, which examines the reachability and distance distribution among all operational nodes and verifies that all routes from quay cranes to yard blocks and from yard blocks to charging interfaces are reachable. The second group comprises strategy comparison experiments, in which threshold charging, conventional opportunity charging, safe opportunity charging, interval charging, and DAIC strategies are compared under 3000 unloading transportation tasks. Each strategy is simulated 30 times under identical random seeds. The third group involves interval charging strategy parameter analysis, where the lower charging threshold and the opportunity charging upper threshold of the interval charging strategy are systematically scanned under workloads of 3000, 6000, and 9000 tasks. The objective is to analyze the influence of different opportunity charging intervals on completion time, minimum SOC, and charging resource utilization. The fourth group consists of traffic-capacity scenario experiments, in which road segment and intersection capacity constraints are introduced to evaluate the impact of charging strategies on traffic congestion. The fifth group is the DAIC-required SOC analysis, which examines the impact of B/R combinations on the number of DAIC triggers and the average required SOC, as well as the differences from the interval charging strategy. The sixth group includes resource sensitivity experiments, where the number of ARTs and charging interfaces are varied to assess the sensitivity of strategy performance to equipment configurations.
3.3.2. Experimental Parameters Design
The baseline experimental scenario adopts 30 ARTs, 8 charging interfaces, and a task release interval of 30 s with an additional random disturbance of 3 s. In pressure-test and traffic-capacity scenarios, road segment and intersection resource constraints are further introduced. For the threshold charging strategy, the lower threshold ranges from 10% to 60%. The combinations of the interval charging strategy cover different mandatory charging lower bounds and opportunity charging upper bounds. The safe opportunity charging strategy adopts two mandatory protection thresholds, namely 20% and 30%. For all strategies, task sequences are generated under identical random seeds to eliminate the influence of stochastic task release on strategy comparison results.
Since random perturbations were introduced into task release times, different random seeds may lead to variations in task sequences and vehicle interactions. Therefore, multiple simulation replications were conducted in each experiment to reduce the influence of randomness. The number of replications was determined by considering both result stability and computational cost.
For the strategy comparison experiments, 30 independent runs with different random seeds were performed under identical parameter settings. Preliminary tests showed that after approximately 25 replications, the mean values of key performance indicators, including task completion time, charging travel distance, and minimum SOC, became nearly stable. Additional replications produced only marginal changes in the averaged results. Therefore, 30 replications were adopted to ensure statistical reliability.
For the interval charging strategy parameter analysis, 10 replications were conducted because a large number of combinations had to be evaluated, resulting in substantially increased computational demand. Preliminary experiments indicated that the spatial distributions of completion time and minimum SOC in the heat maps became stable after approximately 8–10 replications, and the variations in the average values of neighboring grid cells were negligible. Hence, 10 replications were considered sufficient to capture the parameter-dependent trends while maintaining computational efficiency.
For the traffic-capacity scenario experiments, the locations of congestion are mainly determined by the road network topology and traffic flow distribution, whereas the effects of random task releases are relatively limited. Preliminary results showed that the average road waiting time, average intersection waiting time, and the locations and occurrence frequencies of congested links remained essentially unchanged after 5–10 replications. Therefore, 5–10 replications were considered adequate to obtain stable congestion evaluation results.
3.3.3. Experimental Outputs Design
The output indicators in this study include operational success rate, task completion time, charging travel distance, charging frequency, minimum SOC, average charging waiting time, average road waiting time, and average intersection waiting time. Among these, task completion time represents the total time required to complete all unloading tasks; charging travel distance refers to the additional distance traveled by ARTs for reaching charging interfaces; charging frequency denotes the total number of ART charging events; minimum SOC represents the lowest battery percentage reached by any ART during simulation; and average road waiting time and average intersection waiting time represent the average waiting time per task caused by road segment and intersection capacity constraints, respectively. The operational success rate is defined as the proportion of simulation runs in which all tasks are successfully completed without ART battery depletion failures.
The experiment design is summarized in Table 4.
Table 4.
Summary of Experiment design.
4. Simulation Results
4.1. Results of DXF-Based Road Network Calibration Experiment
The results of DXF-based road network calibration experiment indicate that the average loaded transport distance between quay cranes and yard blocks at Tianjin Port Second Container Terminal is 954.552 m, while the maximum path length approaches 2 km. The relatively long horizontal transportation distance increases both the operational energy consumption and charging trigger frequency of ARTs. It also exposes the risk of battery depletion for the conventional opportunity charging strategy, which lacks mandatory low-battery protection under continuous task flows.
4.2. Results of Strategy Comparison Experiment
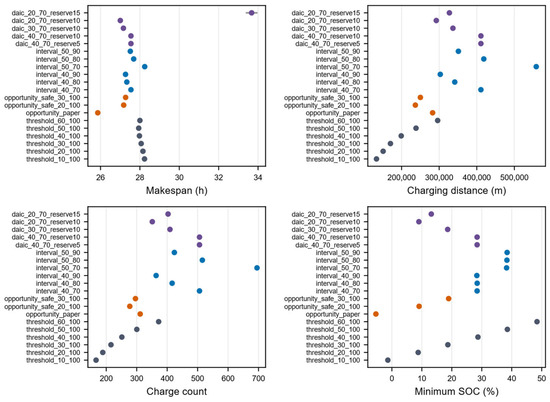
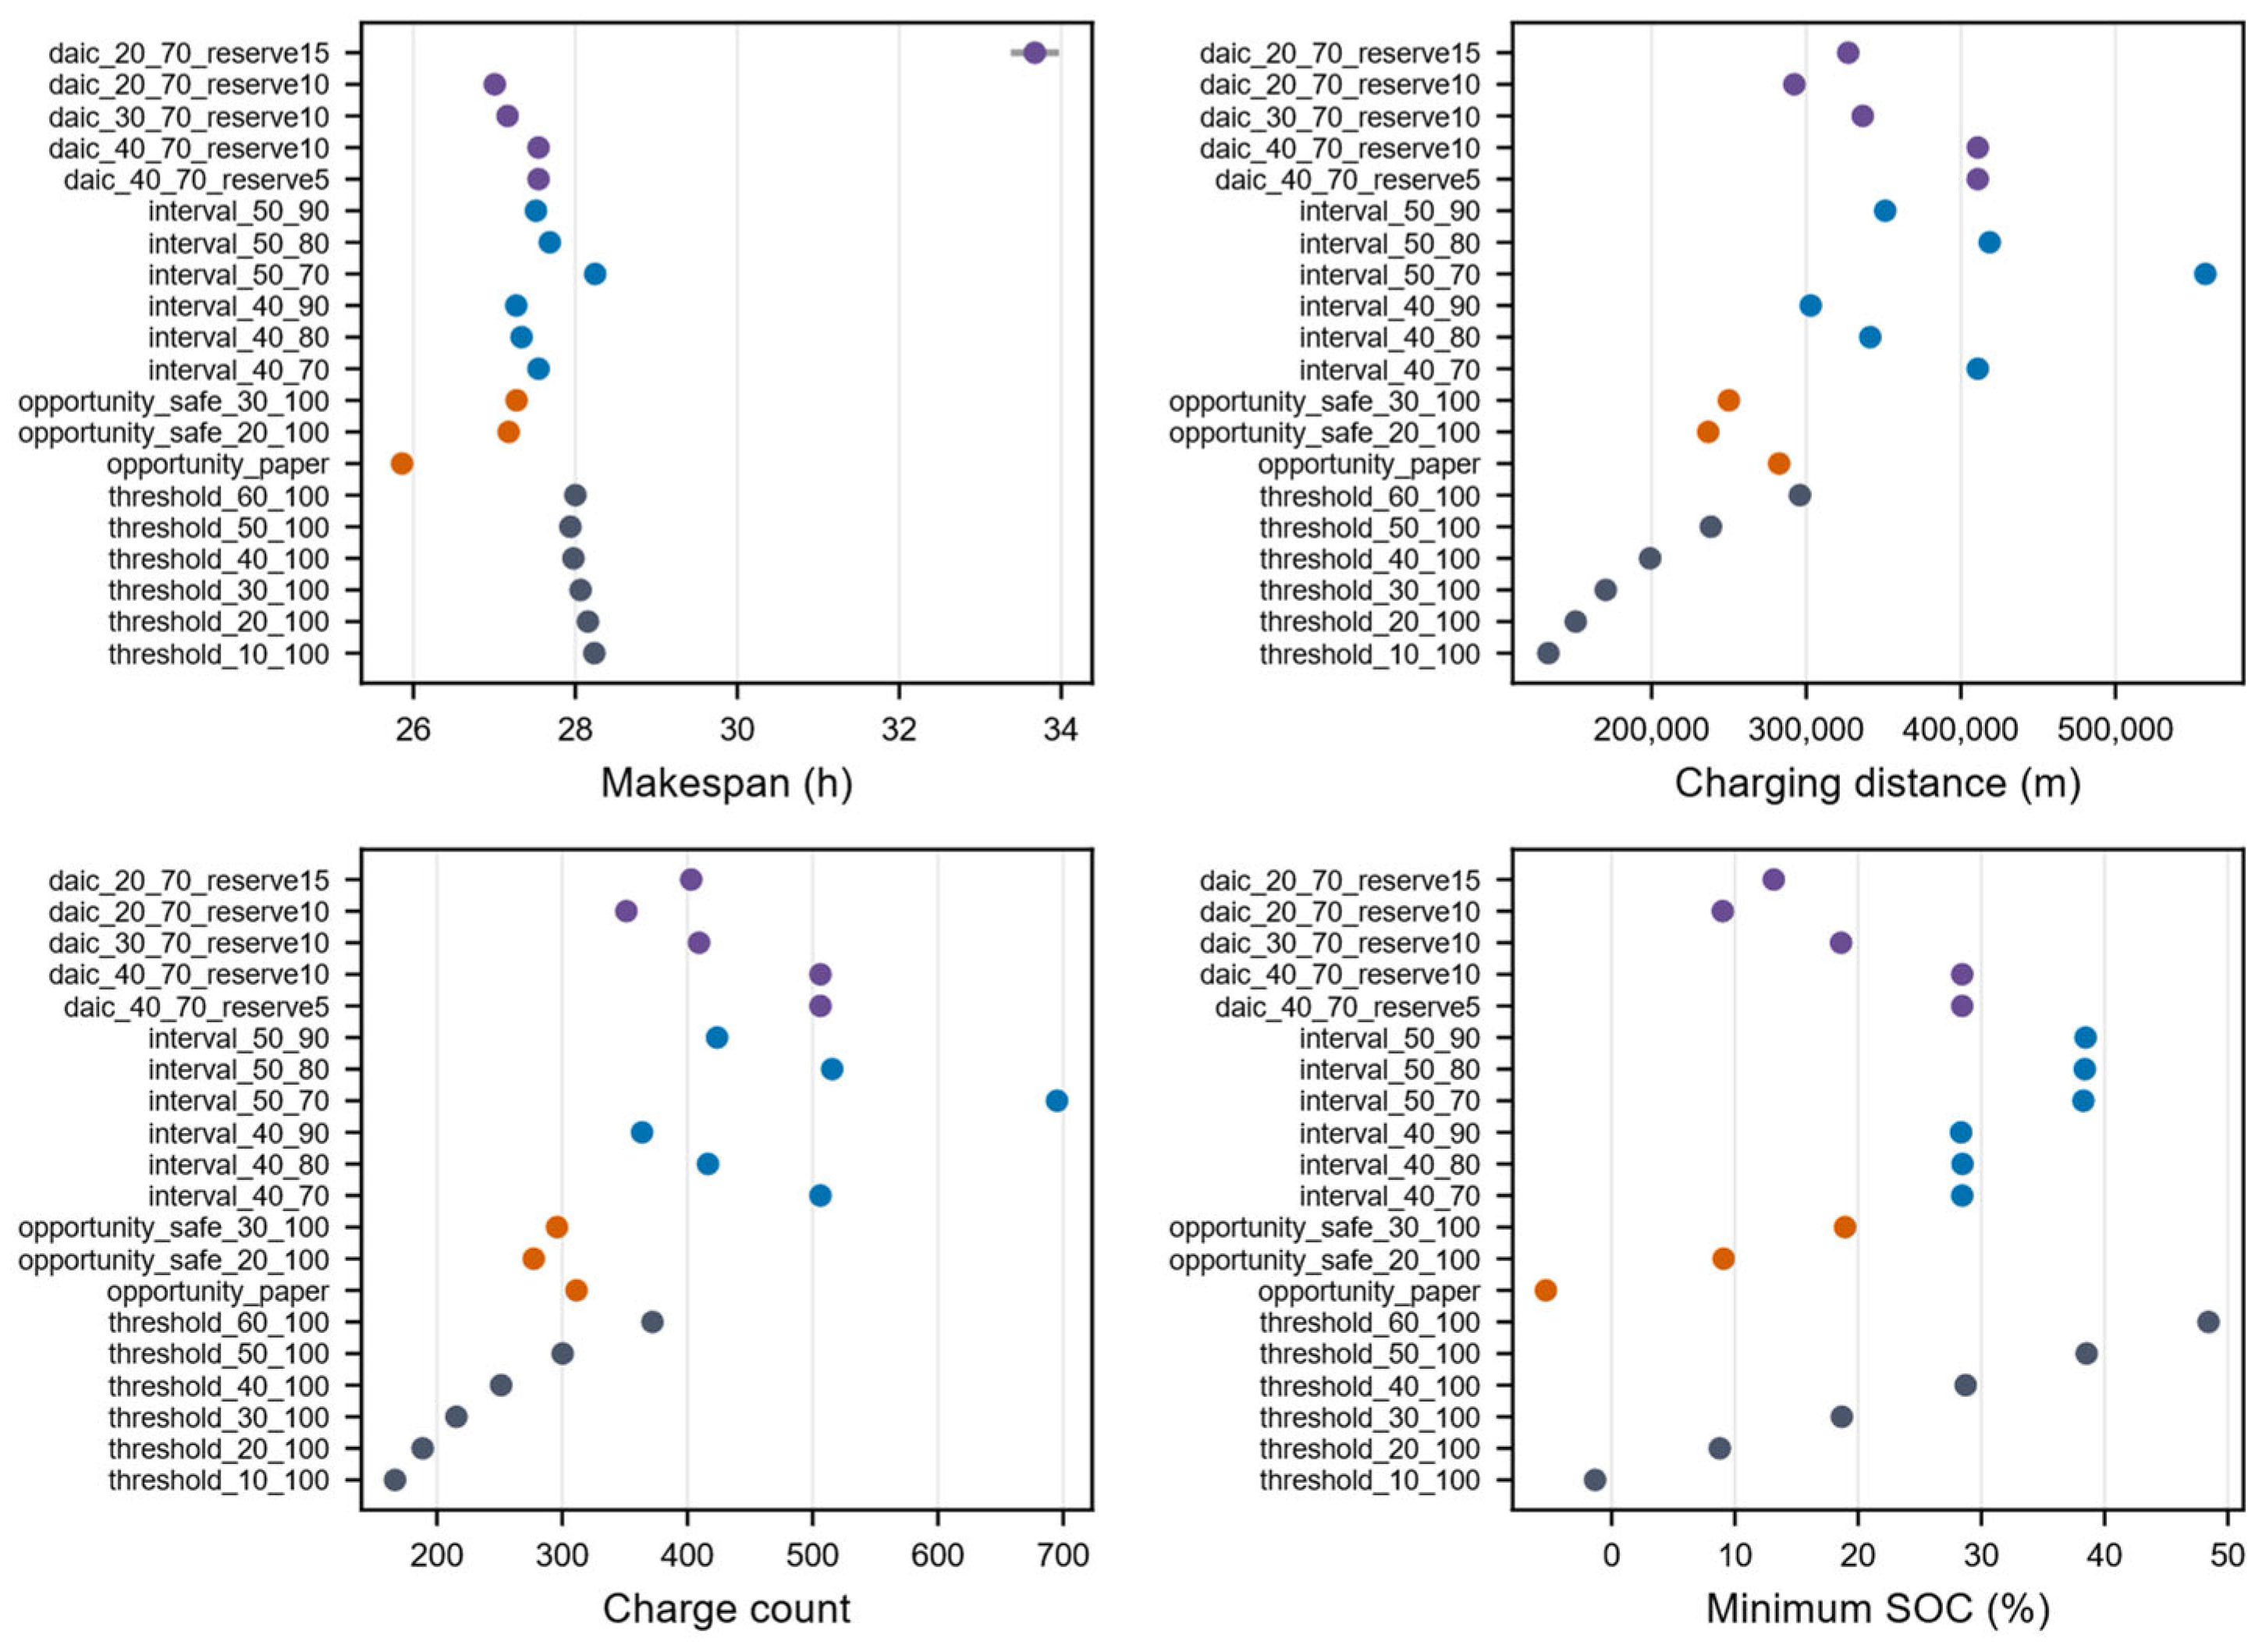
Table 5 and Figure 5 show that the conventional opportunity charging strategy (Opp-P), which does not include low-battery protection, appears to achieve a relatively short completion time; however, its operational success rate is 0, with an average of 1537.033 battery depletion events and a minimum SOC of −5.335%. These results indicate that, although the strategy may statistically complete part of the transportation tasks, it cannot satisfy the requirements for continuous and safe operation. Therefore, under the relatively long road network conditions of the target terminal, this strategy is unsuitable for practical deployment. After introducing low-battery protection, both the safe opportunity charging strategy with a 20% threshold and the safe opportunity charging strategy with a 30% threshold achieved an operational success rate of 1 with zero battery depletion events, demonstrating that opportunity charging must be combined with mandatory safety thresholds to ensure operational reliability.
Table 5.
Comparison results of typical ART charging strategies (3000 tasks, distance-calculation mode).
Figure 5.
Comparison of different ART charging strategies.
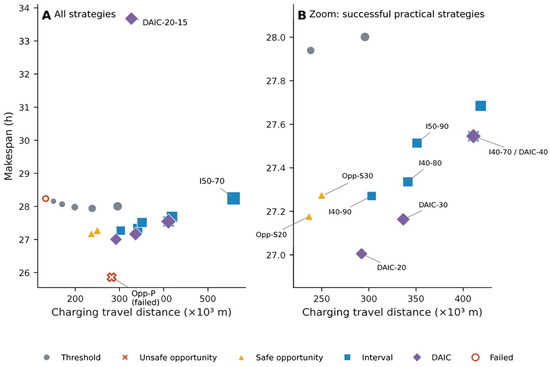
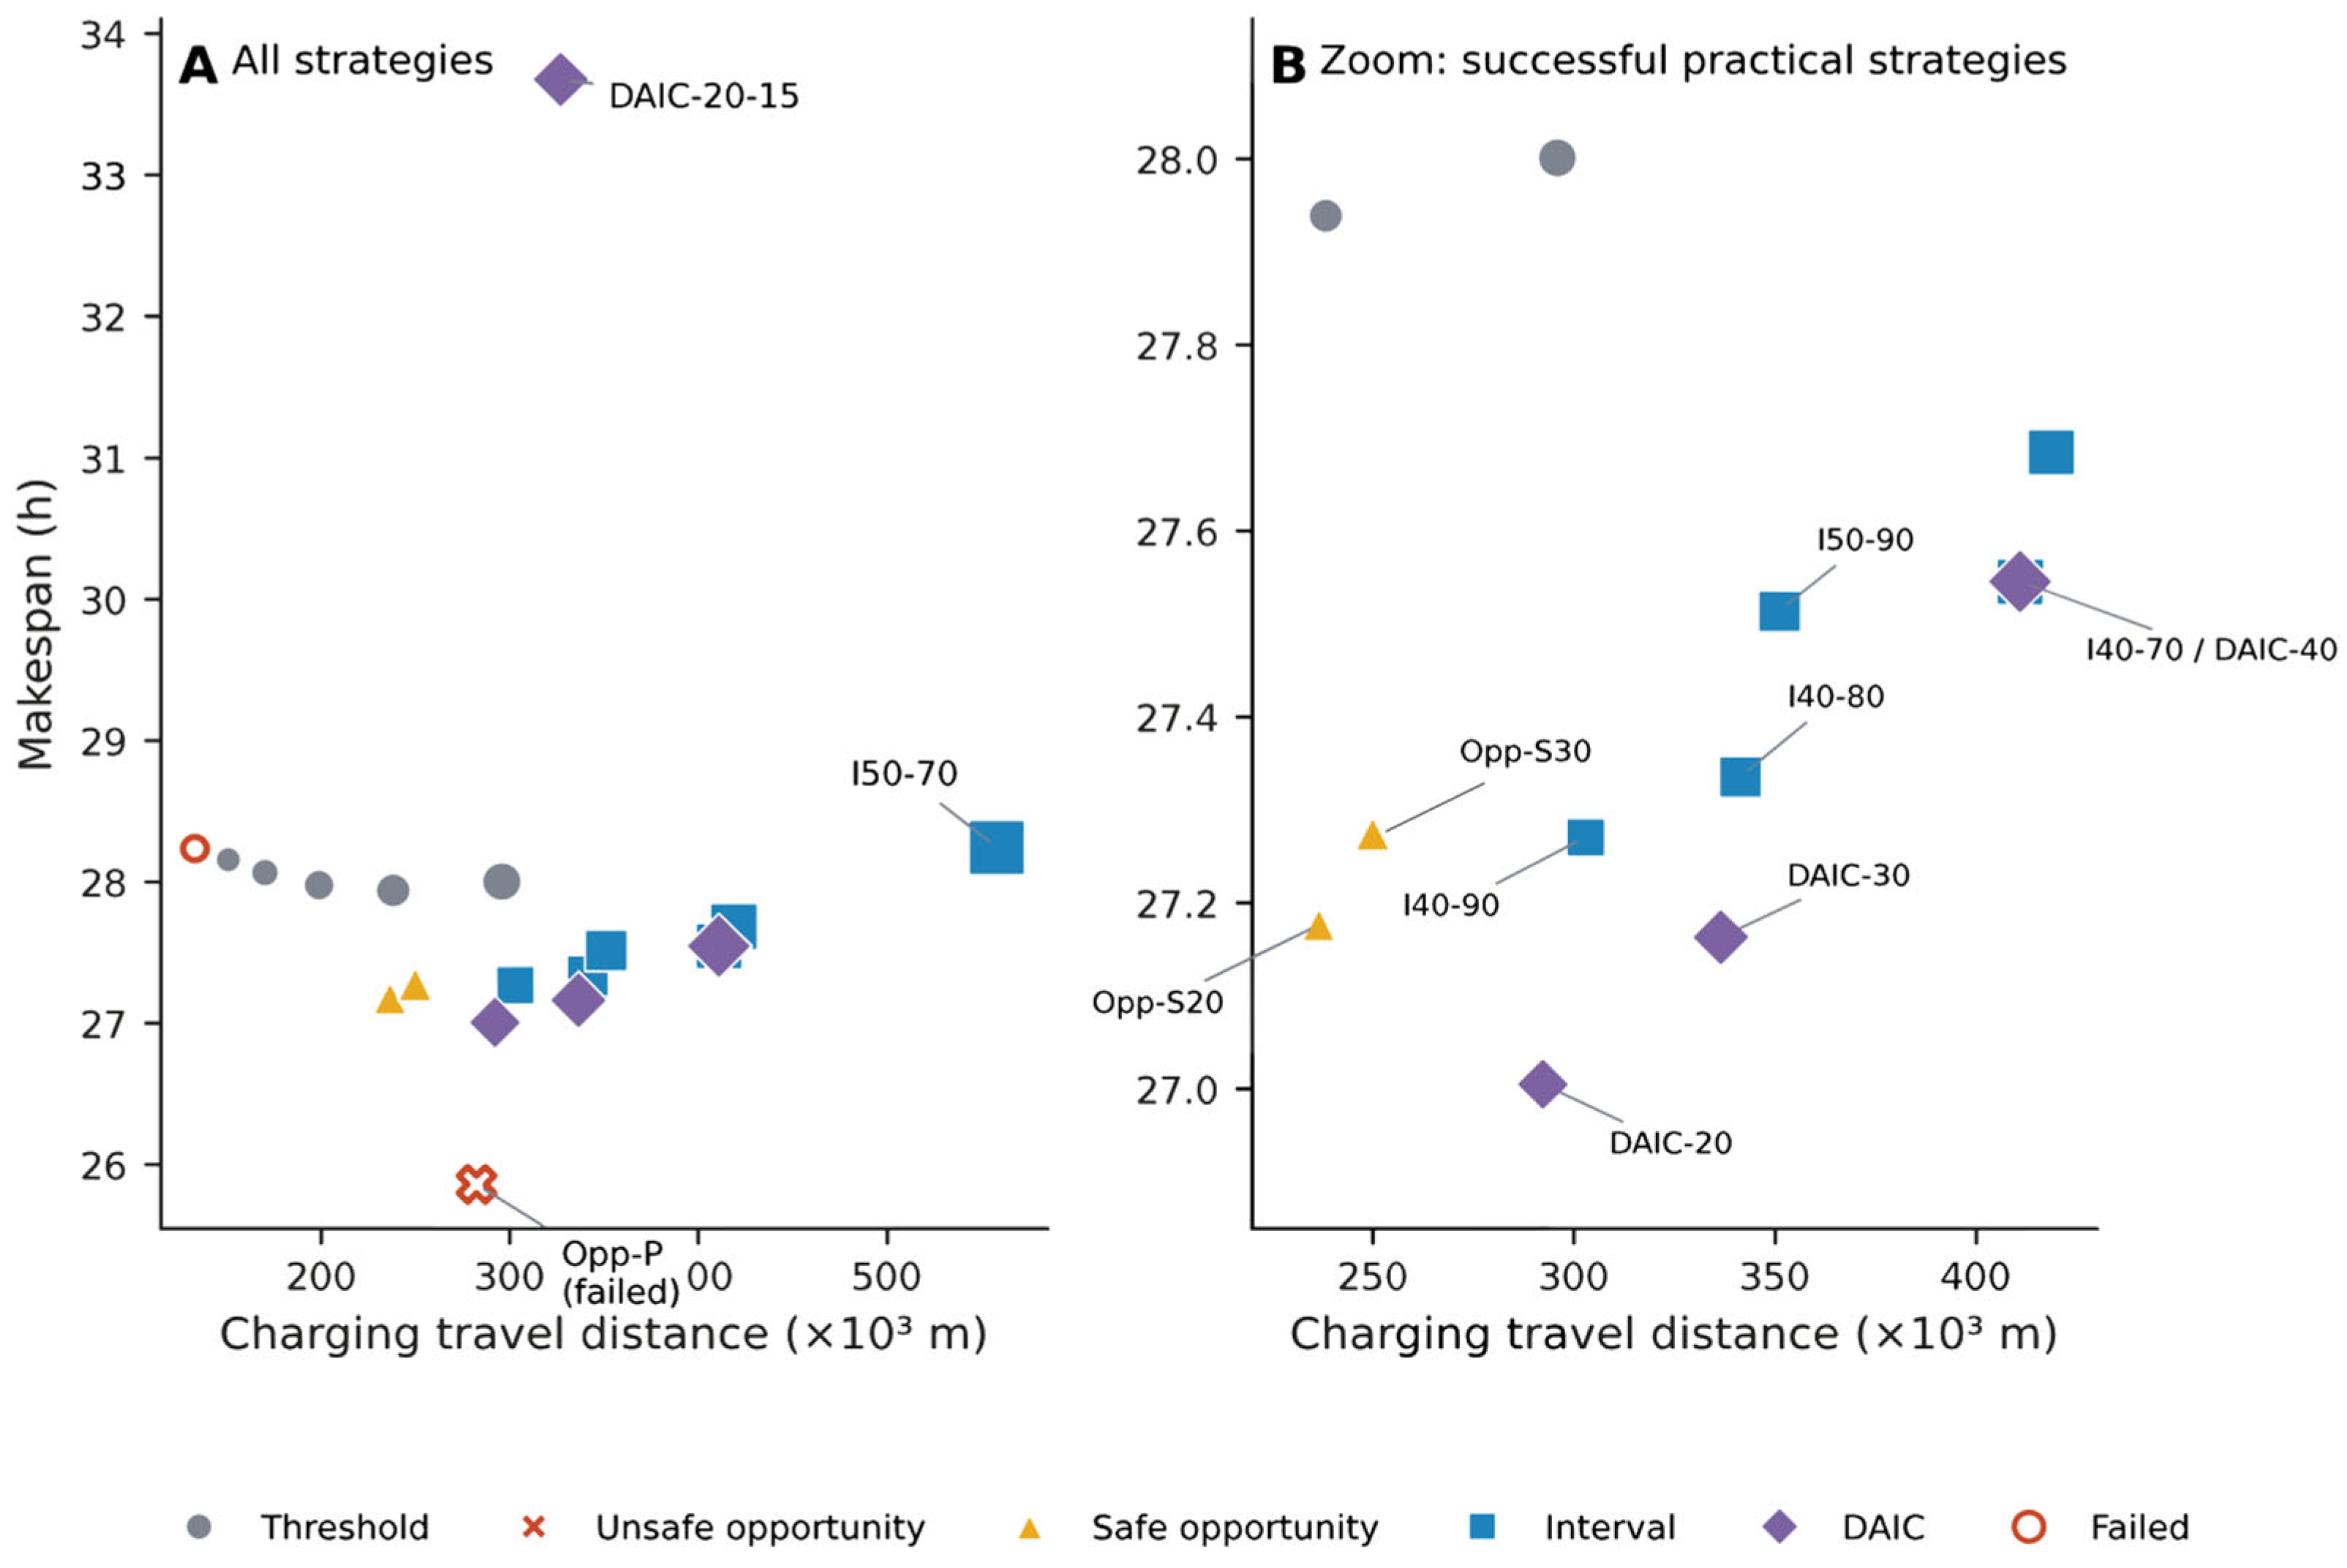
Figure 6 shows the relationship between completion time and charging travel distance under different charging strategies. Among the feasible strategies, the low-threshold DAIC scheme achieved a relatively short completion time; however, its minimum SOC was only 9.013%, indicating an insufficient safety margin. Therefore, it is not suitable to recommend this strategy solely based on completion time performance. The safe opportunity charging strategy with a 20% threshold achieved a charging travel distance of 236,616.1 m and a charging frequency of 277.3 events, indicating relatively low charging resource occupation; nevertheless, its minimum SOC was similarly low at 9.087%. Among the threshold charging strategies, the 50% lower-threshold strategy achieved relatively high scores in the equal-weight multi-indicator normalized ranking, but its frequent charging behavior would increase charging interface occupation. Considering completion time, charging travel distance, charging frequency, and minimum SOC comprehensively, interval-based strategies—particularly the 40%/70% and 40%/80% interval charging strategies—are more suitable as the primary recommended charging schemes for ART operations at the target terminal.
Figure 6.
Makespan and charging distance under different ART charging strategies.
4.3. Results of Interval Charging Strategy Parameter Analysis
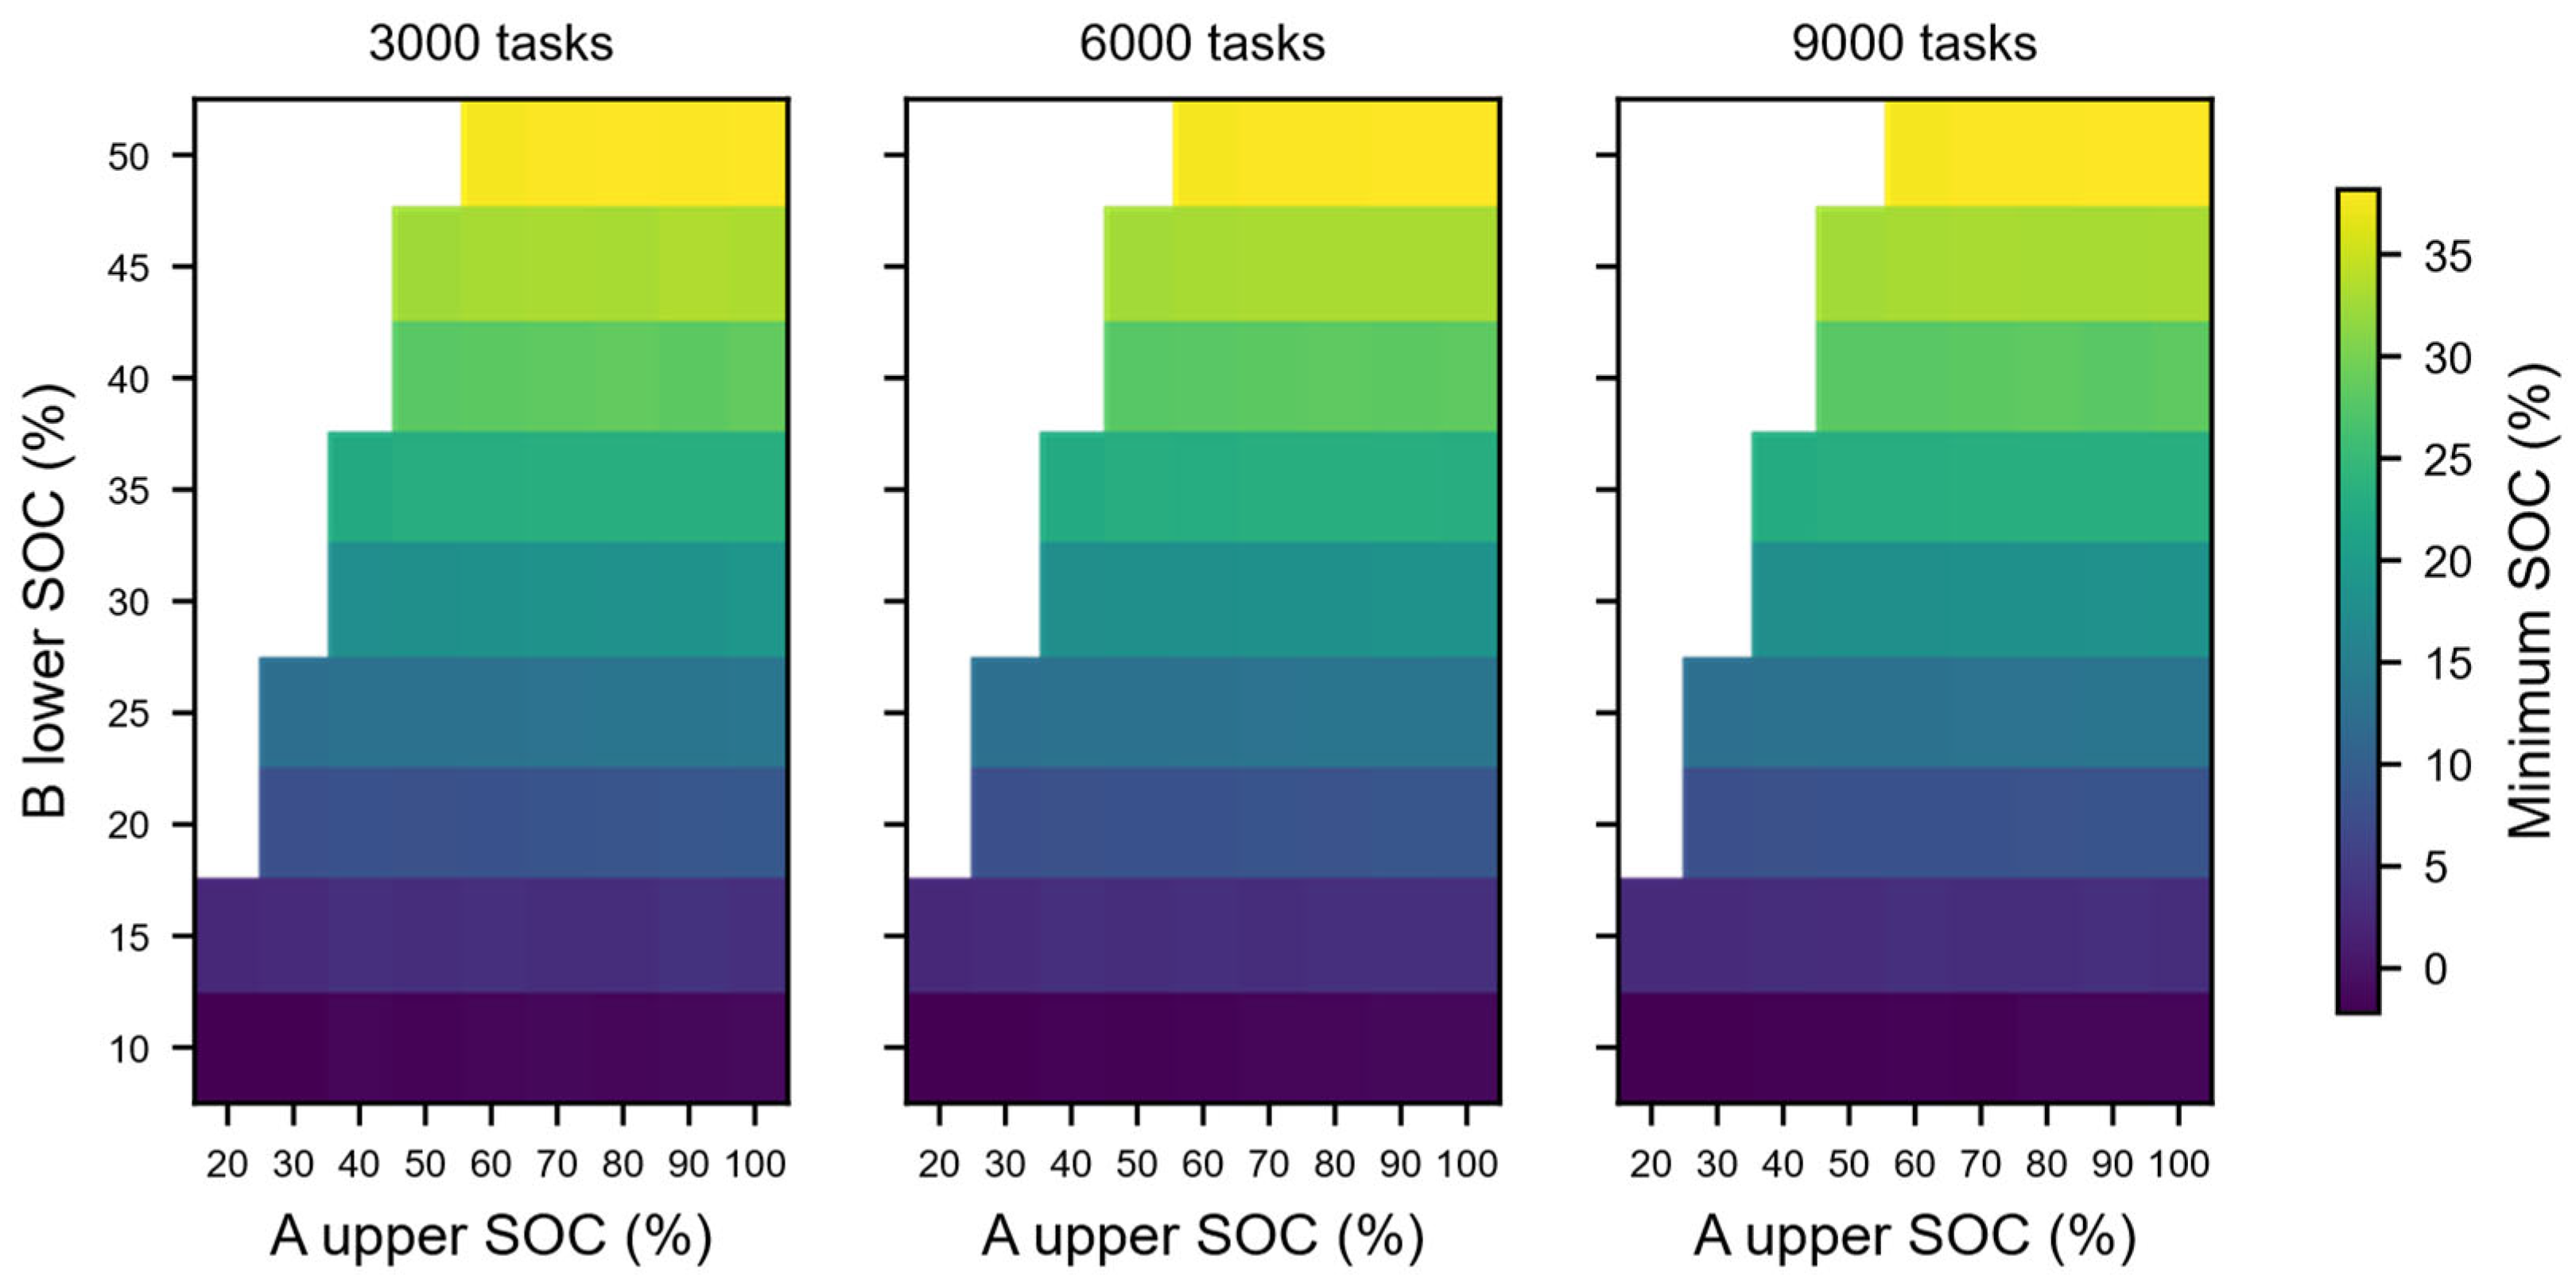
Table 6 shows that, compared with the 40%/70% interval charging strategy, the 40%/80% interval charging strategy reduces the completion time from 27.545 h to 27.336 h, decreases the charging travel distance from 410,960.9 m to 341,409.7 m, and lowers the charging frequency from 506.2 to 416.4 events, while maintaining a nearly equivalent minimum SOC. In contrast, although the 50%/70% interval charging strategy increases the minimum SOC to 38.28%, the completion time rises to 28.245 h, while the charging travel distance and charging frequency increase to 558,142.1 m and 695.1 events, respectively. Therefore, under the DXF-calibrated road network of the target terminal, the 40%/80% interval charging strategy represents a more balanced solution in terms of operational time and charging resource utilization among interval-based strategies. The 40%/70% interval charging strategy can be regarded as a conservative and robust alternative, whereas the 50%/70% interval charging strategy is more suitable for scenarios prioritizing a higher SOC safety margin.
Table 6.
Comparison of interval charging strategies under typical parameters.
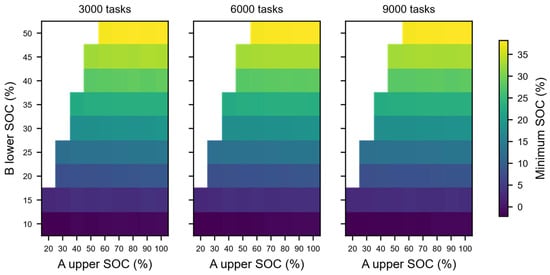
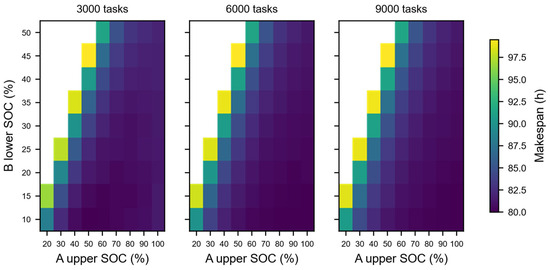
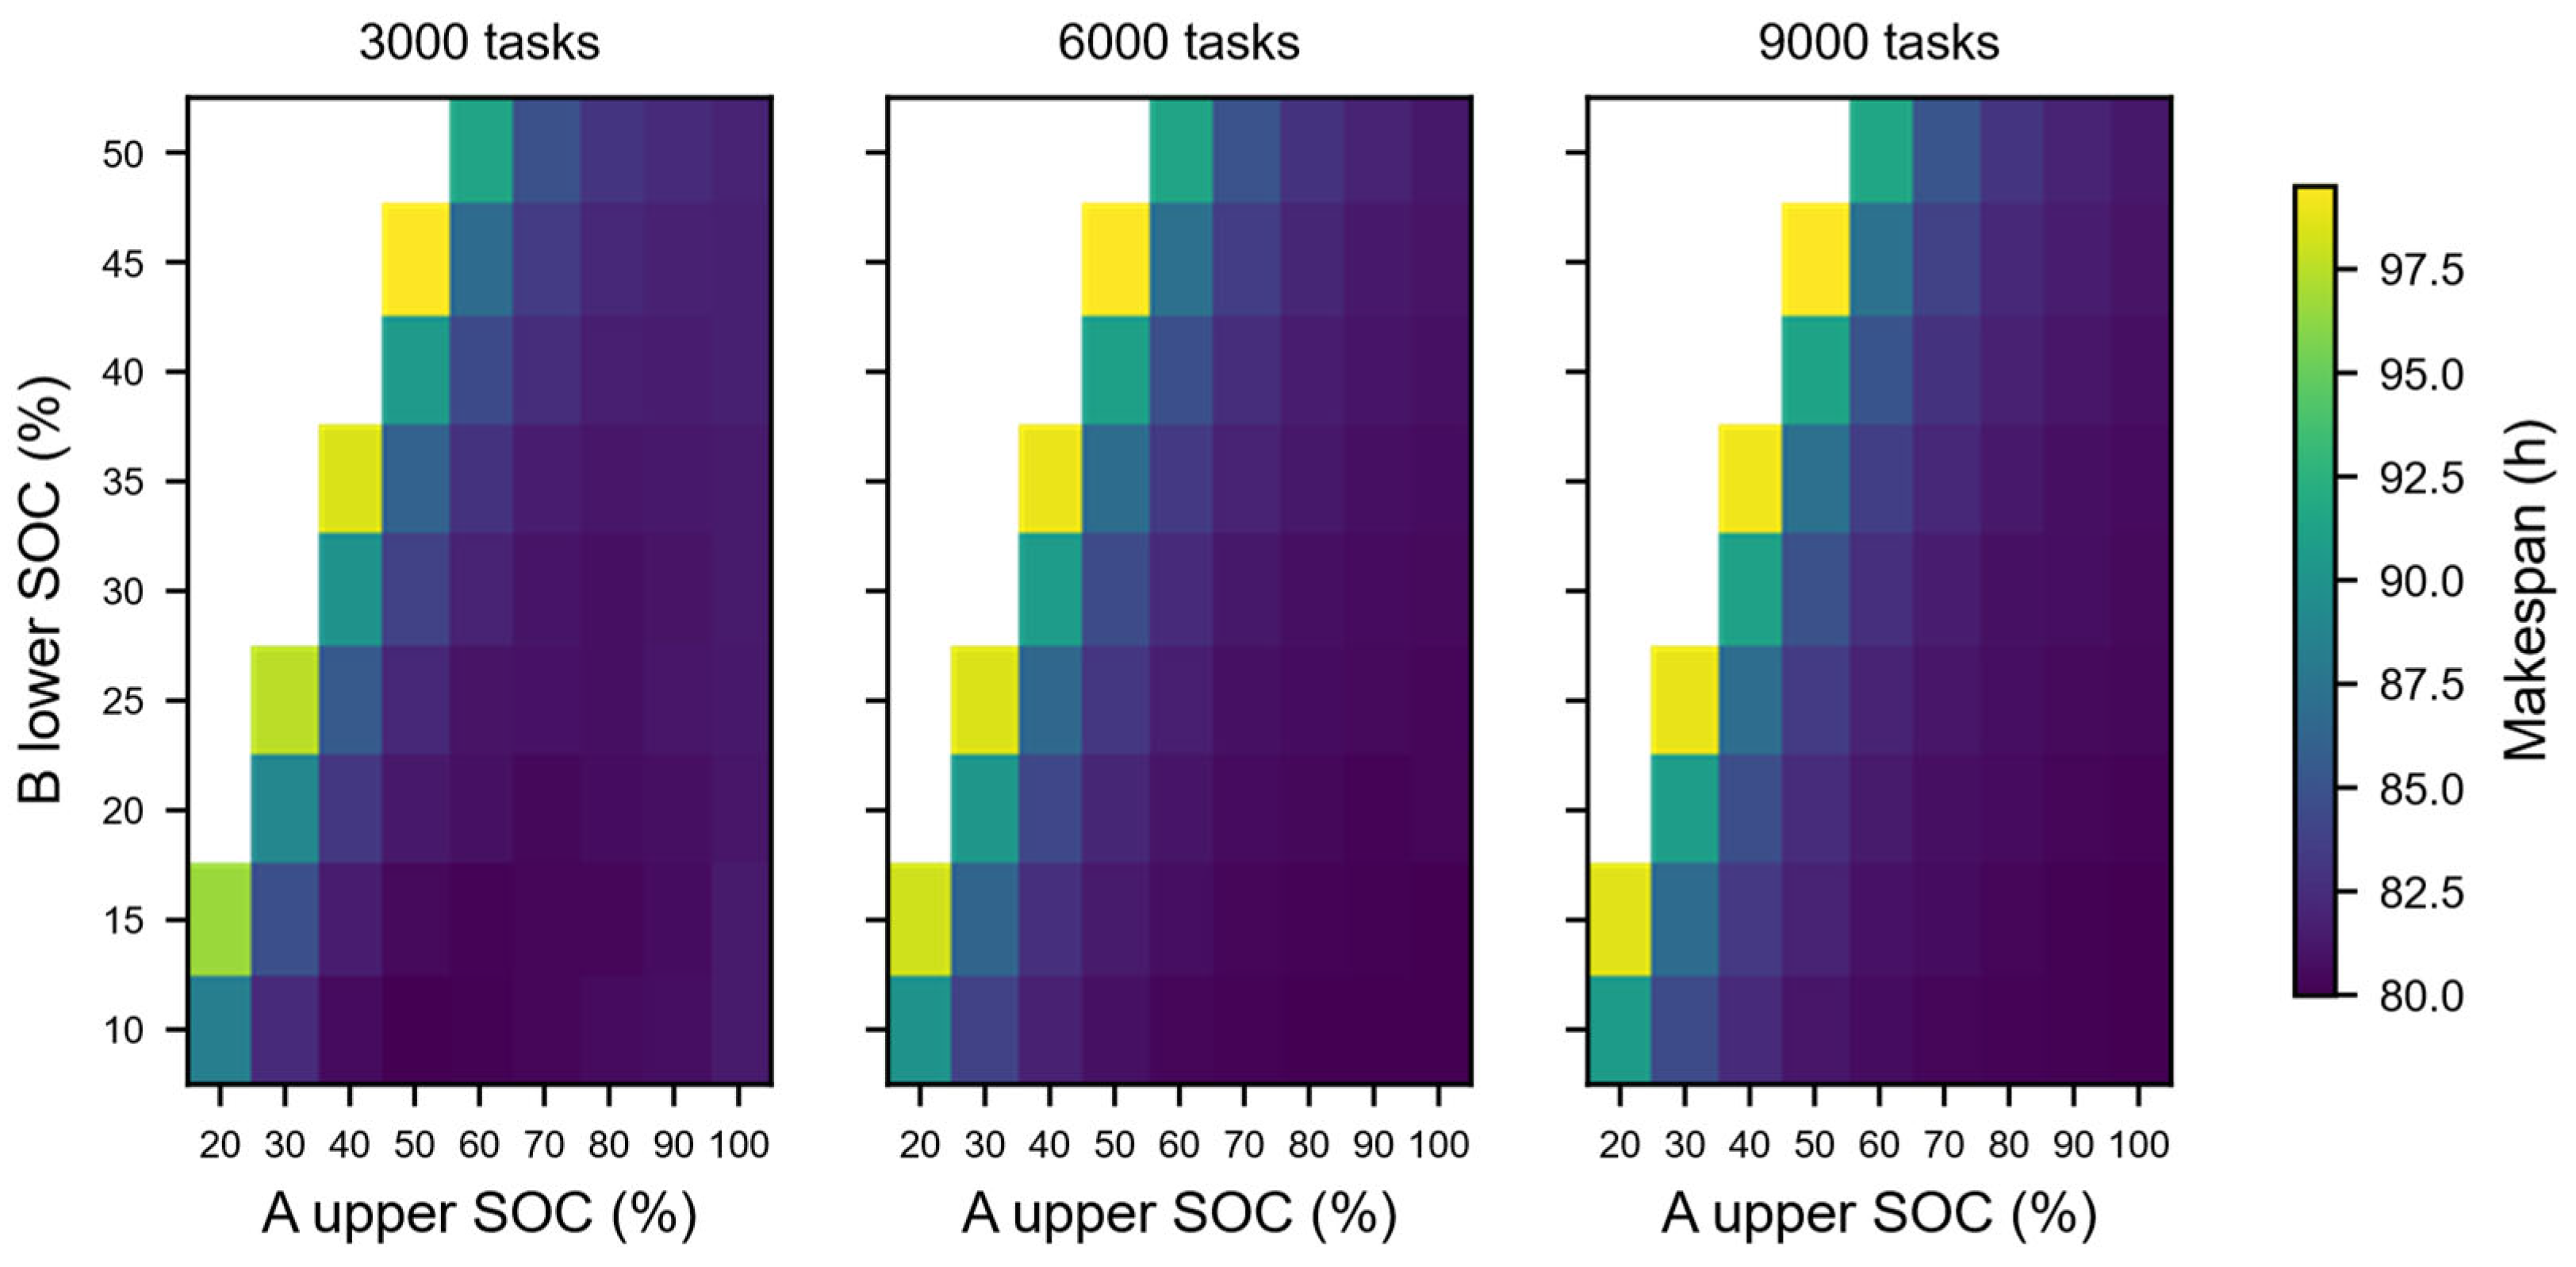
Figure 7 and Figure 8 present the heat maps of the minimum SOC and completion time, respectively, for the interval charging strategy. Further interval-grid experiments indicate that, under workloads of 3000, 6000, and 9000 tasks, most parameter combinations are capable of completing all tasks successfully; however, substantial differences exist among different combinations in terms of minimum SOC and charging resource utilization. Lower values can shorten completion time and reduce charging resource occupation, but they also cause the minimum SOC to approach the safety boundary. Conversely, higher values improve the SOC safety margin while increasing charging frequency and charging travel distance. Therefore, parameter selection for interval charging strategies should not rely solely on task completion time, but should also comprehensively consider minimum SOC, charging interface utilization, and road congestion impacts.
Figure 7.
The lowest SOC heat map under the interval charging strategy.
Figure 8.
Completion time heat map under the interval charging strategy.
4.4. Results of Traffic-Capacity Scenario Experiment
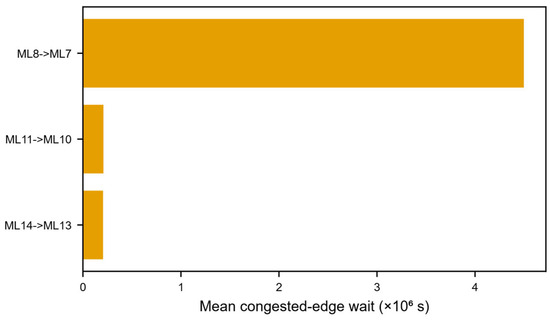
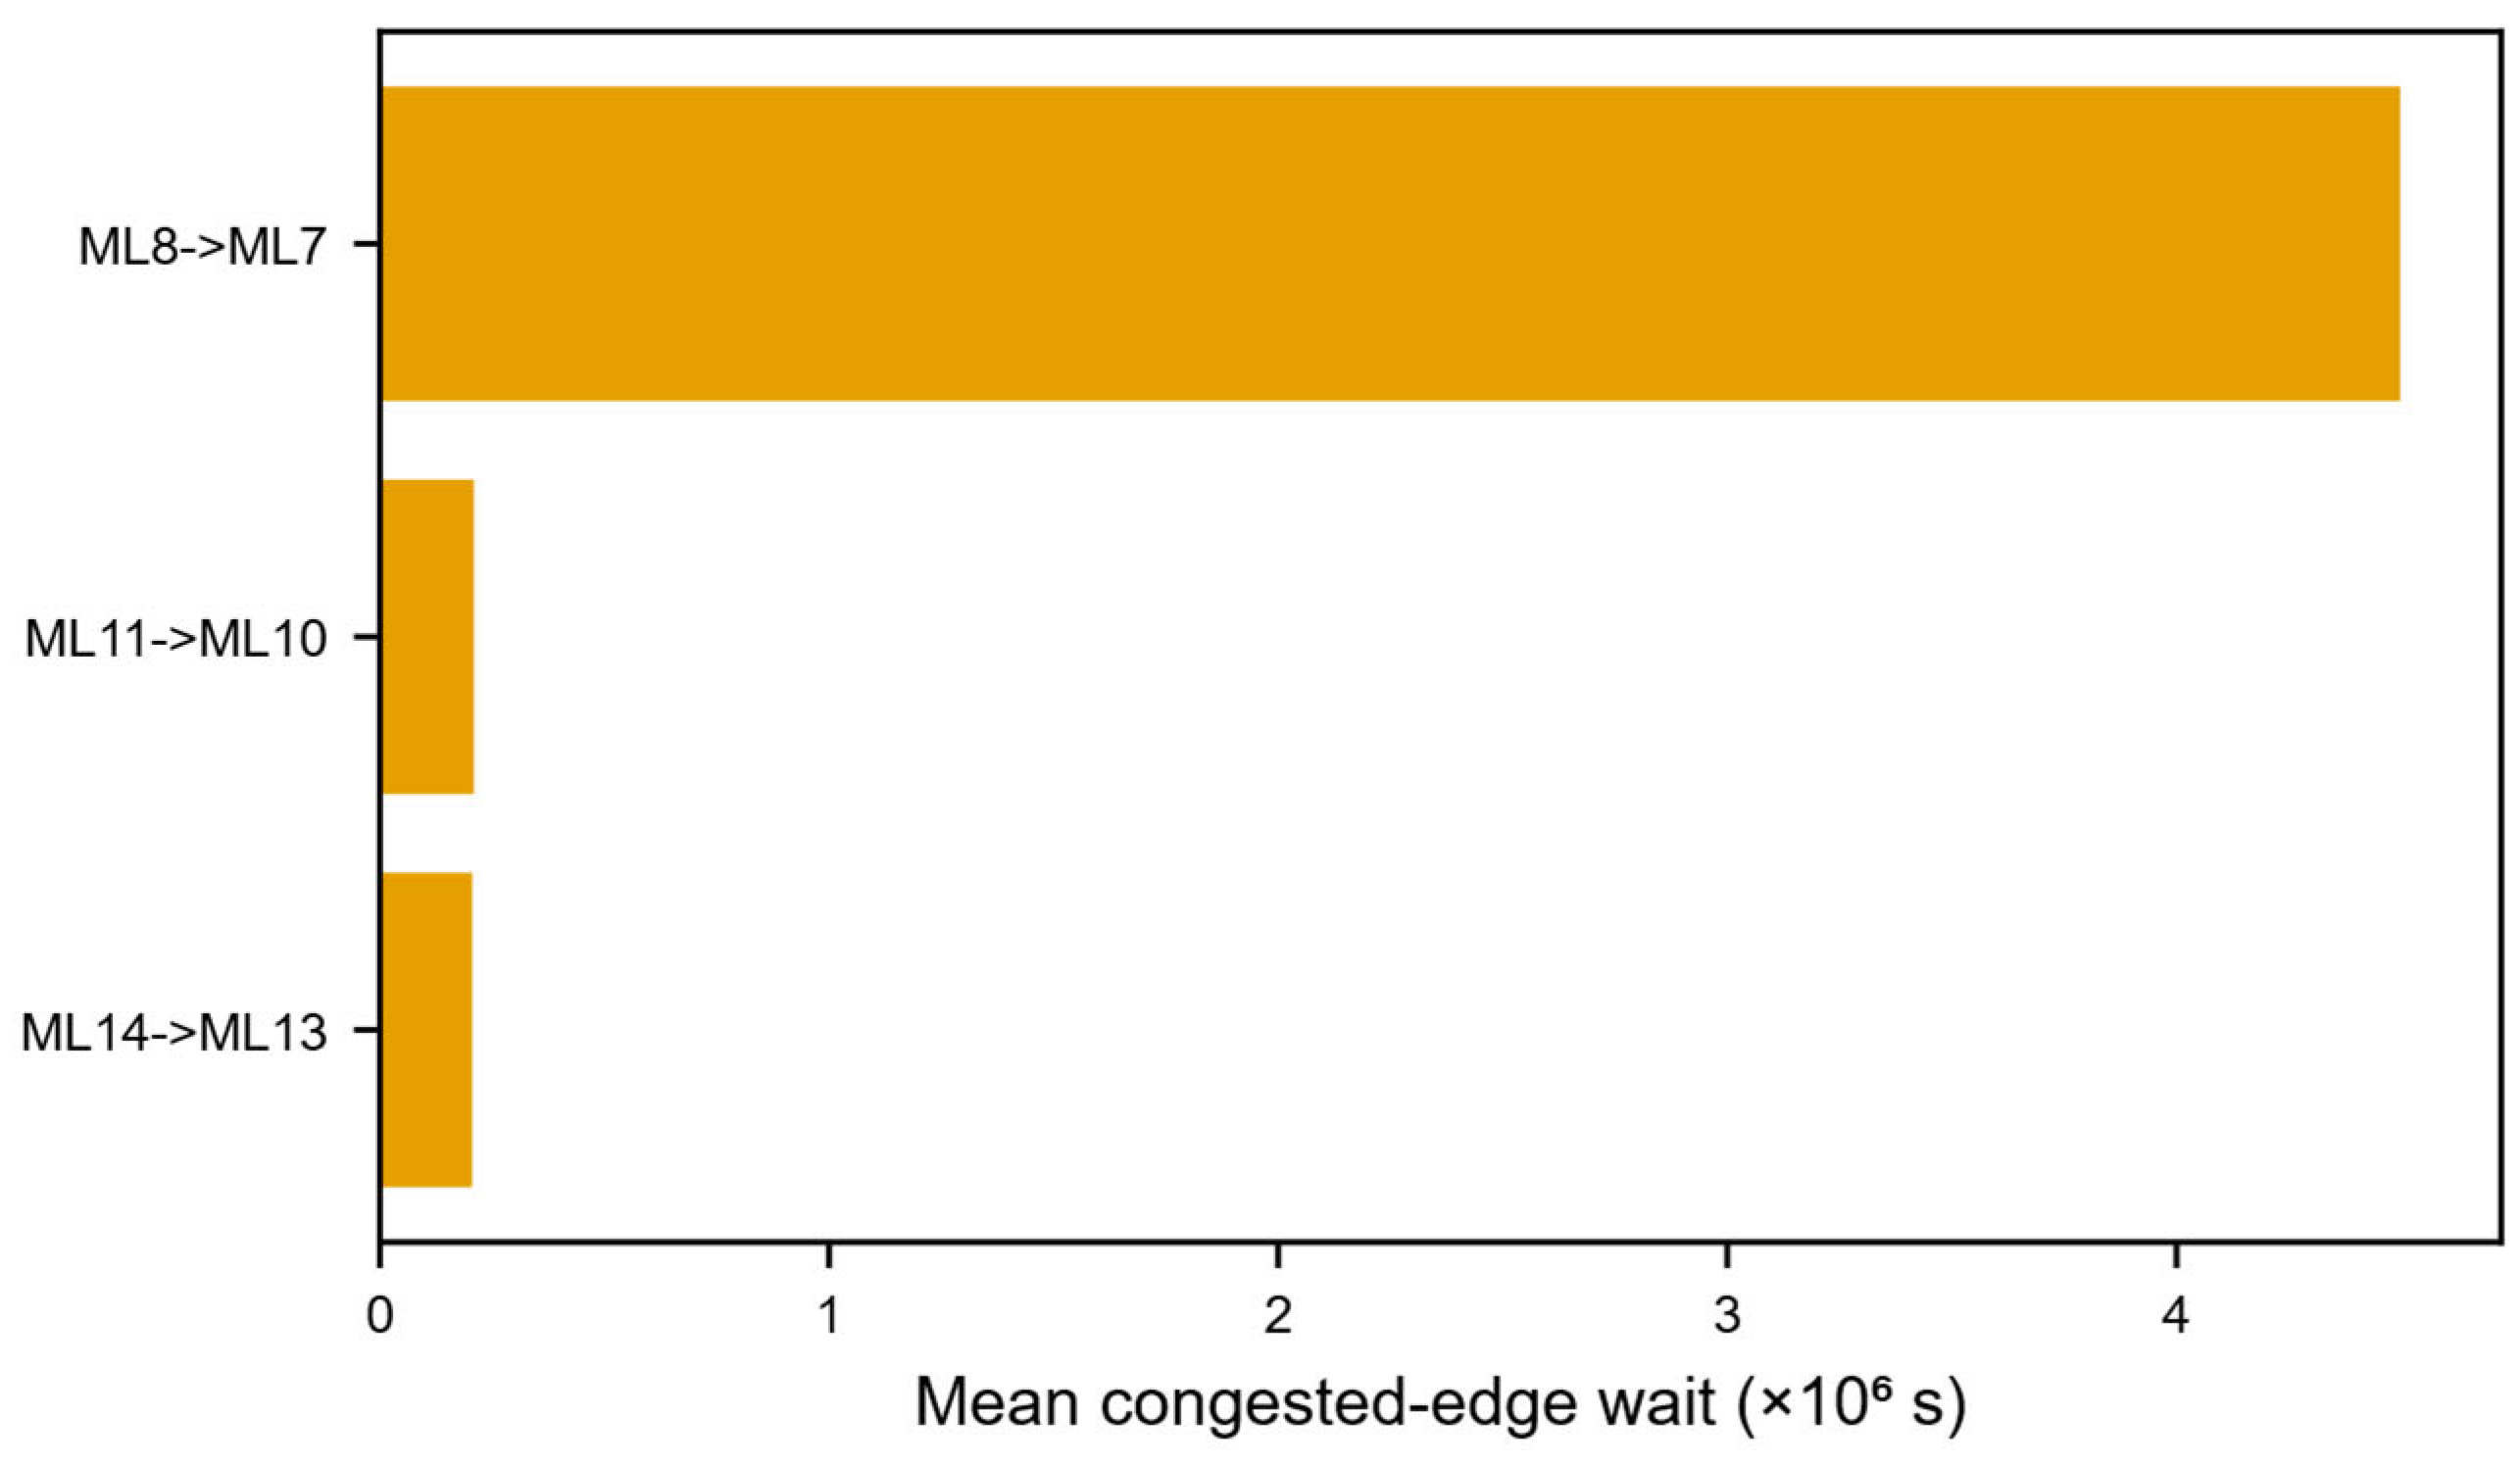
The validation results of the traffic-capacity model indicate that, under the condition of a single ART and 100 tasks, both the average road waiting time and the average intersection waiting time are 0, demonstrating that the road-capacity model does not produce abnormal waiting behavior in single-vehicle scenarios. When the number of ARTs increases to 30, traffic-capacity constraints significantly alter system performance: the road waiting time of representative strategies reaches several hundred to several thousand seconds per task, while intersection waiting times also increase substantially. Figure 9 reveals that the most congested edge is ML8 → ML7, followed by ML11 → ML10 and ML14 → ML13. These findings indicate that ART charging strategies at the target terminal not only affect charging interface utilization but also influence road congestion through ART travel paths between operational areas and charging zones.
Figure 9.
Main congestion directed edges.
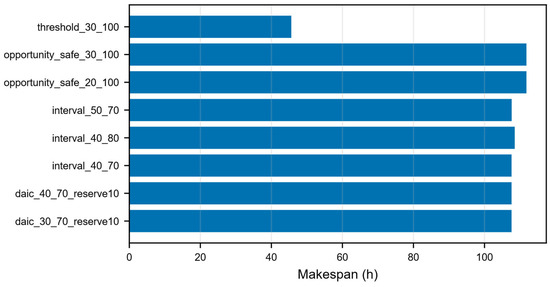
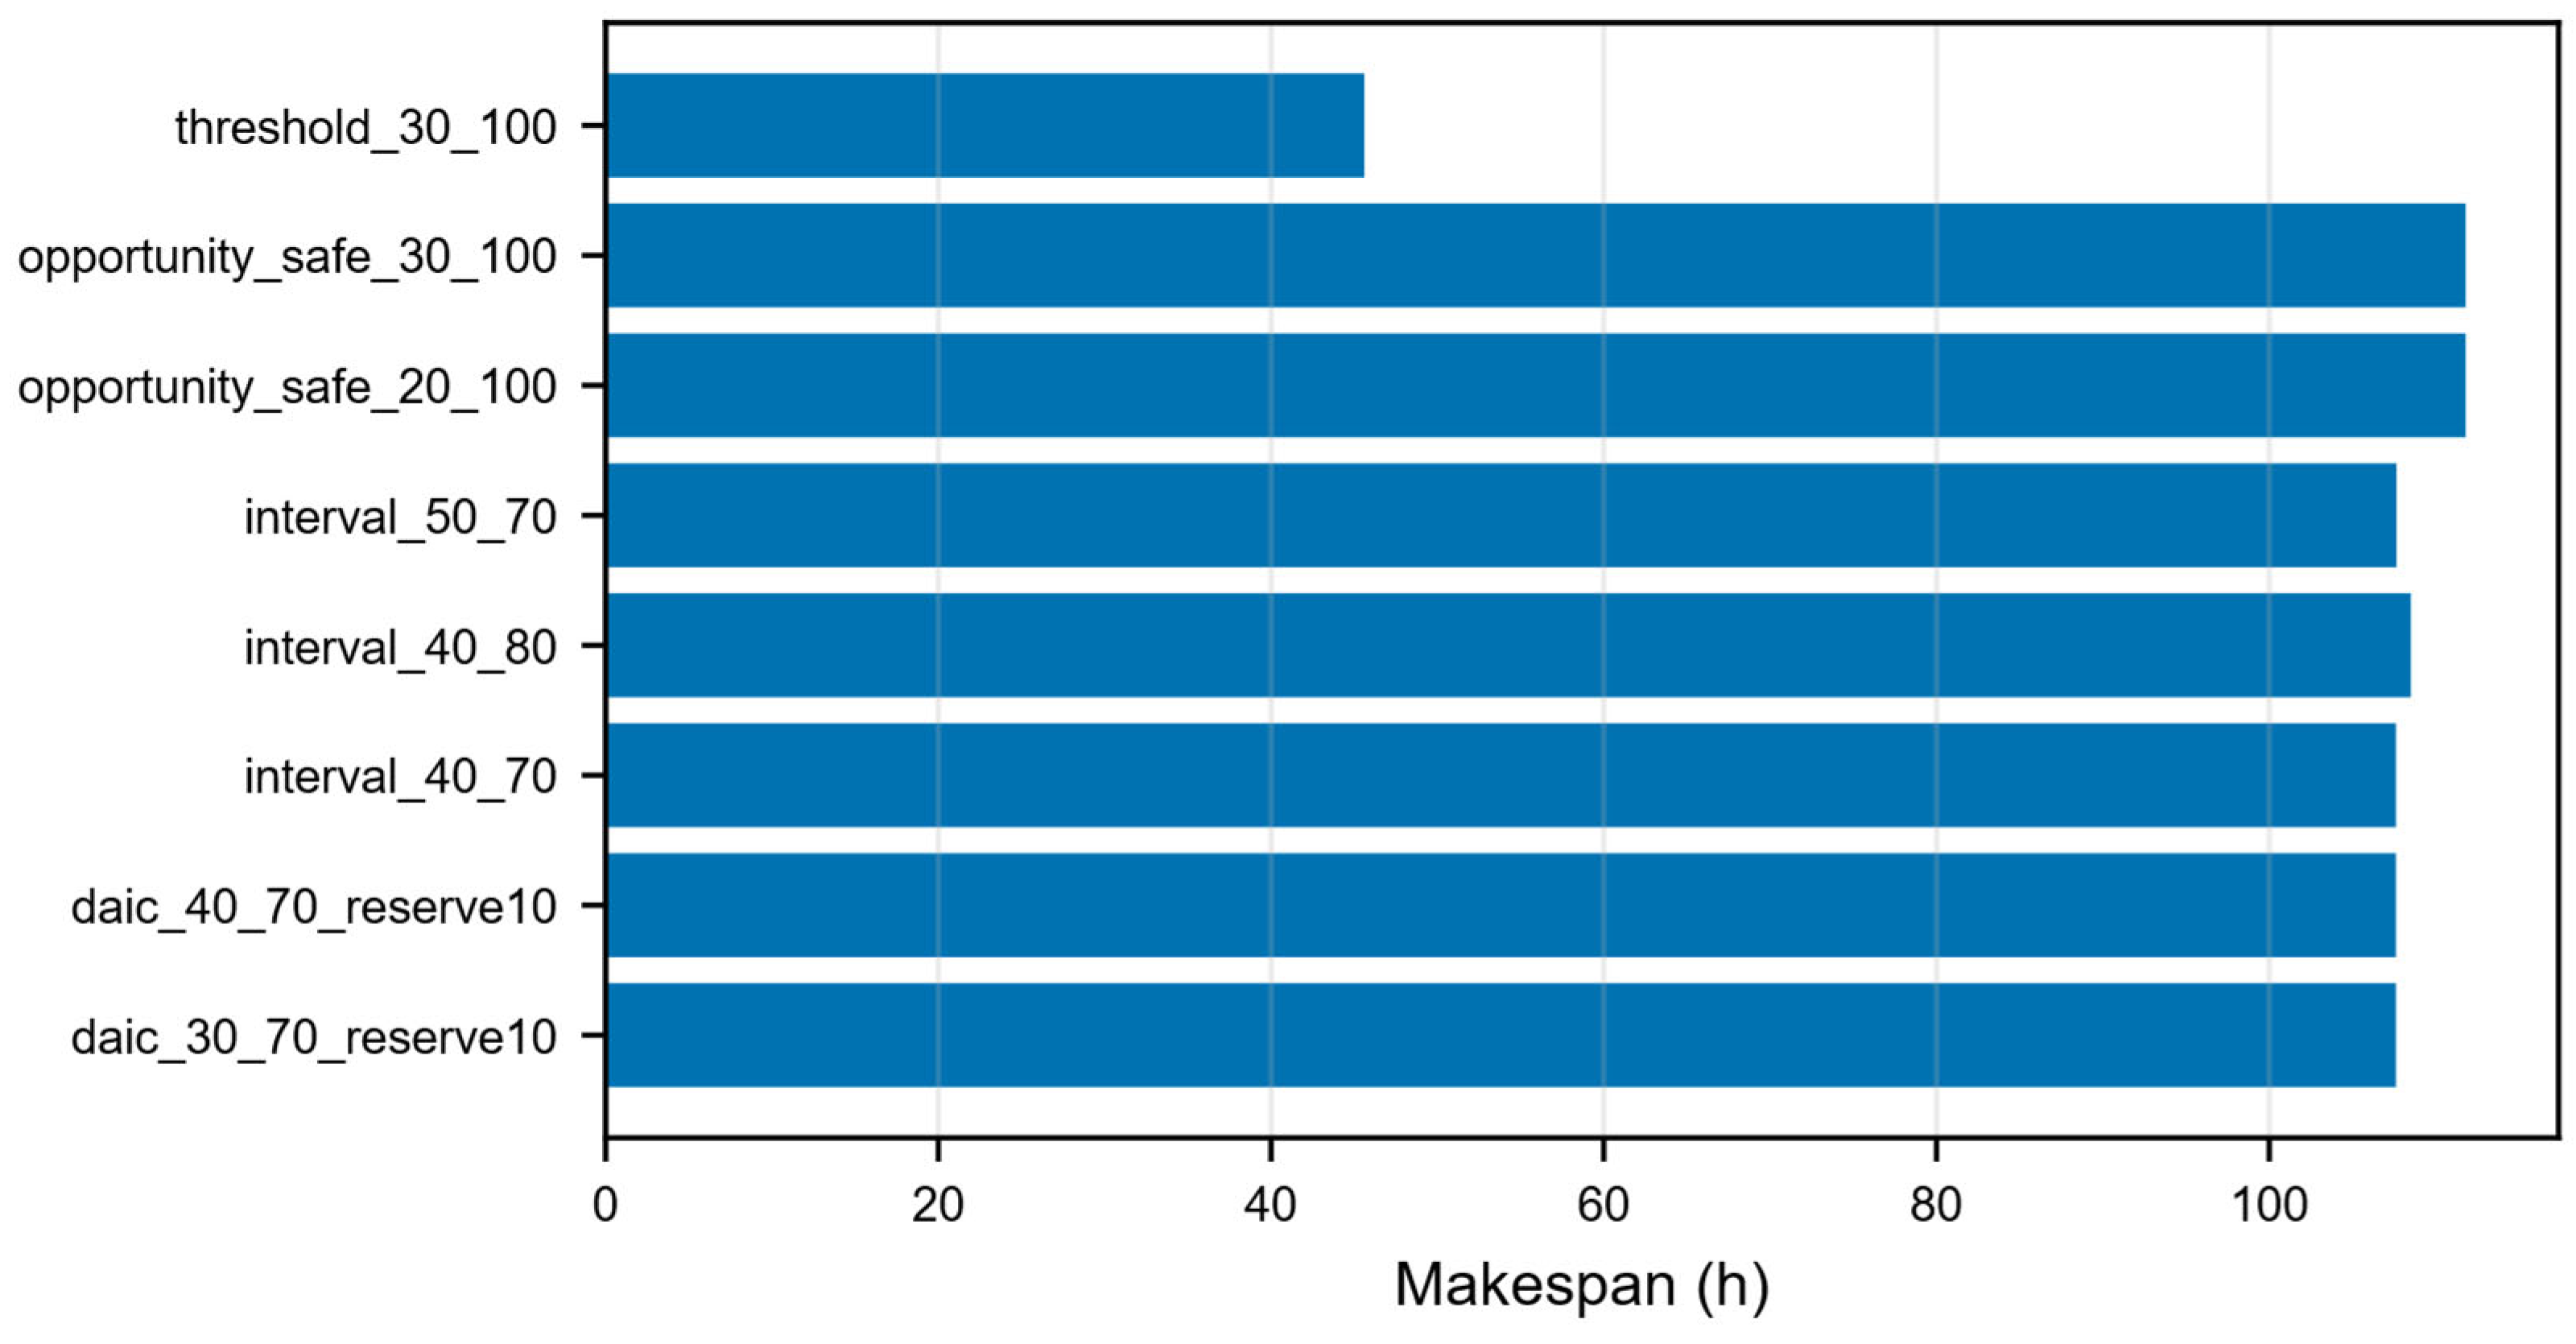
As shown in Table 7 and Figure 10, the threshold charging strategy with a 30% lower threshold achieves a completion time of 45.61 h under the traffic-capacity scenario, which is significantly lower than those of the high-frequency opportunity charging strategies and several interval charging strategies. In contrast, both the safe opportunity charging strategy with a 20% threshold and the safe opportunity charging strategy with a 30% threshold exhibit completion times of 111.80 h, indicating that high-frequency charging behavior substantially amplifies traffic congestion when road-capacity constraints are present. These results suggest that, in terminal scenarios with significant traffic conflicts, charging strategies should not solely pursue high SOC levels or frequent charging opportunities; instead, the impact of charging-related travel paths on arterial roads and intersections must also be taken into consideration.
Table 7.
Representative charging strategy results under the traffic capacity scenario.
Figure 10.
Comparison of the makespan of the charging strategy under the traffic capacity scenario.
4.5. Results of Required SOC Analysis for the DAIC Strategy
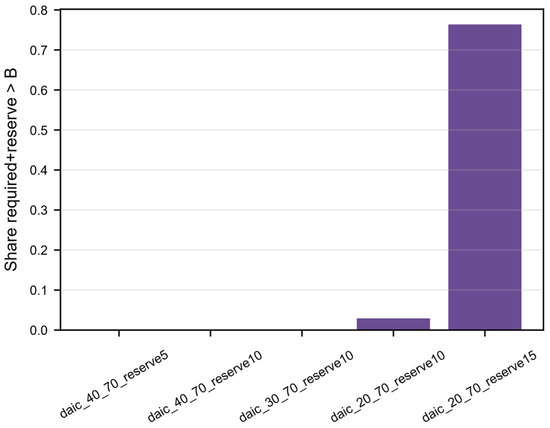
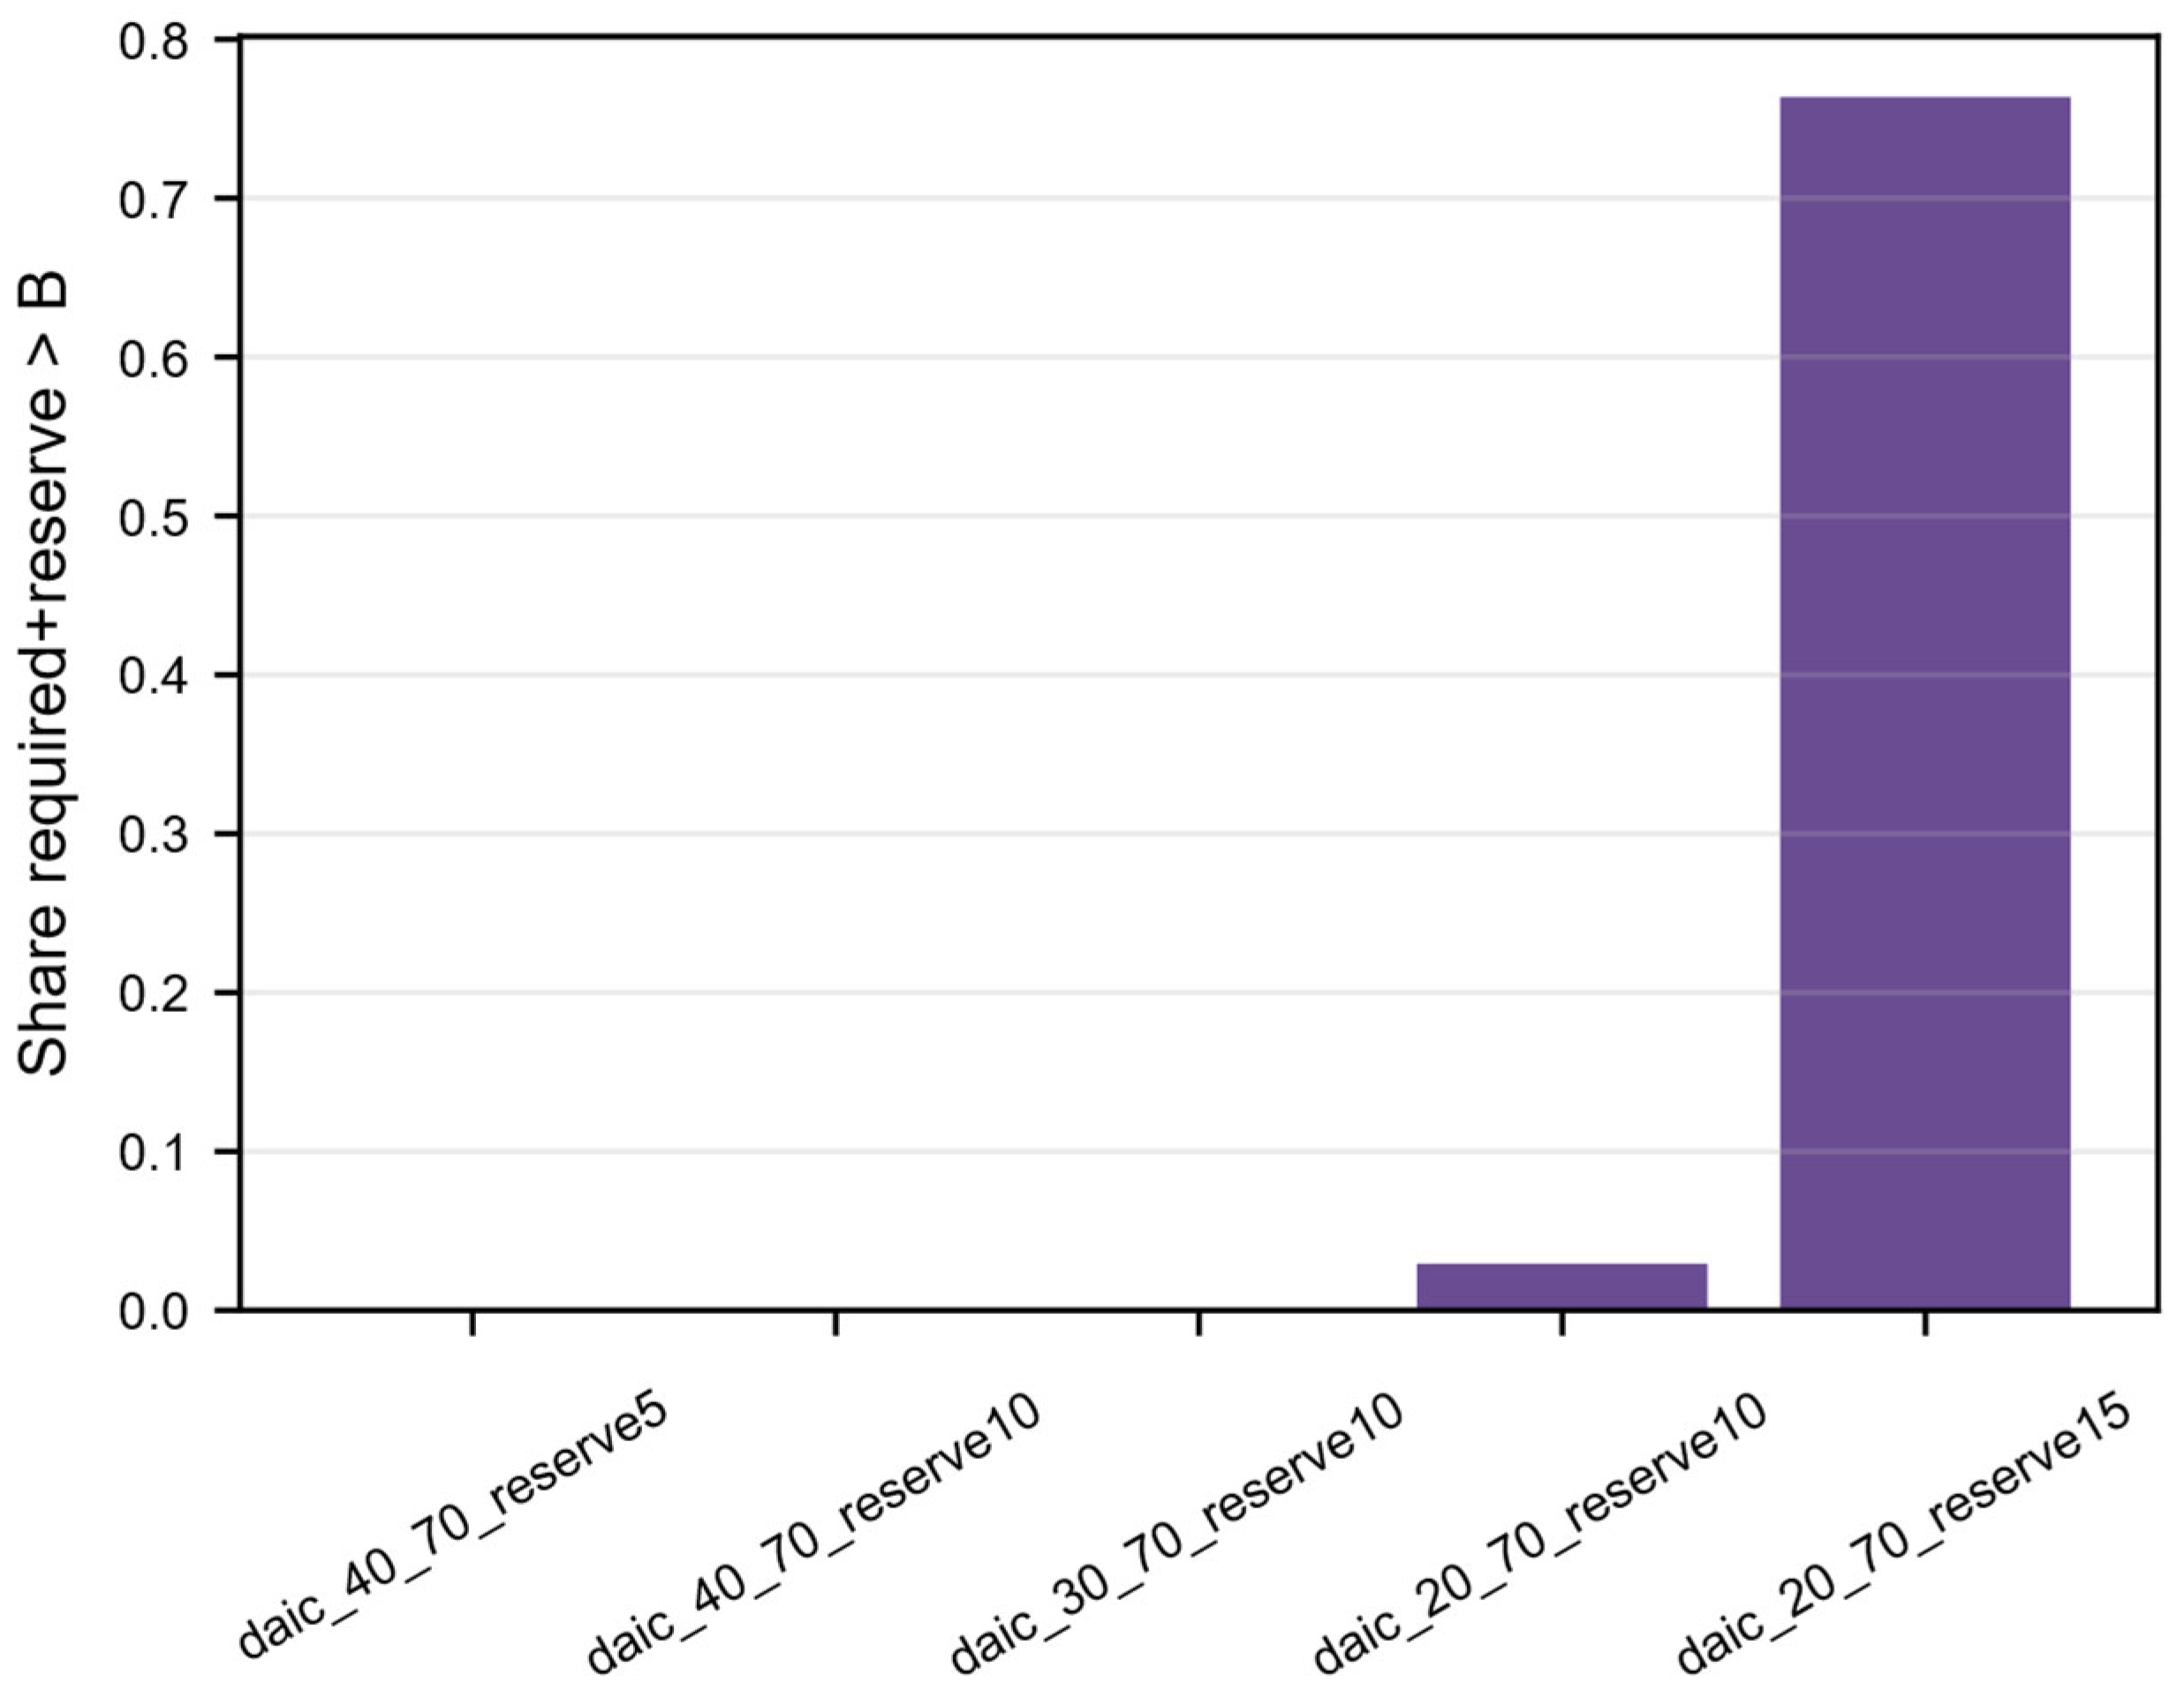
As shown in Table 8 and Figure 11, the results of the DAIC strategy indicate that, under the DXF-calibrated road network of the target terminal, the average SOC required for task assignment is 6.384%, with a 95th percentile (P95) value of 9.668% and a maximum value of 11.262%. When or , the sum of the task-required SOC and the safety reserve remains below the mandatory charging threshold. Consequently, the DAIC trigger frequency is 0, and the scheduling performance is essentially equivalent to that of the corresponding interval charging strategy.
Table 8.
Distribution of DAIC Required SOC.
Figure 11.
DAIC required SOC.
When and , the share of cases exceeding the threshold is 0.029, with an average trigger frequency of 0.600. In contrast, when and increases to 15%, the share exceeding rises to 0.764, and the average trigger frequency increases to 71.267. These results demonstrate that the effectiveness of the DAIC strategy does not emerge under all parameter settings; rather, it becomes actively involved in scheduling only when relatively low thresholds and higher are adopted.
4.6. Results of Resource Sensitivity Experiment
To avoid evaluating charging strategies solely based on task completion time, a multi-criteria ranking and Pareto analysis were further conducted. The evaluation metrics included success rate, completion time, charging travel distance, number of charging events, minimum SOC, and number of power depletion events. Among these metrics, success rate and minimum SOC were regarded as benefit criteria, where larger values indicate better performance, whereas completion time, charging travel distance, number of charging events, and number of power depletion events were treated as cost criteria, where smaller values indicate better performance.
For benefit criteria, min–max normalization was applied:
For cost criteria, reverse min–max normalization was employed:
where denotes the original value of the -th metric for the -th strategy, and represents the corresponding dimensionless normalized score. After normalization, all metrics were transformed into comparable values ranging from 0 to 1, where 1 indicates the best performance and 0 indicates the worst performance.
Equal weighting was adopted to calculate the overall score, i.e., all evaluation metrics were assigned identical weights:
where denotes the overall score of strategy , and is the number of evaluation metrics. The overall score was used to assist in assessing the balance among operational efficiency, charging resource utilization, and energy safety, but it was not used as the sole basis for strategy recommendation. The final recommendation was determined jointly based on the Pareto front, the safety margin of the minimum SOC, and congestion performance under different road-capacity scenarios.
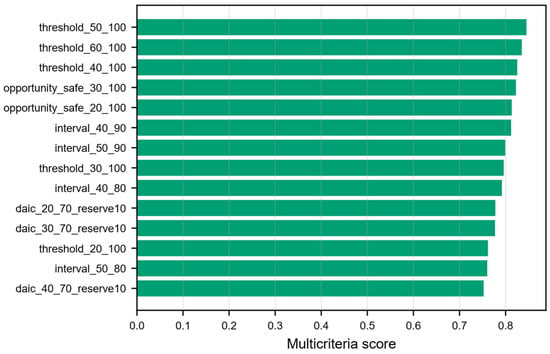
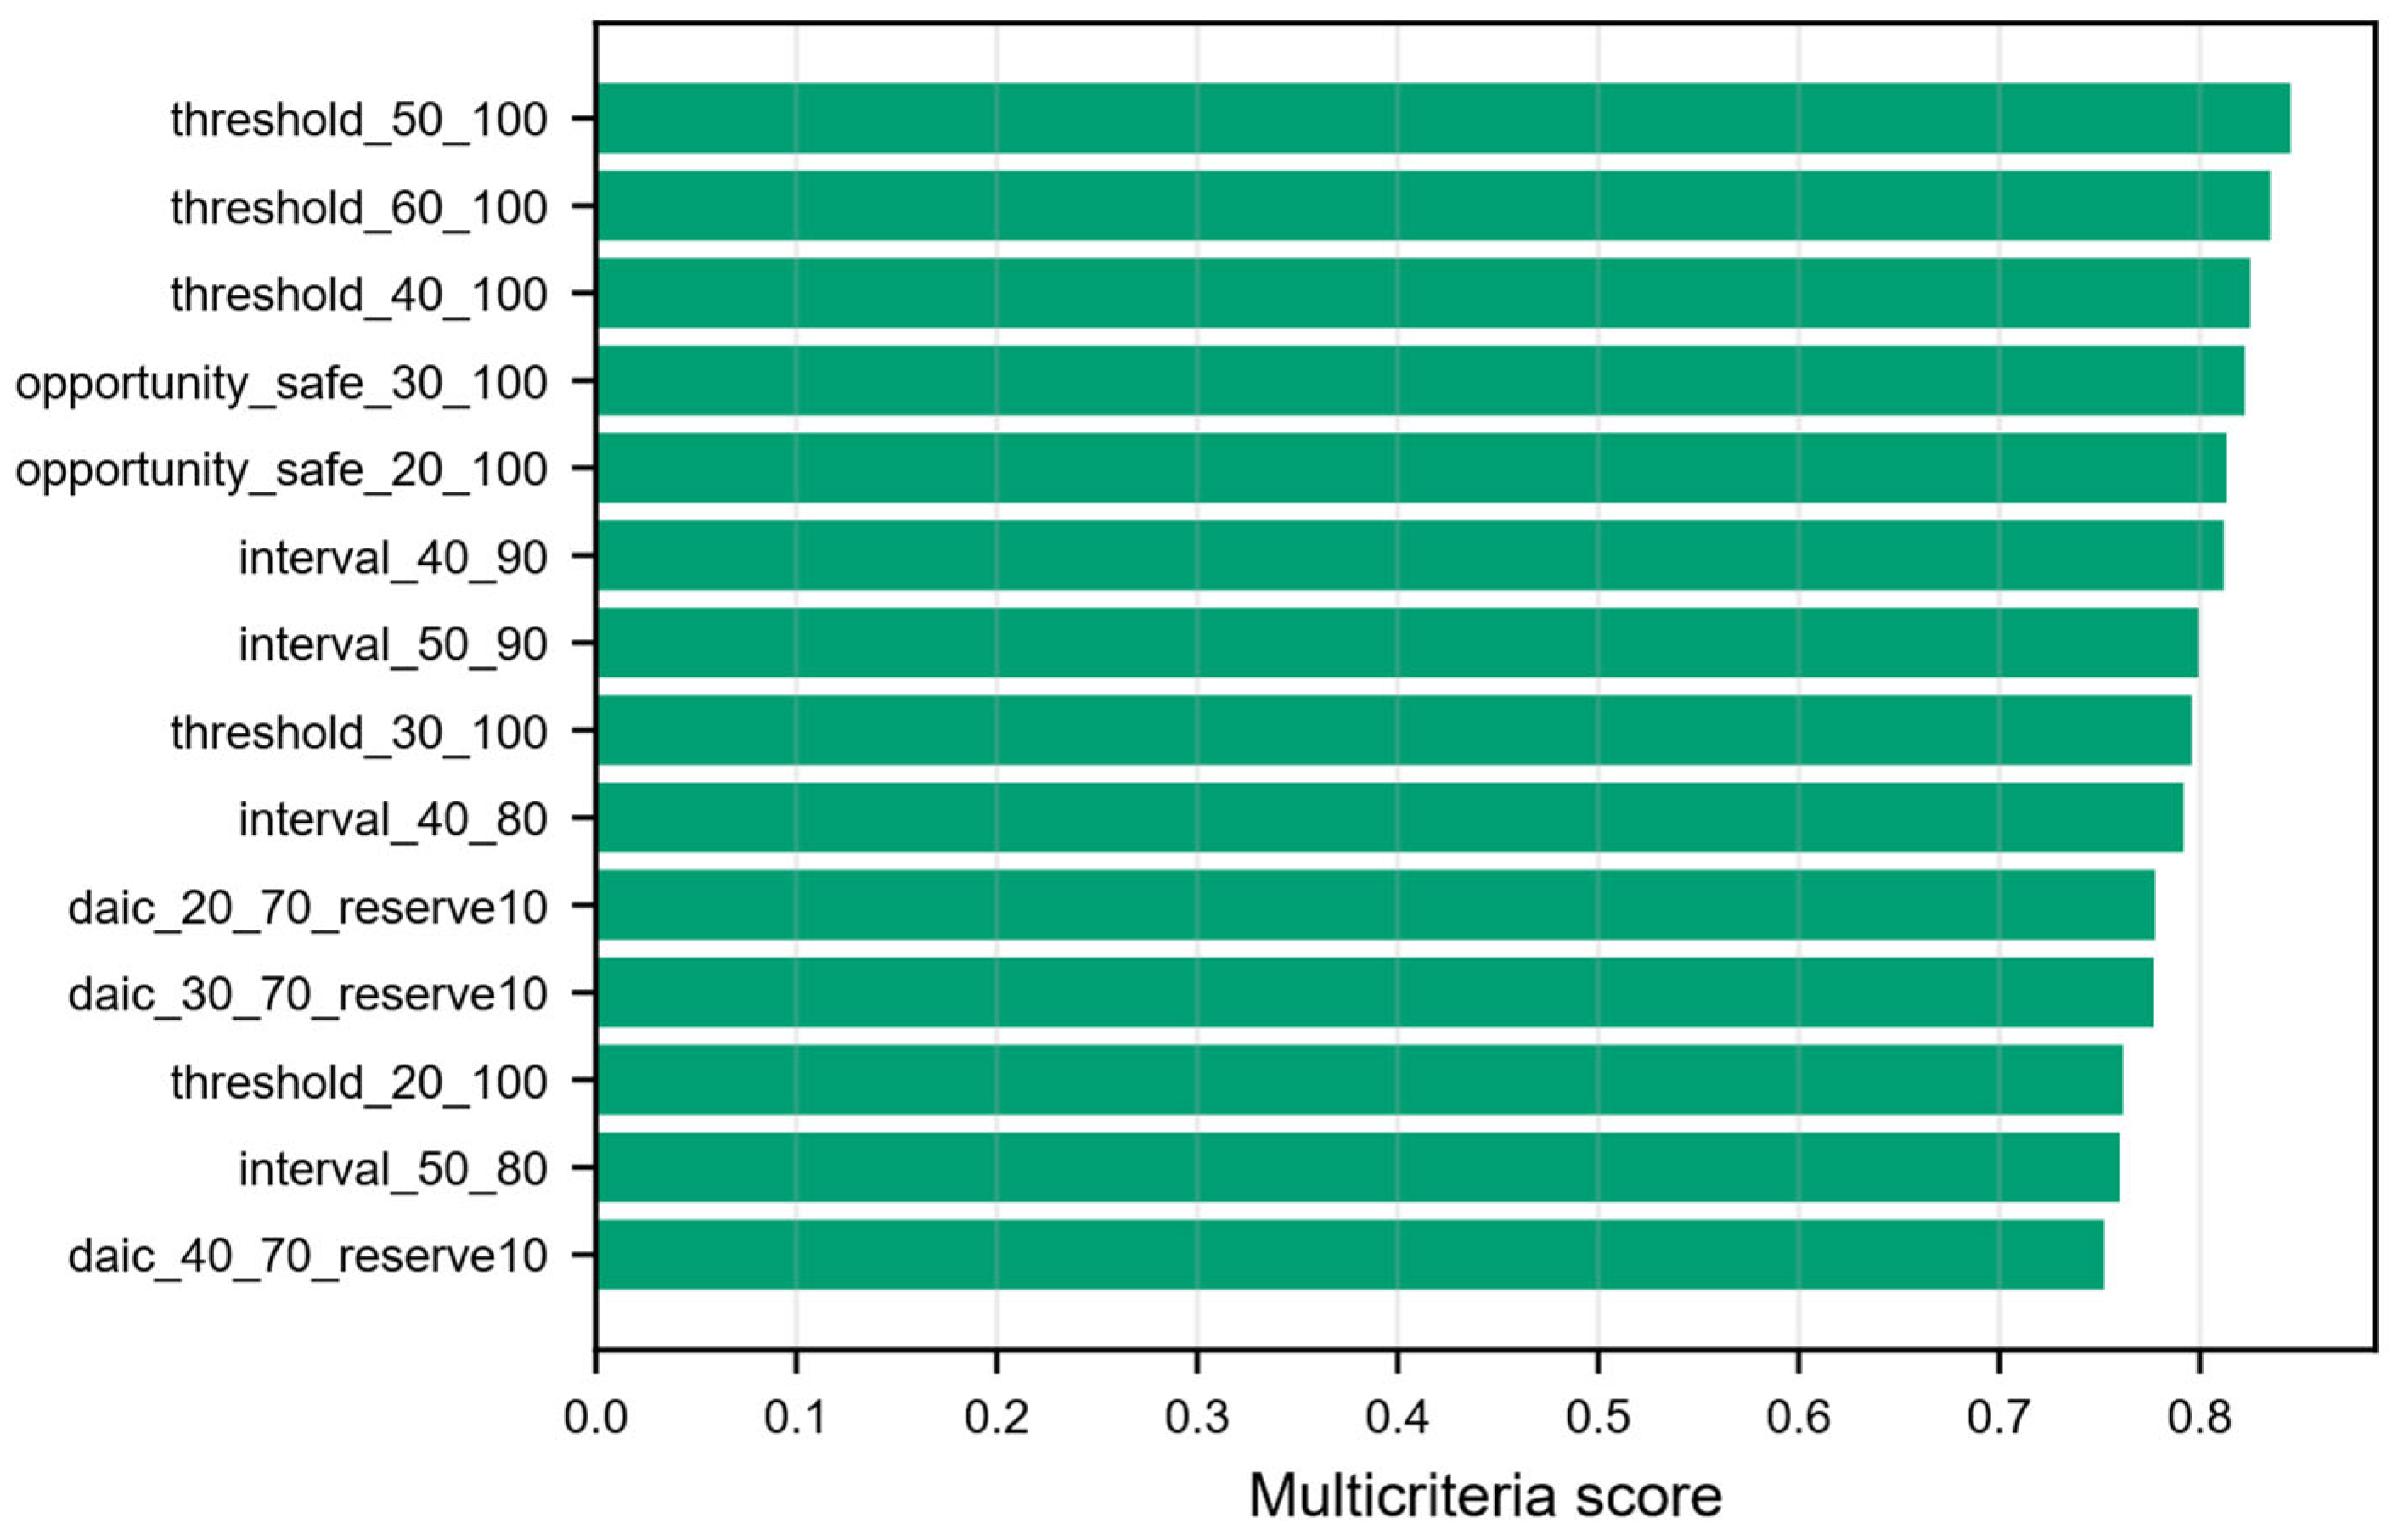
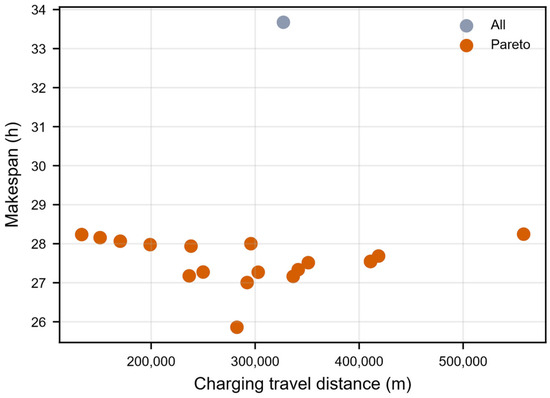
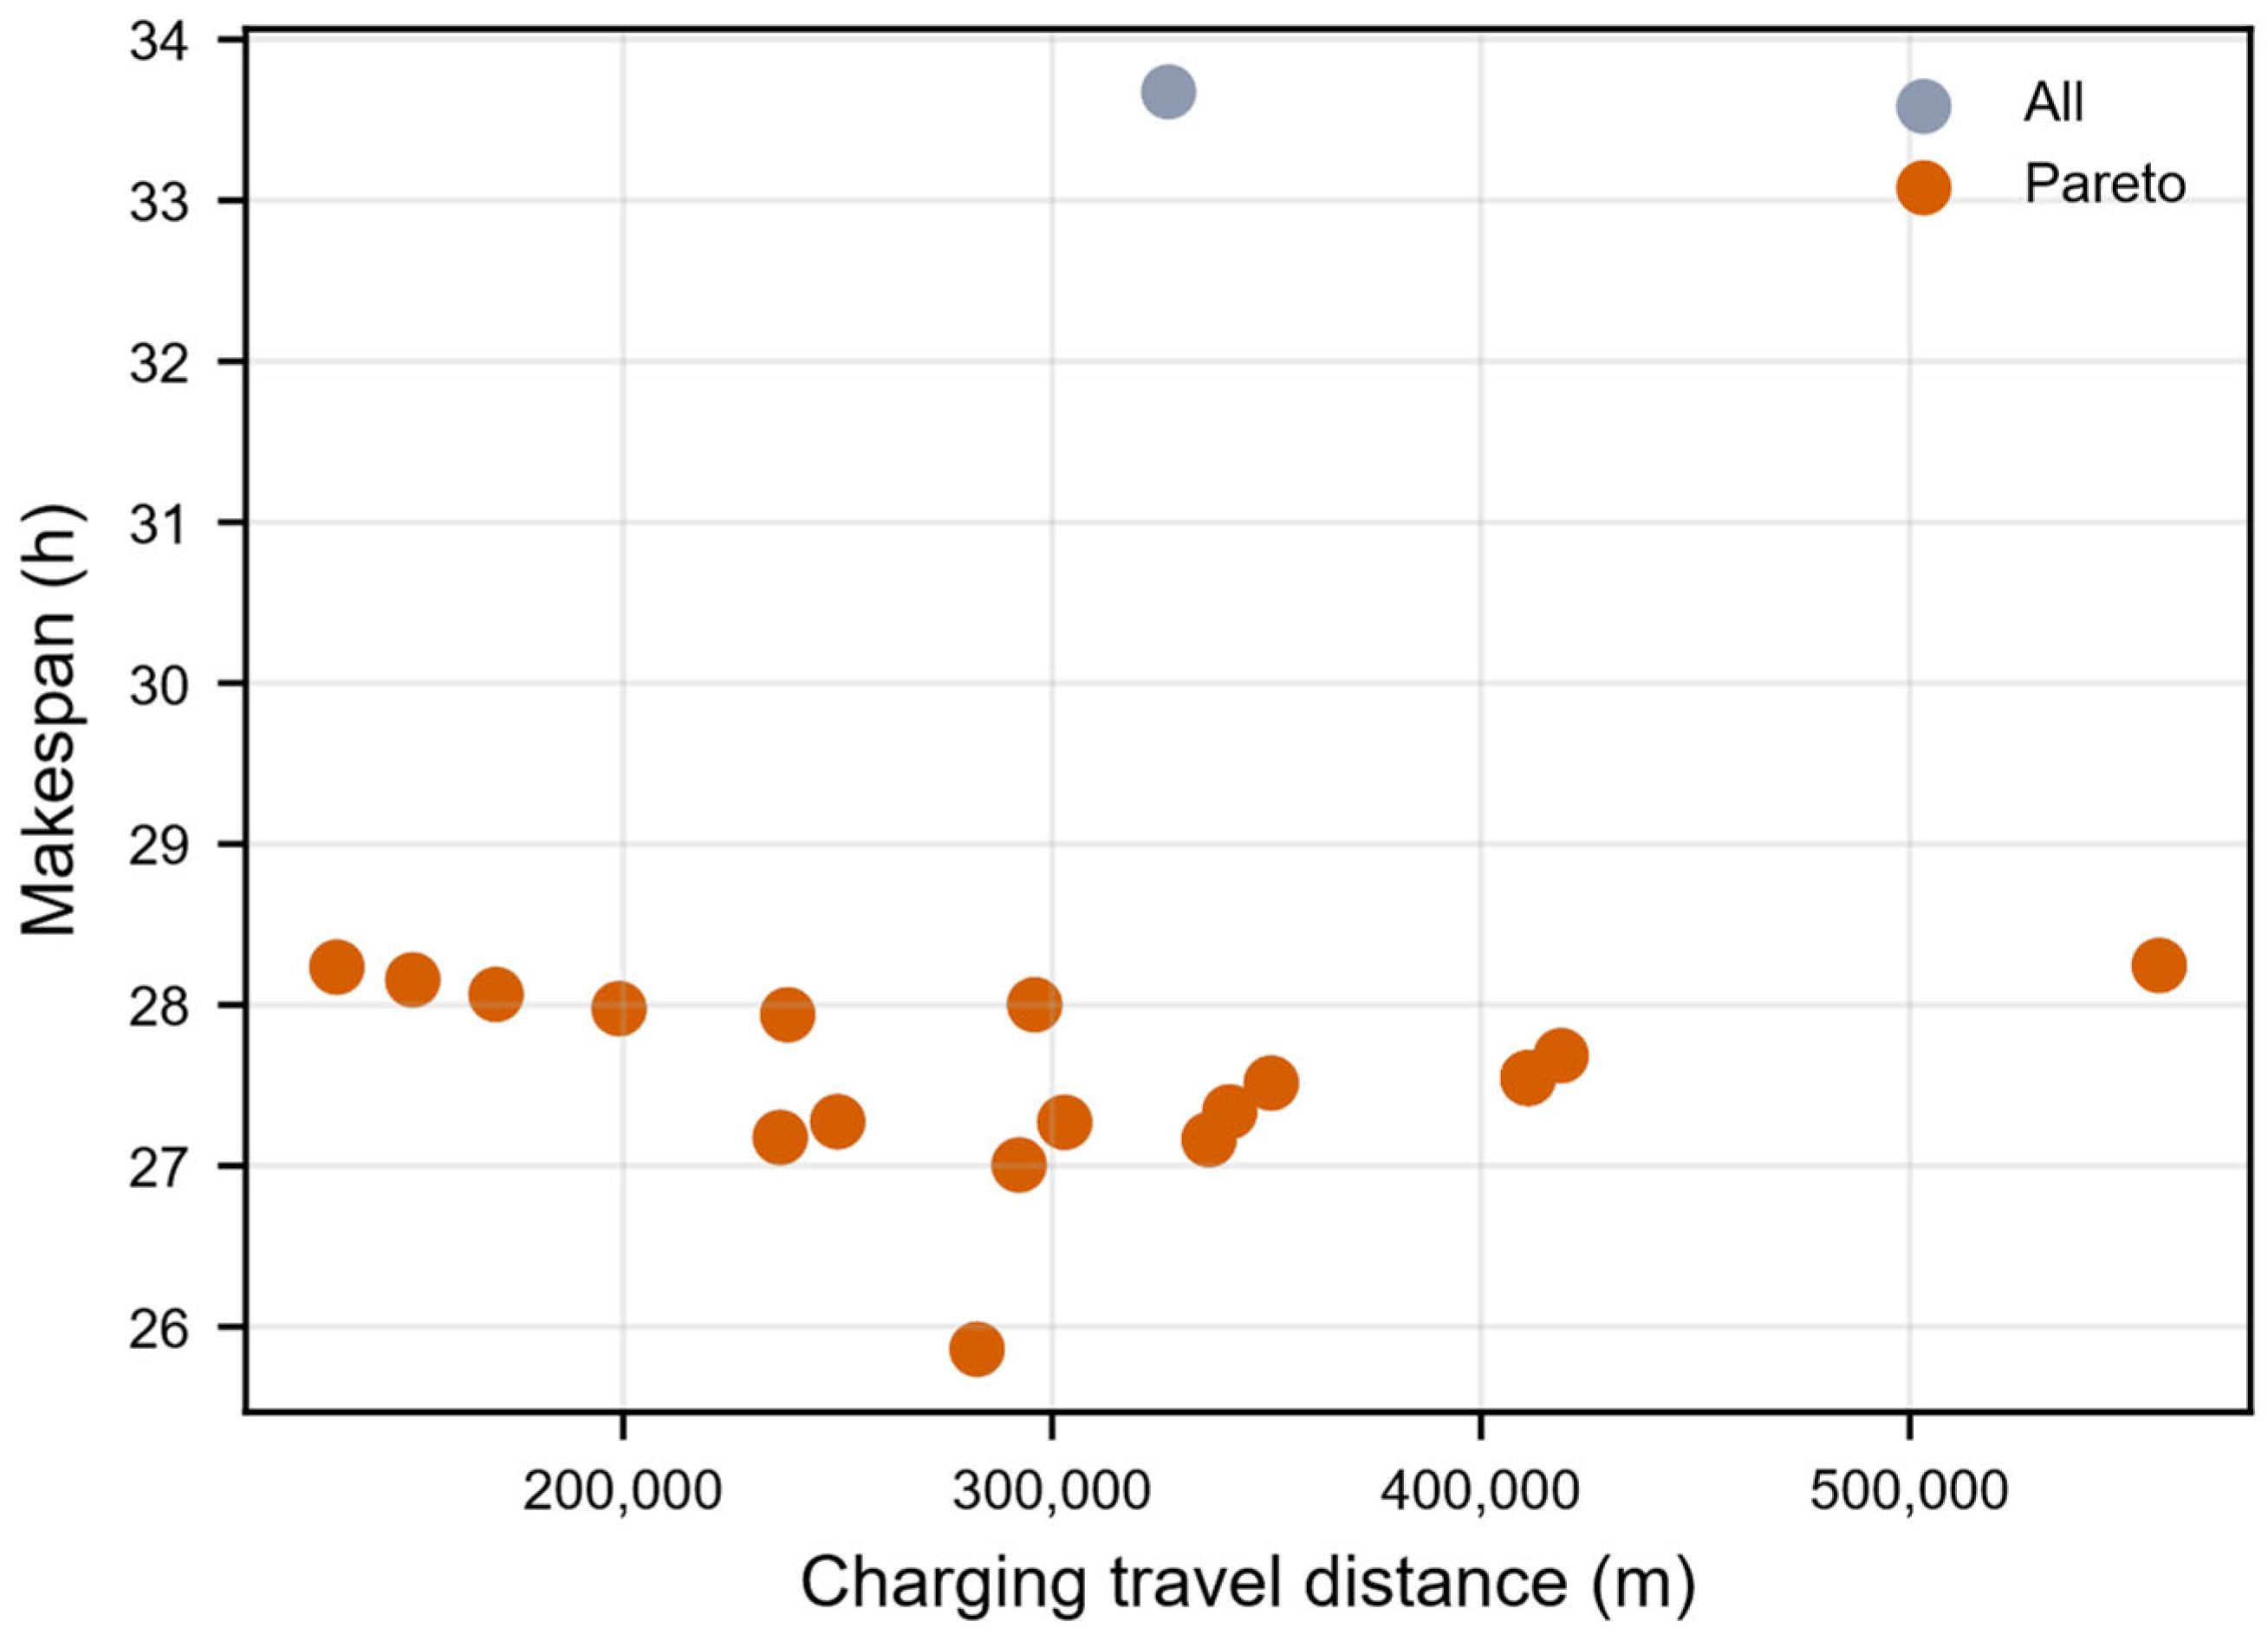
As shown in Figure 12, the equal-weight multi-criteria normalization results indicate that the 50% lower-threshold strategy achieved the highest overall score, exhibiting a relatively balanced performance in terms of success rate, minimum SOC, charging travel distance, number of charging events, and completion time. However, its average charging waiting time was higher than that of several interval charging strategies and the safe opportunity charging strategy. As shown in Figure 13, Pareto analysis further revealed that the 40%/70% interval strategy, 50%/70% interval strategy, safe opportunity charging strategy with a 20% threshold, as well as several DAIC and threshold-based strategies, were all non-dominated solutions. These findings suggest that a pronounced trade-off exists among operational efficiency, energy safety, and charging resource utilization when designing ART charging strategies for the target terminal.
Figure 12.
Comprehensive multi-indicator ranking results.
Figure 13.
Pareto frontier of charging strategies.
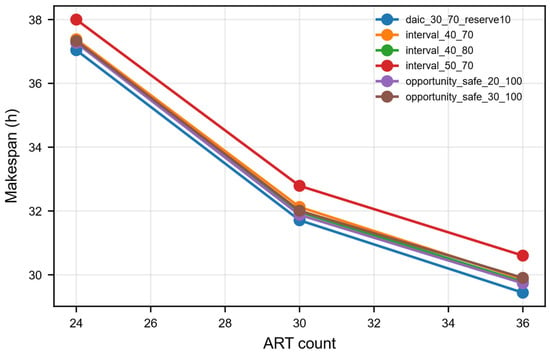
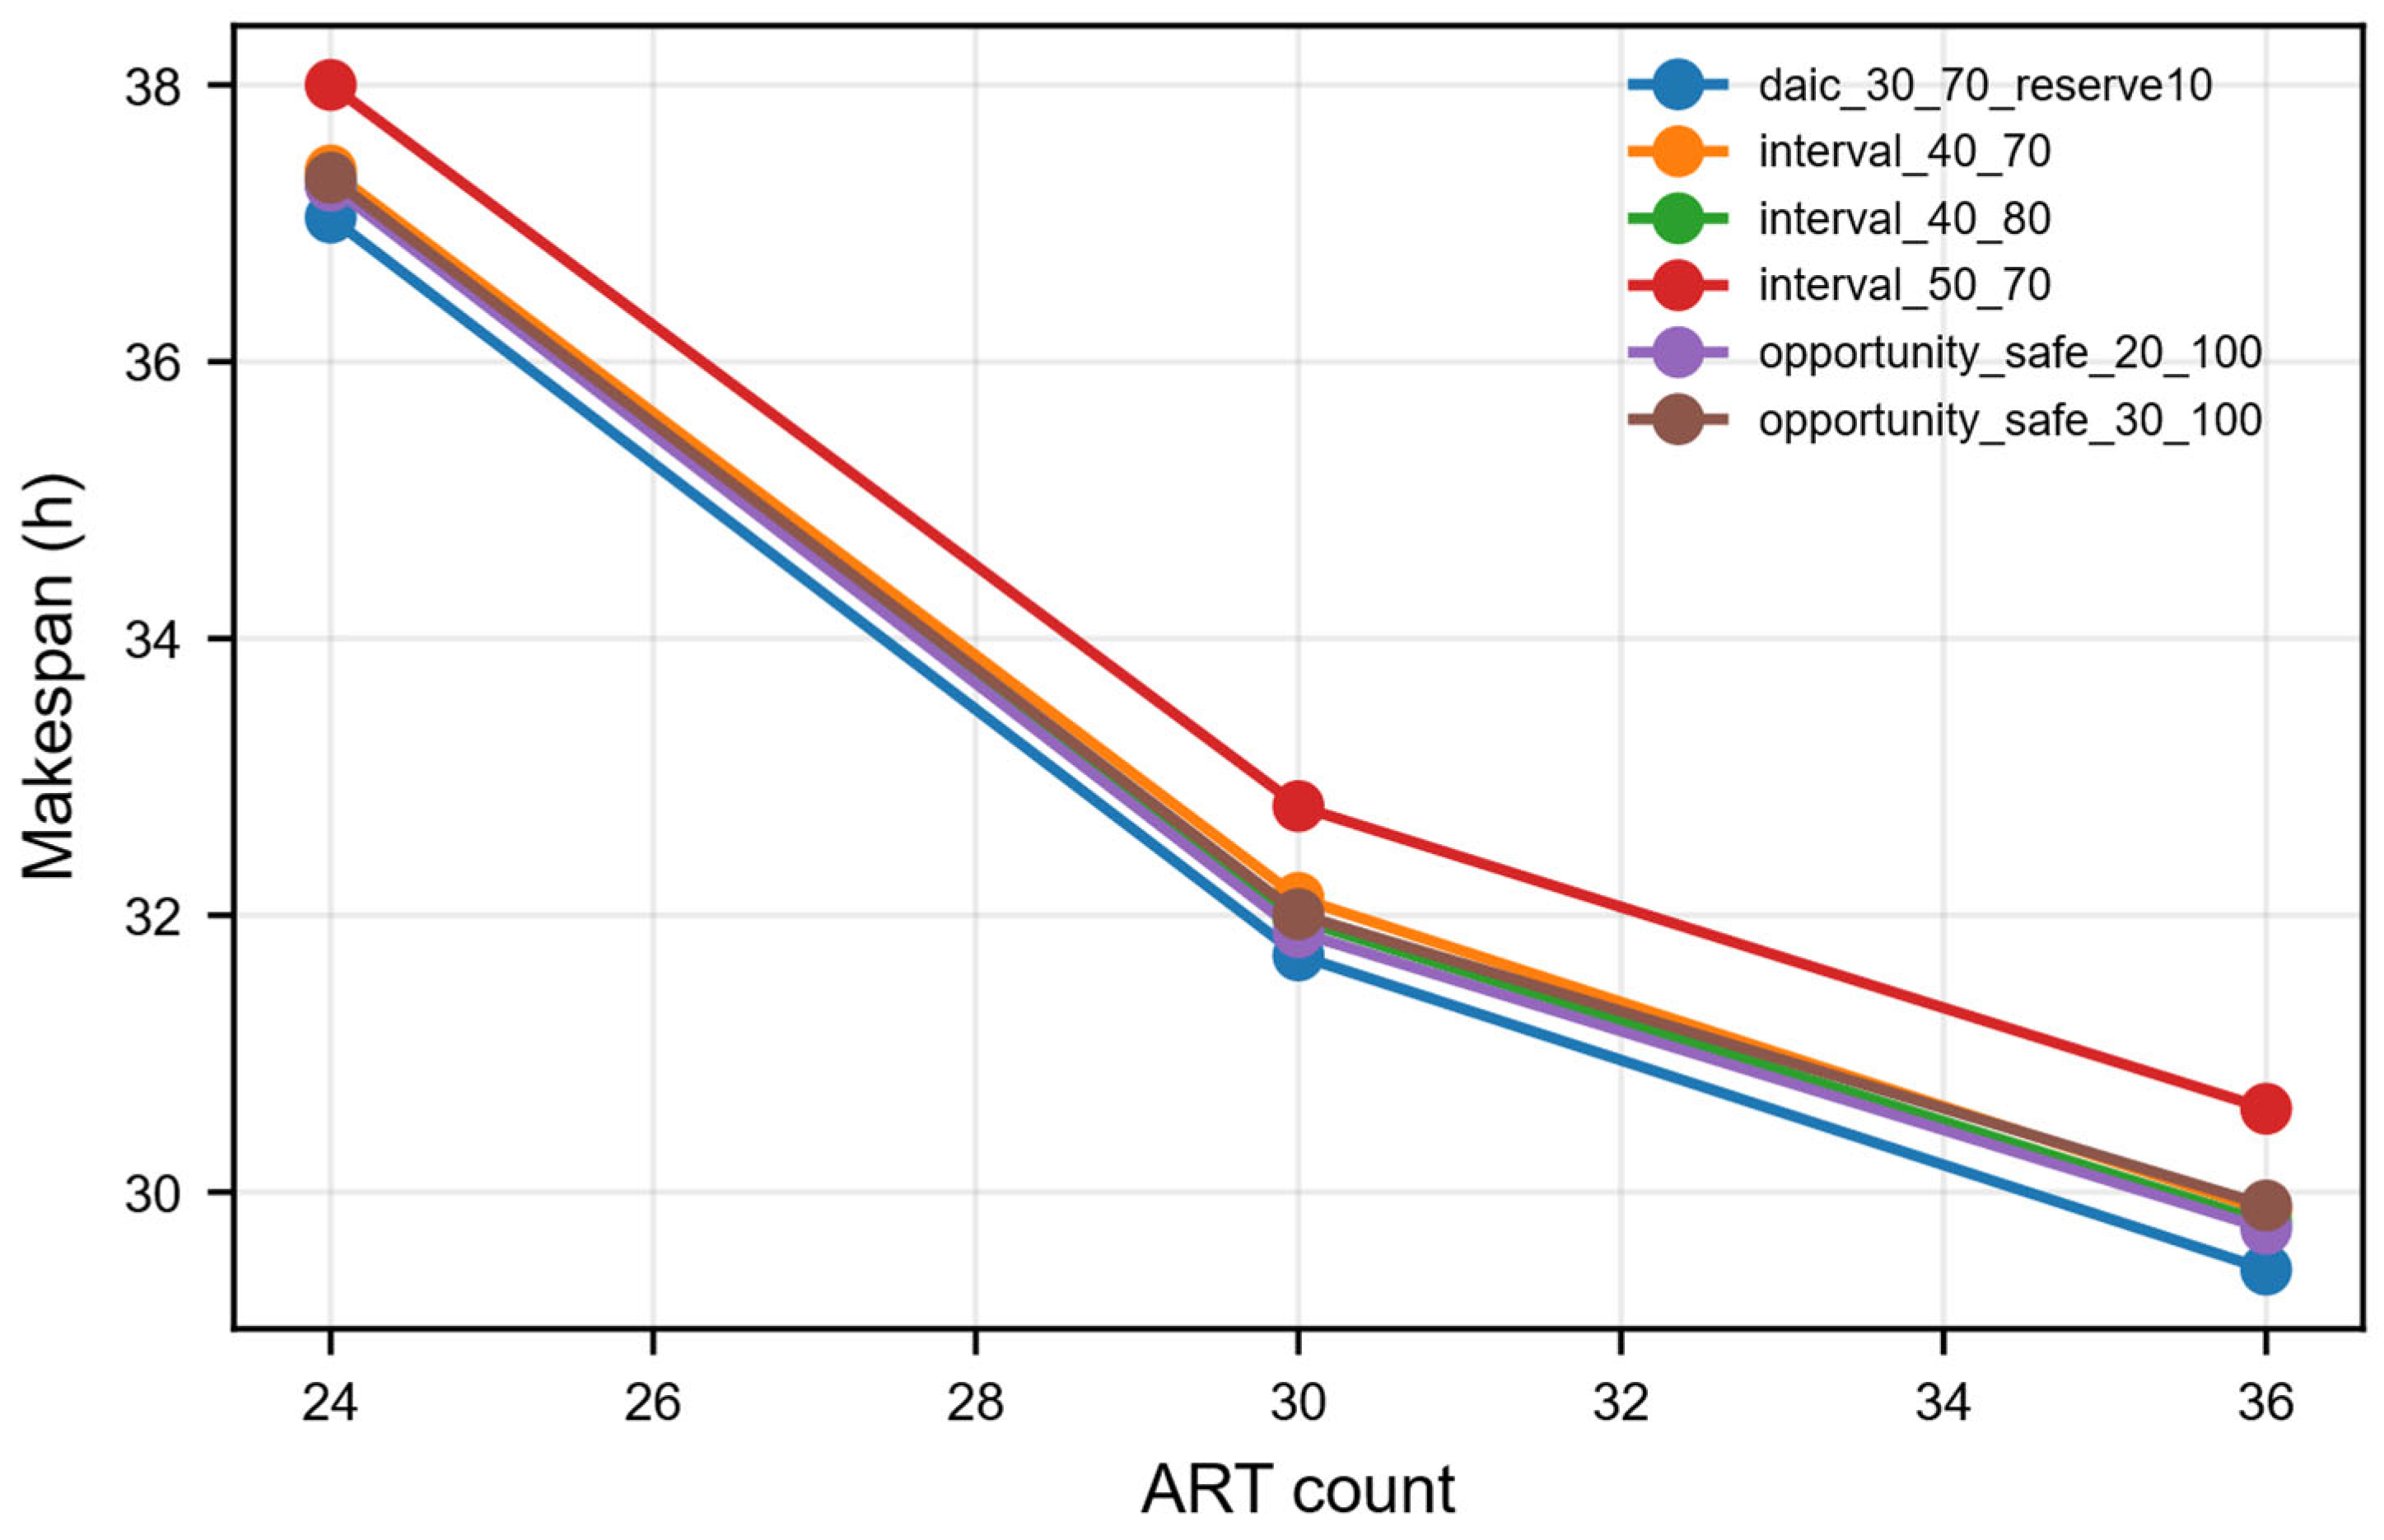
As shown in Figure 14, the resource sensitivity experiments reveal that the number of ARTs and charging interfaces significantly influence task completion time and charging travel distance. Taking the 40%/80% interval charging strategy as an example, the completion time is 27.336 h under the configuration of 30 ARTs and 8 charging interfaces. When the number of ARTs increases to 36 while maintaining 8 charging interfaces, the completion time is further reduced to 25.833 h. Under the configuration of 36 ARTs and 10 charging interfaces, the completion time decreases to 22.583 h, although charging travel distance and charging frequency also change accordingly. These results indicate that charging strategy optimization should be jointly considered with fleet size and charging infrastructure planning, rather than discussing individual strategy parameters in isolation.
Figure 14.
Sensitivity analysis of ART quantity and charging interface quantity.
5. Discussion
This study demonstrates that DXF-based geometric calibration has a substantial impact on charging strategy evaluation. At Tianjin Port Second Container Terminal, the average loaded transport distance between quay cranes and yard blocks reaches 954.552 m. Such relatively long horizontal transportation paths alter energy consumption intensity and charging trigger frequency, while also exposing the battery depletion risk of the conventional opportunity charging strategy that lacks mandatory low-battery protection. These findings indicate that, in automated terminal charging strategy research, road network geometry should not be regarded as a neutral background factor, but rather as a critical determinant influencing strategy performance ranking.
From the perspective of strategy mechanisms, opportunity charging itself is not inherently safe. The conventional opportunity charging strategy only performs charging when an idle charging interface is available after task completion, without enforcing mandatory low-battery protection. Under long-distance transportation paths and continuous task flows, vehicles may still be assigned to tasks that cannot be completed safely with the remaining battery capacity. After introducing low-battery protection, the safe opportunity charging strategy completely eliminates battery depletion failures, demonstrating that opportunity charging in practical engineering deployment should at least be combined with threshold-based protection mechanisms.
Interval charging strategies exhibit strong interpretability and parameter tunability. Experimental results show that the 40%/80% interval charging strategy achieves a relatively balanced performance in terms of completion time, charging travel distance, charging frequency, and minimum SOC. The 40%/70% interval charging strategy is comparatively more conservative, while the 50%/70% interval charging strategy further improves the minimum SOC but significantly increases charging resource occupation. Since practical terminals may differ in their preferences regarding safety margins, charging interface utilization, and operational efficiency, interval parameters should be selected according to specific operational objectives rather than solely pursuing minimum completion time.
The traffic-capacity scenarios further demonstrate that road congestion amplifies the differences among charging strategies. High-frequency charging strategies may increase ART travel between operational areas and charging zones, thereby occupying critical arterial roads and intersection resources. The congested edges identified in this study, including ML8 → ML7, ML11 → ML10, and ML14 → ML13, provide useful references for future charging zone deployment, traffic organization optimization, and detour rule design.
It should be noted that, although DXF layers and graphical entities are employed for road network calibration, several modeling assumptions remain. DXF coordinates are interpreted in millimeters, lane directions are inferred from traffic flow layers, charging nodes are arranged according to parking-space and vehicle-position layers, and the semantics of certain CAD layers still require manual interpretation. Therefore, the experimental results of this study are suitable as a DXF-based simulation evaluation and comparative basis for ART charging strategies at Tianjin Port Second Container Terminal. Future work may further calibrate road capacities, peak task release patterns, and charging interface locations by integrating on-site GPS and terminal operating system data.
6. Conclusions
This study constructs a directed ART traffic network based on the DXF drawings of Tianjin Port Second Container Terminal. The calibrated network consists of 88 nodes, 144 directed edges, 10 quay crane nodes, 20-yard block nodes, and 8 charging interfaces. The average loaded transport distance between quay cranes and yard blocks is 954.552 m, indicating that the target terminal involves relatively long horizontal transportation paths. Consequently, the geometric characteristics of the terminal layout have a significant impact on charging strategy simulation and evaluation.
The conventional opportunity charging strategy without mandatory low-battery protection experiences a large number of battery depletion events under the long-distance road network of the target terminal, resulting in an operational success rate of 0. In contrast, both the safe opportunity charging strategy with a 20% threshold and the safe opportunity charging strategy with a 30% threshold achieve an operational success rate of 1 after introducing mandatory low-battery protection. These results demonstrate that opportunity charging must be combined with safety-threshold mechanisms to ensure reliable operation.
Among the interval charging strategies, the 40%/80% interval charging strategy achieves a completion time of 27.336 h, a charging travel distance of 341,409.7 m, a charging frequency of 416.4 events, and a minimum SOC of 28.469%, outperforming the 40%/70% interval charging strategy in terms of operational time and charging resource utilization. However, Pareto analysis indicates that the 40%/70% interval charging strategy, the 50%/70% interval charging strategy, and the safe opportunity charging strategy with a 20% threshold are all Pareto-efficient solutions, among which the 40%/70% interval charging strategy demonstrates stronger overall robustness. Although the 50%/70% interval charging strategy improves the minimum SOC, it significantly increases the charging travel distance and charging frequency.
The traffic-capacity scenarios successfully pass the single-vehicle validation test, with road waiting time remaining 0 under the single-ART condition. However, significant congestion emerges when the fleet size increases to 30 ARTs, with road waiting time reaching approximately 541.09 s per task. The primary congested edges are identified as ML8 → ML7, ML11 → ML10, and ML14 → ML13. These results indicate that charging strategies influence road-capacity utilization through charging-related route selection.
The DAIC diagnostic results show that the average SOC required for task assignment under the current road network is 6.384%, with a P95 value of 9.668% and a maximum value of 11.262%. When or , the distance-aware constraint is effectively covered by the threshold condition. In contrast, when and , DAIC is triggered an average of 71.267 times, indicating that the DAIC strategy is more suitable for scenarios with relatively low thresholds and higher safety reserve requirements.
Overall, ART charging strategies at Tianjin Port Second Container Terminal should not be evaluated solely based on completion time. Instead, multiple indicators—including operational success rate, minimum SOC, charging travel distance, charging frequency, charging waiting time, and road congestion—should be comprehensively considered. Among the interpretable and practically deployable rule-based strategies, the 40%/70% interval charging strategy can be recommended as a balanced overall solution, while the 40%/80% interval charging strategy can serve as an alternative emphasizing operational efficiency and charging resource utilization. The 50% lower-threshold charging strategy is suitable for scenarios prioritizing higher SOC safety margins, whereas the safe opportunity charging strategy is more appropriate in environments with sufficient charging interfaces and tolerance for higher charging frequency.
Author Contributions
Conceptualization, H.H., R.Y., N.Z. (Ning Zhao) and X.L.; methodology, H.H., R.Y. and N.Z. (Ning Zhao); software, M.H.; validation, R.Y. and M.H.; formal analysis, H.H. and R.Y.; investigation, H.H., N.Z. (Ning Zhao), X.L., R.Y. and M.H.; resources, R.Y. and N.Z. (Nenad Zrnic); data curation, H.H. and R.Y.; writing—original draft preparation, H.H.; writing—review and editing, H.H., R.Y., M.H., N.Z. (Nenad Zrnic) and X.L.; visualization, M.H.; supervision, H.H., R.Y. and N.Z. (Ning Zhao); project administration, H.H., R.Y., N.Z. (Ning Zhao) and X.L. All authors have read and agreed to the published version of the manuscript.
Funding
The authors gratefully acknowledge the financial support by the Department of Science & Technology of Shandong Province [grant number 2025CXGC010712], and the Ministry of Science & Technology of China [grant number 20240605]. This research was supported by the National Natural Science Foundation of China (No. 52472435).
Data Availability Statement
The data used in this study did not involve any public data sets.
Conflicts of Interest
Author Rong Yang was employed by Tianjin Port (Group) Co., Ltd. The remaining authors declare that the research was conducted in the absence of any commercial or financial relationships that could be construed as a potential conflict of interest.
References
- Liu, C.-I.; Jula, H.; Ioannou, P.A. Design, simulation, and evaluation of automated container terminals. IEEE Trans. Intell. Transp. Syst. 2002, 3, 12–26. [Google Scholar] [CrossRef] [Scilit]
- Kim, K.H.; Bae, J.W. A look-ahead dispatching method for automated guided vehicles in automated port container terminals. Transp. Sci. 2004, 38, 224–234. [Google Scholar] [CrossRef] [Scilit]
- Vis, I.F.A. Survey of research in the design and control of automated guided vehicle systems. Eur. J. Oper. Res. 2006, 170, 677–709. [Google Scholar] [CrossRef] [Scilit]
- Le-Anh, T.; De Koster, M.B.M. A review of design and control of automated guided vehicle systems. Eur. J. Oper. Res. 2006, 171, 1–23. [Google Scholar] [CrossRef] [Scilit]
- Ma, N.; Zhou, C.; Stephen, A. Simulation model and performance evaluation of battery-powered AGV systems in automated container terminals. Simul. Model. Pract. Theory 2021, 106, 102146. [Google Scholar] [CrossRef] [Scilit]
- Chen, J.C.; Chen, T.-L.; Teng, Y.-C. Meta-model based simulation optimization for automated guided vehicle system under different charging mechanisms. Simul. Model. Pract. Theory 2021, 106, 102208. [Google Scholar] [CrossRef] [Scilit]
- Boccia, M.; Masone, A.; Sterle, C.; Murino, T. The parallel AGV scheduling problem with battery constraints: A new formulation and a matheuristic approach. Eur. J. Oper. Res. 2023, 307, 590–603. [Google Scholar] [CrossRef] [Scilit]
- Li, X.; Peng, Y.; Tian, Q.; Feng, T.; Wang, W.; Cao, Z.; Song, X. A decomposition-based optimization method for integrated vehicle charging and operation scheduling in automated container terminals under fast charging technology. Transp. Res. Part E Logist. Transp. Rev. 2023, 180, 103338. [Google Scholar] [CrossRef] [Scilit]
- Gao, Y.; Chang, D.; Chen, C.-H.; Sha, M. A digital twin-based decision support approach for AGV scheduling. Eng. Appl. Artif. Intell. 2024, 130, 107687. [Google Scholar] [CrossRef] [Scilit]
- Song, X.; Chen, N.; Zhao, M.; Wu, Q.; Liao, Q.; Ye, J. Novel AGV resilient scheduling for automated container terminals considering charging strategy. Ocean Coast. Manag. 2024, 250, 107014. [Google Scholar] [CrossRef] [Scilit]
- Zhou, S.; Liao, Q.; Xiong, C.; Chen, J.; Li, S. A novel metaheuristic approach for AGVs resilient scheduling problem with battery constraints in automated container terminal. J. Sea Res. 2024, 202, 102536. [Google Scholar] [CrossRef] [Scilit]
- Zhang, X.; Gu, Y.; Tian, Y. Integrated optimization of automated guided vehicles and yard cranes considering charging constraints. Eng. Optim. 2024, 56, 1748–1766. [Google Scholar] [CrossRef] [Scilit]
- Li, S.; Fan, L.; Jia, S. A hierarchical solution framework for dynamic and conflict-free AGV scheduling in an automated container terminal. Transp. Res. Part C Emerg. Technol. 2024, 165, 104724. [Google Scholar] [CrossRef] [Scilit]
- Kong, L.; Ji, M.; Yu, A.; Gao, Z. Scheduling of automated guided vehicles for tandem quay cranes in automated container terminals. Comput. Oper. Res. 2024, 163, 106505. [Google Scholar] [CrossRef] [Scilit]
- Wang, Y.-Z.; Hu, Z.-H.; Tian, X.-D. Scheduling ASC and AGV considering direct, buffer, and hybrid modes for transferring containers. Comput. Oper. Res. 2024, 161, 106419. [Google Scholar] [CrossRef] [Scilit]
- Zhou, C.; Stephen, A.; Tan, K.C.; Chew, E.P.; Lee, L.H. Multiagent Q-Learning approach for the recharging scheduling of electric automated guided vehicles in container terminals. Transp. Sci. 2024, 58, 664–683. [Google Scholar] [CrossRef] [Scilit]
- Che, A.; Wang, Z.; Zhou, C. Multi-agent deep reinforcement learning for recharging-considered vehicle scheduling problem in container terminals. IEEE Trans. Intell. Transp. Syst. 2024, 25, 16855–16868. [Google Scholar] [CrossRef] [Scilit]
- Yang, Y.; Liang, J.; Feng, J. Simulation and optimization of automated guided vehicle charging strategy for U-shaped automated container terminal based on improved proximal policy optimization. Systems 2024, 12, 472. [Google Scholar] [CrossRef] [Scilit]
- Zhou, W.; Zhang, Y.; Tang, K.; He, L.; Zhang, C.; Tian, Y. Co-optimization of the operation and energy for AGVs considering battery-swapping in automated container terminals. Comput. Ind. Eng. 2024, 195, 110445. [Google Scholar] [CrossRef] [Scilit]
- Xiong, C.; Wang, C.; Zhou, S.; Song, X. Dynamic rolling scheduling model for multi-AGVs in automated container terminals based on spatio-temporal position information. Ocean Coast. Manag. 2024, 258, 107349. [Google Scholar] [CrossRef] [Scilit]
- Xing, Z.; Liu, H.; Wang, T.; Lin, Y.H.; Chew, E.P.; Tan, K.C.; Li, H. AGV charging scheduling with capacitated charging stations at automated ports. Transp. Res. Part E Logist. Transp. Rev. 2025, 197, 104080. [Google Scholar] [CrossRef] [Scilit]
- Zhao, R.; Liang, C. Optimizing AGV utilization and battery life in automated container terminals: Focus on a novel charging strategy and reinforcement learning algorithm. J. Clean. Prod. 2025, 519, 145939. [Google Scholar] [CrossRef] [Scilit]
- Xie, T.; Yu, F.; Yang, Y. AGV scheduling at U-shaped automated container terminals considering dual threshold charging strategy. Flex. Serv. Manuf. J. 2025, 63, 9269–9297. [Google Scholar] [CrossRef] [Scilit]
- Zhen, L.; Zhang, Q.; Tan, Z.; Wang, S. Scheduling AGVs in ports with battery charging and swapping. IISE Trans. 2025, 57, 1245–1262. [Google Scholar] [CrossRef] [Scilit]
- Zhou, S.; Yu, Y.; Zhao, M.; Zhuo, X.; Lian, Z.; Zhou, X. A Reinforcement Learning-Based AGV Scheduling for Automated Container Terminals with Resilient Charging Strategies. IET Intell. Transp. Syst. 2025, 19, e70027. [Google Scholar] [CrossRef] [Scilit]
- Jiang, G.; Chen, A.; Yang, G.; Zhang, Y.; Zhong, R.; Du, K. Joint scheduling of multi-equipment in an automated container terminal under charging-on-the-go mode. Transp. A Transp. Sci. 2026, 1–33. [Google Scholar] [CrossRef] [Scilit]
- Yang, A.; Liu, Y.; Xin, C.; Chen, Q.; Wang, L. Towards intuitive visualisation goals for the operation optimisation of automated container terminal based on digital twin technology. Marit. Policy Manag. 2024, 51, 631–652. [Google Scholar] [CrossRef] [Scilit]
- Li, J.; Xiao, H.; Liu, Z. A multi-agent deep deterministic policy gradient algorithm integrated with the A algorithm for multiple-equipment integrated scheduling in automated container terminals. Eng. Optim. 2025, 1–24. [Google Scholar] [CrossRef] [Scilit]
- Xiao, G.; Mi, C. Sustainable Maritime Transport and Port Intelligence. J. Mar. Sci. Eng. 2026, 14, 592. [Google Scholar] [CrossRef] [Scilit]
- Mi, C.; Wang, T.; Man, X.; Shen, Y. Multi-View Point Cloud Registration Method for Automated Disassembly of Container Twist Locks. J. Mar. Sci. Eng. 2026, 14, 605. [Google Scholar] [CrossRef] [Scilit]
- Shen, Y.; Gao, Z.; Wang, J.; Zhang, Z.; Zhang, Y.; Postolache, O.; Mi, C. Point Cloud Surface Registration for Cargo Hold Material Matching via Sparse Line-Based Sensing Method. IEEE Sens. J. 2025, 25, 43305–43318. [Google Scholar] [CrossRef] [Scilit]
- Shen, Y.; Man, X.; Wang, J.; Zhang, Y.; Mi, C. Truck Lifting Accident Detection Method Based on Improved PointNet++ for Container Terminals. J. Mar. Sci. Eng. 2025, 13, 256. [Google Scholar] [CrossRef] [Scilit]
- He, M.; Zhang, Y.; Liu, Y.; Shen, Y.; Mi, C. Automated Evaluation Method for Risk Behaviors of Quay Crane Operators at Ports Using Virtual Reality. Algorithms 2024, 17, 508. [Google Scholar] [CrossRef] [Scilit]
- Li, C.; Yao, L.; Mi, C. Fusion Algorithm Based on Improved A* and DWA for USV Path Planning. J. Mar. Sci. Appl. 2025, 24, 224–237. [Google Scholar] [CrossRef] [Scilit]

Disclaimer/Publisher’s Note: The statements, opinions and data contained in all publications are solely those of the individual author(s) and contributor(s) and not of MDPI and/or the editor(s). MDPI and/or the editor(s) disclaim responsibility for any injury to people or property resulting from any ideas, methods, instructions or products referred to in the content. |
© 2026 by the authors. Licensee MDPI, Basel, Switzerland. This article is an open access article distributed under the terms and conditions of the Creative Commons Attribution (CC BY) license.