


Abstract
Oscillating water column (OWC) wave energy converters equipped with dielectric elastomer generators (DEGs) represent a promising technology for harnessing ocean wave energy. This study emphasises the critical role of functional specifications in guiding the development of these devices from initial concept to full-scale deployment. A comprehensive analysis of key design parameters that influence the performance and efficiency of flexible OWCs with DEG-based power take-off systems is presented. This investigation focuses on the effects of draft, membrane diameter, deformation characteristics, number of layers, and membrane thickness on power output. Utilising a combination of analytical tools, including Wave Venture software, MATLAB, and Abaqus, detailed simulations and analyses are conducted to optimise these parameters. Our results demonstrate that increasing the DEG diameter significantly enhances power output, with diameters between 5 and 12 m showing optimal efficiency. A critical strain threshold of approximately 32% is identified, beyond which power output efficiency diminishes. Furthermore, the study reveals that multi-layer DEG configurations can substantially increase energy production, with thinner membranes generally yielding higher outputs. These findings provide valuable insights for developing functional specifications that balance performance, manufacturability, and long-term reliability in marine environments. This research advances OWC technology by offering a parameter-screening framework to guide device design towards optimised configurations and to accelerate the path to commercial viability in the wave energy sector.
1. Introduction
Wave energy converters (WECs) provide a reliable and environmentally friendly power source, aiding the worldwide transition to renewable energy [1]. The oscillating water column (OWC) device is a type of WEC that uses an air chamber to convert wave motion into air pressure and a power take-off (PTO) system to convert pneumatic power into electricity [2]. Besides its high reliability and straightforward maintenance [3], the system’s simple geometry has attracted numerous researchers to conduct analytical, numerical, and experimental analyses. Over the last 10 years, there has been a growing trend towards flexible body WECs enabled by elastomeric membranes, which can simplify all aspects of WEC design. The membrane component can function as the primary mover, power take-off (PTO), and other sub-assembly systems [3].
Functional specifications play a crucial role in developing and optimising flexible OWCs, bridging theoretical research and practical implementation [4,5]. They define the key performance requirements, operational parameters, and design constraints that guide development from initial concept to full-scale deployment. For flexible OWCs with DEG-based PTOs, these specifications encompass energy conversion efficiency, operational wave conditions, structural integrity, and environmental compatibility [6]. Well-defined specifications provide a clear roadmap for researchers and engineers, ensuring that all aspects of device performance are considered and optimised across scales [7].
A primary challenge in developing flexible OWCs is translating small-scale experimental results and theoretical models into full-scale, commercially viable devices [8]. Functional specifications are critical here, providing a framework for evaluating and comparing performance across scales. By defining target metrics such as power output, efficiency, and operational ranges, researchers can more effectively identify and address scaling issues [9], enabling a systematic progression from laboratory prototypes to pilot installations and full-scale commercial devices.
Comprehensive specifications also facilitate the interdisciplinary collaboration essential to wave energy conversion [10]. Clear performance targets and design constraints create a common language, enabling experts in materials science, hydrodynamics, electrical engineering, and environmental science to work effectively together. This is particularly important for flexible OWCs, where the interplay between membrane, fluid dynamics, and electrical systems demands a holistic design perspective [11]. Developing functional specifications also encourages a more holistic approach. Such an approach also encourages holistic optimisation. Rather than focusing solely on maximising energy output, well-crafted specifications consider manufacturability, maintainability, and long-term reliability [12], ensuring devices are both efficient and practical to deploy in real-world marine environments. This better aligns research with industry needs, potentially accelerating commercialisation. Finally, functional specifications provide a framework for systematic comparison between flexible OWC designs and other WEC technologies [5,8]. Standardised performance metrics and testing protocols enable meaningful comparisons across approaches, helping identify the most promising avenues for further development and investment [13].
Developing flexible OWCs represents a significant advancement in wave energy conversion technology. Systems utilising DEGs as PTO mechanisms offer several advantages over rigid OWCs. The membrane’s flexibility enables better wave energy absorption across a wider frequency range, potentially increasing overall efficiency [14]. DEGs also address challenges associated with conventional turbine-based systems, operating efficiently in harsh marine environments while offering lower costs, easier installation and maintenance, reduced noise, and improved energy efficiency compared to traditional turbines [15,16].
The design of flexible OWCs requires careful consideration of various parameters. The geometry, including the draft and diameter of the air chamber, significantly influences hydrodynamic behaviour and energy absorption [17], and optimising these parameters can substantially improve power output [18]. The membrane’s properties, including material composition, thickness, and number of layers, are equally important, as material choice affects efficiency and durability in marine environments [19]. Silicone-based elastomers have emerged as promising DEG candidates due to their favourable mechanical properties and potential for further improvement through the addition of compounds [20].
Numerical modelling is pivotal in designing flexible OWCs. Advanced CFD and FEA techniques accurately simulate the complex fluid–structure interactions in these systems [21], allowing performance prediction under various wave conditions without costly physical prototypes at every stage [22]. The computational demands of such models have, in turn, driven the development of reduced-order modelling techniques that balance accuracy and efficiency [23].
Experimental validation remains crucial. Wave tank testing provides insights into scaled prototype behaviour under controlled conditions [24], helping validate numerical models and identify issues before deployment. Sea trials, such as those at the Natural Ocean Engineering Laboratory (NOEL) in Italy, represent the ultimate test, providing real-world performance data and highlighting installation, operation, and durability challenges [25]. The draft affects the system’s natural frequency, which should match the predominant wave frequencies at the deployment site for optimal absorption [26]. Membrane diameter significantly impacts power output, with larger diameters generally increasing energy production, albeit with manufacturing and installation limits [27]. Membrane deformation is another critical factor, with research indicating an optimal strain level beyond which further stretching yields no proportional increase in power [28]. Multi-layer DEG configurations present both opportunities and challenges: increasing the number of layers can enhance power output but introduces manufacturing complexities and potential failure modes [29]. Recent advances, such as nano-silica/polydimethylsiloxane (PDMS) composites, show promise in offering improved energy density and fatigue life [30]. Researchers continue exploring novel designs and materials, including U- and L-shaped OWC collectors, each offering unique hydrodynamic advantages for different deployment scenarios [31,32], alongside advanced control strategies for DEG-based PTOs aimed at optimising energy conversion across varied sea states [33].
Although several studies have investigated OWC-DEG systems, the reported design indicators remain fragmented. Vertechy et al. [33] and Moretti et al. [25] presented analytical and small-scale results for circular-diaphragm DEGs (CD-DEGs) with diameters of 0.25 to 0.39 m, reporting watt-range peak power under wave-tank conditions. This work was extended to L- and U-shaped collectors, achieving 0.87 W and 3.8 W at scales of 1:40 and 1:30, with conversion efficiencies near 18% [31,32,33]. Sea trials at NOEL [25] tested segmented 0.39 m CD-DEGs at 1:8 to 1:10 scale but focused on mechanical resilience rather than electrical performance. Common to these studies, the design indicators (diameter, thickness, prestretch, layer count, and draft) are treated as fixed inputs rather than a coupled design space, and full-scale performance is inferred almost exclusively through Froude scaling, without examining whether the optimal small-scale configuration remains optimal at commercial scale. Wider barriers to adoption, including long-term durability in harsh marine environments, manufacturing scale-up, and cost competitiveness with other renewables, compound this fragmentation and require continued interdisciplinary effort across materials science, hydrodynamics, electrical engineering, and environmental science.
To the authors’ knowledge, no prior work has provided a coupled parametric study of these design indicators for a single OWC-DEG architecture across small and full scales or identified a strain threshold at which the marginal energy gain begins to decline. The present study addresses these gaps and contributes to the field in three respects. First, a coupled sensitivity analysis of four governing design indicators (cylinder draft, membrane diameter, membrane deformation, and number of stacked dielectric layers) is performed for a single vertical flexible OWC architecture, using a consistent modelling chain that combines frequency-domain hydrodynamics (Wave Venture), capacitance and electrical-energy modelling in MATLAB, and finite element analysis in Abaqus. Second, the analysis is conducted across the full scale range from sub-metre laboratory dimensions to a 12 m full-scale prototype, allowing the consistency of design conclusions across scales to be examined rather than assumed solely through Froude similitude. Third, a strain threshold of approximately 32% is identified at which the marginal energy gain per unit stretch begins to decline. This threshold provides a direct design limit linking electrical performance to fatigue-driven sizing, a connection that prior OWC-DEG studies have not quantified. These three contributions together support the translation of parametric results into a draft set of functional specifications for a full-scale device, as discussed in Section 4. The methodology follows a structured design process that begins with site data and then proceeds to concept selection, numerical modelling, validation, and performance assessment.
This paper is organised as follows. Section 2 reviews the key aspects of OWC design, including the PTO system, geometry, materials, and numerical analysis. Section 3 presents a detailed parametric analysis of membrane thickness, number of layers, and structural geometry, using a combination of analytical tools: software developed by Wave Venture Ltd. (based on quasi-static finite element analysis and frequency-domain dynamic analysis) [34], MATLAB, and Abaqus. Section 4 draws conclusions and outlines priorities for further work.
2. Design and Performance Consideration Factors
2.1. Power Take-Off
Choosing the right PTO system is essential when designing OWCs. The PTO is the component that converts the oscillating water’s mechanical energy into usable electricity. Various PTO mechanisms, such as bidirectional and impulse turbines, have been proposed and explored for the OWC technology [35]. Though widely used, bidirectional air turbines show poor efficiency in bidirectional flows [36]. The Wells turbine is a well-known example in this category and is suitable for moderate sea conditions. However, it faces challenges in very energetic seas, and installing a bypass pressure-relief valve is necessary to ensure proper functioning in such conditions [37].
Impulse turbines provide an alternative option, including notable types such as axial-flow and bi-radial impulse turbines. Axial-flow impulse turbines have a broader operational flow range than Wells turbines. However, their peak efficiency remains relatively low, rarely exceeding 50%, limiting their energy conversion efficiency [5]. Bi-radial impulse turbines offer a more efficient solution, achieving peak efficiencies of around 78% and addressing some of the limitations of Wells turbines [38]. Despite their higher efficiency, bi-radial turbines are more complex, which can complicate their design and operation [39].
Rezanejad et al. [26] and López et al. [40] conducted a numerical and experimental analysis to investigate the impact of various wave and turbine parameters on the performance of the OWC. They found that the impact of wave height is less significant than that of turbine damping and incoming wave period. However, the influence of wave height becomes more pronounced at higher wave amplitudes. This reduces the device’s efficiency sensitivity to wave-period changes and tends to maintain a constant value across a wide range of wave periods.
Dielectric elastomers (DEs) are flexible materials that can be used in different applications as actuators, generators, and sensors [41,42,43,44,45]. DEs are particularly well-suited for applications requiring large deformations. Dielectric elastomer generators (DEGs) offer an innovative approach to PTO systems in WECs, effectively addressing the challenges posed by traditional turbines. They are designed to better adapt to harsh sea environments [14], offer low cost, easy installation and maintenance, produce less noise, and are more energy-efficient than traditional turbines [14]. Teillant et al. [15] estimated that DEGs could potentially reduce the Levelized Cost of Energy (LCOE) by at least 50% based on cost and failure rate projections. This makes DEGs a promising alternative to conventional turbine-based PTO systems in OWC setups (Figure 1).
Figure 1.
Working principle of a stacked circular-diaphragm DEG with compliant electrodes: prestretch, inflation under chamber pressure, and the charge–discharge cycle.
2.2. Geometry
The geometry of OWCs is probably the most popular topic, as it strongly influences the efficiency of WECs. As a result, different types of OWCs have been introduced during the last decade, such as object-mediated and hybrid [46], floating OWCs [27], bottom-fixed, floating PD WECs, L-shaped OWC collectors, U-shaped OWC collectors [47] and dynamically tuned PD WEC (DT-PD WEC with DEG on top) [48,49]. L-shaped OWC devices include a horizontal channel parallel to the seabed that serves as an added-mass duct. While this configuration shows potential for onshore applications in shallow waters, its suitability for offshore installations, particularly in large-scale wave farms, is limited. Moretti et al. [28] demonstrated the potential of L-shaped OWCs by achieving 0.87W power output and 18% energy conversion efficiency using a VHB 4905 film-based DEG in wave flume tests. Experimental details are provided in Table 1, with results scaled to a prototype using Froude scaling [50].
Table 1.
Experimental details of L-shaped OWCs.
Several reviews have synthesised how oceanographic conditions (wave period, height, and depth) and chamber geometry (width, opening ratio, front-wall draught) jointly determine OWC hydrodynamic efficiency, with the resonant frequency shifting inversely with chamber width and the optimal opening ratio falling within a narrow range for any given site [51].
Within this broader framework, various theoretical and experimental studies have been conducted to improve the hydrodynamic performance and achieve resonance with target wave frequencies of U-shaped OWC configurations [31,32]. Fox et al. [17] numerically investigated conventional, U-shaped, and L-shaped OWCs, concluding that the U-shaped design offered superior performance. However, López et al. [18] presented contrasting findings through numerical modelling of various OWC configurations in Vigo port, favouring the L-shaped design. Moretti et al. [47] developed a combined hydrodynamic and electro-hyperelastic model for U-shaped oscillating water columns (OWCs). Their experimental prototype achieved a peak power output of 3.8W and 18% conversion efficiency. Table 2 presents the experimental results and Froude-scaled prototype data, demonstrating the potential of U-shaped OWCs with DEG technology for wave energy conversion.
Table 2.
Experimental details of U-shaped OWCs.
2.3. Materials and Structural Considerations
The choice of materials for DEGs significantly impacts their performance and the system’s overall efficiency. In addition to the DE material itself, the selection of stretchable electrodes is crucial to the device’s operation. Table 3 explores various materials used for DEGs and stretchable electrodes, highlighting their properties and potential applications. It will also briefly overview different failure mechanisms and criteria important for the DE materials used in OWC.
Several failure theories have been proposed for dielectric elastomers (DEs), each with its strengths and limitations. Kawabata’s criterion [52] states that failure occurs when the maximum principal stretch reaches a critical value (λu) determined from uniaxial tension tests. While this criterion is effective for TPE materials, it may not accurately predict failure in NR, SBR, and PU materials. Other failure theories include strain energy density at breaking, stresses at breaking (using the Cauchy stress tensor), and equivalent elongation criteria [53]. The equivalent elongation criterion defines a parameter (I) based on the deformation gradient tensor to assess failure. Also, DE materials have several key properties that influence their performance in energy conversion applications:
- Stretchability: The DE’s maximum deformation range determines the achievable capacitance variation.
- Dielectric constant and breakdown electric field: Higher values of these properties lead to greater energy density.
- Viscoelastic losses: Material hysteresis can result in energy dissipation.
- Electric losses: Non-zero DE conductivity can contribute to electrical losses.
- Mechanical stiffness: A high stiffness requires larger mechanical loads to deform the DE, while a low elastic modulus can increase the risk of electromechanical instabilities [54].
DEGs are subject to various failure mechanisms and operational constraints that must be carefully considered in their design and deployment. Excessive stretching of the DE material can rupture the membrane, causing irreversible damage to the device. Exceeding the material’s breakdown strength under an electric field can cause electrical breakdown, rendering the DEG inoperable [55]. Moreover, excessive electric fields can lead to electromechanical buckling, compromising the device’s structural integrity [27]. Factors such as water absorption and oxidation significantly influence the durability of elastomers in marine environments [56,57]. These ageing mechanisms can lead to reduced stretchability, increased stiffness, and reduced material strength, ultimately affecting device performance [19,58]. Considering the typical frequency of ocean waves (approximately 0.2 Hz), DEGs can undergo millions of deformation cycles per year, emphasising fatigue life as a primary concern during the design phase [16]. Strain crystallisation is pivotal in ensuring optimal fatigue life for elastomers [59]. Controlling the crystallisation process is crucial for enhancing material resistance to fatigue and improving durability. Also, studies have shown that applying a pre-strain to elastomers can enhance fatigue resistance while maintaining the same maximum amplitude load [60,61]. This indicates that pre-straining is a valuable technique for improving the durability of DEGs.
Table 3.
Comparison of DE materials and stretchable electrodes.
2.4. Numerical Analysis and Validation
WECs, including flexible OWCs, present distinct challenges due to their dynamic interactions with ocean waves and inherent structural flexibility. These simulations must account for the nonlinear behaviour and the coupling between the flexible structure and the surrounding fluid. Advanced numerical techniques are needed to handle these complexities. This will provide a realistic understanding of the device’s behaviour under various wave scenarios. It is essential to accurately capture these complex dynamics in a numerical model to predict the system’s performance and ensure its long-term reliability.
Reduced-order modelling techniques can simplify these complex interactions, making simulations more computationally efficient while still capturing essential dynamic behaviours [29,72,73]. Although these models are efficient, they have limitations in capturing the intricate details of fluid–structure interaction, especially for large deformations and unsteady flow conditions. Therefore, they are typically used in the initial design and optimisation stages before moving on to more advanced numerical tools. Potential flow models provide a simplified representation of hydrodynamic forces that are limited in capturing complex wave–structure interactions. This theory aids in solving the governing equations of fluid motion, providing an understanding of the hydrodynamic forces, moments, and pressure distributions acting on the flexible structure [74]. Steady-state models focus solely on static equilibrium conditions and provide basic insights, but they fail to capture the dynamic effects that are crucial to WEC operation. Frequency and time-domain models integrate dynamic behaviour through modal analysis, which enhances the model’s ability to predict performance more accurately.
On the other hand, high-fidelity CFD-FEA simulations offer a detailed approach to capturing the complex dynamics of wave–structure interaction. While providing accurate representations of fluid and structural behaviour, these methods are computationally demanding due to intricate meshing requirements and challenges posed by moving boundaries [75,76]. Techniques such as mesh deformation and immersed boundary methods have been developed to address these challenges, each with advantages and drawbacks in terms of computational efficiency and accuracy [23,77]. Huang et al. [21] presented a high-fidelity computational fluid dynamics (CFD) and finite element analysis (FEA) framework to study WECs. They accurately captured fluid–structure interactions and the nonlinear behaviour of the membrane parts, and applied their methodology to OWC with flexible membranes and Anaconda-type WECs. Wang et al. [22] developed a 3D computational model to simulate interactions between FWECs and ocean waves. They analysed the impact of DEG PTO and wave conditions on energy capture and identified optimal parameters for maximising efficiency. They also conducted a detailed computational study to investigate the interactions between waves and multiple WECs arranged in a seawall configuration [78]. They analysed the impact of device spacing and array size on energy output and provided valuable design insights. George et al. [79] studied the challenges of using flexible materials in WECs. They developed a new model to understand how these materials behave over time, enabling predictions of how WECs will perform in real-world conditions. They applied their model to two types of FWECs: submerged pressure-differential and floating bulge-wave attenuators. They showed that FWECs are designed to resist fatigue, which helps them last longer and operate more efficiently.
For OWCs, the numerical model must account for both material properties and the structural response of flexible components, including large membrane deformations. Validation of these models requires extensive experimental testing to ensure accuracy and reliability. These tests include wave-tank experiments, sea trials, and dry-run tests, each offering valuable insights into the performance and potential challenges of flexible OWCs with DEGs. By analysing the results from these experiments, researchers can better understand the system’s dynamic behaviour, optimise the design, and enhance efficiency and durability under real-world conditions.
2.4.1. Dry-Run Experiments
Dry-run setups provide safer, more controlled conditions than wave tank environments. They allow for focused experimentation and facilitate iterative design improvements. In addition to verifying PTO performance and implementing control algorithms [80,81,82], these tests allow for in-depth investigations into structural and material challenges without the constraints of water-based testing (Figure 2) [83]. Abad et al. [84] designed and constructed a new test rig to replicate the membrane behaviour of the flexible OWC and analysed the structural characteristics of flexible membranes. They also introduced a new characterisation process that combined numerical, analytical, and experimental results.
Figure 2.
(a) Schematic of the experimental characterisation setup for an inflated circular-diaphragm DEG, adapted from [83]; (b) BASM-WEC designed dry test rig [85]; and (c) circular-diaphragm DEG in inflated state, adapted from [83].
2.4.2. Wave-Tank Testing
Testing marine energy devices in wave tanks helps evaluate how prototypes perform and respond to controlled wave conditions before deployment at sea. This phase is critical for understanding device behaviour and generating benchmark data to validate numerical models. At Edinburgh University’s wave flume facility, two small-scale bottom-fixed OWC prototypes, scaled at 1:50 and 1:40, were tested under regular wave conditions [85]. Further testing was carried out at the FloWave tank at Edinburgh University, where a 1:50-scale floating OWC and a larger 1:30-scale prototype with an axisymmetric U-shaped collector were examined [24]. These experiments provided important insights into the responses of both bottom-fixed and floating OWCs to wave dynamics, laying a solid foundation for further model development and the exploration of potential design improvements to enhance performance.
2.4.3. Sea Test Site
Sea trials of flexible OWC concepts are crucial for understanding their real-world performance and challenges, providing valuable data on installation, operation, and long-term performance in actual waves and harsh weather.
The sea trials of an OWC with a DEG PTO in the Mediterranean Sea marked a significant advancement in this field. These tests were conducted at the Natural Ocean Engineering Laboratory (NOEL) in Reggio Calabria, Italy, a controlled yet challenging sea test site [25]. In contrast to previous wave-tank tests, which used a single DEG with a full-scale equivalent diameter of around 10 m, this set of sea trials involved multiple DEGs (Table 4).
Table 4.
Experimental parameters and outputs of the U-OWC with circular-diaphragm DEG (CD-DEG) at the NOEL sea test site [14,25].
Each of these DEGs had a diameter of 390 mm, which translates to about 3 m at full scale. This segmented approach to the PTO design makes it easier to manufacture the DEGs and improves the system’s robustness by reducing the impact of potential DEG faults. In these experiments, the focus was on assessing the mechanical performance of DEGs without implementing their electrical activation. This led to evaluating the mechanical resilience and operational stability of the DEGs under real sea conditions.
2.5. Methodology Summary
The modelling chain used in this study consists of three components, each addressing a distinct aspect of the OWC-DEG response. The workflow is sequential: Wave Venture or Abaqus is used to obtain the membrane deformation response, and MATLAB is then used to compute the electrical output from the resulting motion.
Wave Venture (frequency-domain hydrodynamic analysis): The Wave Venture TE (v4.0) software, based on quasi-static finite element analysis coupled with frequency-domain dynamic analysis [34], is used to compute the linear hydrodynamic response of the flexible OWC.
The flexible cylinder is modelled as a vertical, partially submerged hollow body with a deformable membrane closing the top. Linear potential flow theory is assumed, and viscous losses are neglected at this stage. Regular waves of unit amplitude are applied over a frequency range of 0.15 to 0.35 Hz in increments of 0.005 Hz. A constant linear PTO damping coefficient is applied to the membrane to represent the energy extraction by the DEG; the damping is set sufficiently high to ensure numerical stability across the frequency range studied, with the consequence that the absolute power outputs in Section 3.1 should be interpreted as conservative estimates rather than as the upper bound achievable with adaptive control. The cylinder is assumed bottom-fixed, and the mooring is not modelled.
Abaqus (finite element analysis of membrane deformation): Multi-layer membrane configurations are analysed in Abaqus (2023) using an axisymmetric formulation with the CAX4H hybrid element, chosen to handle the near-incompressible response of the silicone material. Four elements are used through the thickness of each layer, in accordance with standard practice for hybrid axisymmetric elements in hyperelastic analysis. Layers are connected through tie constraints at the inter-layer surfaces. The simulation is performed in two steps: a controlled radial displacement is first applied at the membrane rim to achieve the prestretch ratio, λ_p, without a chamber pressure; a uniform air-chamber pressure representative of the wave-induced pneumatic load is then applied to the underside of the prestretched membrane. The boundary conditions are as follows: rim radial displacement prescribed in step 1 and held fixed in step 2, rim out-of-plane displacement constrained to zero throughout, and axis of symmetry at the centre of the membrane. The membrane material is modelled as a hyperelastic, incompressible Mooney–Rivlin solid for the multi-layer cases and as an Ogden solid for the single-layer baseline runs, which are validated against the analytical model of Moretti et al. [28]; the corresponding parameters are provided in the relevant data tables. The axisymmetric Mooney–Rivlin formulation used here is the standard approach for hyperelastic membrane inflation and reproduces the analytical spherical-cap pressure–displacement relation for single-layer circular diaphragms to within a few per cent, supporting its use for multi-layer configurations for which no closed-form solution exists.
MATLAB (capacitance and electrical-energy modelling): The membrane tip displacement, h(t), and the principal stretch, λ(t), computed from Wave Venture, or from Abaqus in the multi-layer cases, are exported as time histories and used as inputs to an in-house MATLAB (R2023b) code. The code implements the lumped-parameter electromechanical model of Vertechy et al. [86] for a circular-diaphragm DEG operating under the constant-electric-field control strategy of Moretti et al. [28]: an electric field E_BD is applied when h·ḣ is negative, and the field is removed when h·ḣ is positive. The instantaneous capacitance, C(h); the instantaneous voltage, V; and the stored electrostatic energy are computed using Equations (1)–(4). The energy harvested per wave cycle is obtained by integrating the change in stored electrostatic energy over the cycle, and the cycle-averaged power is the cycle energy divided by the wave period. Reported power-output values throughout Section 3 refer to the cycle-averaged power unless explicitly identified as peak values.
A high-fidelity two-way CFD-FEA coupling for an equivalent architecture has been reported by Huang et al. [21], and the present results are consistent with their findings within the parameter ranges for which direct comparison is possible.
3. Energy Generation: Parameter Effects
The WEC dimensions should be adjusted based on performance assessment results to improve energy conversion efficiency. For flexible OWC, this may involve modifying the dimensions of the OWC chamber, the mechanical characteristics and geometry of the membrane part, the control method, or other components to achieve the desired power output while maintaining structural integrity. Using DEGs as the PTO in OWCs can increase the design complexity due to the highly nonlinear nature of elastomers and the need to accommodate large deformations for energy production. These parameters include the diameter-to-thickness ratio, draft depth, material properties, and membrane prestretching. Therefore, in this study, the effects of the OWC diameter, draft length, flexible membrane thickness, and DEG layer number on power output were investigated. The OWC WEC model studied by Moretti et al. [27] is chosen as the analysis object in the present work. In Figure 3, a flexible membrane is attached to the top of the cylinder under the influence of wave action.
Figure 3.
Schematic diagram of flexible OWC.
The numerical methodology underlying the results in this section is summarised in Section 2.5, which describes the Wave Venture frequency-domain analysis, the MATLAB capacitance and energy modelling, and the Abaqus finite element analysis of the multi-layer membrane configurations.
The alternating pressure difference between the interior and exterior of the cylinder creates periodic fluctuations, causing the upper flexible membrane to deform cyclically. This periodic deformation enables the conversion of the elastic potential energy of the flexible membrane into electrical energy through the DEG. Except as noted, the properties listed in Table 5 are for the DEG component. In some cases, a different membrane with different properties is used.
Table 5.
Properties of flexible material ().
Throughout this section, the following terminology is used. Energy refers to the electrostatic energy harvested per wave cycle, denoted (J). Average power refers to the cycle-averaged power output, , where T is the wave period; this is the quantity plotted in all power-versus-parameter figures and reported in the comparison tables. Peak power is the maximum instantaneous power during the wave cycle and is reported only when explicitly identified.
3.1. The Effect of the Draft
To assess the impact of the draft on membrane deformation and power output, an OWC with cylinder drafts ranging from 6 to 12 m was simulated in Wave Venture software. The geometry dimensions are summarised in Table 6.
Table 6.
Geometric and operational parameters used in the cylinder draft sensitivity study.
The simulated deformation amplitude of the flexible membrane is presented in Figure 4, with the dimensionless ratio, , plotted against the incident wave frequency over the range 0.15 to 0.35 Hz. Each curve corresponds to a fixed cylinder draft between 6 m and 12 m.
Figure 4.
Deformation amplitude of the flexible membrane with different drafts.
For every draft, the response exhibits clear resonance at the wave frequency, matching the natural frequency of the flexible OWC. As the draft increases from 6 m to 12 m, the resonant frequency shifts monotonically from approximately 0.29 Hz down to approximately 0.22 Hz, consistent with the heavier oscillating water mass at greater drafts. The peak value of lies between approximately 0.04 and 0.05 across the full range of drafts, a variation of less than 10%. The draft, therefore, primarily serves as a frequency-tuning parameter rather than an amplitude-control parameter: it determines where the system resonates but has little effect on how strongly it resonates. This has a direct design implication: the draft should be selected to align the natural frequency with the modal frequency of the deployment site, while the response amplitude is governed by other parameters (diameter, prestretch, and PTO damping) examined in the subsequent subsections.
Using the membrane deformation from Figure 4 as input to the constant-electric-field energy model (Equations (1)–(4)), the cycle-averaged power output of the device is shown in Figure 5 as a function of wave frequency, with curves corresponding to drafts of 6 m to 12 m [27,40]. The power-output peaks track the deformation peaks, shifting from approximately 0.29 Hz at = 6 m to approximately 0.22 Hz at = 12 m. The peak power varies between approximately 0.04 kW and 0.05 kW across the draft range, again reflecting that the draft governs the location of resonance rather than its strength. The absolute power values reported here should be interpreted as conservative estimates, since a constant and relatively high PTO damping coefficient was applied in the simulations to maintain numerical stability; this damping level is unlikely to reflect the optimal real-world tuning of a deployed device, and the calibrated diameter sweep in Figure 6 is therefore a more reliable indicator of the absolute power-scaling behaviour. The design implication of Figure 5, taken together with Figure 4, is that draft selection for a given site is a tuning exercise: the draft should be chosen such that the resonant frequency falls within the dominant frequency band of the site’s wave climate, after which other parameters can be used to maximise the peak amplitude.
Figure 5.
The estimated power output of the flexible OWC WEC with different drafts.
Figure 6.
Effect of diameter on generated electrical power.
3.2. The Effect of the Membrane Diameter
To investigate the impact of DEG diameter on power output, simulations were conducted using a 6 m diameter DEG as the baseline. The MATLAB capacitance and energy model was verified against the analytical and numerical results reported by Moretti et al. [27,28] for a single-layer CD-DEG at full scale, operating under the constant-electric-field control strategy. The comparison uses the same membrane diameter, undeformed thickness, prestretch ratio, dielectric properties, and breakdown field as the reference. Across the examined wave-frequency range, the present implementation reproduces the average power per cycle predicted by [27,28] to within a few percentage points. This confirms the accuracy of the current workflow, with the best agreement observed near the resonance frequency. The remaining small discrepancy is attributable to differences in how membrane stretch is computed: an analytical spherical-cap approximation in [27,28] versus the same formula in the present work, with a more refined treatment of the rim boundary condition. The OWC dimensions and material properties of the DEGs are shown in Table 7.
Table 7.
Constitutive and electrical parameters of the silicone-rubber DEG used in the single-layer analyses.
Various control strategies and electronic circuits are used to calculate electrical power output for different application targets [33]. This study uses the constant electric-field method, which fully complies with the Froude scaling law, as shown in Figure 6.
In practical applications, the membrane tip oscillations vary in amplitude from cycle to cycle due to the system’s dynamic nature. This affects its capacitance, which fluctuates between its minimum (when the membrane is flat) and its maximum (when the membrane is fully extended). For a constant electric field controller, the electrical activation is determined by the instantaneous values of h and : an electric field of magnitude, , is applied when is negative, and the field is removed when is positive [27]. The electrostatic energy, , stored in the DEG is given by the product of its capacitance and the square of the applied voltage [47,86]:
The capacitance of the DEG is expressed as a function of the membrane tip displacement:
The voltage across the DEG is, in turn, expressed as a function of the principal stretch at the centre of the membrane:
And the principal stretch given by the following:
The membrane is assumed to deform into a perfect spherical cap of radius under uniform pressure, valid for . Under uniform pressure, valid for λ corresponds to both the latitudinal and longitudinal stretch ratios.
Figure 6 shows the average power output per wave cycle plotted against DEG diameter, evaluated over the range 0.4 to 12 m using two independent methods. In Method 1, the power output was obtained at a single baseline diameter and then scaled to other diameters using the Froude scaling law. In Method 2, the diameter, wave height, and wavelength were rescaled together before re-running the MATLAB capacitance and energy model from first principles at each diameter.
The two methods agree to within 1.5% across the full range, which confirms two points: the in-house code is internally consistent (since the same baseline is reproduced through two independent computational paths), and the constant-electric-field controller used in this study is compatible with Froude similitude (since the agreement of the two methods would otherwise break down). With this consistency established, the dominant trend in Figure 6 is the strong increase in power output with diameter. The relationship is approximately cubic, growing from less than 0.5 W at = 1 m to approximately 6 × 10⁵ W at = 12 m. This scaling reflects the combined effect of the larger swept area, the greater deformation amplitude at fixed strain, and the greater capacitance variation per unit voltage. The practical implication is a clear preferred range: diameters below 5 m yield power outputs that are too low to justify the device footprint, while diameters above 12 m introduce manufacturing, transport, and maintenance challenges that grow disproportionately with size. The range 5 to 12 m therefore emerges as the design corridor within which the present architecture is expected to be most cost-effective.
To examine the impact of diameter on the frequency response, membrane deformation, and power output, OWCs with diameters ranging from 4 to 12 m were simulated in Wave Venture. The simulation conditions are summarised in Table 8.
Table 8.
Geometric and operational parameters used in the membrane diameter sensitivity study.
Figure 7 presents the dimensionless membrane deformation amplitude, , as a function of wave frequency for OWC diameters ranging from 4 m to 12 m, with all other parameters held at the values listed in Table 8.
Figure 7.
Deformation amplitude of the flexible membrane with different diameters.
Two trends are clearly visible. First, the resonant frequency decreases monotonically with diameter, shifting from approximately 0.32 Hz at = 4 m to approximately 0.26 Hz at = 12 m; this reflects the increase in effective inertia of the oscillating water column and the reduction in membrane stiffness per unit area at larger diameters. Second, and more significantly, the peak amplitude itself increases strongly with diameter, from approximately 0.03 at = 4 m to approximately 0.14 at = 12 m, a factor of more than 4. In contrast to the draft sweep of Figure 4, where the peak amplitude was nearly constant, the diameter sweep here shows that the diameter influences both the location and the strength of the resonance. This is the underlying mechanism that explains the diameter-dominated power scaling observed in Figure 6 and Figure 8.
Figure 8.
Estimated power output of the flexible OWC WEC with different diameters.
Figure 8 presents the corresponding cycle-averaged power output as a function of frequency for the same diameter range. The trend mirrors Figure 7 but with steeper scaling: the peak power increases from approximately 0.02 kW at = 4 m to approximately 0.35 kW at = 12 m, a factor of approximately 18. This is consistent with the cubic dependence identified in Figure 6, since the present sweep uses a finer frequency resolution and explicitly resolves the resonant peak at each diameter. The frequency at which the peak power occurs shifts in step with the deformation resonance in Figure 7. Two design observations follow. First, for any given target site, the diameter should be selected so that the resonance lies within the dominant frequency band of the local wave climate; under-tuned and over-tuned configurations both lose a significant fraction of the available power. Second, the rapid increase in peak power with diameter justifies the upper-bound recommendation of approximately 12 m identified in Figure 6 only when the resonance can be maintained within the operational frequency band; beyond this diameter, the resonance moves below typical site frequencies, and the apparent power advantage is not realised in practice.
3.3. The Effect of the Membrane Deformation
The inherent flexibility of dielectric elastomer generators (DEGs) allows them to undergo significant deformation in response to wave conditions and the air pressure in the air chamber. If allowed to exceed a certain limit, DEGs are more likely to experience various forms of failure, especially fatigue failure. This section will analyse how deformation affects the power output of DEGs. The material properties of the membrane are listed in Table 7. Figure 9 presents the relationship between cycle-averaged power output, membrane tip displacement, and engineering strain for two representative DEG diameters: 4 m in panels (a) and (b), and 10 m in panels (c) and (d). The membrane thickness was scaled according to the Froude scaling law so that the two cases share the same dimensionless geometry, allowing the strain dependence to be assessed independently of absolute scale. In panels (a) and (c), the power output rises monotonically with tip displacement, but the rate of increase changes character as the displacement grows. A linear extrapolation of the initial slope (shown as a dashed red line) over-predicts the actual power output (black solid curve) once the tip displacement exceeds approximately 1.0 m for the 4 m diameter case and approximately 2.5 m for the 10 m diameter case, indicating that the marginal power gain per unit additional deformation begins to decline beyond these points. Panels (b) and (d) re-cast the same data against engineering strain to reveal a scale-invariant feature: in both cases, the change in slope occurs at a strain of approximately 32%. Below this strain, the system behaves nearly linearly, with each additional percentage of strain delivering a near-constant increment in power; above it, the curve flattens, and further stretching yields progressively smaller gains. This 32% threshold has two practical implications. First, it sets a soft upper bound on the operational strain the controller should target during the most probable sea state, since exceeding this value increases fatigue loading without a commensurate increase in power. Second, it provides a direct link between electrical performance and fatigue-driven sizing, since the strain margin between the operating point and the threshold can be translated into an expected number of cycles to failure once material-specific fatigue data are available.
Figure 9.
Correlation between membrane deformation, strain, and power output for (a,b) 4 m diameter DEG and (c,d) 10 m diameter DEG.
3.4. The Effect of Membrane Layers and Thickness
This section examines the effect of the DEG’s number of layers on the OWC’s power output. All simulations are conducted under identical wave conditions and damping coefficients, with the air chamber’s internal pressure set at 1 kPa. Each membrane layer is uniformly prestretched to a factor of 1.2, resulting in a final thickness of 7.1 cm per layer and a diameter of 8 m. Simulations are conducted for membrane configurations with n ranging from 1 to 4. Silicon is selected as the membrane material, and its Mooney–Rivlin parameters are detailed in Table 9.
Table 9.
Hyperelastic material constants used in the Abaqus multi-layer finite element analysis.
Figure 10 illustrates the Abaqus simulation setup described in Section 2.5. Panel (a) shows the deformed shape of the membrane after the prestretch step alone, in which a controlled radial displacement is applied at the rim to achieve the target prestretch ratio of 1.2 without any chamber pressure. Panel (b) shows the deformed shape after the second loading step, in which a uniform internal pressure representative of the air-chamber pressure under the modal sea state is applied to the underside of the prestretched membrane. The colour field in both panels represents the maximum principal nominal strain. Panel (c) illustrates the axisymmetric CAX4H mesh used, and panel (d) shows the boundary conditions, with the rim radial displacement prescribed in step 1 and held fixed in step 2, the rim out-of-plane displacement constrained throughout, and the axis of symmetry along the centreline. In panels (a), (b), and (d), the orange and blue arrows represent the applied loads and prescribed boundary condition constraints.
Figure 10.
Abaqus simulation: (a) deformed shape under prestretch; (b) deformed shape under combined prestretch and chamber pressure; (c) axisymmetric mesh; and (d) boundary conditions and loading.
Figure 11 presents the time history of the membrane tip displacement over a single wave cycle of period 7 s, for one to four layers of the thicker membrane configuration (7.1 cm per layer after prestretch). The single-layer case attains a peak tip displacement of approximately 2.5 m, while the two-, three-, and four-layer cases reach approximately 1.0 m, 0.6 m, and 0.4 m, respectively. The progressive reduction in displacement reflects the increase in equivalent stiffness as additional layers are added: each layer contributes a parallel elastic resistance to the chamber pressure, resulting in a correspondingly smaller deformation. This trend is consistent with the analytical spherical-cap pressure–displacement relation when the layer count scales the total membrane thickness.
Figure 11.
Tip displacement of the thicker flexible membrane (7.1 cm per layer after prestretch) for varying numbers of layers over a single wave cycle.
The same analysis was repeated for a thinner membrane configuration to isolate the effect of layer thickness on the response. The geometry, prestretch ratio, and material properties are unchanged from the previous case; only the undeformed thickness was reduced, so that each layer reached a final post-prestretch thickness of 6 cm. Figure 12 shows the corresponding tip-displacement time histories.
Figure 12.
Tip displacement of the thinner flexible membrane (6 cm per layer after prestretch) for varying numbers of layers over a single wave cycle.
As expected from the reduced layer stiffness, the peak tip displacement at each layer count is larger than in the thicker case: approximately 3.3 m, 1.5 m, 0.9 m, and 0.6 m for one to four layers, respectively. The trend in layer count remains qualitatively the same: the peak displacement decreases as additional layers are added, but the absolute values are approximately 30–50% higher than the corresponding values in Figure 11.
After completing simulations for membranes with different layers (n = 1, 2, 3, 4), the tip displacement was recorded, and the energy was subsequently calculated using Equations (1)–(4).
Figure 13 presents the cycle-averaged power output as a function of the number of layers, for both the thicker (7.1 cm per layer) and the thinner (6 cm per layer) configurations. Despite the reduction in tip displacement with increasing layer count observed in Figure 11 and Figure 12, the total power output rises with the number of layers in both cases. This apparently counterintuitive result is explained by the structure of the capacitance model in Equation (2): the DEG capacitance scales with the square of the layer count, so even when each layer experiences a smaller stretch, the multiplicative increase in capacitance more than compensates, leading to an increase in the net stored electrostatic energy per cycle.
Figure 13.
Power output versus number of layers for both thick and thin flexible membrane configurations.
For four layers, the thinner configuration delivers approximately W of cycle-averaged power, compared with approximately W for the thicker configuration, an increase of approximately 14%. The advantage of the thinner configuration stems from its greater deformation per layer at the same chamber pressure, which translates into a higher breakdown voltage at the breakdown-field operating point and, hence, greater stored energy. The design implication is twofold. First, stacking thin layers is more effective than using a single thick membrane of equivalent total thickness. Second, the marginal gain from adding further layers diminishes, with the increment from three to four layers being smaller than that from two to three; beyond approximately four layers, manufacturing complexity is likely to dominate the trade-off, and the additional electrical benefit will not justify the increased fabrication risk.
Compared with thicker membranes, thinner ones produce more energy. This is expected, as thinner multi-layer membranes undergo greater deformation, leading to higher energy output. However, advancements in manufacturing technology are still needed to produce multi-layer membranes at the extremely thin thicknesses required for optimal performance.
Complementing the time-domain Abaqus analysis above, the frequency-domain hydrodynamic response of the multi-layer flexible OWC was computed in Wave Venture. For computational efficiency, the multi-layer effect was represented in this analysis by an equivalent thicker single membrane, with the total thickness scaled in proportion to the layer count, as summarised in Table 10. Figure 14 presents the resulting deformation amplitude, , as a function of wave frequency for layer counts ranging from 1 to 5. The peak deformation occurs near 0.295 Hz in all cases and decreases monotonically with layer count, from approximately 0.05 for a single layer to approximately 0.012 for five layers. The reduction reflects the same stiffening mechanism observed in Figure 11 and Figure 12: the equivalent thicker membrane resists chamber pressure more strongly and therefore deforms less under identical wave forcing. The resonant frequency is largely insensitive to the layer count, indicating that the layer count primarily affects the response amplitude rather than its frequency, in contrast to the diameter and draft parameters examined earlier.
Table 10.
Layer count and equivalent membrane thickness specifications used in the multi-layer frequency-domain analysis.
Figure 14.
Deformation amplitude of the flexible membrane for different numbers of layers.
Figure 15 presents the corresponding cycle-averaged power output for the same layer counts. The trend reverses that of Figure 14: the peak power increases with layer count, from approximately 0.05 kW for a single layer to approximately 0.24 kW for five layers, a factor of approximately five. As discussed in connection with Figure 13, this is a direct consequence of the n2 scaling of the DEG capacitance, which more than compensates for the reduction in per-layer deformation. The peak power occurs at the same resonant frequency identified in Figure 14, confirming that the hydrodynamic resonance sets the optimal operating frequency and is not shifted by the electrical characteristics of the layer stack. The combined message of Figure 13, Figure 14 and Figure 15 is therefore consistent: multi-layer configurations deliver higher power output than single-layer membranes of equivalent total thickness; the gain is dominated by capacitance scaling rather than deformation; and the marginal benefit diminishes beyond approximately three to four layers. The smaller power multiplier reported here, compared with Figure 13, reflects the equivalent-thickness modelling assumption used in the frequency-domain analysis, which treats the multi-layer stack as a single, thicker membrane and therefore does not capture the full n2 capacitance scaling observed in the explicit multi-layer Abaqus model.
Figure 15.
The estimated power output of the flexible OWC WEC for different numbers of layers.
4. Conclusions
This study has provided a coupled parametric analysis of the design indicators that govern the performance of a vertical flexible OWC equipped with a circular-diaphragm dielectric elastomer generator. Combining frequency-domain hydrodynamic analysis (Wave Venture), MATLAB-based capacitance and energy modelling, and Abaqus finite element simulations, four governing parameters were identified, and their effects were quantified.
4.1. Principal Findings
The principal findings from the parametric study are summarised below:
- Draft: The draft sets the OWC’s natural frequency and should be tuned to the modal frequency of the deployment site. Varying the draft from 6 m to 12 m shifts the resonance frequency from approximately 0.29 Hz to 0.22 Hz, while the peak deformation amplitude remains within ±8%. The draft, therefore, acts as a tuning parameter rather than an amplitude-control parameter.
- Membrane diameter: Diameter has the strongest single influence on power output, growing approximately as the cube of diameter up to about 12 m. Beyond this range, manufacturing, transport, and maintenance considerations dominate, and the gain in power output no longer justifies the additional engineering cost. The preferred diameter range identified here is conditional on the assumptions of linear hydrodynamics, constant PTO damping, and constant-electric-field control; site-specific factors such as water depth, dominant wave period, and manufacturing constraints may shift the range in practice.
- Membrane deformation and strain threshold: A critical strain of approximately 32% was identified in the present simulations, above which the marginal increase in generated power per unit stretch declines. This value is specific to the silicone material model used in this study (Table 9) and to the constant-electric-field control strategy; for other dielectric materials, particularly acrylics with substantially larger limiting stretches, the threshold may differ. The 32% value should therefore be interpreted as a design indicator for fatigue-margin selection rather than as a universal material limit. It provides a direct link between electrical performance and fatigue-driven sizing, a connection that has not previously been quantified for OWC-DEG systems.
- Layer count and thickness: Multi-layer configurations outperform single-thick layers of equivalent total thickness because the same hydrostatic and pneumatic loads produce a larger total deformation across thinner layers. The benefit is most pronounced in moving from one to three layers, with diminishing returns thereafter.
4.2. Draft Functional Specifications for a First-Generation Full-Scale Device
Translated into draft functional specifications for a first-generation, full-scale OWC-DEG targeting Northern European wave climates (mean energy period 7 to 9 s), the parametric findings suggest the following baseline configuration:
- Cylinder draft: 9 to 10 m to align the natural frequency near 0.13 Hz.
- Membrane diameter: 8 to 10 m, as a compromise between power output and manufacturability.
- Prestretch ratio: 1.2 to 3, depending on the chosen dielectric material.
- Operational strain: Capped at 30% during the most probable sea state, preserving margin against the 32% threshold for fatigue life.
- Membrane stack: Three to four layers of 6-to-7 cm post-prestretch thickness, using a silicone-based dielectric.
- Control strategy: Constant-electric-field control referenced to membrane displacement and its rate of change.
These values should be treated as a starting point for site-specific concept selection rather than as universal targets. Departures from this baseline are expected for sites with shorter or longer dominant wave periods, for alternative dielectric materials (notably acrylics with substantially larger limiting stretches), and for breakwater-integrated layouts where the host structure sets the geometric envelope.
4.3. Real-World Challenges and Future Work
The translation of the parametric results into the draft functional specifications above represents a starting point for site-specific concept selection rather than a demonstration of commercial readiness. Several real-world challenges remain. The manufacturing of large-area, multi-layer dielectric membranes with consistent thickness and electrode coverage is not yet a mature industrial process and represents the principal barrier to scale-up. Long-term durability under the combined action of cyclic strain, seawater exposure, UV radiation, and biofouling is not captured by short-duration laboratory testing, and standardised marine ageing protocols for dielectric elastomers are still lacking. The control strategy assumed in this study, a constant electric field, is provably suboptimal for irregular seas; adaptive or model-predictive controllers that explicitly respect the strain limit identified here are a priority for future work. Beyond the device-level scope of the present study, dual-purpose deployments in which a WEC is integrated into a breakwater have been proposed as one route to reducing the effective LCoE through shared infrastructure and coastal-protection co-benefits [87,88]. Boodoo et al. [89] recently quantified this effect using a techno-economic framework that explicitly monetises the avoided-erosion benefit alongside conventional electricity revenue, showing that the inclusion of dual-purpose co-benefits can substantially shift LCoE projections in favour of breakwater-integrated configurations. Assessment of the current OWC-DEG architecture within this dual-purpose framework is part of the follow-up work outlined below. Finally, the LCoE projection of Teillant et al. [15] is sensitive to the membrane failure rate, which depends in turn on the strain margin chosen relative to the 32% threshold identified above; cost models should be updated as fatigue data on full-scale samples become available, and a full techno-economic analysis incorporating these cost categories is identified as future work.
Ongoing work by the authors extends the present framework towards a formal multi-objective optimisation that couples the parametric sensitivity results with explicit fatigue-life and techno-economic objective functions, incorporating stochastic sea states and dual-purpose deployment benefits where applicable. These developments will be the subject of a follow-up paper.
Author Contributions
Conceptualisation, F.A., S.L., Y.H., S.D., L.Y., Q.X. and F.B.; methodology, F.A., S.L. and F.B.; software, F.A., S.L., Y.H., Q.X. and F.B.; validation, F.A. and Y.H.; formal analysis, F.A., S.L., Y.H. and S.D.; investigation, F.A., S.L., Y.H., S.D. and F.B.; resources, S.L. and F.B.; data curation, F.A.; writing—original draft preparation, F.A.; writing—review and editing, S.L. and Y.H.; visualisation, F.A. and Y.H.; supervision, S.L. and F.B.; project administration, S.L. and F.B.; funding acquisition, S.L., S.D., L.Y., Q.X. and F.B. All authors have read and agreed to the published version of the manuscript.
Funding
This research was funded by the Engineering and Physical Sciences Research Council (EPSRC), grant number EP/V040553/1.
Data Availability Statement
The data presented in this study are available upon request from the corresponding author. The data are not publicly available because they are part of an ongoing study.
Acknowledgments
This work was supported by the Centre for Bionic Adaptive Stretchable Materials for Wave Energy Converters (BASM-WEC) under grant number EP/V040553/1 from the UK Engineering and Physical Sciences Research Council (EPSRC). The financial support from Xodus Group for Farhad Abad to work on this study is greatly acknowledged.
Conflicts of Interest
Author Farhad Abad was employed by the Xodus Group. The remaining authors declare that this research was conducted in the absence of any commercial or financial relationships that could be construed as a potential conflict of interest.
Abbreviations
The following abbreviations and symbols are used in this manuscript:
| CD-DEG | Circular-diaphragm dielectric elastomer generator |
| CFD | Computational fluid dynamics |
| DE | Dielectric elastomer |
| DEG | Dielectric elastomer generator |
| FEA | Finite element analysis |
| FSI | Fluid–structure interaction |
| LCOE | Levelised cost of energy |
| NOEL | Natural Ocean Engineering Laboratory |
| OWC | Oscillating water column |
| PDMS | Polydimethylsiloxane |
| PTO | Power take-off |
| SWCNT | Single-walled carbon nanotube |
| TPE | Thermoplastic elastomer |
| WEC | Wave energy converter |
| Membrane deformation amplitude (m) | |
| Wave amplitude (m) | |
| Capacitance of the DEG (F) | |
| Mooney–Rivlin hyperelastic constants (Pa) | |
| Membrane diameter (m) | |
| Membrane thickness (m) | |
| Cylinder draft (m) | |
| Applied electric field (V/m) | |
| Breakdown electric field (V/m) | |
| Frame radius (prestretch radius) (m) | |
| Wave frequency (Hz) | |
| Membrane tip displacement (m) | |
| Time derivative of tip displacement (m/s) | |
| Air chamber height (m) | |
| Hyperelastic limiting stretch parameter (dimensionless) | |
| Number of membrane layers (dimensionless) | |
| Spherical cap radius of deformed membrane (m) | |
| Undeformed membrane thickness (m) | |
| Total membrane thickness (m) | |
| Voltage applied across the DEG (V) | |
| Dielectric permittivity (F/m) | |
| F/m) | |
| Principal stretch ratio at membrane centre (dimensionless) | |
| Prestretch ratio (dimensionless) | |
| Dielectric material density (kg/m3) | |
| Energy density (kJ/kg) | |
| Poisson ratio |
References
- Foteinis, S. Wave energy converters in low energy seas: Current state and opportunities. Renew. Sustain. Energy Rev. 2022, 162, 112448. [Google Scholar] [CrossRef] [Scilit]
- Zhu, G.; Samuel, J.; Zheng, S.; Hughes, J.; Simmonds, D.; Greaves, D. Numerical investigation on the hydrodynamic performance of a 2D U-shaped Oscillating Water Column wave energy converter. Energy 2023, 274, 127357. [Google Scholar] [CrossRef] [Scilit]
- Collins, I.; Hossain, M.; Dettmer, W.; Masters, I. Flexible membrane structures for wave energy harvesting: A review of the developments, materials and computational modelling approaches. Renew. Sustain. Energy Rev. 2021, 151, 111478. [Google Scholar] [CrossRef] [Scilit]
- Babarit, A.; Hals, J.; Muliawan, M.J.; Kurniawan, A.; Moan, T.; Krokstad, J. Numerical benchmarking study of a selection of wave energy converters. Renew. Energy 2012, 41, 44–63. [Google Scholar] [CrossRef] [Scilit]
- Pecher, A.; Kofoed, J.P. Handbook of Ocean Wave Energy; Springer Nature: Berlin/Heidelberg, Germany, 2017. [Google Scholar]
- Penalba, M.; Ringwood, J.V. A review of wave-to-wire models for wave energy converters. Energies 2016, 9, 506. [Google Scholar] [CrossRef] [Scilit]
- Weber, J. WEC Technology Readiness and Performance Matrix–finding the best research technology development trajectory. In Proceedings of the 4th International Conference on Ocean Energy, Dublin, Ireland, 17–19 October 2012. [Google Scholar]
- Ingram, D.M. Protocols for the Equitable Assessment of Marine Energy Converters; The University of Edinburgh: Edinburgh, UK, 2011. [Google Scholar]
- Holmes, B.; Nielsen, K. Guidelines for the Development & Testing of Wave Energy Systems; OES-IA Annex II Task 2.1; Hydraulics and Maritime Research Centre (HMRC), University College Cork (UCC) for OES-IA: Cork, Ireland, 2010. [Google Scholar]
- Day, A.; Babarit, A.; Fontaine, A.; He, Y.-P.; Kraskowski, M.; Murai, M.; Penesis, I.; Salvatore, F.; Shin, H.-K. Hydrodynamic modelling of marine renewable energy devices: A state of the art review. Ocean Eng. 2015, 108, 46–69. [Google Scholar] [CrossRef] [Scilit]
- Falcão, A.F.d.O. Wave energy utilization: A review of the technologies. Renew. Sustain. Energy Rev. 2010, 14, 899–918. [Google Scholar] [CrossRef] [Scilit]
- Ochs, M.E.; Bull, D.L. Technological Cost-Reduction Pathways for Oscillating Water Column Wave Energy Converters in the Marine Hydrokinetic Environment; Sandia National Lab. (SNL-NM): Albuquerque, NM, USA, 2013.
- Mork, G.; Barstow, S.; Kabuth, A.; Pontes, M.T. Assessing the global wave energy potential. In Proceedings of the International Conference on Offshore Mechanics and Arctic Engineering, Shanghai, China, 6–11 June 2010; pp. 447–454. [Google Scholar]
- Moretti, G.; Herran, M.S.; Forehand, D.; Alves, M.; Jeffrey, H.; Vertechy, R.; Fontana, M. Advances in the development of dielectric elastomer generators for wave energy conversion. Renew. Sustain. Energy Rev. 2020, 117, 109430. [Google Scholar] [CrossRef] [Scilit]
- Teillant, B.; Moretti, G.; Vertechy, R.; Fontana, M.; Monk, K.; Alves, M.-F. Techno-economic comparison between air turbines and dielectric elastomer generators as power take off for oscillating water column wave energy converters. In Proceedings of the 11th European Wave & Tidal Energy Conference, Nantes, France, 6–11 September 2015. [Google Scholar]
- Chiba, S.; Waki, M.; Jiang, C.; Takeshita, M.; Uejima, M.; Arakawa, K.; Ohyama, K. The Possibility of a High-Efficiency Wave Power Generation System Using Dielectric Elastomers. Energies 2021, 14, 3414. [Google Scholar] [CrossRef] [Scilit]
- Fox, B.N.; Gomes, R.P.F.; Gato, L.M.C. Analysis of oscillating-water-column wave energy converter configurations for integration into caisson breakwaters. Appl. Energy 2021, 295, 117023. [Google Scholar] [CrossRef] [Scilit]
- López, I.; Carballo, R.; Fouz, D.M.; Iglesias, G. Design Selection and Geometry in OWC Wave Energy Converters for Performance. Energies 2021, 14, 1707. [Google Scholar] [CrossRef] [Scilit]
- Le Gac, P.Y.; Le Saux, V.; Paris, M.; Marco, Y. Ageing mechanism and mechanical degradation behaviour of polychloroprene rubber in a marine environment: Comparison of accelerated ageing and long term exposure. Polym. Degrad. Stab. 2012, 97, 288–296. [Google Scholar] [CrossRef] [Scilit]
- Madsen, F.B.; Daugaard, A.E.; Hvilsted, S.; Skov, A.L. The Current State of Silicone-Based Dielectric Elastomer Transducers. Macromol. Rapid Commun. 2016, 37, 378–413. [Google Scholar] [CrossRef] [Scilit] [PubMed]
- Huang, Y.; Xiao, Q.; Idarraga, G.; Yang, L.; Dai, S.; Abad, F.; Brennan, F.; Lotfian, S. Novel computational fluid dynamics-finite element analysis solution for the study of flexible material wave energy converters. Phys. Fluids 2023, 35, 083611. [Google Scholar] [CrossRef] [Scilit]
- Wang, C.; Wei, Y.; Chen, W.; Huang, L. Hydroelastic modelling of a deformable wave energy converter including power take-off. Mar. Struct. 2024, 98, 103678. [Google Scholar] [CrossRef] [Scilit]
- Shabara, M.A.; Zou, S.; Abdelkhalik, O. Numerical investigation of a variable-shape buoy wave energy converter. In Proceedings of the International Conference on Offshore Mechanics and Arctic Engineering, Virtual, 21–30 June 2021; p. V009T009A013. [Google Scholar]
- Ingram, D.; Wallace, R.; Robinson, A.; Bryden, I. The design and commissioning of the first, circular, combined current and wave test basin. In Proceedings of the Oceans, Taipei, Taiwan, 7–10 April 2014. [Google Scholar]
- Moretti, G.; Malara, G.; Scialò, A.; Daniele, L.; Romolo, A.; Vertechy, R.; Fontana, M.; Arena, F. Modelling and field testing of a breakwater-integrated U-OWC wave energy converter with dielectric elastomer generator. Renew. Energy 2020, 146, 628–642. [Google Scholar] [CrossRef] [Scilit]
- Rezanejad, K.; Guedes Soares, C.; López, I.; Carballo, R. Experimental and numerical investigation of the hydrodynamic performance of an oscillating water column wave energy converter. Renew. Energy 2017, 106, 1–16. [Google Scholar] [CrossRef] [Scilit]
- Moretti, G.; Rosati, G.P.P.; Alves, M.; Grases, M.; Vertechy, R.; Fontana, M. Analysis and design of an oscillating water column wave energy converter with dielectric elastomer power take-off. In Proceedings of the International Conference on Offshore Mechanics and Arctic Engineering, St. John’s, NL, Canada, 31 May–5 June 2015; p. V009T009A023. [Google Scholar]
- Moretti, G.; Papini, G.P.R.; Righi, M.; Forehand, D.; Ingram, D.; Vertechy, R.; Fontana, M. Resonant wave energy harvester based on dielectric elastomer generator. Smart Mater. Struct. 2018, 27, 035015. [Google Scholar] [CrossRef] [Scilit]
- Rosati Papini, G.P.; Vertechy, R.; Fontana, M. Dynamic model of dielectric elastomer diaphragm generators for oscillating water column wave energy converters. In Proceedings of the Smart Materials, Adaptive Structures and Intelligent Systems, Snowbird, UT, USA, 16–18 September 2013; p. V001T003A038. [Google Scholar]
- Jiang, Y.; Tian, C.; Yao, J.; Wu, W.; Ning, N.; Tian, M.; Zhang, L. Nano-Silica/Polydimethyl(methylvinyl)siloxane dielectric elastomer generator with high generating energy density, high efficiency and long fatigue life. Chem. Eng. J. 2022, 439, 135339. [Google Scholar] [CrossRef] [Scilit]
- Wang, C.; Zhang, Y.; Xu, H.; Guo, P. Response of a U-Oscillating Water Column system with a pitching front wall in regular waves. Ocean Eng. 2024, 310, 118591. [Google Scholar] [CrossRef] [Scilit]
- Muduli, R.; Patil, S.B.; Karmakar, D. Hydrodynamic performance of pile restrained U-shaped OWC device using boundary element method. Eng. Anal. Bound. Elem. 2024, 158, 139–159. [Google Scholar] [CrossRef] [Scilit]
- Rosati Papini, G.P.; Moretti, G.; Vertechy, R.; Fontana, M. Control of an oscillating water column wave energy converter based on dielectric elastomer generator. Nonlinear Dyn. 2018, 92, 181–202. [Google Scholar] [CrossRef] [Scilit]
- Wave Venture TETM Software, version 4.0; Wave Venture Ltd.: Cork, Ireland, 2024.
- Ahamed, R.; McKee, K.; Howard, I. Advancements of wave energy converters based on power take off (PTO) systems: A review. Ocean Eng. 2020, 204, 107248. [Google Scholar] [CrossRef] [Scilit]
- Falcão, A.F.O.; Henriques, J.C.C. Oscillating-water-column wave energy converters and air turbines: A review. Renew. Energy 2016, 85, 1391–1424. [Google Scholar] [CrossRef] [Scilit]
- Brito-Melo, A.; Gato, L.M.C.; Sarmento, A.J.N.A. Analysis of Wells turbine design parameters by numerical simulation of the OWC performance. Ocean Eng. 2002, 29, 1463–1477. [Google Scholar] [CrossRef] [Scilit]
- Henriques, J.C.C.; Portillo, J.C.C.; Gato, L.M.C.; Gomes, R.P.F.; Ferreira, D.N.; Falcão, A.F.O. Design of oscillating-water-column wave energy converters with an application to self-powered sensor buoys. Energy 2016, 112, 852–867. [Google Scholar] [CrossRef] [Scilit]
- Carrelhas, A.A.D.; Gato, L.M.C.; Henriques, J.C.C.; Falcão, A.F.O.; Varandas, J. Test results of a 30 kW self-rectifying biradial air turbine-generator prototype. Renew. Sustain. Energy Rev. 2019, 109, 187–198. [Google Scholar] [CrossRef] [Scilit]
- López, I.; Pereiras, B.; Castro, F.; Iglesias, G. Performance of OWC wave energy converters: Influence of turbine damping and tidal variability. Int. J. Energy Res. 2015, 39, 472–483. [Google Scholar]
- Moretti, G.; Rosset, S.; Vertechy, R.; Anderson, I.; Fontana, M. A review of dielectric elastomer generator systems. Adv. Intell. Syst. 2020, 2, 2000125. [Google Scholar] [CrossRef] [Scilit]
- Du, X.; Du, L.; Li, P.; Liu, X.; Han, Y.; Yu, H.; Tao, K.; Tang, L. A dielectric elastomer and electret hybrid ocean wave power generator with oscillating water column. Nano Energy 2023, 111, 108417. [Google Scholar] [CrossRef] [Scilit]
- Gratz-Kelly, S.; Krüger, T.; Rizzello, G.; Seelecke, S.; Moretti, G. An audio-tactile interface based on dielectric elastomer actuators. Smart Mater. Struct. 2023, 32, 034005. [Google Scholar] [CrossRef] [Scilit]
- Chiba, S.A.; Waki, M.; Takeshita, M.; Ohyama, K. Possibilities of Artificial Muscles Using Dielectric Elastomers and their Applications. Adv. Mater. Res. 2023, 1176, 99–117. [Google Scholar] [CrossRef] [Scilit]
- Fan, P.; Zhu, L.; Zhu, Z.; Chen, H.; Chen, W.; Hu, H. Predicting energy harvesting performance of a random nonlinear dielectric elastomer pendulum. Appl. Energy 2021, 289, 116696. [Google Scholar] [CrossRef] [Scilit]
- Vertechy, R.; Fontana, M.; Papini, G.R.; Bergamasco, M. Oscillating-water-column wave-energy-converter based on dielectric elastomer generator. In Proceedings of the Electroactive Polymer Actuators and Devices (EAPAD), San Diego, CA, USA, 11–14 March 2013; pp. 130–142. [Google Scholar]
- Moretti, G.; Papini, G.P.R.; Daniele, L.; Forehand, D.; Ingram, D.; Vertechy, R.; Fontana, M. Modelling and testing of a wave energy converter based on dielectric elastomer generators. Proc. R. Soc. A Math. Phys. Eng. Sci. 2019, 475, 20180566. [Google Scholar] [CrossRef] [Scilit] [PubMed]
- Fontana, M.; Daniele, L.; Moretti, G.; Damiani, F.; Righi, M.; Vertechy, R.; Teillant, B.; Vicente, M.; Sarmento, A.; Forehand, D. Wave Motion Generator Based on a Dielectric Elastomer with Stiffness Compensation. WO Patent 116276, 28 June 2018. [Google Scholar]
- Righi, M.; Moretti, G.; Forehand, D.; Agostini, L.; Vertechy, R.; Fontana, M. A broadbanded pressure differential wave energy converter based on dielectric elastomer generators. Nonlinear Dyn. 2021, 105, 2861–2876. [Google Scholar] [CrossRef] [Scilit]
- Pecher, A. Experimental testing and evaluation of WECs. In Handbook of Ocean Wave Energy; Springer: Cham, Switzerland, 2017; pp. 221–260. [Google Scholar]
- Portillo Juan, N.; Negro Valdecantos, V.; Esteban, M.D.; López Gutiérrez, J.S. Review of the influence of oceanographic and geometric parameters on oscillating water columns. J. Mar. Sci. Eng. 2022, 10, 226. [Google Scholar] [CrossRef] [Scilit]
- Kawabata, S. Fracture and mechanical behavior of rubber-like polymers under finite deformation in biaxial stress field. J. Macromol. Sci. Part B 1973, 8, 605–630. [Google Scholar] [CrossRef] [Scilit]
- Hamdi, A.; Naït Abdelaziz, M.; Aït Hocine, N.; Heuillet, P.; Benseddiq, N. A fracture criterion of rubber-like materials under plane stress conditions. Polym. Test. 2006, 25, 994–1005. [Google Scholar] [CrossRef] [Scilit]
- Koh, S.J.A.; Keplinger, C.; Li, T.; Bauer, S.; Suo, Z. Dielectric elastomer generators: How much energy can be converted? IEEE/ASME Trans. Mechatron. 2010, 16, 33–41. [Google Scholar] [CrossRef] [Scilit]
- Moretti, G.; Fontana, M.; Vertechy, R. Parallelogram-shaped dielectric elastomer generators: Analytical model and experimental validation. J. Intell. Mater. Syst. Struct. 2014, 26, 740–751. [Google Scholar] [CrossRef] [Scilit]
- Riaya, A.; Shaw, M.T.; Garton, A. Oxidation of Elastomers in Aqueous Environments. Rubber Chem. Technol. 1994, 67, 775–785. [Google Scholar] [CrossRef] [Scilit]
- Le Gac, P.Y. Durability of Polychloroprene Rubber for Marine Application; ENSAM: Paris, France, 2014. [Google Scholar]
- Rabanizada, N.; Lupberger, F.; Johlitz, M.; Lion, A. Experimental investigation of the dynamic mechanical behaviour of chemically aged elastomers. Arch. Appl. Mech. 2015, 85, 1011–1023. [Google Scholar] [CrossRef] [Scilit]
- Mars, W.V.; Fatemi, A. Factors that Affect the Fatigue Life of Rubber: A Literature Survey. Rubber Chem. Technol. 2004, 77, 391–412. [Google Scholar] [CrossRef] [Scilit]
- Abraham, F.; Alshuth, T.; Jerrams, S. The effect of minimum stress and stress amplitude on the fatigue life of non strain crystallising elastomers. Mater. Des. 2005, 26, 239–245. [Google Scholar] [CrossRef] [Scilit]
- Cadwell, S.M.; Merrill, R.A.; Sloman, C.M.; Yost, F.L. Dynamic Fatigue Life of Rubber. Ind. Eng. Chem. Anal. Ed. 1940, 12, 19–23. [Google Scholar] [CrossRef] [Scilit]
- Kaltseis, R.; Keplinger, C.; Koh, S.J.A.; Baumgartner, R.; Goh, Y.F.; Ng, W.H.; Kogler, A.; Tröls, A.; Foo, C.C.; Suo, Z. Natural rubber for sustainable high-power electrical energy generation. RSC Adv. 2014, 4, 27905–27913. [Google Scholar] [CrossRef] [Scilit]
- Chen, Y.; Agostini, L.; Moretti, G.; Fontana, M.; Vertechy, R. Dielectric elastomer materials for large-strain actuation and energy harvesting: A comparison between styrenic rubber, natural rubber and acrylic elastomer. Smart Mater. Struct. 2019, 28, 114001. [Google Scholar] [CrossRef] [Scilit]
- Jean-Mistral, C.; Jacquet-Richardet, G.; Sylvestre, A. Parameters influencing fatigue life prediction of dielectric elastomer generators. Polym. Test. 2020, 81, 106198. [Google Scholar] [CrossRef] [Scilit]
- Philippe, J.; Ambroise, W.; Guillaume, A.; Melis, C.; Kessel, R.V.; Fourmon, A.; Barrabino, E.; Heemskerk, J.; Queau, J.P. Standing wave tube electro active polymer wave energy converter. In Proceedings of the SPIE Smart Structures and Materials + Nondestructive Evaluation and Health Monitoring, San Diego, CA, USA, 12–15 March 2012. [Google Scholar]
- Shian, S.; Huang, J.; Zhu, S.; Clarke, D.R. Optimizing the Electrical Energy Conversion Cycle of Dielectric Elastomer Generators. Adv. Mater. 2014, 26, 6617–6621. [Google Scholar] [CrossRef] [Scilit] [PubMed]
- McKay, T.; O’Brien, B.; Calius, E.; Anderson, I. Self-priming dielectric elastomer generators. Smart Mater. Struct. 2010, 19, 055025. [Google Scholar] [CrossRef] [Scilit]
- Kovacs, G.; Düring, L.; Michel, S.; Terrasi, G. Stacked dielectric elastomer actuator for tensile force transmission. Sens. Actuators A Phys. 2009, 155, 299–307. [Google Scholar] [CrossRef] [Scilit]
- Chen, B.; Bai, Y.; Xiang, F.; Sun, J.-Y.; Mei Chen, Y.; Wang, H.; Zhou, J.; Suo, Z. Stretchable and transparent hydrogels as soft conductors for dielectric elastomer actuators. J. Polym. Sci. Part B Polym. Phys. 2014, 52, 1055–1060. [Google Scholar] [CrossRef] [Scilit]
- Rosset, S.; Araromi, O.A.; Schlatter, S.; Shea, H.R. Fabrication Process of Silicone-based Dielectric Elastomer Actuators. J. Vis. Exp. 2016, 108, e53423. [Google Scholar] [CrossRef] [Scilit] [PubMed]
- Ong, H.-Y.; Shrestha, M.; Lau, G.-K. Microscopically crumpled indium-tin-oxide thin films as compliant electrodes with tunable transmittance. Appl. Phys. Lett. 2015, 107, 132902. [Google Scholar] [CrossRef] [Scilit]
- Kelly, M.; Boerner, T.; Alam, M.-R. Modeling comparison of flexible-inflatable and rigid small-scale heaving wave energy converters. In Proceedings of the International Conference on Offshore Mechanics and Arctic Engineering, Hamburg, Germany, 5–10 June 2022; p. V008T009A074. [Google Scholar]
- Shabara, M.A.; Abdelkhalik, O. Dynamic modeling of the motions of variable-shape wave energy converters. Renew. Sustain. Energy Rev. 2023, 173, 113070. [Google Scholar] [CrossRef] [Scilit]
- Dafnakis, P.; Bhalla, A.P.S.; Sirigu, S.A.; Bonfanti, M.; Bracco, G.; Mattiazzo, G. Comparison of wave–structure interaction dynamics of a submerged cylindrical point absorber with three degrees of freedom using potential flow and computational fluid dynamics models. Phys. Fluids 2020, 32, 093307. [Google Scholar] [CrossRef] [Scilit]
- Huang, Y.; Idarraga, G.; Xiao, Q.; Yang, L.; Dai, S.; Abad, F.; Brennan, F.; Lotfian, S. Numerical analysis of structured sheet material in flexible oscillating water column wave energy converter. In Proceedings of the International Conference on Offshore Mechanics and Arctic Engineering, Singapore, 9–14 June 2024; p. V007T009A063. [Google Scholar]
- Huang, Y.; Xiao, Q.; Idarraga, G.; Yang, L.; Dai, S.; Abad, F.; Brennan, F.; Lotfian, S. Numerical Analysis of Flexible Tube Wave Energy Convertor Using CFD-FEA Method. In Proceedings of the International Conference on Offshore Mechanics and Arctic Engineering, New York, NY, USA, 11–16 June 2023; p. V008T009A062. [Google Scholar]
- Huang, Y.; Xiao, Q.; Alarcon, G.I.; Yang, L.; Dai, D.; Abad, F.; Brennan, F.; Lotfian, S. A CFD-FEM analysis for Anaconda WEC with mooring lines. In Proceedings of the 15th European Wave and Tidal Energy Conference, Bilbao, Spain, 3–7 September 2023; p. 163. [Google Scholar]
- Wei, Y.; Wang, C.; Chen, W.; Huang, L. Array analysis on a seawall type of deformable wave energy converters. Renew. Energy 2024, 225, 120344. [Google Scholar] [CrossRef] [Scilit]
- George, D.; Collins, I.; Masters, I.; Hossain, M. Extreme load analysis of flexible wave energy converters utilising nonlocal continuum damage mechanics. Appl. Ocean Res. 2024, 142, 103843. [Google Scholar] [CrossRef] [Scilit]
- Righi, M.; Vertechy, R.; Fontana, M. Experimental Characterization of a Circular Diaphragm Dielectric Elastomer Generator. In Proceedings of the ASME 2014 Conference on Smart Materials, Adaptive Structures and Intelligent Systems, Newport, RI, USA, 8–10 September 2014. [Google Scholar]
- Moretti, G.; Rosati, G.P.P.; Fontana, M.; Vertechy, R. Hardware in the loop simulation of a dielectric elastomer generator for oscillating water column wave energy converters. In Proceedings of the OCEANS 2015, Genova, Italy, 18–21 May 2015; pp. 1–7. [Google Scholar]
- Moretti, G.; Righi, M.; Vertechy, R.; Fontana, M. Fabrication and Test of an Inflated Circular Diaphragm Dielectric Elastomer Generator Based on PDMS Rubber Composite. Polymers 2017, 9, 283. [Google Scholar] [CrossRef] [Scilit] [PubMed]
- Abad, F.; Lotfian, S.; Dai, S.; Zhao, G.; Alarcon, G.; Yang, L.; Huang, Y.; Xiao, Q.; Brennan, F. Experimental study on inflatable circular diaphragms used in the oscillating water column wave energy converter. In Advances in the Analysis and Design of Marine Structures; CRC Press: Boca Raton, FL, USA, 2023; pp. 187–193. [Google Scholar]
- Abad, F.; Lotfian, S.; Dai, S.; Zhao, G.; Alarcon, G.I.; Yang, L.; Huang, Y.; Xiao, Q.; Brennan, F. Experimental and computational analysis of elastomer membranes used in oscillating water column WECs. Renew. Energy 2024, 226, 120422. [Google Scholar] [CrossRef] [Scilit]
- Shiach, J.B.; Mingham, C.G.; Ingram, D.M.; Bruce, T. The applicability of the shallow water equations for modelling violent wave overtopping. Coast. Eng. 2004, 51, 1–15. [Google Scholar] [CrossRef] [Scilit]
- Vertechy, R.; Papini Rosati, G.P.; Fontana, M. Reduced model and application of inflating circular diaphragm dielectric elastomer generators for wave energy harvesting. J. Vib. Acoust. Trans. ASME 2015, 137, 011004. [Google Scholar] [CrossRef] [Scilit]
- Vicinanza, D.; Contestabile, P.; Nørgaard, J.Q.H.; Andersen, T.L. Innovative rubble mound breakwaters for overtopping wave energy conversion. Coast. Eng. 2014, 88, 154–170. [Google Scholar] [CrossRef] [Scilit]
- Koutrouveli, T.I.; Di Lauro, E.; das Neves, L.; Calheiros-Cabral, T.; Rosa-Santos, P.; Taveira-Pinto, F. Proof of concept of a breakwater-integrated hybrid wave energy converter using a composite modelling approach. J. Mar. Sci. Eng. 2021, 9, 226. [Google Scholar] [CrossRef] [Scilit]
- Boodoo, A.; Cross, J.S.; Ridgewell, C.; Kortelainen, V.; Vuorinen, M.; Harouna-Mayer, A. A Techno-Economic framework for Dual-Purpose wave Farms: Integrating coastal protection benefits into the Levelized cost of energy assessment. Energy Convers. Manag. 2026, 349, 120887. [Google Scholar] [CrossRef] [Scilit]
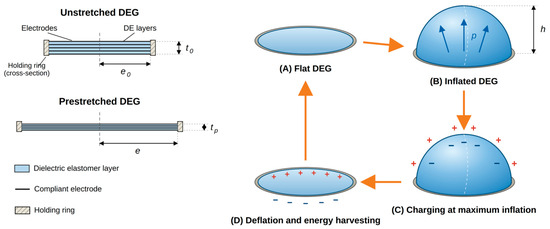
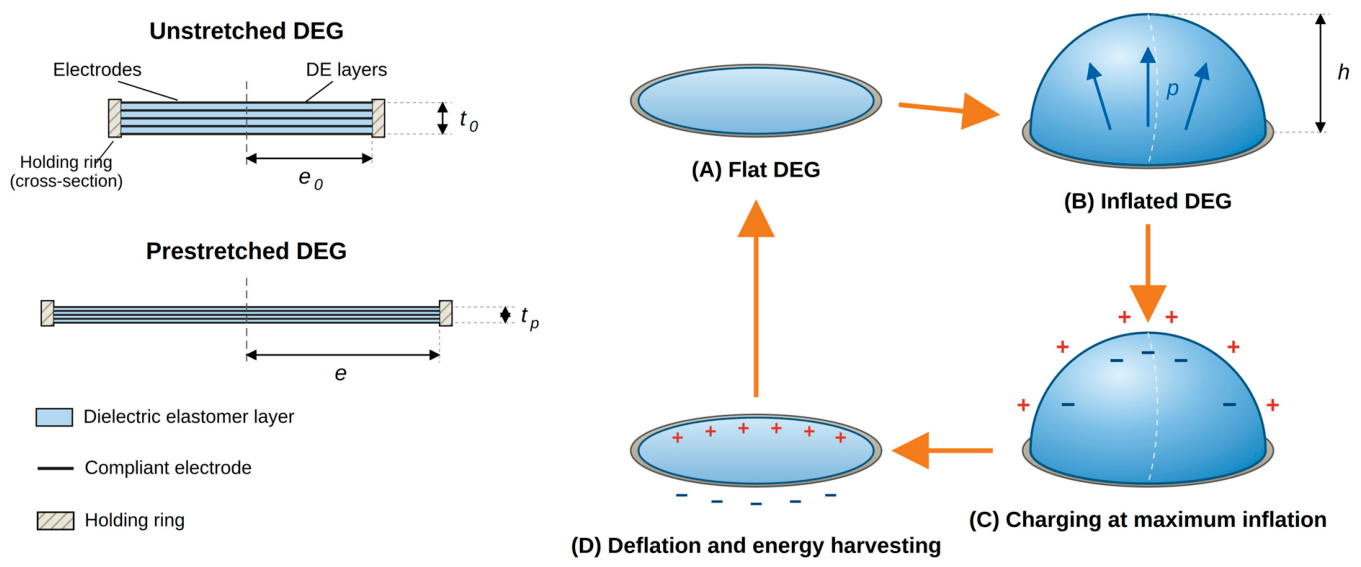
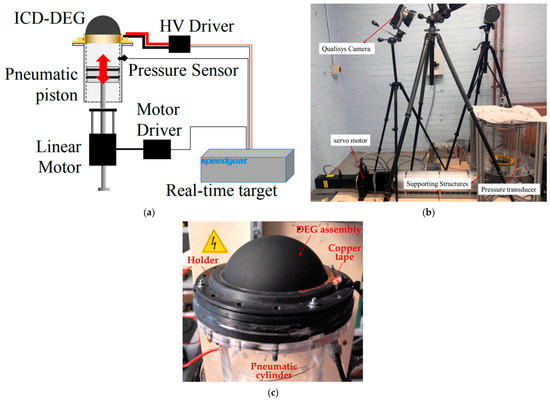
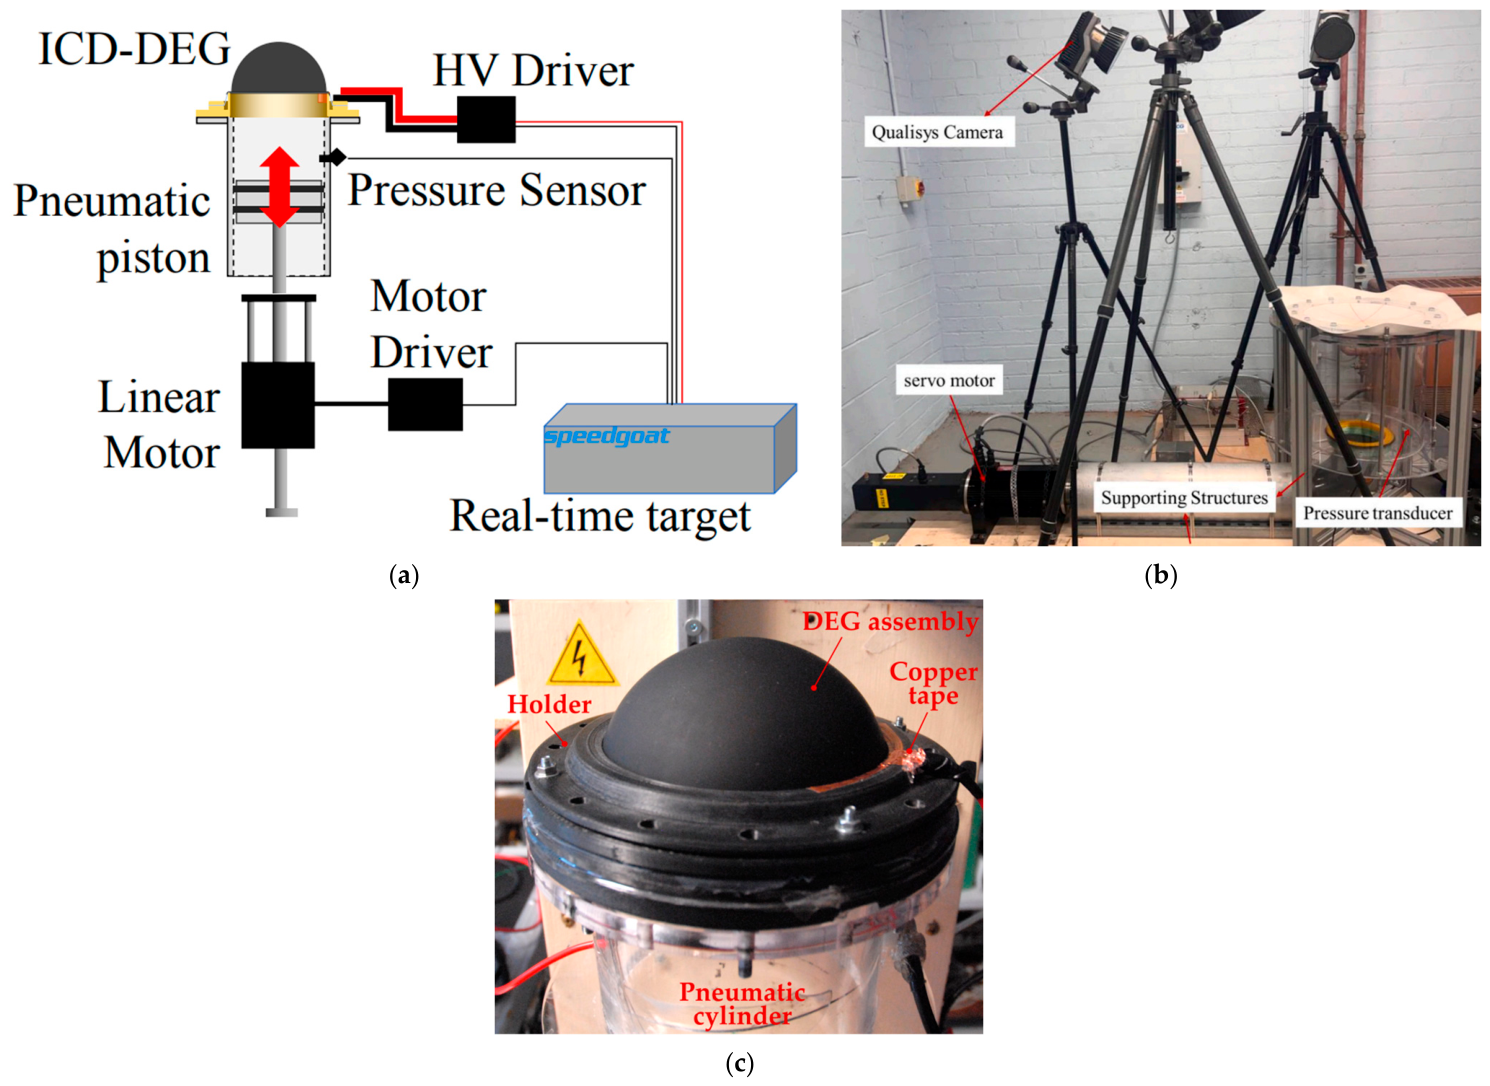
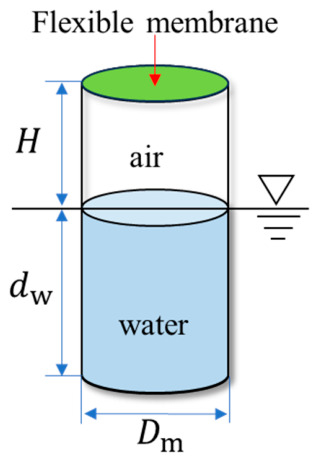
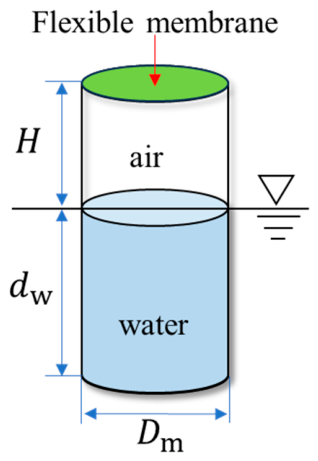
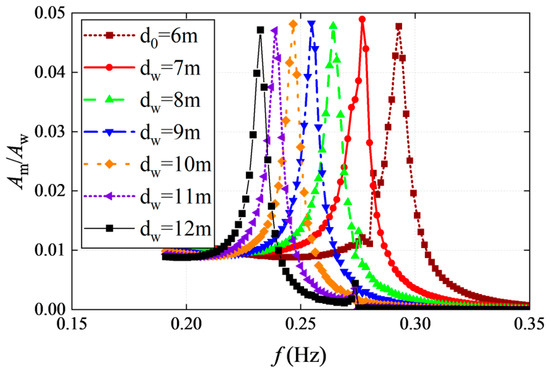
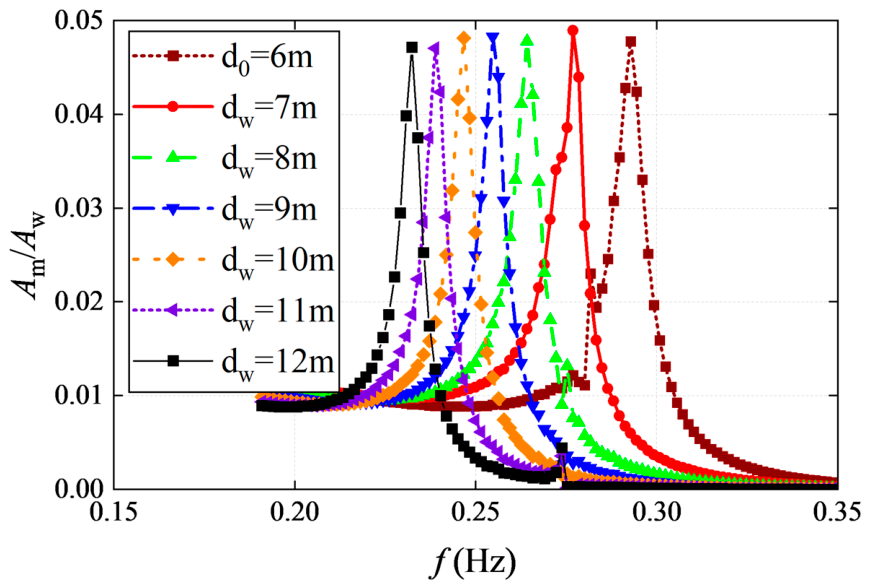
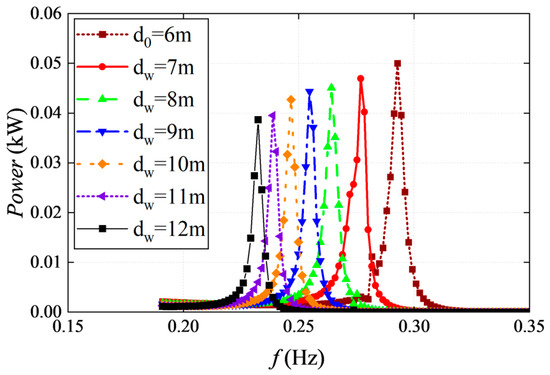
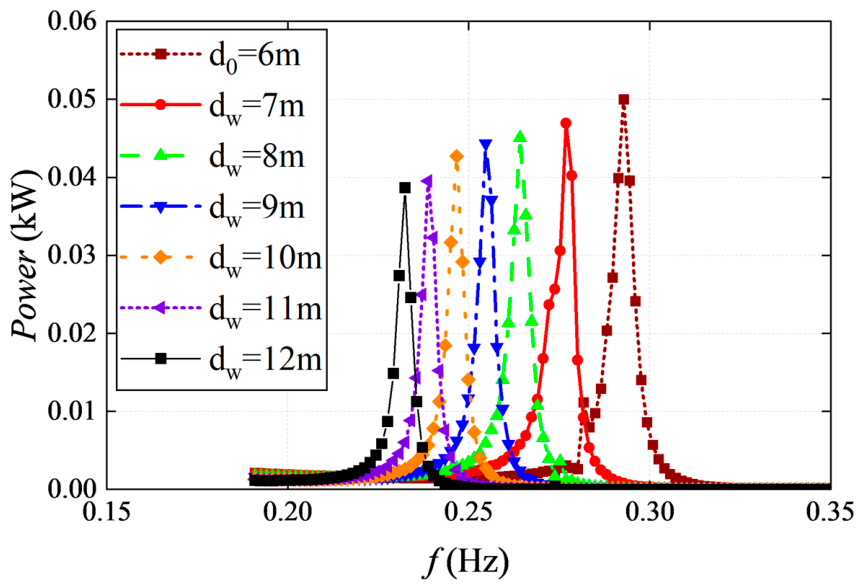
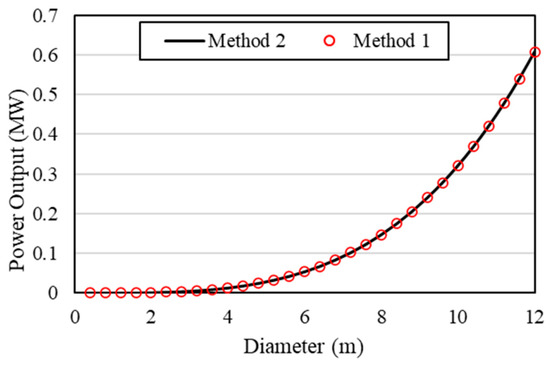
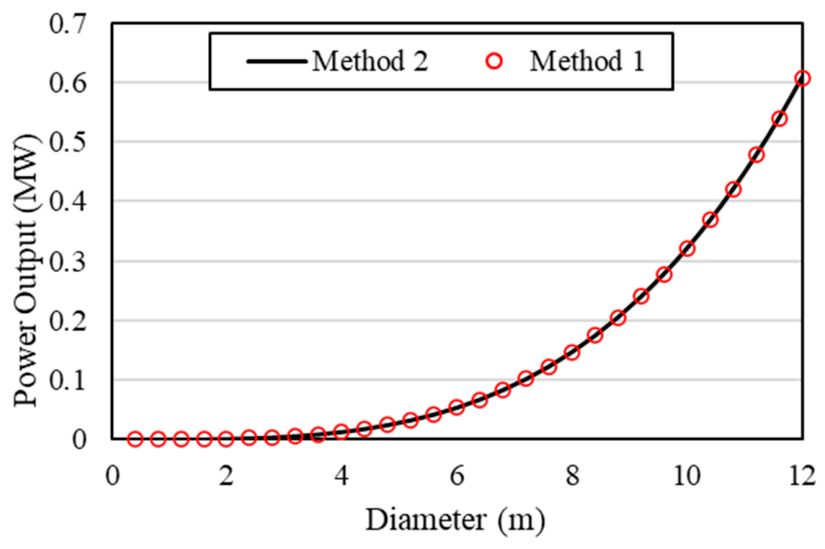
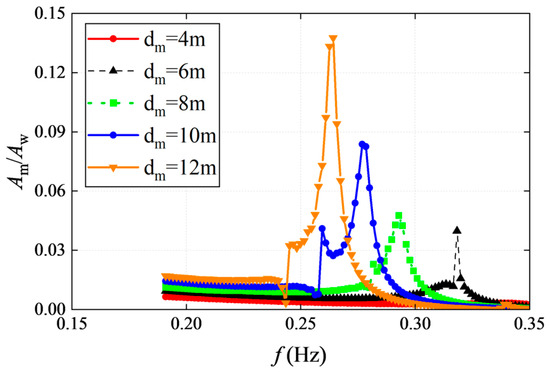
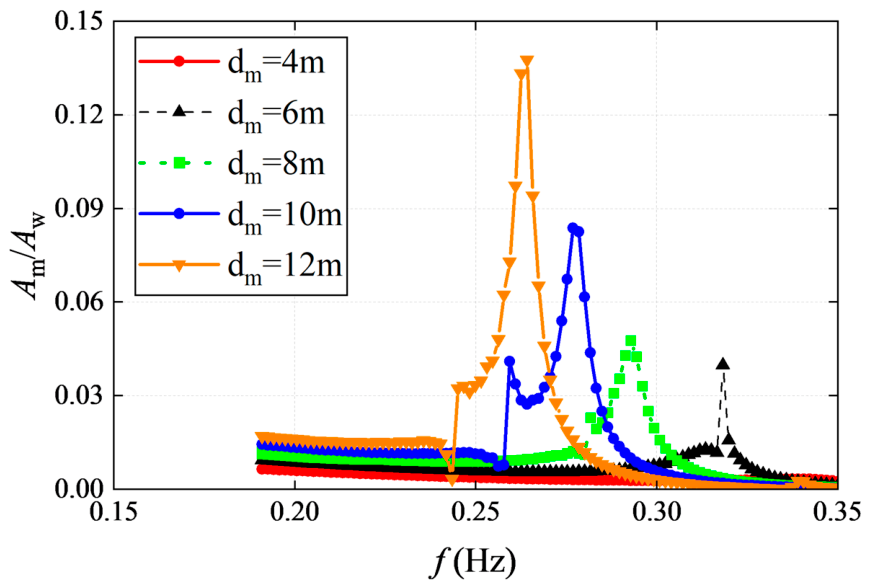
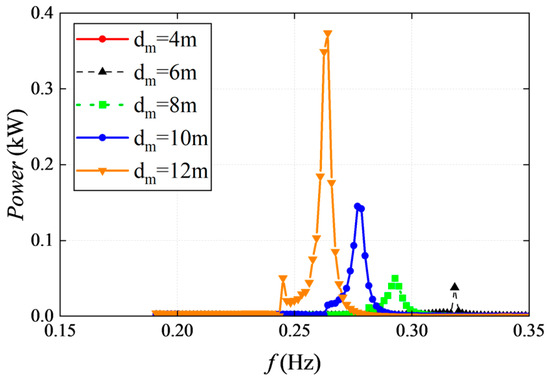
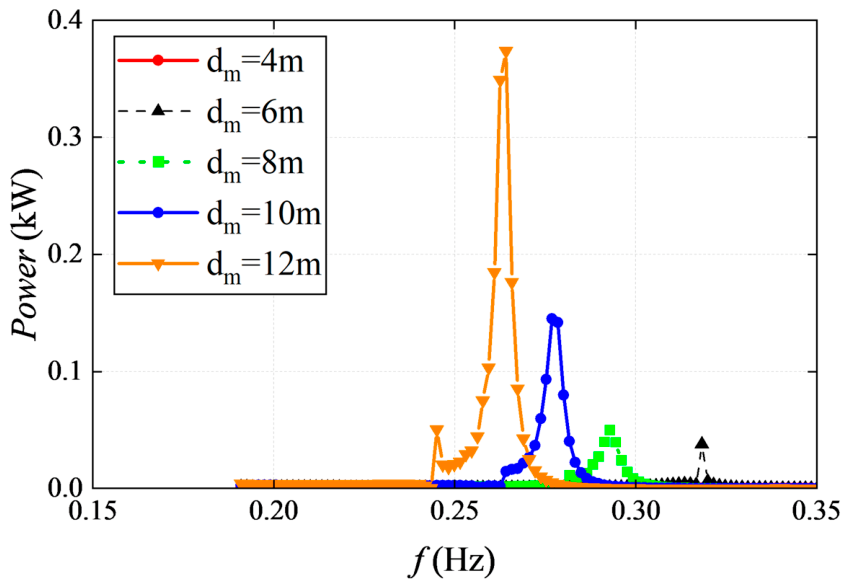
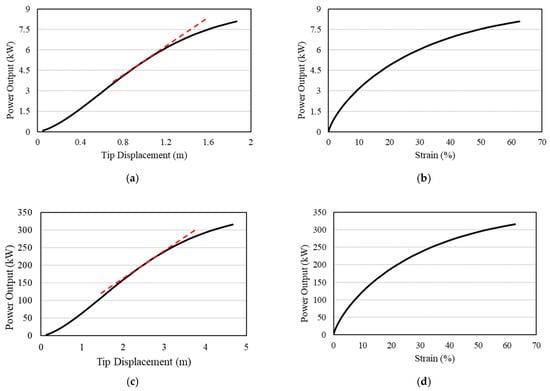
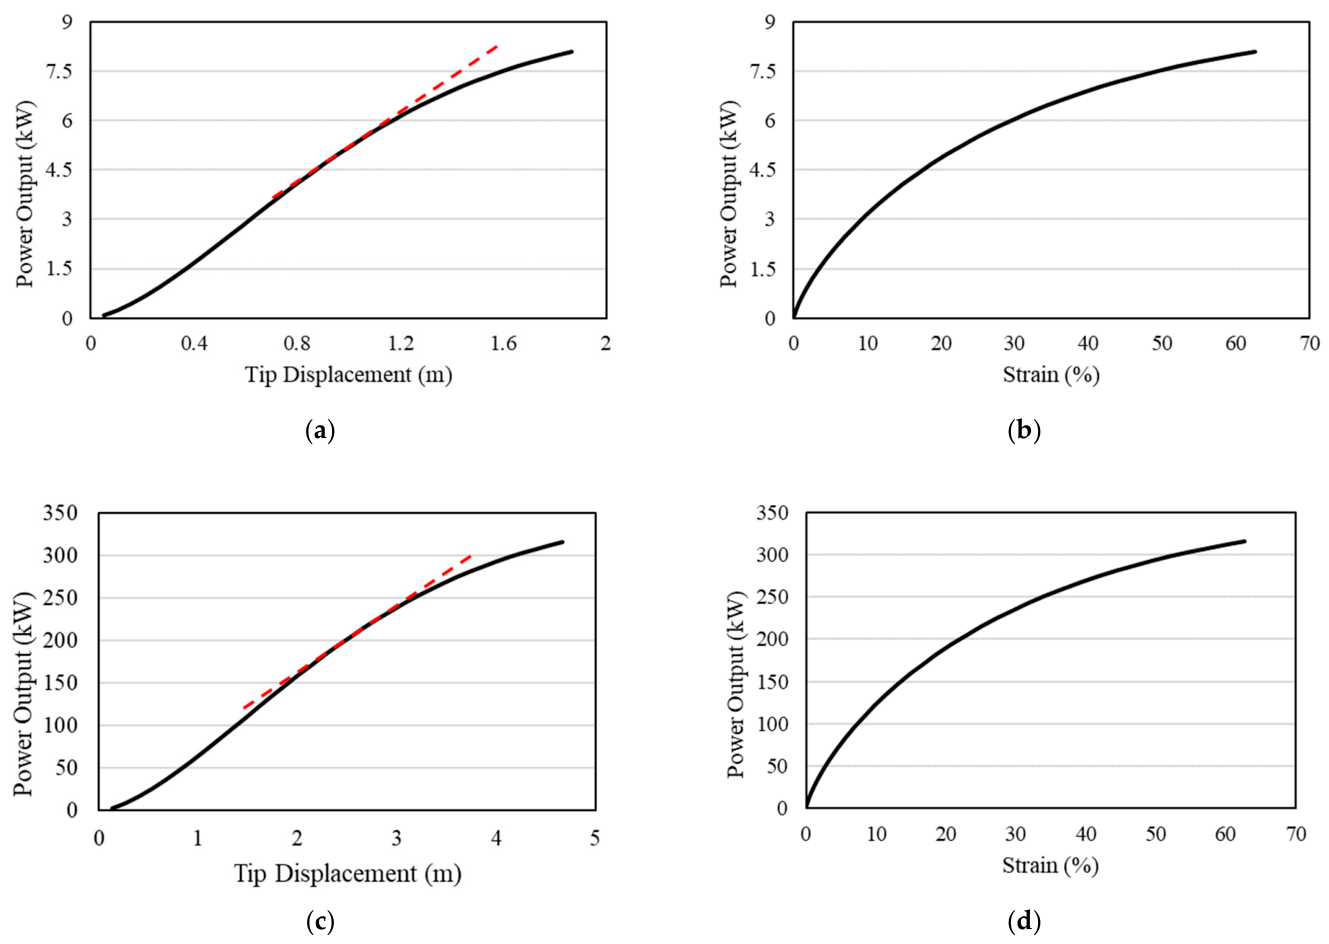
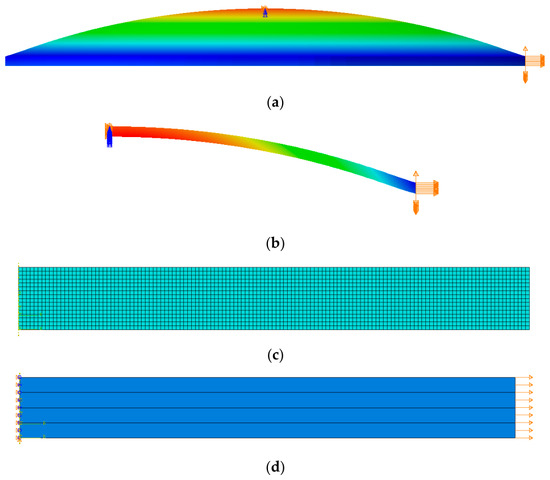
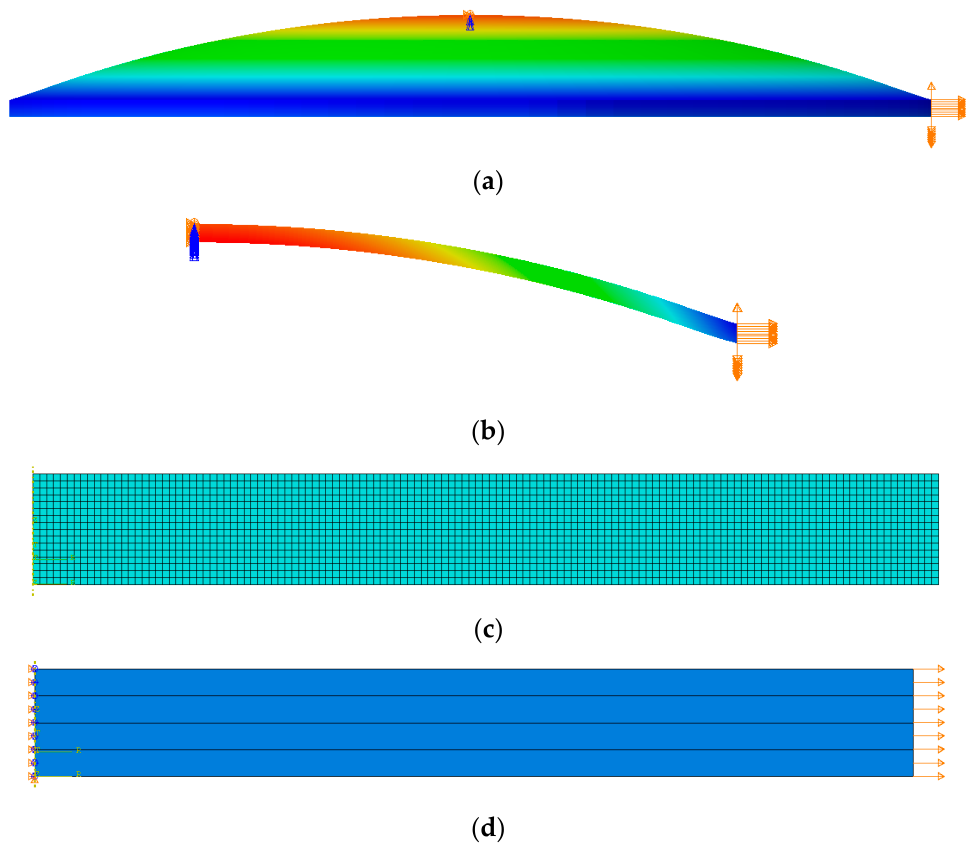
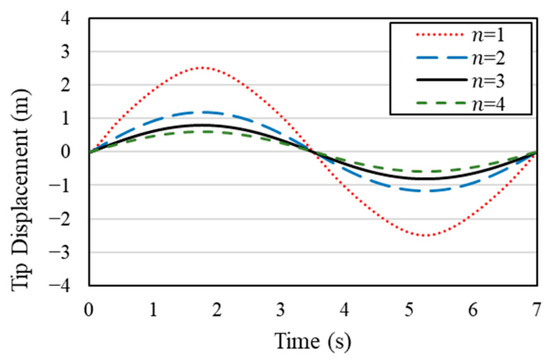
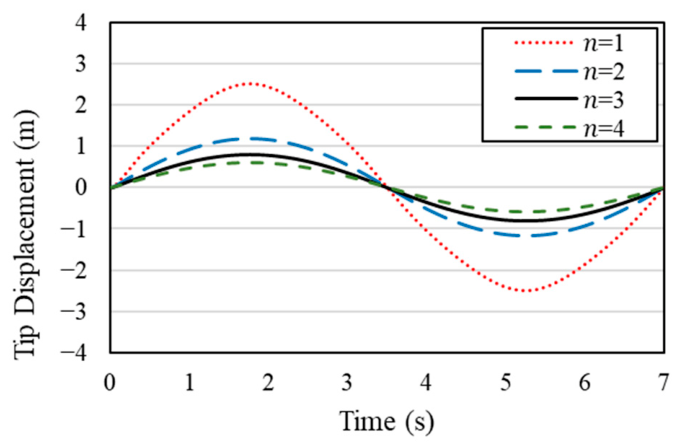
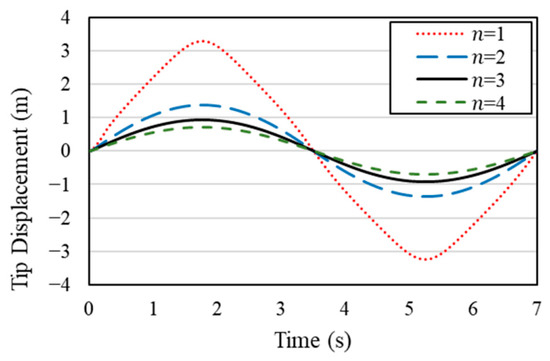
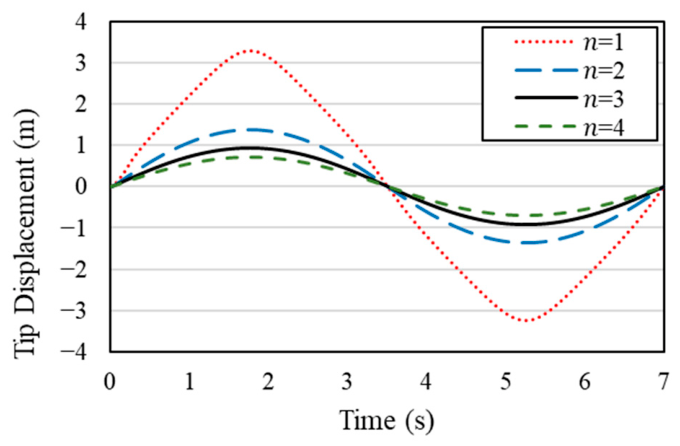
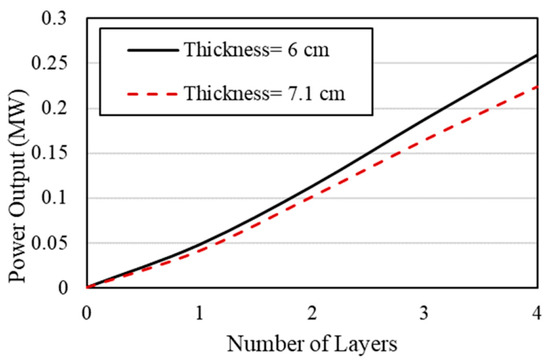
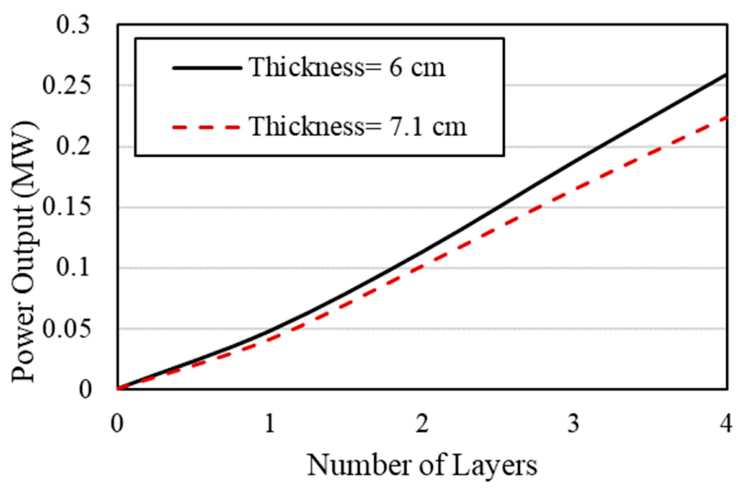
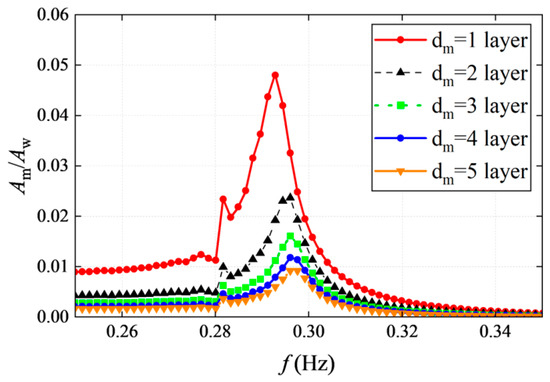
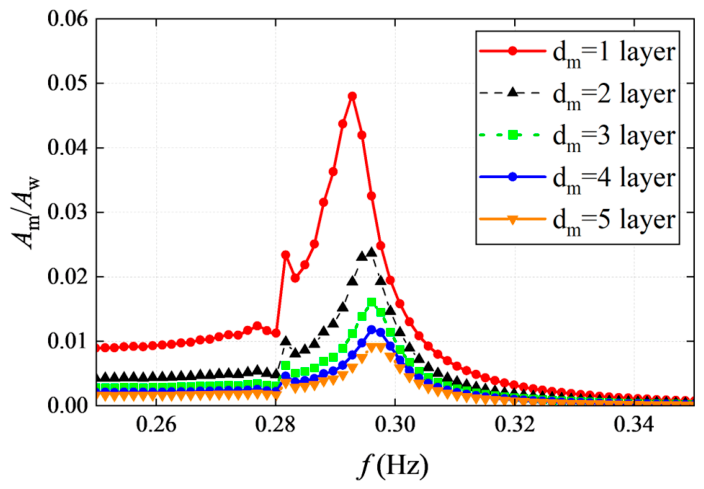
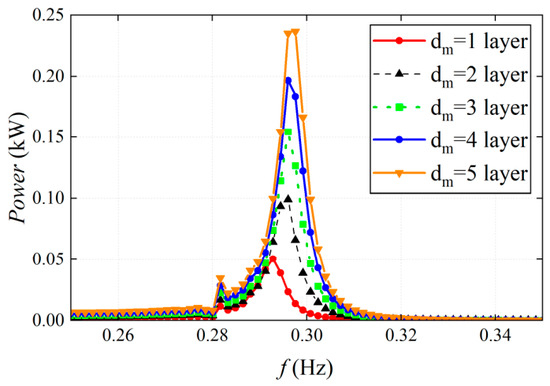
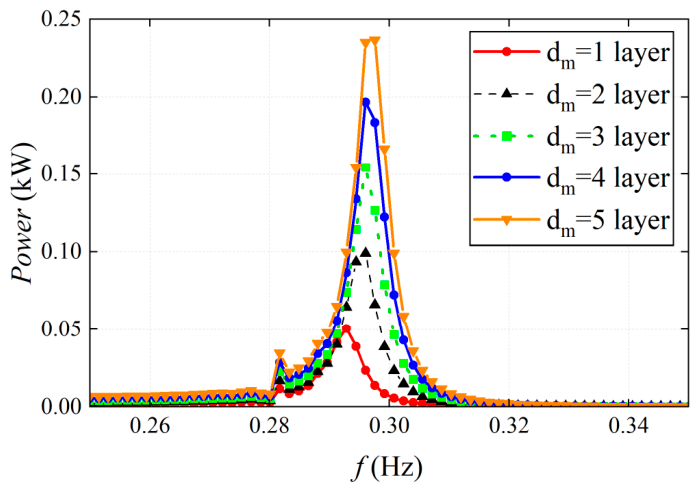

Disclaimer/Publisher’s Note: The statements, opinions and data contained in all publications are solely those of the individual author(s) and contributor(s) and not of MDPI and/or the editor(s). MDPI and/or the editor(s) disclaim responsibility for any injury to people or property resulting from any ideas, methods, instructions or products referred to in the content. |
© 2026 by the authors. Licensee MDPI, Basel, Switzerland. This article is an open access article distributed under the terms and conditions of the Creative Commons Attribution (CC BY) license.