Article

Response of Typhoon Waves and Storm Surges to Sea Surface Temperature Rise and Sea Level Rise: A Case Study of Super Typhoon Doksuri (2023) in the Taiwan Strait


1
School of Hydraulic and Ocean Engineering, Changsha University of Science and Technology, Changsha 410114, China
2
China Key Laboratory of Water-Sediment Sciences and Water Disaster Prevention of Hunan Province, Changsha 410114, China
3
China Key Laboratory of Water Security Guarantee in Guangdong-Hong Kong-Marco Greater Bay Area of Ministry of Water Resources, Guangzhou 510610, China
*
Author to whom correspondence should be addressed.
J. Mar. Sci. Eng. 2026, 14(12), 1137; https://doi.org/10.3390/jmse14121137
Submission received: 13 May 2026 / Revised: 17 June 2026 / Accepted: 18 June 2026 / Published: 21 June 2026
(This article belongs to the Special Issue Climate Change Impacts on Coastal Processes)

Abstract

In the context of global climate warming, sea surface temperature (SST) rise and sea level (SL) rise are projected to amplify typhoon-related marine dynamic disaster risks. These are idealized sensitivity experiments designed to isolate the individual effects of SST warming and SL rise, not full climate projections. This study investigates Super Typhoon Doksuri (2023) using the WRF-SWAN-ROMS coupled model, with sensitivity experiments designed for SST (+0.8 °C, +2.0 °C, +3.5 °C) and SL rise (+0.4 m, +0.6 m, +0.8 m) scenarios referenced to IPCC AR6 projections. Results indicate that SST rise enhances typhoon intensity by approximately 16% at +3.5 °C, elevates mean wave height by 25.0%, and increases extreme significant wave height by 24.0%, with the extreme wave height sensitivity approximately 2.75 times that of the mean. Storm surge exhibits a nonlinear response, with the extreme surge sensitivity approximately 13.2 times that of the mean. SL rise has relatively minor effects on open sea areas but affects coastal regions notably, expanding the inundation area by approximately 47% under the 0.8 m scenario. The Taiwan Strait channeling effect amplifies wave heights and surges on the right side of the track. Comparative analysis suggests that SST indirectly amplifies disasters by enhancing typhoon intensity, while SL rise directly constrains nearshore dynamics through static water level elevation. These findings offer process-based insights into the contrasting physical mechanisms through which SST rise and SL rise affect coastal hazards in semi-enclosed regions and may inform future ensemble-based climate impact assessments.

1. Introduction

Tropical cyclones are intense weather systems that form over tropical or subtropical oceans, and the associated typhoon waves, storm surges, and coastal inundation are the main factors causing coastal disasters. China is located in the active Northwest Pacific typhoon region and is one of the countries most severely affected by typhoon disasters globally, with an average of seven to nine tropical cyclones making landfall or affecting China each year, and exceeding 12 in some years, resulting in average annual direct economic losses exceeding 20 billion CNY [1,2]. Coastal typhoon compound disaster risk assessment methods have developed rapidly in recent years, providing important technical support for disaster prevention decision-making [3,4]. In addition to coastal inundation and property damage, intensified typhoon waves and storm surges pose increasing hydrodynamic threats to offshore engineering infrastructure, including wind turbine installations in the rapidly expanding coastal renewable energy sector [5].
Under global climate warming, ocean–atmosphere interaction processes have become more complex, and ocean–atmosphere coupling significantly affects typhoon tracks and intensity [6,7]. Persistent sea surface temperature rise is a key factor affecting typhoon activity [8,9]. Observational data indicate that China’s coastal sea temperature has risen by approximately 0.015 °C annually. When sea temperature exceeds the critical threshold of 26.5 °C, the basic thermal conditions for typhoon development are provided, and anomalous sea temperature rise may further promote intensity enhancement. Mei et al. [10] found that the intensity of landfalling typhoons over the Northwest Pacific has shown a significant increasing trend since the 1970s, attributed to persistent coastal sea surface temperature rise. Sea level rise is one of the most significant ocean responses under global climate change, and it exerts profound effects on typhoon waves, storm surges, and coastal inundation processes by raising the mean sea level, modifying nearshore hydrodynamic conditions, and enhancing extreme event impacts [11,12]. Related studies have shown that sea level rise not only directly increases extreme water levels but also significantly amplifies coastal compound disaster risks through coupling with typhoons, waves, and precipitation [13]. It has been pointed out that by 2100, over 50% of tide gauge stations worldwide will experience centennial extreme sea level events becoming annual events or even more frequent [14,15]. Multiple studies have confirmed that sea level rise superimposed on typhoons will significantly alter coastal hydrodynamic environments and inundation risks [16,17].
Extensive research has explored the evolution of typhoon disasters under climate change, but differing hypotheses remain regarding the relative dominance of SST versus SL rise. Some studies emphasize SST as the primary driver, arguing that intensity enhancement is the root cause of amplified wave and surge hazards [18,19], while others highlight SL rise as a direct and deterministic aggravating factor that operates independently of typhoon intensity changes [11,20]. Whether these two factors produce additive, synergistic, or regionally varying effects remains unresolved. Lavender et al. [18] conducted sensitivity experiments with Typhoon Yasi, and the results showed that SST rise enhances typhoon intensity, precipitation, and storm energy, thereby amplifying the corresponding storm surge. Wang et al. [19] further investigated Typhoon Mangkhut using the pseudo-global warming technique, showing that SST + 2.26 °C to +4.53 °C can lower the minimum pressure by 9.2 to 19.4 hPa and increase turbulent heat fluxes to 177% to 272% of the original values, verifying the thermodynamic driving mechanism of SST rise for typhoon enhancement. Salarieh et al. [20] pointed out that future persistent SST rise will lead to stronger hurricane wind speeds and higher storm surge water levels along the US Atlantic and Gulf coasts. Wu et al. [21] employed the COAWST coupled system (WRF-ROMS-SWAN) to investigate the dynamic and thermodynamic ocean responses to Typhoon Mangkhut in the South China Sea, revealing that SST cooling exhibits spatial asymmetry governed by typhoon wind fields and temporal lag controlled by upwelling and vertical mixing, underscoring the complex air–sea interaction processes that modulate typhoon intensification. Chen et al. [11] investigated the impact of sea level rise on storm-induced coastal inundation using a high-resolution FVCOM coupled model, noting that sea level rise significantly enhances inundation through enhanced wave breaking and wave-induced setup processes. Zhang et al. [22] compared linear superposition and numerical simulation methods, pointing out that the interaction between storm surge and sea level rise is approximately linear in open sea areas, but in nearshore and complex terrain regions, sea level rise causes significant nonlinear responses by altering hydrodynamic structures. Jisan et al. [23] employed ensemble simulation methods, noting that in the Bay of Bengal region, when sea level rise reaches 0.54 m, the storm surge inundation area can be increased by over 50%, indicating that even without changes in typhoon intensity, sea level rise significantly amplifies disaster scale.
However, these studies share a common limitation: they typically examine either SST or SL rise in isolation, using different modeling frameworks and typhoon cases, making direct comparison of the two drivers difficult. Moreover, the physical mechanisms through which SST-induced intensity changes versus SL-rise-induced depth changes produce distinct spatial patterns in wave height and storm surge remain insufficiently decomposed. Whether the two drivers produce additive, competing, or spatially varying effects within a single consistent modeling framework has not been systematically addressed.
Furthermore, the Taiwan Strait, as a semi-enclosed waterway connecting the East China Sea and the South China Sea, has unique narrow and elongated topography that significantly regulates the propagation of typhoon waves and storm surges. Yang et al. [24] investigated Typhoon Maria, showing that Taiwan Island topography can significantly alter wind field structures within the strait through blocking effect and channeling effect, with maximum wind speed changes reaching 10 m/s, and topographic lowering weakens southwestward storm surge flux in the strait by approximately 16%. Wu et al. [25] investigated Super Typhoon Rammasun in the Beibu Gulf using idealized track shifts, demonstrating that track variability significantly modulates local storm surge and wave responses through altered wind field asymmetry and fetch limitations, with maximum surge occurring on the right-hand side of the track. Zhang et al. [26] simulated the spatiotemporal evolution of wind, waves, and currents in the Taiwan Strait during Typhoon Doksuri, revealing the significant modulation effect of the channeling effect on the wind field, but no climate change sensitivity experiments were conducted. Xiao and Lu [27] performed high-resolution storm surge modeling for Doksuri based on FVCOM, evaluating sensitivity to SL rise and bottom friction, but no systematic analysis of the joint response of typhoon waves and storm surges to SST changes was included. Collectively, existing Doksuri studies provide valuable process understanding but have not systematically compared the effects of SST rise and SL rise on typhoon waves and storm surges within a unified coupled framework.
Regarding numerical simulation tools, coupled models have become the mainstream approach for studying typhoon–wave–storm surge interactions [28]. Moghimi et al. [29] utilized the Coupled Ocean–Atmosphere–Wave–Sediment Transport (COAWST) system to conduct high-resolution modeling of Hurricane Sandy, showing that coupled modeling significantly outperforms uncoupled schemes for compound flood simulation, verifying its reliability in large-scale typhoon disaster research. In parallel, data-driven methods such as hybrid deep learning have shown promise for large-scale wave forecasting [30], offering complementary tools that may be integrated with physical models for rapid hazard assessment. Kumar et al. [31] conducted wave–ocean coupled simulations in Mississippi Bay, further demonstrating that coupled models can accurately reproduce nearshore hydrodynamic processes, providing effective means for analyzing bottom friction dissipation and wave–current interaction mechanisms. In recent years, scholars have gradually introduced the COAWST model for localized typhoon disaster research. However, existing sensitivity analyses based on this model have mostly focused on single climate factor impact assessment, and comparative mechanism studies of the two driving factors, SST rise and SL rise, remain insufficient [32]. In summary, three critical gaps motivate the present study. First, existing sensitivity studies typically examine SST rise and SL rise as independent drivers using different models and cases, precluding direct comparison of their physical mechanisms and relative magnitudes within a consistent framework. Second, for the Taiwan Strait specifically, the modulation of SL rise effects by the strait’s semi-enclosed topography—particularly how depth increase alters bottom friction dissipation and wave energy propagation in this narrow waterway—remains insufficiently quantified. Third, diagnostic analyses linking local wave and surge sensitivity to specific physical processes (e.g., bottom friction regulation, wind field redistribution) are lacking in existing Doksuri and Taiwan Strait studies, limiting mechanistic interpretation of the modeled responses.
Addressing these gaps, this study employs the fully coupled COAWST system (WRF-SWAN-ROMS) to conduct idealized sensitivity experiments for Typhoon Doksuri (2023). By designing SST rise (+0.8 °C, +2.0 °C, +3.5 °C) and SL rise (+0.4 m, +0.6 m, +0.8 m) scenarios within a single consistent framework, we systematically compare: (1) how SST rise and SL rise produce contrasting effects on typhoon waves, storm surges, and wind fields; (2) how SST rise and SL rise affect coastal hazards through contrasting physical pathways, specifically typhoon intensification versus nearshore depth modification; and (3) the physical mechanisms underlying the local responses through diagnostic analysis of bottom friction dissipation and stress. These idealized sensitivity experiments are designed to isolate the individual effects of SST warming and SL rise for this single-event case study, with a focus on elucidating the contrasting physical mechanisms rather than providing definitive climate projections.

2. Materials and Methods

2.1. Study Area and Data Sources

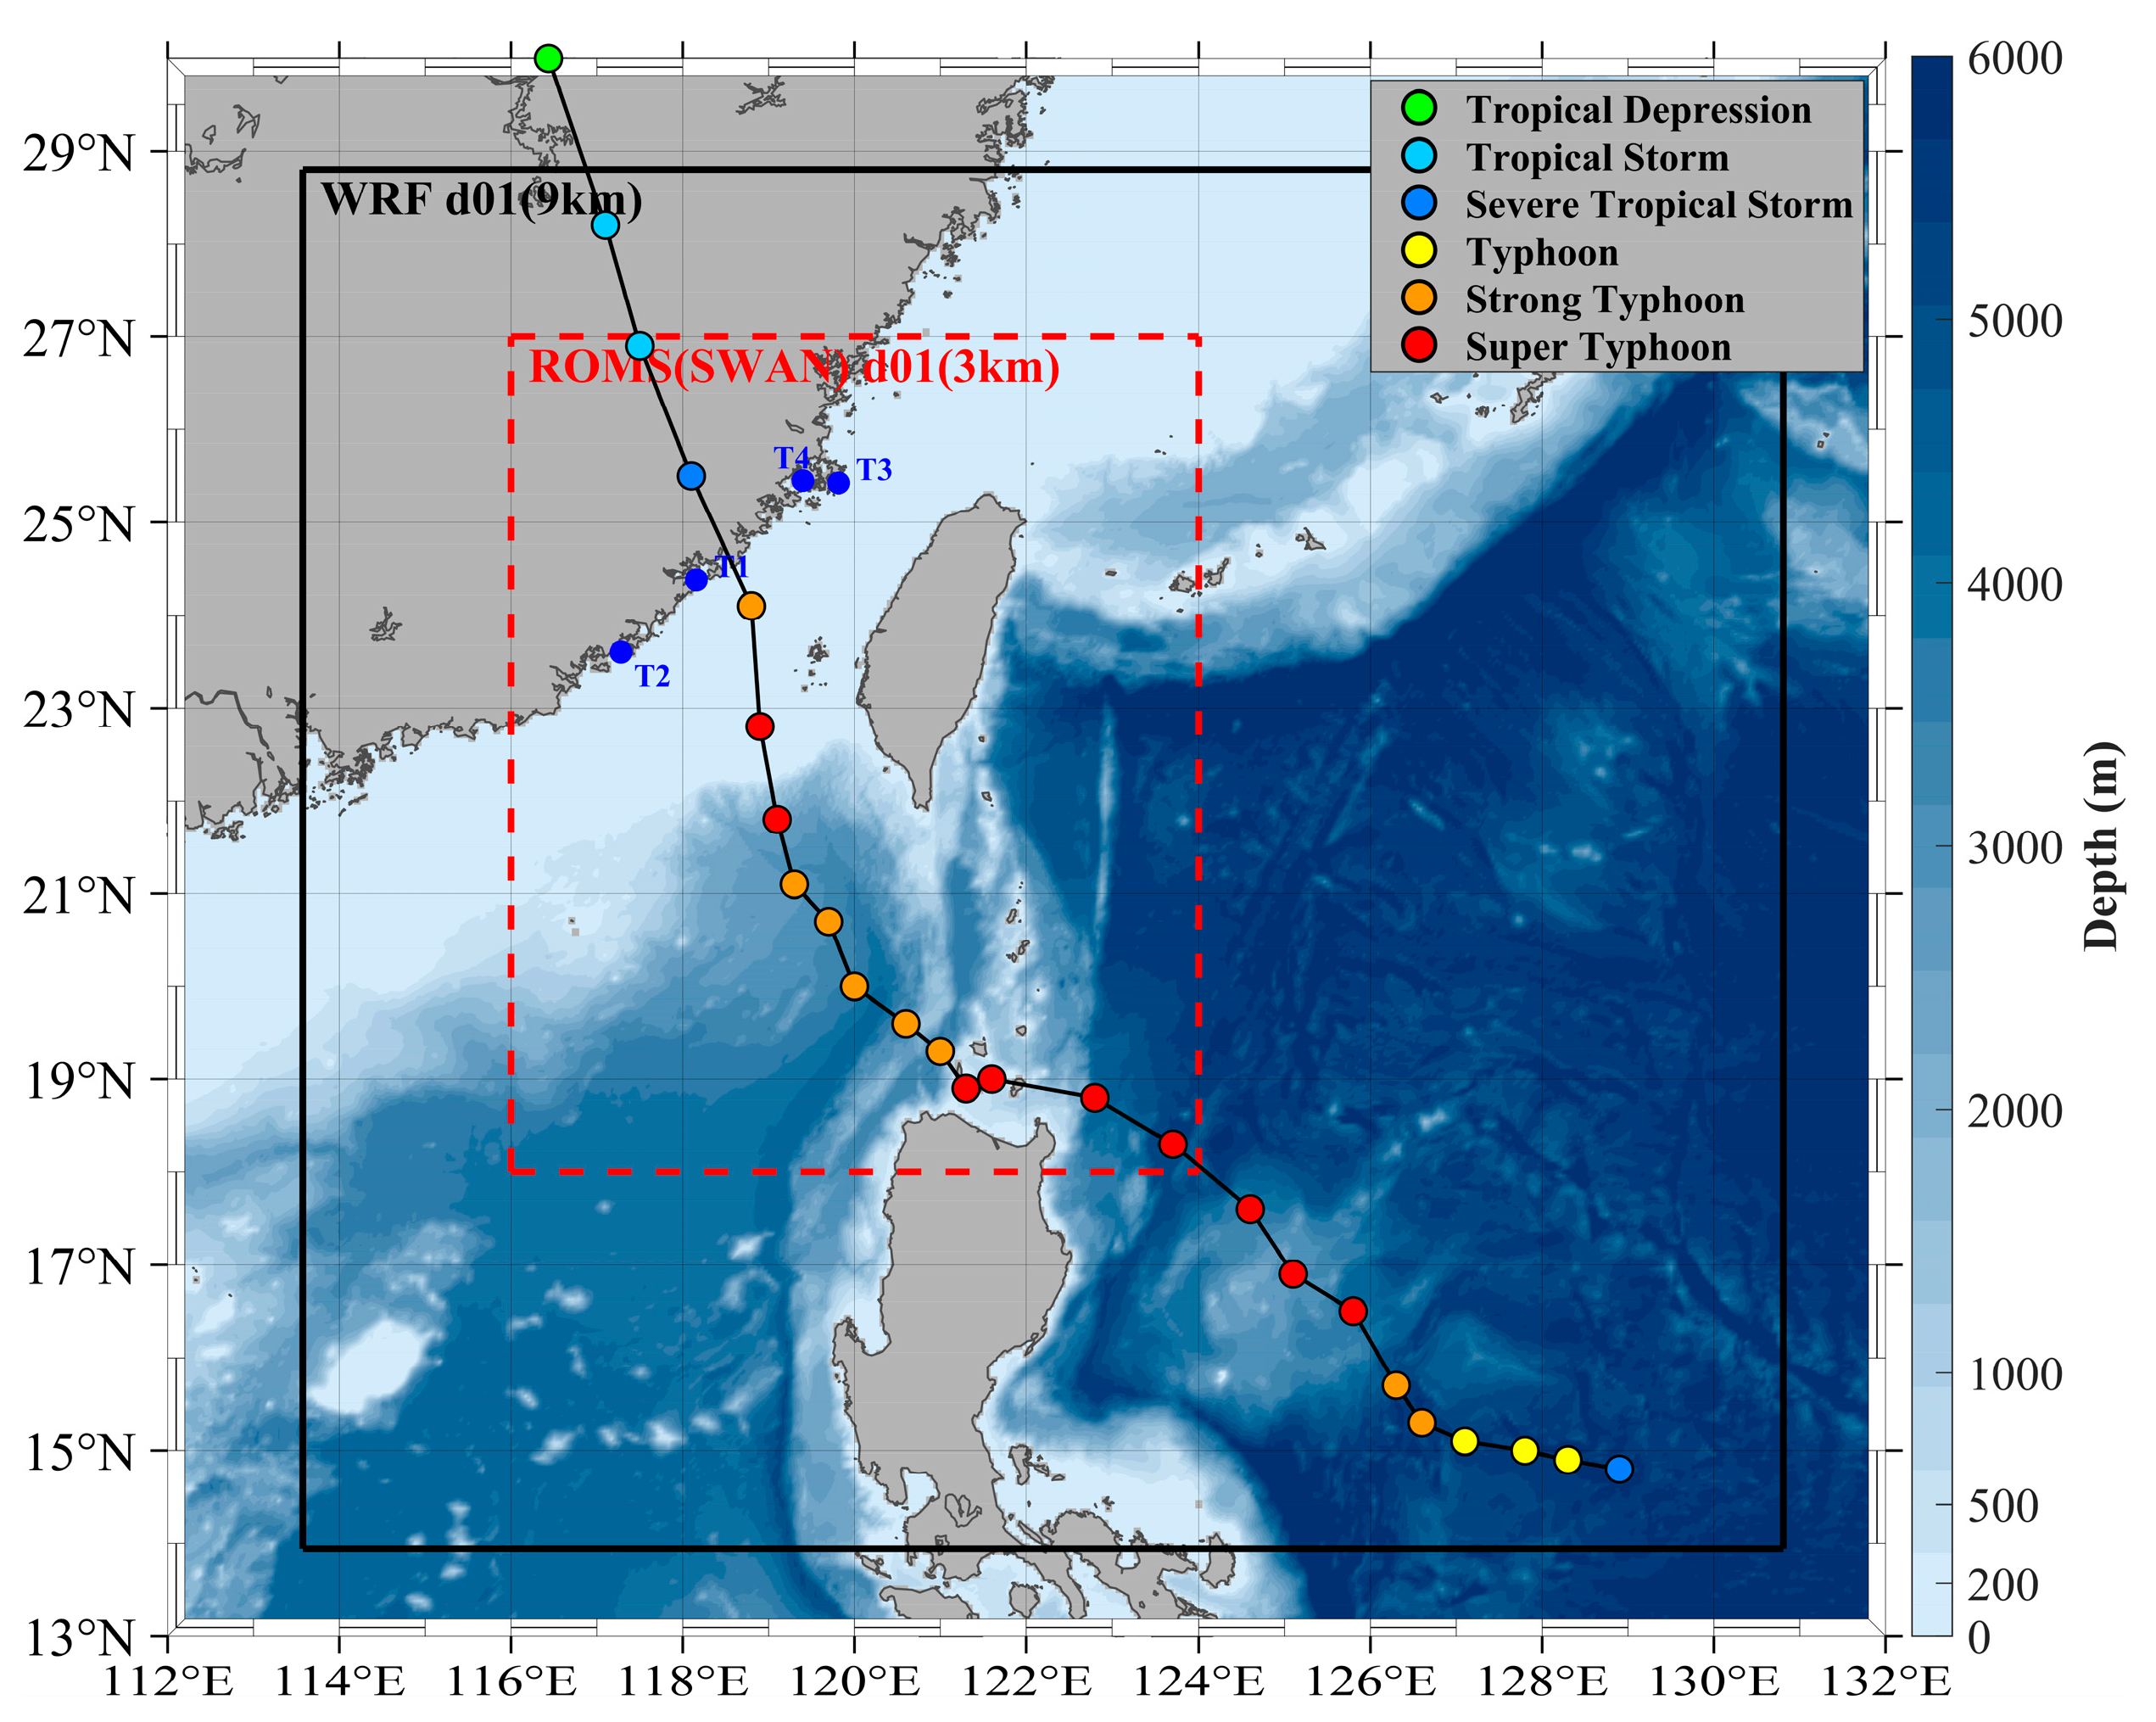
This study focuses on the region between 113° E and 130° E and between 14° N and 31.5° N, covering the northern South China Sea, the Bashi Channel, the Taiwan Strait, and parts of the western Pacific Ocean near the Philippines (Figure 1). This region completely covers the track of Typhoon Doksuri in 2023 and the areas potentially affected along the Fujian coast. The coastline in this area is highly irregular, with numerous semi-enclosed bays, estuaries, and shoals. Four characteristic points (T1–T4, Table 1) are selected across the study domain to represent diverse coastal settings and typhoon-relative positions. The model grid configurations are as follows. The Weather Research and Forecasting (WRF) atmospheric model has a grid resolution of 9 km with 200 by 186 grid points, covering 14° N to 31.5° N and 113° E to 130° E. The Regional Ocean Modeling System (ROMS) ocean model and the Simulating Waves Nearshore (SWAN) wave model share a common grid with a resolution of 3 km and 296 by 333 grid points, focusing on 18° N to 27° N and 116° E to 124° E, to better resolve nearshore processes.
Offshore bathymetry is derived from the GEBCO_2023 global seafloor topography dataset (https://www.gebco.net), with 15 arc-second resolution (~450 m), published by the British Oceanographic Data Centre (BODC). Nearshore bathymetry is refined using electronic nautical charts and regional sounding data, unified to a common datum, and merged with GEBCO data to improve nearshore topographic accuracy. Land elevation data for inundation assessment are obtained from the NASA Shuttle Radar Topography Mission (SRTM) 1 Arc-Second Global digital elevation model (SRTMGL1.003, ~30 m resolution) [33] (https://lpdaac.usgs.gov/products/srtmgl1v003/ (accessed on 1 January 2025)). Coastline vectors are primarily sourced from the Global Self-consistent Hierarchical High-resolution Geography Database (GSHHG) published by the National Oceanic and Atmospheric Administration (NOAA) (https://www.ngdc.noaa.gov/mgg/shorelines (accessed on 3 January 2024)), with manual corrections applied where necessary.
Initial and boundary conditions for the WRF atmospheric model are provided by the Global Data Assimilation System Final Analysis (FNL) data released by the National Centers for Environmental Prediction (NCEP), with a spatial resolution of 0.25° × 0.25° and a temporal interval of 6 h (https://rda.ucar.edu/datasets/ds083.2/ (accessed on 4 January 2025)). Variables include 33 isobaric surface elements such as temperature, wind field, humidity, and pressure. Initial conditions and lateral boundary forcing for the ROMS ocean model are provided by the Hybrid Coordinate Ocean Model (HYCOM) reanalysis product, with a horizontal resolution of 1/12° and 40 vertical layers (https://www.hycom.org). Tidal forcing is provided by the Oregon State University (OSU) TPXO tidal model (https://www.tpxo.net). Boundary conditions for the SWAN wave model are provided by the NOAA global wave spectral model WaveWatch III (WW3) (https://github.com/NOAA-EMC/WW3 (accessed on 6 January 2025)).
Model validation is performed using multiple source observational data, including the China Meteorological Administration (CMA) tropical cyclone best-track dataset (https://data.cma.cn), providing 3-hourly typhoon position, intensity class, central maximum wind speed, and minimum central pressure. Real-time observation data from marine meteorological stations provided by the National Marine Information Center are used for sea surface pressure and wind speed validation. Jason-3 satellite altimeter along-track significant wave height data are used for wave height validation, accessed through the NOAA NCEI archive (https://www.ncei.noaa.gov/archive/accession/Jason3-xGDR/ (accessed on 8 January 2025)) via FTP at (ftp://ftp.nodc.noaa.gov/nodc/data/jason3-gdr/gdr/)). Four tide gauge stations are selected for astronomical tide validation. All observational data used in this study are publicly available; the processed model output data presented in this paper are available from the corresponding author upon reasonable request.

2.2. Numerical Model Configuration

Numerical simulations in this study are conducted using the Coupled Ocean–Atmosphere–Wave–Sediment Transport (COAWST) coupled modeling system, version 3.7 [28]. This system was developed by the Woods Hole Oceanographic Institution and is publicly available at https://github.com/DOI-USGS/COAWST (accessed on 10 January 2025). It achieves two-way data exchange among the WRF, ROMS, and SWAN component models through the Model Coupling Toolkit (MCT) coupler. The coupling interval is 1800 s (30 min). Exchanged variables include: WRF provides 10 m wind, surface pressure, and heat fluxes to ROMS and SWAN; ROMS provides SST to WRF and currents/water levels to SWAN; and SWAN provides wave radiation stress, significant wave height, and peak period to ROMS and wave-induced surface roughness to WRF. The air–sea momentum and heat fluxes are computed using a bulk flux formulation with wave-dependent surface roughness. The simulation period covers 0000 UTC 21 July to 0000 UTC 29 July 2023. The first 48 h (21–22 July) serve as the model spin-up period. All subsequent validation and analyses use model output from 23 to 29 July 2023.
The WRF model employs the Advanced Research WRF (ARW) dynamic core, version 4.2.2. The horizontal direction uses an Arakawa C grid with Mercator projection and a horizontal resolution of 9 km. The vertical direction employs terrain-following mass coordinates with 35 layers, and the model top pressure is 50 hPa. Physical parameterization schemes are configured as follows: the microphysics process uses the Lin scheme; longwave and shortwave radiation both employ the Rapid Radiative Transfer Model for General Circulation Models (RRTMG) scheme; the land surface process uses the Noah scheme; the planetary boundary layer uses the Yonsei University (YSU) scheme; cumulus convection uses the Tiedtke scheme; and the near-surface layer is based on Monin–Obukhov similarity theory.
ROMS uses an Arakawa C grid with a horizontal resolution of 3 km and 16 sigma vertical layers (THETA_S = 5, THETA_B = 0.4, Vtransform = 2, Vstretching = 4). The vertical turbulence closure adopts the Mellor–Yamada 2.5-level scheme. Bottom stress follows a logarithmic drag law with a bottom roughness length of z0b = 0.02 m. The wetting–drying treatment uses a mass-conservative thin-layer scheme with a minimum depth threshold of Dcrit = 0.10 m. Initial and boundary conditions are provided by the HYCOM reanalysis product, and tidal forcing is provided by the TPXO tidal model. Open boundary conditions apply the Chapman implicit scheme for the free-surface, the Flather scheme for 2D momentum, and radiation with nudging for 3D momentum and tracers. The time step is 30 s.
SWAN is a third-generation wave model. Wave breaking uses a constant-breaking formulation with α = 1.0 and γ = 0.73, and bottom friction dissipation uses the Madsen formulation with an equivalent Nikuradse roughness of kn = 0.05 m. SWAN and ROMS share the same 3 km horizontal grid. Boundary conditions are provided by the NOAA WW3 model, with a time step of 180 s.

2.3. Scenario Design

To assess the impact of sea surface temperature rise and sea level rise on typhoon waves and storm surges, sensitivity experiments for SST rise and SL rise are designed in this study based on the projected 2100 increase ranges for the low-, medium-, and high-emission scenarios, SSP1-1.9, SSP2-4.5, and SSP5-8.5, in the IPCC Sixth Assessment Report (AR6) [32]. SST rise scenarios are set to +0.8 °C, +2.0 °C, and +3.5 °C, corresponding to the global mean sea surface temperature change mid-range values under low-, medium-, and high-emission pathways, respectively. SL rise scenarios are set to +0.4 m, +0.6 m, and +0.8 m, where +0.4 m corresponds to a conservative mid-term estimate under low-to-medium emission pathways, +0.6 m is consistent with the central 2100 estimate under the SSP2-4.5 pathway, and +0.8 m covers the extreme high-end result under high-emission pathways. Details of the experiment settings are provided in Table 2.
SST rise scenarios focus on the thermodynamic forcing effects of ocean–atmosphere interaction. Sea surface temperature is the main energy source for typhoon development, and high-temperature seawater continuously transfers heat to the atmosphere through sensible and latent heat fluxes, supporting typhoon intensification and wind field expansion. In this study, SST perturbations are applied by adding a uniform temperature increment (+0.8 °C, +2.0 °C, or +3.5 °C) to the ROMS initial temperature field at the surface layer to achieve warming scenarios. In this framework, SST changes directly act on the atmospheric model (WRF), affecting typhoon track and intensity simulation by altering air–sea interface heat exchange. The ocean model (ROMS) and wave model (SWAN) are primarily driven by wind field changes output from WRF, rather than being directly regulated by the initial SST.
SL rise scenarios are implemented using a static mean sea surface elevation method. Specifically, a constant SL rise increment (+0.4 m, +0.6 m, or +0.8 m) is simultaneously added to the water depth and all open boundary tidal water level time series, serving as a modified physical boundary condition for model input. This approach effectively raises the mean sea level by deepening the water column at all grid nodes.

2.4. Model Validation

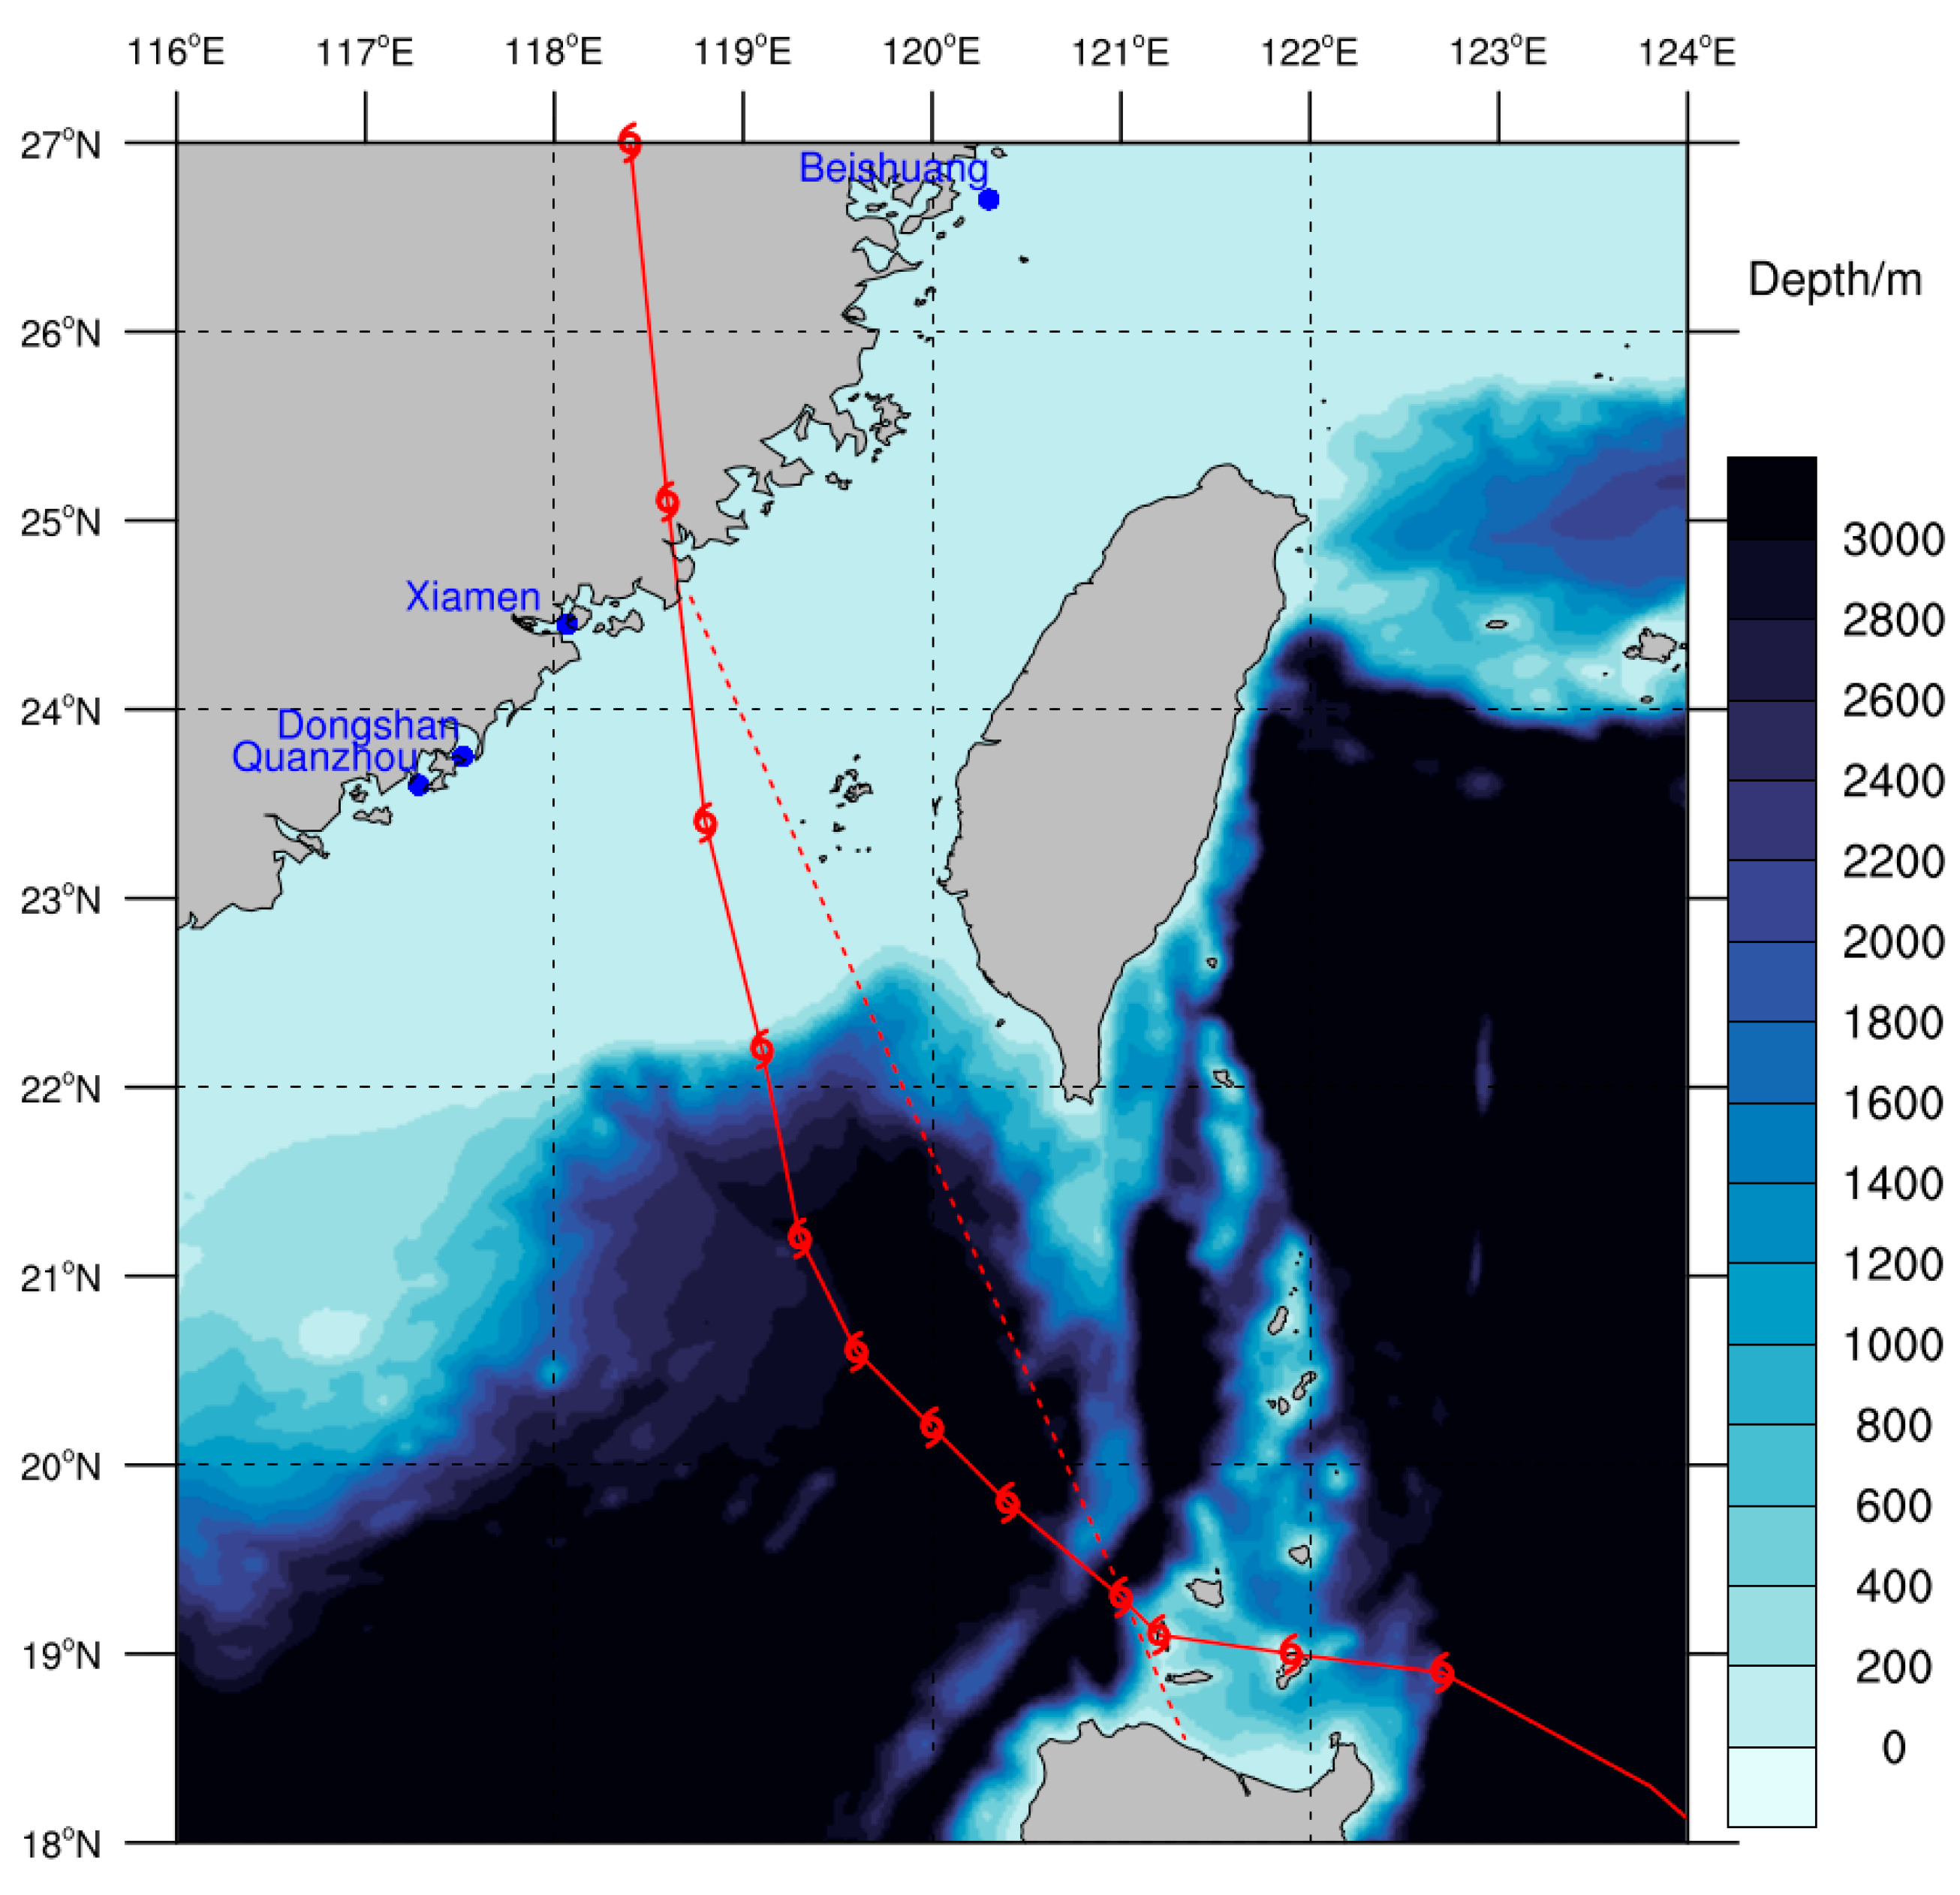
To comprehensively assess the reliability of the coupled model, validation is performed against multiple observational datasets, including typhoon track and intensity from the China Meteorological Administration (CMA) best-track archive, surface meteorological station measurements, tide gauge records, and satellite altimeter data. Figure 2 shows the spatial distribution of the validation stations used in this study.

2.4.1. Typhoon Track Validation

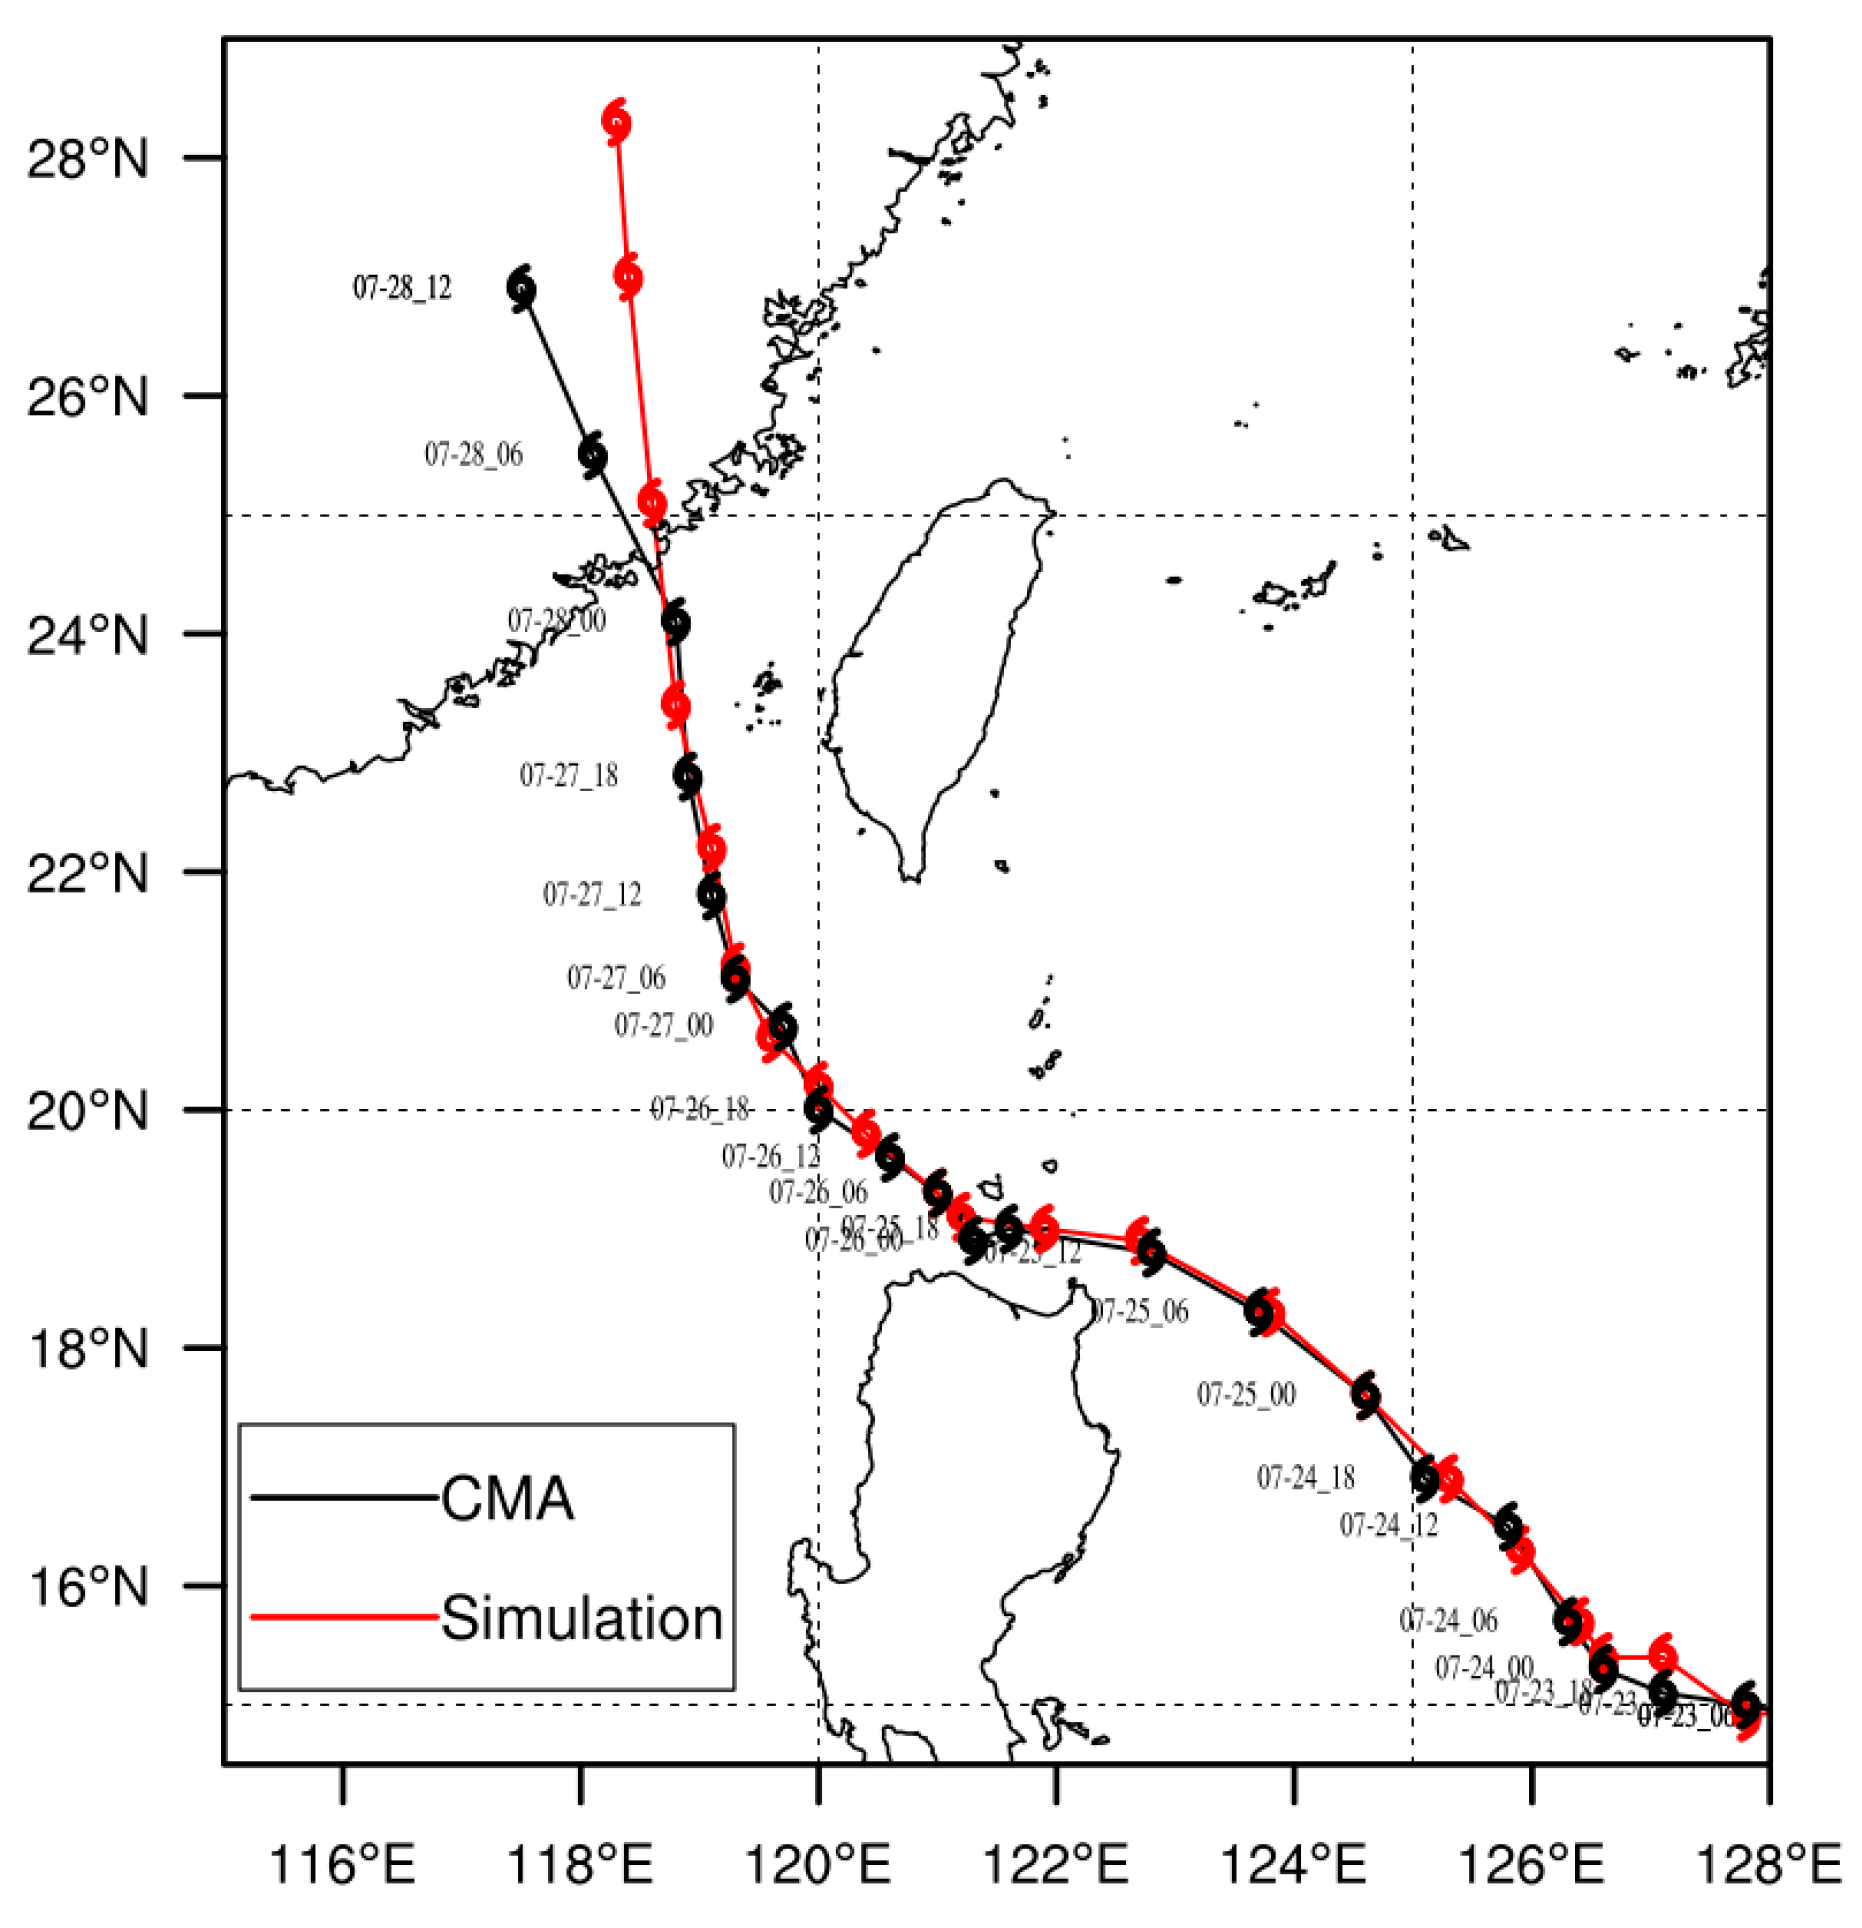
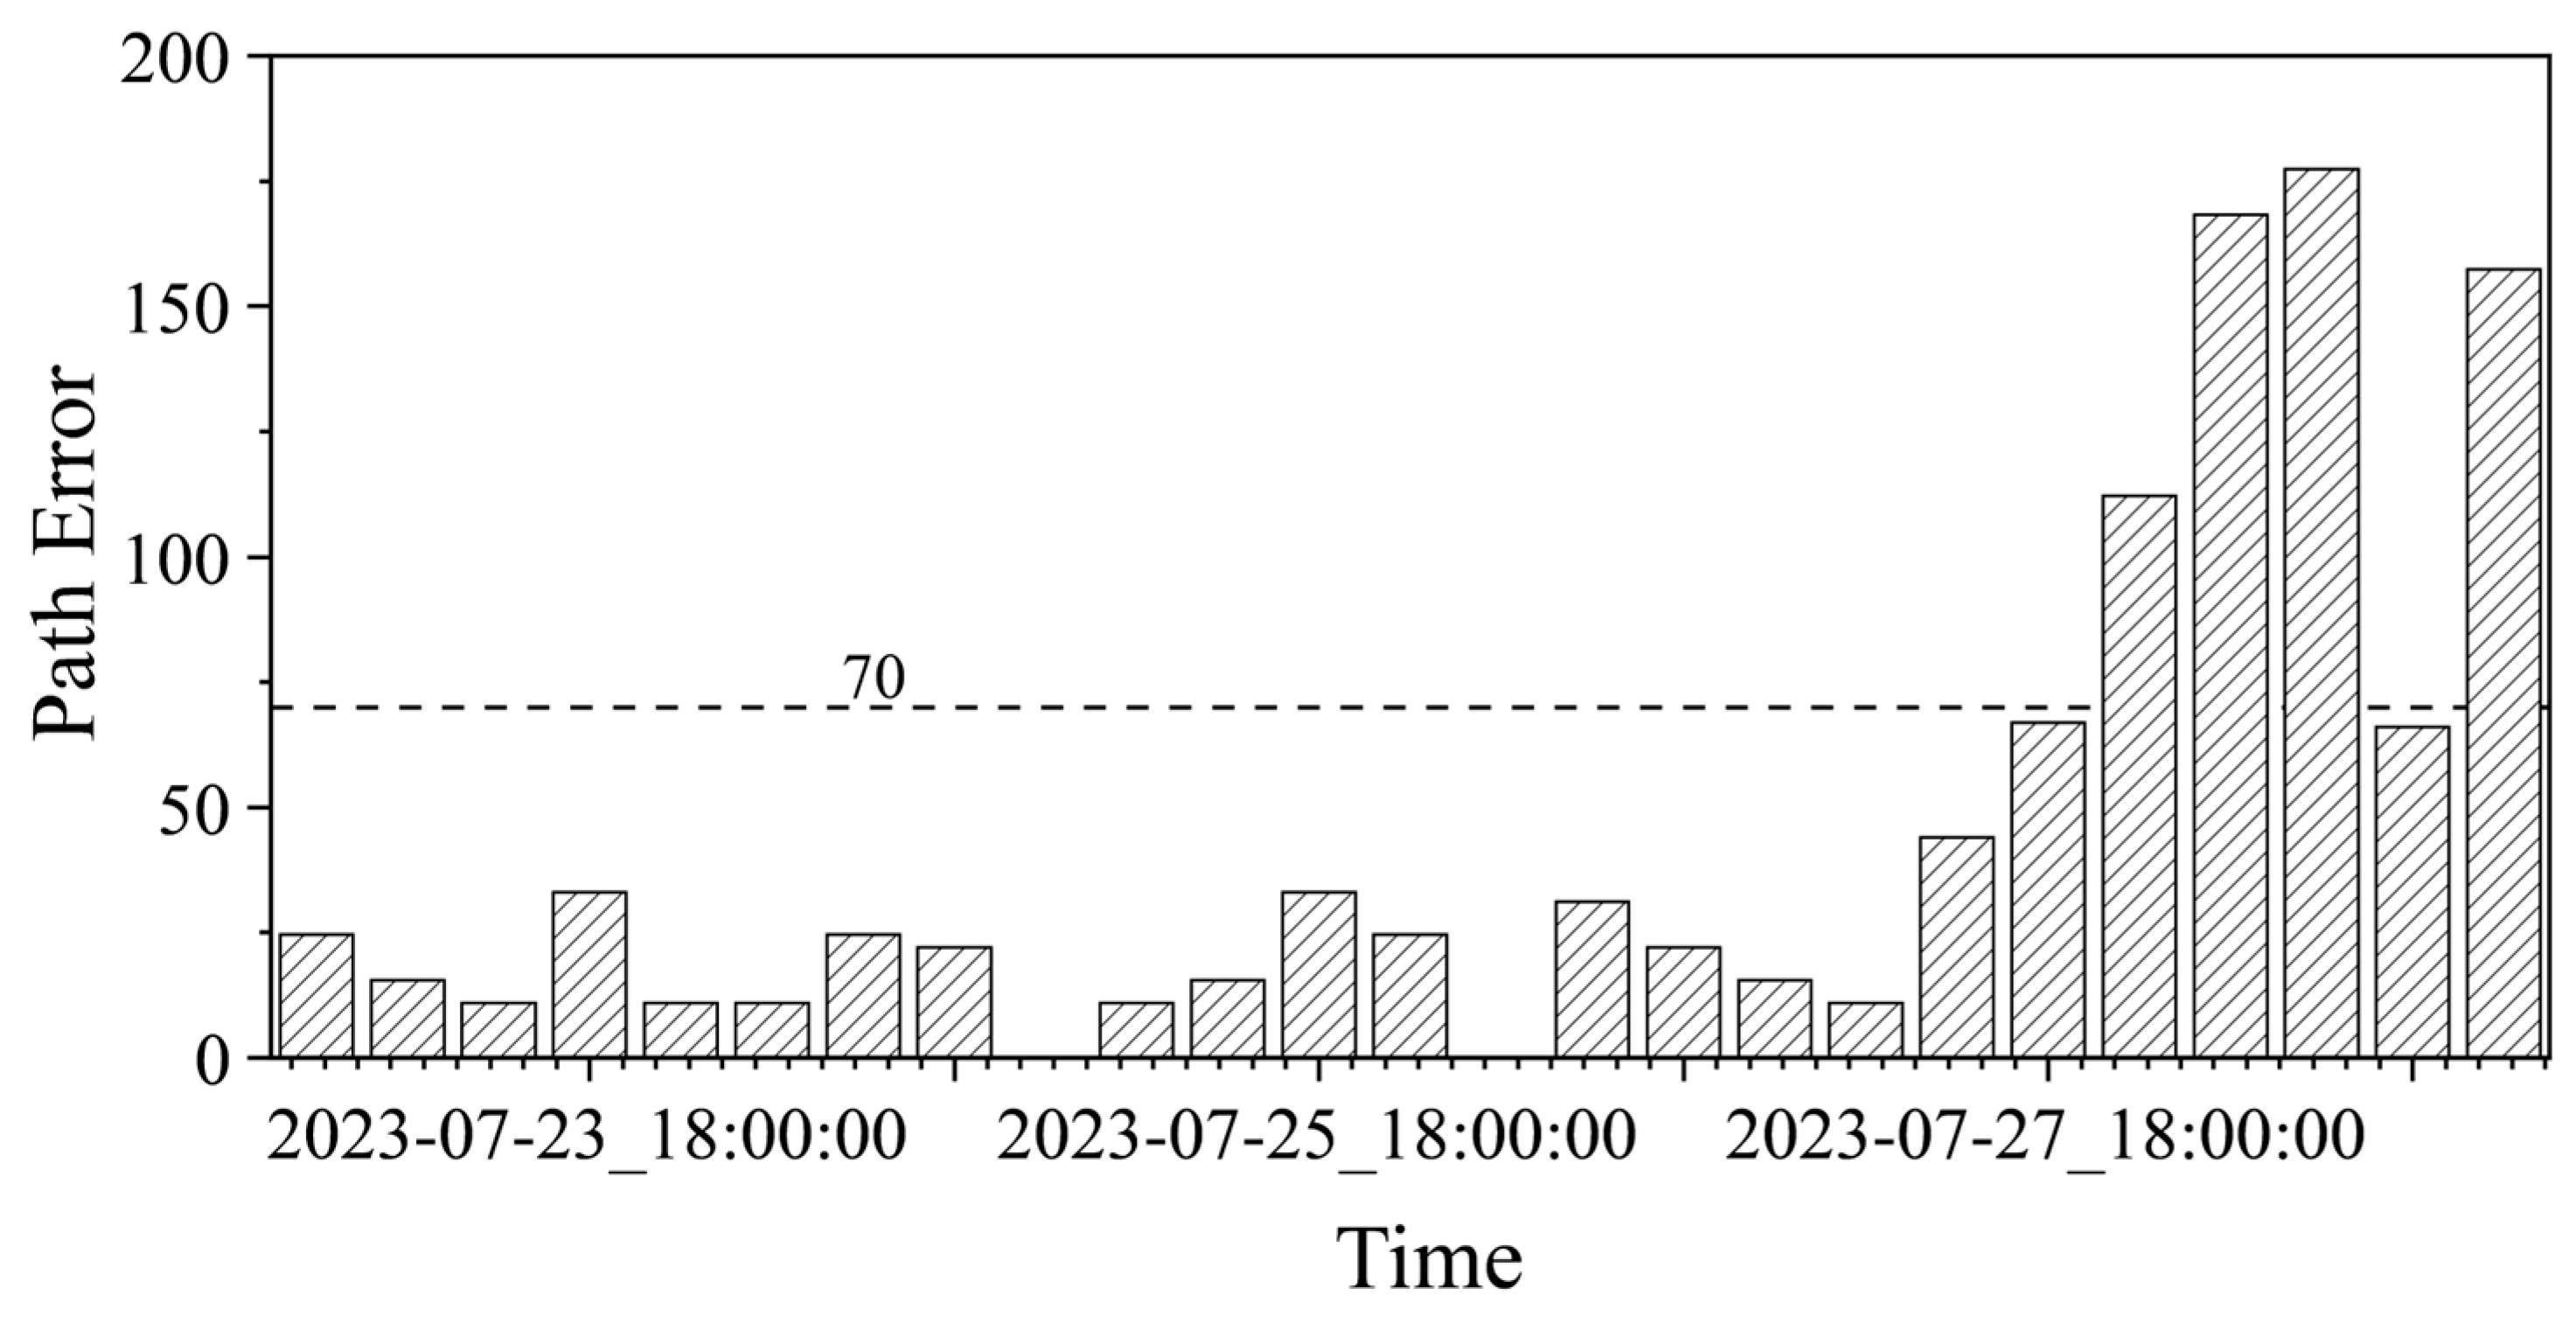
The simulated typhoon track is validated against the CMA best-track dataset at 6-hourly intervals (Figure 3). The simulated track generally follows the observed trajectory from genesis in the western Pacific to landfall on the Fujian coast. Track errors at each 6-hourly interval remain well below 70 km prior to landfall (Appendix A, Figure A1), indicating satisfactory reproduction of the typhoon’s northwesterly propagation and landfall location.

2.4.2. Wind Field Validation

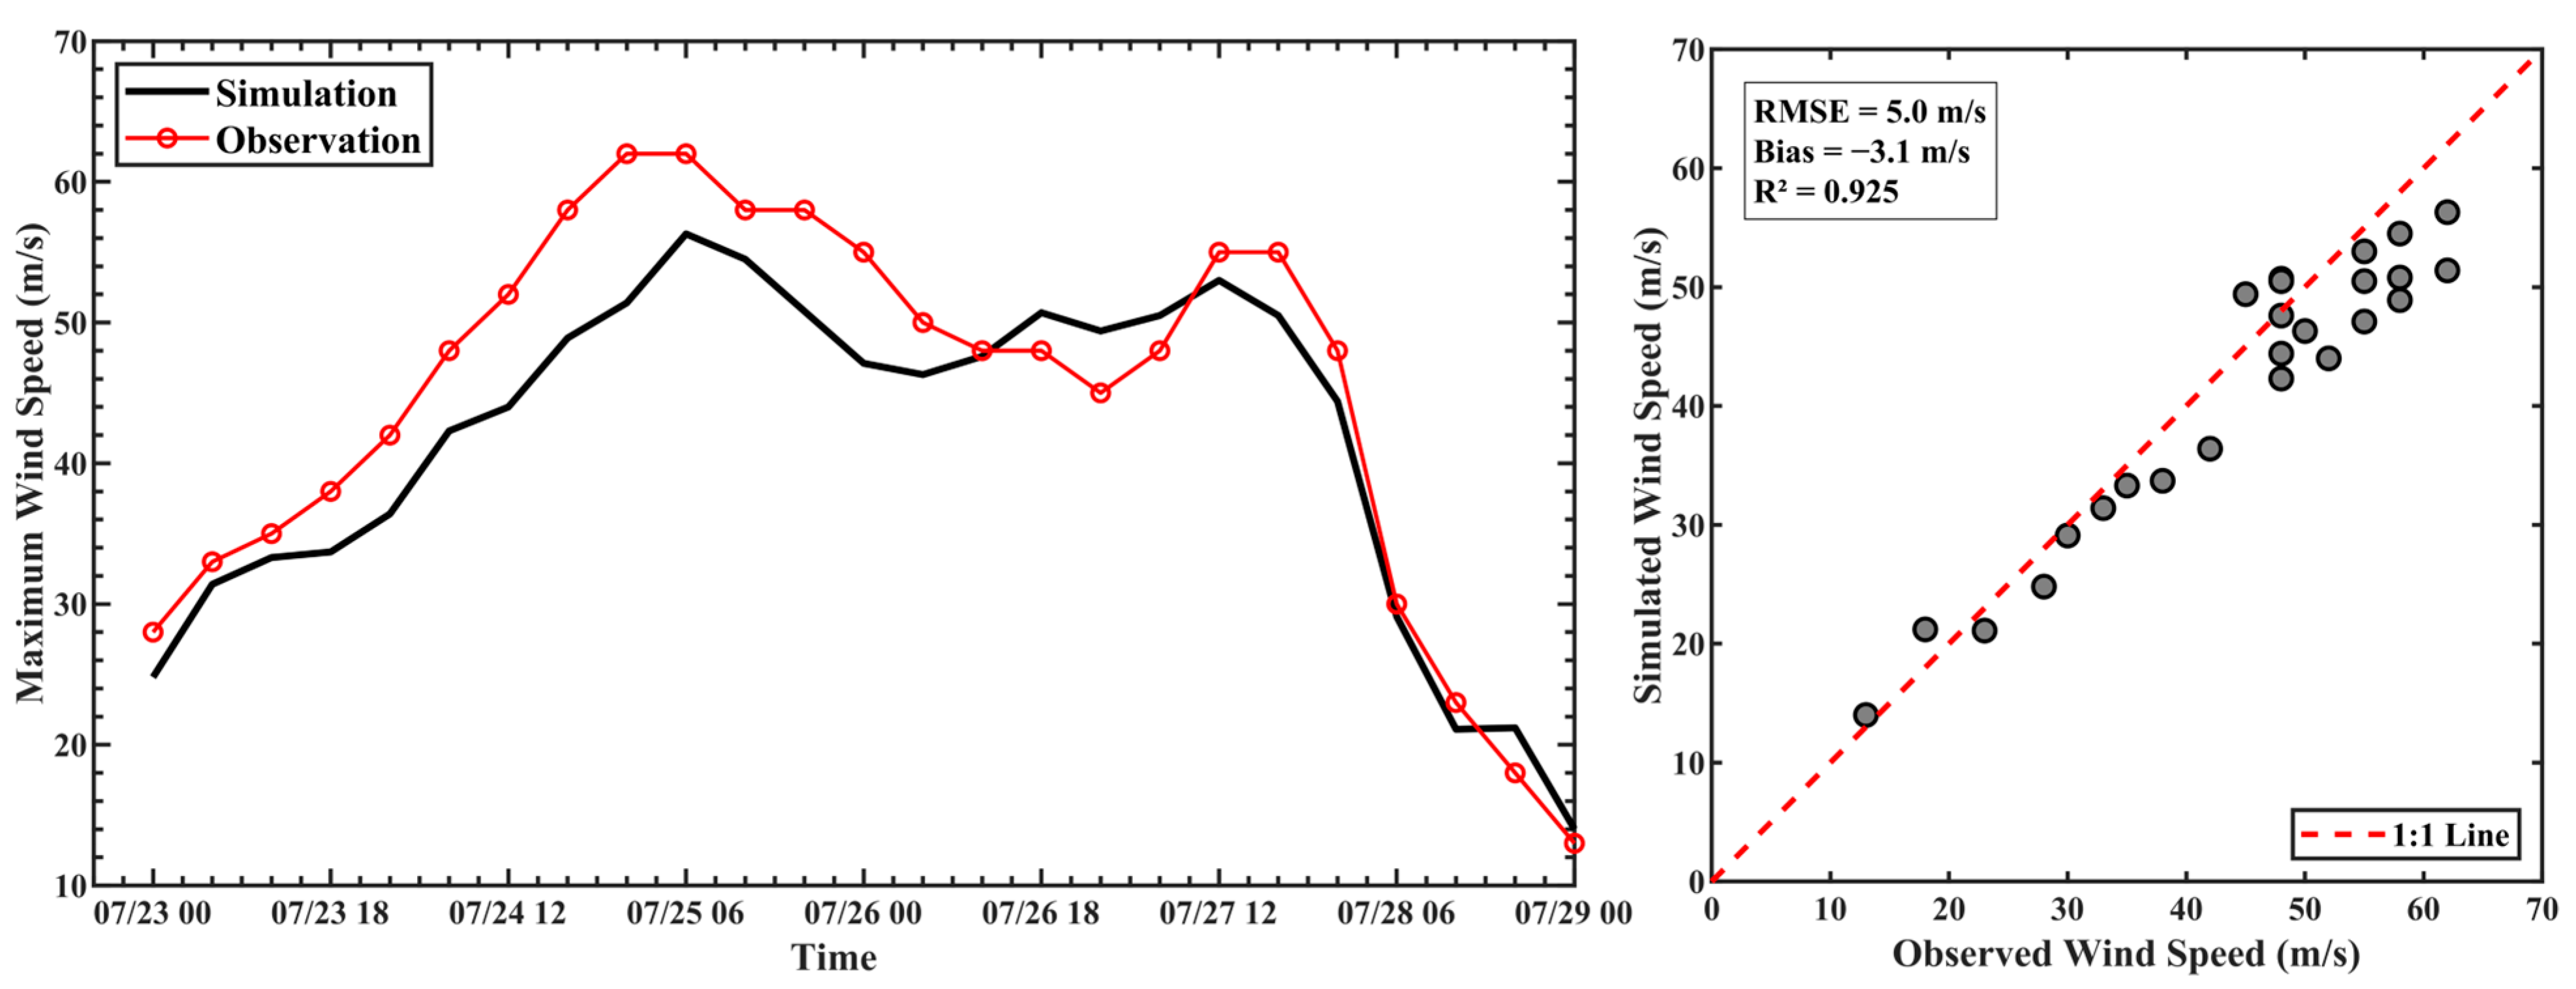
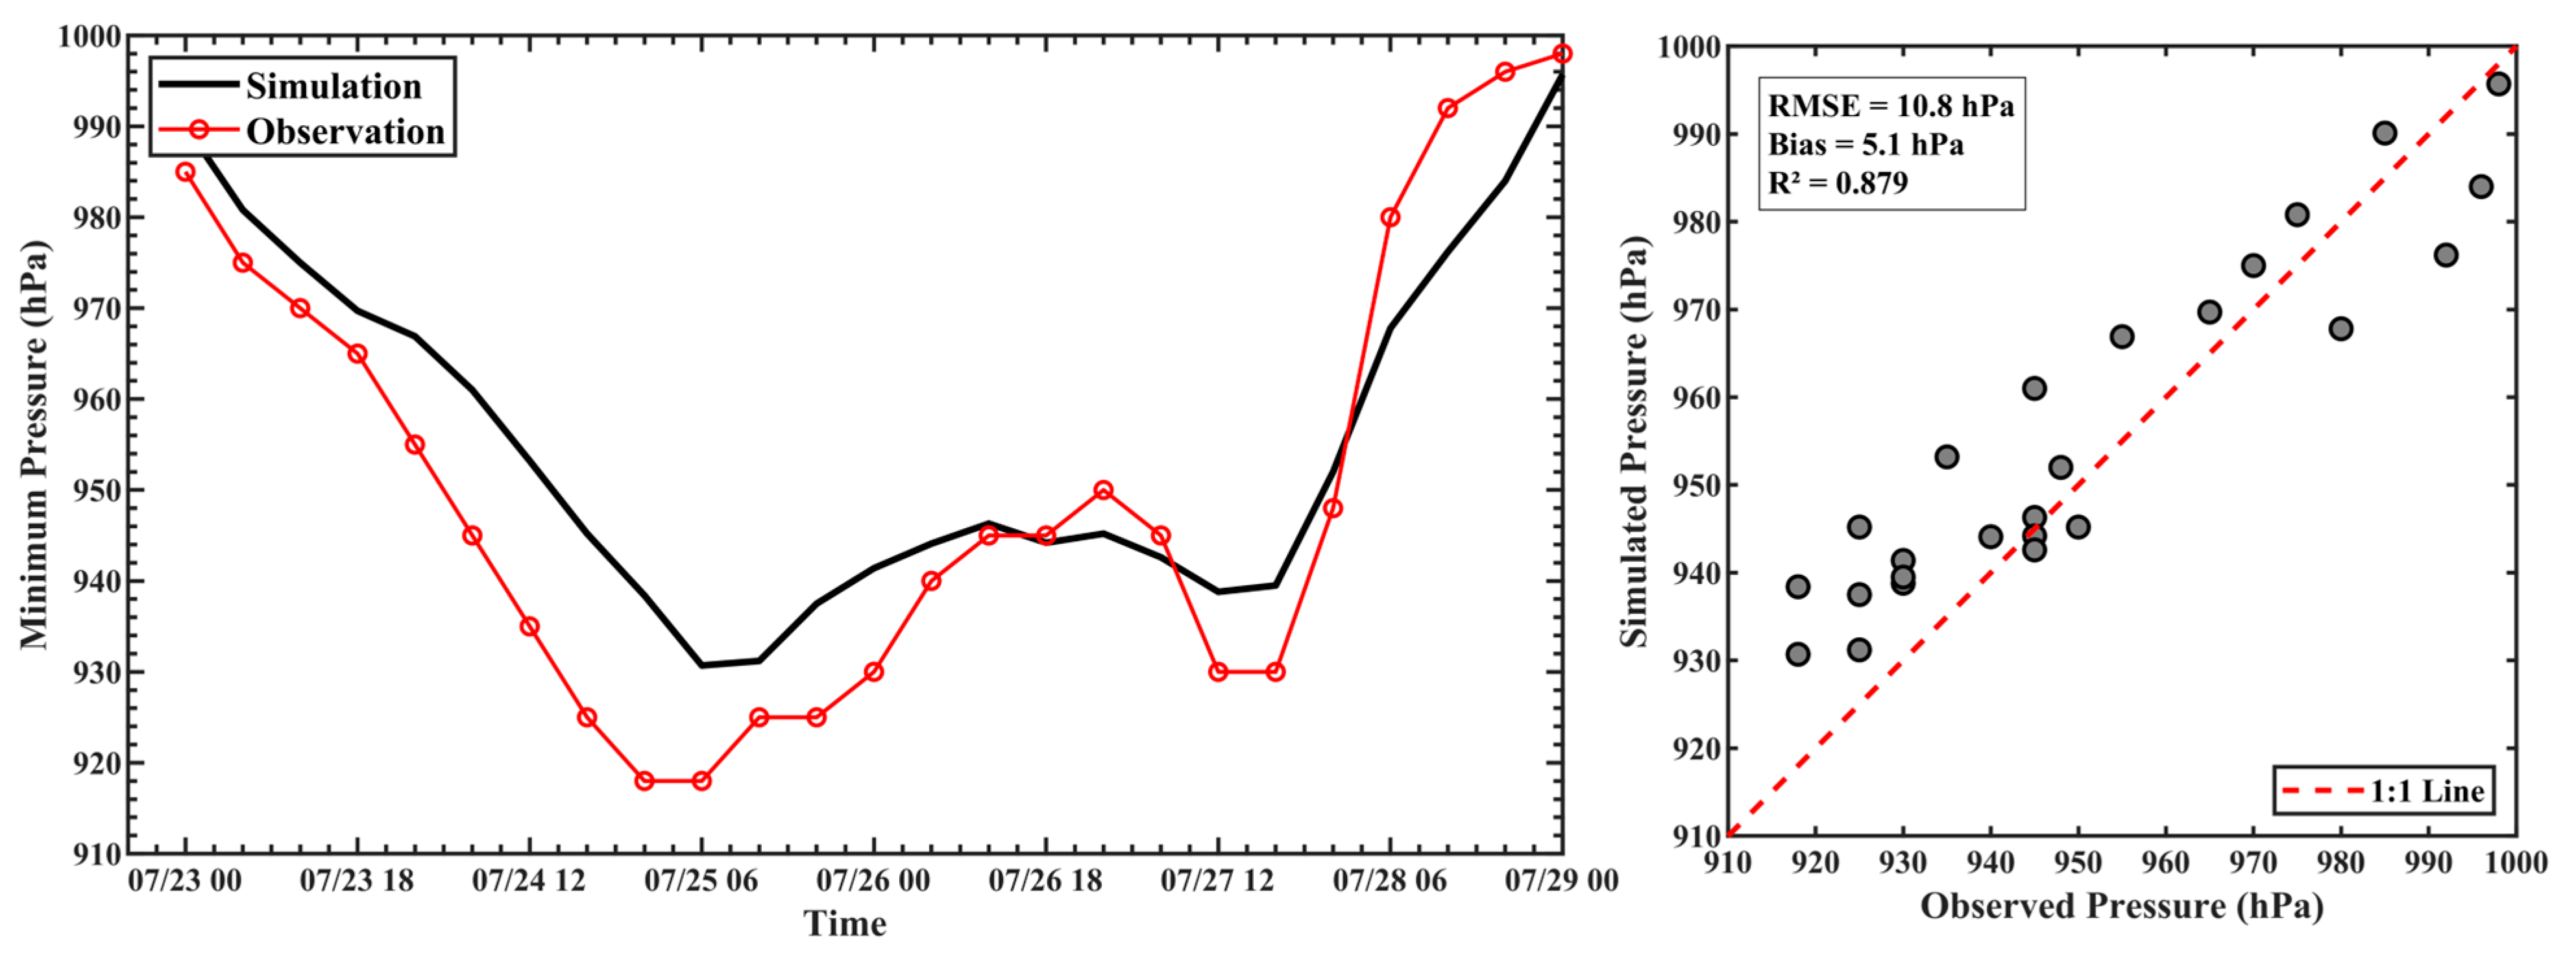
Typhoon intensity is validated by comparing simulated maximum 10 m wind speed and minimum sea-level pressure against the CMA best-track dataset (Figure 4 and Figure 5). The simulated maximum wind speed yields RMSE = 5.0 m/s, Bias = −3.1 m/s, and R2 = 0.925. The minimum central pressure shows RMSE = 10.8 hPa, Bias = 5.1 hPa, and R2 = 0.879, with the simulation generally overestimating the central pressure during the rapid intensification phase (24–25 July).
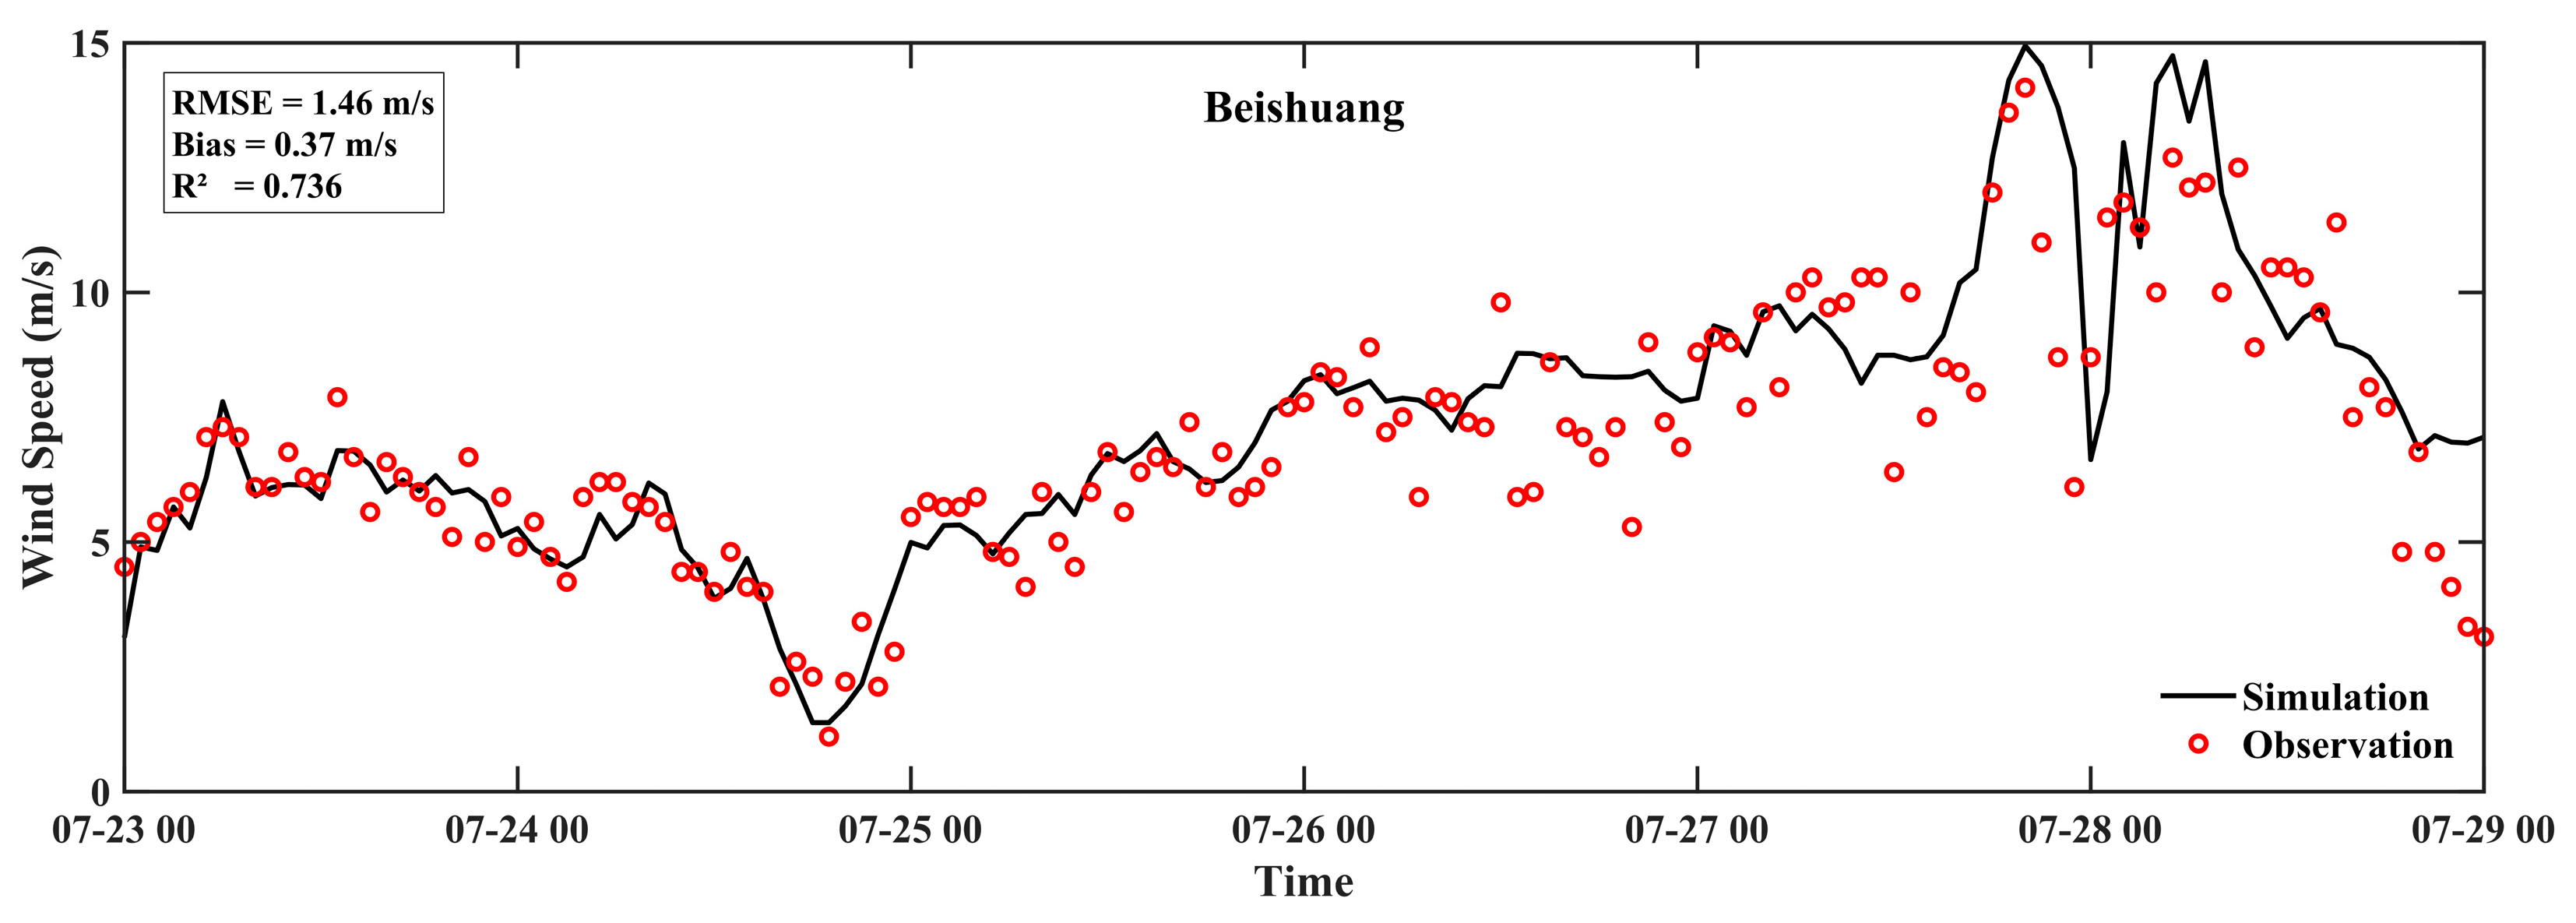
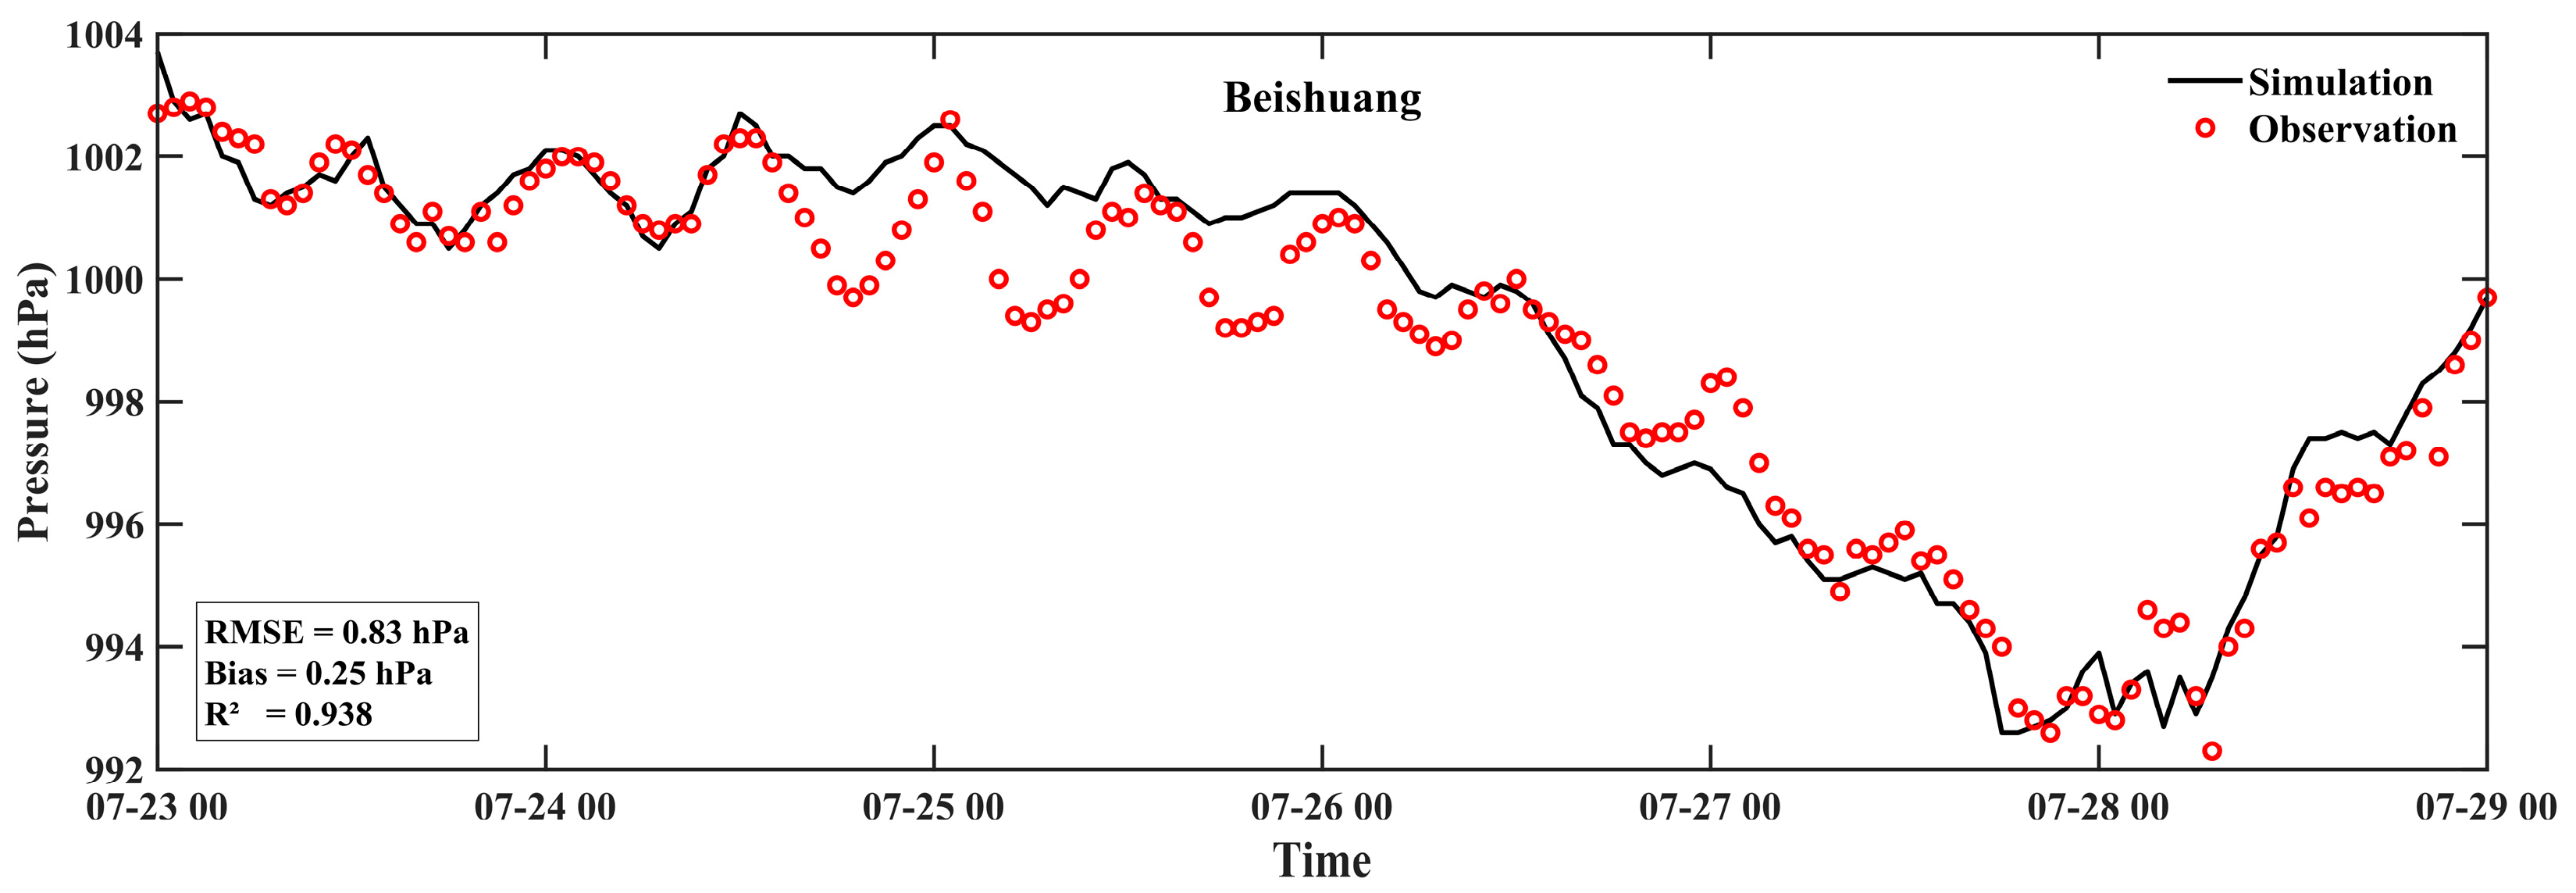
Local wind field representation is further validated using simulated 10 m wind speed and sea-level pressure at Beishuang meteorological station (120.30° E, 26.70° N), compared with hourly observations (Figure 6 and Figure 7). The wind speed simulation captures the temporal evolution during typhoon approach, with RMSE = 1.46 m/s, Bias = 0.37 m/s, and R2 = 0.736. The sea-level pressure simulation shows excellent agreement, with RMSE = 0.83 hPa, Bias = 0.25 hPa, and R2 = 0.938.

2.4.3. Astronomical Tide Validation

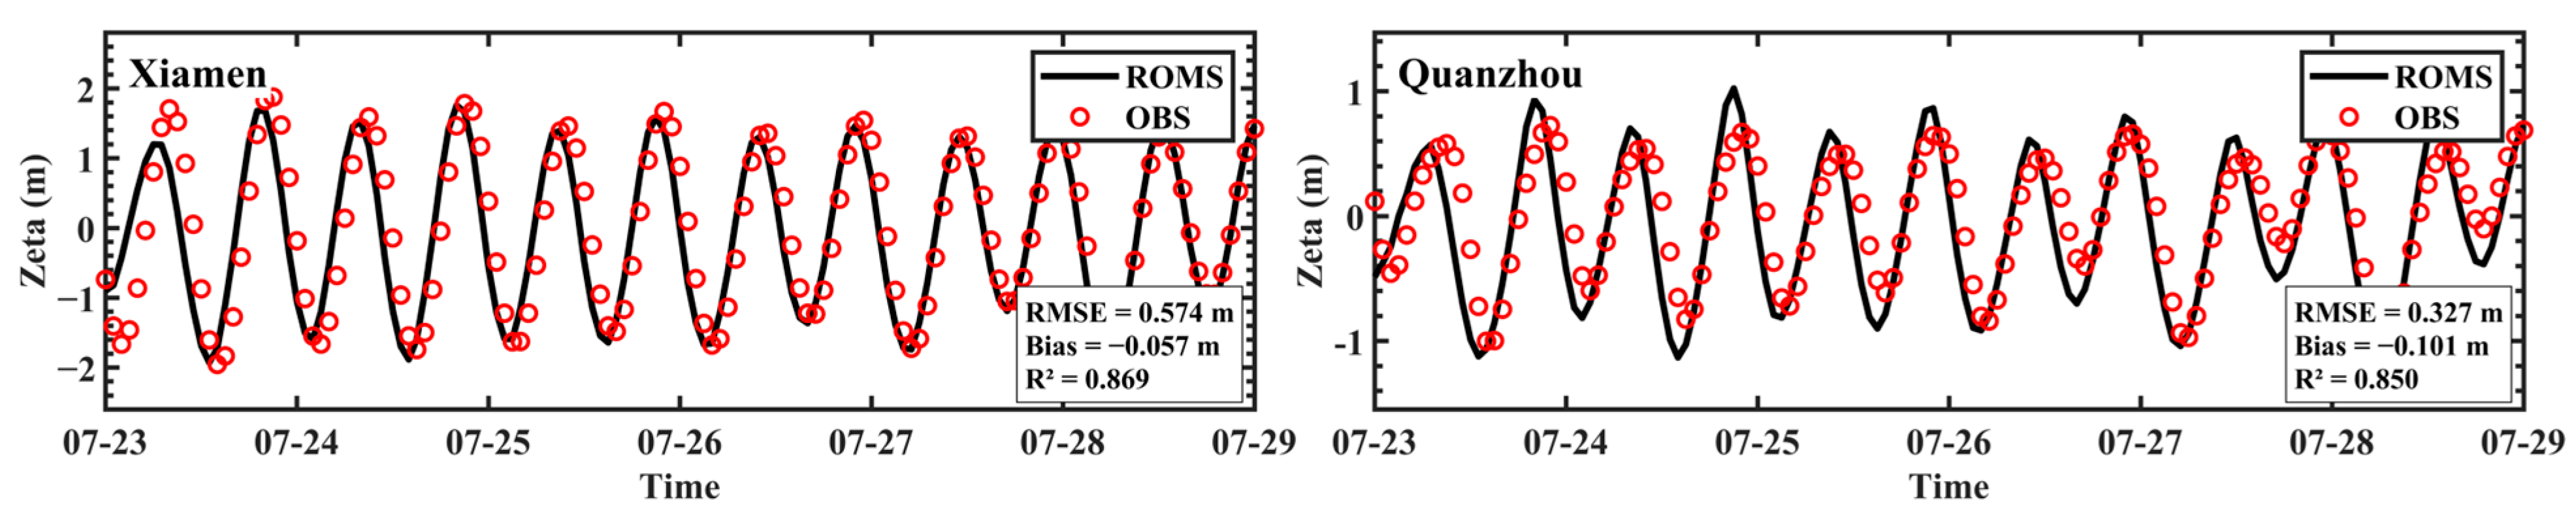
Astronomical tide validation is conducted at two tide gauge stations for the simulation period from 23 to 29 July 2023. Figure 8 presents the comparison of astronomical tide time series at the Xiamen (118.07° E, 24.45° N) and Quanzhou (117.28° E, 23.6° N) representative stations. The results show good agreement between simulated and observed data, with tidal amplitude and phase reasonably captured. The statistical results indicate that the RMSE values at the two validation stations are 0.574 m and 0.327 m, respectively. The Bias values are −0.057 m and −0.101 m, respectively. The R2 values are both greater than 0.85, providing a reliable hydrodynamic background field for subsequent storm surge simulation.

2.4.4. Total Water Level Validation

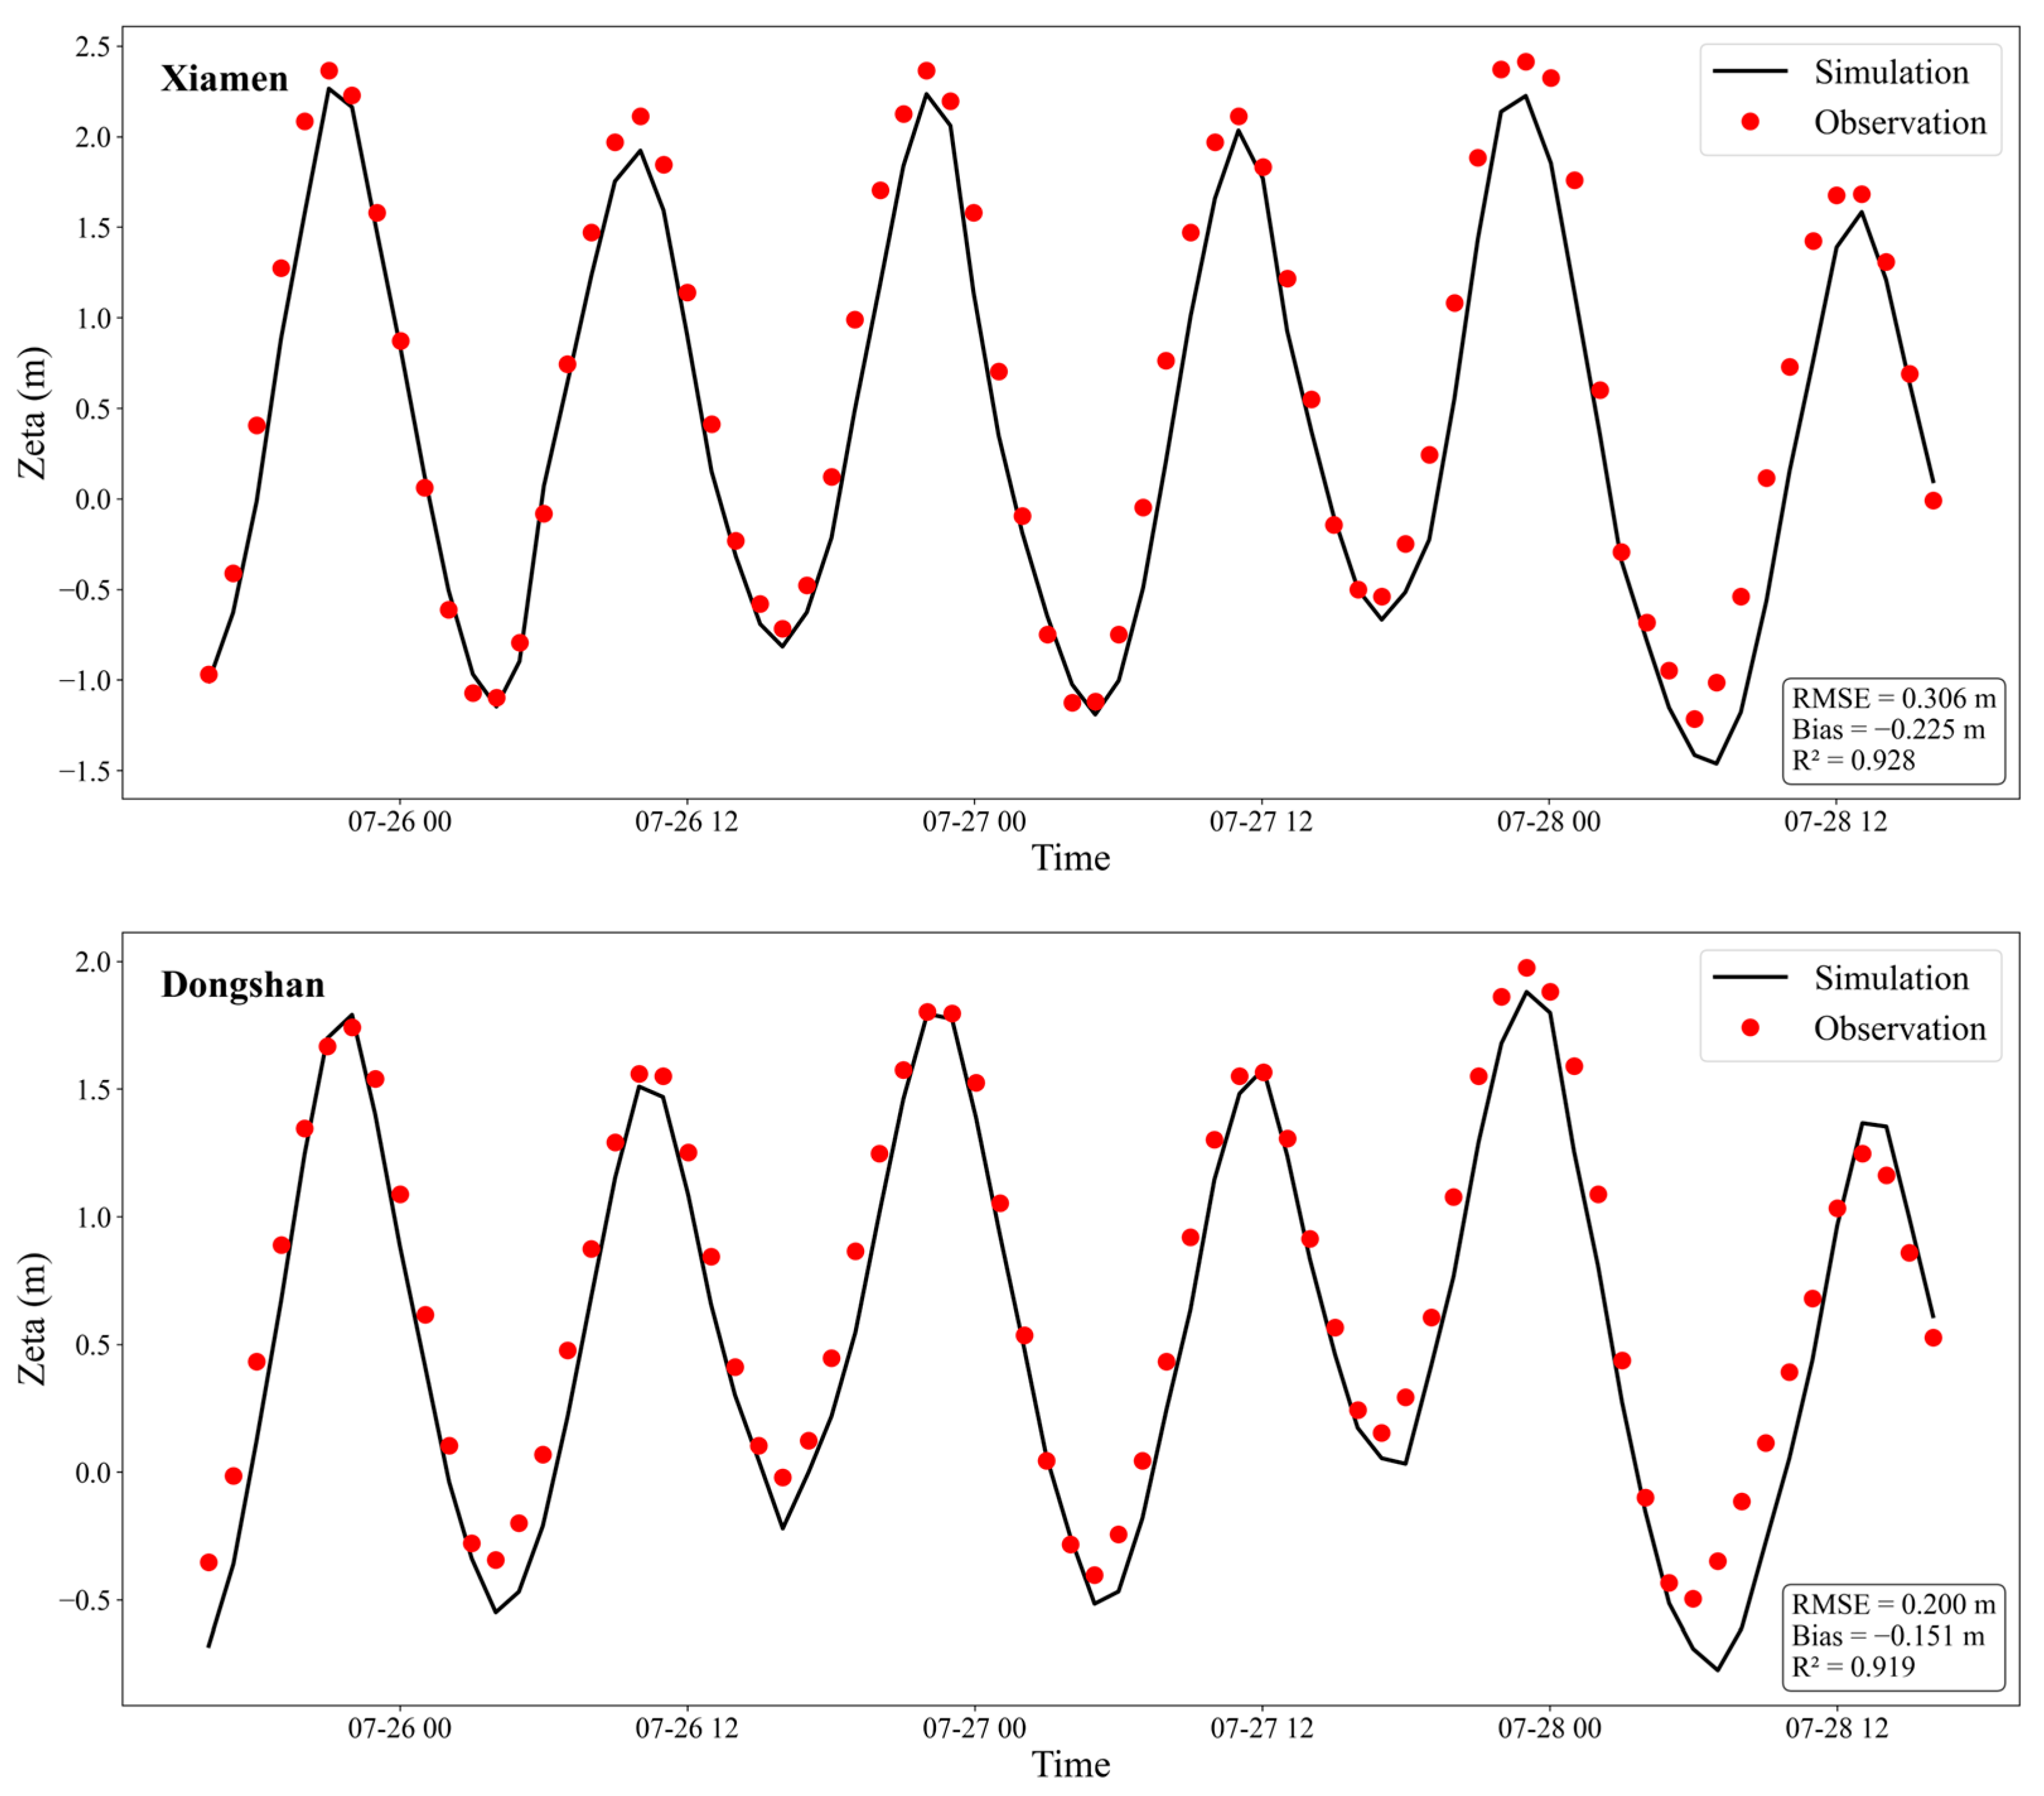
Total water level (astronomical tide + storm surge) validation is performed by comparing the simulated results with observed data at Xiamen (118.07° E, 24.45° N) and Dongshan (117.52° E, 23.75° N) stations (Figure 9). The observational data are extracted from Xiao and Lu [27]. The agreement with observations is strong: Xiamen achieves R2 = 0.928 and RMSE = 0.306 m, and Dongshan achieves R2 = 0.919 and RMSE = 0.200 m. The model captures both the water level peak magnitudes and their temporal evolution, indicating that the coupled system provides a reliable representation of surge dynamics. There is a slight underestimation of peak water level (Bias = −0.225 m at Xiamen and −0.151 m at Dongshan).

2.4.5. Significant Wave Height Validation

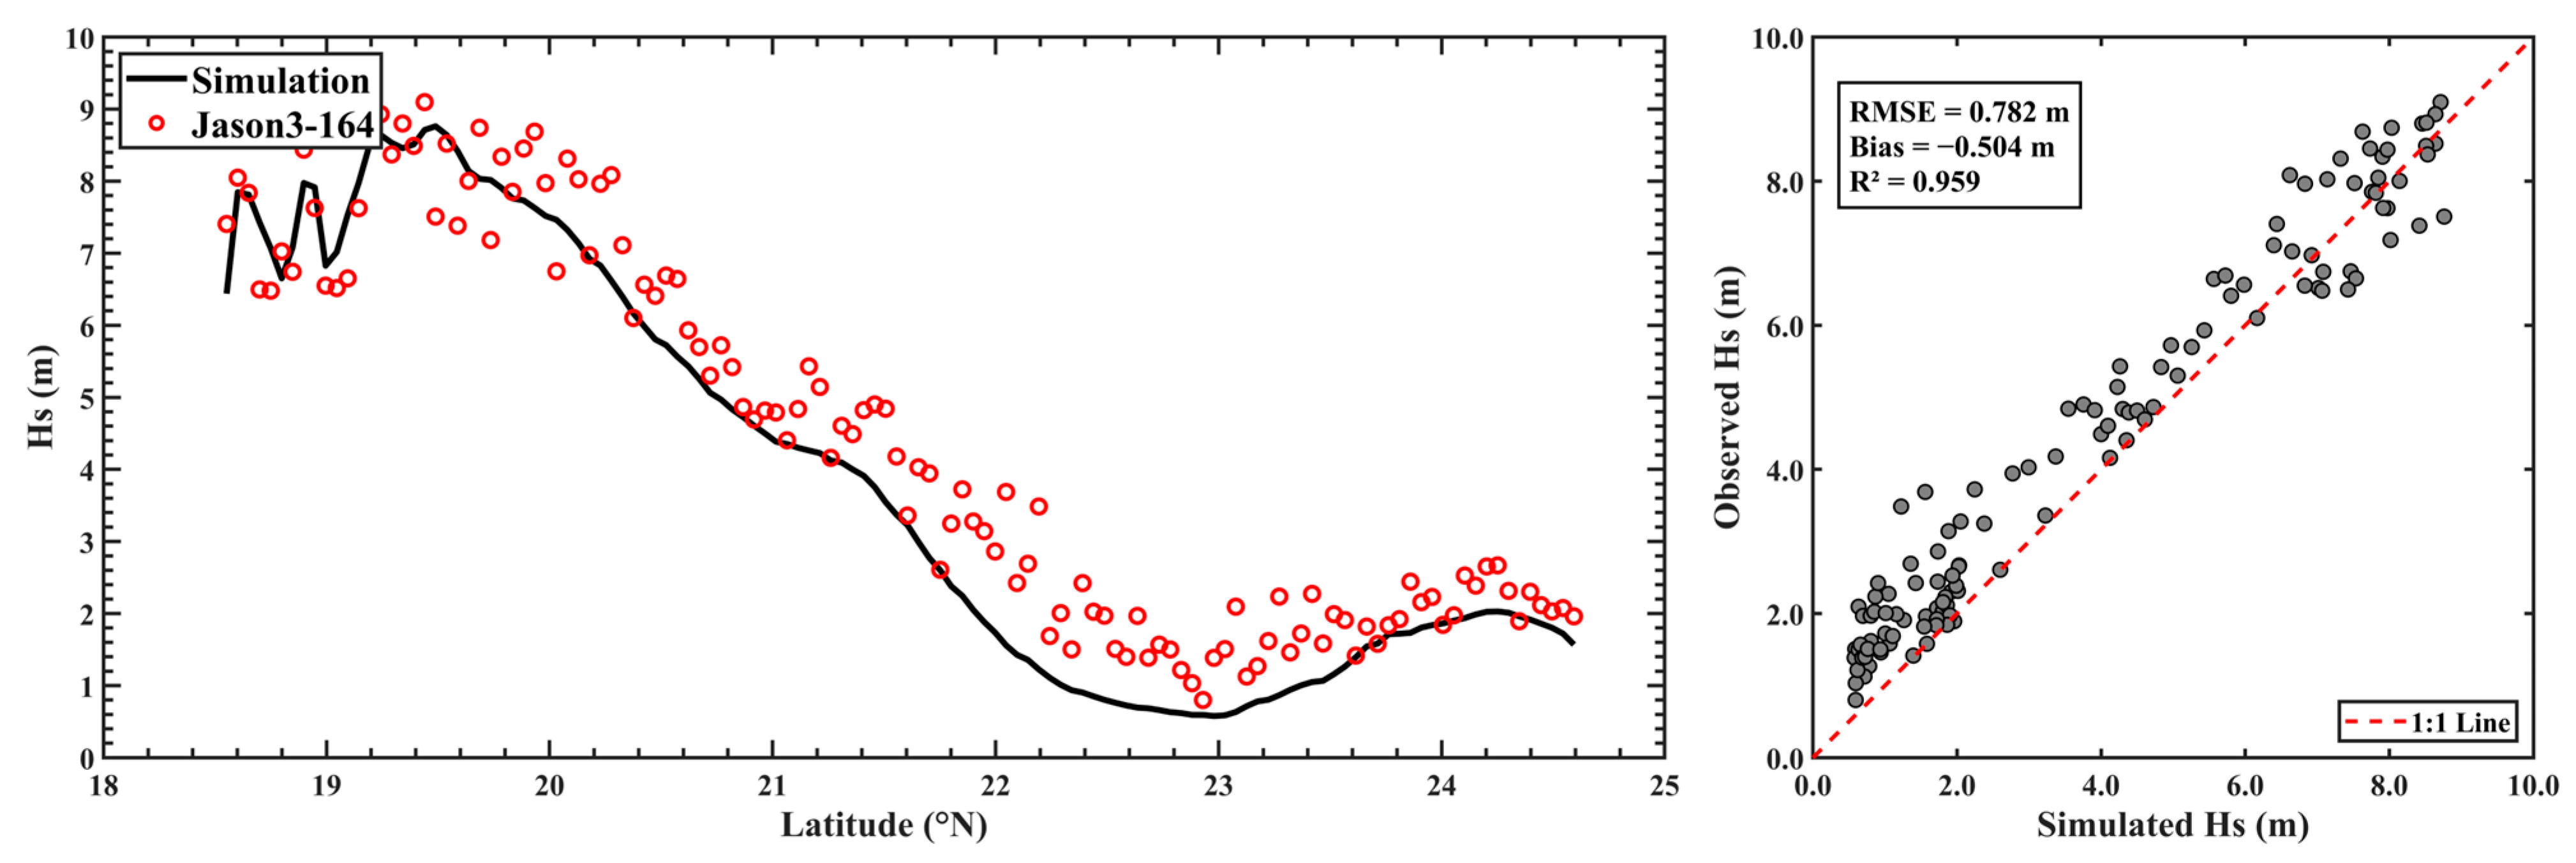
Significant wave height validation is performed using Jason-3 satellite altimeter along-track data. Figure 10 shows the simulated and observed significant wave height time series, left, and scatter distribution, right, for Jason-3 Track 164. The model reasonably captures the peak magnitude and spatial decay trend of significant wave height during the typhoon period. The coefficient of determination for this track is 0.959, RMSE is 0.782 m, and Bias is −0.504 m, indicating reliable simulation results for typhoon waves.
Taken together, the validation results demonstrate that the coupled model achieves acceptable accuracy across all examined categories (Table 3). The simulated track follows the CMA best-track with pre-landfall errors well below 70 km. Wind field and intensity metrics (R2 = 0.736–0.938) confirm that the model reasonably reproduces the typhoon’s pressure and wind structure. Astronomical tide validation (R2 > 0.85) establishes a reliable hydrodynamic background, while total water level validation (R2 > 0.91, RMSE < 0.31 m at both stations) confirms the model’s skill in capturing surge dynamics. Wave height validation (R2 = 0.959) further supports the model’s reliability for subsequent SST sensitivity and SL impact analysis.

3. Results

3.1. Influence of Sea Surface Temperature Rise on Typhoon Waves and Storm Surges

3.1.1. Typhoon Intensity Response

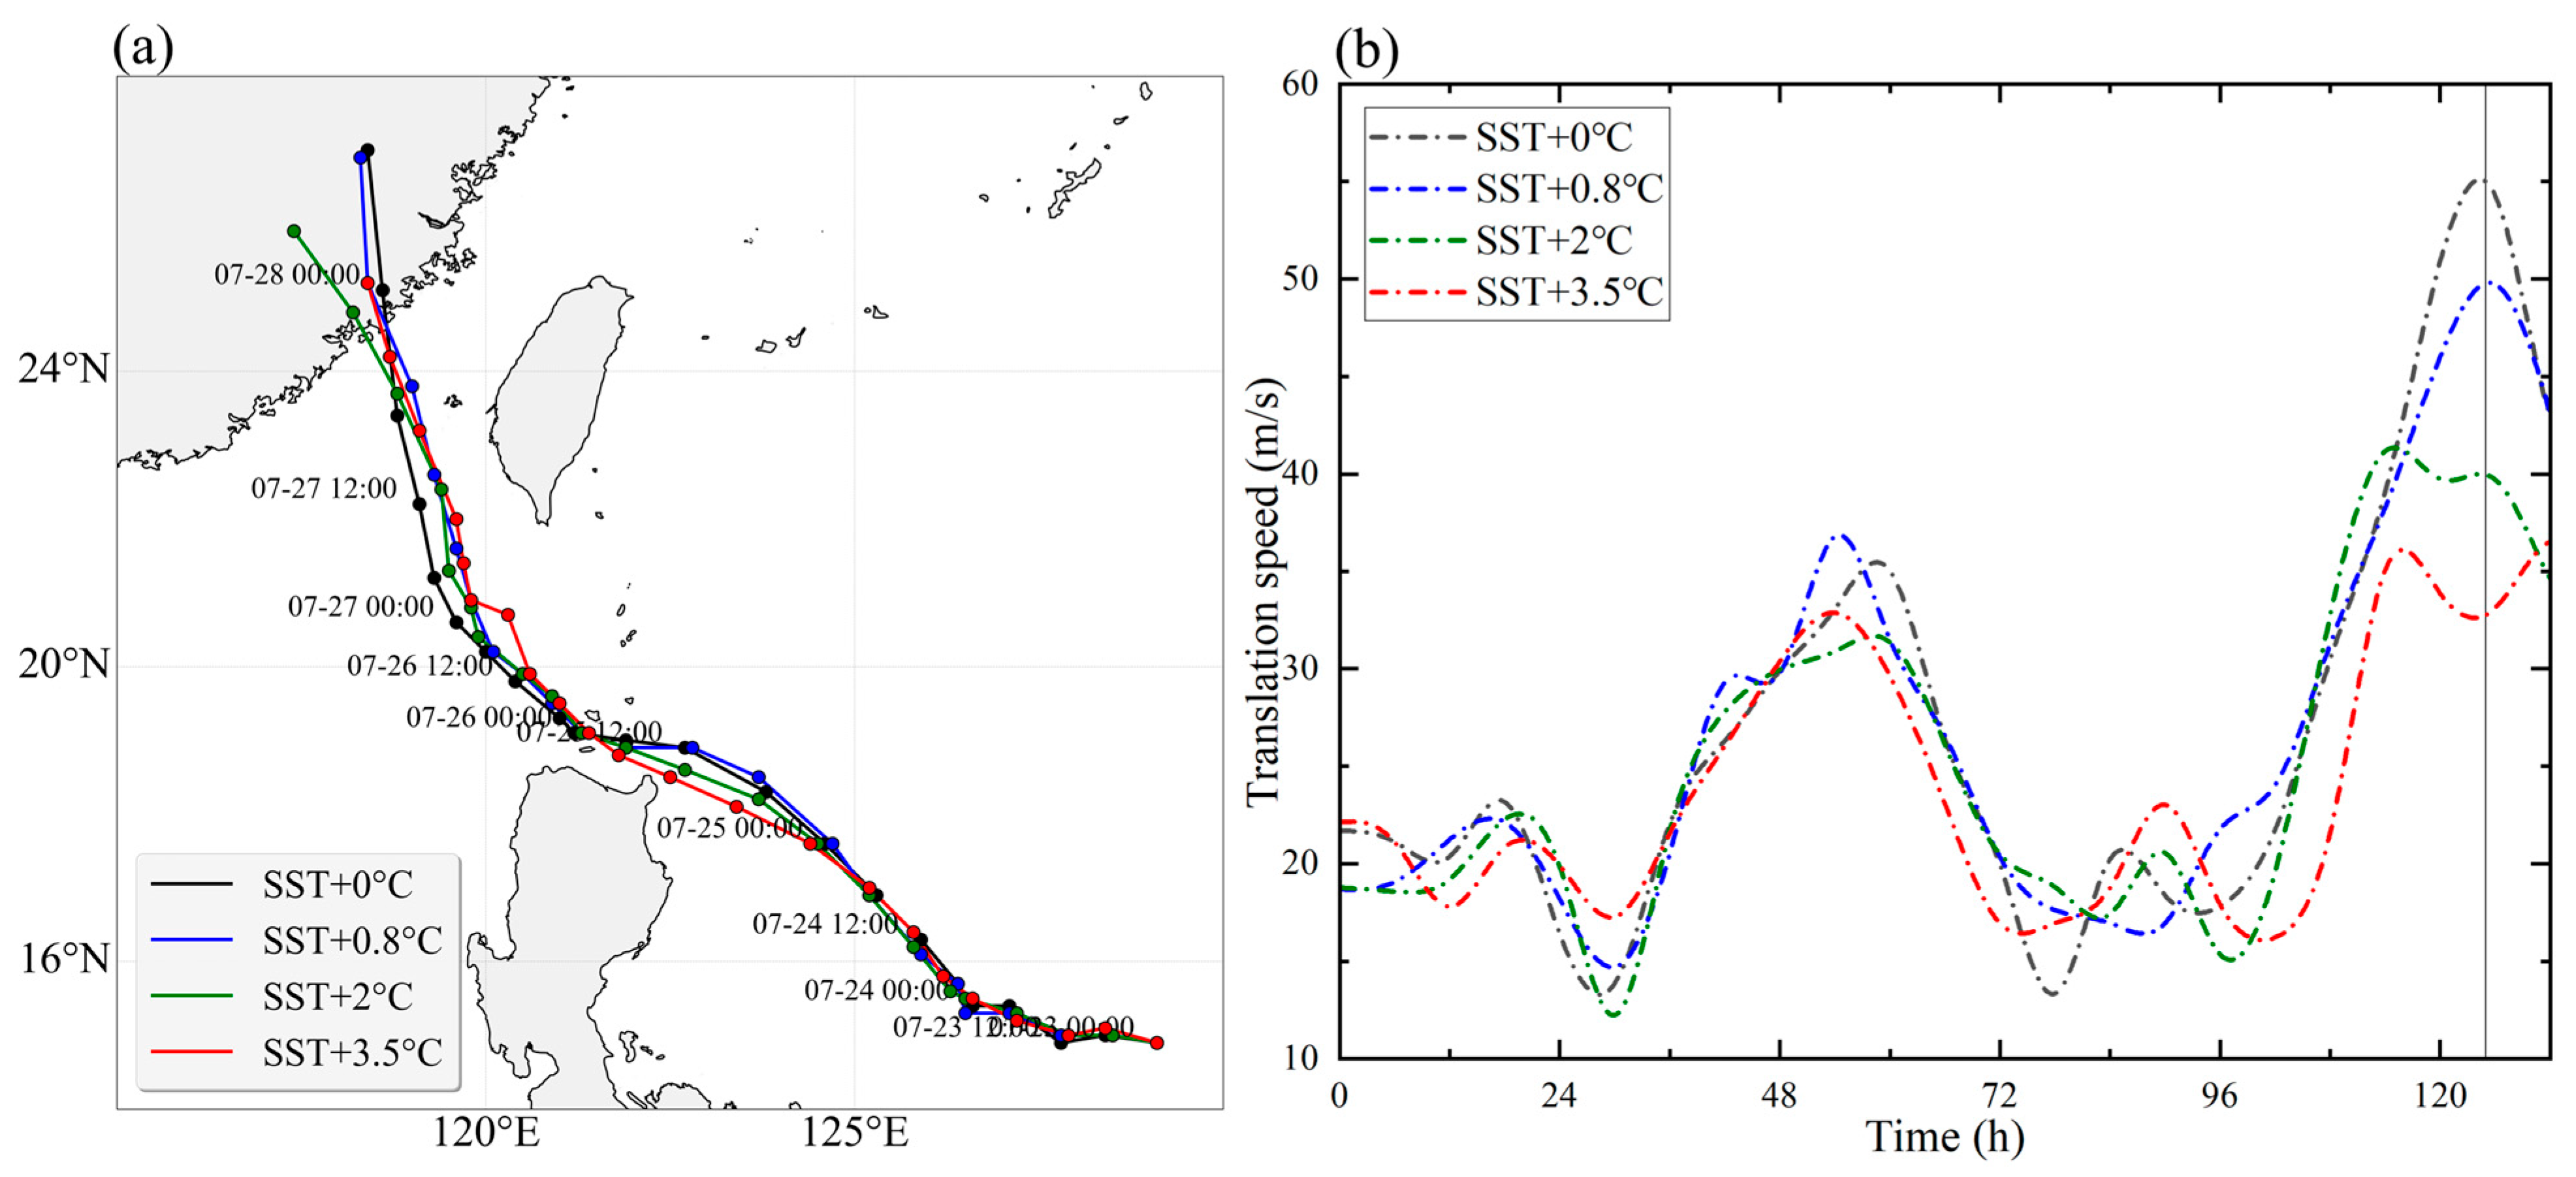
Figure 6 presents the simulated typhoon tracks and translation speed comparison under different SST rise scenarios. As shown in Figure 11a, the tracks of the four scenarios are generally close to each other, but with increasing SST, the track length within the same simulation period shortens and the trajectory tends to become more tortuous. As shown in Figure 11b, where the black thin line marks the landfall segment, typhoon translation speed decreases with rising SST; the mean translation speeds under the four scenarios are 26.53 m/s, 26.39 m/s, 25.09 m/s, and 23.48 m/s, respectively, and the reduction in translation speed during the landfall period is particularly prominent. The track shortening and translation speed reduction can be attributed to the adjustment of environmental airflow caused by SST changes. Although the landfall point is slightly shifted, more southward at +2.0 °C, the overall track deflection pattern is not significant.
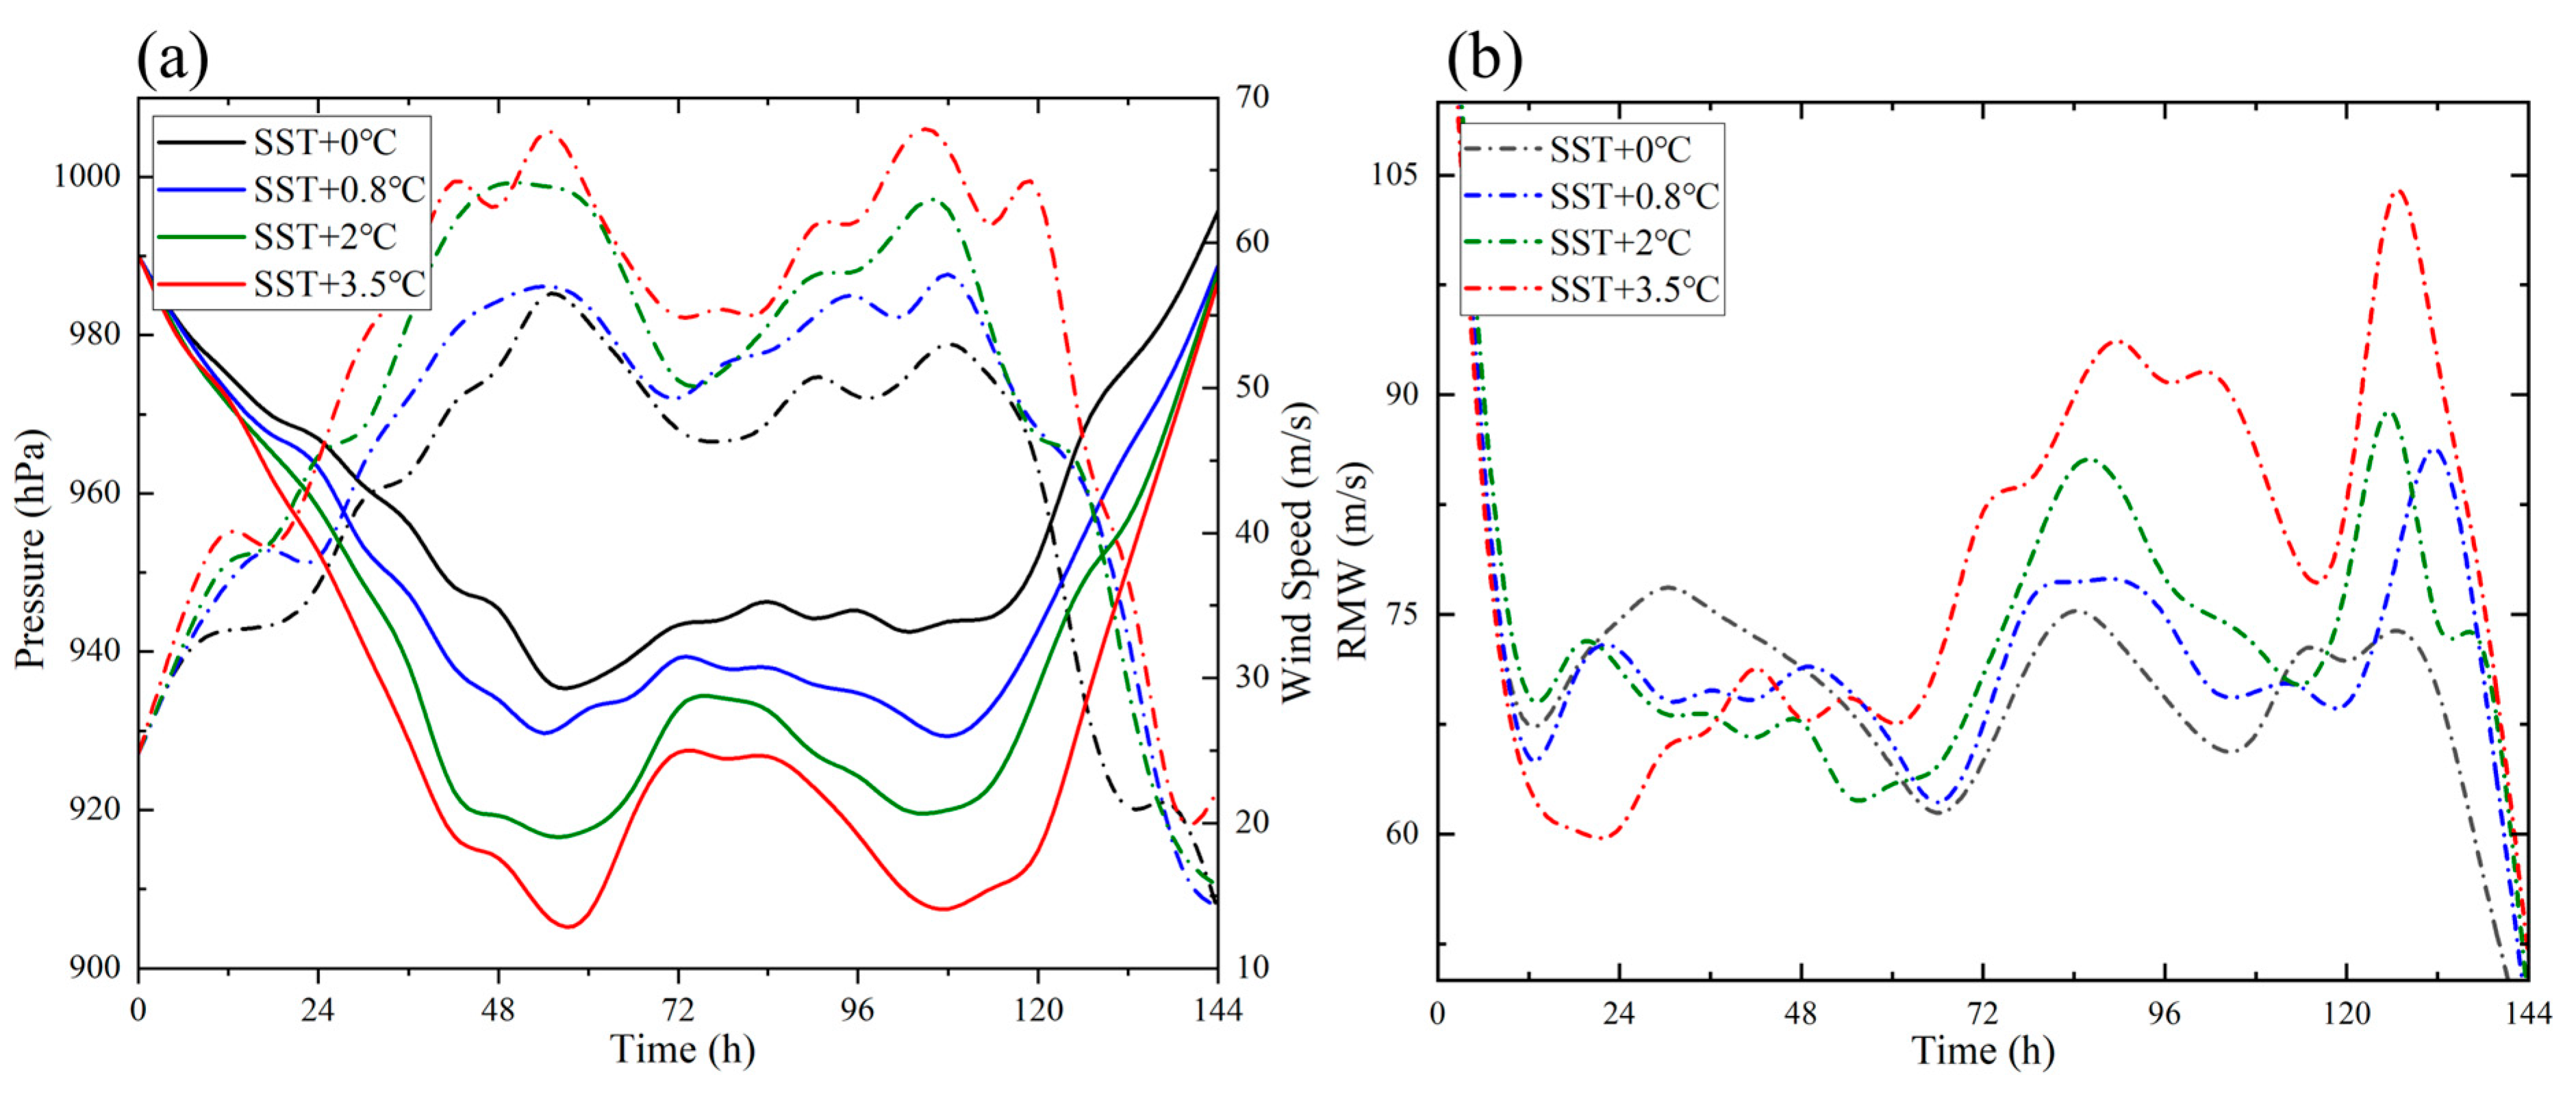
Sea surface temperature rise enhances air–sea interface heat fluxes, providing more abundant energy for typhoon development. Figure 12 shows the evolution of typhoon intensity and structural parameters under different SST scenarios. As shown in Figure 12a, with increasing SST, the maximum typhoon wind speed exhibits nonlinear accelerated growth, increasing by 4.82% at +0.8 °C, 11.19% at +2.0 °C, and 16.52% at +3.5 °C. This is explained by the fact that tropical cyclones are essentially heat engines that extract sensible and latent heat from warm ocean surfaces, and their maximum potential intensity (MPI) is significantly increased with rising SST [8].
Stage-dependent differences in the radius of maximum wind (RMW) response are presented in Figure 12b. During the typhoon intensification stage, RMW decreases with rising SST, indicating that higher sea temperatures trigger stronger eyewall heating efficiency, and enhanced pressure gradient forces promote core contraction. During the typhoon mature and maintenance stages, RMW increases with rising SST, indicating that high sea temperatures not only enhance the typhoon core but also strengthen outer-core latent heat release, and energy is dispersed outward, causing circulation broadening. This stage-dependent structural variation provides a dynamical explanation for subsequent spatial shifts in typhoon wave and storm surge response [34].
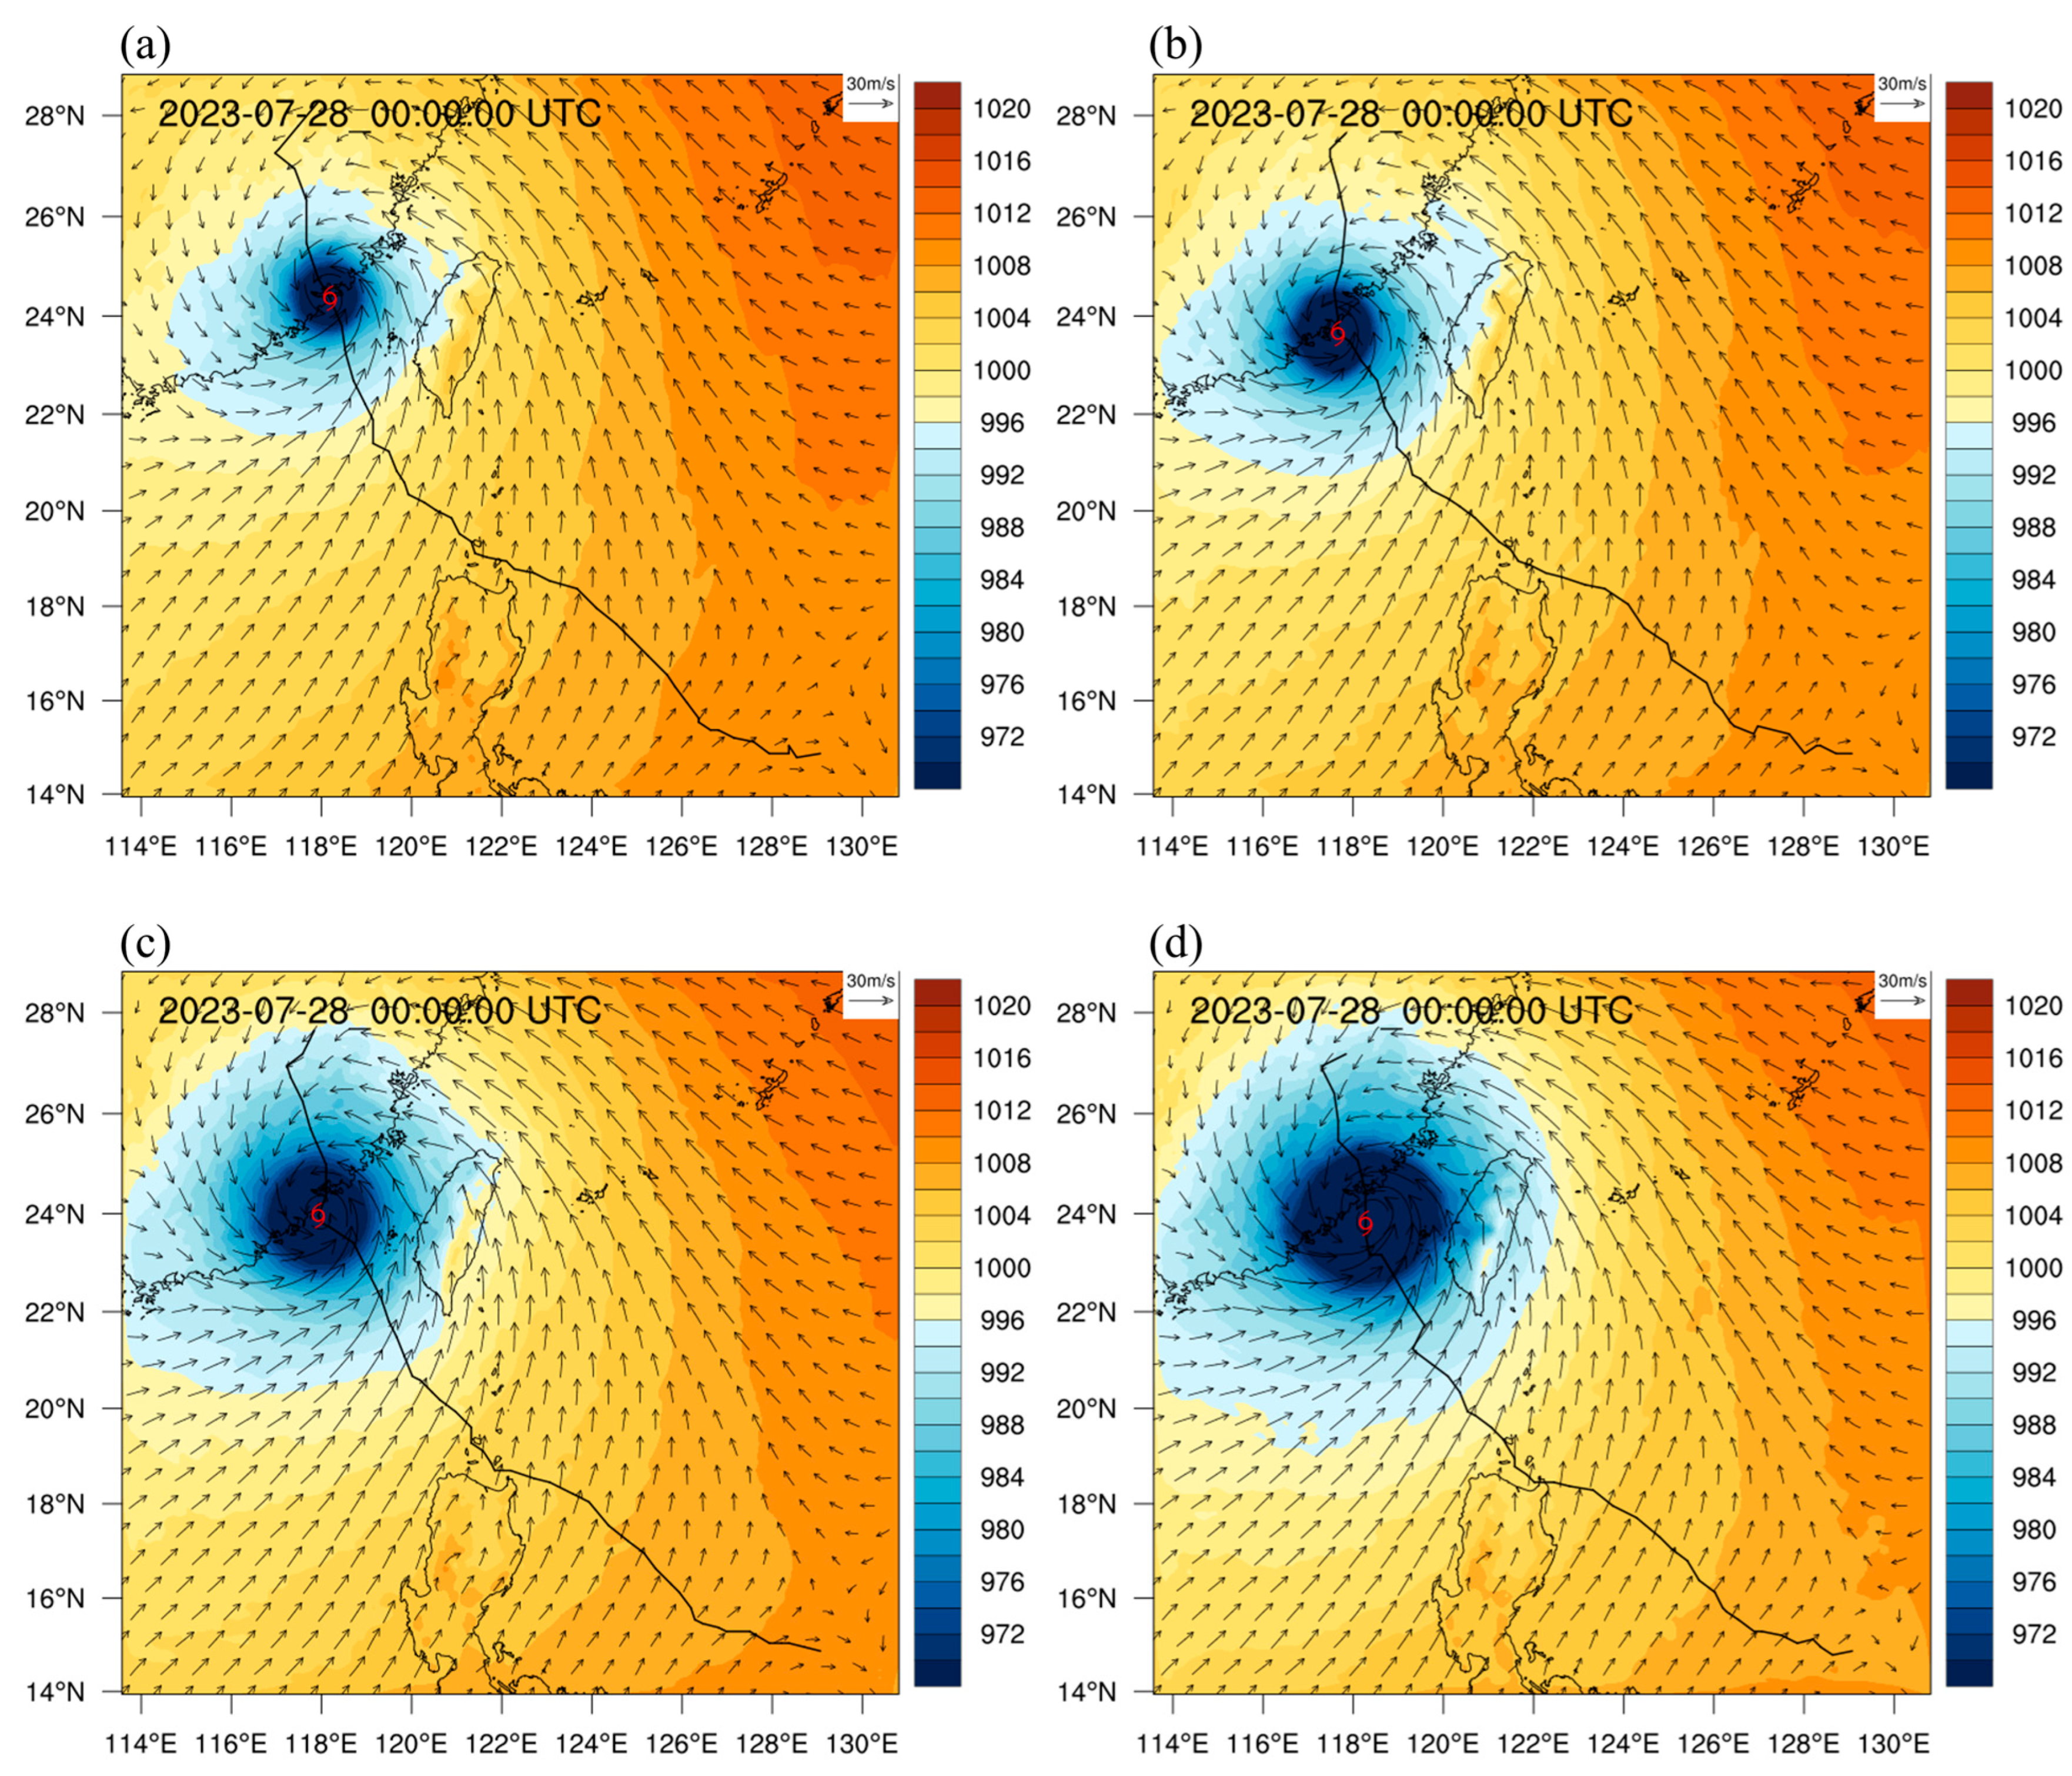
Figure 13 presents the spatial distribution of wind field and pressure field at the same moment, 00:00 UTC, 28 July 2023, under different SST rise scenarios. Figure 13a shows the baseline scenario, and Figure 13b–d show the scenarios with SST rises of 0.8 °C, 2.0 °C, and 3.5 °C, respectively. As shown, with increasing SST, the typhoon exhibits stronger central wind and lower central pressure, and the low-pressure coverage area is significantly expanded, indicating that the typhoon influence range gradually broadens. Although the landfall point position changes, the trend of typhoon intensity increase is very significant. The rise in sea surface temperature not only increases typhoon intensity but also delays its decay process.
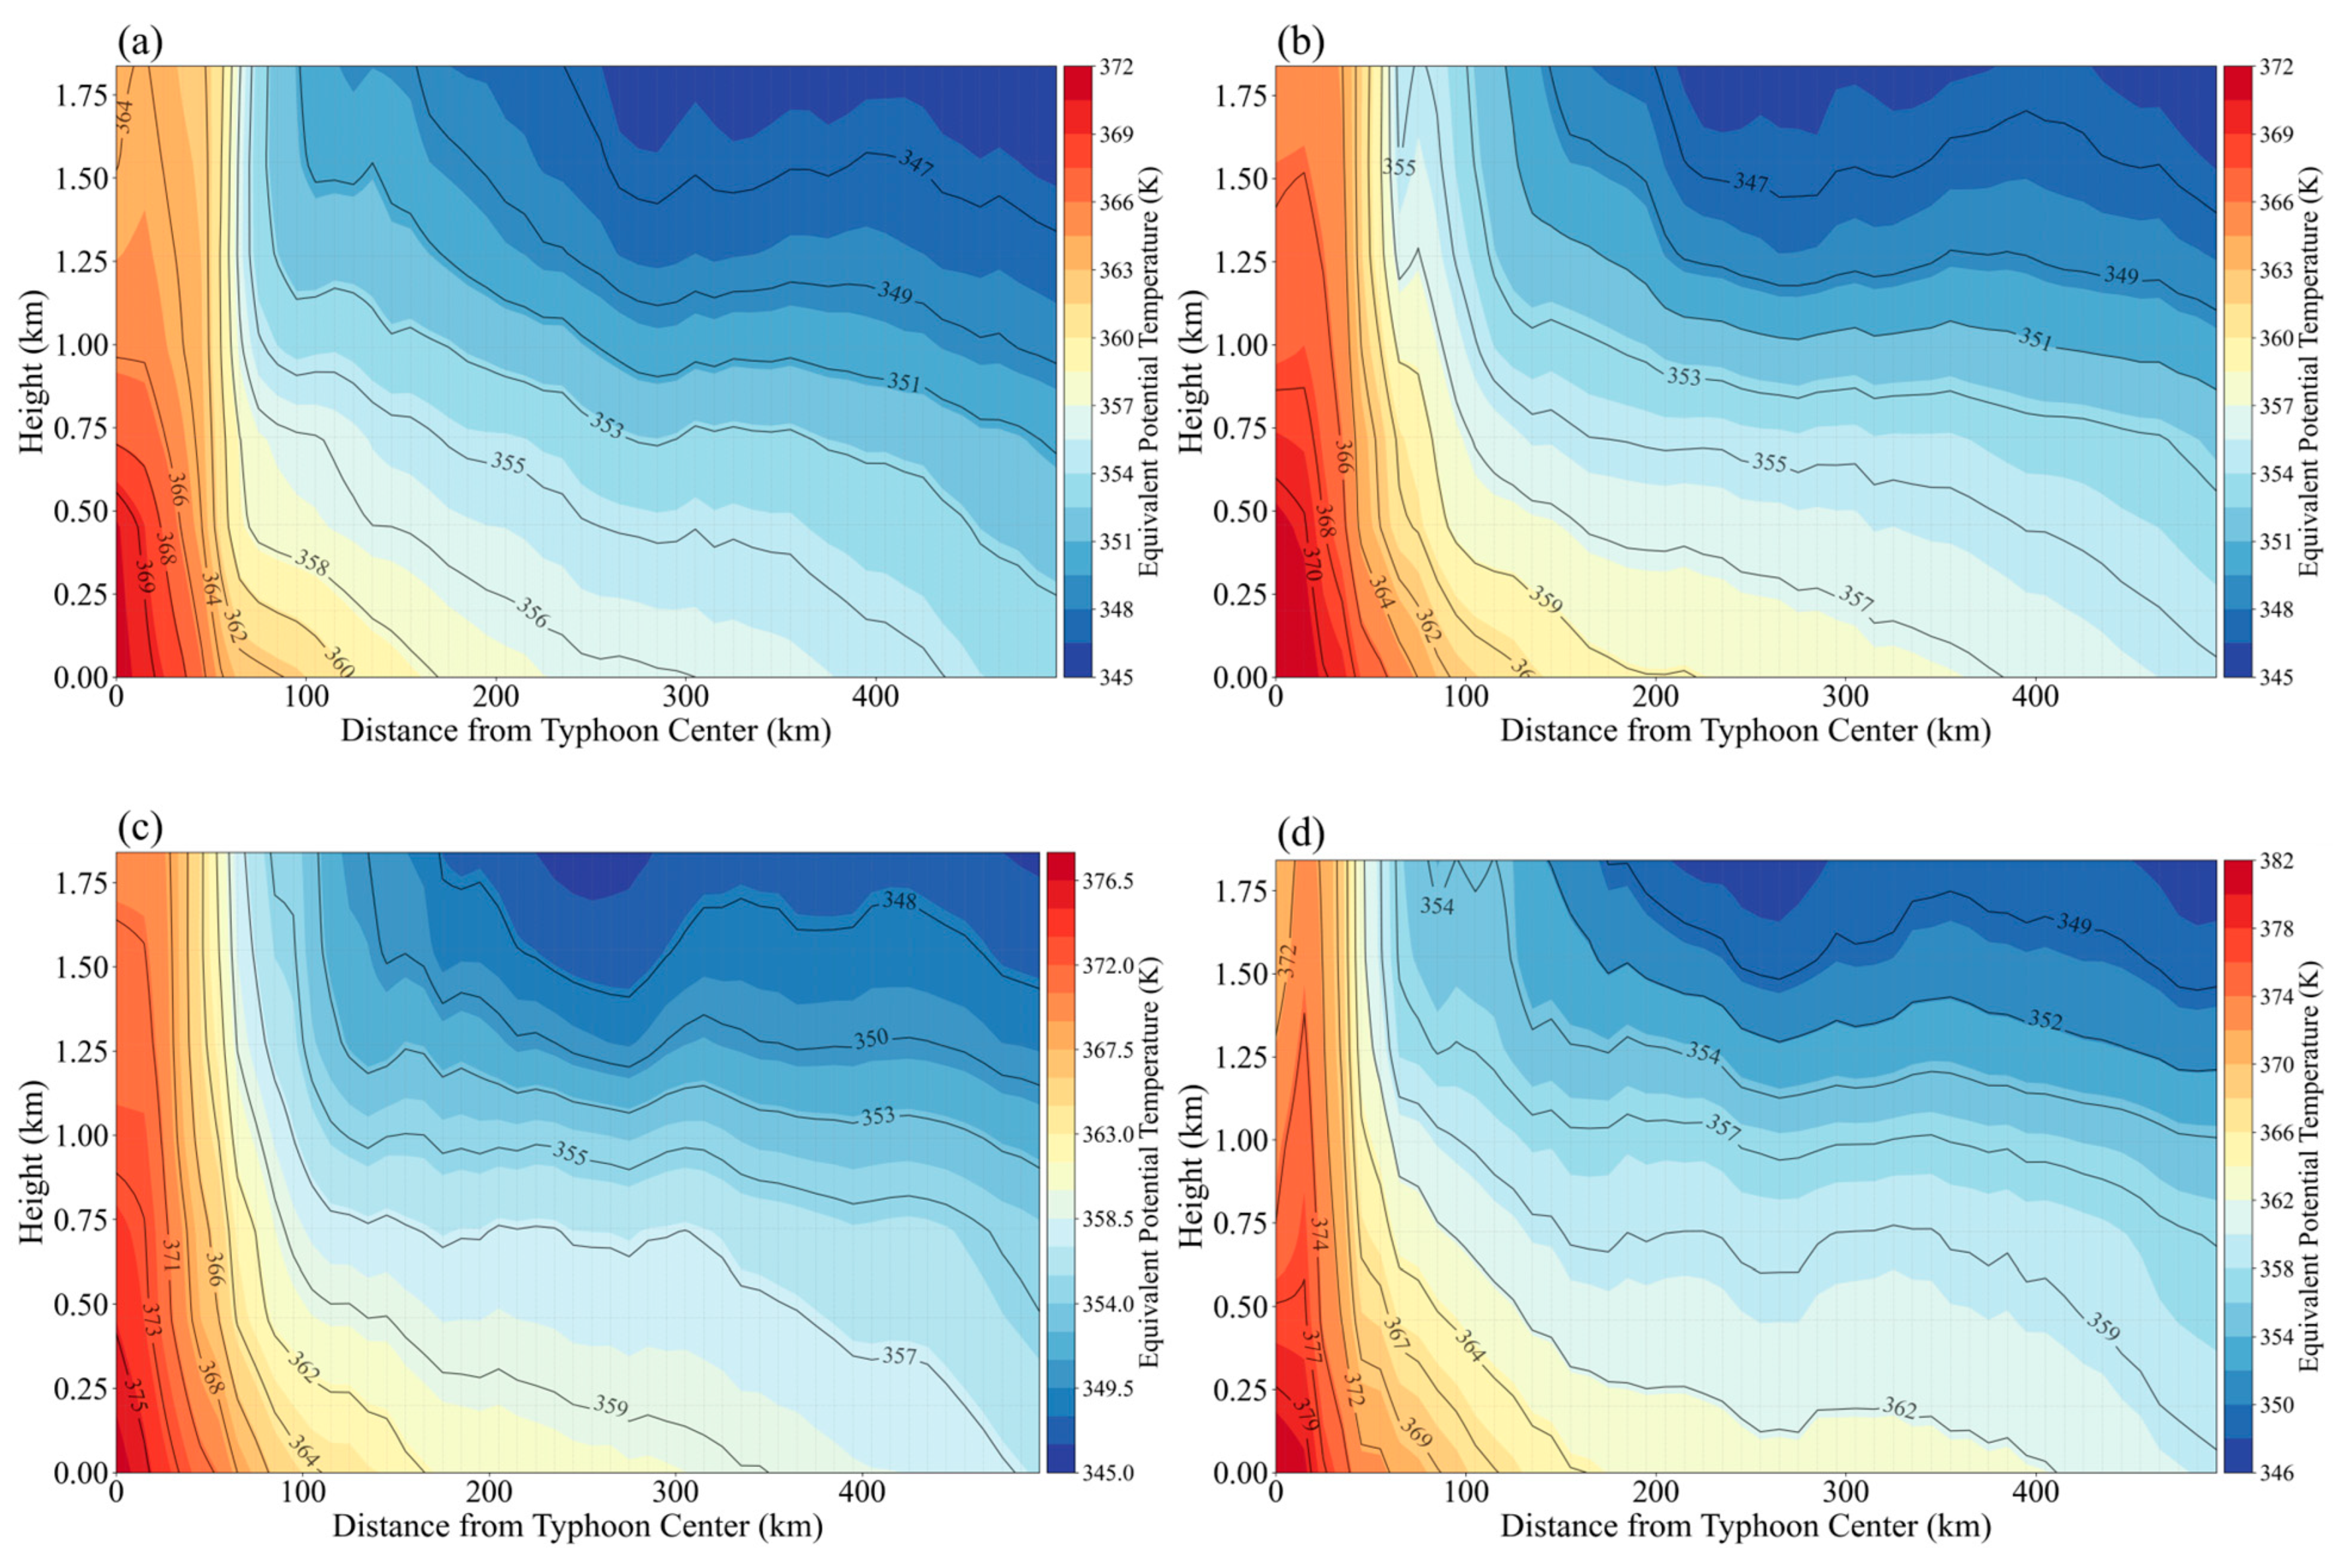
In addition, equivalent potential temperature ( θ e ), a thermodynamic variable conserved in dry and moist adiabatic processes, is adopted to characterize the thermal structure of the typhoon vortex. Figure 14 presents the azimuthally averaged equivalent potential temperature radial distribution at 06:00 UTC on 25 July 2023 under different SST scenarios. It is evident that with rising SST, the radial distribution of equivalent potential temperature in the cyclone inner core region shows significant differences. Under the +0 °C, +0.8 °C, +2.0 °C, and +3.5 °C scenarios, the equivalent potential temperature at the cyclone center bottom layer is 370.6 K, 373.4 K, 376.3 K, and 382.2 K, respectively. The equivalent potential temperature difference between the cyclone center and the 111 km radius ( θ e _ c e n t e r θ e _ r = 111 ) is 11.4 K, 13.9 K, 14.4 K, and 17.0 K, respectively, with corresponding cyclone center pressures of 936.2 hPa, 929.2 hPa, 916.3 hPa, and 906.4 hPa. These results indicate that SST rise not only raises the upper limit of cyclone intensification but also strengthens the cyclone secondary circulation by increasing the equivalent potential temperature radial gradient, enabling high-temperature, high-humidity air to be transported more efficiently to the inner core region, thereby providing a favorable thermodynamic environment for rapid cyclone intensification.

3.1.2. Typhoon Wave Response

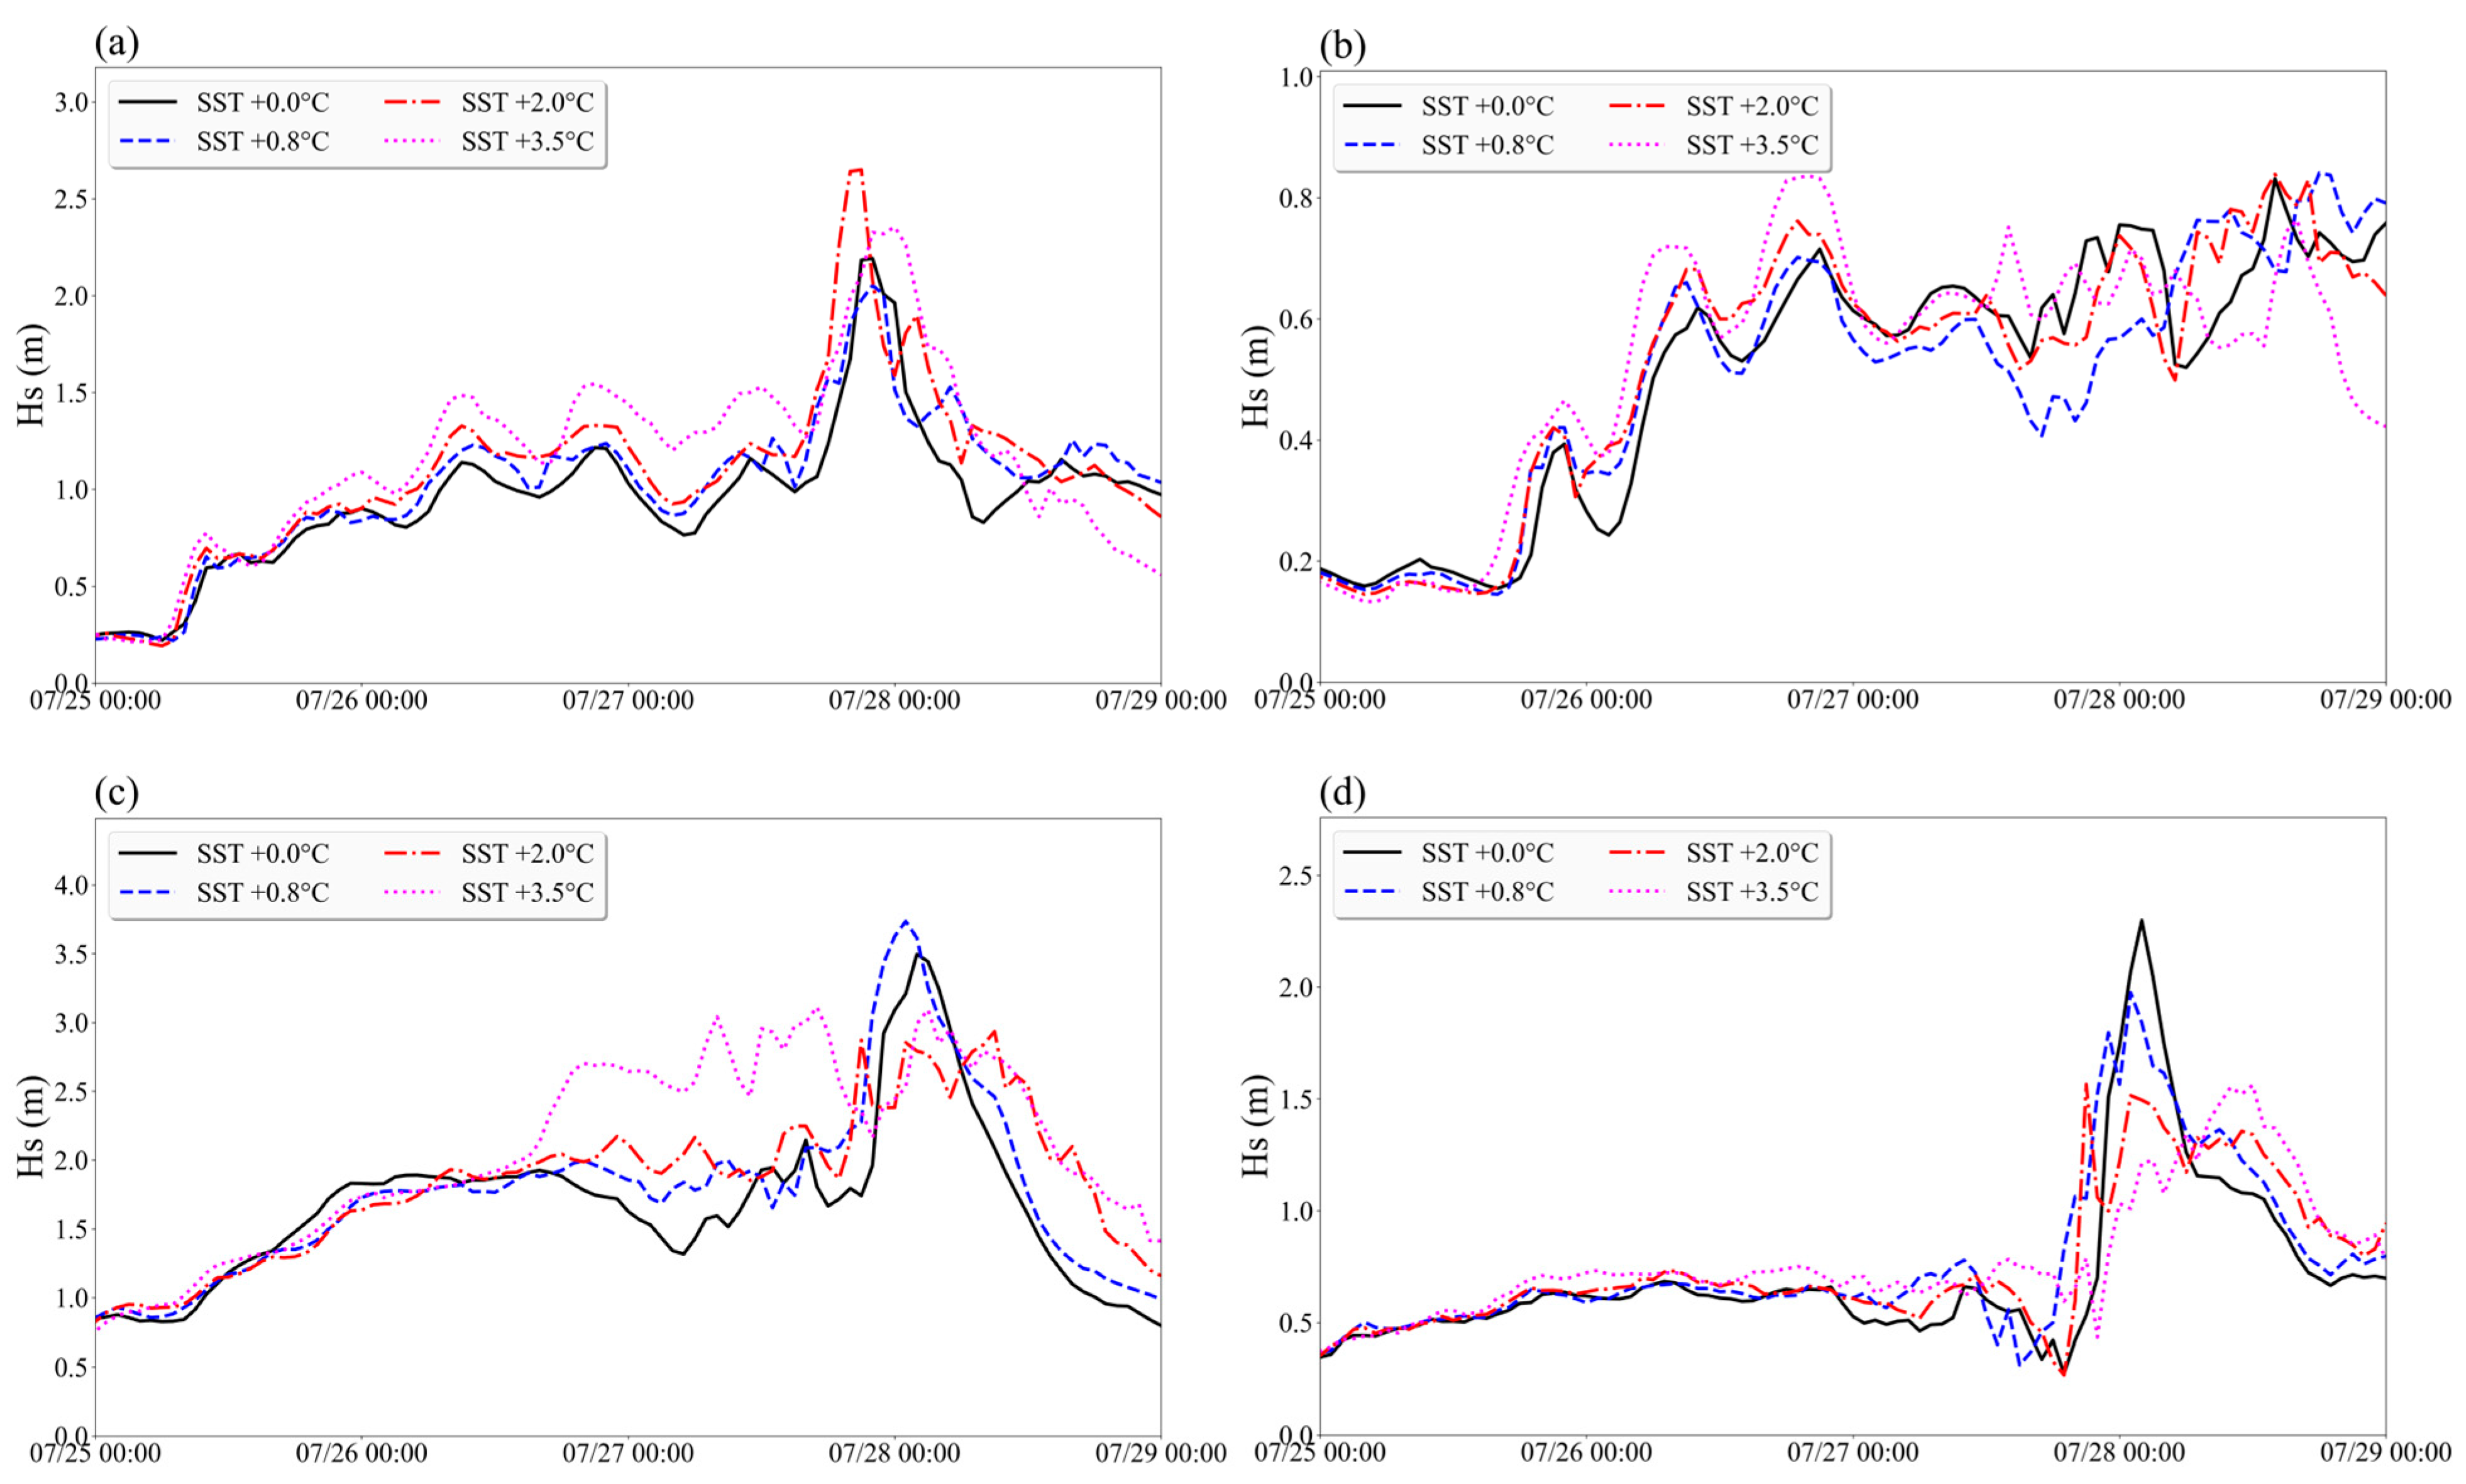
Based on the above sensitivity characteristics of typhoon intensity and structure, the influence of SST rise on typhoon waves is further analyzed. The spatial locations of the four characteristic points (T1–T4) are shown in Figure 1 and Table 1. Figure 15 presents the significant wave height changes at characteristic points under different SST scenarios, where a to d correspond to the four nearshore characteristic points T1, T2, T3, and T4, respectively. As shown, the T1 point shows a trend of increasing significant wave height with SST rise before the extreme value, but the maximum peak appears in the +2.0 °C scenario, approximately 2.6 m, while the peak at +0.8 °C is lower than the baseline scenario. This may be related to typhoon track deflection under different warming magnitudes: at +2.0 °C, the track shifts leftward, making T1 closer to the typhoon center, while at +0.8 °C, the overall track shifts rightward, causing T1 to be relatively farther away. The T2 point presents a multi-peak characteristic, and with rising SST, the significant wave height reaches its maximum earlier, which may originate from the fact that SST rise leads to enhanced typhoon intensity and expanded wind field range, causing the offshore point to be affected by typhoon peripheral wind stress earlier. The T3 point response pattern shows a significant shift, with peak times gradually advancing with rising SST and peak numbers changing from single to multiple. The maximum wave height peak, approximately 3.8 m, appears at +0.8 °C, which is speculated to be similarly affected by the rightward track deflection, making T3 closer to the strong wind area in this scenario. The T4 point presents the opposite characteristic, with peaks decreasing with rising SST; the baseline scenario has the highest peak, approximately 2.3 m, but after the peak, a trend of higher wave height with larger warming magnitude is observed. This may be related to the fact that SST rise causes typhoon structural changes and RMW adjustments, with the strong wind area deviating from T4 during the peak period, while the contribution of peripheral swell increases in the later stage. Overall, SST rise causes the significant wave height time series at each characteristic point to exhibit an overall upward trend, but the response magnitude and extreme value distribution show significant spatial differences, which are jointly constrained by typhoon track deflection and intensity changes.
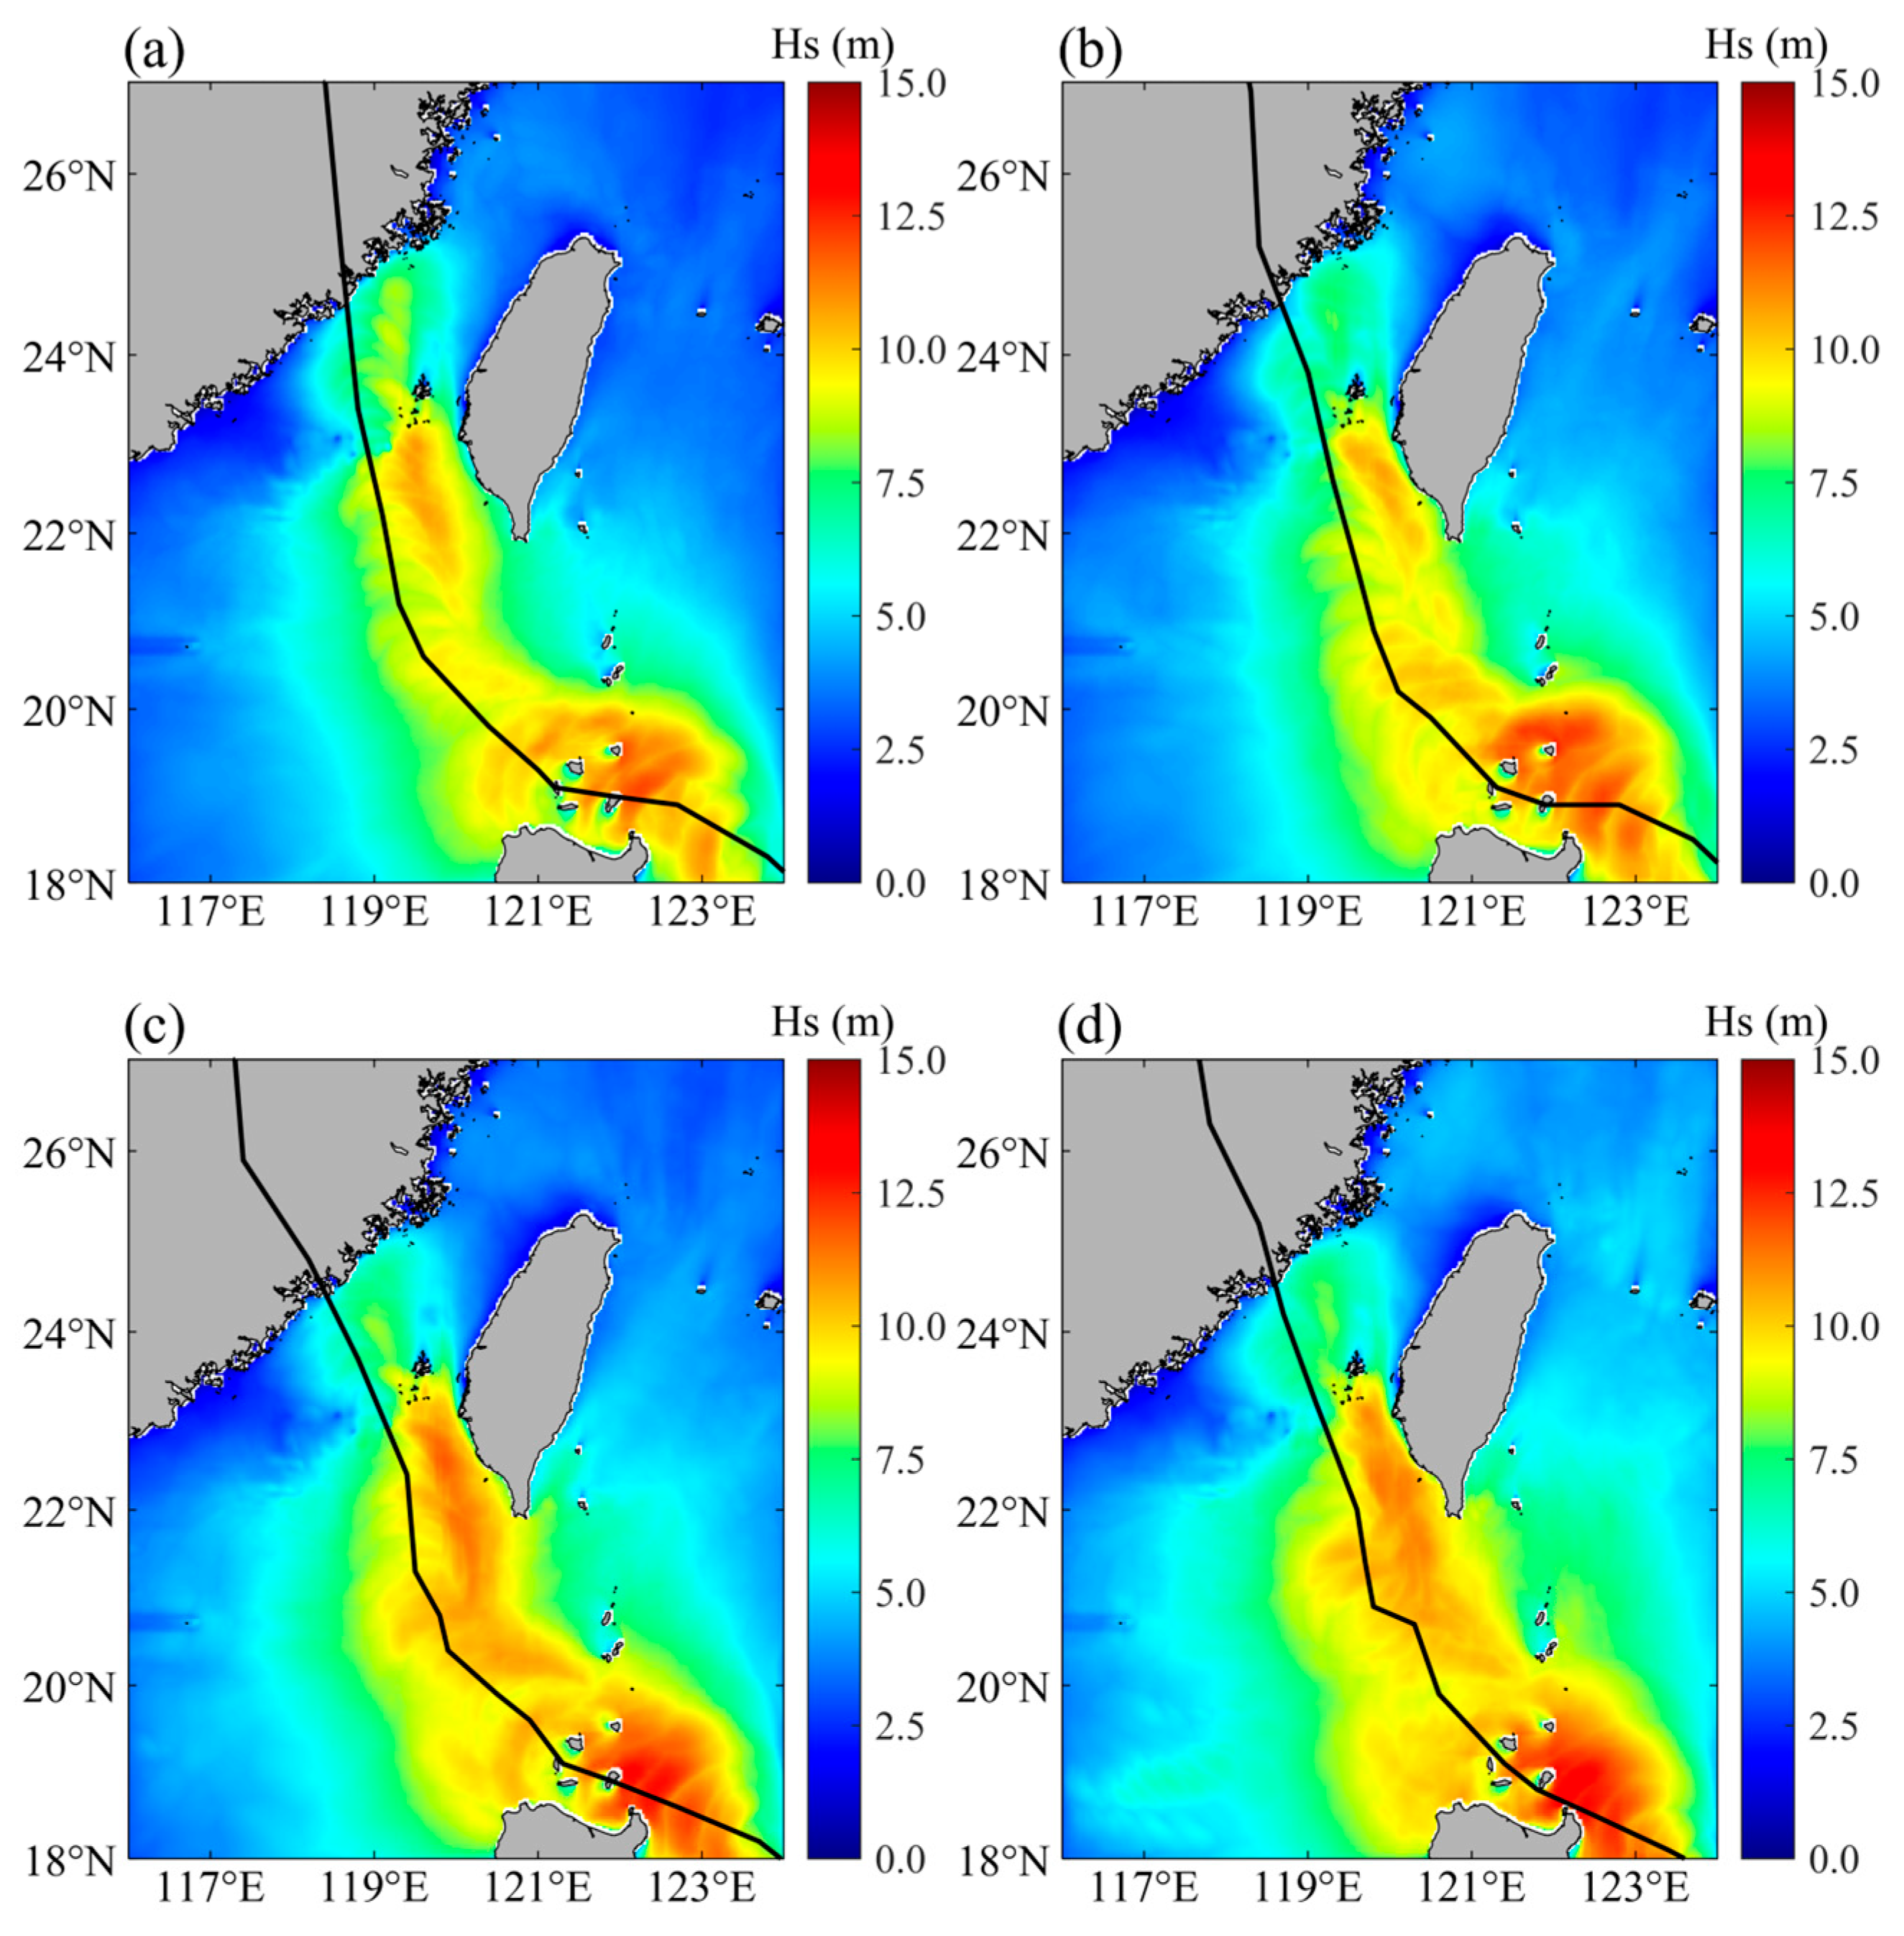
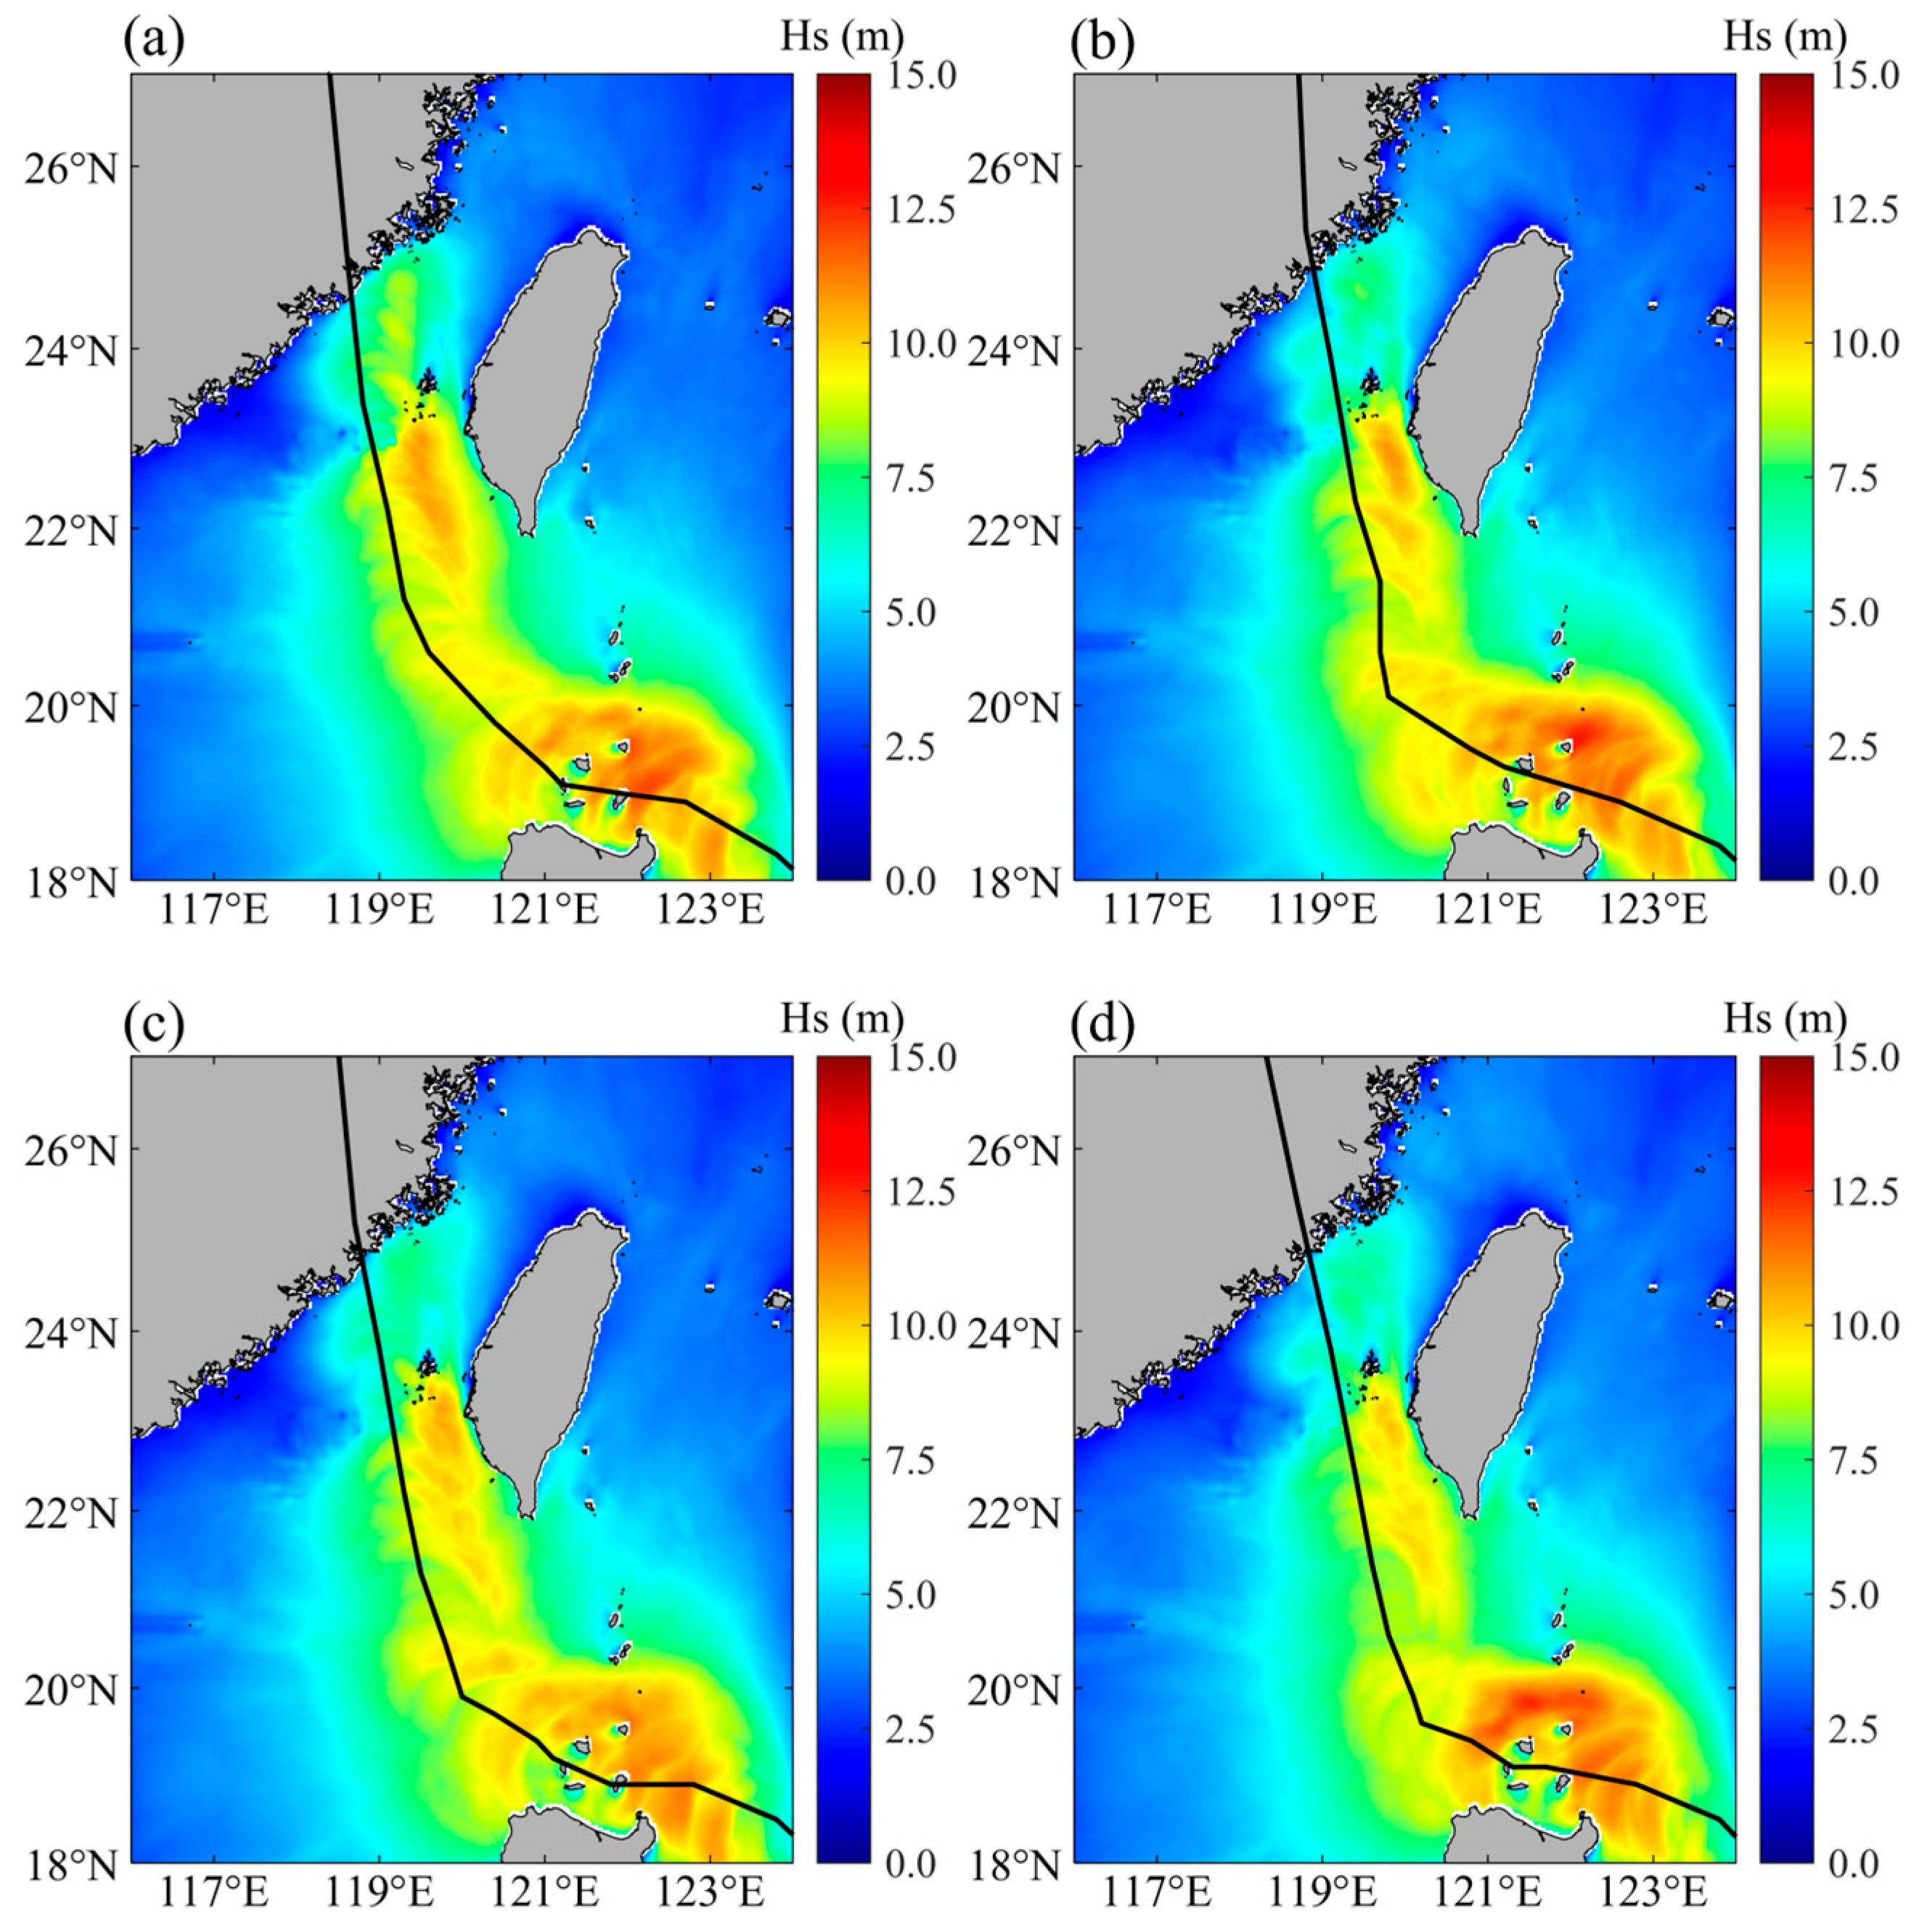
To reveal the spatial distribution patterns underlying the above characteristic point time series responses, Figure 16 presents the spatial distribution of wave height extremes under different SST rise scenarios. Figure 16a shows the spatial distribution of wave height extremes under the baseline scenario, and Figure 16b–d show the distributions under SST rises of 0.8 °C, 2.0 °C, and 3.5 °C, respectively. As shown, the spatial distribution characteristics of wave heights under different SST scenarios are similar, mainly distributed on the right side of the typhoon track, indicating the right-biased characteristic of typhoon waves, with maximum values distributed near the sea area of Luzon Island, and secondary high-value areas located on the southwest side of Taiwan Island. With rising SST, the wave height influence range gradually expands, and the areas southwest of Taiwan Island and northeast of Luzon Island respond most strongly, with significant increases in wave height extremes.
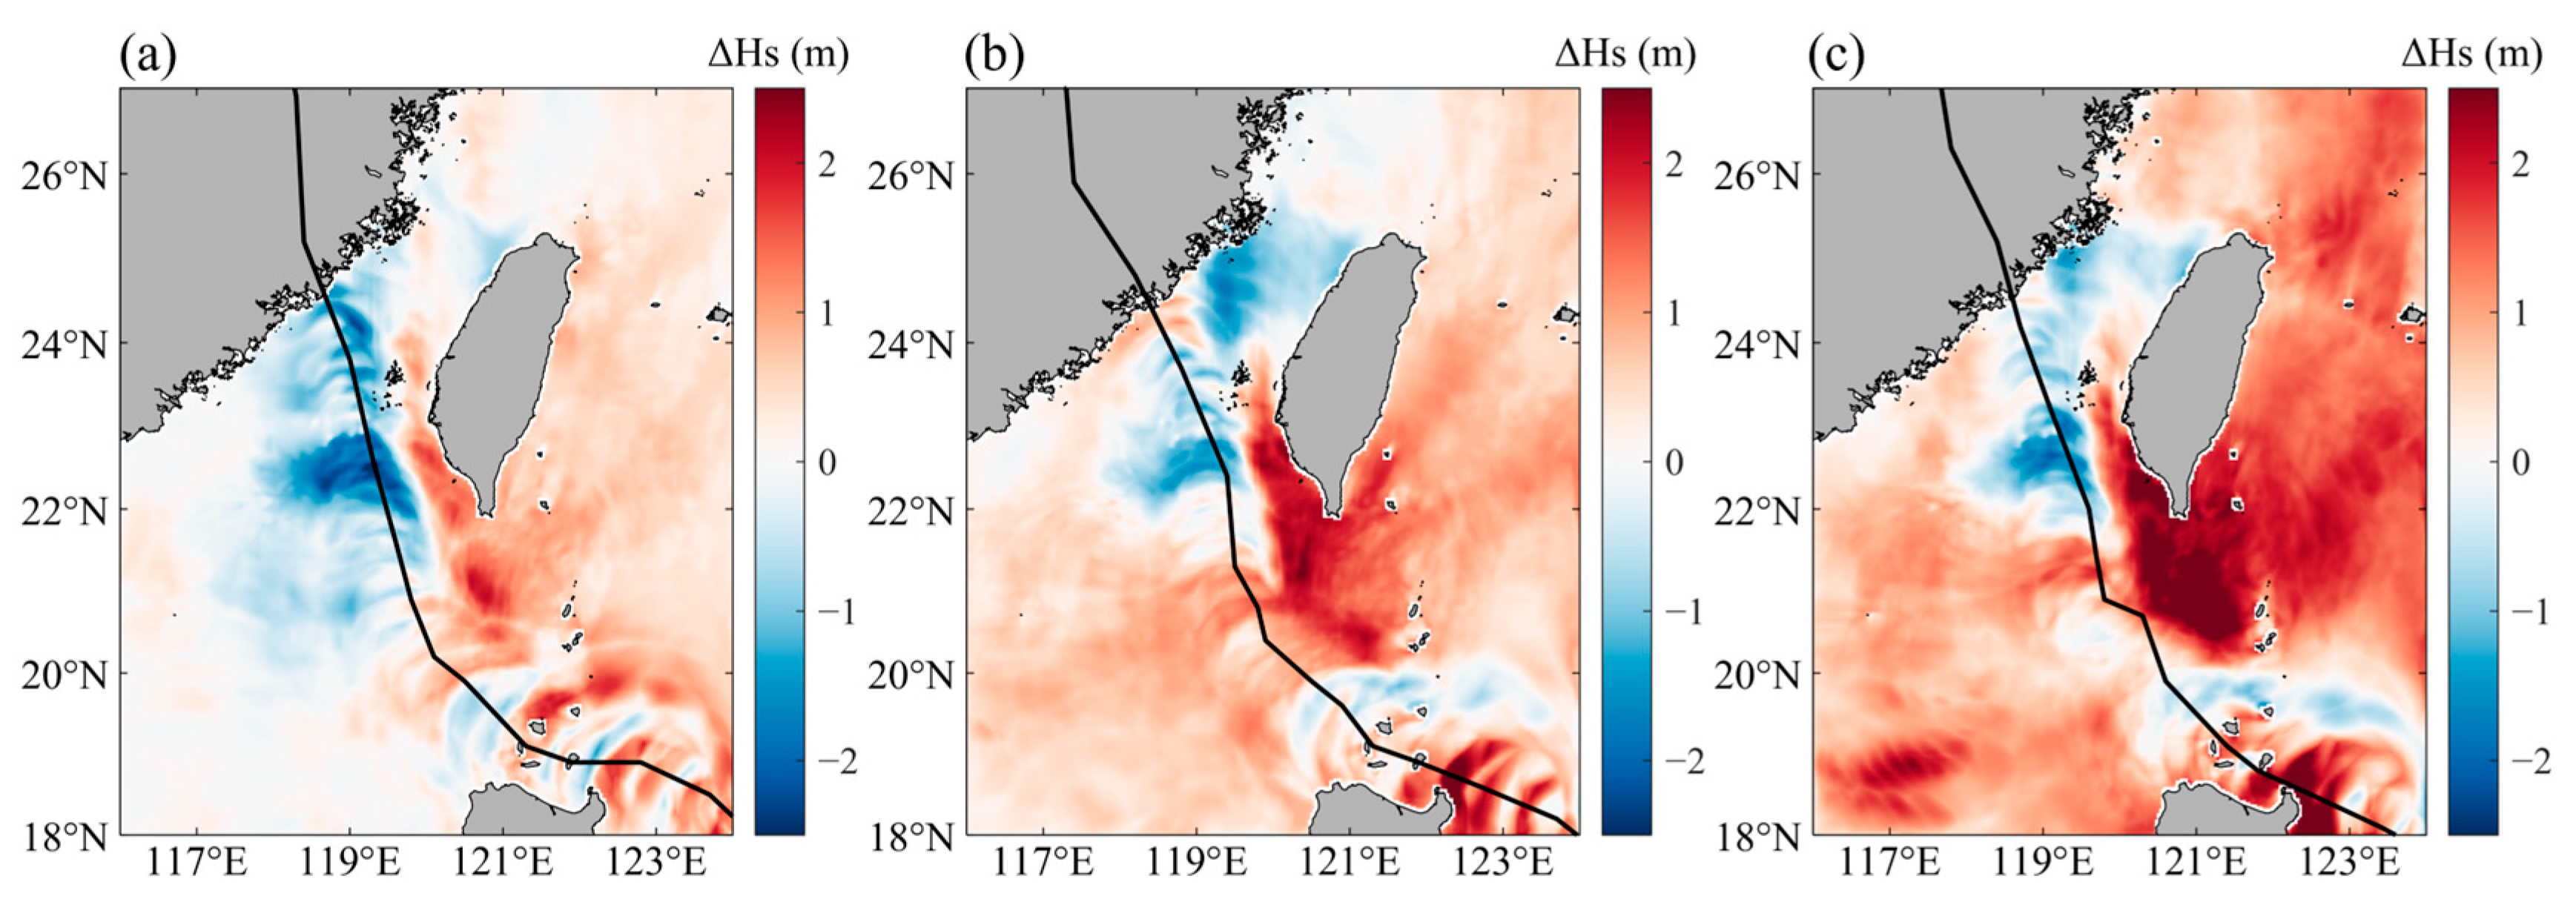
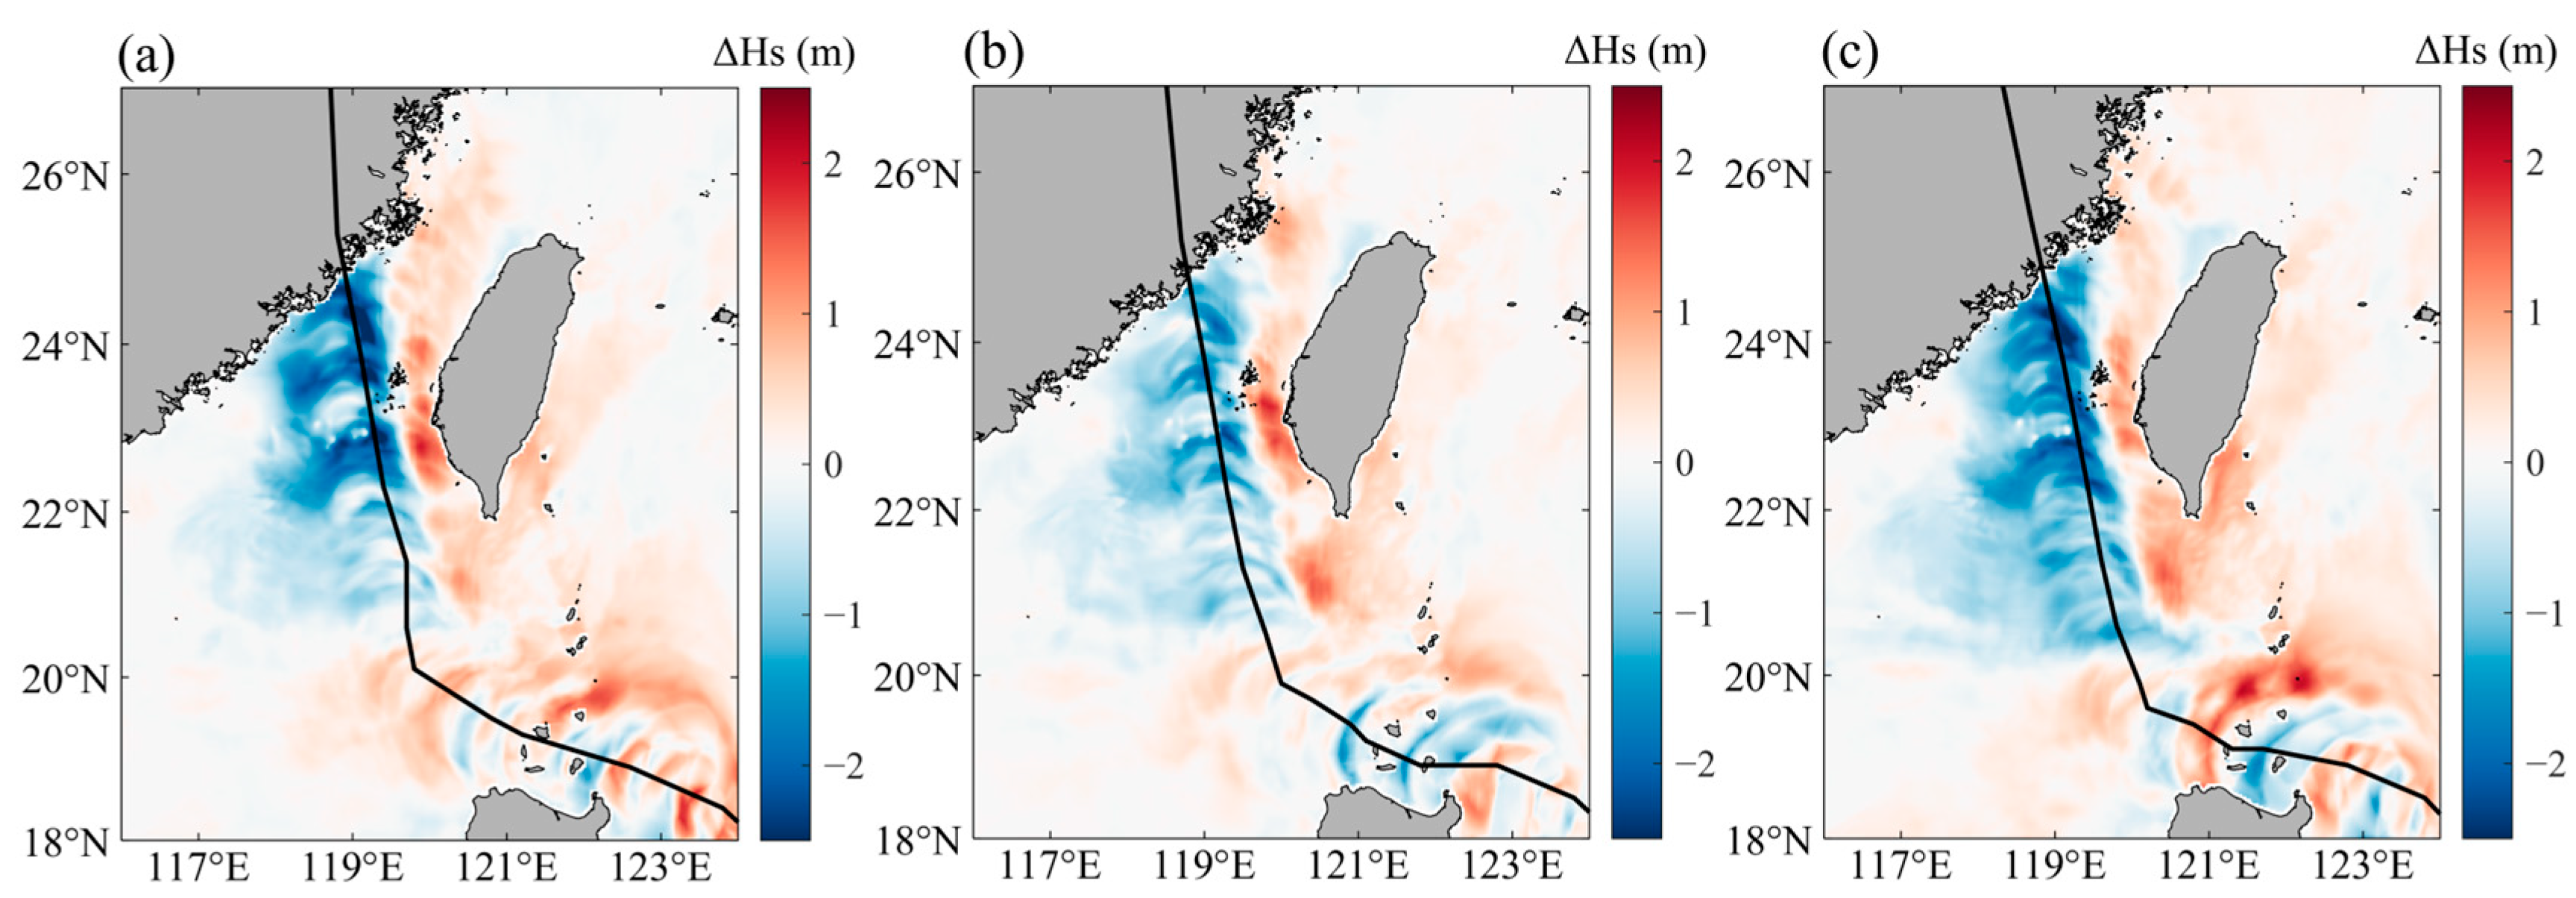
To further quantify the spatial response differences induced by warming, Figure 17 presents the spatial distribution of significant wave height extreme increments under different SST rise scenarios relative to the baseline. Areas with increased wave height increments are concentrated between Luzon Island and Taiwan Island on the right side of the typhoon track. With increasing warming magnitude, the increase range gradually expands toward the right side of Taiwan Island. Negative wave height increments appear in some areas on the left side of the typhoon track, which may be attributed to typhoon intensification caused by SST rise leading to typhoon track deflection or wind field structure changes. It is noteworthy that the area within approximately 200 km of the typhoon track is identified as the high-sensitivity zone for wave height response. From a mechanism perspective, SST rise enhances typhoon intensity and expands the wind field range, thereby increasing wave height through enhanced wind stress input, and its impact continuously acts on the sea areas along the typhoon track as the typhoon moves.
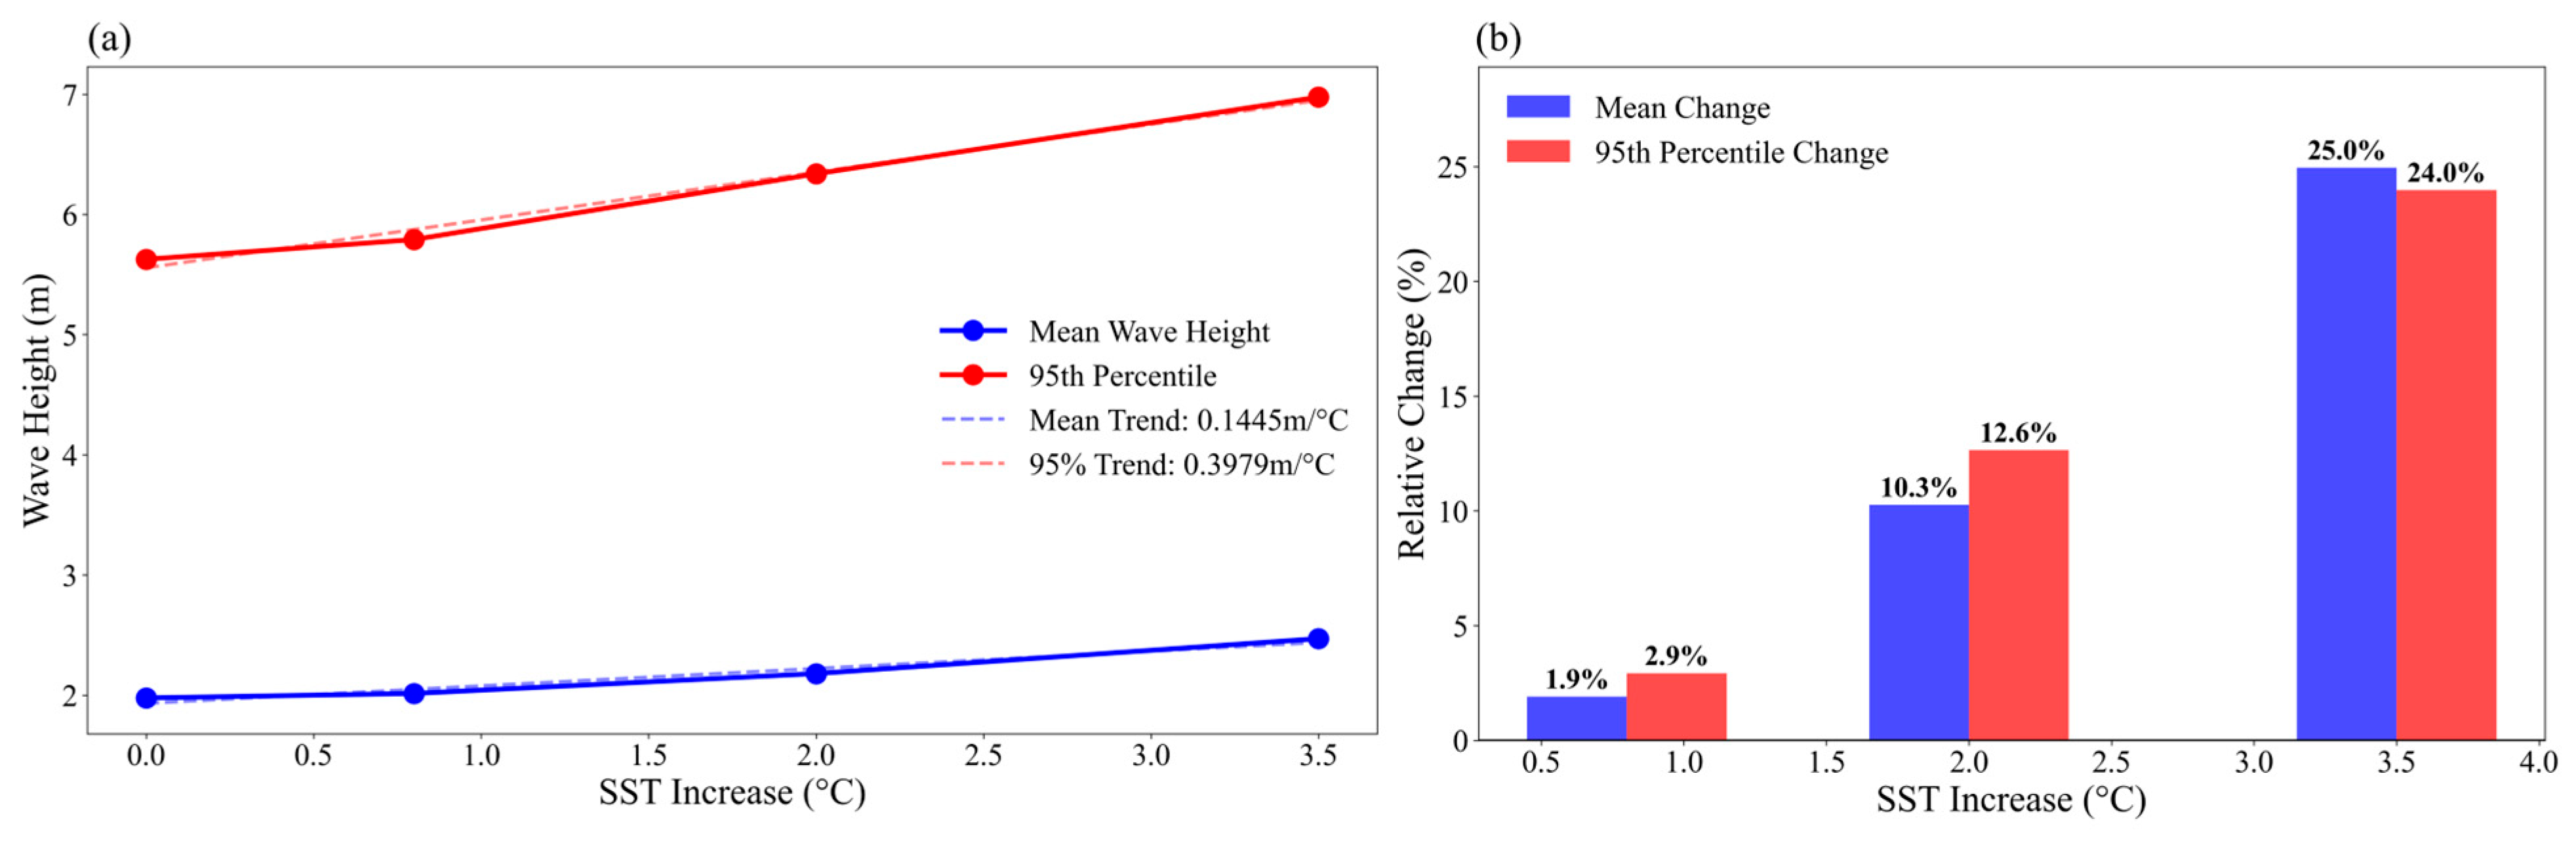
The above spatial increment analysis indicates that SST rise has a significant positive promoting effect on typhoon waves. To further evaluate the domain-wide response characteristics, joint statistics are performed for significant wave heights across all grid points and all time steps, and the 95th percentile significant wave height is defined as the extreme significant wave height [35]. Domain-wide statistical analysis is presented in Figure 18. With SST gradually rising to 3.5 °C, mean wave height increases from 1.977 m to 2.470 m (+25.0%), and extreme significant wave height (95th percentile) increases from 5.626 m to 6.975 m (+24.0%). More importantly, the absolute increment of extreme significant wave height (1.349 m) is significantly higher than that of mean wave height (0.493 m), and the sensitivity coefficient of extreme significant wave height (0.3979 m/°C) is approximately 2.75 times that of mean wave height (0.1445 m/°C), indicating that high wave height events are more sensitive to temperature rise, with extreme significant wave height responding preferentially under modest warming scenarios.

3.1.3. Storm Surge Response

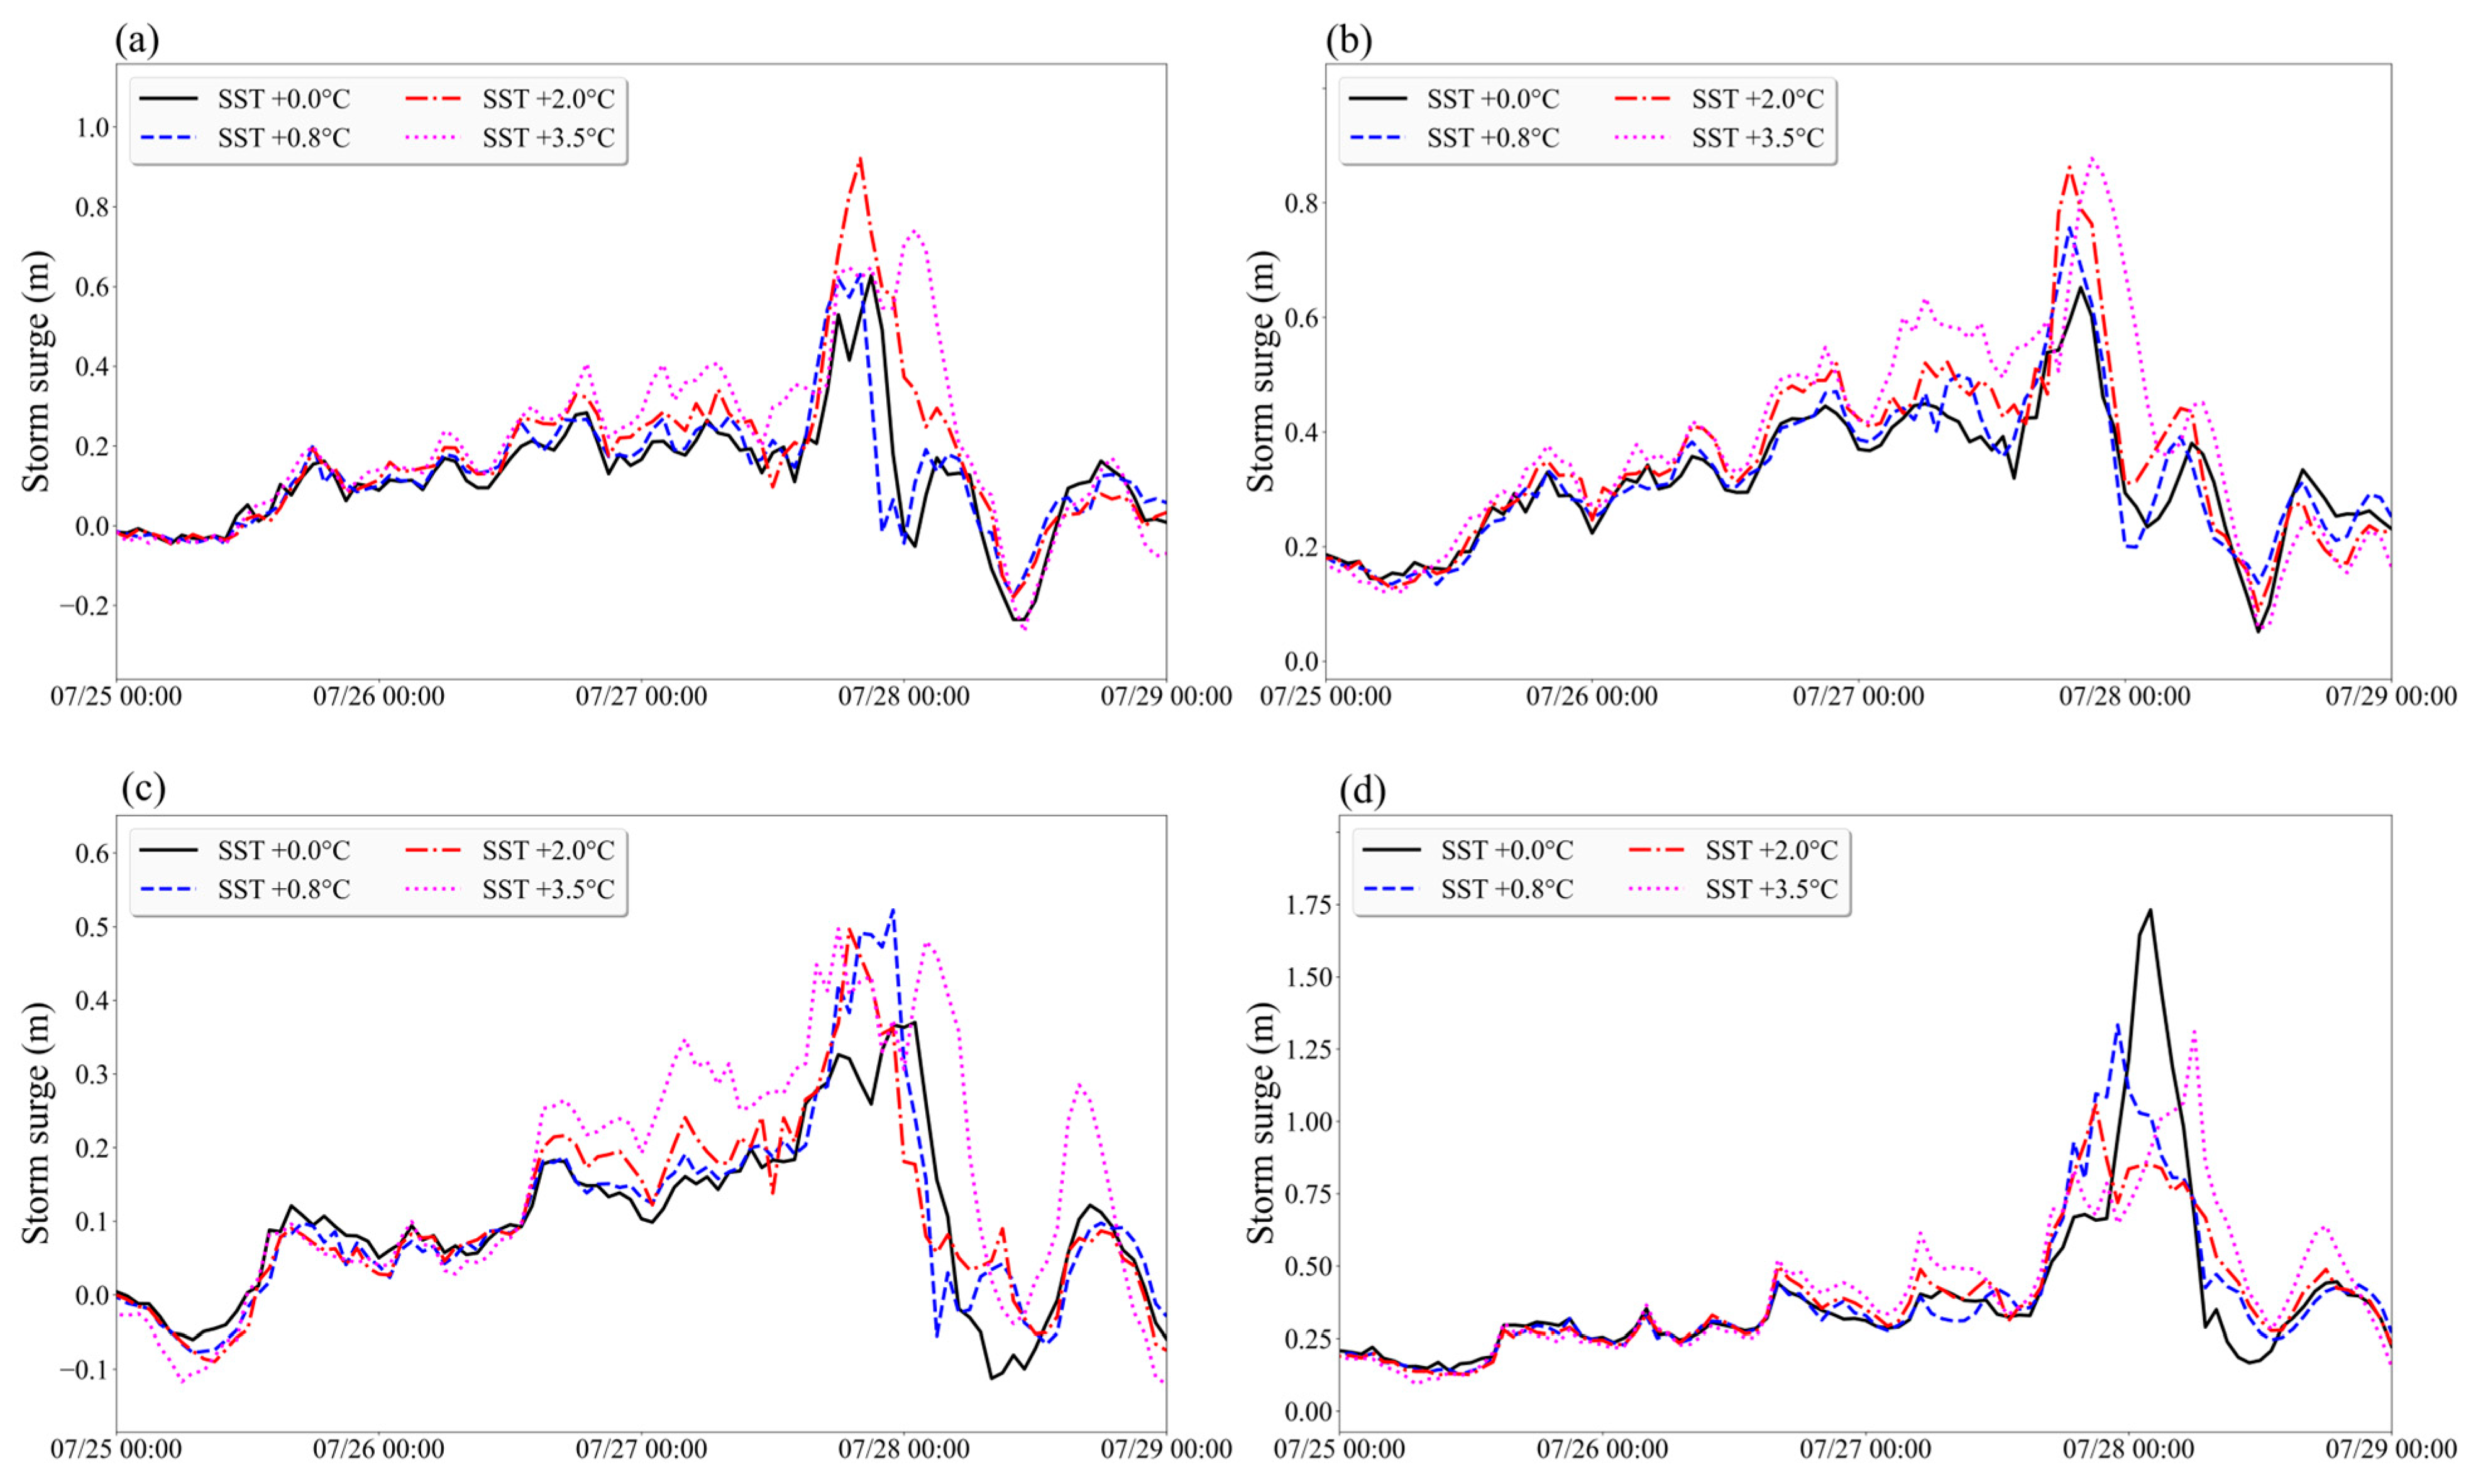
Based on the analysis of typhoon wave responses, the influence of SST rise on storm surges is further examined. Figure 19 presents the storm surge changes at characteristic points under different SST scenarios. As shown, the T1 point storm surge peak appears in the +2.0 °C scenario, approximately 0.9 m, significantly higher than the +3.5 °C scenario. This is attributed to the fact that in this scenario, the typhoon landfall point shifts significantly leftward, making T1, located on the left side of the track and relatively close, more strongly affected by the typhoon, while at +3.5 °C, track deflection or intensity changes cause T1 to be relatively farther from the strong wind area. The T2 point presents a characteristic of monotonically increasing peaks with rising SST, with +2.0 °C slightly lower than +3.5 °C (peak approximately 0.65 m), indicating that at this point, the warming enhancement effect on storm surge exceeds the influence of track deflection, and SST rise amplifies the storm surge by expanding the typhoon wind field range, benefiting the offshore point. The T3 point shows nearly identical peaks under different warming magnitudes (approximately 0.5 m). Although higher SST makes the typhoon stronger, the typhoon track at +0.8 °C is more rightward compared to the +2.0 °C scenario, making T3 closer to the strong wind area in the former scenario, ultimately causing the responses under different scenarios to converge. The T4 point has the highest storm surge peak in the baseline scenario (approximately 1.45 m), higher than all warming scenarios, which is related to the increase in RMW and the outward shift of the wind stress extreme area after warming. The strong wind area deviates from T4 after warming, causing the peak to decrease, but this point still shows the pattern of higher storm surge with higher SST in other periods, indicating that the warming background surge elevation effect still exists. Overall, SST rise elevates the storm surge at each characteristic point and increases its variability, but peak responses are modulated by the combined effects of warming direct effects and typhoon track and wind field structure changes, exhibiting significant nonlinear characteristics and local differences.
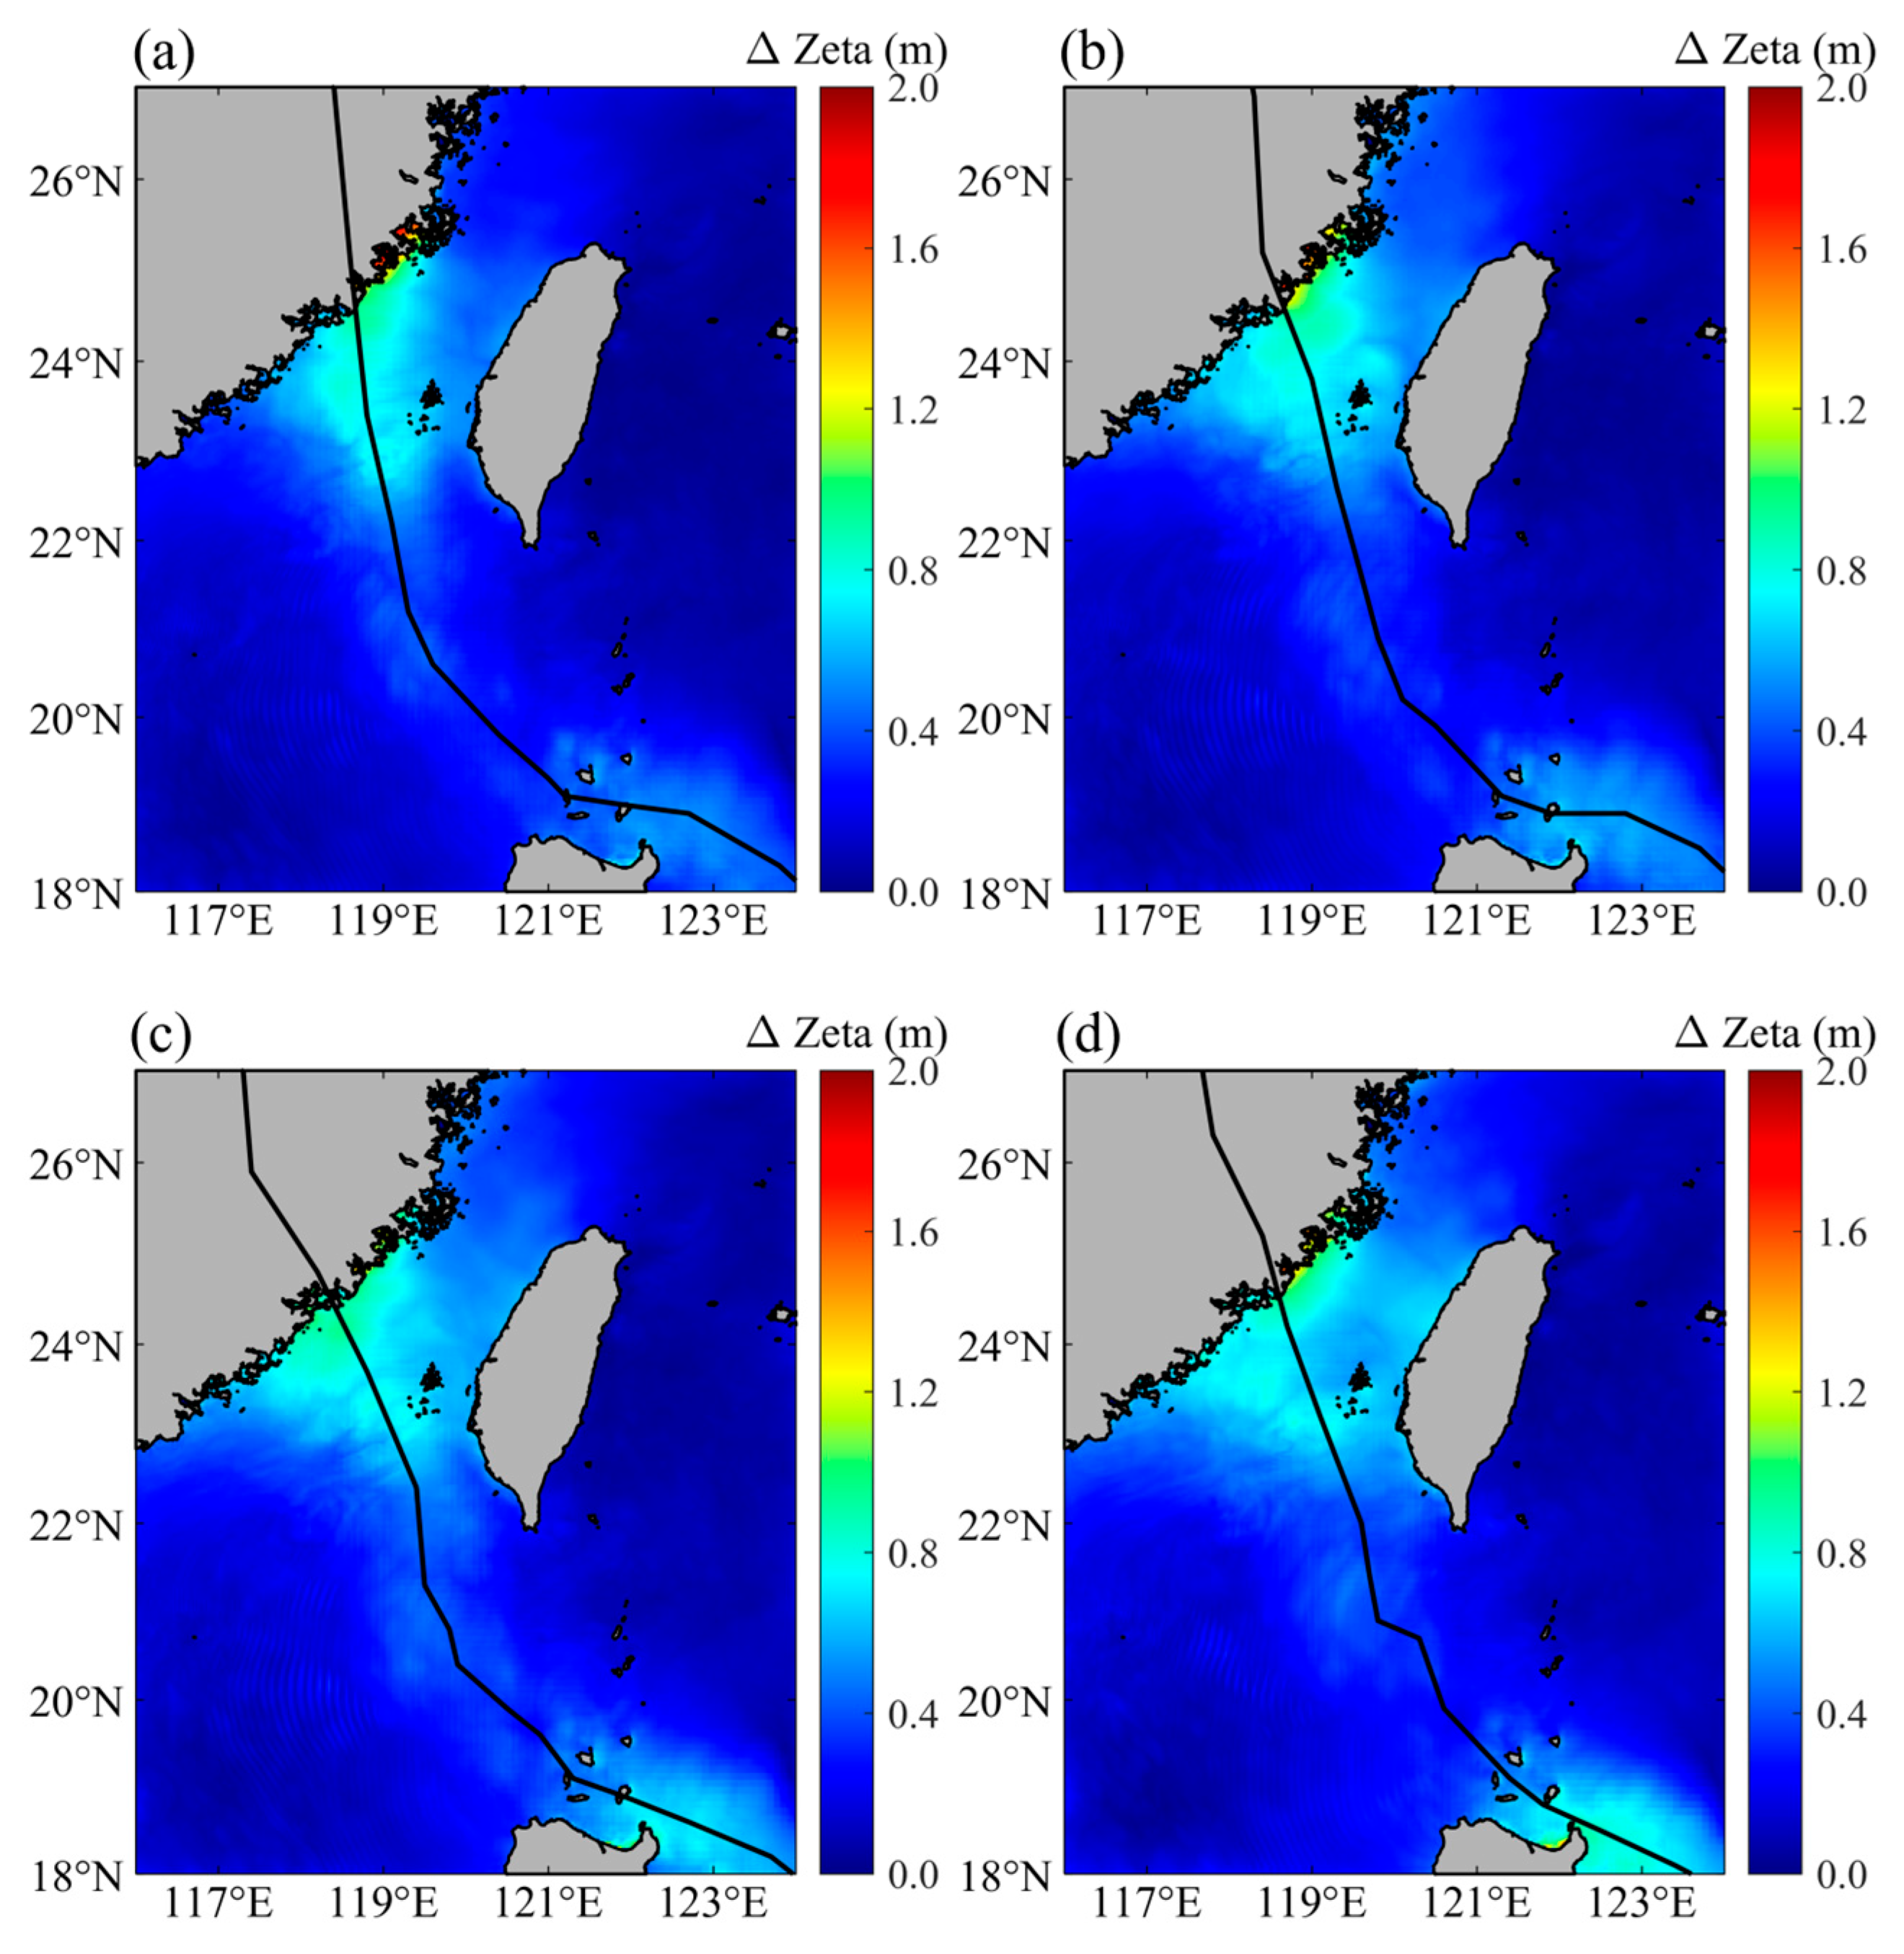
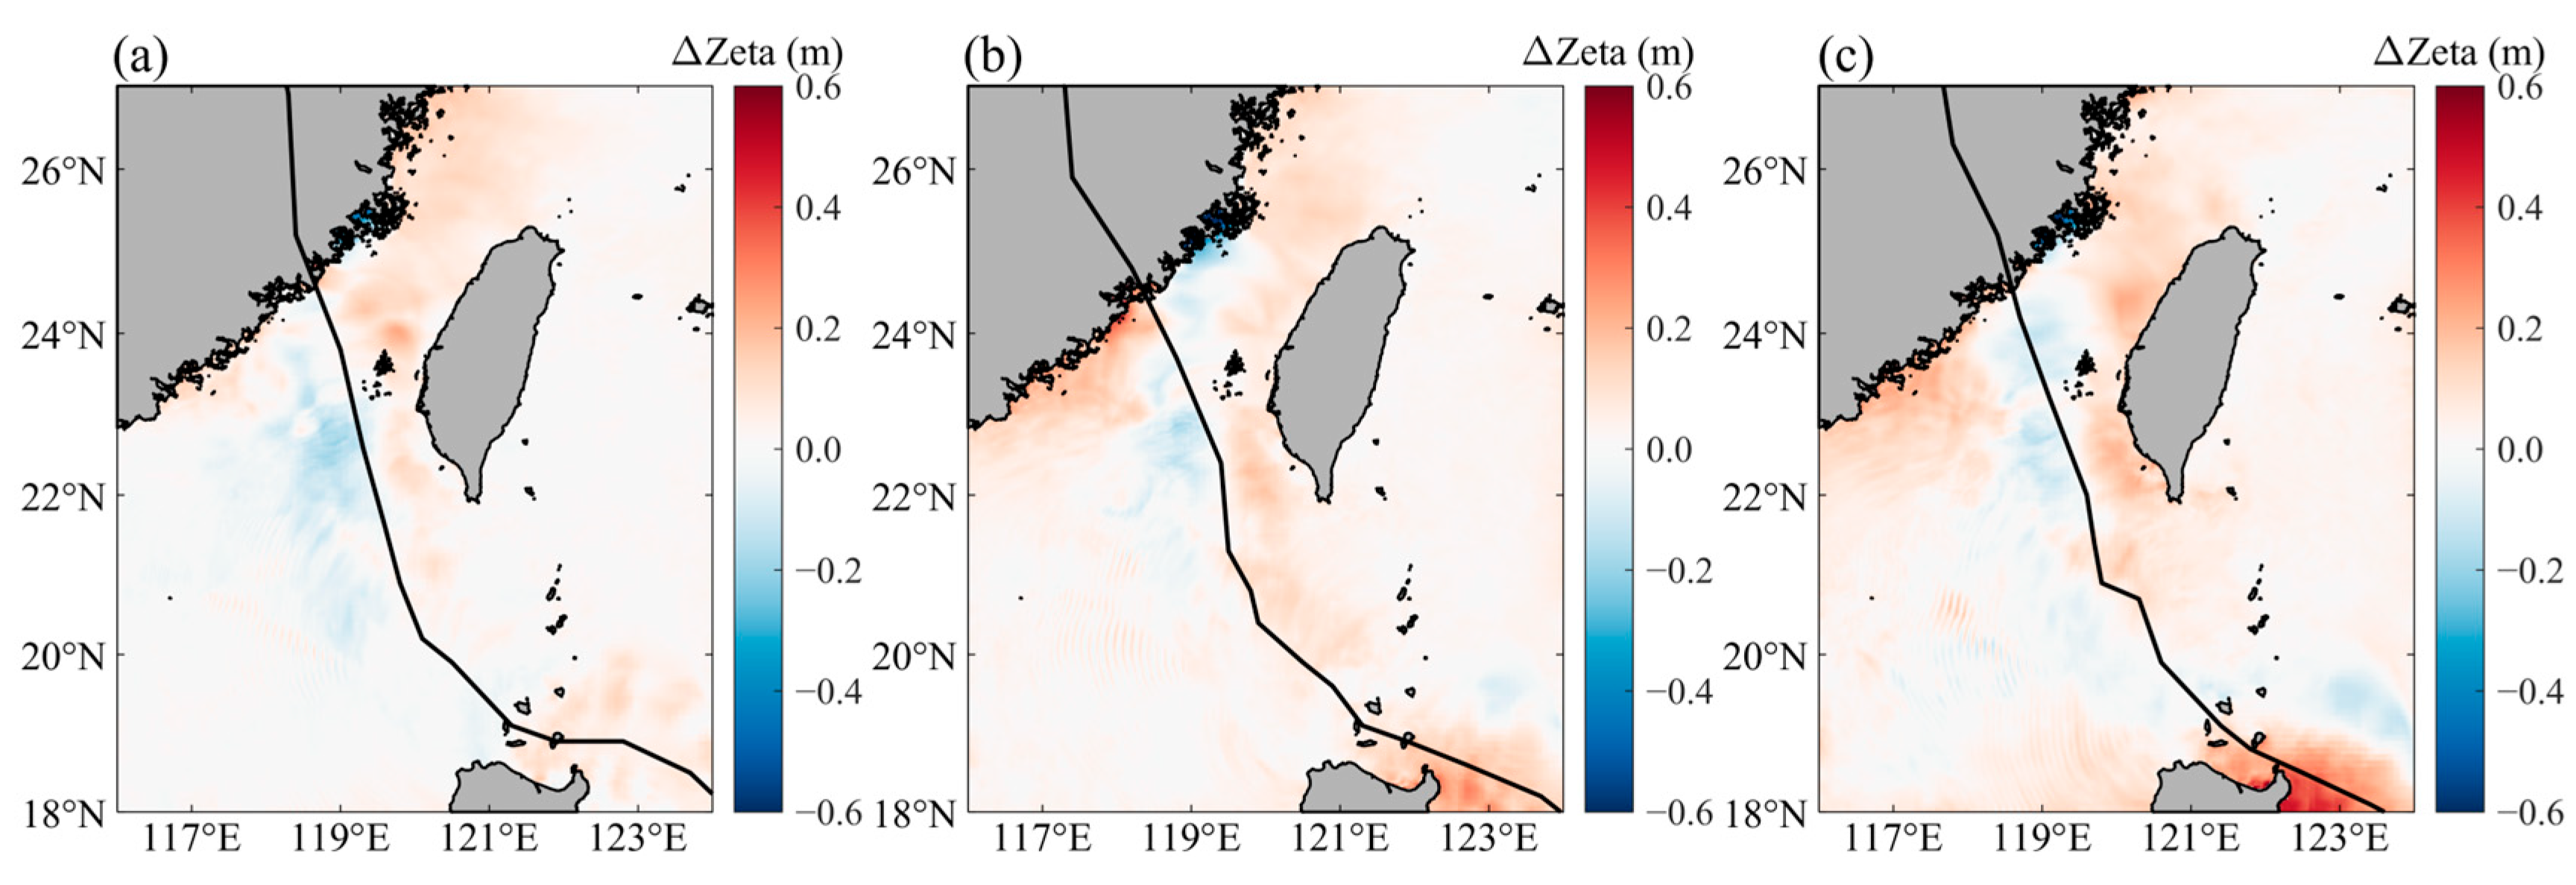
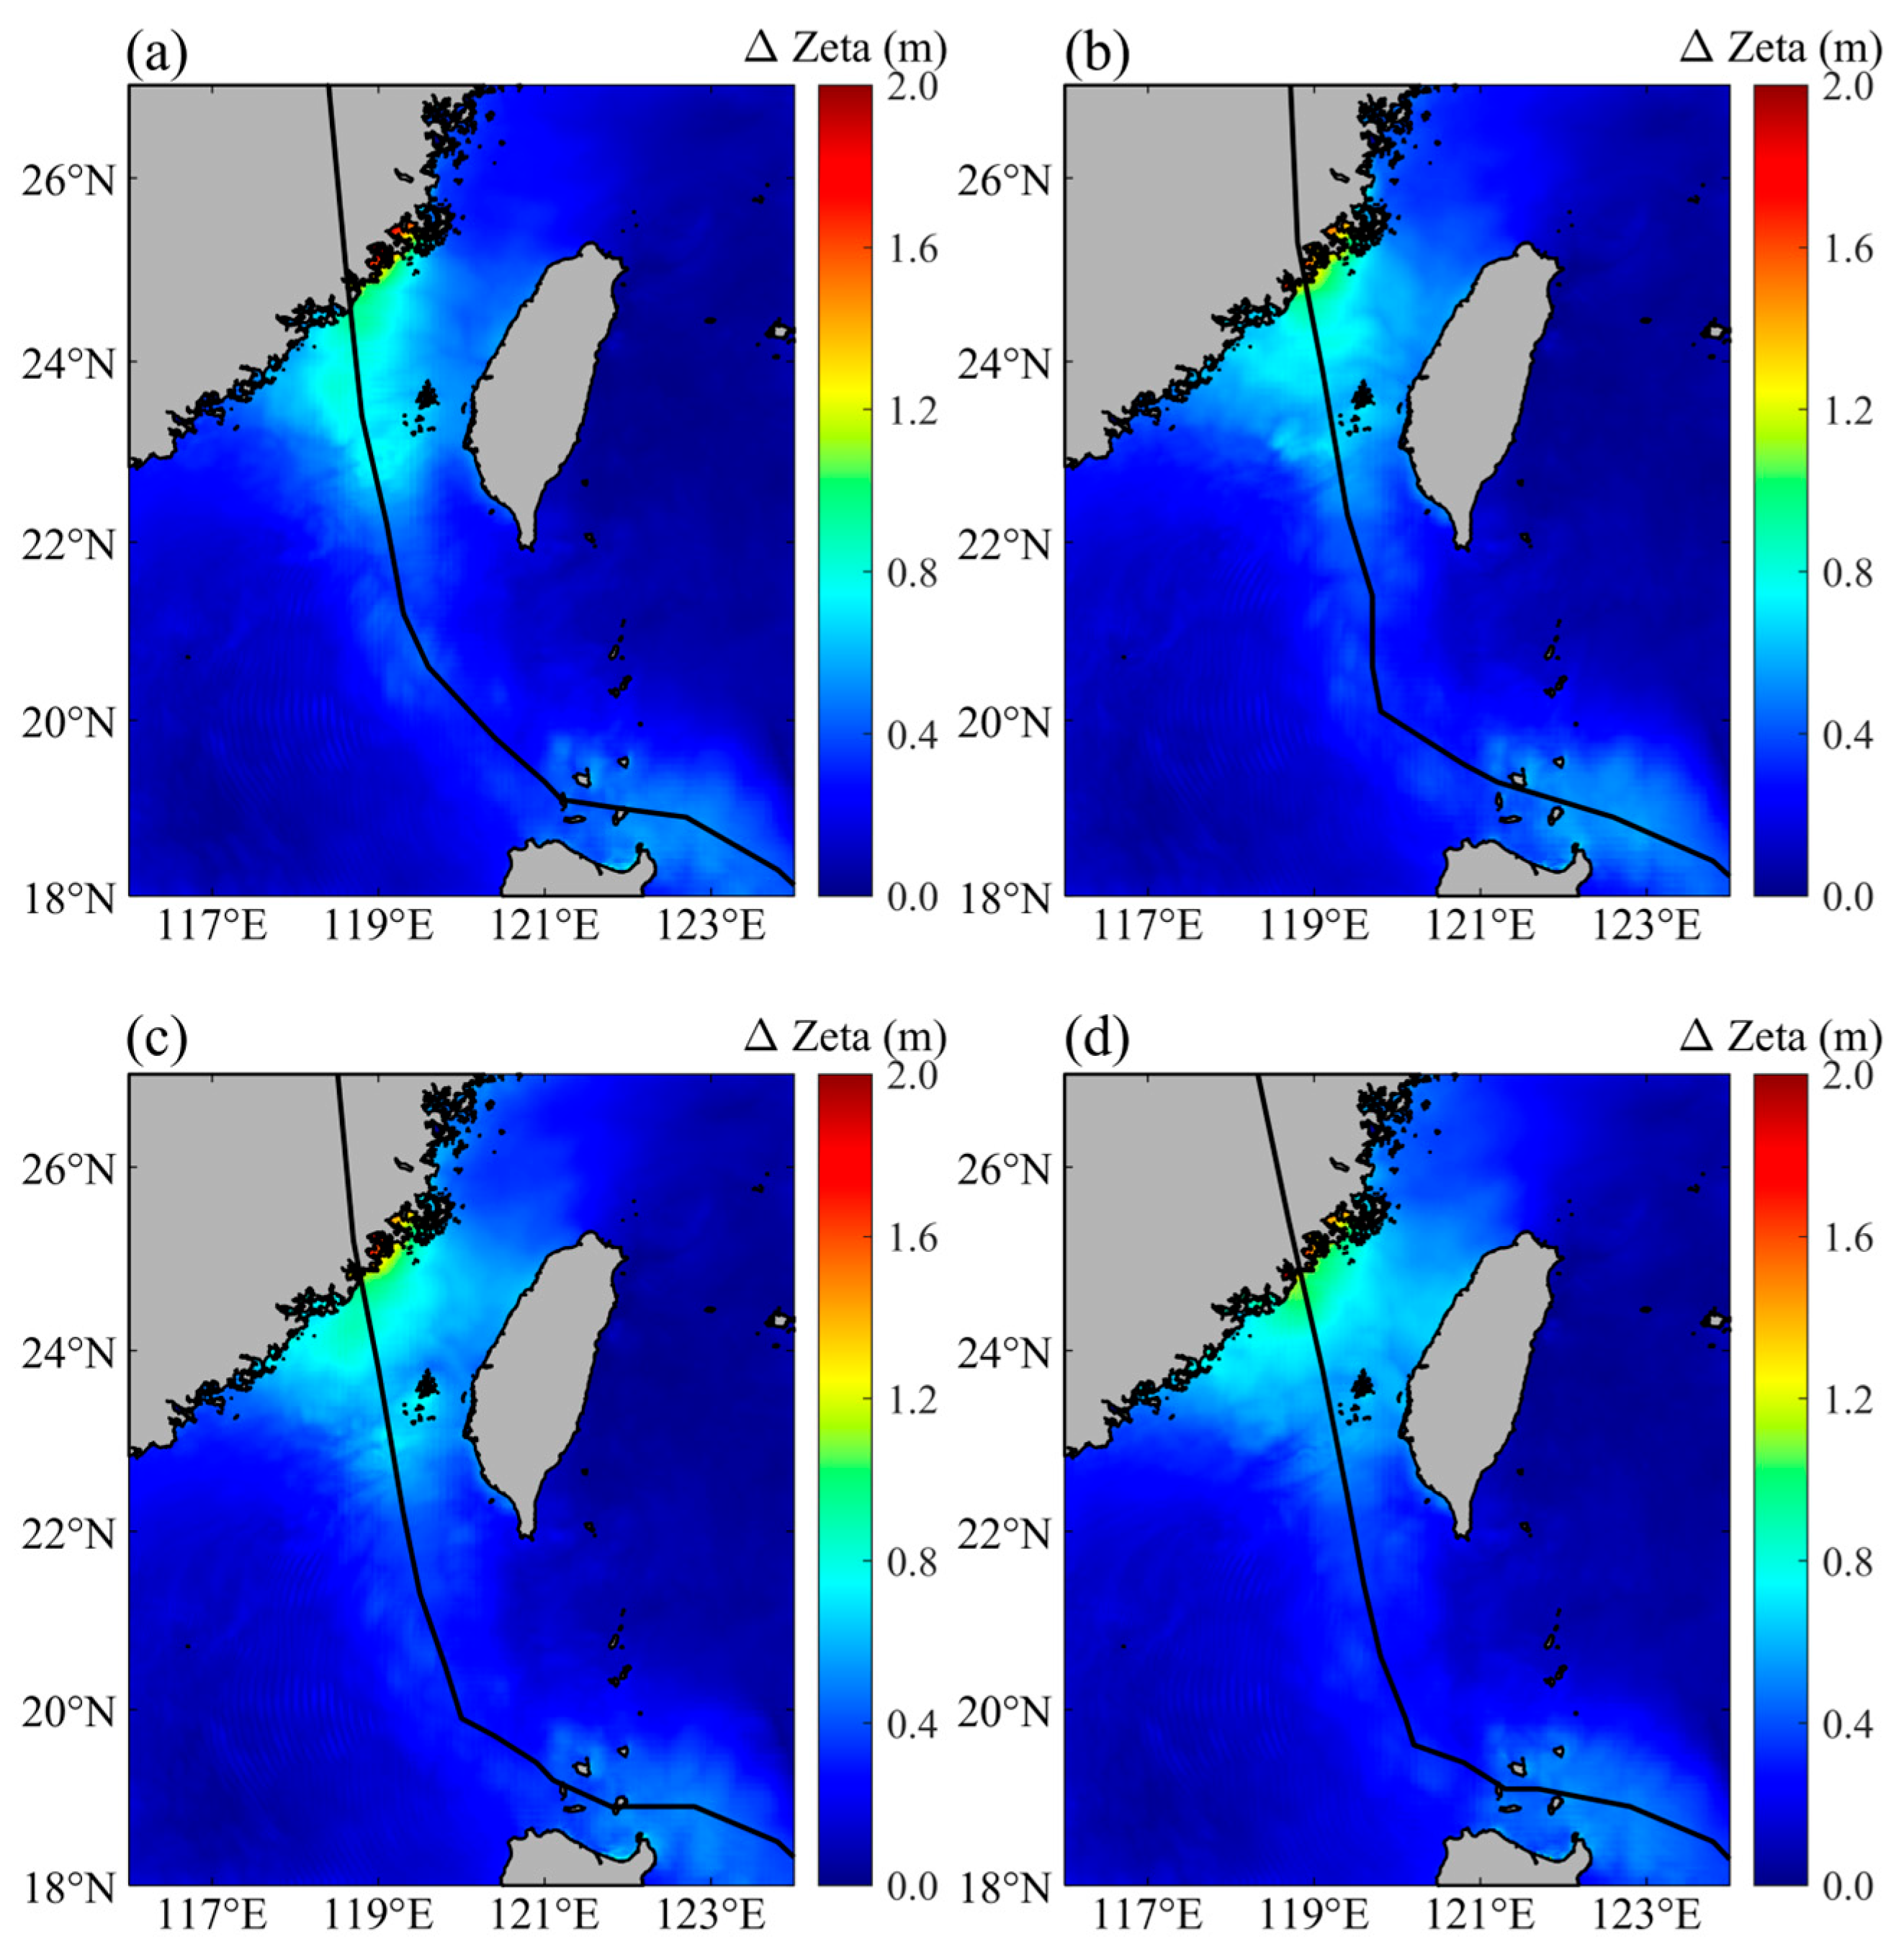
To reveal the causes of the above characteristic point nonlinear responses from a spatial scale, Figure 20 presents the spatial distribution of storm surge extremes under different SST rise scenarios. Figure 20a shows the spatial distribution under the baseline scenario, and Figure 20b–d show the distributions under SST rises of 0.8 °C, 2.0 °C, and 3.5 °C, respectively. As shown, the spatial patterns of storm surge extremes under different warming magnitudes are generally consistent, with high-value areas concentrated on both sides of the nearshore typhoon track. Storm surges are significantly amplified in nearshore areas, showing obvious local enhancement in concave coastlines, estuaries, and shoal areas, which can be explained by geometric constraints and energy convergence mechanisms in shallow water areas [36]. Maximum values appear in the nearshore Fujian area, with some degree of surge also observed on the west side of Taiwan Island and near Luzon Island. With rising SST, the storm surge range in the Taiwan Strait and near Luzon Island is significantly expanded. However, the maximum storm surge extreme near the Fujian coast slightly decreases with rising SST. Since the position of this extreme center does not shift significantly, this nonlinear response is speculated to result from the combined action of topography or coastline constraints and typhoon track deflection and RMW changes.
Further difference analysis between different warming scenarios and the baseline for storm surge extremes is presented in Figure 21. The spatial distribution of storm surge extremes is mainly regulated by topography while also being affected by warming effects and typhoon track deflection. Significant differences in response are observed among different coastal regions. Most coastal areas show increased surge extremes with rising SST, while some areas show decreased surges. Notably, although the spatial position of the maximum surge extreme point does not shift significantly with warming, local surge extremes show non-monotonic changes. This is mainly related to topographic constraints in semi-enclosed bays. When surge is topographically constrained and cannot be dispersed outward to the open sea, local water level elevation becomes more significant. SST rise indirectly regulates onshore wind stress input by changing typhoon intensity and wind field distribution, thereby further modulating surge amplitude.
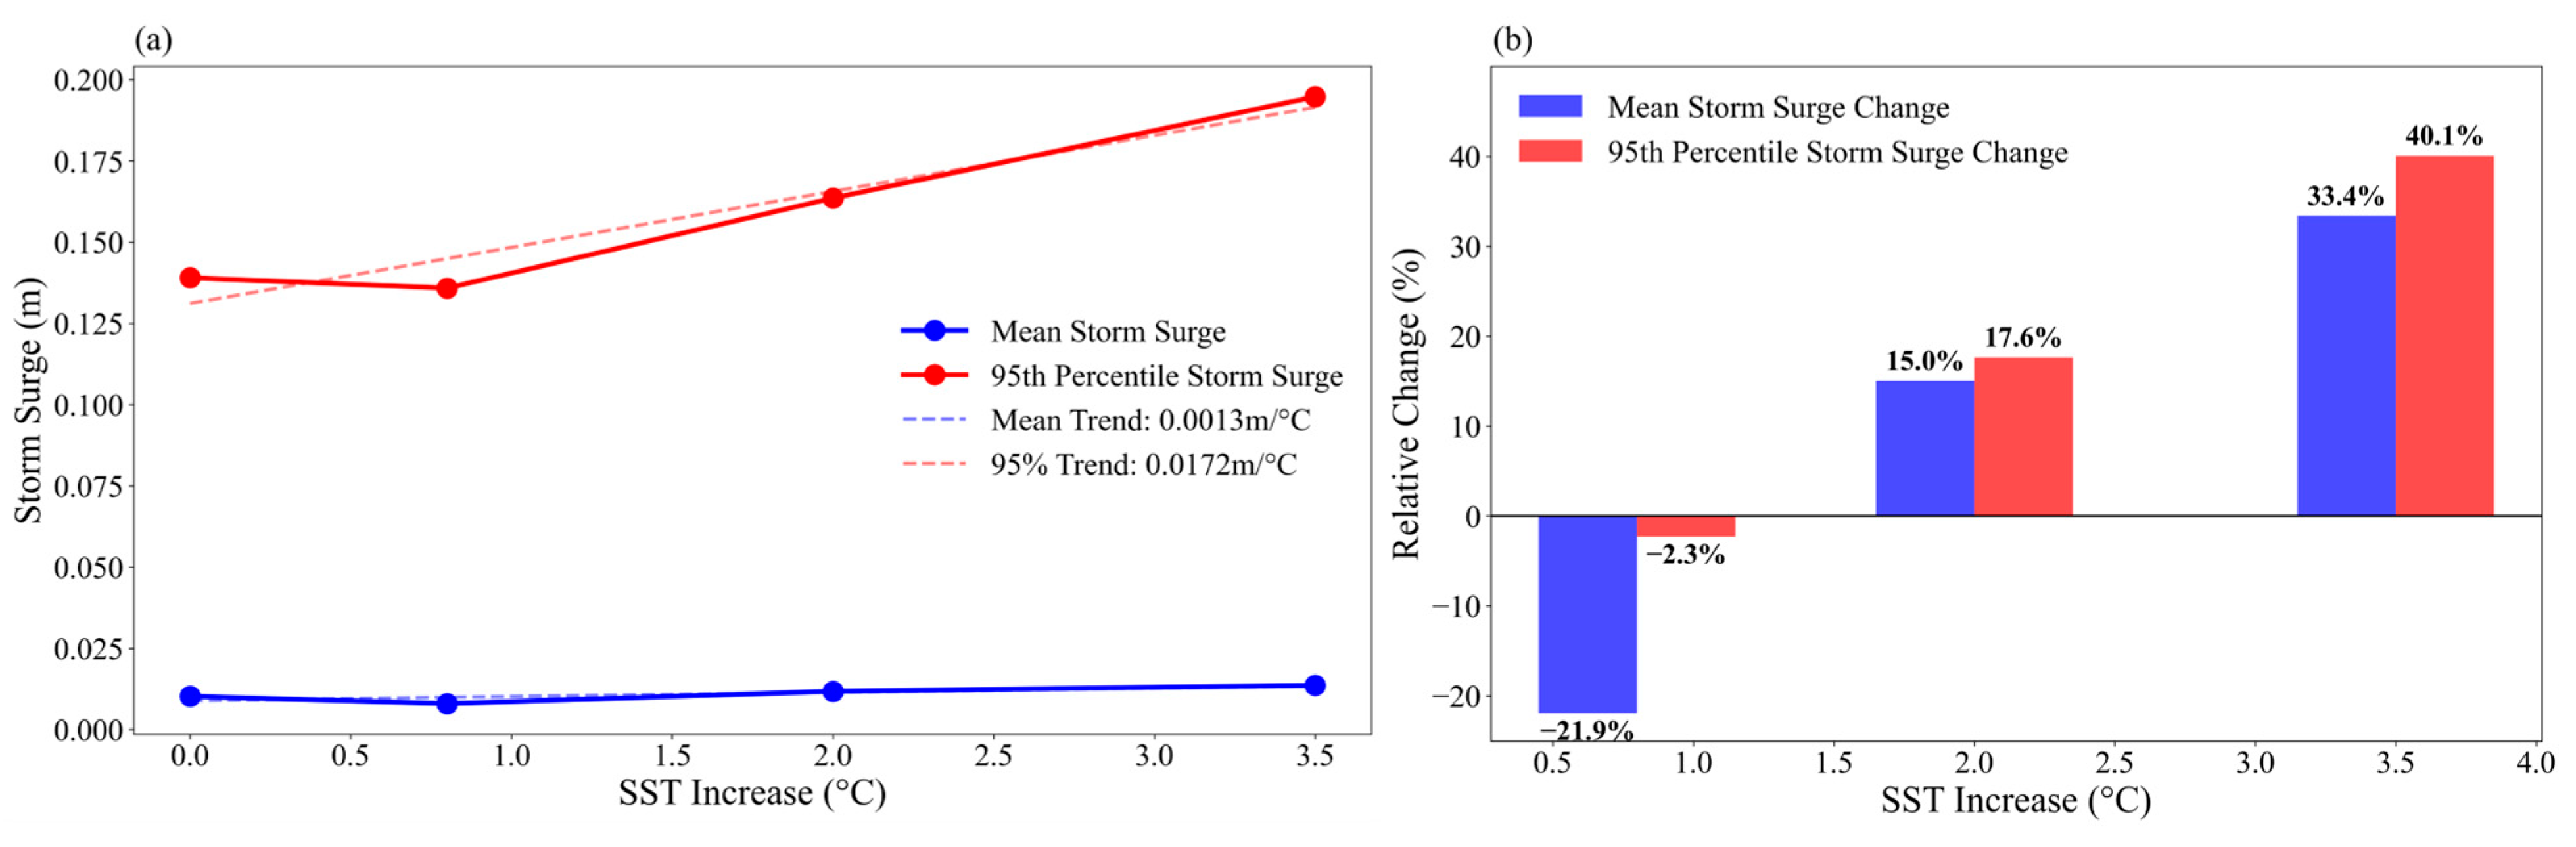
Consistent with the above wave height statistical method, the 95th percentile storm surge is defined as the extreme storm surge in this study, and joint statistics are performed for all domain grid points. The results are presented in Figure 22. Mean storm surge exhibits a non-monotonic pattern characterized by an initial decrease followed by an increase, decreasing by 21.9% at +0.8 °C, turning to increase by 15.0% at +2.0 °C, and further increasing by 33.4% at +3.5 °C. This decrease-then-increase pattern may be explained as follows. In the low-magnitude warming stage, the inhibitory effects of typhoon track deflection and RMW changes on surge are more prominent. As the warming magnitude increases, the positive effect of typhoon intensity enhancement gradually dominates, and storm surge subsequently rises. In contrast, extreme storm surge (95th percentile) shows a pattern closer to monotonic increase, decreasing by only 2.3% at +0.8 °C, then turning to increase, and reaching 40.1% at +3.5 °C. The extreme storm surge sensitivity coefficient (0.0172 m/°C) is approximately 13.2 times that of mean surge (0.0013 m/°C). The significant sensitivity of extreme surge to SST originates from the nonlinear amplification effect of extreme events on typhoon intensity changes. When typhoon intensity is enhanced, the strong wind area expands and wind stress input increases, and under nearshore topographic constraints, extreme surge is not linearly superimposed but jointly modulated by bay topographic focusing and bottom friction saturation effects.

3.2. Influence of Sea Level Rise on Typhoon Waves and Storm Surges

The analysis in Section 3.1 shows that SST rise indirectly amplifies typhoon waves and storm surges by enhancing typhoon intensity. This section investigates the SL rise effect using the same coupled framework to isolate the direct contribution of static water level elevation from intensity-driven amplification.

3.2.1. Typhoon Wave Response

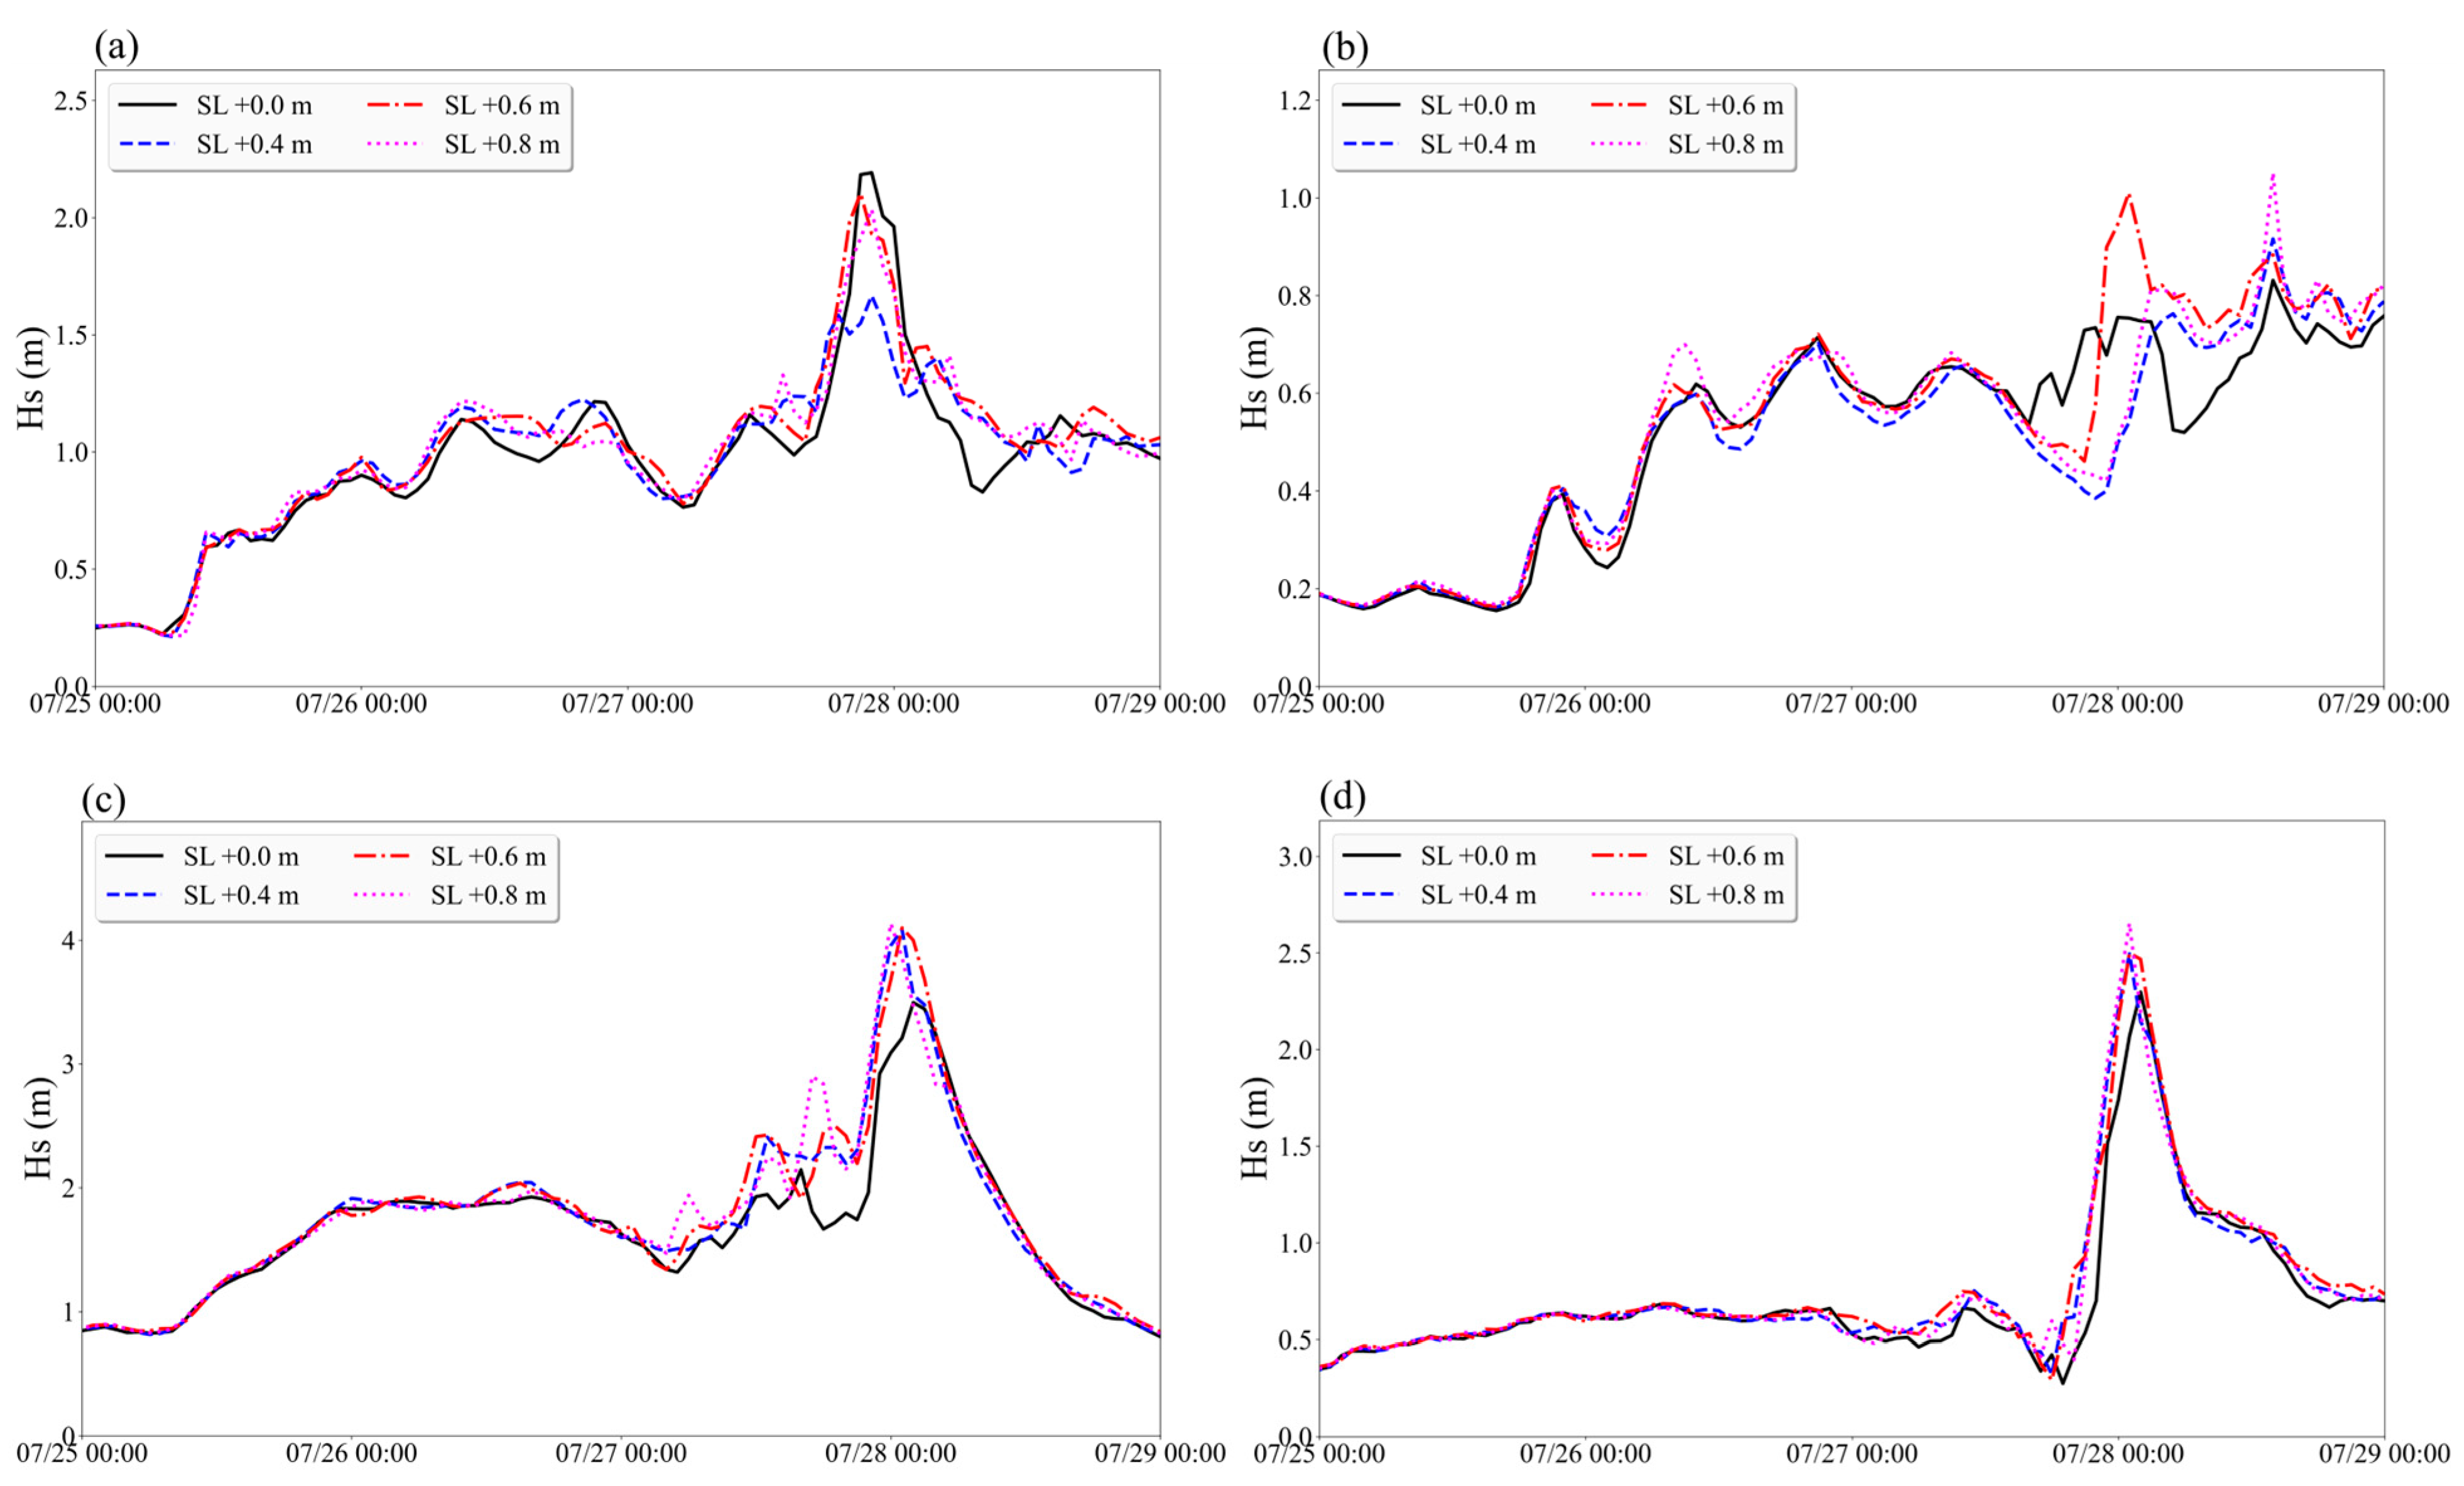
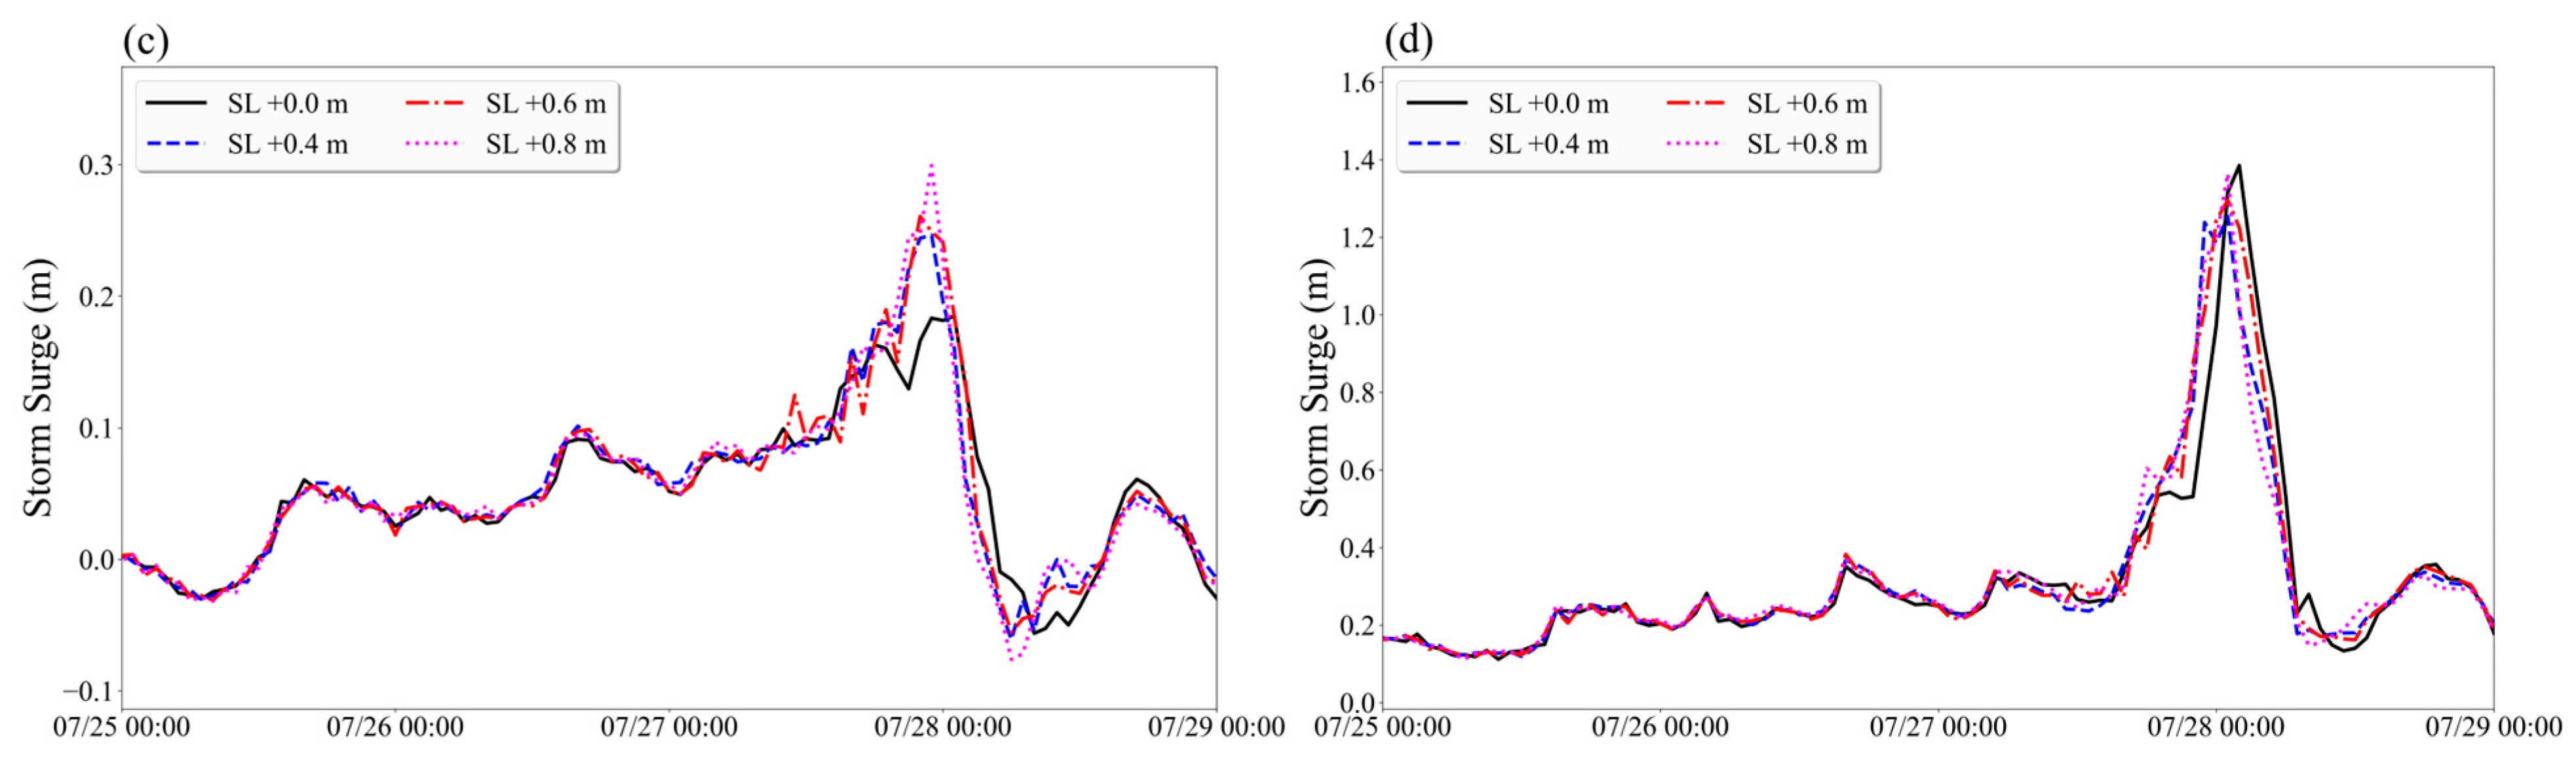
Based on the systematic analysis of the influence of SST rise on typhoon waves, the response characteristics of typhoon waves under SL rise scenarios are examined in this section. Figure 23 presents the wave height changes at characteristic points under different SL rise scenarios. As shown, the T1 point (central Fujian coast) peak decreases from approximately 2.2 m (baseline) to 1.6 m (SL+0.8 m), a reduction of approximately 27%. Further analysis reveals that this decrease is primarily caused by subtle typhoon track deflections under different SL rise scenarios. As T1 is located very close to the typhoon landfall location, its local wave height is highly sensitive to changes in the minimum distance between the typhoon center and the station (Appendix A, Figure A2). Under the baseline scenario, the typhoon passes closest to T1 (64.8 km), yielding the highest local wind speed (21.8 m/s) and consequently the largest wave height. Under SL+0.4 m, the minimum distance increases sharply to 79.0 km, and the maximum wind speed at T1 drops markedly to 15.6 m/s. As SL rise further increases to +0.6 m and +0.8 m, the minimum distance decreases slightly to 75.3 km and 74.3 km, respectively, and the local wind speed recovers to 21.1 m/s and 20.7 m/s, though it remains below the baseline level. The strong covariation between local wind speed and wave height at T1 indicates that the SL-rise-induced wave height variation at this point is predominantly controlled by changes in local wind forcing due to typhoon track variability. The T2 point (southern Fujian coast) peak increases from approximately 0.8 m to approximately 1.05 m, which is related to weakened bottom friction dissipation after water depth increase, allowing more wave energy to propagate to the nearshore [37]. The T3 point (northern Fujian coast) peak increases from approximately 3.5 m to 4.1 m, an amplitude increase of 17%, showing the most significant response. This is related to the fact that this point is located in the typhoon right-side strong wind area with a relatively open sea area, where bottom friction is significantly reduced after water depth increase, allowing waves to develop more fully. The T4 point (northern Fujian coast) peak increases from approximately 2.5 m to 2.7 m, with a relatively small amplitude increase. Although located on the right side of the track, the topographic focusing effect in the bay where this point is located weakens with water depth increase, partially offsetting the enhancing effect of bottom friction reduction on wave height, resulting in limited net increase [38].
Figure 24 presents the spatial distribution of wave height extremes under different SL rise scenarios. Figure 24a shows the spatial distribution under the baseline scenario, and Figure 24b–d show the distributions under SL rise values of 0.4 m, 0.6 m, and 0.8 m, respectively. From a spatial distribution perspective, the spatial patterns of wave height extremes under different SL rise scenarios are generally consistent. SL rise has minimal impact on wave height extremes in open sea areas, and nearshore areas show small fluctuations without obvious systematic patterns, indicating that SL rise mainly acts on nearshore regions and has limited influence on the overall spatial distribution pattern.
To further quantify the spatial response differences caused by sea level rise, Figure 25 presents the spatial distribution of significant wave height extreme increments under different SL rise scenarios relative to the baseline. Wave height extremes decrease in most areas on the central-southern Fujian coast (left side of the typhoon track), which may be related to altered local wave propagation conditions caused by SL-rise-induced water depth increase. Wave height significantly increases in northeastern Fujian coastal areas and the Taiwan Strait (right side of the typhoon track), mainly stemming from significantly reduced bottom friction and wave breaking dissipation after water depth increase, providing more favorable conditions for wave growth [39]. Overall, wave height extremes in most nearshore areas increase with sea level rise, mainly due to weakened bottom friction dissipation after water depth increase. Limited or even decreased wave height increases in some bays or topographic depressions are caused by the weakening of topographic focusing effects with water depth increase, partially offsetting the bottom friction reduction effect. The semi-enclosed topography of the Taiwan Strait exhibits a significant regulatory role under SL rise scenarios [40]. After water depth increase, the channeling effect constrains wave propagation paths and enhances wind stress accumulation, making wave height responses in this region more prominent.
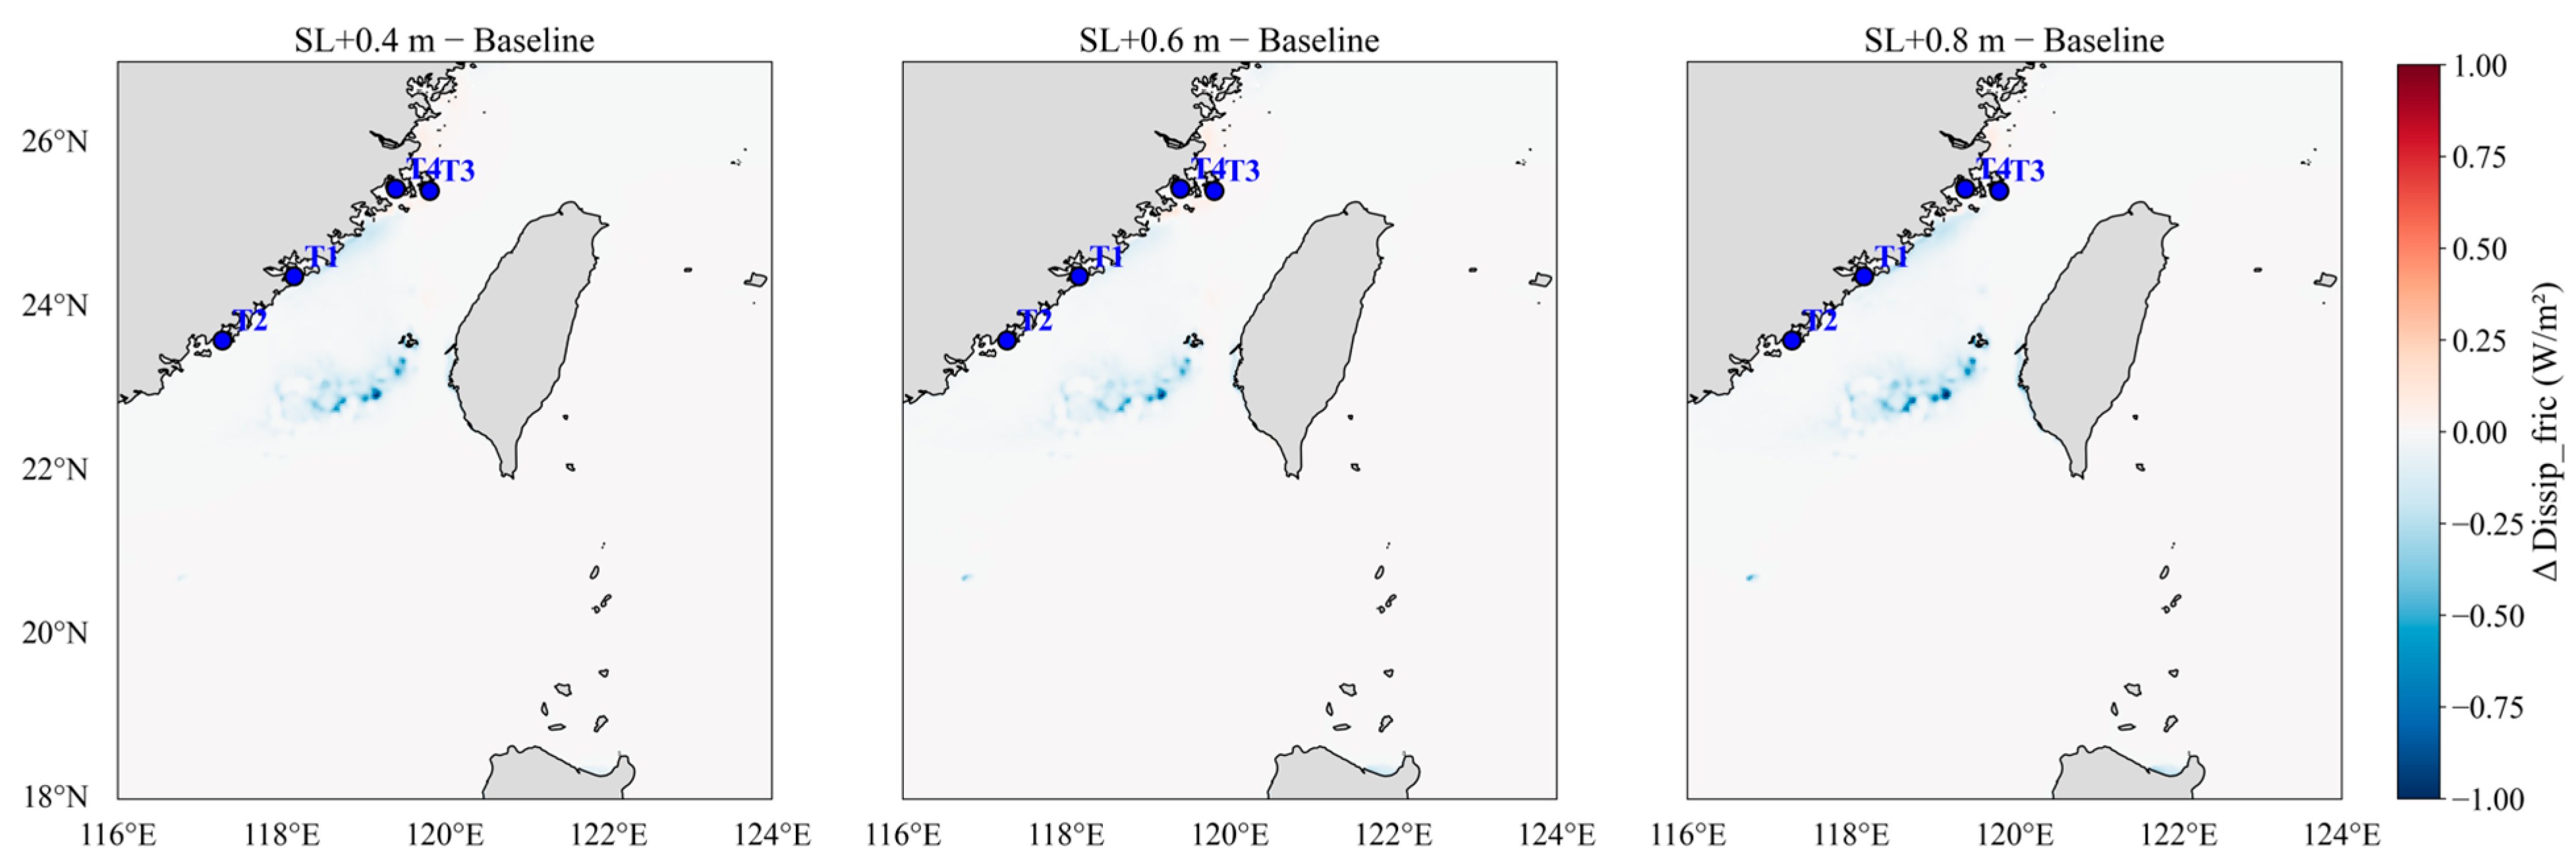
To diagnose the physical mechanism underlying the SL-rise-induced wave height changes, the time series of wave energy dissipation due to bottom friction at characteristic points T1–T4 under different SL rise scenarios are examined (Appendix A, Figure A3). During the typhoon impact period (26–28 July), bottom friction dissipation exhibits pronounced peaks corresponding to the passage of Typhoon Doksuri. As sea level rises, the dissipation magnitude weakens systematically at all four points, reflecting reduced frictional damping as the water column deepens. The spatial pattern of the change in time-averaged wave energy dissipation relative to the baseline (Figure 26) reveals that bottom friction reduction occurs over most nearshore shallow-water regions, further confirming the systematic decrease in bottom friction dissipation with rising sea level observed at the characteristic points.

3.2.2. Storm Surge Response

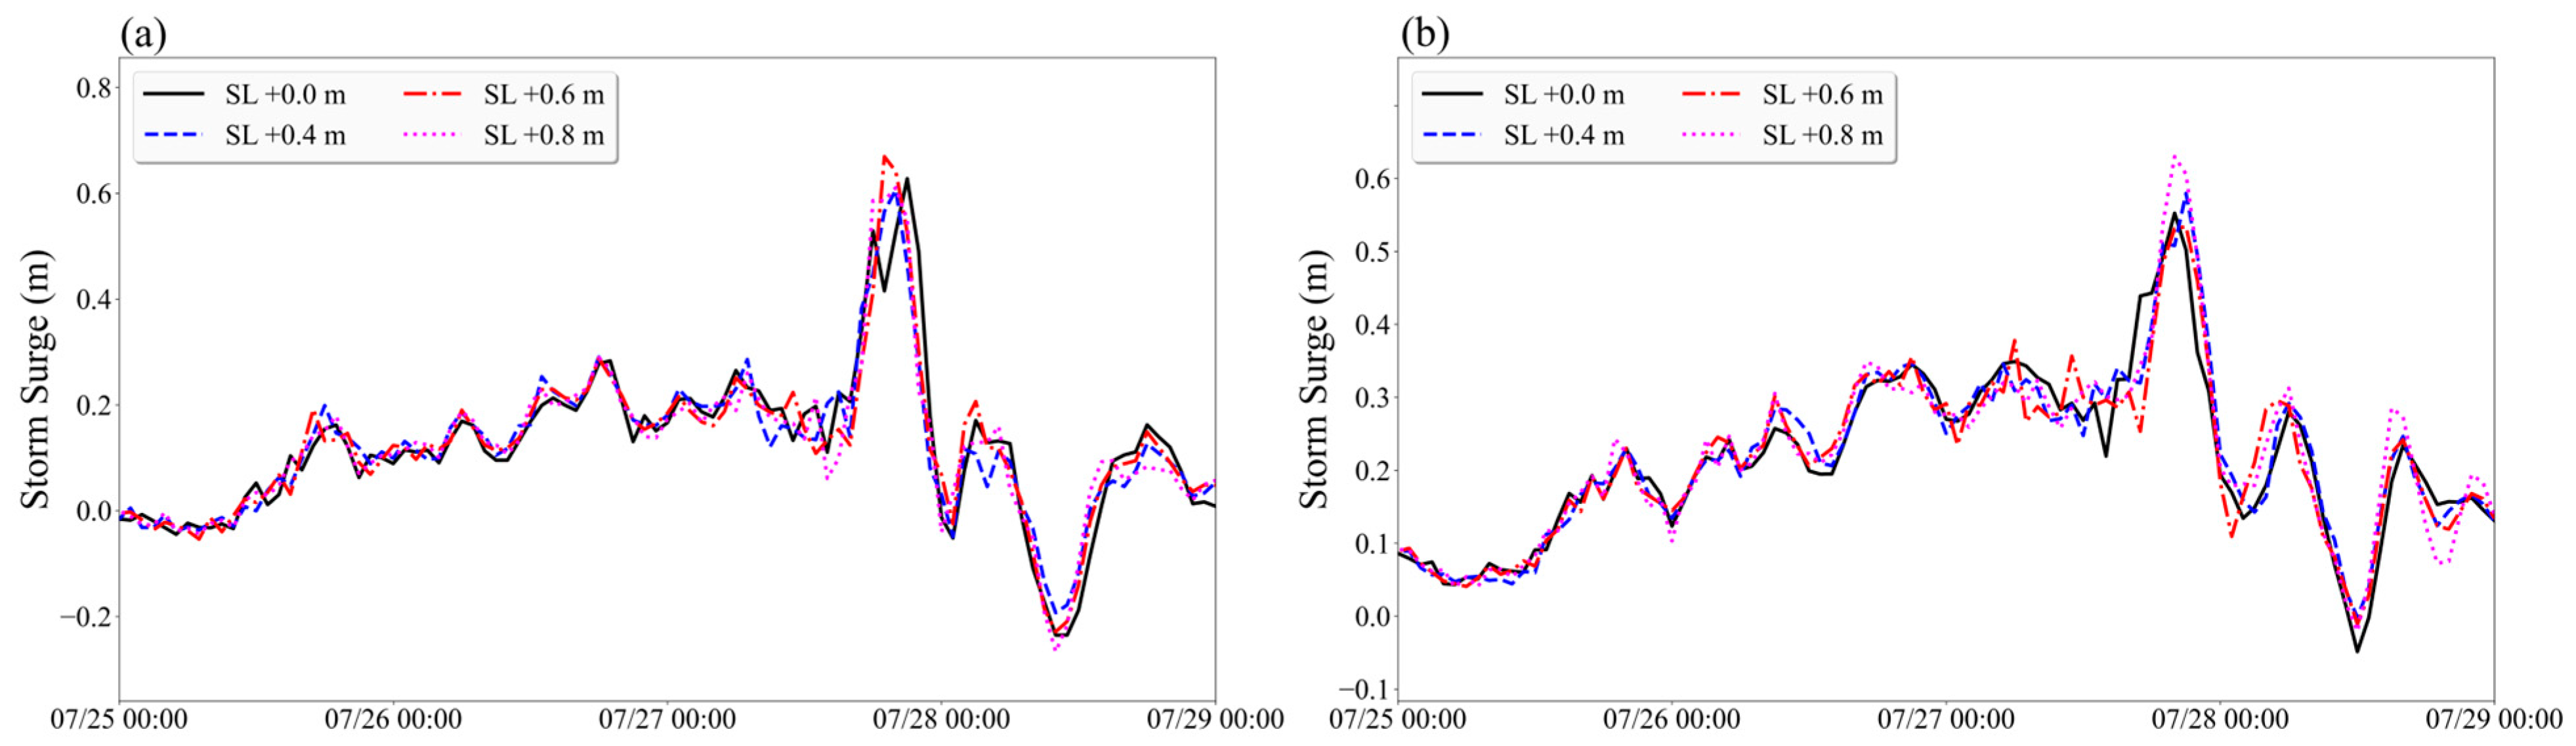
Based on the analysis of SL rise’s influence on typhoon waves, the response characteristics of storm surges under SL rise scenarios are further examined. Figure 27 presents the storm surge changes at characteristic points under different SL rise scenarios. As shown, the T1 point (central Fujian coast) and T2 point (southern Fujian coast) storm surge peaks are approximately 0.6 m and 0.45 m, respectively. Both show minimal changes with sea level rise. The T3 point (northern Fujian coast) peak increases from approximately 0.35 m to 0.5 m (SL+0.8 m), an increase of 43%, showing the most significant response. This is related to the fact that this point is located in the typhoon right-side strong wind area with a relatively open sea area. The T4 point (northern Fujian coast) peak decreases from approximately 1.5 m to approximately 1.3 m (SL+0.8 m), a reduction of approximately 13%, which is related to the weakening of topographic constraint effects in the semi-enclosed bay where it is located as water depth increases. The semi-enclosed bay where the T4 point is located is subject to topographic constraints under the baseline scenario. Storm surge is restricted by the bay geometry and cannot easily be discharged to the open sea, resulting in significant local water level elevation. SL-rise-induced water depth increase reduces the outflow restriction of the bay, effectively increasing the discharge cross-section and allowing previously retained water to more easily disperse toward the open sea along channels, thereby manifesting as a decrease in surge peak.
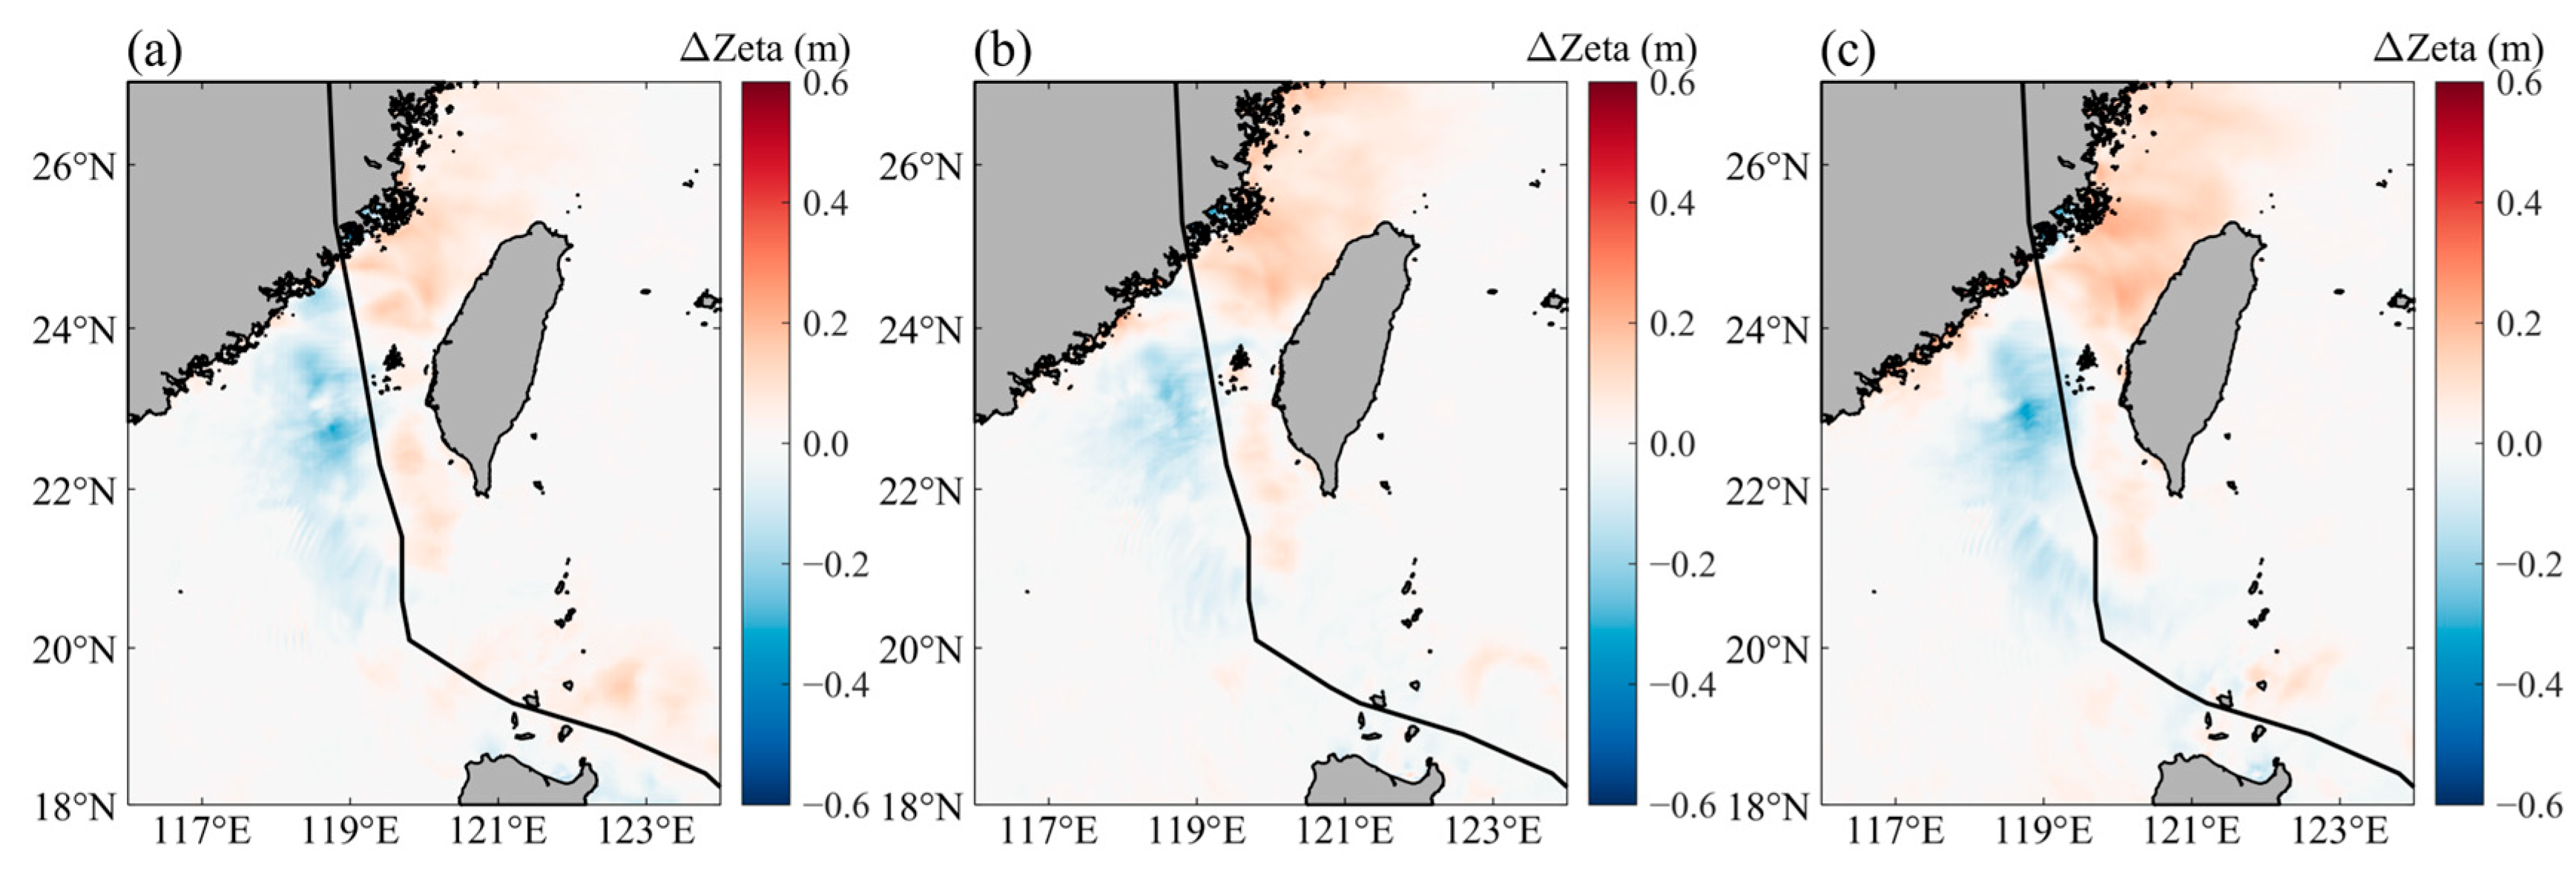
Figure 28 presents the spatial distribution of storm surge extremes under different SL rise scenarios. Figure 28a shows the spatial distribution under the baseline scenario, and Figure 28b–d show the distributions under SL rise values of 0.4 m, 0.6 m, and 0.8 m, respectively. From a spatial distribution perspective, the spatial patterns of surge extremes under different SL rise scenarios are generally consistent. Similar to the wave height response to sea level rise, the influence of sea level rise on storm surges is also mainly manifested in nearshore areas, showing small fluctuations without obvious systematic patterns, while no significant changes are observed in open sea areas, indicating that SL rise mainly acts on nearshore regions and has limited influence on the overall spatial distribution pattern.
To reveal the local response differences in nearshore areas, Figure 29 presents the spatial distribution of storm surge extreme increments under different SL rise scenarios relative to the baseline. Surge extremes decrease in most areas on the outer side of the central-southern Fujian coast while increasing in northeastern Fujian coastal areas, the Taiwan Strait, and the west side of Taiwan Island. This regional difference indicates that although total water level (static sea level elevation plus storm surge) increases approximately linearly with SL rise, the spatial response of the storm surge component itself exhibits significant nonlinear characteristics and is closely related to local topography. Decreased surge on the outer side of the central-southern Fujian coast may be related to altered storm surge propagation conditions caused by SL-rise-induced water depth increase (such as increased shallow-water wave speed and changed wind stress transfer efficiency). Increased surge in northeastern Fujian and the Taiwan Strait mainly stems from significantly reduced bottom friction after water depth increase, with weakened energy dissipation causing storm surge water levels to tend to increase, combined with the amplification effect of the channeling effect of the semi-enclosed Taiwan Strait topography on surge response. Overall, surge extremes in most nearshore areas increase with sea level rise, with the main controlling mechanism being the weakening of bottom friction effects after water depth increase. Decreased surges in individual semi-enclosed bays are caused by the weakening of topographic constraint effects with water depth increase, allowing storm surge currents to more easily disperse toward the open sea [41].
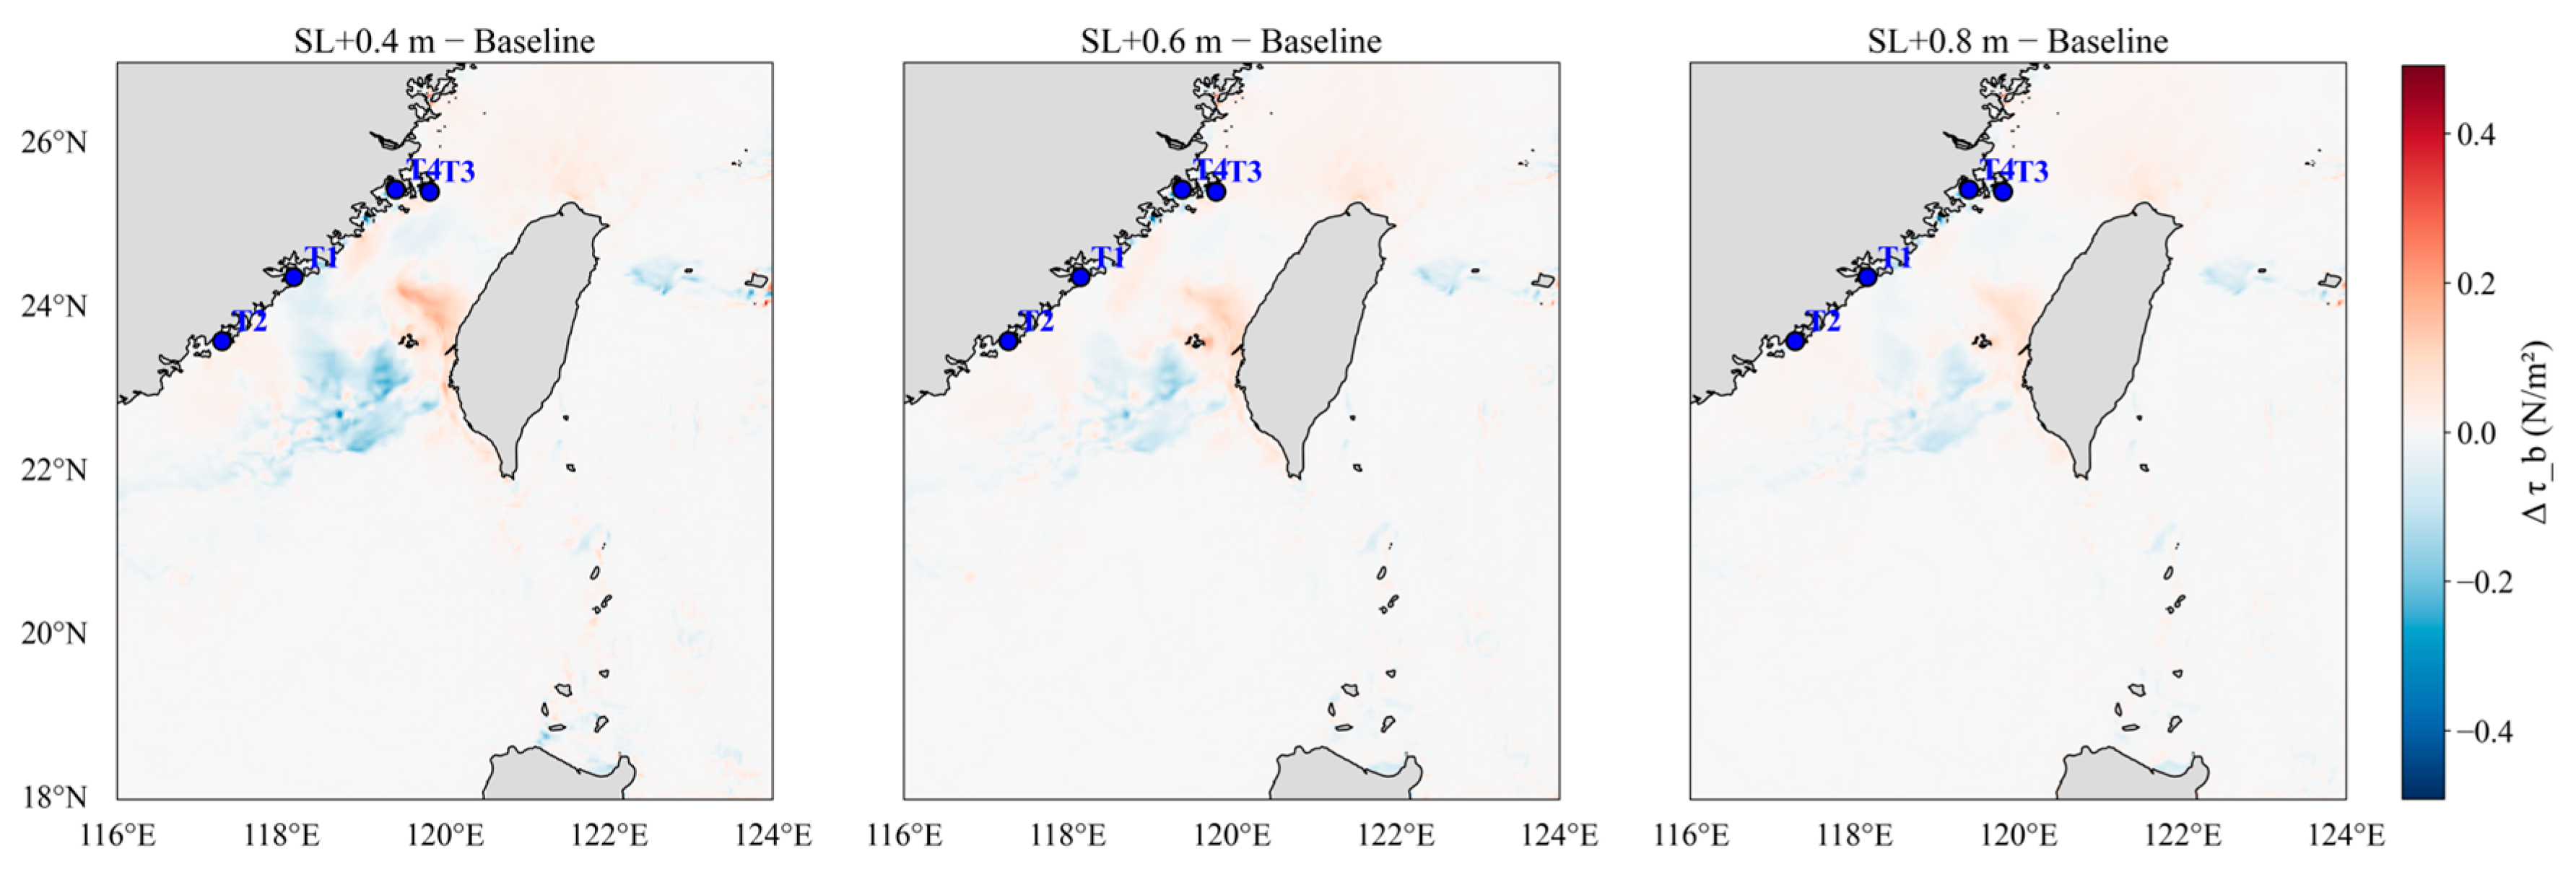
To examine the physical mechanism through which SL rise modifies the storm surge response, the bottom friction stress (τb) time series at T1–T4 under different SL rise scenarios are examined (Appendix A, Figure A4). Under SL rise scenarios, τb exhibits a marked reduction at all characteristic points, reflecting the decreased frictional resistance as the water column deepens. The spatial distribution of the change in time-averaged bottom friction stress relative to the baseline (Figure 30) demonstrates that the reduction in τb is concentrated in shallow nearshore zones, consistent with the systematic weakening of bottom friction at the characteristic points as sea level rises.

3.2.3. Storm Surge Inundation Response

Inundation assessment adopts a static bathtub approach based on the SRTM DEM (30 m resolution). A grid cell is classified as inundated when the total water level (astronomical tide + storm surge) exceeds the local topographic elevation. No coastal defence structures, building blockage, or drainage systems are considered in this framework. The inundation threshold is applied uniformly across the domain without accounting for subsurface drainage or surface runoff capacity.
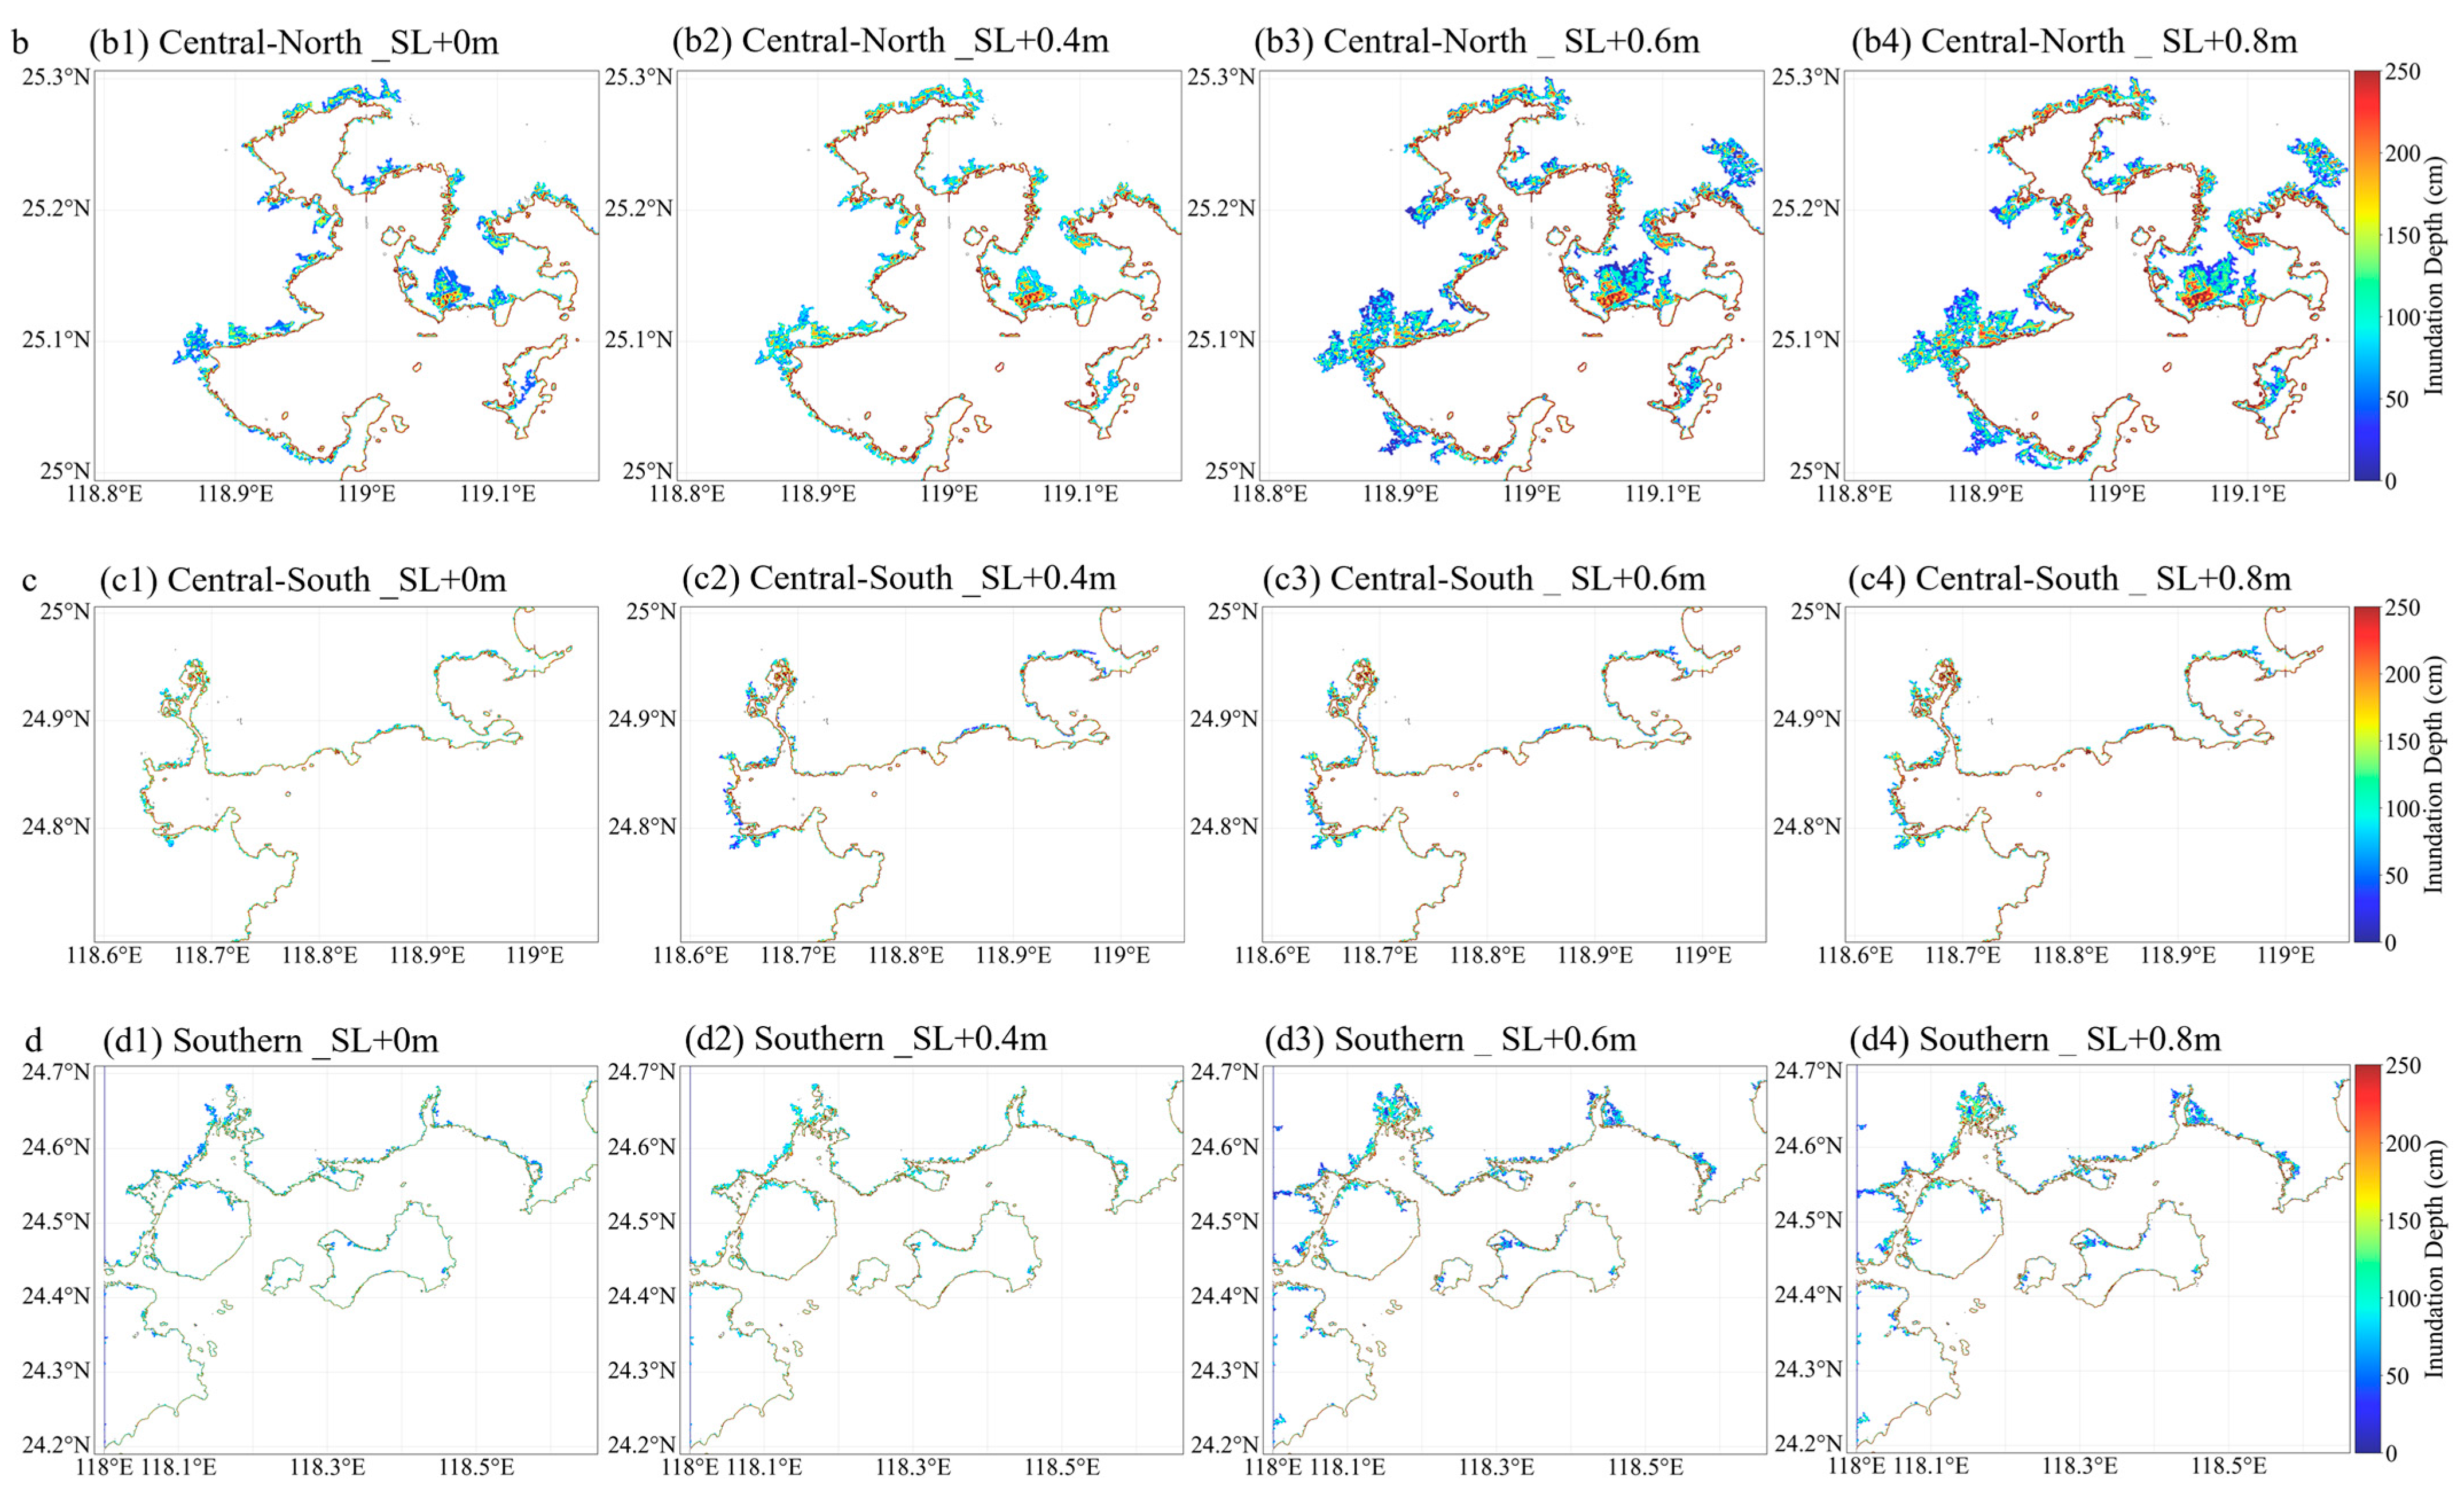
Additional inundation modeling is conducted for the coastal area near the landfall point of Typhoon Doksuri. The key coastal stretches covered include the continuous coast from Zhangzhou to Putian, from south to north, the southern stretch (Zhangzhou–Xiamen south coast), the central-south stretch (Xiamen Bay coast), the central-north stretch (Quanzhou south coast), and the northern stretch (Quanzhou–Putian south coast). Figure 31 presents the inundation spatial distribution of the above four coastal stretches under the baseline, SL+0.4 m, SL+0.6 m, and SL+0.8 m scenarios. The stretches are arranged from top to bottom as northern, central-north, central-south, and southern. Overall, a deterministic aggravating effect of sea level rise on inundation disasters is observed, but significant spatial differences exist. Baseline inundation is severe in coastal stretches on the right side of the typhoon track (central-north and northern), with large absolute increases after sea level rise. Baseline inundation is lighter in stretches on the left side of the track and near the landfall point (southern and central-south), but more significant relative increases after sea level rise are observed. Among them, the central-north stretch, affected by the channeling effect of semi-enclosed topography amplifying storm surge, is the most severely inundated of the four stretches. Under the 0.8 m SL rise scenario, areas with inundation depths exceeding 250 cm increase significantly, mainly due to the combined effect of reduced bottom friction effects and elevated baseline water level after water depth increase.
Table 4 presents the statistical results of inundation area. Inundation area exhibits phased growth characteristics with sea level rise: a modest increase (~10%) in the 0.4 m scenario, an abrupt increase (~41%) in the 0.6 m scenario, and decelerated growth (~47%) in the 0.8 m scenario. These values represent first-order sensitivity estimates under the static bathtub assumption rather than definitive flooding projections, as they do not account for coastal defence infrastructure, building blockage, or drainage capacity that would moderate real-world inundation extent. Mean inundation depth changes are relatively small (5% to 14%). Risk increases are most pronounced in areas with originally strong storm surge, indicating that sea level rise directly constrains nearshore dynamic processes by elevating the mean sea level [24]. Although storm surge components may decrease in some areas, baseline water level elevation makes storm surges of the same intensity more likely to reach disaster thresholds, leading to a deterministic increase in inundation range [42].

4. Discussion

4.1. SST Effects and Comparison with Existing Studies

The sensitivity experiments in Section 3.1 reveal that SST rise produces significant effects on typhoon intensity, typhoon waves, and storm surges, but the response characteristics show obvious differences. Typhoon intensity exhibits nonlinear accelerated enhancement, with an increase of 16.52% at +3.5 °C. Typhoon wave heights show monotonic overall increases, with mean wave height increased by 25.0% and extreme significant wave height increased by 24.0%, and the sensitivity coefficient of extreme wave height (0.3979 m/°C) is approximately 2.75 times that of mean wave height (0.1445 m/°C). Storm surge exhibits a non-monotonic response characterized by an initial decrease followed by an increase, decreasing by 21.9% at +0.8 °C and increasing by 33.4% at +3.5 °C. The extreme storm surge sensitivity coefficient is approximately 13.2 times that of mean surge. The physical rationality of these responses is further elaborated below through comparison with existing studies and using MPI theory.
Lavender et al. [18] conducted sensitivity experiments with Typhoon Yasi, and the results showed that SST +2 °C enhances intensity by approximately 10%. Linear interpolation from this result yields a theoretical expected increase of approximately 17.5% under the +3.5 °C scenario, which is slightly higher than the simulated result of this study (16.52%). This reflects the fact that typhoon intensity response to SST is not strictly linear and is modulated by regional environmental factors such as Taiwan Strait topographic constraints. The intensity increase obtained in this study can also be independently verified from Emanuel’s [8] maximum potential intensity (MPI) theory. MPI is exponentially positively correlated with sea surface temperature, and when SST rises by 3.5 °C from the baseline, the theoretical MPI increases by approximately 15% to 20%, which is in high agreement with the simulated result of this study (16.52%). This consistency not only supports the applicability of the WRF model parameterization schemes but also indicates that the enhancement effect of SST rise on typhoon intensity is mainly constrained by the thermodynamic upper limit, rather than being a random error of model computation. Mei et al. [10] found that the intensity of Northwest Pacific landfalling typhoons has shown a significant increasing trend since the 1970s, attributed to persistent coastal SST rise, and the sensitivity experiments in this study provide process-scale physical explanations for this long-term trend. Salarieh et al. [20] projected that future persistent SST rise will lead to stronger hurricane wind speeds and higher storm surge water levels along the US Atlantic and Gulf coasts, and the sensitivity coefficients obtained in this study (2.75 and 13.2 times for extreme wave height and extreme surge, respectively) provide quantitative support for such projections.
From a mechanism perspective, SST rise indirectly amplifies typhoon intensity by enhancing air–sea heat fluxes, and the energy transfer path can be summarized as follows. SST rise leads to increased latent heat flux, which enhances typhoon intensity, and then increased wave heights and surges are driven by enhanced wind stress input. This indirect path is modulated by typhoon internal dynamics, and the stage-dependent RMW changes described in Section 3.1.1 (contraction during intensification and expansion during mature stages) are typical manifestations, echoing Kaplan et al. [34] regarding the structural evolution patterns of rapidly intensifying typhoons. The non-monotonic response of storm surge, with the extreme storm surge sensitivity coefficient being approximately 13.2 times that of mean surge, indicates that extreme events are much more sensitive to climate change than average conditions and should be considered as key factors in adaptation planning.

4.2. SL Rise Effects and Topographic Regulation Mechanisms

The analysis in Section 3.2 shows that SL rise has relatively minor effects on open sea areas but notably alters coastal and topographically constrained regions. In the implemented SL rise scenarios, the elevation of mean sea level and the increase in water depth are physically equivalent: adding the SL rise increment to the bathymetric depth (h → h + SL rise) simultaneously raises the water surface and deepens the water column relative to the fixed topography. Most nearshore wave heights and storm surge extremes increase with SL rise, while decreased surges are observed in individual semi-enclosed bays. The inundation area increase reaches 46.59% under the 0.8 m SL rise scenario. This inundation increase magnitude is comparable to that reported by Jisan et al. [23] for the Bay of Bengal, where 0.54 m SL rise leads to an approximately 50% increase in inundation area. Although the regions differ, the magnitude of increase is comparable, indicating a broadly consistent aggravating effect of SL rise on inundation across different regional settings. Chen et al. [11] investigated the Massachusetts coast using the FVCOM model, pointing out that approximately 0.5 m SL rise can significantly enhance inundation, and the results of this study verify the regional applicability of this conclusion along the southern Fujian coast.
From a mechanism perspective, SL rise directly alters nearshore hydrodynamic boundary conditions by elevating the baseline water level, and the influence path can be summarized as follows. SL rise causes water depth increase, bottom friction is consequently reduced, and nearshore wave heights and surges are increased. This mechanism is supported by the bottom friction dissipation and bottom stress diagnostics presented in Figure 26 and Figure 30, which show systematic weakening of frictional damping in nearshore regions under elevated SL rise scenarios. In semi-enclosed bays, weakened topographic constraint effects cause surges to decrease. This mechanism difference can be directly verified from characteristic point responses. The T3 point is located in the open sea area on the right side of the typhoon track, and after SL rise, increased water depth significantly reduces bottom friction, with both wave heights and surges showing increasing trends. The T4 point is located within a semi-enclosed bay, and although SL rise similarly reduces bottom friction, the weakening of topographic constraint effects allows water to more easily disperse toward the open sea, and the net effect manifests as decreased surge. The comparison of these two local responses indicates that the influence of SL rise on storm surges is not uniformly amplified but is jointly determined by topographic openness and constraint conditions.
The semi-enclosed topography of the Taiwan Strait produces significant non-uniform responses under SL rise scenarios. Yang et al. [24] investigated Typhoon Maria, pointing out that Taiwan Island topography can weaken southwestward storm surge flux in the strait by approximately 16% through the blocking effect and channeling effect. The results of this study further show that when SL rise causes water depth increase, the regulatory role of the channeling effect undergoes nonlinear transformation. On the one hand, increased water depth weakens bottom friction dissipation, further amplifying wave heights and surges on the right side of the track. On the other hand, reduced outflow restriction in semi-enclosed bays causes surges at points such as T4 to decrease instead. This bidirectional regulation indicates that simply assuming SL rise will uniformly aggravate coastal disaster risks may overestimate some regions while underestimating others.
The essential difference between SST rise and SL rise mechanisms lies in the energy input path and time-varying characteristics. SST changes typhoon intensity by enhancing air–sea heat fluxes, and its effect has significant time-varying characteristics, continuously acting on the sea areas along the typhoon track as the typhoon moves and causing peak times to advance. SL rise directly modulates nearshore dynamic boundary conditions through static water depth elevation, mainly changing wave heights and surge magnitudes rather than temporal structures. This difference imposes different requirements on numerical simulation frameworks. Noncoupled atmospheric models cannot capture SL rise-induced water level constraints and bottom friction changes, while noncoupled ocean models cannot feedback SST-induced typhoon intensity changes to ocean boundary conditions. The two-way coupled architecture of the COAWST system enables both driving factors to be simultaneously represented within a unified framework.

4.3. Uncertainties and Future Research Directions

Several uncertainties exist in this study. First, spatially uniform increments are adopted for SST rise and SL rise in the sensitivity experiments, without considering the spatial distribution characteristics of regional sea temperature anomalies and the spatial variability in SL rise. Under actual climate change, SST rise shows significant spatial inhomogeneity, and SL rise also exhibits regional differences due to crustal movement, ocean currents, and other factors [15]; the simplified treatment in this study may introduce some bias in the response magnitude assessment. Second, coupled model simulations of rapid typhoon intensification processes still involve uncertainties, which directly affect the reliability of typhoon intensity responses under SST scenarios. Zhang et al. [42] pointed out that the choice of boundary layer parameterization schemes in current atmospheric models has a significant impact on typhoon intensification rates, with different parameterization schemes potentially causing more than 20% intensity differences. Third, static methods are used for inundation calculation, without considering the dynamic effects of building water blockage and drainage systems, and actual inundation ranges may deviate from the calculated results [43]. Fourth, it is acknowledged that SST rise and SL rise are examined as independent perturbations in this study, while combined SST-SL rise scenarios that may produce nonlinear compound effects are not considered. This reflects the classical attribution approach in process-based sensitivity assessment but represents a limitation for projecting future compound coastal hazards. Furthermore, only a single typhoon case is selected in this study, and the statistical representativeness of the results is limited.
Future research can be deepened in the following directions: (1) combined effect analysis of SST rise and SL rise joint scenarios; (2) applying the quantitative sensitivity coefficients obtained herein to adaptive coastal engineering design frameworks that account for climate deep uncertainty [44]; and (3) extending the research to an ensemble of five to 10 historical typhoon cases, with climate signals distinguished from natural variability through large-sample statistics [45].

5. Conclusions

Based on the WRF-SWAN-ROMS coupled model, Typhoon Doksuri (2023) is taken as the research object in this study, and the influence of sea surface temperature rise and sea level rise on typhoon waves, storm surges, and coastal inundation is systematically analyzed. The main conclusions are drawn as follows:
(1) SST rise is associated with nonlinear enhancement in typhoon intensity through enhanced air–sea heat fluxes (+16.52% at +3.5 °C), thereby driving overall typhoon wave height elevation (+25.0% mean) and non-monotonic storm surge response (+33.4% at +3.5 °C). The sensitivity of extreme significant wave height and extreme storm surge to warming is 2.75 times and 13.2 times that of mean values, respectively, indicating that extreme events may warrant prioritized consideration in future climate adaptation planning.
(2) SL rise has relatively minor effects on open sea areas but notably alters nearshore dynamic processes. Most coastal wave heights and surges increase due to weakened bottom friction, while individual semi-enclosed bays show decreased surges due to weakened topographic constraint effects. The Taiwan Strait channeling effect undergoes nonlinear transformation under SL rise scenarios, further amplifying disaster risks on the right side of the track. The inundation area increase reaches 46.59% under the 0.8 m SL rise scenario, with total peak water level increasing approximately linearly.
(3) SST rise and SL rise affect typhoon disasters through essentially different mechanisms. SST indirectly drives through altered typhoon intensity, and its effect has time-varying characteristics. SL rise directly constrains nearshore boundary conditions through static water depth elevation, mainly changing magnitudes rather than temporal structures. The two-way coupled architecture of the COAWST system enables consistent representation of both driving paths within a unified framework.
(4) The contrasting mechanisms identified in this study—SST effects operating through typhoon intensification versus SL rise effects operating through nearshore depth modification—highlight that coastal hazard assessments should account for driver-specific physical pathways rather than treating climate change impacts as uniform additive perturbations. The sensitivity coefficients and diagnostic evidence provided here offer a process-based reference for similar semi-enclosed coastal regions while acknowledging that the single-case, idealized experiment design limits statistical generalizability.

Author Contributions

Conceptualization, Q.S. and Z.W.; data curation, Q.S., K.Y. and K.G.; formal analysis, Q.S., K.Y. and K.G.; funding acquisition, Z.W.; investigation, Q.S.; methodology, Q.S.; project administration, Z.W.; resources, Z.W.; software, Q.S.; supervision, Z.W.; validation, Q.S.; visualization, Q.S., K.Y. and K.G.; writing—original draft, Q.S.; writing—review and editing, Q.S. and Z.W. All authors have read and agreed to the published version of the manuscript.

Funding

This research was funded by the National Natural Science Foundation of China (52571278, 52479063). Partial support was also provided by the Open Research Fund of the Key Laboratory of Water Security Guarantee in the Guangdong–Hong Kong–Marco Greater Bay Area of the Ministry of Water Resources. (WSGBA-KJ2023012), the Science and Technology Innovation Program of Hunan Province (2023RC3136), the Educational Science Foundation of Hunan Province (23A0265) and the Graduate Scientific Research and Innovation Project of Changsha University of Science and Technology (CLKYCX24032).

Data Availability Statement

The datasets supporting the conclusions of this article are available from the corresponding author upon reasonable request.

Conflicts of Interest

The authors declare no conflicts of interest.

Appendix A

Figure A1. Track errors at 6-hourly intervals.
Jmse 14 01137 g0a1
Figure A2. Minimum distance from typhoon center to T1 and maximum wind speed at T1 under different SL rise scenarios.
Jmse 14 01137 g0a2
Figure A3. Bottom friction dissipation at characteristic points under different SL rise scenarios. (a) T1; (b) T2; (c) T3; (d) T4.
Jmse 14 01137 g0a3
Figure A4. Bottom friction stress at characteristic points under different SL rise scenarios. (a) T1; (b) T2; (c) T3; (d) T4.
Jmse 14 01137 g0a4

References

  1. Kirezci, E.; Young, I.R.; Ranasinghe, R.; Muis, S.; Nicholls, R.J.; Lincke, D.; Hinkel, J. Projections of global-scale extreme sea levels and resulting episodic coastal flooding over the 21st Century. Sci. Rep. 2020, 10, 11629. [Google Scholar] [CrossRef] [PubMed]
  2. Sheng, Y.P.; Paramygin, V.A.; Yang, K.; Rivera-Nieves, A.A. A sensitivity study of rising compound coastal inundation over large flood plains in a changing climate. Sci. Rep. 2022, 12, 3403. [Google Scholar] [CrossRef] [PubMed]
  3. Tian, S.; Zhang, K.; Chi, Y.; Lian, Y. Assessing storm surge compound disasters risk: A case study of the coastal area of Qingdao. Ocean Coast. Manag. 2025, 262, 107593. [Google Scholar] [CrossRef]
  4. Needham, H.F.; Keim, B.D.; Sathiaraj, D. A review of tropical cyclone-generated storm surges: Global data sources, observations, and impacts. Rev. Geophys. 2015, 53, 545–591. [Google Scholar] [CrossRef]
  5. Wu, Z.; Gao, K.; Jiang, C.; Pan, W.; Li, B.; Li, C.; Dong, Z.; Deng, B.; Chen, J. Dynamic Response of a monopile offshore wind turbine under aero-hydrodynamic interaction. Ocean Eng. 2026, 343, 123375. [Google Scholar] [CrossRef]
  6. Chen, Y.; Wei, Y.; Zheng, Y.; Wu, X.; Liu, Q.; Li, R.; Sun, L.; Zhao, B.; Yin, S.; Liu, H.; et al. Influence of ocean-atmosphere interactions on typhoon track and intensity: A case study for typhoon “Hato” (1713). Nat. Hazards 2025, 121, 7609–7624. [Google Scholar] [CrossRef]
  7. Lai, S.K.; Chan, P.W.; He, Y.; Chen, S.S.; Kerns, B.W.; Su, H.; Mo, H. Real-time operational trial of atmosphere–ocean–wave coupled model for selected tropical cyclones in 2024. Atmosphere 2024, 15, 1509. [Google Scholar] [CrossRef]
  8. Emanuel, K.A. The maximum intensity of hurricanes. J. Atmos. Sci. 1988, 45, 1143–1155. [Google Scholar] [CrossRef]
  9. Lin, I.I.; Chen, C.H.; Pun, I.F.; Liu, W.T.; Wu, C.C. Warm ocean anomaly, air sea fluxes, and the rapid intensification of tropical cyclone Nargis (2008). Geophys. Res. Lett. 2009, 36, L03612. [Google Scholar] [CrossRef]
  10. Mei, W.; Xie, S.P. Intensification of landfalling typhoons over the northwest Pacific since the late 1970s. Nat. Geosci. 2016, 9, 753–757. [Google Scholar] [CrossRef]
  11. Chen, C.; Lin, Z.; Beardsley, R.C.; Shyka, T.; Zhang, Y.; Xu, Q.; Qi, J.; Lin, H.; Xu, D. Impacts of sea level rise on future storm-induced coastal inundations over Massachusetts coast. Nat. Hazards 2021, 106, 375–399. [Google Scholar] [CrossRef]
  12. Yin, K.; Xu, S.; Huang, W.; Xie, Y. Effects of sea level rise and typhoon intensity on storm surge and waves in Pearl River Estuary. Ocean Eng. 2017, 136, 80–93. [Google Scholar] [CrossRef]
  13. Xu, K.; Zhuang, Y.; Bin, L.; Wang, C.; Tian, F. Impact assessment of climate change on compound flooding in a coastal city. J. Hydrol. 2023, 617, 129166. [Google Scholar] [CrossRef]
  14. Ma, Y.; Wu, Y.; Shao, Z.; Cao, T.; Liang, B. Impacts of sea level rise and typhoon intensity on storm surges and waves around the coastal area of Qingdao. Ocean Eng. 2022, 249, 110953. [Google Scholar] [CrossRef]
  15. Arns, A.; Wahl, T.; Dangendorf, S.; Jensen, J. The impact of sea level rise on storm surge water levels in the northern part of the German Bight. Coast. Eng. 2015, 96, 118–131. [Google Scholar] [CrossRef]
  16. Zhao, C.; Ge, J.; Ding, P. Impact of sea level rise on storm surges around the Changjiang Estuary. J. Coast. Res. 2014, 68, 27–34. [Google Scholar] [CrossRef]
  17. Marsooli, R.; Lin, N.; Emanuel, K.; Feng, K. Climate change exacerbates hurricane flood hazards along US Atlantic and Gulf Coasts in spatially varying patterns. Nat. Commun. 2019, 10, 3785. [Google Scholar] [CrossRef] [PubMed]
  18. Lavender, S.L.; Hoeke, R.K.; Abbs, D.J. The influence of sea surface temperature on the intensity and associated storm surge of tropical cyclone Yasi: A sensitivity study. Nat. Hazards Earth Syst. Sci. 2018, 18, 795–805. [Google Scholar] [CrossRef]
  19. Wang, H.; Gao, L.; Zhu, L.; Zhang, L.; Wu, J. Changes in the typhoon intensity under a warming climate: A numerical study of typhoon Mangkhut. J. Clim. 2024, 37, 3703–3722. [Google Scholar] [CrossRef]
  20. Salarieh, B.; Ugwu, I.A.; Salman, A.M. Impact of changes in sea surface temperature due to climate change on hurricane wind and storm surge hazards across US Atlantic and Gulf coast regions. SN Appl. Sci. 2023, 5, 205. [Google Scholar] [CrossRef]
  21. Wu, Z.; Zou, Z.; Chen, J.; Luo, H.; Deng, B.; Jiang, C.; Lv, Z.; Zhang, H. Dynamic and thermodynamic characteristics of ocean response to super typhoon Mangkhut in the South China Sea. Front. Mar. Sci. 2025, 12, 1586377. [Google Scholar] [CrossRef]
  22. Zhang, K.; Li, Y.; Liu, H.; Xu, H.; Shen, J. Comparison of three methods for estimating the sea level rise effect on storm surge flooding. Clim. Change 2013, 118, 487–500. [Google Scholar]
  23. Jisan, M.A.; Bao, S.; Pietrafesa, L.J. Ensemble projection of the sea level rise impact on storm surge and inundation at the coast of Bangladesh. Nat. Hazards Earth Syst. Sci. 2018, 18, 351–364. [Google Scholar] [CrossRef]
  24. Yang, J.; Lin, C.Y.; Liu, H.; Li, L.; Wu, T.R.; Wang, P.; Li, B.; Liu, P.L.F. Effects of island topography on storm surge in Taiwan strait during Typhoon Maria. J. Waterw. Port Coast. Ocean Eng. 2021, 147, 04020057. [Google Scholar] [CrossRef]
  25. Wu, Z.; Zhang, S.; Wei, W.; Gao, K.; Chen, J.; Jiang, C.; Deng, B. Potential impacts of typhoon tracks on sorm surge and typhoon wave in the Beibu Gulf: A case study of Super Typhoon Rammasun. Front. Mar. Sci. 2025, 12, 1673292. [Google Scholar] [CrossRef]
  26. Lei, Z.; Jing, X.; Xin, L.; Deqiang, Z.; Zhen, G.; He, F.; Yaqin, J. Wind, Wave, and Current Variations in the Taiwan Strait Induced by Typhoon Doksuri in 2023. J. Appl. Meteorol. Sci. 2025, 36, 665–680. [Google Scholar]
  27. Xiao, Z.; Lu, Y. High-Resolution Modeling of Storm Surge Response to Typhoon Doksuri (2023) in Fujian, China: Impacts of Wind Field Fusion, Parameter Sensitivity, and Sea-Level Rise. J. Mar. Sci. Eng. 2025, 14, 5. [Google Scholar] [CrossRef]
  28. Warner, J.C.; Armstrong, B.; He, R.; Zambon, J.B. Development of a coupled ocean–atmosphere–wave–sediment transport (COAWST) modeling system. Ocean Modell. 2010, 35, 230–244. [Google Scholar] [CrossRef]
  29. Moghimi, S.; Thomson, J.; Özkan-Haller, T.; Umlauf, L.; Zippel, S. On the modeling of wave-enhanced turbulence nearshore. Ocean Modell. 2016, 103, 118–132. [Google Scholar] [CrossRef]
  30. Yang, K.; Wu, Z.; Jiang, C.; Deng, B.; Chen, J. Hybrid deep learning for large-scale spatiotemporal forecasting of significant wave height. Appl. Ocean Res. 2026, 171, 105094. [Google Scholar] [CrossRef]
  31. Kumar, N.; Voulgaris, G.; Warner, J.C.; Olabarrieta, M. Implementation of the vortex force formalism in the coupled ocean-atmosphere-wave-sediment transport (COAWST) modeling system for inner shelf and surf zone applications. Ocean Modell. 2012, 47, 65–95. [Google Scholar] [CrossRef]
  32. Masson-Delmotte, V.; Zhai, P.; Pirani, A.; Connors, S.L.; Péan, C.; Berger, S.; Caud, N.; Chen, Y.; Goldfarb, L.; Gomis, M.I.; et al. Climate Change 2021: The Physical Science Basis. Contribution of Working Group I to the Sixth Assessment Report of the Intergovernmental Panel on Climate Change; Cambridge University Press: Cambridge, UK, 2021. [Google Scholar]
  33. Farr, T.G.; Rosen, P.A.; Caro, E.; Crippen, R.; Duren, R.; Hensley, S.; Kobrick, M.; Paller, M.; Rodriguez, E.; Roth, L.; et al. The Shuttle Radar Topography Mission. Rev. Geophys. 2007, 45, RG2004. [Google Scholar] [CrossRef]
  34. Kaplan, J.; DeMaria, M. Large-scale characteristics of rapidly intensifying tropical cyclones in the North Atlantic basin. Weather Forecast. 2003, 18, 1093–1108. [Google Scholar] [CrossRef]
  35. Wahl, T.; Jain, S.; Bender, J.; Meyers, S.D.; Luther, M.E. Increasing Risk of Compound Flooding from Storm Surge and Rainfall for Major US Cities. Nat. Clim. Change 2015, 5, 1093–1097. [Google Scholar] [CrossRef]
  36. Dietrich, J.C.; Tanaka, S.; Westerink, J.J.; Dawson, C.N.; Luettich, R.A., Jr.; Zijlema, M.; Holthuijsen, L.H.; Smith, J.M.; Westerink, L.G.; Westerink, H.J. Performance of the unstructured-mesh, SWAN+ADCIRC model in computing hurricane waves and surge. J. Sci. Comput. 2012, 52, 468–497. [Google Scholar]
  37. Arns, A.; Dangendorf, S.; Jensen, J.; Talke, S.; Bender, J.; Pattiaratchi, C. Sea-level rise induced amplification of coastal protection design heights. Sci. Rep. 2017, 7, 40171. [Google Scholar] [CrossRef] [PubMed]
  38. Idier, D.; Bertin, X.; Thompson, P.; Pickering, M.D. Interactions between mean sea level, tide, surge, waves and flooding: Mechanisms and contributions to sea level variations at the coast. Surv. Geophys. 2019, 40, 1603–1630. [Google Scholar] [CrossRef]
  39. Battjes, J.A.; Janssen, J.P.F.M. Energy loss and set-up due to breaking of random waves. In Coastal Engineering 1978; ASCE: New York, NY, USA, 1978; pp. 569–587. [Google Scholar]
  40. Resio, D.T.; Westerink, J.J. Modeling the physics of storm surges. Phys. Today 2008, 61, 33–38. [Google Scholar] [CrossRef]
  41. Mousavi, M.E.; Irish, J.L.; Frey, A.E.; Olivera, F.; Edge, B.L. Global warming and hurricanes: The potential impact of hurricane intensification and sea level rise on coastal flooding. Clim. Change 2011, 104, 575–597. [Google Scholar]
  42. Zhang, Z.; Zhang, W.; Zhao, W.; Zhao, C. Radial distributions of sea surface temperature and their impacts on the rapid intensification of Typhoon Hato (2017). Atmosphere 2020, 11, 128. [Google Scholar] [CrossRef]
  43. Vousdoukas, M.I.; Voukouvalas, E.; Mentaschi, L.; Dottori, F.; Giardino, A.; Bouziotas, D.; Bianchi, A.; Salamon, P.; Feyen, L. Developments in large-scale coastal flood hazard mapping. Nat. Hazards Earth Syst. Sci. 2016, 16, 1841–1853. [Google Scholar] [CrossRef]
  44. Lawrence, J.; Haasnoot, M. What it took to catalyse uptake of dynamic adaptive pathways planning to address climate change uncertainty. Environ. Sci. Policy 2017, 68, 47–57. [Google Scholar] [CrossRef]
  45. Knutson, T.; Camargo, S.J.; Chan, J.C.L.; Emanuel, K.; Ho, C.-H.; Kossin, J.; Mohapatra, M.; Satoh, M.; Sugi, M.; Walsh, K.; et al. Tropical cyclones and climate change assessment: Part II. Projected response to anthropogenic warming. Bull. Am. Meteorol. Soc. 2020, 101, E303–E322. [Google Scholar] [CrossRef]
Figure 1. Research area, model grid, track and intensity evolution of Typhoon Doksuri and spatial locations of characteristic points T1–T4.
Jmse 14 01137 g001
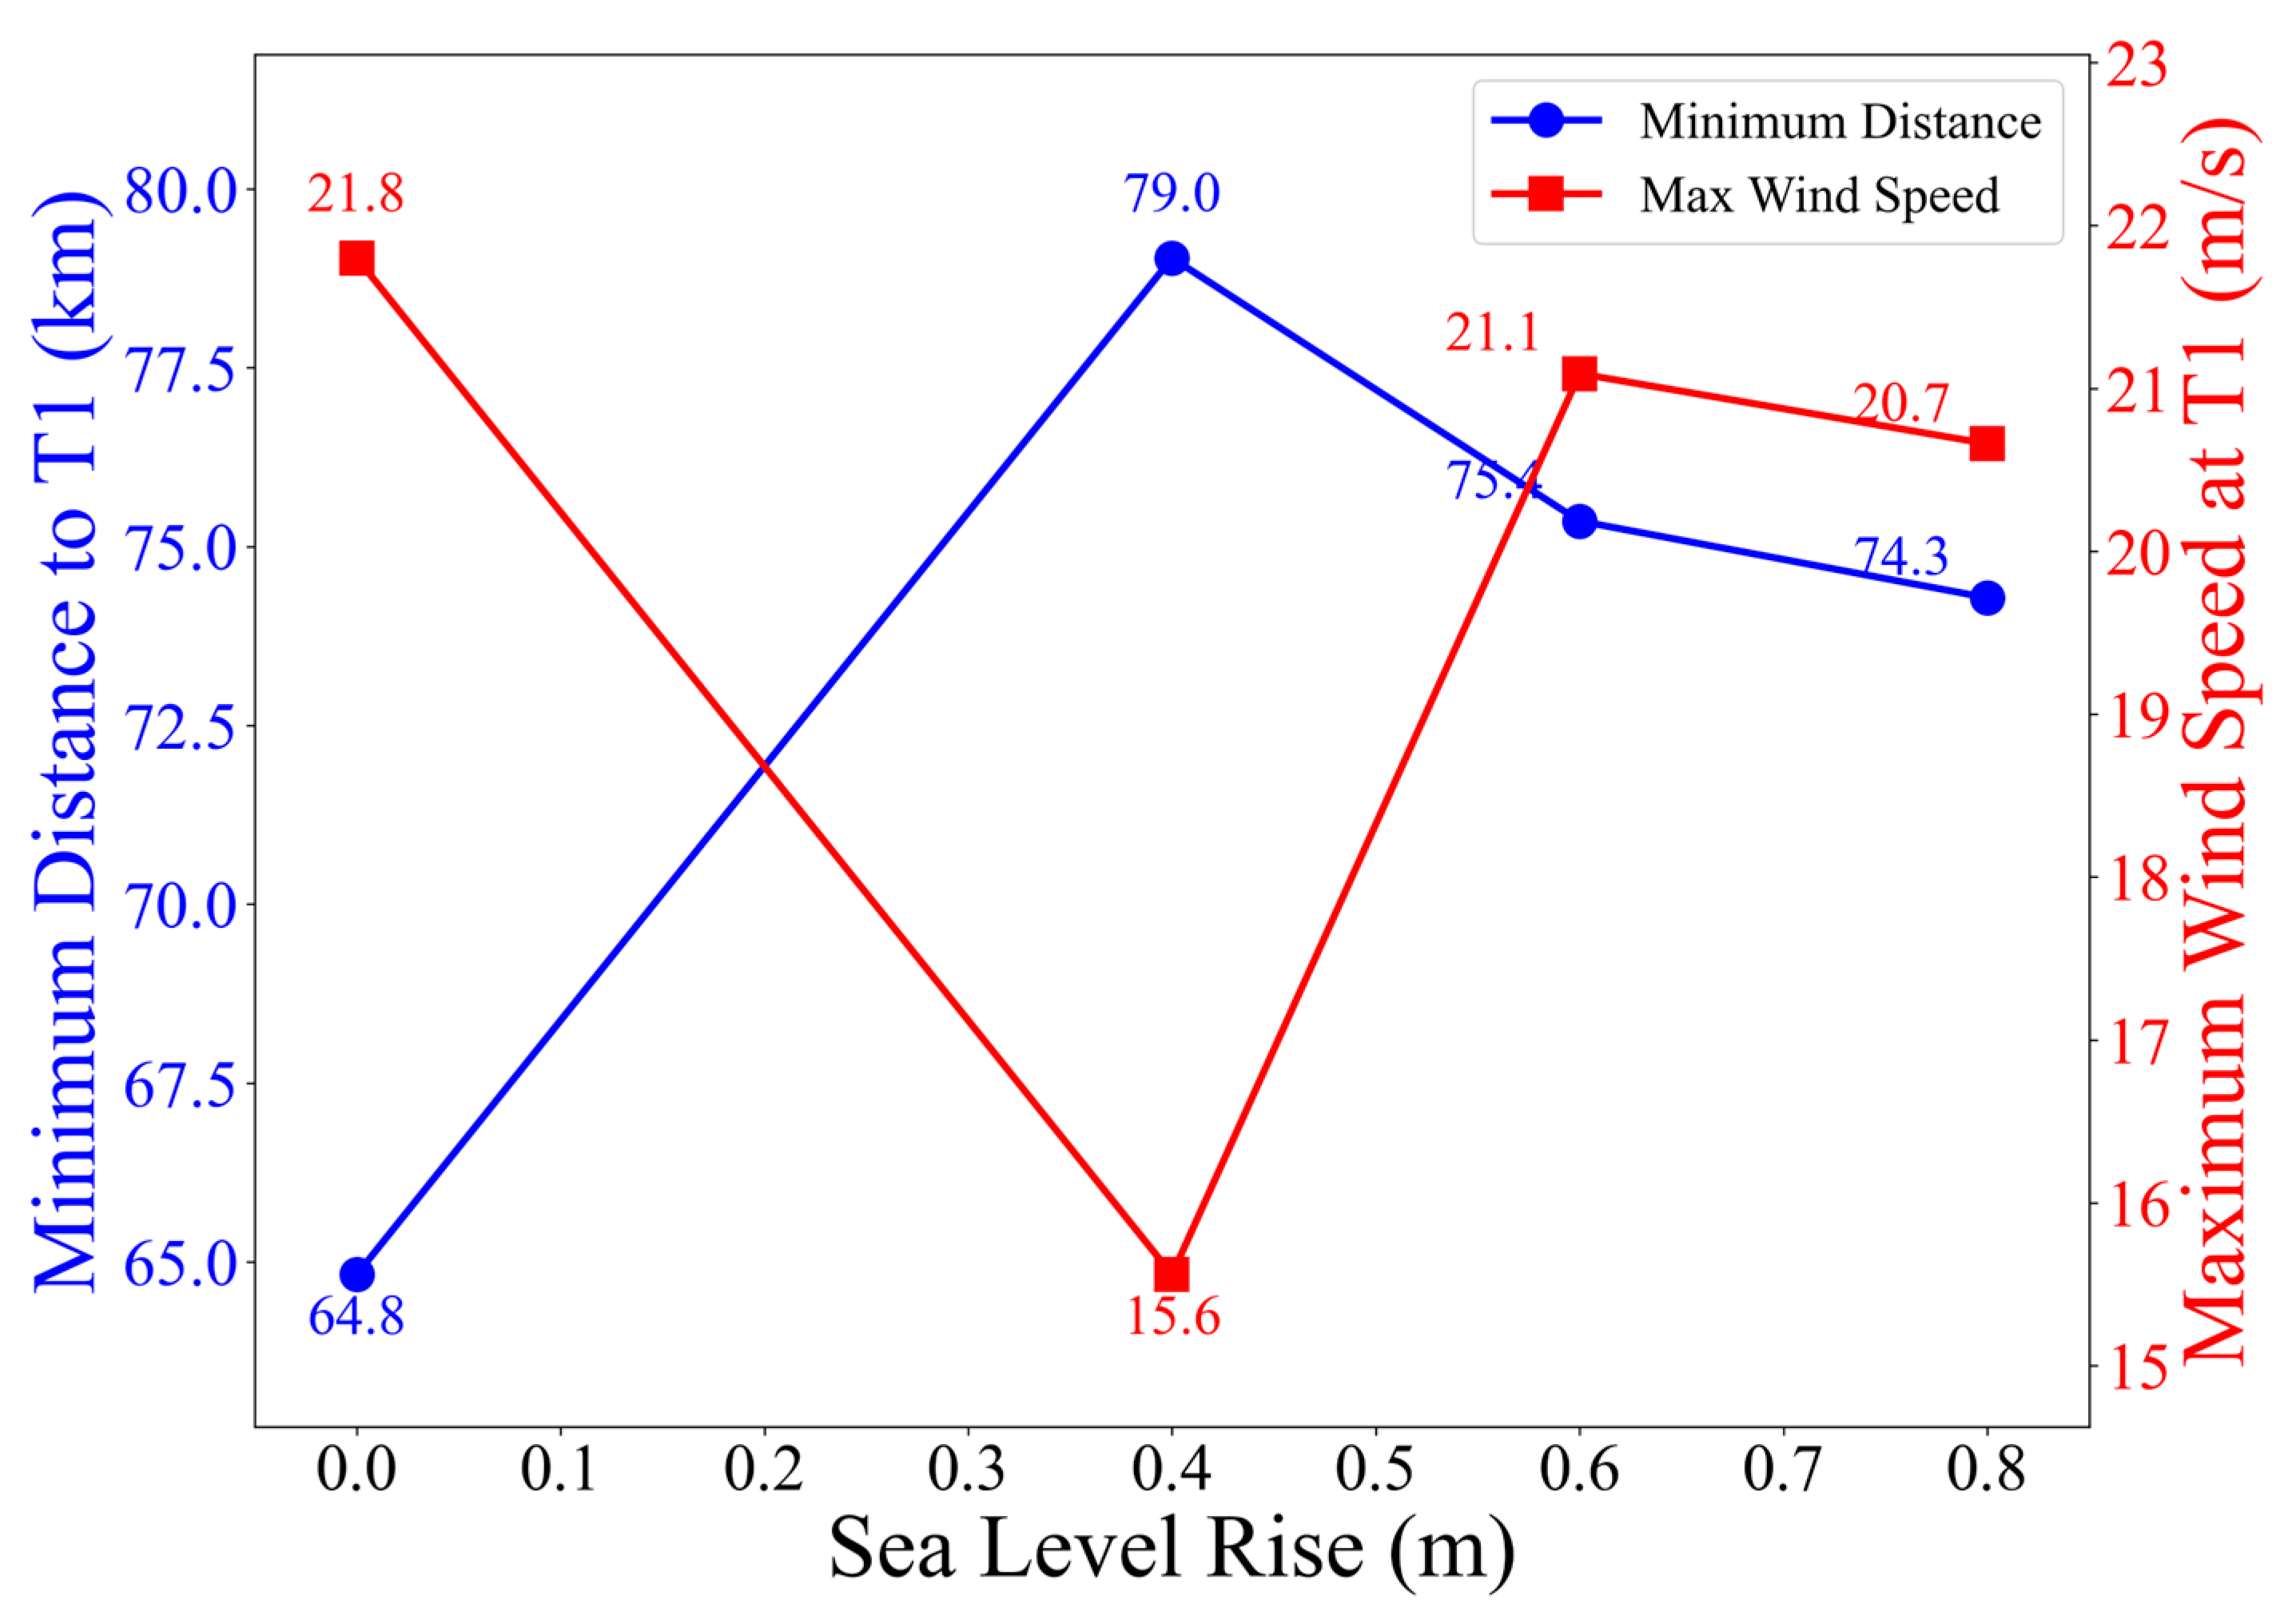
Figure 2. Validation station distribution. (Blue dots denote meteorological and tide gauge stations. The red solid line indicates the simulated typhoon track, and the red dashed line represents the Jason-3 altimeter track).
Jmse 14 01137 g002
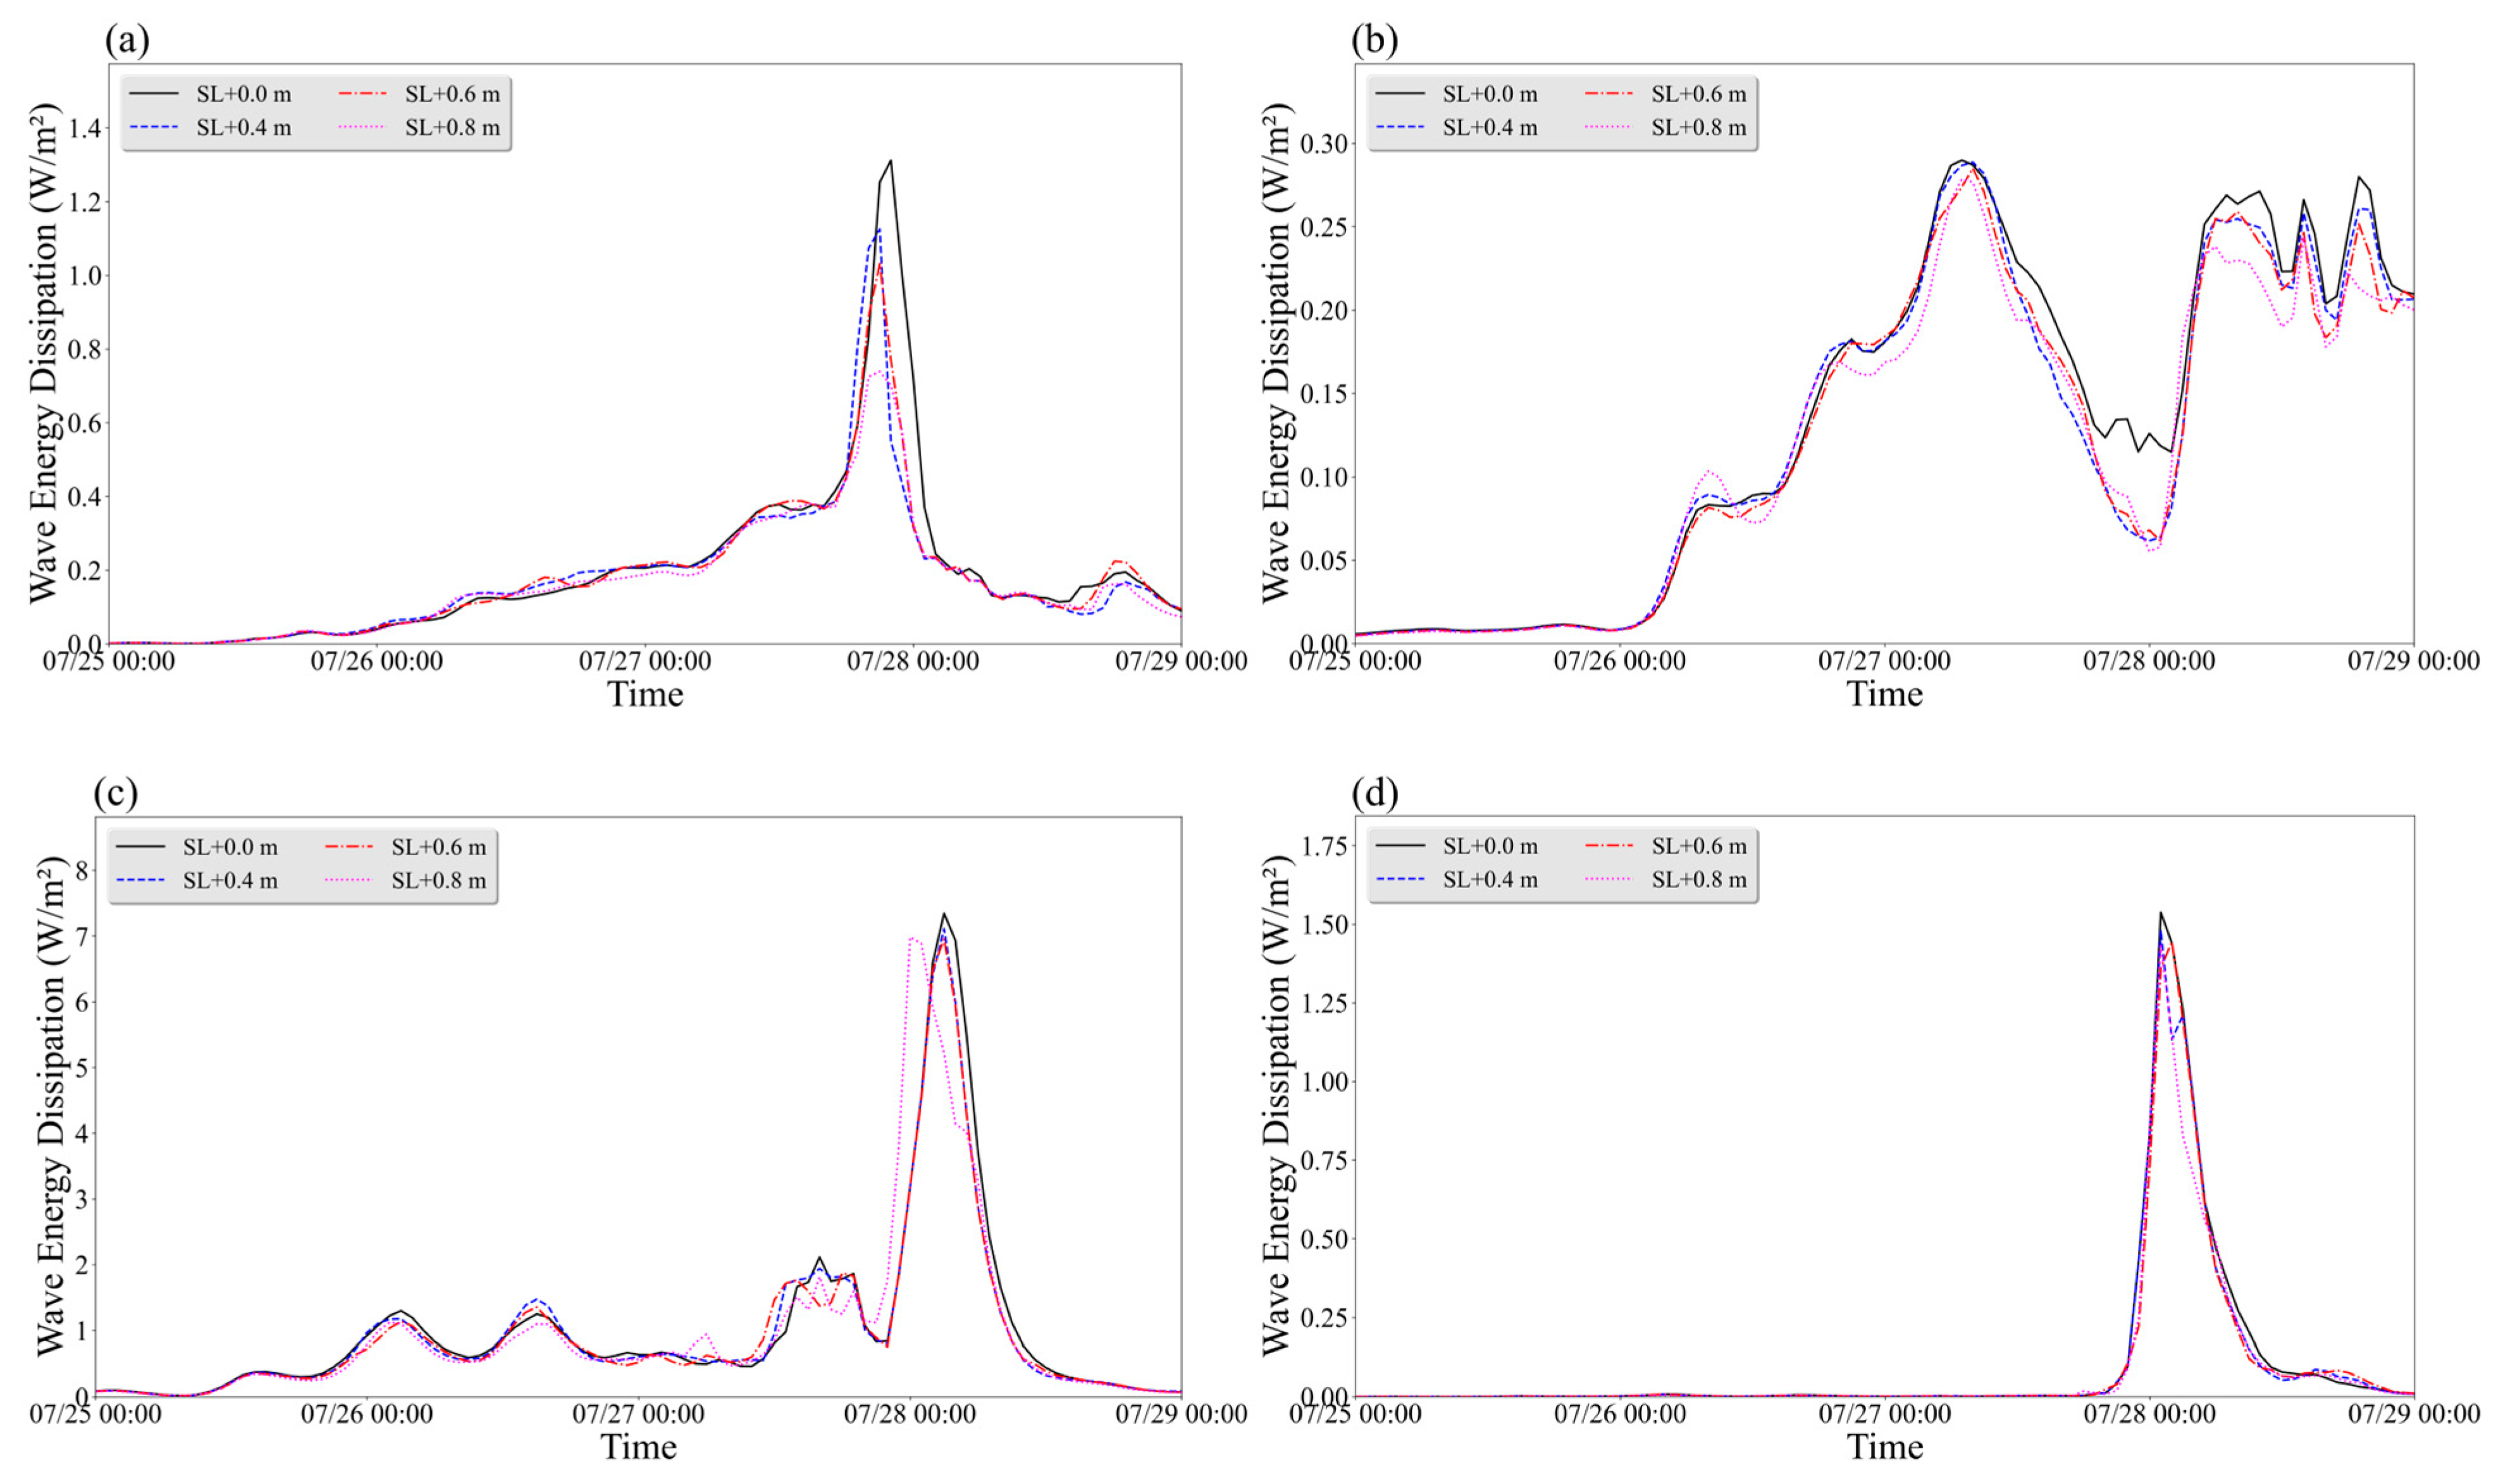
Figure 3. Simulated (red) and CMA best-track (black) typhoon tracks.
Jmse 14 01137 g003
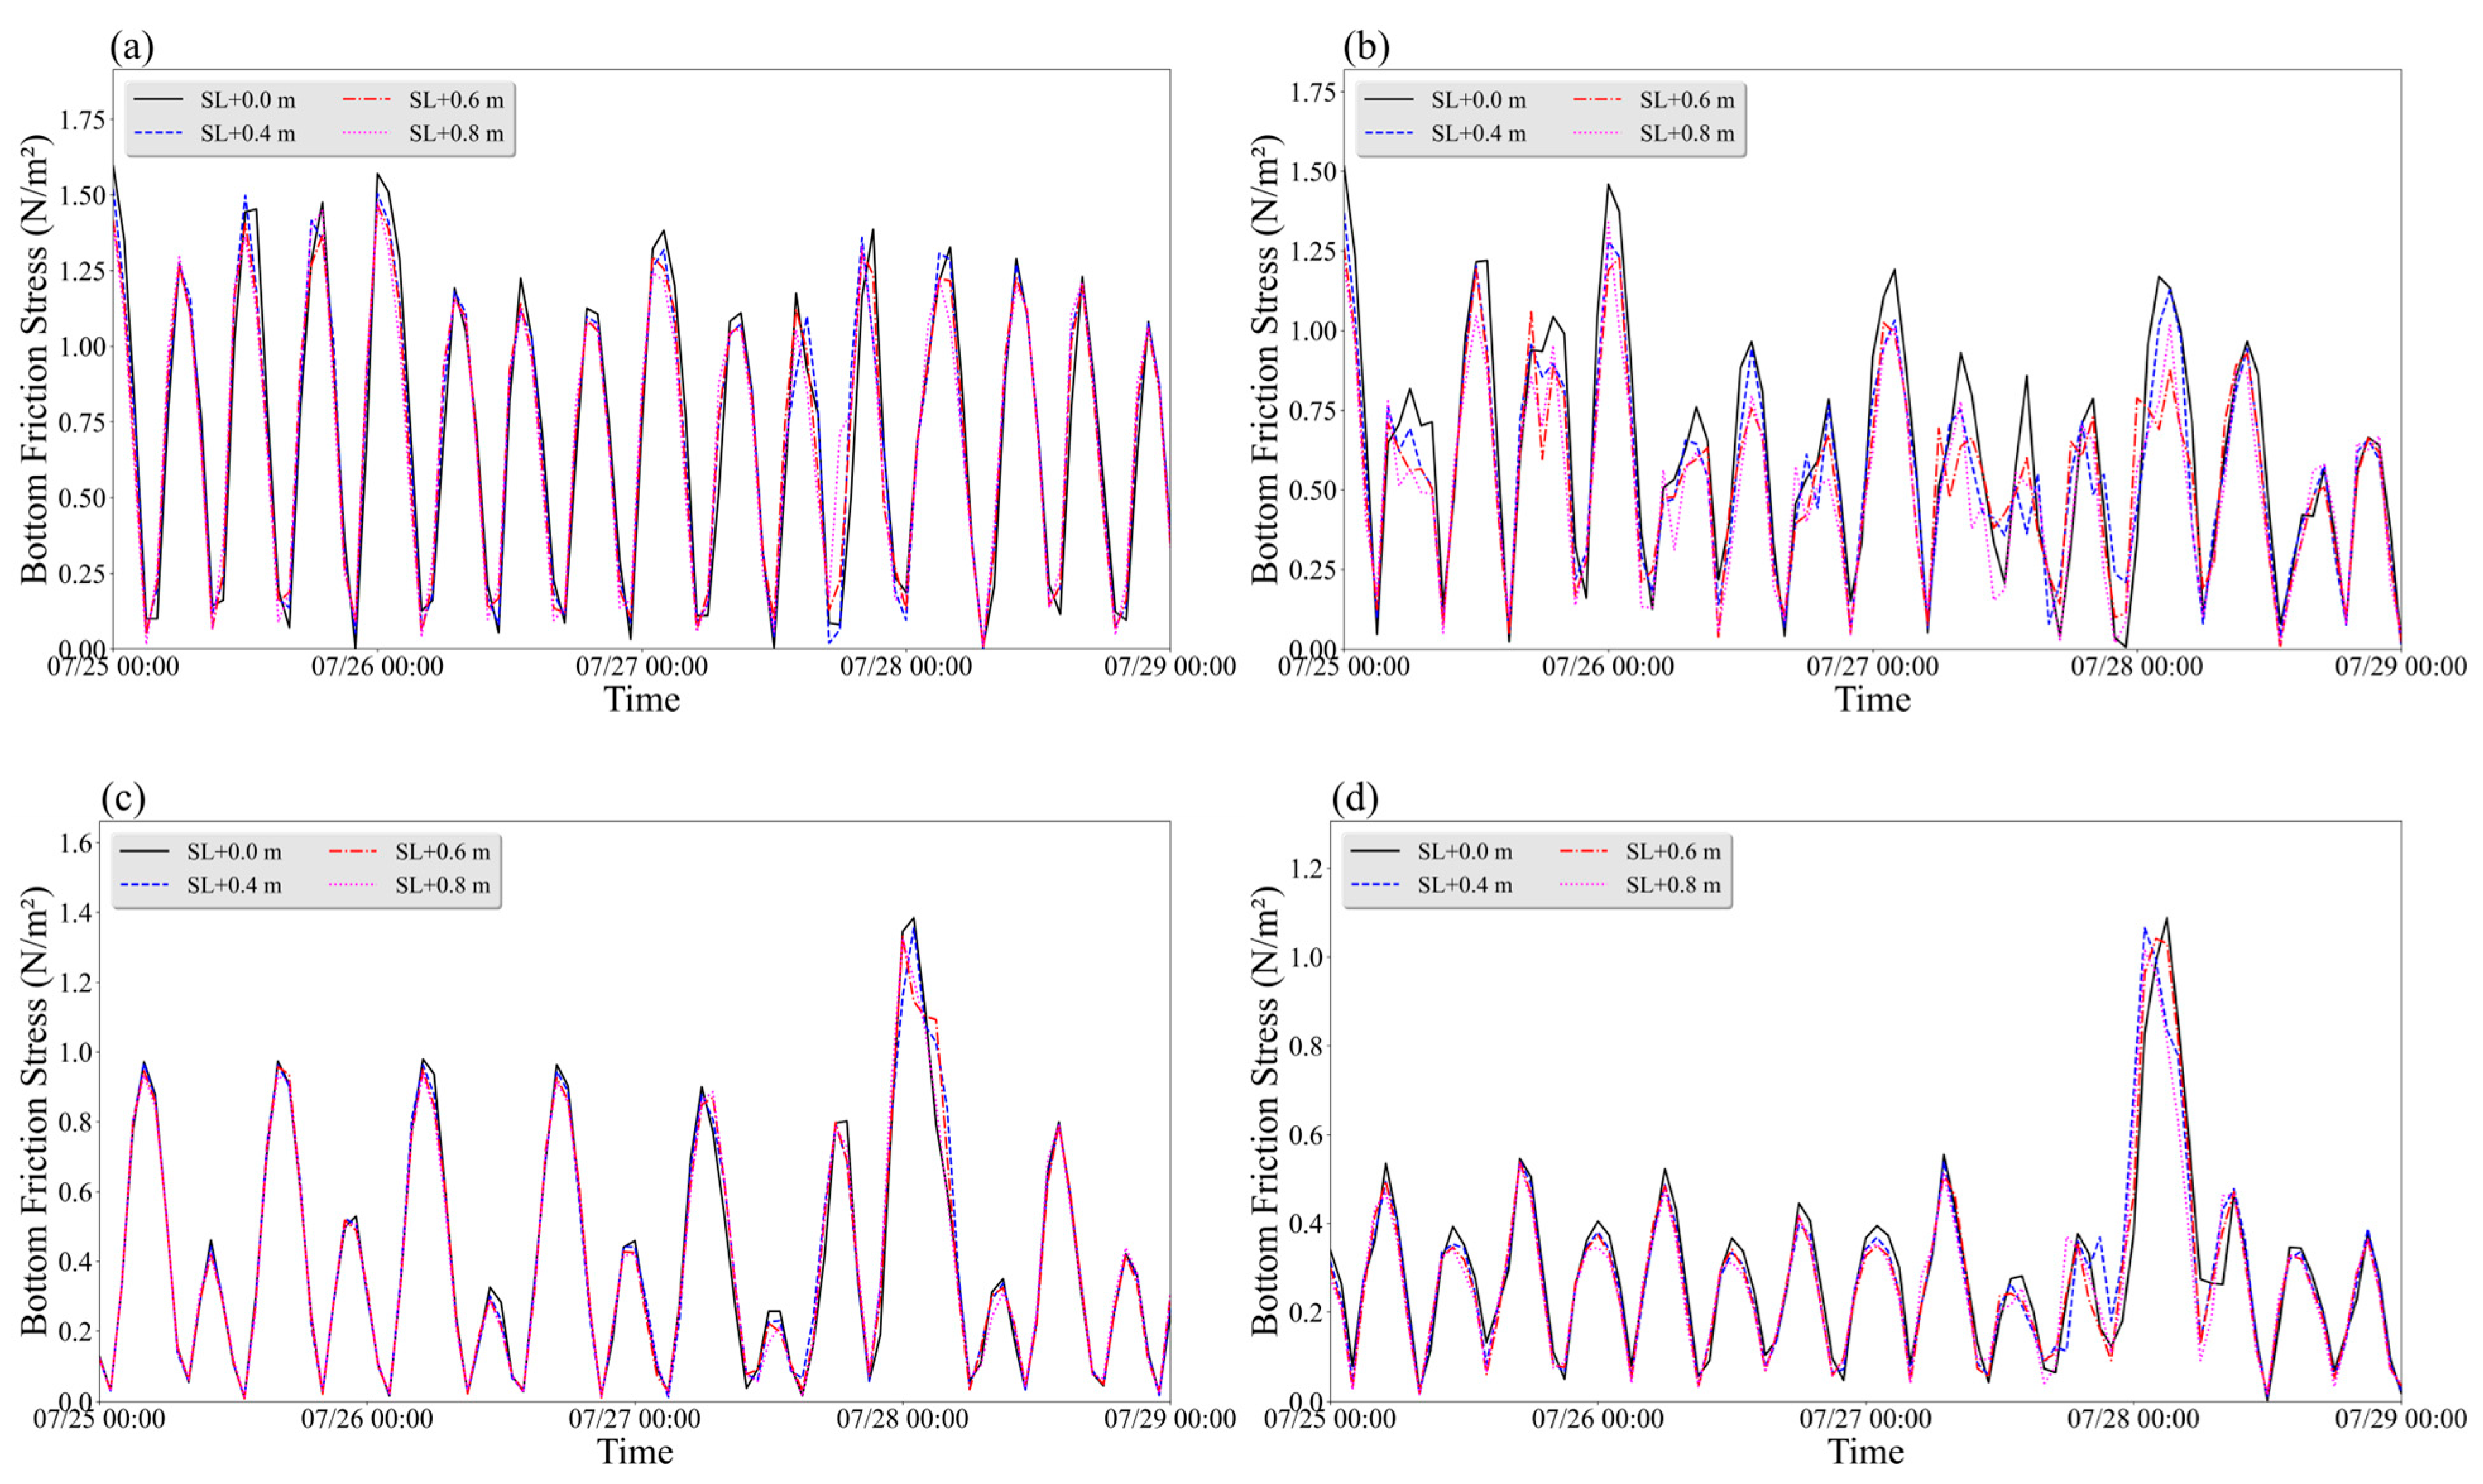
Figure 4. Maximum wind speed validation against CMA best-track data.
Jmse 14 01137 g004
Figure 5. Minimum sea-level pressure validation against CMA best-track data.
Jmse 14 01137 g005
Figure 6. Wind speed validation at Beishuang station.
Jmse 14 01137 g006
Figure 7. Sea-level pressure validation at Beishuang station.
Jmse 14 01137 g007
Figure 8. Astronomical tide validation at Xiamen (left) and Quanzhou (right) stations.
Jmse 14 01137 g008
Figure 9. Total water level validation at Xiamen and Dongshan stations.
Jmse 14 01137 g009
Figure 10. Significant wave height validation.
Jmse 14 01137 g010
Figure 11. Typhoon Doksuri track changes (a) and translation speed comparison (b) the black thin line marks the landfall segment) under SST rise scenarios.
Jmse 14 01137 g011
Figure 12. Evolution of typhoon intensity and structural parameters under different SST scenarios. (a) Maximum wind speed and central pressure; (b) radius of maximum wind (RMW).
Jmse 14 01137 g012
Figure 13. Spatial distribution of wind field and pressure field under different SST rise scenarios. (a) Baseline; (b) SST+0.8 °C; (c) SST+2.0 °C; (d) SST+3.5 °C.
Jmse 14 01137 g013
Figure 14. Azimuthally averaged equivalent potential temperature radial distribution of Typhoon Doksuri at the same moment under different SST rise scenarios. (a) SST+0 °C; (b) SST+0.8 °C; (c) SST+2.0 °C; (d) SST+3.5 °C.
Jmse 14 01137 g014
Figure 15. Significant wave height changes at characteristic points under different SST rise scenarios. (a) T1; (b) T2; (c) T3; (d) T4.
Jmse 14 01137 g015
Figure 16. Spatial distribution of wave height extremes under different SST rise scenarios. (a) Baseline; (b) SST+0.8 °C; (c) SST+2.0 °C; (d) SST+3.5 °C.
Jmse 14 01137 g016
Figure 17. Spatial distribution of significant wave height extreme increments under different SST rise scenarios. (a) SST+0.8 °C; (b) SST+2.0 °C; (c) SST+3.5 °C.
Jmse 14 01137 g017
Figure 18. Statistical comparison of wave heights under different SST rise scenarios. (a) Mean wave height (blue) and 95th percentile significant wave height (red) as a function of SST increase, with linear trend lines and sensitivity coefficients indicated; (b) Relative change in mean wave height (blue) and 95th percentile significant wave height (red) under +0.8°C, +2.0°C, and +3.5°C scenarios compared to baseline.
Jmse 14 01137 g018
Figure 19. Storm surge changes at characteristic points under different SST rise scenarios. (a) T1; (b) T2; (c) T3; (d) T4.
Jmse 14 01137 g019
Figure 20. Spatial distribution of storm surge extremes under different SST rise scenarios. (a) Baseline; (b) SST+0.8 °C; (c) SST+2.0 °C; (d) SST+3.5 °C.
Jmse 14 01137 g020
Figure 21. Spatial distribution of storm surge extreme increments under different SST rise scenarios. (a) SST+0.8 °C; (b) SST+2.0 °C; (c) SST+3.5 °C.
Jmse 14 01137 g021
Figure 22. Statistical comparison of storm surges under different SST rise scenarios. (a) Mean storm surge (blue line with circles) and 95th percentile storm surge (red line with circles) as a function of SST increase; dashed lines indicate linear regression trends, with slopes of 0.0013 m/°C for the mean and 0.0172 m/°C for the 95th percentile. (b) Relative percentage change in mean storm surge (blue) and 95th percentile storm surge (red) under SST rise scenarios of +0.8 °C, +2.0 °C, and +3.5 °C; the mean storm surge exhibits a decrease of 21.9% at +0.8 °C but increases at higher SST rise scenarios.
Jmse 14 01137 g022
Figure 23. Wave height changes at characteristic points under different SL rise scenarios. (a) T1; (b) T2; (c) T3; (d) T4.
Jmse 14 01137 g023
Figure 24. Spatial distribution of wave height extremes under different SL rise scenarios. (a) Baseline; (b) SL+0.4 m; (c) SL+0.6 m; (d) SL+0.8 m.
Jmse 14 01137 g024
Figure 25. Spatial distribution of significant wave height extreme increments under different SL rise scenarios. (a) SL+0.4 m; (b) SL+0.6 m; (c) SL+0.8 m.
Jmse 14 01137 g025
Figure 26. Change in time-averaged wave energy dissipation (relative to baseline).
Jmse 14 01137 g026
Figure 27. Storm surge changes at characteristic points under different SL rise scenarios. (a) T1; (b) T2; (c) T3; (d) T4.
Jmse 14 01137 g027aJmse 14 01137 g027b
Figure 28. Spatial distribution of storm surge extremes under different SL rise scenarios. (a) Baseline; (b) SL+0.4 m; (c) SL+0.6 m; (d) SL+0.8 m.
Jmse 14 01137 g028
Figure 29. Spatial distribution of storm surge extreme increments under different SL rise scenarios. (a) SL+0.4 m; (b) SL+0.6 m; (c) SL+0.8 m.
Jmse 14 01137 g029
Figure 30. Change in time-averaged bottom friction stress (relative to baseline).
Jmse 14 01137 g030
Figure 31. Spatial distribution of inundation in key coastal stretches under different SL rise scenarios. (ad) From top to bottom: northern, central-north, central-south, and southern stretches; (a1d4) from left to right: baseline, SL+0.4 m, SL+0.6 m, and SL+0.8 m.
Jmse 14 01137 g031aJmse 14 01137 g031b
Table 1. Characteristic points T1–T4 used in this study.
PointLongitude (°E)Latitude (°N)Location Description
T1118.0724.45Xiamen coast, central Fujian, on the left side of the typhoon track and near typhoon landfall
T2118.1724.38Quanzhou Bay mouth, southern Fujian coast, on the left side of the typhoon track
T3119.8225.43Northern Fujian, on the right side of the typhoon track
T4119.4025.45Semi-enclosed bay coast, northern Fujian, on the right side of the typhoon track
Table 2. Experiment settings.
ExperimentScenario
Case 0 (Baseline)Control
Case 1SST + 0.8 °C
Case 2SST + 2.0 °C
Case 3SST + 3.5 °C
Case 4SL + 0.4 m
Case 5SL + 0.6 m
Case 6SL + 0.8 m
Table 3. Summary of model validation results.
CategoryVariableDataset/StationRMSEBiasR2
IntensityMax wind speedCMA best track5.0 m/s−3.1 m/s0.925
IntensityMin pressureCMA best track10.8 hPa5.1 hPa0.879
Wind field10 m wind speedBeishuang1.46 m/s0.37 m/s0.736
Wind fieldPressureBeishuang0.83 hPa0.25 hPa0.938
TideWater levelXiamen0.574 m−0.057 m0.869
TideWater levelQuanzhou0.327 m−0.101 m0.850
SurgeTotal water levelXiamen0.306 m−0.225 m0.928
SurgeTotal water levelDongshan0.200 m−0.151 m0.919
Table 4. Coastal inundation statistics under different SL rise scenarios.
SL Rise (m)00.40.60.8
Inundation area (km2)281.52310.26396.19412.68
Inundation area change010.21%40.73%46.59%
Disclaimer/Publisher’s Note: The statements, opinions and data contained in all publications are solely those of the individual author(s) and contributor(s) and not of MDPI and/or the editor(s). MDPI and/or the editor(s) disclaim responsibility for any injury to people or property resulting from any ideas, methods, instructions or products referred to in the content.