Article

Managing Nutrient and Pathogen Leaching: Impacts of Slurry pH Adjustment on Sandy Soil

1
LEAF—Linking Landscape, Environment, Agriculture and Food Research Center, Associate Laboratory TERRA, Instituto Superior de Agronomia, Universidade de Lisboa, Tapada da Ajuda, 1349-017 Lisboa, Portugal
2
Centro de Química, Universidade de Trás-os-Montes e Alto Douro, Quinta de Prados, 5000-801 Vila Real, Portugal
*
Author to whom correspondence should be addressed.
Agriculture 2026, 16(9), 973; https://doi.org/10.3390/agriculture16090973
Submission received: 28 February 2026 / Revised: 15 April 2026 / Accepted: 27 April 2026 / Published: 29 April 2026
(This article belongs to the Special Issue Circular Economy in Livestock Production)

Abstract

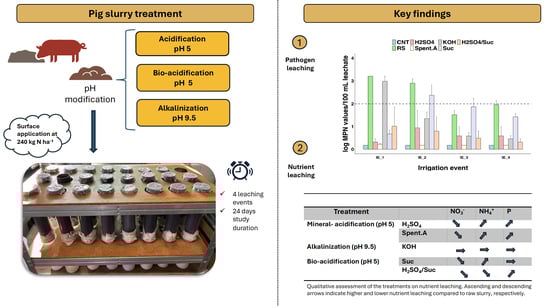
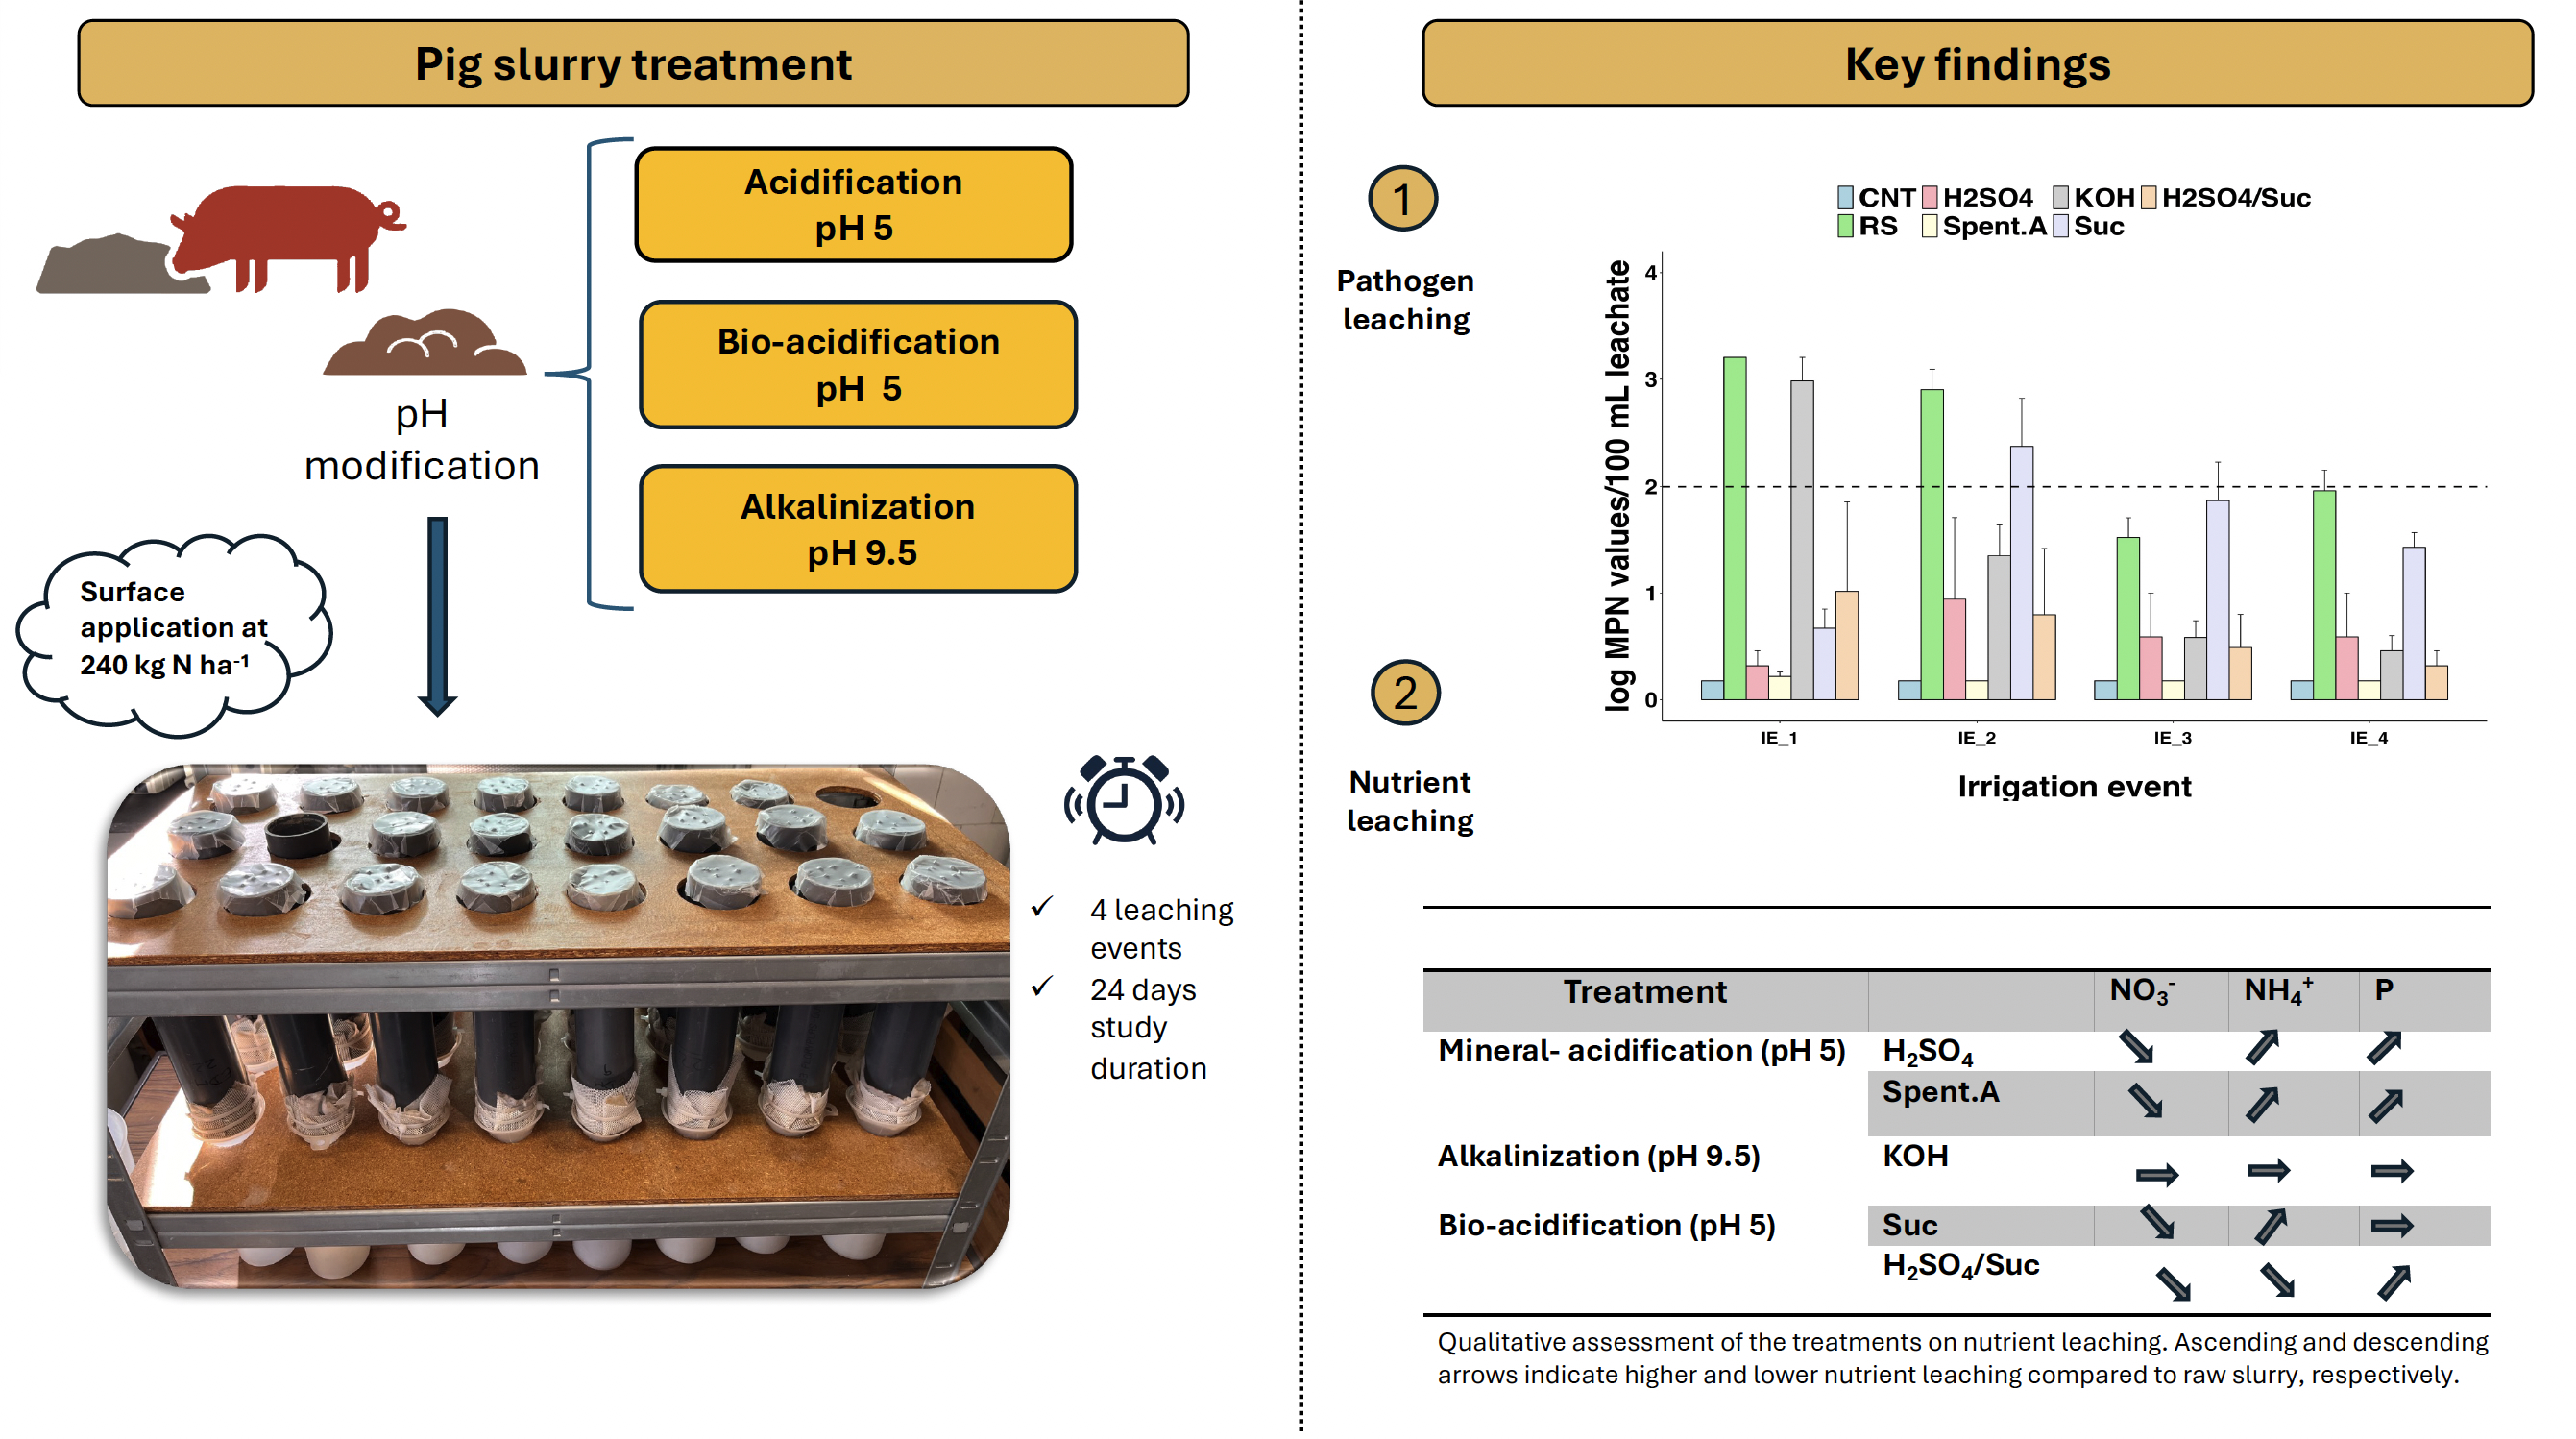
This study aimed to evaluate the leaching of nutrients and pathogens following the surface application of pH-modified slurry on sandy soil. Three slurry pH modification strategies—mineral and biological acidification (pH 5) and alkalinization (pH 9.5)—were tested using mineral acids or bases, paper-industry by-products, or combinations of additives. We hypothesized that: (i) acidification increases nitrogen (N) and phosphorus (P) leaching through nutrient solubilization, and (ii) effective sanitization reduces the risk of pathogen leaching. A 24-day column leaching experiment was conducted with slurry applied at 240 kg N ha−1 and four weekly irrigation events. Results indicated that nitrate (NO3) leaching accounted for less than 15% of the total nitrogen applied; however, acidified slurry significantly increased ammonium (NH4+) leaching by 72%. The combination of H2SO4 with sucrose reduced NH4+ and NO3 leaching, although P leaching exceeded 35% of the total P applied. Sulphur (S) concentrations in leachates ranged from 42.3 to 112.8 mg S kg−1 soil, particularly in treatments involving H2SO4 or SO42−—rich additives such as spent acid. Faecal coliform leaching declined throughout the study, with acidified slurry consistently maintaining levels below the threshold for irrigation water (<100 MPN/100 mL). Regarding nutrient leaching, pH-modified slurry may present a higher risk of N, P and S leaching compared to untreated slurry, which could also be interpreted as an increase in plant nutrient availability.

Graphical Abstract

1. Introduction

Despite the already high demand for animal products, a further increase in global meat production is projected by 2032 [1]. To achieve optimal management and logistical efficiency, livestock facilities have been concentrated [2]. An inevitable consequence of this concentration is the accumulation of animal slurry, which is produced in the European Union (EU) in billions of tons annually [3]. Although slurry is rich in nutrients and organic matter (OM), its management presents a major challenge for livestock facilities due to unclear regulations and the questionable economic viability of its agronomic valorisation [1].
Valorisation of animal slurry in agriculture is a practice aligned with the circular economy concept promoted by the EU [4]. Soil application of animal slurry can be a convenient method for farmers to fertilize horticultural crops, such as ready-to-eat (RTE) fruits and vegetables [5]. However, if poorly managed, raw slurry can be a significant source of pathogenic microorganisms (i.e., E. coli) that can lead to contamination of crops and groundwaters [6,7]. In general, the population density of slurry-borne bacteria, such as E. coli, tends to decrease after soil application due to unfavourable conditions for their survival [8]. However, Cools et al. [9] demonstrated that E. coli can survive in soil for long periods (up to 80 days) after soil application of pig slurry. Depending on a variety of factors, such as: (i) the source of the slurry (ii) physicochemical properties of the slurry (i.e., pH, dry matter content); (iii) soil temperature; (iv) oxygen availability; and (v) microbial competition, migration of slurry-borne bacteria can occur from the upper soil layers to groundwater [7,8,9]. This transfer may also pose an added risk of crop contamination, particularly if groundwater reservoirs are used for irrigation purposes [10]. Therefore, to serve as a safe bio-based fertilizer (BBF) for horticultural crops, slurry sanitization is necessary prior to soil application.
Modifying the pH of animal slurry has been shown to effectively reduce the population of enteropathogens, resulting in a sanitized BBF [11]. Three pH modification approaches were considered in previous works: mineral-acidification or bio-acidification (both to pH 5), and alkalinization (pH 9.5) [5]. Mineral-acidification to pH 5.5, commonly practiced to mitigate NH3 emissions during storage and after soil application [12], has been proven to significantly reduce E. coli numbers in contaminated pig slurry [5]. However, the application of acidified slurry in sandy soils led to a significant increase in the leaching potential of faecal coliforms [7,13]. On the contrary, when alkalinized (pH 9.5) slurry was applied on a sandy soil, a progressive decrease in the faecal coliform counts was reported throughout three irrigation events [7]. Although slurry bio-acidification with carbon-rich substrates may be a promising alternative to standard-acidification, no studies have currently evaluated the microbiological quality of leachates after soil application of bio-acidified slurry.
In addition to the effect on pathogen leaching, pH manipulation strategies can also have a direct effect on nutrient solubility, thereby altering the leaching of slurry elements [12,13]. For instance, slurry acidification to pH 5.5 or lower has been shown to increase the solubility of mineral-sorbed/precipitated phosphorus (P) species [14]. Since most farmers adjust the amount of slurry applied to match the crop’s nitrogen (N) requirements, excessive P application is commonly observed [4]. High P accumulation in soils can increase the leachability of P into water bodies, often resulting in eutrophication [15]. Furthermore, slurry acidification involves the use of concentrated acids, with sulfuric acid (H2SO4) being the most commonly used additive [12]. Although sulphur (S) is an important plant macronutrient involved in many biochemical reactions, high soil S concentrations (>50 kg S ha−1) can harm plants, soil, and water quality [16].
Agro-industrial by-products of low economic value or combinations of different additives have recently been used to modify the pH value of slurry [5,17]. High slurry sanitization efficiency was achieved with spent acid [5], a liquid by-product obtained during the pulp bleaching process in paper mills [18]. The combination of H2SO4 with carbon-rich substrates (i.e., glucose, sucrose) also showed high efficiency in reducing the pH of the slurry to 3.9 [19]. Such practices represent a great opportunity to valorise waste streams in the agricultural sector and improve the fertilizing value of animal slurry. However, the effect of alternative additives or combinations of additives on the leaching of nutrients and pathogens remains to be studied.
Therefore, the main objective of the present study was to evaluate the potential leachability of nutrients and faecal coliforms after surface application of pH-modified slurry on sandy soil. Our hypotheses were that: (i) surface application of (bio)-acidified slurry may result in increased losses of N and P in the leachate due to nutrient solubilization [13], and (ii) treatments that result in complete sanitization of the slurry will present lower risks of pathogen leaching [7].

2. Materials and Methods

2.1. Slurry Sampling and Treatments Considered

The pig slurry was collected from a commercial pig farm located in the district of Leiria, Portugal. The facility had a closed-loop production system with an average number of 650 heads (fattening stage; cereal grain-based feeding regime). Sampling took place directly from the discharge pipeline of the facility prior to routine cleaning. The collected material was stored in 50 L barrels with non-hermetic lids at ambient temperature. To account for the variability of the bulk material, independent samples were collected from the barrels at the initiation of each experimental treatment and stored at 4 °C prior to analysis. Microbiological analysis of raw slurry samples (detection of Salmonella in 25 g of slurry and enumeration of E. coli (CFU g−1 slurry)) was performed within 24 h after slurry collection. Analytical methods used to characterize the raw slurry samples are described in Chrysanthopoulos et al. [5]. The main physico-chemical properties of the slurry are presented in Table 1.
The strategies used to sanitize the slurry by pH modification were mineral-acidification (pH 5), bio-acidification (pH 5) and alkalinization (pH 9.5).
Overall, seven treatments were considered for the leaching experiment: surface application of raw (untreated) slurry (RS); acidified slurry with concentrated sulfuric acid (95% w/w) (H2SO4); acidified slurry with the by-product spent acid (Spent.A); bio-acidified slurry with sucrose (Suc); bio-acidified slurry by combining H2SO4 with sucrose (H2SO4/Suc); and alkalinized slurry with potassium hydroxide (10 M) (KOH). A treatment without slurry application acted as the control (CNT). Spent acid is a liquid by-product obtained from a local paper and pulp industry with high concentrations of Na (147 g L−1) and SO42− (697 g L−1), capable of reducing the pH of pig slurry to as low as pH 5 [5]. For bio-acidification, commercial table sugar was used as a bio-labile carbon-rich substrate to stimulate the production of organic acids by the slurry microbiota. The rationale for combining H2SO4 with sugar was to mitigate the amount of H2SO4 required. The additive dose required for each treatment is shown in Table S1. For mineral-acidification and alkalinization treatments, additives were applied to 500 g of slurry, in small increments and in triplicate. The pH value of the slurry was constantly monitored with a portable pH meter (AL15-Aqualytic, DKSH, Bangkok, Thailand) under manual stirring. Slurry bio-acidification was conducted in temperature-controlled storage units at 22 °C (±2 °C) over four days. For H2SO4/Suc treatment, H2SO4 was initially applied until pH 6, followed by sucrose addition. Bio-acidified slurry samples were collected on day 4 upon reaching the target pH of 5. All treated slurry samples were stored at 4 °C before used in the leaching experiment. Microbiological analysis of the treated slurry samples was performed within 24 h after collection.

2.2. Experimental Setup

To simulate the maximum potential leaching of nutrients and pathogens after surface application of pig slurry, a sandy soil (classified as Haplic Arenosol) with low organic carbon content (4.3 g kg−1) was used as described in [4]. The initial soil pH was 5.6 with low concentrations of extractable P (10.8 mg P kg−1 soil) and K (12.1 mg K kg−1 soil) recorded. Rigid PVC columns (inner diameter: 5.5 cm; length: 50 cm), secured at the bottom with a layer of glass wool and PVC mesh, were filled with 0.9 kg air-dried soil. The columns were then submerged in a container with distilled water for 24 h to allow complete saturation. A total of 21 columns were placed on a shelf equipped to allow collection of the leachate in Erlenmeyer flasks.
Raw and treated slurry samples (replicated three times) were applied at a dose corresponding to 240 kg N ha−1 (80 mg N kg−1 soil), which represents the maximum allowable amount of organic residues for soil application according to Portuguese regulations [20]. The different slurry treatments were homogeneously spread onto the soil surface without disturbing it. The study lasted 24 days, as this period covers the critical leaching risk window following slurry application, with the first 24 days being the most problematic in terms of nutrient leaching potential [4]. Soil columns were maintained at 22 °C throughout the experiment.

2.3. Irrigation Events

Simulation of rainfall events was achieved by applying 300 mL of distilled water, equivalent to 100% of the soil water holding capacity (WHC). This volume was selected to ensure complete renewal of the soil solution at each leaching event, allowing quantification of the nutrients accumulated between consecutive events. The first irrigation event (IE) occurred three days after slurry application to be aligned with good agricultural practices and respect a three-day waiting period [7]. A total of four IEs were planned with a seven-day interval between events. All columns were weighed before and after each leaching event to account for water evaporation. To minimize water losses and allow gaseous exchanges, perforated parafilm was placed on top of each column.
Upon collection of the leachates, the total volume of each sample was determined (Table 2). Subsamples were analysed for the pH (Orion 3-star plus, Thermo Fischer Scientific, Waltham, MA, USA), electrical conductivity (EC) (Orion star A212, Thermo Fischer Scientific, Waltham MA, USA), NO3-N and NH4+-N by segmented flow autoanalyzer (San Plus System, Skalar, Breda, The Netherlands), and total content of P, potassium (K) sulphur (S) through inductively coupled plasma spectrometry (iCAP 7000 Series ICP Spectrometer, Thermo Fisher Scientific, Waltham MA, USA). Faecal coliform enumeration in leachates was conducted after each IE as described in Section 2.4.2.

2.4. Microbiological Analysis

2.4.1. Detection of Salmonella and Enumeration of E. coli in Slurry Samples

Salmonella detection and E. coli enumeration in raw and treated slurries were carried out in accordance with ISO 6579-1 [21] and ISO 16649-2 [22], respectively, as previously described by Chrysanthopoulos et al. [5]. The present work followed the microbiological criteria mentioned in EU regulation for fertilizing products (EU 2019/1009) [23]. In this context, pig slurry was considered sanitized whenever Salmonella was not detected in 25 g of fresh material and E. coli counts were less than 1000 (3 log) CFU g−1 of slurry.

2.4.2. Enumeration of Faecal Coliforms in the Leachate

After each IE, subsamples of the leachate were collected in sterilized Erlenmeyer flasks. Samples were kept at 4 °C until microbiological analysis was performed, <12 h after sampling. Faecal coliform enumeration was carried out as previously described by Rodrigues et al. [7]. Briefly, for each leachate sample, series of 15 Lactose Broth (LacB) tubes (Biokar Diagnostics, Beauvais, France), each with Durham fermentation tubes inside, were inoculated with appropriate volumes of leachate. The tubes were then incubated at 35 ± 0.5 °C and examined for turbidity after 24 to 48 ± 3 h. After this period, all tubes with gas and/or turbidity were subjected to confirmation, transferring 0.1 mL of the culture from each tube to fermentation tubes containing 10 mL of E. coli (EC) broth (Biokar Diagnostics, Beauvais, France) with Durham tubes. The tubes were incubated at 44.5 ± 0.2 °C for 24 ± 2 h. Growth with gas production was considered a positive thermotolerant (faecal) coliform reaction. The failure to produce gas was considered a negative reaction. The most probable number (MPN) of faecal coliforms/per 100 mL of leachate was calculated, according to tabulated values, from the number of positive EC broth tubes. To define whether the collected leachate was sanitized or not, it was necessary to establish a limit value. As no microbiological regulations currently apply to leachate, the maximum limit of 100 MPN of faecal coliforms per 100 mL was used, as defined by the Portuguese legal regime for irrigation water (Ministry of the Environment of Portugal, Ministerial Diploma 236/98).

2.5. Calculations and Statistical Analysis

The R studio software (version 2025.05.0+496) [24] was used for graphical illustrations and statistical analyses of the data. One-way analysis of variance (ANOVA) was applied to assess the effects of treatment on slurry sanitization (day 0) and cumulative nutrients leached at the end of the experiment (day 25). Pairwise comparison of means was performed using a Tukey honest significant difference (HSD) test at a significance level of α = 0.05. Data normality and homogeneity of variances were verified using the Shapiro–Wilk and Levene’s tests, respectively.
A linear mixed-effect model (lmer package) was applied to assess the effects of fixed (treatment × day) and random (replicate) factors on pH, EC, NH4+, NO3 and p values obtained during the leaching experiment. Following model fitting, variance analysis was conducted to assess the effect of treatments at each irrigation event. Pairwise comparisons were performed using the post hoc Tukey test at a significance level of α = 0.05. Outputs of the statistical analysis are provided in the Supplementary Material (Tables S2–S6).

3. Results and Discussion

3.1. pH and Electrical Conductivity of the Leachates

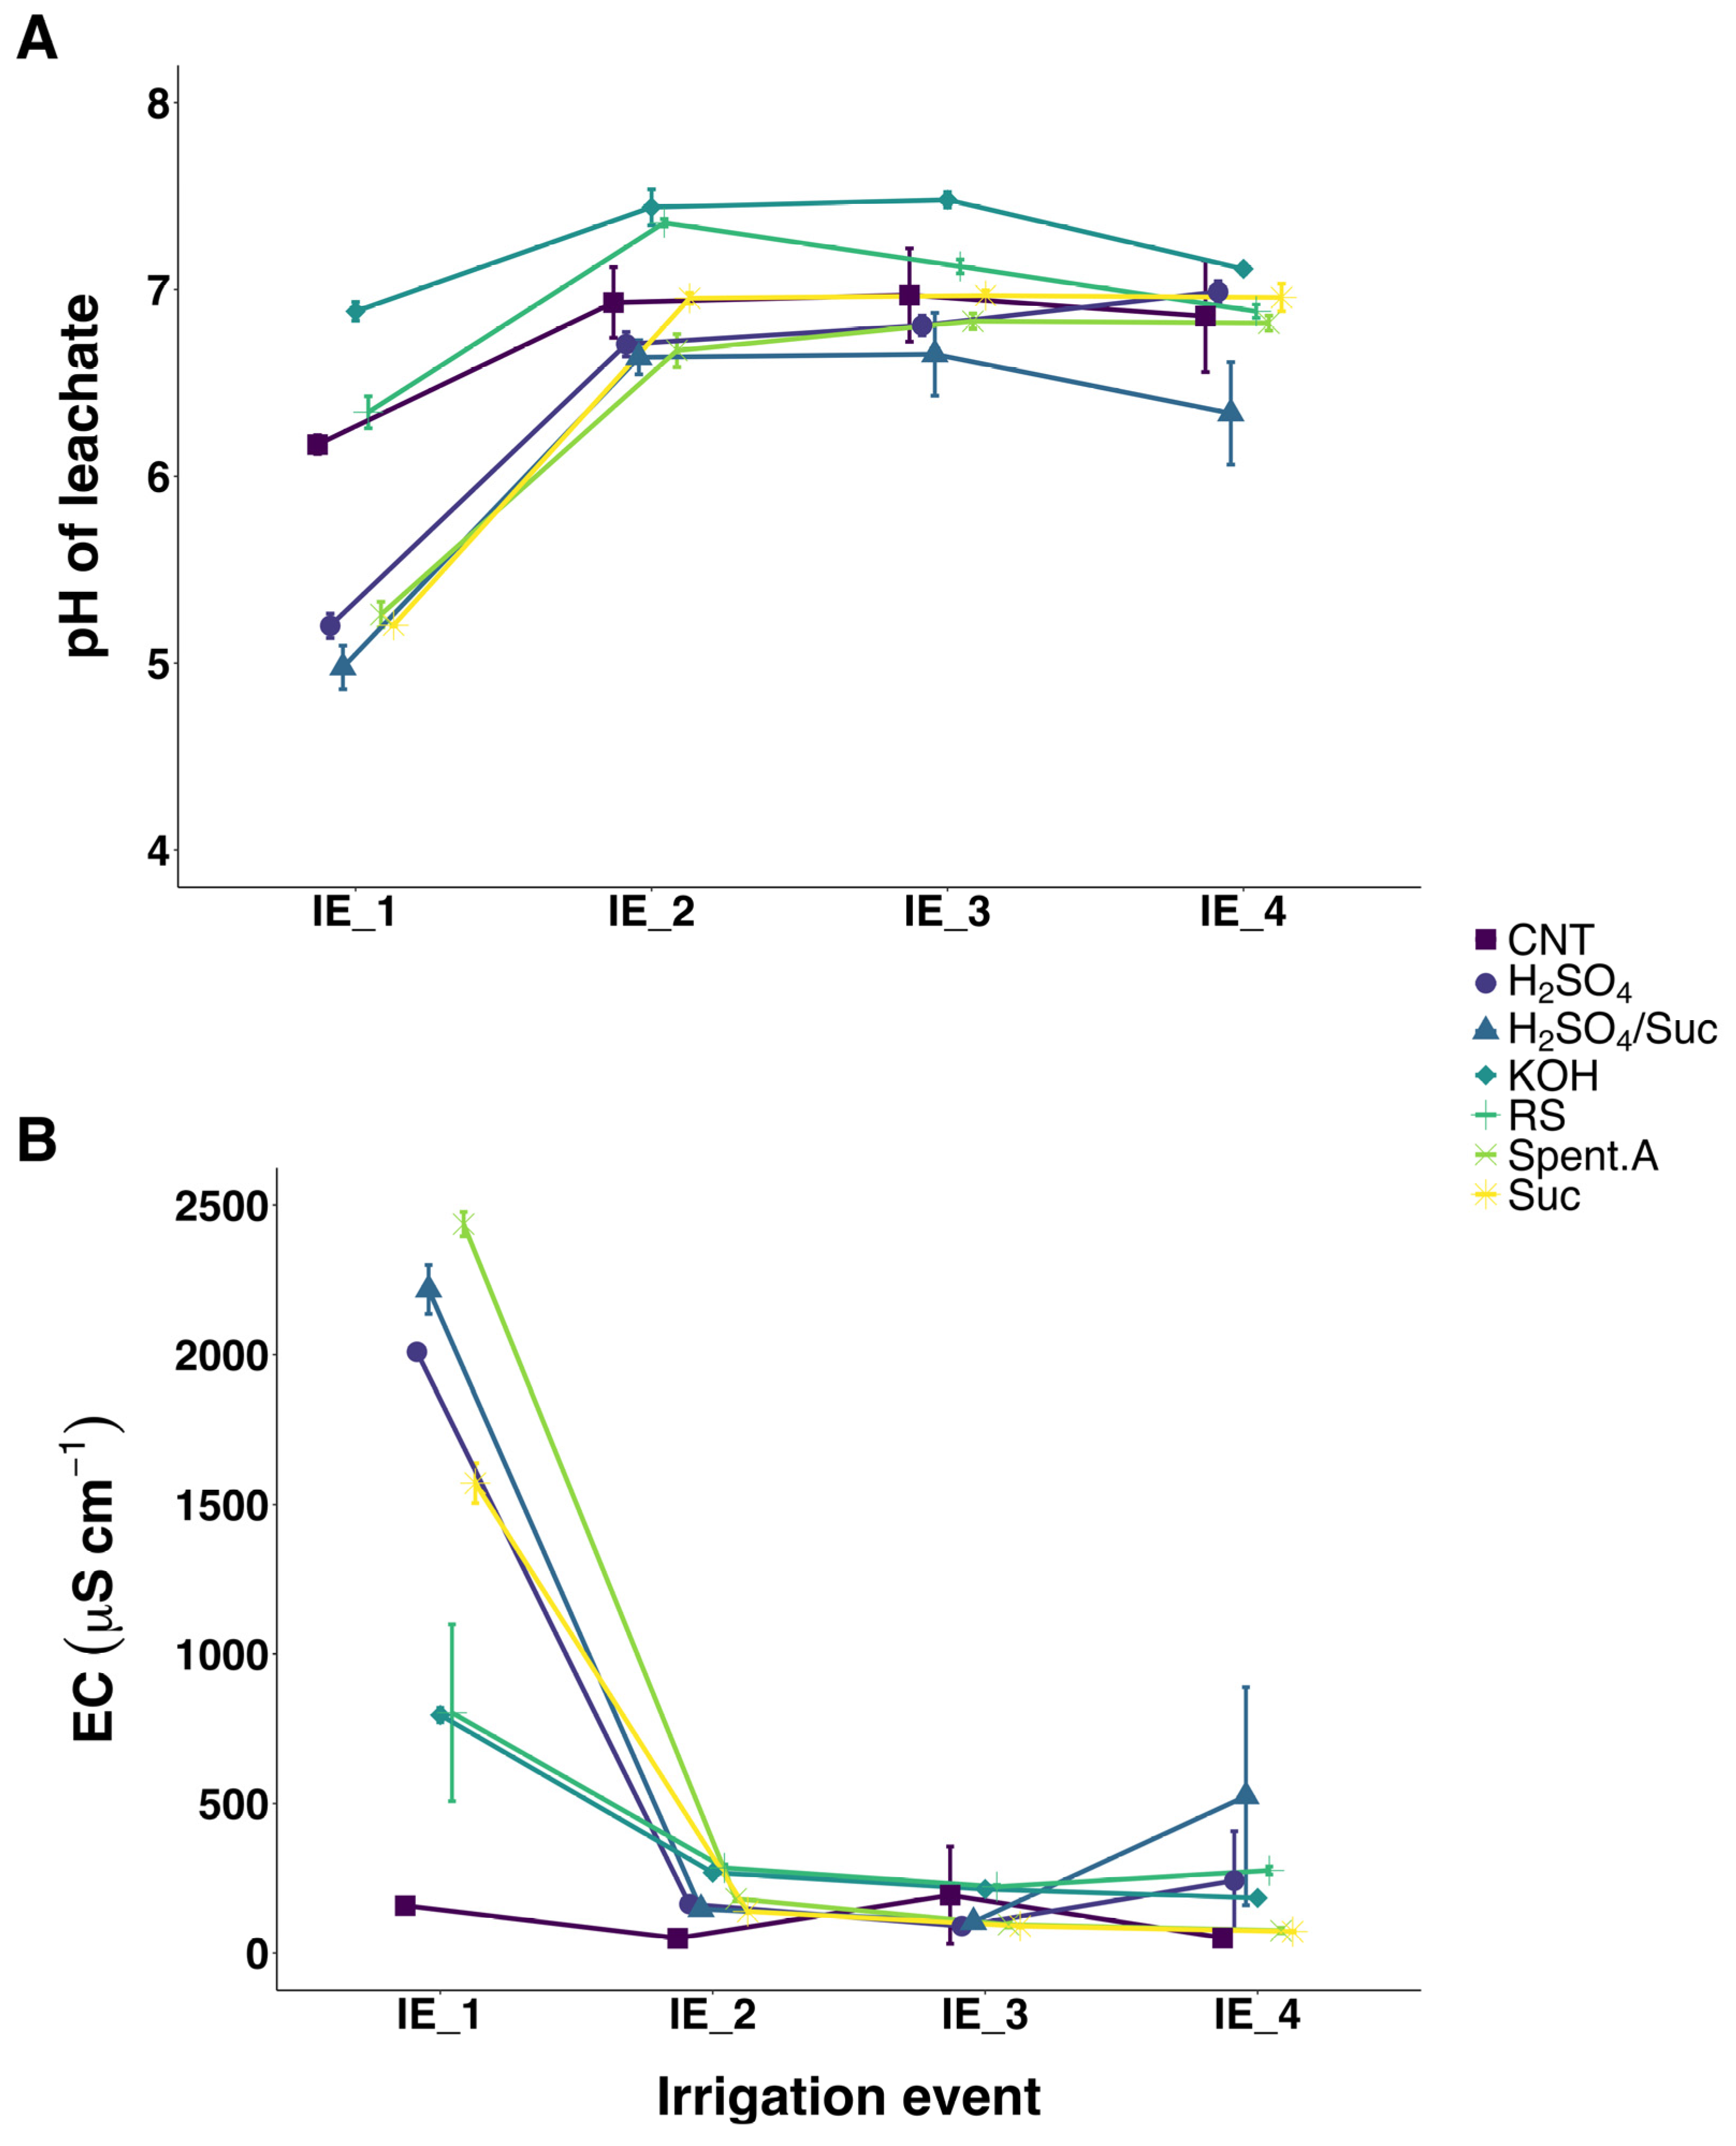
Surface application of raw and treated slurry samples significantly affected the pH and EC of the leachates after the first IE (Figure 1). All additives used for slurry (bio)-acidification resulted in a significant decrease in the pH of the leachate compared to CNT. However, at IE2 (day 10), no significant differences were observed, with all leachates exhibiting pH values greater than 6. By IE4, leachate pH values reached an equilibrium in the range of 6.8–7.1, except for the H2SO4/Suc treatment, where leachate pH remained below 6.5.
Similar to pH, the leachate EC exhibited significant differences at IE1 (Figure 1B). Treatments involving the addition of sulfuric acid (i.e H2SO4, H2SO4/Suc) or sulfate-rich additives (Spent.A), showed EC values greater than 2000 μS cm−1. Nevertheless, a strong decrease in EC was observed for all leachates after IE2. Bio-acidification with H2SO4/Suc was the only treatment in which leachate EC increased significantly between IE3 and IE4.
The observed increase in leachate EC following (bio)-acidification treatments can be attributed either to the decrease in slurry pH and/or the additive used. Indeed, dissolution of metal complexes in animal slurries is a common phenomenon induced by acidification [13]. While previous studies have noted high EC values in leachates from acidified slurries, significant decreases typically occur from IE3 onwards [7,13]. The alternative additives assessed in this study (Spent.A) may have increased the leachate EC due to its high Na content (147 g L−1). However, this effect was limited to IE1, consistent with previous observations for H2SO4 [7].
Both pH and EC are important groundwater quality parameters, as they influence the stability of aquatic ecosystems [25,26]. Acidic leachate, as observed in this study at IE1 with (bio)-acidified treatments, tends to have higher dissolved oxygen levels [27] which can accelerate oxidation reactions. The near-neutrality of leachate pH in most of the treatments at the end of the study (day 24), is unlikely to impair groundwater quality.

3.2. Potential Leaching of Pathogens

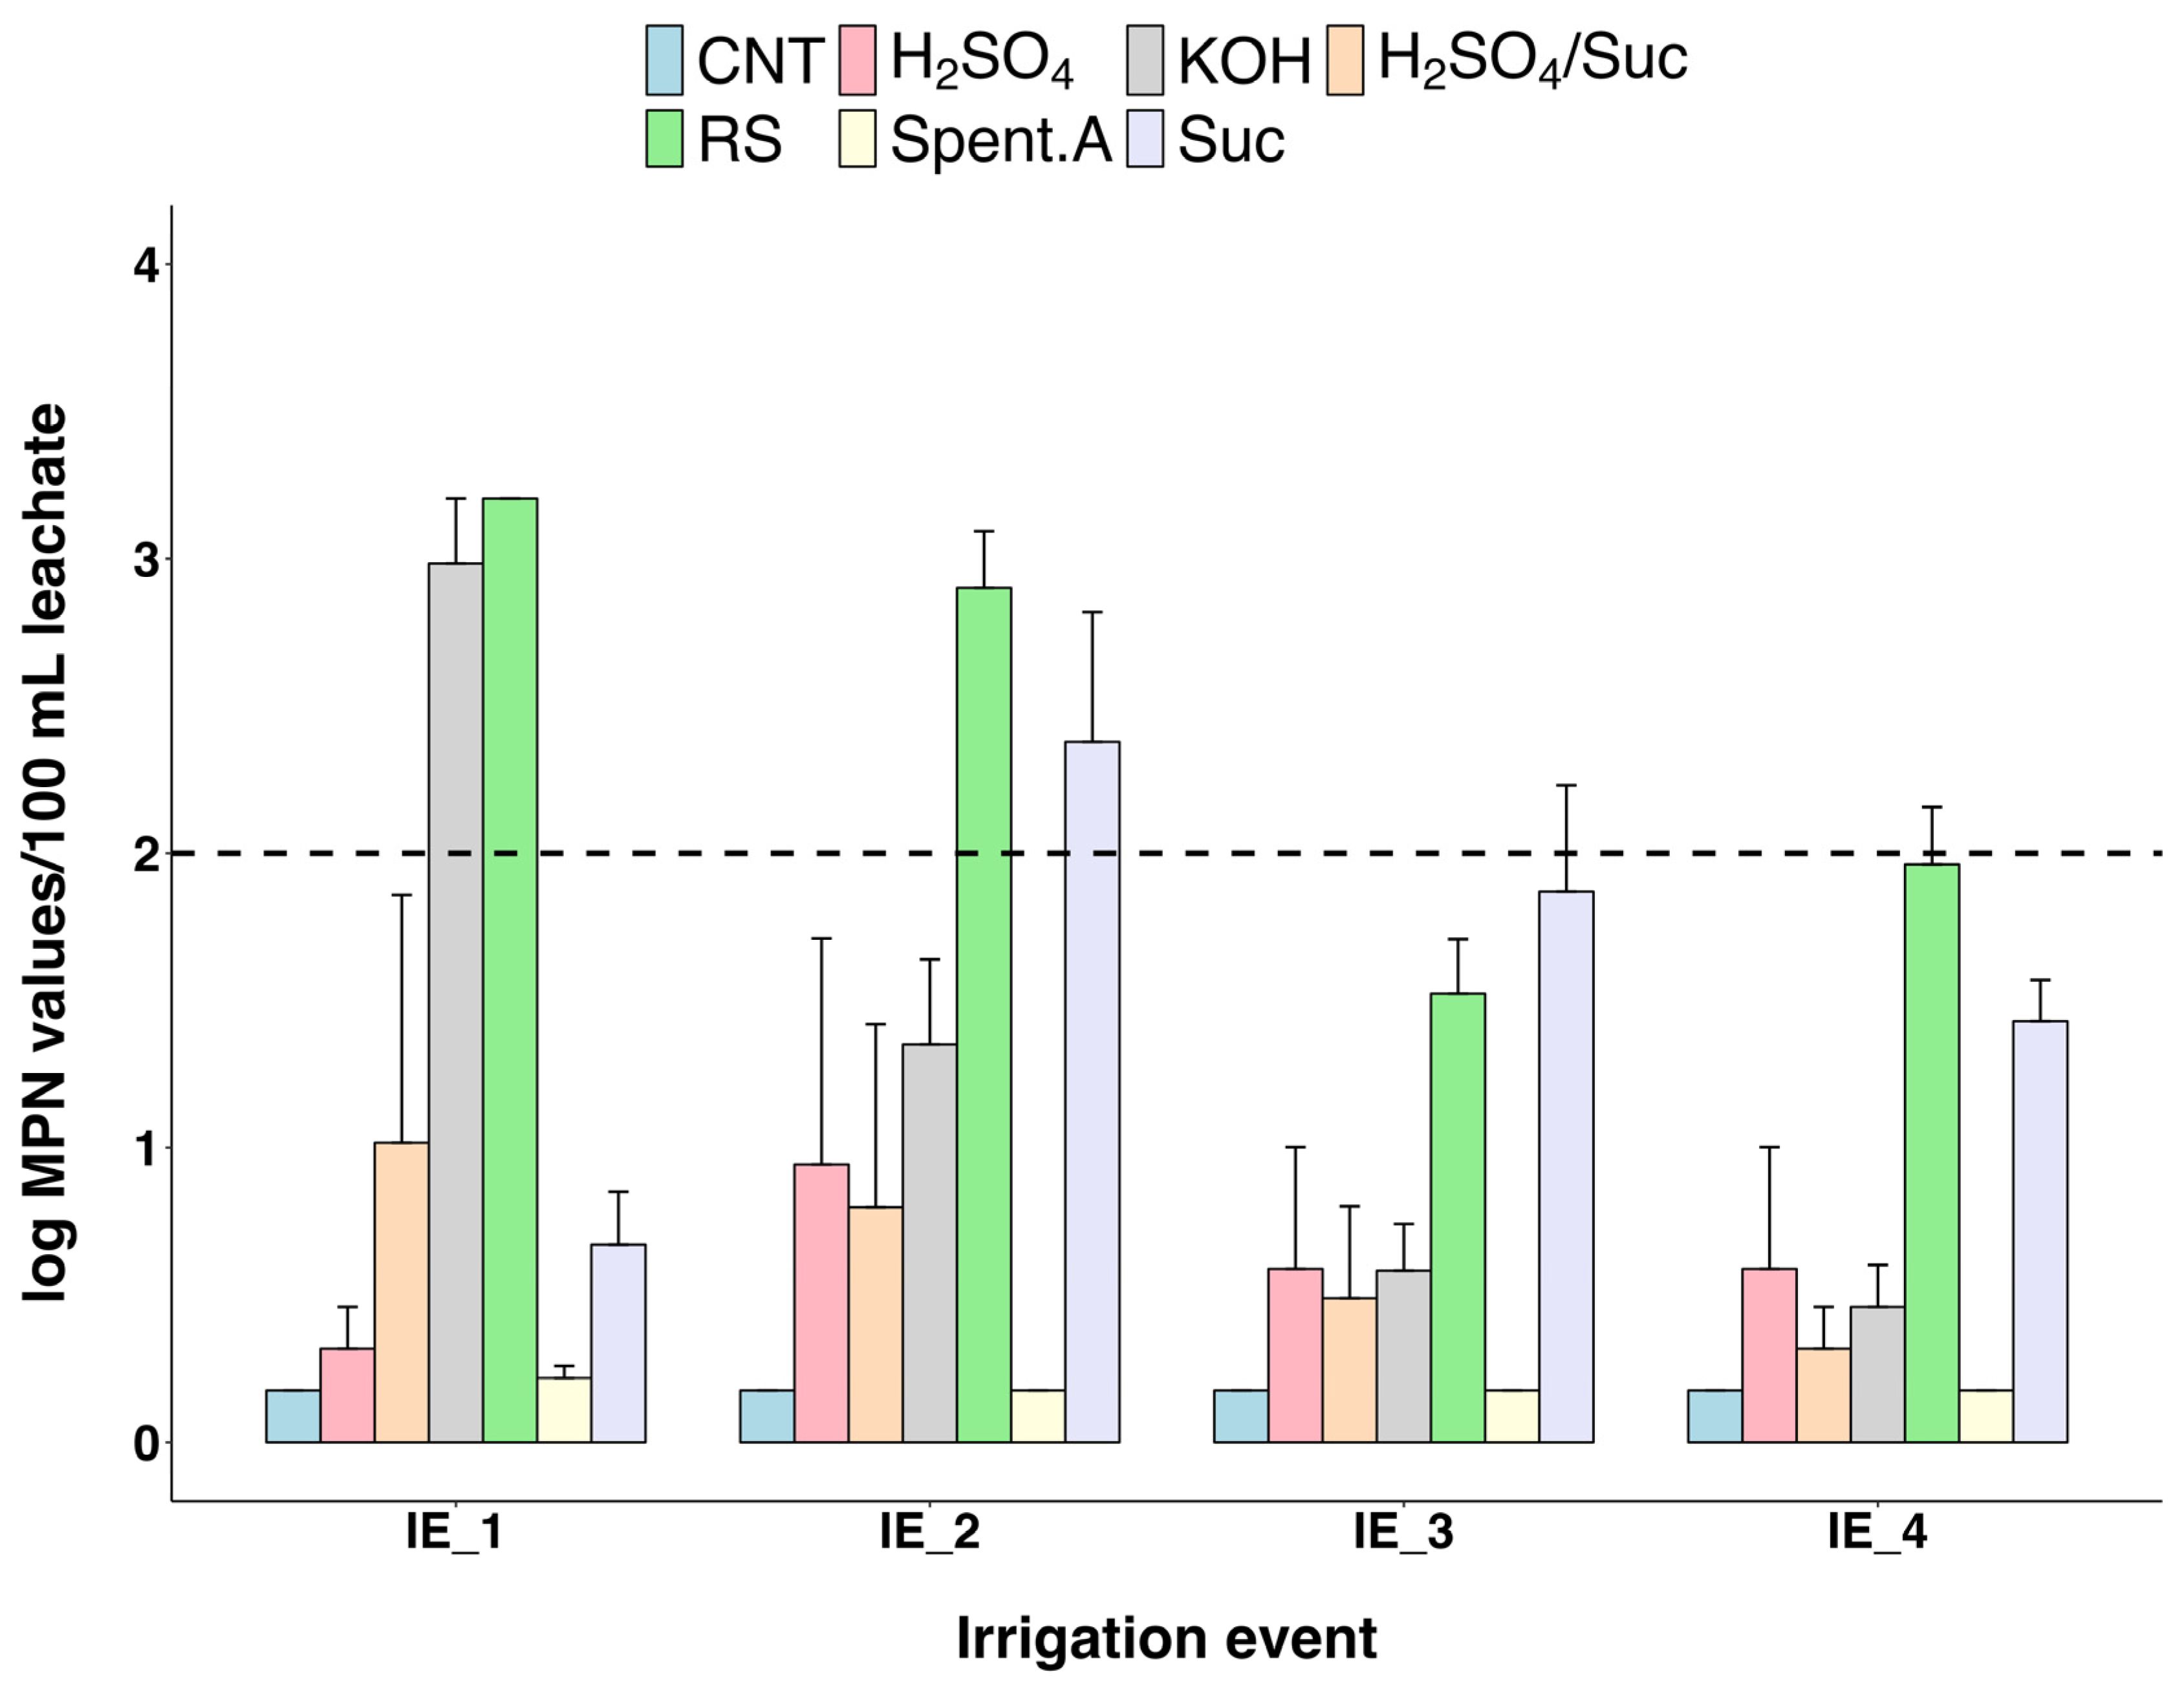
An important aspect to consider when evaluating the potential leaching of pathogens after slurry application is the microbiological quality of the slurry [13]. Incomplete sanitization prior to soil application can lead to a high risk of pathogen leaching, especially in sandy soils [7]. In the present study, all treatments resulted in sanitization of the slurry (<1000 CFU E. coli g−1 slurry) (Table S1, Supplementary Material). For most treatments, faecal coliform concentrations in the respective leachate were below the threshold considered in this study (<100 MPN/100 mL), suggesting a low risk of pathogen leaching associated with these treated slurries.
Over the four IEs, a decreasing trend in faecal coliform counts in the leachate was observed (Figure 2). Untreated slurry exhibited the highest faecal coliform counts during IE1 and IE2. Nonetheless, a progressive reduction was observed across all treatments by IE3 and IE4.
However, despite the sanitization of the alkalinized slurry, the faecal coliform counts in the leachate at IE1 were similar to those resulting from the application of raw slurry (Figure 2). Previous work by Rodrigues et al. [7] corroborates these results, as the alkalinization of cattle slurry also led to the presence of faecal coliforms exceeding the considered limit in the leachate obtained during the first leaching event post-application. A possible explanation is the neutralization of alkalinized slurry at the soil/slurry interface. The buffering capacity and acidity of the soil (pH 5.6) used in both studies are important factors that can compromise alkalinization efficiency. It is therefore possible that microorganisms were inhibited but not killed by the alkalinization treatment, allowing them to multiply once the leachate pH returned to near-neutral values (pH 6–7) (Figure 1). This may have resulted in the subsequent transport of faecal coliforms through the soil column. Nevertheless, despite this initially high pathogen leaching potential, a strong decrease was observed for this treatment from IE2 to IE4.
Slurry acidified with H2SO4 and Spent.A consistently produced leachate (IE1 to IE4) with faecal coliform numbers below the established threshold (<100 MPN/100 mL) across all IEs. Comparing the two bio-acidified treatments, H2SO4/Suc resulted in lower faecal coliform counts than Suc at all IEs except IE1. As an alternative to mineral-acidification, slurry bio-acidification presents promising results in terms of pathogen leaching mitigation. Chrysanthopoulos et al. [5] previously reported greater sanitization efficiency with pig slurry when combining H2SO4 with sucrose. In the present study, by incorporating a pre-acidification step with H2SO4 (H2SO4/Suc), pathogen leaching decreased to legal levels compared to the addition of sucrose (Suc) alone. Similarly to the pH neutralization observed at IE2 for alkalinized slurry, neutralization of the Suc leachate (from pH 5.2 at IE1 to pH 7 at IE2, Figure 1) may have promoted the multiplication of initially inhibited microorganisms.
From a practical perspective, the first leaching event represents the greatest risk of faecal coliform leaching, as argued by other authors [10]. From IE3 onwards, all treatments produced leachate with faecal coliform counts below the legal limit for irrigation water, including raw slurry application. However, farmers intending to fertilize horticultural crops through surface application of animal slurry must ensure the use of a safe and sanitized product. Therefore, pH modification is an important sanitization strategy for slurry prior to soil application. Acidifying slurry using alternative additives may, therefore, be a promising approach.

3.3. Leaching of Nutrients

3.3.1. Potential Leaching of Ammonium Nitrogen

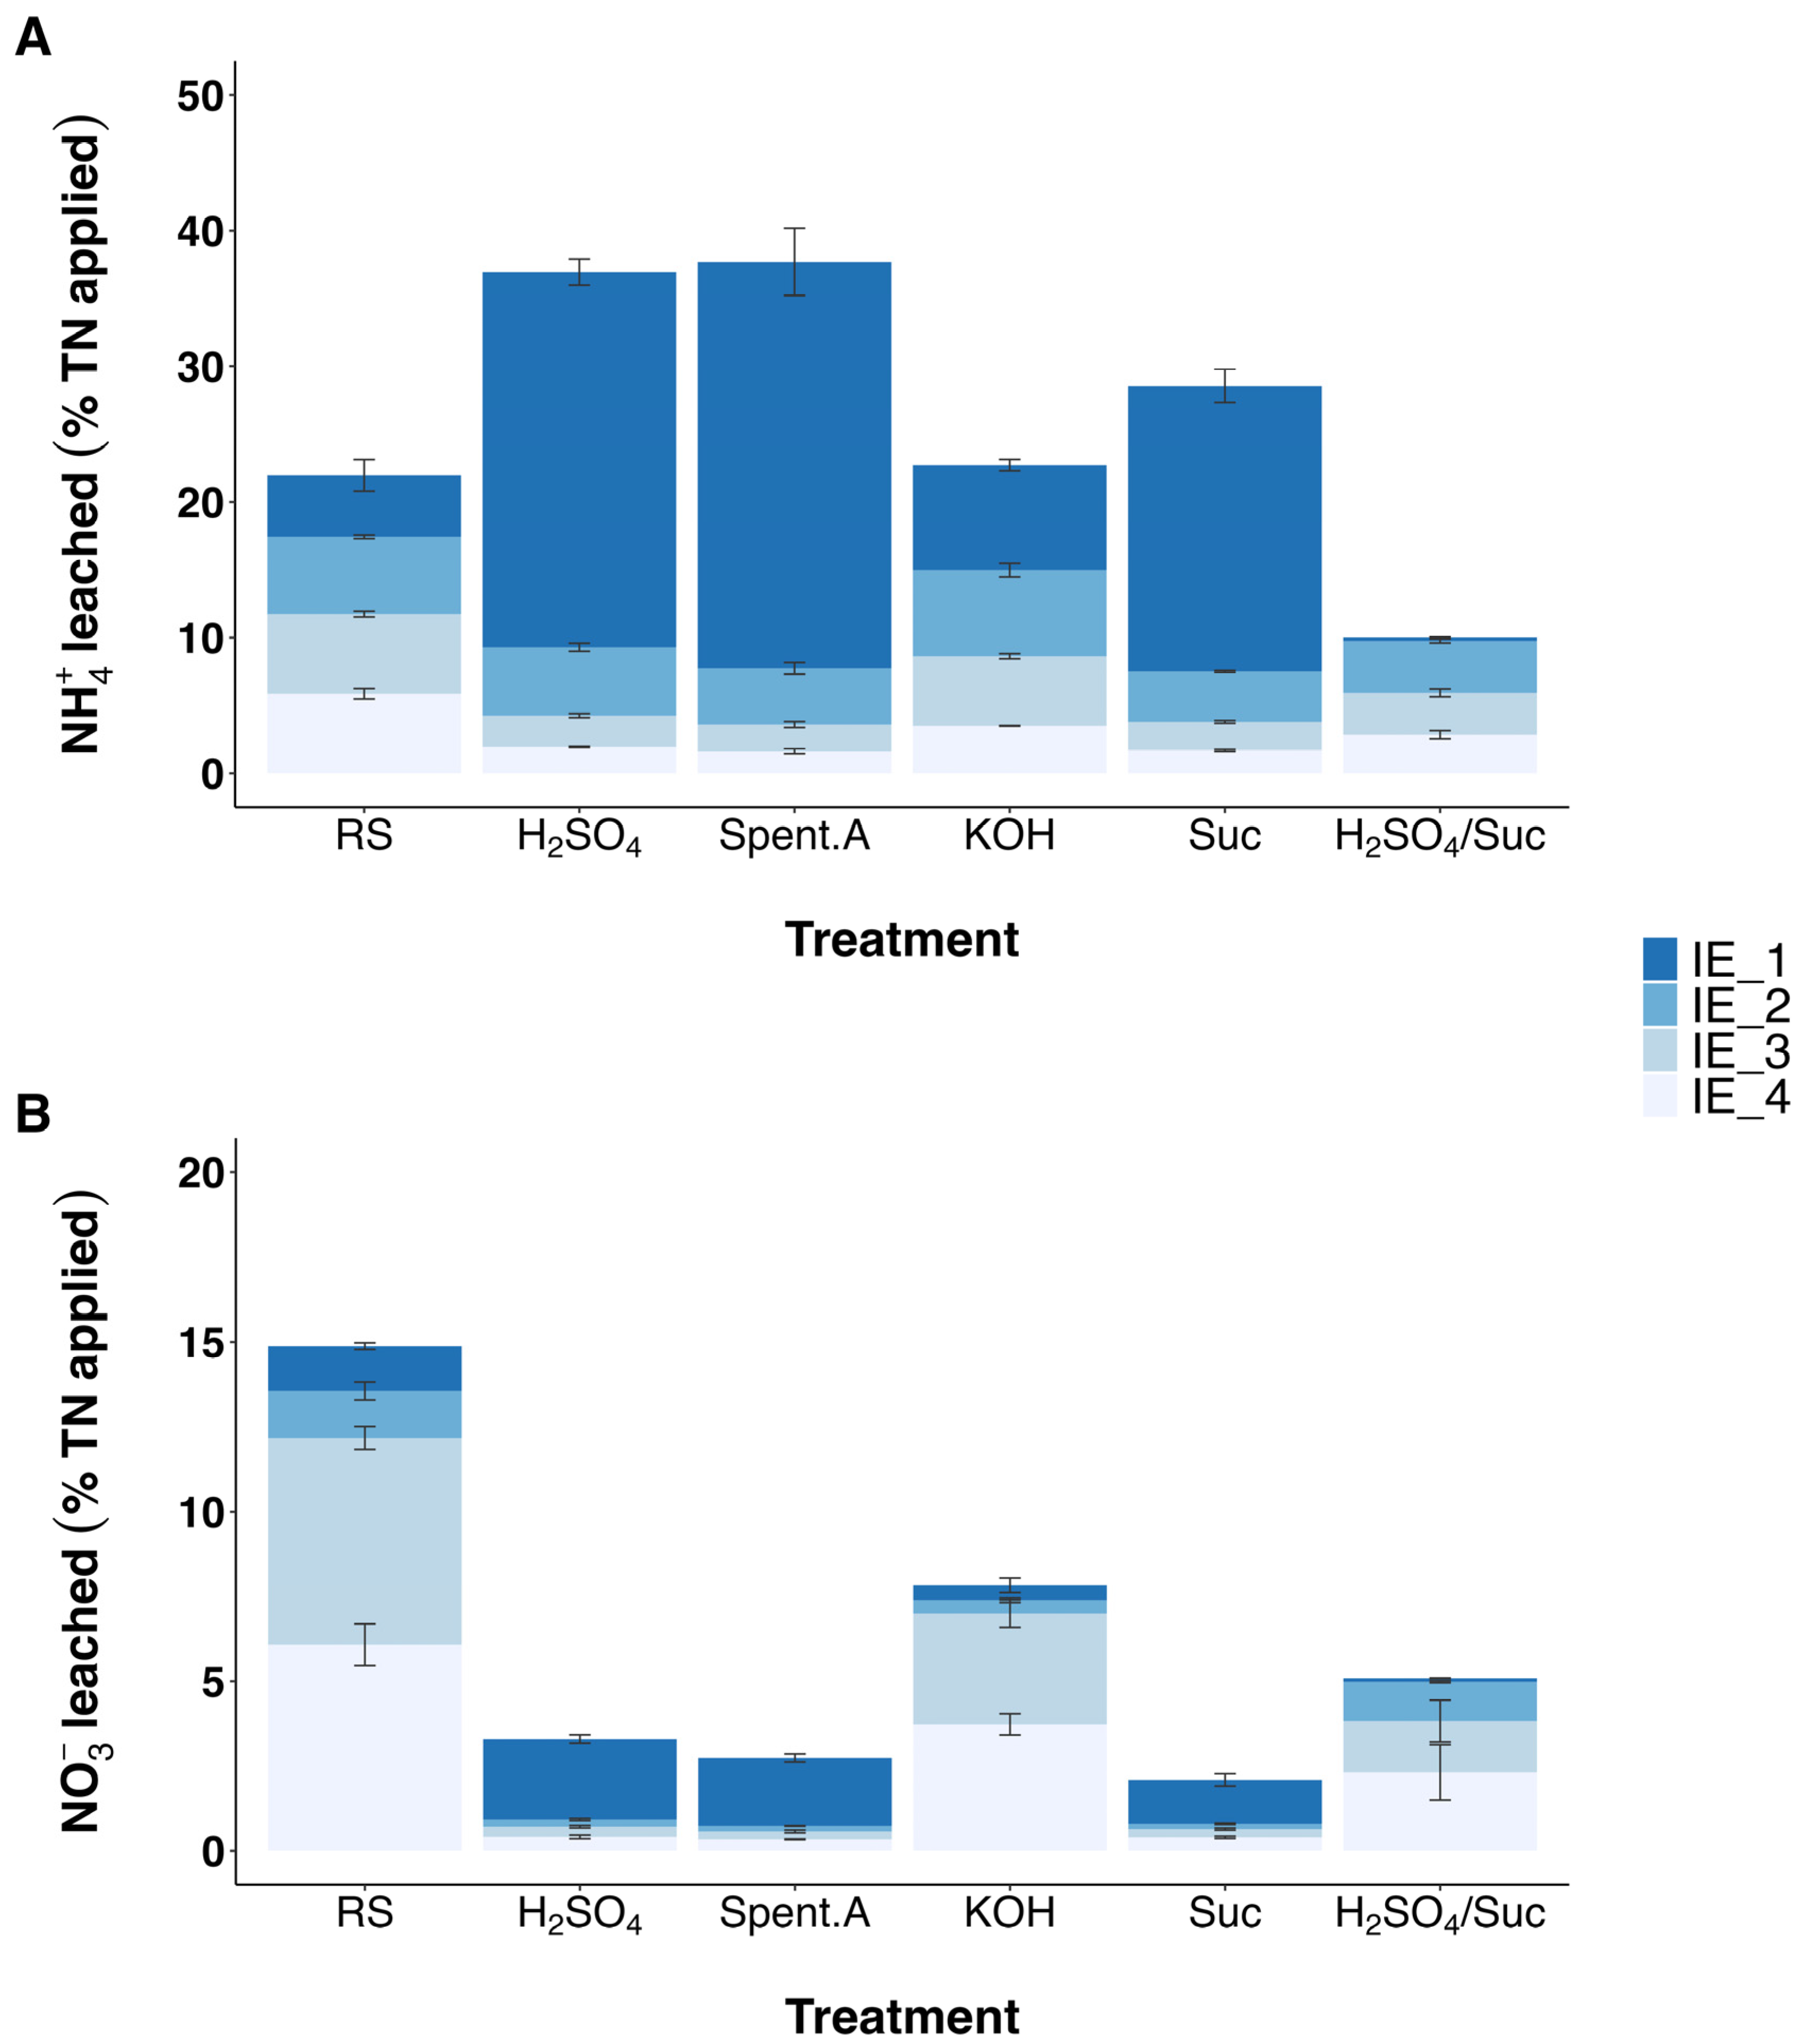
Significant differences between treatments were observed regarding the cumulative NH4+ leached over the four IEs (Figure 3A). Mineral-acidification with H2SO4 and Spent.A exhibited the highest NH4+ availability for leaching, with nearly 30% of the losses observed during IE1 (day 3). Nevertheless, a significant reduction was measured between IE1 and IE2, followed by a gradual decrease until IE4 (day 24). Slurry bio-acidification with Suc showed similar behaviour to acidified treatments, with the highest peak in NH4+ leaching occurring during IE1. However, H2SO4/Suc showed a different response, with a significantly lower NH4+ concentration observed in the leachate at IE1 (day 3). The leachability of NH4+ in both RS and KOH did not differ significantly at any IE.
As expected, all slurry applications led to ammonium leaching values considerably higher than the 1.2 mg kg−1 soil observed in the CNT (Table 3). Bio-acidified slurry with H2SO4/Suc resulted in a 55% reduction in cumulative NH4+ leached relative to RS. Conversely, the sole addition of sucrose (Suc) caused a significant increase in NH4+ leaching. Notably, acidification with Spent.A exhibited the highest cumulative NH4+ leaching, totalling 30.1 mg NH4+ kg−1 soil.
From the obtained results, it is evident that (bio)-acidified slurry (except H2SO4/Suc) increased the potential leaching of NH4+. Ammonium is a monovalent cation that can be rapidly converted into NO3 through nitrification. In addition, due to its adsorption to soil colloids, NH4+ is less prone to leaching compared to NO3 [13]. Previous studies attributed substantial NH4+ leaching from acidified slurry treatments to the sandy texture of the soil and its low cation exchange capacity [13].
In line with these findings, the higher leachability of NH4+ in the present study can be attributed to the sandy texture of the soil used, its low OC content, and the very short period (3 days) for nitrification to take place. This is further supported by the leachate pH data: during IE1, where peak NH4+ leaching was recorded, leachate pH in the (bio)-acidified treatments dropped below 5.5 (Figure 1). At such pH values, H+ ions compete directly with NH4+ for cation exchange sites on the soil matrix, effectively displacing NH4+ into the soil solution and enhancing its downward transport [28]. This is further aggravated by the inhibition of nitrification under acidic soil acidifications [29].
Furthermore, slurry acidification is known to reduce ammonia volatilization after soil application [12,30], meaning that more N is retained in the soil as NH4+ compared to untreated or alkalinized slurry. Since leaching losses are expressed relative to the NH4+-N initially present in each treatment, this larger NH4+ pool partly explains the higher leaching percentages observed in acidified treatments.
Regardless of treatments, the absence of plants on top of the leaching column, combined with the simulation of intense rainfall events, meant that NH4+ was easily infiltrated through the soil columns, reaching very high concentrations in the leachate at IE1. Previous works by Esteves et al. [31] and O’ Flynn et al. [32] corroborate these findings, as the highest peak in NH4+ leaching was observed during IE1. While NH4+ leachability from alkalinized slurry has been scarcely studied, our findings do not support any significant benefit regarding the mitigation of NH4+ leaching with this treatment. The pattern observed for alkalinized slurry is consistent with the work of Rodrigues et al. [7], who did not observe significant differences during the first two IEs.

3.3.2. Potential Leaching of Nitrate Nitrogen

Regarding NO3 leaching, a consistent pattern emerged across two treatment groups: the first group, consisting of H2SO4, Spent.A, and Suc, exhibited the majority of NO3 leaching at IE1, while the second group, including RS, KOH, and H2SO4/Suc, demonstrated a progressively increasing NO3 concentration in the leachate (Figure 3B). Raw slurry, in particular, showed significantly higher NO3 leaching at IE3 and IE4 accounting for over 12% losses of the TN applied. Cumulative NO3 losses remained significantly lower when slurry was treated with the by-product Spent.A or bio-acidified with Suc compared to RS (Table 3). Ultimately, despite the gradual increase in NO3 leaching over the four IEs observed for H2SO4/Suc, cumulative NO3 leaching was significantly lower in relation to RS.
Nitrification is a microbially driven process responsible for the conversion of NH4+ to nitrite (NO2) and subsequently to NO3. Since no NO3 was present in the applied slurry, all NO3 leached originated from either soil native nitrate or nitrification of NH4+ from the slurry or released through mineralization following application. As previously discussed, large quantities of NH4+ were leached in acidified treatments, especially during IE1 (Figure 3A). Given that NH4+ serves as the primary substrate for nitrification, it is logical to infer that less NH4+ was available for conversion to NO3 and subsequent leaching. Furthermore, it has been well documented that soil application of acidified slurry can cause a delay in the nitrification process [29]. The present findings are in line with those of Loide et al. [33], who also observed the lowest NO3 leaching after soil application of acidified cattle and pig slurry.

3.3.3. Potential Leaching of Phosphorus

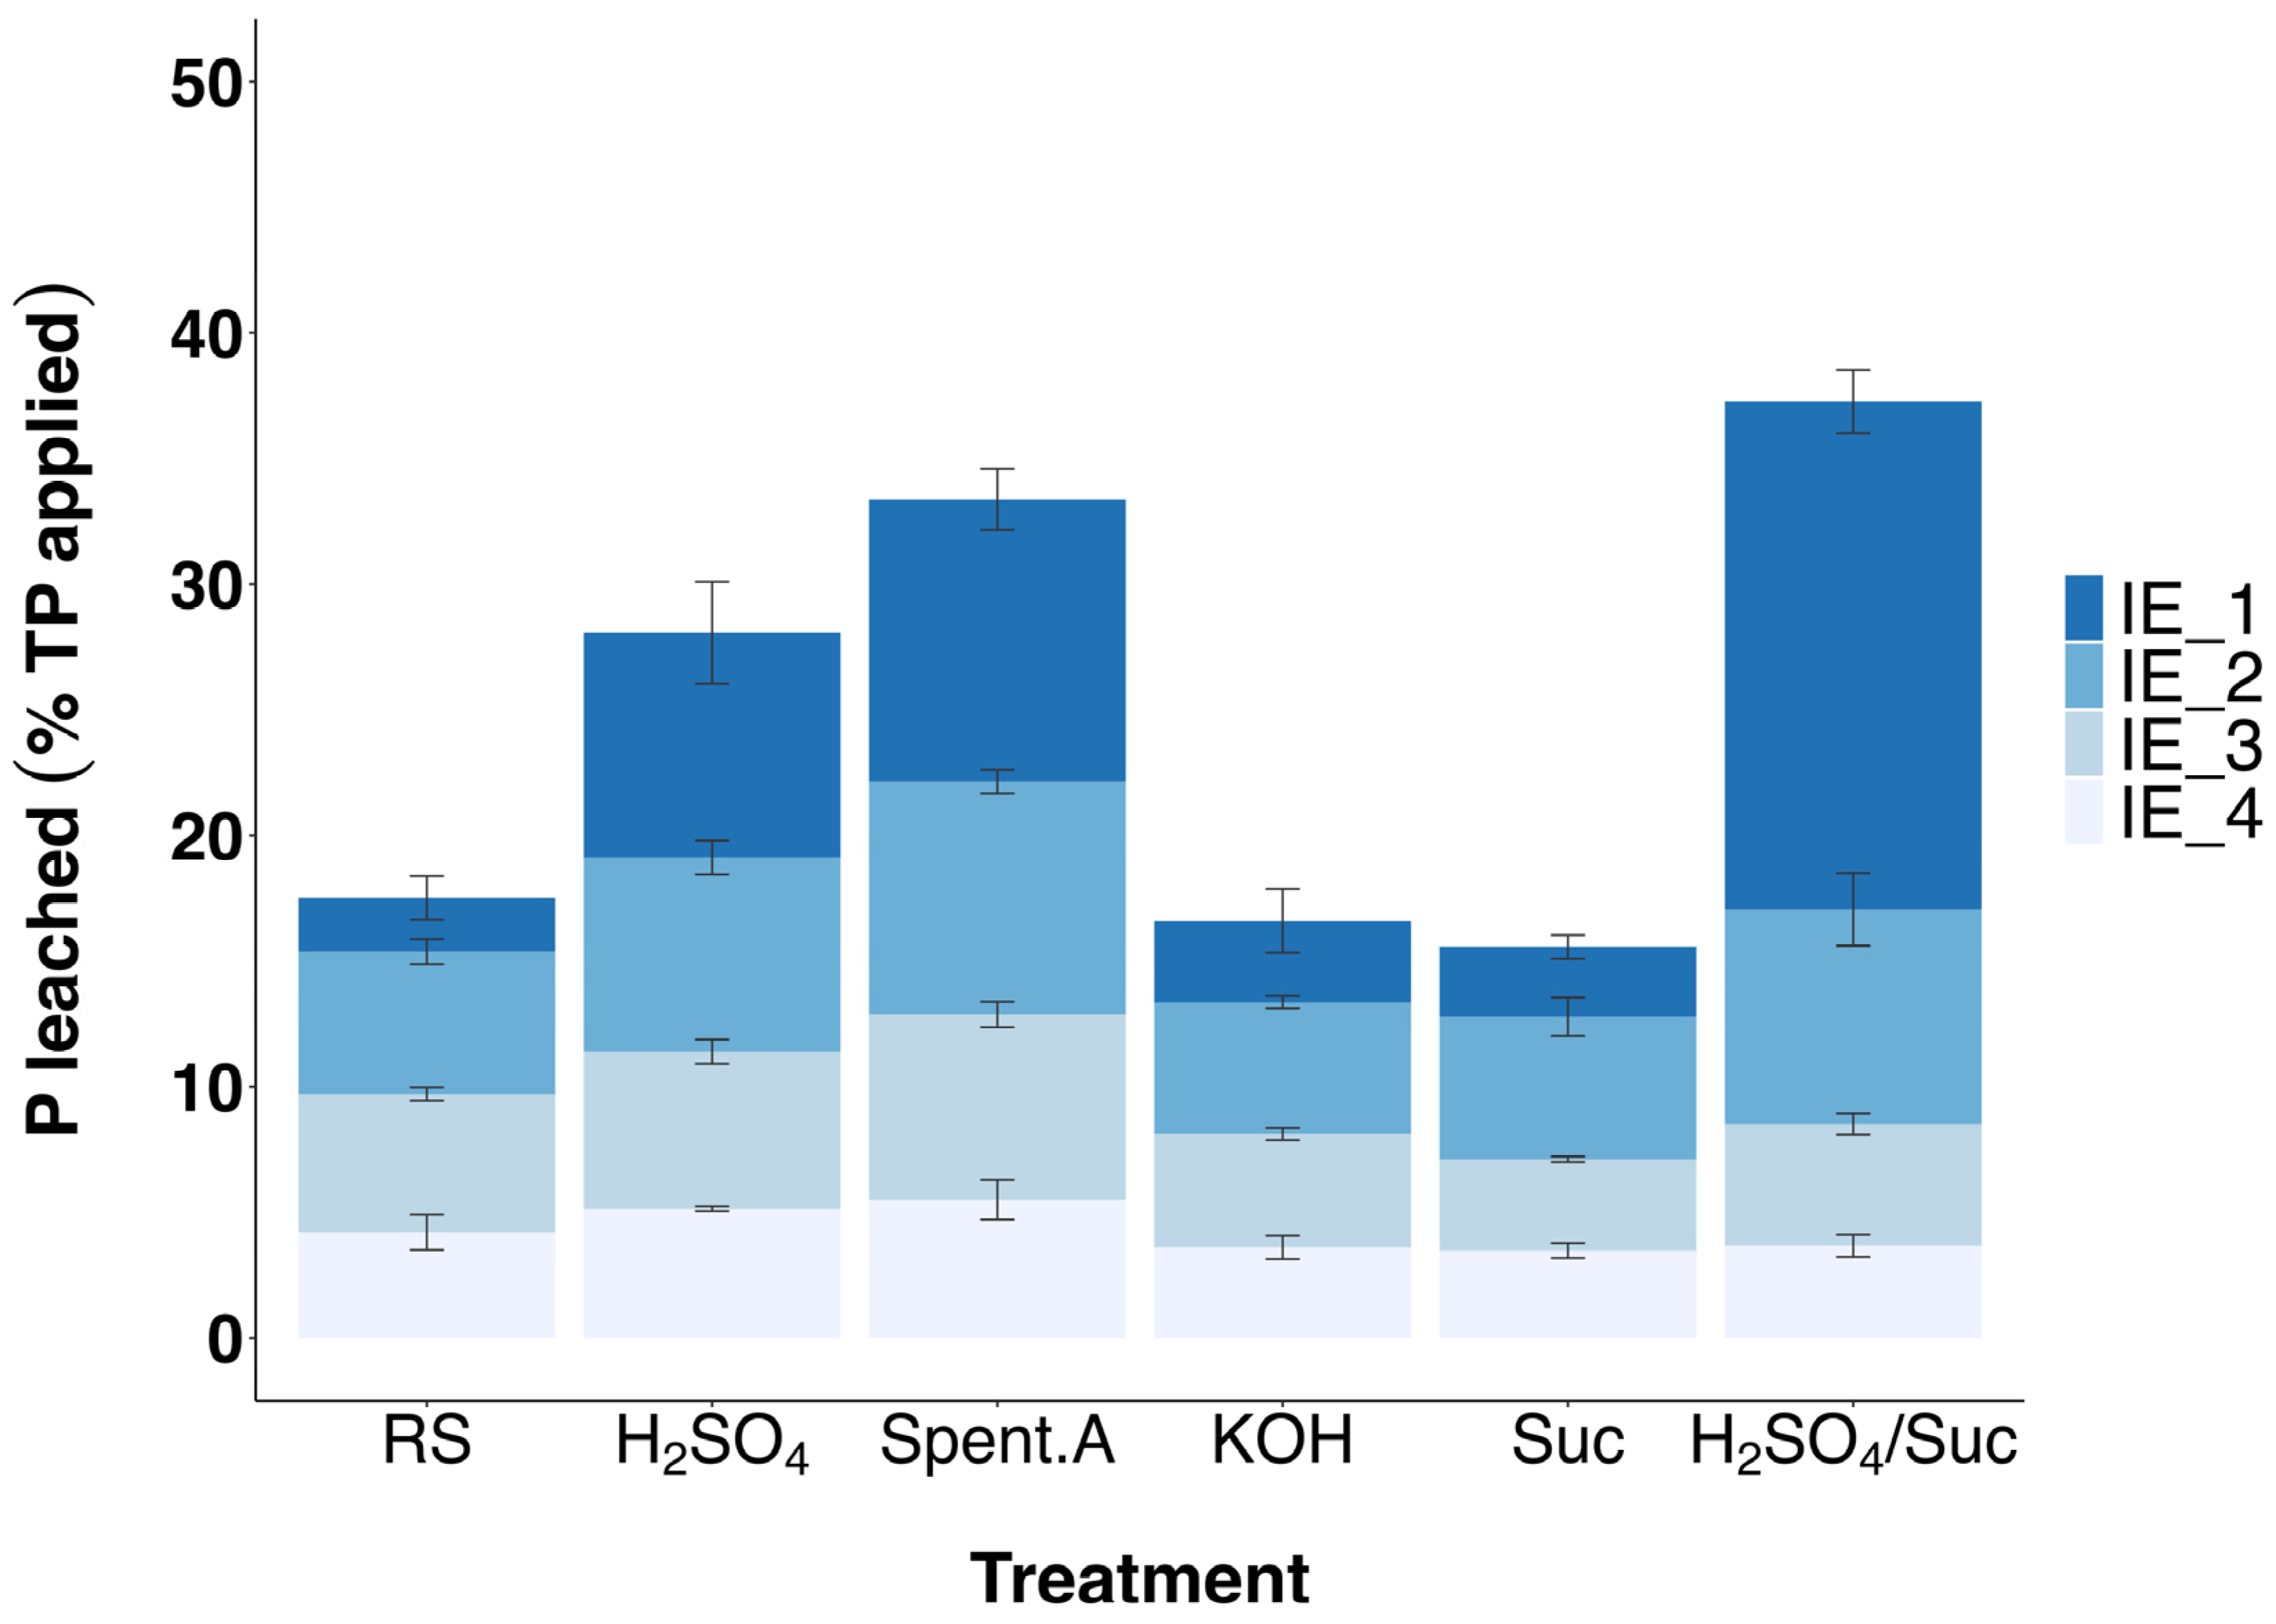
The dynamics of P leaching varied significantly across the four IEs in (bio)-acidified treatments (Figure 4). During IE1, H2SO4/Suc showed the highest P leaching, equivalent to nearly 20% of the TP applied. Although acidified slurry with H2SO4 and Spent.A showed significantly higher P losses compared to RS at IE1, these accounted for less than 15% of the TP applied. Similar P leaching patterns were observed for alkalinized slurry and Suc, since no significant differences were identified at any given IE. P concentrations in leachates declined over time for all treatments after IE1.
In the present study, a sandy soil with low P content (10.8 mg P kg−1) was used, which may explain the low cumulative p values in the CNT (Table 3). Statistical analysis did not reveal significant differences in cumulative P leaching between RS, KOH and Suc, confirming the pattern observed at individual IEs. Conversely, acidified slurry with H2SO4 and Spent.A showed cumulative P losses totalling 5.0 and 5.9 mg P kg−1 soil, respectively. Bio-acidified slurry with H2SO4/Suc significantly increased the cumulative P losses compared to RS by 87%.
One of the main hypotheses of the present study was that surface application of (bio)-acidified slurry would enhance the leachability of P. The results confirm this hypothesis and further support the notion that acidified slurry promotes the dissolution of mineral-precipitated P [34]. Nevertheless, P dynamics do not solely depend on P speciation but also on the interaction of slurry P with soil particles [14]. Indeed, previous studies have demonstrated that acidification increases the labile inorganic P fraction in the slurry, which also makes it more susceptible to soil adsorption [12,35]. Rodrigues et al. [7] did not observe significant P leaching with acidified slurry applied to a sandy soil and discussed the possibility of greater P sorption under acidic conditions. In other studies, a decrease in P leaching was reported after soil application of acidified cattle and pig slurry [32]. However, the high slurry application rate (240 kg N ha−1) used in this study, may have exceeded the soil sorption capacity, resulting in high P losses.
The effects on P leaching of the two bio-acidified slurries, Suc and H2SO4/Suc, was notably different and the reason for such difference is not entirely clear. The addition of sucrose alone had no significant effect on P leaching relative to RS. Although the organic acids produced during bio-acidification reduced the slurry pH to 5.2 (Table S1), they appear less effective in mobilizing P for subsequent leaching. On the other hand, the immediate acidification achieved with H2SO4 upon application created an acidic environment in the slurry. The inclusion of a pre-acidification step with H2SO4 in the H2SO4/Suc treatment may have induced additional chemical interactions that account for the significantly higher P leaching observed.

3.3.4. Potential Leaching of Macronutrients

While our interest primarily lies in N and P leaching, other macronutrients are of great importance when BBFs are introduced to the soil. The decomposition of animal manures/slurries in the soil can result in the mineralization of slurry elements (e.g., Ca), which may later leach to deeper soil layers and reduce groundwater quality [36]. The use of additives to manipulate slurry’s pH usually enriches the slurry with macronutrients [5], although intense rainfall events may cause excess nutrient leaching.
The cumulative amounts of K and S leached are depicted in Table 3. All treatments caused a significant increase in the amount of total K leached compared to RS, with alkalinized slurry totalling 28.4 mg K kg−1 soil. This latter result was expected since slurry alkalinization to pH 9.5 occurred via the addition of KOH. In columns where alkalinized slurry was applied, 63 mg K were added through the KOH solution. Consequently, approximately 41% of the total K applied was leached accounting all four IEs. In contrast to our results, Rodrigues et al. [7] did not observe significant differences in K leaching between raw and alkalinized slurry with KOH in a sandy soil.
The potential leaching of S presented significant differences between treatments. Cumulative S losses in the H2SO4 and Spent.A treatments were nearly 10 and 12.7 times higher than in raw slurry, respectively. By combining H2SO4 with sucrose, the amount of S leached was reduced by 45% compared to the sole use of H2SO4. On the other hand, treatments that did not involve the addition of H2SO4 (KOH, Suc) exhibited S leaching similar to that of raw slurry. It is evident that the inclusion of H2SO4 or additives with elevated SO42− content, such as Spent.A (697 g SO42− L−1), significantly enhanced the leachability of S. Sulphate is a divalent anion that can be easily leached downwards through the soil profile due to weak binding with negatively charged soil colloids [35]. Similar to our work, the use of acidified cattle and pig slurry enhanced the leaching potential of S [32], even though a steady decrease was observed over time [7]. Previous studies also discussed the benefits of S supplementation in cattle slurry, particularly in S-responsive soils, where NO3 leaching was significantly reduced [37].

3.4. Agricultural Implications and Management Recommendations

The present study simulated a worst-case scenario (sandy soil, high slurry application rates, heavy rainfall events, absence of vegetation), conditions most representative of the closed spreading period at the end of the autumn-winter season. While these conditions allowed for a controlled assessment of nutrient and pathogen leaching, real-world field applications involve additional factors that can reduce nutrient losses. Active crop root uptake is one such factor. Adjusting slurry pH can facilitate faster nutrient absorption by plants due to greater nutrient solubility [38], effectively reducing the window of time during which nutrients are vulnerable to leaching, provided that an actively growing crop is present. In this regard, Nouri et al. [39] reported that cover cropping on sandy and sandy loam soils produced the greatest reductions in NO3 leaching among all textural classes, underlining that the leaching risks observed in the present study may be attenuated when crops are present in the field.
From a practical standpoint, farmers operating on sandy soils such as Haplic Arenosols should consider applying slurry at rates below the regulatory maximum, particularly during periods of high rainfall risk and in the absence of an actively growing crop. Split applications at lower rates could further reduce the instantaneous NH4+ load available for leaching while still meeting crop N demand. Overall, combining pH-adjusted slurry with well-timed spreading schedules and adequate vegetation cover could represent an effective integrated management strategy for minimizing nutrient losses and reducing the environmental footprint of slurry application on light-textured soils.

4. Conclusions

The present study assessed the vulnerability of sandy soils to nutrient and pathogen leaching following surface application of pH modified slurry. The findings confirmed both research hypotheses. First, slurry acidification increases the risk of nutrient leaching in sandy soils, though the magnitude and nutrient fraction affected depend strongly on the acidification method and additive used, highlighting that not all pH modification strategies carry the same environmental trade-offs. Second, sanitized slurry minimizes the risk of pathogen leaching, with most treated slurries producing leachates that meet the legal microbiological requirements for irrigation water reuse, though bio-acidification and alkalinization warrant further attention in this regard.
Overall, the results highlight that pH modification of slurry cannot be evaluated solely on its agronomic or hygienic benefits, as its interaction with soil texture and the associated leaching risk must also be considered. Sandy soils, given their low buffering capacity and rapid drainage, represent a particularly sensitive application context. Future research should explore how these dynamics translate to field-scale conditions, including the influence of soil texture, application timing, rainfall patterns, and crop nutrient uptake in mitigating leaching losses.

Supplementary Materials

The following supporting information can be downloaded at: https://www.mdpi.com/article/10.3390/agriculture16090973/s1, Table S1: Additives and dose used to modify the pH of pig slurry prior to soil application (means, n = 3); Table S2: Pairwise comparisons (contrast) of leachate pH between treatments for each irrigation event (IE) by variance analysis upon the linear mixed model (df = 54); Table S3: Pairwise comparisons (contrast) of leachate electrical conductivity (EC) between treatments for each irrigation event (IE) by variance analysis upon the linear mixed model (df = 46); Table S4: Pairwise comparisons (contrast) of nitrate content in the leachate between treatments for each irrigation event (IE) by variance analysis upon the linear mixed model (df = 46); Table S5: Pairwise comparisons (contrast) of ammonium content in the leachate between treatments for each irrigation event (IE) by variance analysis upon the linear mixed model (df = 46); Table S6: Pairwise comparisons (contrast) of phosphorus content in the leachate between treatments for each irrigation event (IE) by variance analysis upon the linear mixed model (df = 46).

Author Contributions

Conceptualization, D.F.; methodology, J.C., L.B. and D.F.; software, S.C. and M.M.; validation, J.C., L.B. and D.F.; formal analysis, J.C., L.B. and D.F.; investigation, S.C., A.C.S., L.B. and D.F.; resources, L.B. and D.F.; data curation, S.C., M.M. and D.F.; writing—original draft preparation, S.C.; writing—review and editing, S.C., J.C., A.C.S., L.B. and D.F.; visualization, S.C.; supervision, J.C., L.B. and D.F.; project administration, D.F.; funding acquisition, D.F. All authors have read and agreed to the published version of the manuscript.

Funding

This research was supported by the Ferticycle project funded by the European Union’s Horizon 2020 research and innovation programme under the Marie Sklodowska-Curie (grant agreement No 860127), by the project “Living Lab on Effluents and coproducts of the livestock activity” funded by PRR, PRR-C05-i03-I-000218-LA 5.1 and national funds through FCT—Fundação para a Ciência e a Tecnologia, I.P., under the projects UIDB/04129/2025 of LEAF-Linking Landscape, Environment, Agriculture and Food Research Unit and LA/P/0092/2020 of Associate Laboratory TERRA.

Data Availability Statement

Data that support the findings of the present work are available in the Mendeley Data repository at https://data.mendeley.com/drafts/ks4prkbxws (accessed on 17 April 2026).

Acknowledgments

The authors thank Miguel Martins and Maria João for their valuable technical assistance and support with laboratory work throughout the study.

Conflicts of Interest

The authors declare no conflicts of interest.

Abbreviations

The following abbreviations are used in this manuscript:
ANOVAAnalysis of variance
BBFBio-based fertilizers
CNTControl
CFUColony forming units
DWDry weight
ECElectrical conductivity
E. coliEscherichia coli
EUEuropean Union
H2SO4Slurry acidification to pH 5 with sulfuric acid
HSDHonest significant difference
IEIrrigation event
KOHSlurry alkalinization to pH 9.5 with potassium hydroxide
MPNMost probable number
NH4+Ammonium nitrogen
NO3Nitrate nitrogen
OMOrganic matter
PPhosphorus
RSRaw slurry
RTEReady-to-eat
SSulphur
SDStandard deviation
Spent.ABy-product spent acid; Sodium sulphate sulfuric acid solution
SucSlurry bio-acidification to pH 5 with addition of sucrose
WHCWater holding capacity

References

  1. OECD/FAO. OECD-FAO Agricultural Outlook 2023–2032; OECD Publishing: Paris, France, 2023. [Google Scholar] [CrossRef]
  2. Fangueiro, D.; Elmahdi, J.; Nyang’au, J.; Chrysanthopoulos, S.; De Vries, J.; Sørensen, P. Optimizing Slurry Management; Burleigh Dodds Science Publishing Limited: Cambridge, UK, 2024; pp. 107–140. [Google Scholar] [CrossRef]
  3. Köninger, J.; Lugato, E.; Panagos, P.; Kochupillai, M.; Orgiazzi, A.; Briones, M.J.I. Manure management and soil biodiversity: Towards more sustainable food systems in the EU. Agric. Syst. 2021, 194, 103251. [Google Scholar] [CrossRef]
  4. Prado, J.; Alvarenga, P.; Ribeiro, H.; Fangueiro, D. Nutrient Potential Leachability in a Sandy Soil Amended with Manure-Based Fertilisers. Agronomy 2023, 13, 990. [Google Scholar] [CrossRef]
  5. Chrysanthopoulos, S.; Coutinho, J.; Silva, A.C.; Brito, L.; Fangueiro, D. Agro-industrial by-products as alternative additives for the agronomic valorization of pig slurry through pH modification. J. Clean. Prod. 2024, 434, 140052. [Google Scholar] [CrossRef]
  6. Amin, M.G.M.; Forslund, A.; Bui, X.T.; Juhler, R.K.; Petersen, S.O.; Lægdsmand, M. Persistence and Leaching Potential of Microorganisms and Mineral N in Animal Manure Applied to Intact Soil Columns. Appl. Environ. Microbiol. 2013, 79, 535–542. [Google Scholar] [CrossRef] [PubMed]
  7. Rodrigues, J.; Fragoso, R.; Brito, L.; Fangueiro, D. Impact of Sandy Soil Amendment with Dairy Slurry Treated through pH Adjustment on Nutrient and Coliform Leaching. Agronomy 2023, 13, 1176. [Google Scholar] [CrossRef]
  8. van Elsas, J.D.; Semenov, A.V.; Costa, R.; Trevors, J.T. Survival of Escherichia coli in the environment: Fundamental and public health aspects. ISME J. 2011, 5, 173–183. [Google Scholar] [CrossRef]
  9. Cools, D.; Merckx, R.; Vlassak, K.; Verhaegen, J. Survival of E. coli and Enterococcus spp. derived from pig slurry in soils of different texture. Appl. Soil Ecol. 2001, 17, 53–62. [Google Scholar] [CrossRef]
  10. Semenov, A.V.; van Overbeek, L.; van Bruggen, A.H.C. Percolation and Survival of Escherichia coli O157:H7 and Salmonella enterica Serovar Typhimurium in Soil Amended with Contaminated Dairy Manure or Slurry. Appl. Environ. Microbiol. 2009, 75, 3206–3215. [Google Scholar] [CrossRef] [PubMed]
  11. Rodrigues, J.; Alvarenga, P.; Silva, A.C.; Brito, L.; Tavares, J.; Fangueiro, D. Animal Slurry Sanitization through pH Adjustment: Process Optimization and Impact on Slurry Characteristics. Agronomy 2021, 11, 517. [Google Scholar] [CrossRef]
  12. Fangueiro, D.; Hjorth, M.; Gioelli, F. Acidification of animal slurry—A review. J. Environ. Manag. 2015, 149, 46–56. [Google Scholar] [CrossRef]
  13. Fangueiro, D.; Surgy, S.; Napier, V.; Menaia, J.; Vasconcelos, E.; Coutinho, J. Impact of slurry management strategies on potential leaching of nutrients and pathogens in a sandy soil amended with cattle slurry. J. Environ. Manag. 2014, 146, 198–205. [Google Scholar] [CrossRef]
  14. Li, Y.; Jones, D.L.; Chen, Q.; Ge, T.; Chadwick, D.R. Acidification and anaerobic digestion change the phosphorus forms and distribution in particle fractions of cattle slurry and phosphorus dynamics in soil after application. Biosyst. Eng. 2020, 200, 101–111. [Google Scholar] [CrossRef]
  15. Rashmi, I.; Biswas, A.K.; Kartika, K.S.; Kala, S. Phosphorus leaching through column study to evaluate P movement and vertical distribution in black, red and alluvial soils of India. J. Saudi Soc. Agric. Sci. 2020, 19, 241–248. [Google Scholar] [CrossRef]
  16. Skwierawska, M.; Zawartka, L.; Zawadzki, B. The effect of different rates and forms of sulphur applied on changes of soil agrochemical properties. Plant Soil Environ. 2008, 54, 171–177. [Google Scholar] [CrossRef]
  17. Kavanagh, I.; Fenton, O.; Healy, M.G.; Burchill, W.; Lanigan, G.J.; Krol, D.J. Mitigating ammonia and greenhouse gas emissions from stored cattle slurry using agricultural waste, commercially available products and a chemical acidifier. J. Clean. Prod. 2021, 294, 126251. [Google Scholar] [CrossRef]
  18. Mendes, C.V.T.; Rocha, J.M.S.; Carvalho, M.G.V.S. Valorization of Residual Streams from Pulp and Paper Mills: Pretreatment and Bioconversion of Primary Sludge to Bioethanol. Ind. Eng. Chem. Res. 2014, 53, 19398–19404. [Google Scholar] [CrossRef]
  19. Regueiro, I.; Gómez-Muñoz, B.; Lübeck, M.; Hjorth, M.; Jensen, L.S. Bio-acidification of animal slurry: Efficiency, stability and the mechanisms involved. Bioresour. Technol. Rep. 2022, 19, 101135. [Google Scholar] [CrossRef]
  20. Despacho n.o 1230/2018|DRE. Available online: https://dre.pt/dre/detalhe/despacho/1230-2018-114627305 (accessed on 23 July 2024).
  21. ISO 6579-1:2017; Microbiology of the Food Chain—Horizontal Method for the Detection, Enumeration and Serotyping of Salmonella—Part 1: Detection of Salmonella spp. ISO: Geneva, Switzerland, 2017. Available online: https://www.iso.org/cms/render/live/en/sites/isoorg/contents/data/standard/05/67/56712.html (accessed on 6 February 2026).
  22. ISO 16649-2:2001; Microbiology of Food and Animal Feeding Stuffs—Horizontal Method for the Enumeration of Beta-Glucuronidase-Positive Escherichia coli—Part 2: Colony-Count Technique at 44 degrees C Using 5-bromo-4-chloro-3-indolyl beta-D-glucuronide. ISO: Geneva, Switzerland, 2001. Available online: https://www.iso.org/standard/29824.html (accessed on 5 February 2026).
  23. Regulation (EU) 2019/1009, of the European Parliament and of the Council of 5 June 2019 Laying Down Rules on the Making Available on the Market of EU Fertilising Products and Amending Regulations (EC) No 1069/2009 and (EC) No 1107/2009 and repealing Regulation (EC) No 2003/2003. OJ 170. Available online: http://data.europa.eu/eli/reg/2019/1009/oj (accessed on 17 April 2026).
  24. Posit Team. RStudio: Integrated Development Environment for R [Computer Software], Version 2025.05.0+496; Posit PBC: Boston, MA, USA, 2025. Available online: https://www.posit.co/ (accessed on 17 April 2026).
  25. Moradi, F.; Amirinejad, A.A.; Ranjbar, F. Impacts of Different Amendments and Water Qualities on Soluble and Exchangeable Phases and Hydraulic Conductivity of a Calcareous Soil. Int. J. Environ. Res. 2024, 18, 46. [Google Scholar] [CrossRef]
  26. Pham, N.Q.; Nguyen, G.T. Evaluating Groundwater Quality Using Multivariate Statistical Analysis and Groundwater Quality Index. Civ. Eng. J. 2024, 10, 699–713. [Google Scholar] [CrossRef]
  27. Dewangan, S.K.; Toppo, D.N.; Kujur, A. Investigating the Impact of pH Levels on Water Quality: An Experimental Approach. Int. J. Res. Appl. Sci. Eng. Technol. 2023, 11, 756–759. [Google Scholar] [CrossRef]
  28. Wang, F.L.; Alva, A.K. Ammonium Adsorption and Desorption in Sandy Soils. Soil Sci. Soc. Am. J. 2000, 64, 1669–1674. [Google Scholar] [CrossRef]
  29. Fangueiro, D.; Surgy, S.; Coutinho, J.; Vasconcelos, E. Impact of cattle slurry acidification on carbon and nitrogen dynamics during storage and after soil incorporation. J. Plant Nutr. Soil Sci. 2013, 176, 540–550. [Google Scholar] [CrossRef]
  30. Zireeni, Y.; Jones, D.L.; Chadwick, D.R. Influence of slurry acidification with H2SO4 on soil pH, N, P, S, and C dynamics: Incubation experiment. Environ. Adv. 2023, 14, 100447. [Google Scholar] [CrossRef]
  31. Esteves, C.; Fangueiro, D.; Martins, M.; Ribeiro, H. Phosphorus-Based Variable-Rate Pig Slurry Application Reduces Greenhouse Gas Emissions and Improves Phosphorus Plant Availability. J. Sustain. Agric. Environ. 2025, 4, e70037. [Google Scholar] [CrossRef]
  32. O’Flynn, C.J.; Healy, M.G.; Lanigan, G.J.; Troy, S.M.; Somers, C.; Fenton, O. Impact of chemically amended pig slurry on greenhouse gas emissions, soil properties and leachate. J. Environ. Manag. 2013, 128, 690–698. [Google Scholar] [CrossRef]
  33. Loide, V.; Saue, T.; Võsa, T.; Tamm, K. The effect of acidified slurry on crop uptake and leaching of nutrients from a loamy topsoil. Acta Agric. Scand. Sect. B—Soil Plant Sci. 2020, 70, 31–38. [Google Scholar] [CrossRef]
  34. Güngör, K.; Jürgensen, A.; Karthikeyan, K.G. Determination of Phosphorus Speciation in Dairy Manure using XRD and XANES Spectroscopy. J. Environ. Qual. 2007, 36, 1856–1863. [Google Scholar] [CrossRef] [PubMed]
  35. Sommer, S.G.; Hjorth, M.; Leahy, J.J.; Zhu, K.; Christel, W.; Sørensen, C.G.; Sutaryo. Pig slurry characteristics, nutrient balance and biogas production as affected by separation and acidification. J. Agric. Sci. 2015, 153, 177–191. [Google Scholar] [CrossRef]
  36. Tripolskaja, L.; Baksiene, E.; Razukas, A.; Sidlauskas, G. How Organic Fertilizers Change Chemical Element Leaching: A Summary of the Lysimeter Studies in Lithuania, 1987–2014. Pol. J. Environ. Stud. 2016, 25, 2589–2599. [Google Scholar] [CrossRef]
  37. Aspel, C.; Murphy, P.N.C.; McLaughlin, M.J.; Forrestal, P.J. Sulfur fertilization strategy affects grass yield, nitrogen uptake, and nitrate leaching: A field lysimeter study. J. Plant Nutr. Soil Sci. 2022, 185, 209–220. [Google Scholar] [CrossRef]
  38. Pedersen, I.F.; Rubæk, G.H.; Sørensen, P. Cattle slurry acidification and application method can improve initial phosphorus availability for maize. Plant Soil 2017, 414, 143–158. [Google Scholar] [CrossRef]
  39. Nouri, A.; Lukas, S.; Singh, S.; Singh, S.; Machado, S. When do cover crops reduce nitrate leaching? A global meta-analysis. Glob. Change Biol. 2022, 28, 4736–4749. [Google Scholar] [CrossRef] [PubMed]
Figure 1. pH (A) and electrical conductivity (B) of the leachates obtained during the four irrigation events, over the 24-day period. Error bars represent the standard error of the mean (n = 3).
Agriculture 16 00973 g001
Figure 2. Potential leachability of faecal coliforms during the four leaching events after surface application of raw and treated slurry. Error bars represent the standard error of the mean (n = 3). The horizontal dashed line represents the maximum threshold for faecal coliforms per 100 mL irrigation water. All treatments resulted in slurry sanitization (Table S1).
Agriculture 16 00973 g002
Figure 3. Ammonium (A) and nitrate (B) leached during the four irrigation events, over the 24-day period (mean, n = 3). Results are expressed as percentage of total nitrogen applied to the soil. Error bars represent the standard error of the mean at each irrigation event.
Agriculture 16 00973 g003
Figure 4. Phosphorus leached during the four irrigation events, over the 24-day period (mean, n = 3). Results are expressed as percentage of total phosphorus applied to the soil. Error bars represent the standard error of the mean at each irrigation event.
Agriculture 16 00973 g004
Table 1. Selected physicochemical and microbiological properties of the raw slurry used in the experiment (mean ± SD, n = 3).
CharacteristicUnitValue
pH (H2O)-7.2 ± 0.1
ConductivitymS cm−120.8 ± 0.1
Dry matterg kg−125.5 ± 1.3
Organic matterg kg−1 (DW)638.8 ± 14.1
Total Ng kg−1 (DW)131.5 ± 4.1
NH4+g kg−1 (DW)98.0 ± 5.1
Total Pg kg−1 (DW)23.9 ± 2.5
Total Kg kg−1 (DW)47.0 ± 3.6
Total Sg kg−1 (DW)10.2 ± 0.9
E. coliCFU g−1 slurry1.8 × 104
Salmonellain 25 g of slurryNot detected
E. coli: Escherichia coli; CFU: colony forming units; DW: dry weight basis.
Table 2. Total leachate volume collected during each irrigation event (mean ± SD, n = 3).
Treatments Leachate Volume Collected (mL)
IE_1IE_2IE_3IE_4
CNT296.2 ± 12269.6 ± 9253.6 ± 8248.9 ± 9
RS284.5 ± 9261.0 ± 6242.3 ± 5236.0 ± 6
H2SO4288.9 ± 7269.8 ± 1246.8 ± 4240.0 ± 3
Spent.A299.8 ± 23259.6 ± 15247.3 ± 5242.3 ± 5
KOH297.3 ± 20267.7 ± 8245.3 ± 6239.9 ± 7
Suc279.4 ± 11258.7 ± 13232.6 ± 2234.8 ± 12
H2SO4/Suc297.3 ± 10235.4 ± 11280.2 ± 5229.6 ± 10
IE: irrigation event; CNT: control; RS: raw slurry; H2SO4: slurry acidification to pH 5 with sulphuric acid; Spent.A: slurry acidification to pH 5 with the by-product spent acid; KOH: slurry alkalinization to pH 9.5 with potassium hydroxide; Suc: slurry bio-acidification to pH 5 with addition of sucrose (30 g kg−1 slurry); H2SO4/Suc: slurry pre-acidification to pH 6 with sulphuric acid followed by sucrose addition (20 g kg−1 slurry).
Table 3. Cumulative amount of nutrients leached during the four irrigation events (mean, n = 3; absolute values expressed in mass of the element per kg of soil).
TreatmentNH4+
(mg kg−1 Soil)
NO3
(mg kg−1 Soil)
Mineral N
(%TN Applied)
P
(mg kg−1 Soil)
P
(%TP Applied)
K
(mg kg−1 Soil)
K
(% Total K Applied)
S
(mg kg−1 Soil)
S
(% Total S Applied)
CNT1.2 E3.0 B-0.7 a-3.2 D-1.8 F-
RS17.6 C11.9 A29.53.4 b18.111.1 D26.27.7 D90.2
H2SO429.6 A2.7 BC32.85.0 c28.319.6 C54.677.0 B101.8
Spent.A30.1 A2.2 CD32.95.9 cd34.124.9 AB71.9112.8 A36.9
KOH18.2 C6.2 A23.73.4 b18.128.4 A25.07.8 D91.9
Suc22.9 B1.3 D23.43.1 b16.020.9 C58.66.3 E69.8
H2SO4/Suc7.9 D4.1 B9.16.4 d37.725.1 B72.642.3 C97.4
In each column, mean values with different lowercase letters are significantly different based on Tukey HSD test (p < 0.05). Mean values with different uppercase letters are significantly different based on Fishers LSD test (p < 0.05).
Disclaimer/Publisher’s Note: The statements, opinions and data contained in all publications are solely those of the individual author(s) and contributor(s) and not of MDPI and/or the editor(s). MDPI and/or the editor(s) disclaim responsibility for any injury to people or property resulting from any ideas, methods, instructions or products referred to in the content.