


Abstract
National modern agricultural industrial parks are the core carriers for promoting agricultural modernization. Clarifying their spatial differentiation patterns is of great significance for revealing the efficiency of resource allocation and promoting coordinated regional development. Based on the data from 338 national modern agricultural industrial parks in China, this study uses methods such as the nearest neighbor index, Voronoi spatial statistics, and spatial autocorrelation to identify their spatial distribution characteristics, and adopts the XGBoost–SHAP model to explore the nonlinear effects of driving factors. The research found the following: (1) The parks exhibit a distinct “sparse west–concentrated middle–dense east” agglomeration pattern aligned with China’s Hu Huanyong Line agro–economic divide. (2) At the municipal level, four high-density cores emerged in central-eastern regions with “dual hot spots–gradient diffusion” characteristics. (3) Farmers’ professional cooperatives and transportation accessibility are the most consistent fundamental driving elements, reflecting the transition of the development momentum of contemporary agriculture from “resource dependency” to “circulation dependence.” Heterogeneity analysis shows elevation, cooperatives and rural income differentially drive agglomeration across regions, with elevation constituting a universal constraint. (4) While regional development and mechanization show adaptive synergy, excessive urbanization generates a distinct “non–agriculturalization” crowding–out effect on agricultural development.
1. Introduction
Fostering agricultural industrial agglomeration is an important measure for fostering sustainable agricultural growth and improving agricultural modernization [1]. However, the agricultural business continues to face challenges such as uneven resource allocation, low degrees of industrial integration, and limited regional coordinating skills [2]. From international experience, Europe and the United States have developed diversified agglomeration models represented by ecological agricultural parks [3], agricultural science and technology parks [4], and agritourism farms [5]. Southeast Asia mainly relies on agricultural parks and comprehensive agricultural development zones [6], while Latin America has established agricultural innovation parks through agribusinesses [7]. Nevertheless, most of these models are driven primarily by spontaneous market evolution. Their functional positioning focuses on production technology demonstration, eco-tourism experience, or single-industry cultivation, and generally lacks top-down coordinated planning. Faced with structural challenges in domestic agricultural development, China established national modern agricultural industrial parks (hereinafter referred to as “industrial parks”) in 2017, advocating the integration of modern production factors such as policies, funds, and technologies based on large-scale farming and breeding bases to form multifunctional modern agricultural development clusters [8]. Unlike traditional agricultural industrial agglomeration, the core concept of industrial parks is to ensure that farmers fully benefit from them. Through policy guidance, a multi-level system of industrial parks has been established at the national, provincial, municipal, and county levels, thereby maximizing their demonstration and leading roles and advancing the modernization of agriculture and rural areas [9]. Up to 2021, the industrial park had an average annual output value of more than 8 billion yuan, attracting 1766 leading enterprises at the provincial level or higher and generating 382.8 billion yuan in social capital investment [10]. These parks have effectively addressed issues such as the fragmentation of agricultural production and inefficiencies in the industrial chain, becoming a core driver for advancing rural revitalization and agricultural modernization. However, in practice, the distribution of industrial parks is clearly imbalanced, resulting in variations in radiating effects between regions and reducing the momentum for coordinated industrial park development [9]. As a result, understanding the spatial distribution pattern and driving variables of industrial parks is critical for addressing uneven industrial development and increasing overall efficiency.
Existing studies on industrial parks mainly focus on single regions or individual parks, covering construction status [10], operation modes [11] and institutional mechanisms [12], and evaluate effectiveness based on farmer linkage and industrial agglomeration effects [13]. However, few studies have conducted an in-depth investigation of the spatial distribution patterns of industrial parks and their internal driving forces, resulting in a lack of systematic understanding and grasp of the mechanisms that drive the establishment of these parks. Neoclassical economics has long emphasized the phenomenon of industrial spatial agglomeration, arguing that it can generate externalities through labor sharing, industrial collaboration, and knowledge spillovers, lowering corporate costs and increasing regional competitiveness [14]. Following that, new economic geography theory revealed how economies of scale and transportation costs shape the spatial distribution of industries, emphasizing the importance of regional advantages for industrial agglomeration and offering a new theoretical perspective on industrial agglomeration’s spatial layout [15]. Industrial parks have arisen as a prominent topic of academic research as the agriculture industry evolves towards larger-scale operations. Scholars are increasingly interested in the spatiotemporal patterns of agricultural industry development and the mechanisms underlying these changes. From a spatial perspective, China’s agricultural business as a whole shows regional disparities, with dense concentration in the east and sparse distribution in the west [16], but the primary grain production pattern shows a progressive drop from southeast to northwest [17]. On the other hand, as the primary driver of industrialization, the majority of leading agricultural enterprises are concentrated in the central and eastern provinces, which have a solid industrial foundation and a developed market [18], and the layouts of some agribusiness enterprises exhibit polycentric and gradient evolution characteristics [1]. The structure and degree of regional agricultural economic growth have been significantly influenced by the spatial differentiation of agricultural industries and enterprises. Furthermore, scientists have employed qualitative comparative analysis [19], geographic detector [20], and weighted TOPSIS [13] to examine driving elements such as institutional safeguards, infrastructure, and commercial entities. They discovered that transportation circumstances, institutional contexts, and leading agricultural companies minimize the cost of agricultural product distribution while establishing policy planning to govern the layout of the agricultural product sector. Although previous research on the driving mechanisms of the agricultural industry has created a foundation, it primarily employs static or linear techniques, ignoring the complex nonlinear relationship between industrial development and environmental variables. Machine learning methods, on the other hand, can address nonlinear complexity more effectively. Extreme Gradient Boosting (XGBoost), a type of machine learning model, has been shown to accurately capture the complicated interaction between drivers when combined with the Shapley additive interpretation (SHAP) method. This efficiently addresses interpretability difficulties with driving factors and sample objects [21]. Furthermore, while the XGBoost–SHAP model has been used in a variety of domains, including ecology and medicine, it is still uncommon to use it to assess industrial agglomeration spatially [22].
There is a major imbalance in agricultural industrial development, regional discrepancies in agglomeration and development, and a lack of comprehensive research on dynamic evolution patterns and impact mechanisms. This study will investigate industrial parks at the national city-region scale. The study will introduce the XGBoost–SHAP analysis model to focus on multi-factor nonlinear interactions and interactive driving mechanisms through an in-depth investigation of the spatio-temporal differentiation characteristics of industrial parks. The goal is to overcome the constraints of previous research, which frequently depends on simple linear relationships, and to understand the spatial differentiation patterns and underlying driving mechanisms by addressing the following two issues: (1) the spatial distribution patterns and characteristics of industrial parks; (2) the core driving factors of agricultural industrial parks, and the interactions among mechanisms including institutional guidance, network synergy and factor agglomeration, as well as their joint role in shaping the spatial agglomeration pattern. This is designed to offer scientific support for improving the spatial layout of industrial parks and increasing industrial agglomeration efficiency, as well as to infuse theoretical and practical momentum into the high-quality advancement of agricultural modernization.
2. Data Sources and Research Methods
2.1. Data Source
The data on industrial parks is sourced from the list of nationally recognized modern agricultural industrial parks published by the Ministry of Agriculture and Rural Affairs of China (https://www.moa.gov.cn/) starting in 2017. The specific numbers are as follows: 41 were established in two batches in 2017, 21 were added in 2018, 45 were established on a large scale in 2019, 31 were established in 2020, 50 were established in each of 2021, 2022, and 2023, and 50 were added in 2024. All of the above represent the number of parks announced in each respective year (i.e., annual new additions, not cumulative stock), totaling 338 parks. The industrial park fully incorporates a unique industrial model with regional demonstration value, thereby encouraging regional agricultural development and furthering agricultural modernization. As a result, the research samples for this study included 338 national modern agricultural industrial parks. To determine the spatial geographical position of each industrial park, relevant planning and construction papers were searched for, as well as the location of the core area at the prefecture-level city and the individual leading unit. We used Baidu’s coordinate picking system (http://api.map.baidu.com/) to obtain geographic coordinate information, and then employed a GIS data converter to convert Baidu BD09 coordinates to WGS84 coordinates, vectorizing their spatial positions to create a spatial database for the industrial park. The relevant factor indicators influencing the formation and distribution of industrial parks primarily originate from China’s National Bureau of Statistics website (https://www.stats.gov.cn/), the China Rural Statistical Yearbook, the China Urban Statistical Yearbook and the China Regional Economic Statistical Yearbook. The elevation data were obtained from the Geospatial Data Cloud Platform (http://www.gscloud.cn), and the rainfall data were obtained from the China 1 km resolution monthly precipitation data set of the National Tibetan Plateau Scientific Data Center (http://data.tpdc.ac.cn). Missing data were mainly supplemented from local statistical yearbooks or public reports, covering 2017–2023. (Due to the publication lag of 2024 data and the fact that industrial park decisions rely on prior resource endowments, industry foundations, and policy environments, this study uses 2017–2023 driving factors to explain the parks’ spatial distribution.) In summary, after identifying spatial patterns using Voronoi, kernel density, and spatial autocorrelation methods, we incorporate relevant driving factors into the XGBoost–SHAP model to reveal the underlying causes of the parks’ spatial distribution. Figure 1 shows the research framework.
Figure 1.
Flow chart of this study.
2.2. Theoretical Foundation
Industrial agglomeration theory elucidates the phenomenon that enterprises tend to concentrate in specific geographical spaces and jointly foster local competitive advantages through interconnection and collaboration [23]. The theory traces its origin to the external economy theory proposed by Marshall, who argued that enterprises’ pursuit of external economies of scale constitutes the primary driver of industrial agglomeration. Labor market pooling, shared intermediate inputs, and knowledge spillovers are identified as the core factors influencing the locational choice of industrial agglomeration [24,25]. Subsequently, scholars incorporated increasing returns to scale, transport costs and factor mobility into the general equilibrium analytical framework, thus developing the New Economic Geography (NEG), which systematically integrates the endogenous formation mechanisms of industrial agglomeration [26]. From the perspective of Marshall’s external economy theory, factor agglomeration and infrastructure sharing can promote the industrial division of labor; labor agglomeration endows enterprises with a more stable division of labor structure, while knowledge spillovers diffuse advanced production technologies to surrounding areas. These factors collectively facilitate the formation of regional economies of scale [1]. Industrial agglomeration in agriculture differs distinctly from that in industry. The former is heavily constrained by the spatial heterogeneity of natural resources, while simultaneously confronting multiple challenges, including transportation infrastructure, production cycles and geographical location [27,28]. Accordingly, the agglomeration effects of agricultural industrial parks are reflected not only in the centralized allocation of production factors and the improvement in production efficiency, but also in the realization of radiation and inclusiveness for surrounding farmers through industrial chain extension, the diffusion of technological innovation, and the organizational driving role of new-type agricultural business entities.
2.3. Indicator Selection
Based on industrial agglomeration theory, agricultural industrial parks represent 0the concrete spatial manifestation of highly concentrated agricultural industries, whose formation and development rely on the combined effects of multiple mechanisms, including factor agglomeration, knowledge spillovers, network synergy and institutional guidance [1]. Among these mechanisms, factor agglomeration is characterized by the spatial centralized allocation of production factors including land, capital and labor, which lays the scale foundation for industrial agglomeration [29,30,31]. On this basis, geographical proximity further promotes inter-industry regional linkages and resource sharing, forming the core content of the network synergy mechanism [32]. Distinct from other types of industrial agglomeration effects, industrial parks generate spillover effects on surrounding rural households through agricultural product markets and innovative outputs, and achieve spatial diffusion via market transmission [10]. In addition, as a policy-driven form of industrial concentration, the development of agricultural industrial parks cannot be separated from policy guidance. The participation of new-type agricultural business entities helps to promote the targeted guidance of policies for industrial agglomeration [13]. In this process, natural resource endowment, as a fundamental constraint, has always been a key external factor influencing agricultural industrial agglomeration [28]. These mechanisms collectively constitute the industrial agglomeration effects of agricultural industrial parks. Accordingly, based on the availability and measurability of data, this study, on the basis of sorting out the relevant literature, the internal causes of the spatial differentiation of agricultural industrial parks are analyzed from five dimensions (12 indicators in total), namely natural conditions, construction foundation, geographical location, support and guarantee, and linking and leading farmers (linking farming enterprises with smallholder farmers, i.e., benefit linkage mechanisms) (as shown in Table 1).
Table 1.
Indicators of driving factors for the spatial distribution of industrial parks.
2.4. Research Methods
2.4.1. Nearest Neighbor Index
The nearest neighbor index can determine the spatial distribution characteristics of data by calculating the characteristics of spatially distributed points [36] as follows:
In the formula, is the nearest neighbor index, is the average nearest distance, is the average theoretical nearest distance, and is the number of industrial parks in the study area. When < 1, the points in the study area are clustered. When > 1, the points in the study area are uniformly distributed, and when = 1, they are randomly distributed.
2.4.2. CV Values Based on Voronoi Polygons
The coefficient of variation (CV) is a standardized measure of data dispersion. The distribution type of sampling points is estimated by the CV value of the area. The CV value is the ratio of the standard deviation to the mean of the Thyssen area, and is used to measure data dispersion [37]. This study uses the Voronoi polygon analysis method to calculate the relative degree of spatial change in industrial parks. The specific scope of judgment is as follows: when the CV value is less than 33%, the spatial distribution type is uniform distribution; when the CV value is between 33% and 64%, the spatial distribution type is random distribution; when the CV value is greater than 64%, the spatial distribution type is clustered distribution [38].
2.4.3. Nuclear Density Estimation
Nuclear density estimation converts the spatial distribution of discrete sampling points into a continuous density curve surface. Examining the regional spatial changes in sample point density reflects the distribution characteristics of the samples and can intuitively reflect the degree of industrial park agglomeration [39]. The nuclear density calculation formula is as follows:
The formula shows the the kernel density estimate value; h represents the bandwidth, represents the coordinate position of the i industrial parks, and is the threshold of the kernel function sum. The larger the kernel density value, the more concentrated the spatial distribution of the industrial parks.
2.4.4. Spatial Autocorrelation Analysis
Spatial autocorrelation analysis is divided into global spatial autocorrelation and local spatial autocorrelation [40]. First, global Moran’s I is a statistical method used to analyze the autocorrelation of spatial data [41]. Global Moran’s I is used to analyze the spatial autocorrelation of industrial parks in each region. The specific calculation formula is as follows:
In the formula, and respectively represent the observed values of the industrial parks in prefecture-level cities and . n represents the number of prefecture-level cities where the industrial park is located. represents the spatial weight matrix. Moran’s I has the range [−1,1]. A positive value indicates strong positive spatial autocorrelation, an equal to 0 indicates random mode, and a negative value indicates strong negative spatial autocorrelation.
Secondly, the Getis–Ord Gi* method is used to identify the degree of concentration of values in geospatial data, and regional visualization is used to present specific “hot spots” and “cold spots” [42].
In the formula, represents the local spatial association index. represents the spatial weight matrix. If it is significantly positive, this indicates that the area is a hot spot area, reflecting a high degree of spatial aggregation. Otherwise, is negative, indicating a cold spot area, reflecting a low degree of spatial aggregation.
2.4.5. XGBoost–SHAP Model
Traditional linear regression models (e.g., OLS) rely on the assumption of constant marginal effects, rendering them inadequate for capturing the complex nonlinear relationships prevalent in reality [43]. To identify nonlinear variations and interaction effects among variables, this study adopts the XGBoost–SHAP framework. As a gradient boosting ensemble learning algorithm, XGBoost is capable of automatically detecting nonlinear dependencies and high-order interactions among variables. Concurrently, integrating the SHAP framework for model interpretation enables the mitigation of the inherent “black box” problem associated with complex machine learning models, while maintaining high predictive accuracy [44]. The mathematical formula for the XGBoost algorithm is as follows:
The XGboost objective function includes a loss function and a regularization term. The loss function measures the error between the model’s predicted values and the actual values, while regularization controls the complexity of the decision tree to prevent the model from overfitting. The formula for the XGBoost objective function is as follows:
Complex models such as XGBoost and neural network models are opaque in their predictions and are collectively referred to as black box models [45]. In contrast to conventional black-box machine learning methods, SHAP is built upon the “Shapley value” in game theory. It can quantify the specific contribution of each individual feature to model prediction outputs, thereby enabling interpretability at both global and local scales [46]. To explain the model prediction results, the SHAP model measures the SHAP values of each feature variable using the following formula:
In the formula: represents the result of the prediction model. is the predicted average value of all training samples. represents the attribution value of each feature, and the SHAP value is calculated using the following formula:
In the formula, represents the SHAP value of feature . N represents the set of all feature variables. represents a subset of N features. M is the total number of feature variables. is the marginal contribution of adding feature variable to subset .
3. Spatial Differentiation and Analysis of Driving Factors
3.1. Spatial Differentiation Pattern of Industrial Parks
3.1.1. Overall Spatial Distribution Characteristics
The overall distribution pattern of industrial parks varies significantly by region (refer to Figure 2). Based on the topography gradient and economic development level disparities from west to east in China, each region has established a distinct industrial structure: The eastern region has entered the post-industrialization stage, characterized by an innovation-driven and service-oriented economy with a prominent sophisticated industrial structure. The central region, as a national grain and heavy industry base, is facing a critical time of “quality improvement and upgrading” toward advanced manufacturing and contemporary agriculture. The western part of China, limited by natural and historical limitations, retains considerable resource dependence and traditional agricultural traits [47]. Based on this classification standard [47], this article divides China into three major regions: the eastern region, the central region and the western region. The eastern region includes 11 provinces, such as Beijing, Tianjin and Hebei. The central region includes eight provinces, such as Shanxi, Jilin and Heilongjiang. The western region includes 12 provinces, such as Inner Mongolia, Ningxia and Qinghai. The 338 industrial parks present a geographical distribution pattern of “sparse in the west, concentrated in the middle, and dense in the east,” which is aligned with the spatial divide defined by the “Hu Line.” The industrial parks are mainly distributed on the eastern side of the “Hu Line.” This is mainly because the area east of the “Hu Line” features a high population concentration, a large market scale [48], abundant agricultural resources, and sound infrastructure, which provide favorable conditions for industrial agglomeration. The eastern, central, and western regions host 110, 98, and 130 industrial parks respectively. In terms of specific forms, the eastern region is primarily evenly dispersed along transportation arteries and municipal units, displaying a pattern of “small agglomeration and large dispersion.” The central region industrial parks, centered on cities in Henan and Anhui, extends to the key wheat-producing areas in southern Henan and the main rice-producing areas in the Jianghan Plain. There are only a few economic active zones in the western region, such as the Sichuan Basin, Guanzhong Plain, and the Northern Slope of Tianshan Mountain, as well as a few industrial parks in most plateau and desert regions. There is a “punctate agglomeration in the core zone, and sparse in the periphery” in space, which reflects the restriction of the wide territory and unequal economic development in the western region on the industrial layout. Second, based on the 375 cities in the country, the number of industrial parks may be divided into five categories. Chongqing has the highest number and is identified as a high-value area. Cities such as Beijing, Tianjin, and Jiamusi belong to the medium-value category. The remaining cities are designated as low-value, relatively low, and blank areas, respectively. This pattern aligns closely with the “Seven Zones and Twenty-Three Belts” agricultural layout promoted under the national strategy during the “13th Five–Year Plan” period. As a strategic node linking the Yangtze River Economic Belt and the New Western Land–Sea Corridor, Chongqing has leveraged its policy advantages and diverse agricultural conditions to facilitate the agglomeration and growth of industrial parks. In contrast, regions such as Jiamusi, situated within the major grain-producing Northeast Plain, primarily function to ensure national food security. Conversely, areas with low concentration or absence of industrial parks are largely found in western China. Due to constraints such as adverse natural conditions, underdeveloped industrial foundations, and limited resource endowments, these regions struggle to develop modern agricultural clusters, thereby exacerbating regional functional disparities within the “Seven Zones and Twenty–Three Belts” framework, particularly between central and western areas.
Figure 2.
Spatial distribution of industrial parks. Note: This map is based on the standard map approved by the Ministry of Natural Resources with drawing number GS(2024) 0650, and the base map has not been modified. The same applies below.
Furthermore, the spatial distribution of industrial parks was analyzed using the average nearest neighbor index. The findings revealed that the average observation distance was 87.98 km, the expected average distance was 105.43 km, the nearest neighbor ratio was 0.83, and the p–value was 0. The significance test revealed that the industrial park as a whole had a coherent distribution. Furthermore, the Voronoi polygon coefficient of variation (CV) was employed to validate the nearest neighbor index results. The CV of the Voronoi polygon for the industrial park was determined to be 184.63%, greatly above 64% [38], demonstrating that the industrial park’s distribution features are clustered (see Figure 3).
Figure 3.
Industrial Park Voronoi polygon.
3.1.2. Spatial Distribution Density Characteristics
Nuclear density is used to assess the degree of spatial agglomeration in industrial parks. An investigation of the nuclear density of industrial parks (as illustrated in Figure 4) reveals that the spatial distribution of industrial parks includes four high-density core regions. The core density values in these areas range from 1.147 to 1.863 per 10,000 square kilometers, and include the Sichuan–Chongqing border agglomeration area, the Zhejiang–Jiangsu–Anhui border agglomeration area, the Beijing–Hebei–Shandong border agglomeration area, and the Shaanxi–Shanxi border agglomeration area. These four core areas, relying on their technological, capital, and supporting advantages, become the aggregation centers of industrial parks. Subsequently, following the theoretical logic of New Economic Geography, industrial activities extend from core regions to peripheral small cities along transportation networks, ultimately manifesting a “core–sub-core–periphery” hierarchical concentric diffusion pattern. Overall, industrial park construction is predominantly concentrated in the central and eastern regions, whereas the western and northwestern areas exhibit relatively sparse distribution. This spatial pattern stems from the agglomeration advantages formed in high–density areas, which are underpinned by developed transportation networks, mature industrial foundations, and preferential policy resource allocation. In contrast, low–density areas face constraints arising from adverse natural conditions and weak infrastructure, which hinder the establishment of network synergies. Moreover, inadequate initial industrial scale limits the activation of factor agglomeration, thereby precluding the emergence of effective agglomerative development dynamics.
Figure 4.
Spatial distribution kernel density of industrial parks.
3.1.3. Spatial Correlation Features
Using spatial autocorrelation methods to study the spatial correlation characteristics of industrial parks, the global Moran’s I estimate value for the industrial park distribution is 0.02, which is more than zero. The Z value of the normal distribution statistic is 2.08, and the p value passes the confidence test, suggesting that the distribution of industrial parks has a substantial positive geographic association. Further application of the Getis–Ord Gi* local association index was used to identify hot and cold spots in industrial parks (as shown in Figure 5). Using the natural breakpoint method, industrial parks were discovered to have a “double hot spot–gradient diffusion” distribution pattern, reflecting the imbalance in hot and cold spot zoning and indicating that significant regional disparities remain in the process of national agricultural modernization. The Beijing–Tianjin–Hebei region, the Sichuan–Chongqing–Guizhou border area, and the Hubei–Hunan–Shaanxi border area are among the most popular industrial park locations. Secondary hot spots are mostly found in the northeast and spread into central provinces such as Henan, Anhui, and Hubei. Transition zones run in a belt–like pattern from the southern section of the North China Plain to the Yunna–Guizhou Plateau. Cold zones are typically found in northern and central–western regions such as Gansu Province, Inner Mongolia, and Qinghai Province; secondary cold zones occur in Tibet and Xinjiang. The hot–cold disparities are fundamentally rooted in the intrinsic differences among various agglomeration elements. Hot spot regions exhibit a virtuous coupling of institutional guidance and network coordination, wherein the proliferation of new–type management entities and transportation network improvements cultivate a relatively mature labor market. Through labor agglomeration and factor integration, this generates regional spillover effects on neighboring households, progressively reinforcing radiating capacities and facilitating effective institutional resource allocation. In contrast, cold spot regions face constraints from ecological red line governance on policy incentives, impeding the establishment of effective regional coordination and driving effects, thus failing to achieve industrial agglomeration.
Figure 5.
Cold and hot analyses of industrial parks.
3.2. Analysis of Industrial Park Drivers and Mechanisms
3.2.1. Feature Importance
The study uses the XGBoost–SHAP model to solve the constraints of traditional industrial cluster research in detecting complicated nonlinear correlations and multi–factor interaction mechanisms. The XGBoost algorithm is more effective than typical statistical methods at capturing complex nonlinear relationships. When used with SHAP analysis, it may explain local changes in individual components and properly identify main driving forces. It may measure each factor’s global influence while also revealing their marginal effects and interaction processes in specific instances. Thus, a critical path with spatial heterogeneity and stage flexibility is obtained [45]. This method combines the macro framework of classical industrial cluster theory with a micro analysis of machine learning to provide more accurate methodological assistance for developing differentiated industrial agglomeration policies [49]. Therefore, the XGBoost–SHAP model is used to analyze the key driving factors that affect the spatial distribution of industrial parks. By calculating the SHAP values, the relative contribution of each driver is obtained, as shown in Figure 6. The left picture depicts feature importance, whereas the right figure displays the SHAP summary plot, with red and blue denoting high and low levels of influence variables, respectively.
Figure 6.
Feature importance based on SHAP values.
This study commences with the initiation of industrial park policy implementation in 2017, selecting 2020 and 2023 as analytical cross–sections at three–year intervals. These time points correspond to the final year of the 13th Five–Year Plan period and the latest available data year, respectively, thereby enabling the examination of stage–specific variations in driving factors across distinct policy phases. The SHAP value analysis of driving factors reveals the following temporal evolution characteristics: for industrial park layout in 2017, the five key contributing factors, ranked in descending order of importance, were FPC, HIG, INO, CUL, and MAP. In 2020, the top two remained unchanged, while the bottom three changed positions, and the URB contribution value increased. The five important contribution variables for 2023 are the same as in 2020, but the last two were changed. Overall, FPC and HIG consistently emerged as the most stable core drivers of industrial park construction across all three years, with both exhibiting positive effects. This indicates a close interactive relationship between institutional guidance and network synergies, with farmers’ cooperatives playing a pivotal role in integrating resources to generate scale effects [50]. Conversely, in areas with convenient transportation access, farmers’ professional cooperatives can incorporate scattered households into the industrial division system at lower transaction costs, thereby fostering a virtuous cycle wherein institutional guidance and network synergies mutually reinforce one another to jointly promote industrial agglomeration [51]. It is worth noting that the contribution values of INO and MAP gradually reduced after 2020, presumably because as regional agricultural growth matured, the marginal benefits of technological innovations and fundamental resources on which they were initially based declined. In 2017, CUL had a primarily favorable influence, but after 2020, it had a negative impact. In 2017, CUL had a primarily favorable influence, but after 2020, it became negative. MAC, in contrast, exhibited the opposite trend. This contrast further indicates a relative weakening of the resource-driven nature of industrial parks: their development has shifted away from relying on the size of farmed land and toward efficiency factors such as mechanization and regional collaboration. As a result, the core driving role of cultivated land is steadily declining, while the impact of mechanization continues to strengthen.
3.2.2. Heterogeneity Analysis
China’s agricultural industry has major regional distinctions, with eastern agriculture favoring innovation-driven development, central agriculture stressing large-scale planting infrastructure, and western agriculture lagging behind in development [52]. Based on this, the study employed the XGBoost–SHAP model to analyze heterogeneity in the eastern, central, and western regions independently. Key drivers were chosen based on the 2023 SHAP value importance ranking (as shown in Figure 7) to highlight differences in mechanisms under industrial park geographical heterogeneity, allowing for the more precise identification of the specific causes of driving variables at the regional level.
Figure 7.
The feature importance of regional SHAP values.
Heterogeneity analysis reveals that, overall, ASL and EXP consistently ranked among the top five factors across the eastern, central, and western regions, constituting shared key drivers of industrial park distribution. However, their degrees of influence exhibited significant regional disparities. First, ASL exerts predominantly positive effects in the eastern, central, and western regions, indicating that natural conditions serve as inherent prerequisites for regional industrial park layout, and that industrial distribution and development continue to adhere to the underlying logic of regional natural resource endowments. Second, EXP exerts predominantly positive effects on industrial park construction in the eastern region. This is fundamentally attributed to the region’s advanced economic development and its industrial structure, which is oriented toward technology-intensive and high value-added sectors. Moreover, supported by a substantial presence of research institutions and technology enterprises, R&D investments can be rapidly transformed into the core competitiveness of industrial parks. However, in the central and western regions, R&D expenditure exhibits a negative impact on the construction of industrial parks. This suggests that industries in these regions are predominantly traditional agriculture- and resource-dependent sectors, suffering from a mismatch between industrial structure and R&D direction, as well as a lack of support for technology transfer, such as pilot bases for scientific research achievements and incubation platforms for tech enterprises. These factors are prone to resource misallocation, ultimately leading to a predominantly negative effect of R&D expenditure on the construction of industrial parks in central and western China.
Furthermore, the importance ranking of factors influencing the distribution of industrial parks exhibits significant regional differences across eastern, central, and western China. Specifically, the primary driving factor is ASL in the eastern region, FPC in the central region, and INC in the western region. Among these, ASL and FPC predominantly show positive effects in high-value ranges, whereas INC tends to exert a negative influence. These differences are essentially the result of the combined effects of heterogeneity in regional resource endowment structures, stages of industrial development, and characteristics of factor constraints. From a regional perspective, ASL emerges as the primary driver in the eastern region, reflecting the area’s high economic development level and substantial industrial density. The spatial layout of industrial parks has transitioned from quantitative expansion to quality enhancement, wherein natural conditions determine the priority order of industrial distribution through spatial accessibility and resource carrying capacity. As a critical variable influencing spatial suitability, ASL consequently assumes primacy as the foremost driver in the eastern region. In the central region, the core drivers are farmers’ professional cooperatives and fiscal support for agriculture, forming a dual-path approach of “resource integration” and “policy empowerment.” This is reflected in how farmers’ cooperatives, under policy incentives, resolve the contradictions between production and the market and strengthen industrial synergy. In the western region, INC serves as the primary driving factor, while MAP and EXP act as secondary drivers, both exhibiting negative effects. This is attributable to the underdeveloped rural economy in the western region, characterized by insufficient endogenous momentum and limited resource endowments, which in turn lead to factor outflows and low rural vitality, further constraining industrial agglomeration [53].
3.2.3. Feature Dependency Analysis
To further notice and validate the nonlinear link between industrial park drivers on a local scale, a feature dependency analysis was performed of the top five drivers in 2023, yielding a visualization diagram (Figure 8). In this picture, the horizontal axis indicates the factor’s real value, while the vertical axis represents the SHAP value associated with the factor. The threshold refers to a critical level of feature values [54]. In this study, the threshold refers to a specified value of the variable. Values below this threshold encourage or inhibit the expansion of industrial parks, whilst values above this barrier have the reverse effect.
Figure 8.
Feature dependency based on SHAP values.
The SHAP feature dependency analysis chart results show the following: First, FPC and URB showed a significant threshold effect. There is a significant non-linear positive association between FPC and industrial park distribution, implying that when the number of cooperatives is less than the threshold, dispersed small-scale enterprises cannot achieve resource integration benefits. Instead, they impede industrial park distribution because of the high coordination costs. When the number reaches the threshold, large-scale cooperative clusters can achieve the intensive allocation of production elements, effectively promote industrial agglomeration, and considerably increase the development of industrial parks. In contrast, URB has a nonlinear inverted U-shape. When area development is slow, low prices for production resources such as land and labor may encourage the formation of industrial parks. However, once regional growth is well established, the SHAP value becomes negative. At this stage, high land prices and fierce rivalry in high-end sectors cause agriculture’s comparative advantage to erode, resulting in lower resource investment and, as a result, a progressive impediment to industrial park development. Second, MAC shows an adaption threshold effect. Small-scale farmers with low mechanization face high purchase costs and low utilization rates. However, once the threshold for mechanization scale is exceeded, mechanization efficiency is released and SHAP values gradually become positive. This indicates that mechanization and scale adaptation are necessary to drive industrial development. From the changes in HIG, the SHAP values show little fluctuation and are concentrated in distribution, reflecting the sustained impact of traffic accessibility. However, traffic accessibility must reach a critical level, i.e., following the creation of a transportation hub, in order to successfully encourage the growth of local industrial parks. In addition, CUL has nonlinear trade-off features. When the cultivated land area is in the low to medium range, this shows that an adequate quantity of cultivated land area can supply basic raw material guarantees for industrial parks and has a positive impact on the distribution of industrial parks. However, when the cultivated land area is too large, excessive reliance on traditional agriculture and scattered land make it difficult to focus, occupying some development space for industrial parks and so acting as an inhibitory effect.
3.2.4. Feature Interaction Analysis
Given that different factors may not independently influence the spatial distribution of industrial parks [8], investigating the interaction of two factors might indicate how one element modifies the influence of another on the projected results. Further investigation of the pairwise interactions between factors was carried out by selecting the top four factors listed by SHAP values in 2023 for interaction analysis (as shown in Figure 9). In the figure, the horizontal axis represents the value of the driving factor, the left vertical axis represents the corresponding SHAP value of that driving factor, and the right vertical axis represents the value of the interacting driving factor. Blue and red indicate low and high values of the secondary driving factor, respectively. The results are as follows:
Figure 9.
Feature interaction effects based on SHAP values.
FPC exhibits significant interactions with HIG, URB, and MAC, but their effects on the construction of industrial parks vary. When the values of HIG or MAC fall below the thresholds (HIG < 580 km, MAC < 4800 mw, respectively), the SHAP values of FPC are mostly concentrated around zero or negative. Once these thresholds are exceeded, the positive interaction contribution of FPC increases significantly, indicating that traffic accessibility and mechanization level are key factors in activating the agglomeration effect of farmer cooperatives. In contrast, the interaction between FPC and URB shows an opposite pattern. When the number of FPC is below 5000, the interaction effect of high URB and FPC is negative; whereas when the number of FPC exceeds 5000, the interaction effect of low URB and FPC becomes more pronounced. This suggests that excessively high regional economic levels inhibit the marginal contribution of cooperatives to the development of industrial parks.
The interactions of HIG with URB and MAC are similar and relatively weak. When traffic accessibility HIG is within the range of 0–1000 km, both regional development level URB and mechanization level MAC remain low, regardless of whether HIG increases or decreases. However, when HIG exceeds 1000 km, the red points of URB and MAC increase with rising HIG, indicating that improvements in economic development and technology enhance the SHAP value contribution of traffic accessibility. This highlights that regional development can improve infrastructure, thereby providing a favorable business environment for industrial clusters.
When URB is in the low-to-medium range, specifically below 50%, MAC predominantly shows high values, i.e., above 4400 mw, indicating that at this stage, mechanization level and urbanization form a positive interaction and jointly promote the agglomeration of industrial parks. However, when the regional development level exceeds 70%, the SHAP values gradually shift to negative, suggesting that after excessive urbanization, even a high mechanization level can no longer meet the development needs of industrial parks, and the negative impact on park agglomeration becomes most pronounced.
4. Discussion
4.1. Analysis of Spatial Distribution Characteristics
The spatial–temporal distribution of agricultural industrial parks indicates a shift in agricultural development from being supply-driven to market-driven. These parks exhibit spatial–temporal differentiation characterized by a pattern of “sparse in the west, concentrated in the center, and dense in the east”. This distribution structurally resembles that of both China’s key villages and towns for rural tourism and agricultural demonstration villages and towns [33,41]. All three are highly concentrated in the economically developed industrial areas of the central and eastern regions in terms of geographical location. The spatial overlap between the three is due to the necessity for rural tourism to rely on a stable source market, agricultural demonstration villages and towns to strengthen their industrial base, and agricultural industrial parks to improve their industrial chain support. All of this indicates a tight need for infrastructure completion and consumer market activity. The central and eastern regions, with their superior transportation networks, huge population bases, and mature consumer markets, have laid a solid market-driven basis, providing critical support for the integration of industrial aspects. In contrast, isolated locations in the west are hampered by insufficient agricultural resource carrying capacity and a lack of modern market elements, making it impossible to meet the essential criteria of market-driven industrial development. As a result, industrial parks are sparsely distributed. In terms of the precise spatial form of industrial parks, the eastern region exhibits a consistent distribution, supporting Shang et al.’s research that rural industrial forms in most eastern regions are deeply embedded and serve heavily urbanized areas [55]. Furthermore, the agglomeration model in the center region surrounding the major grain-producing areas has a compound feature that combines path dependency and market-driven factors. This is comparable to the transition process of traditional agricultural areas described by Zhao et al. [56], but we discovered that market-driven pressures do not simply replace the original supply base, but rather develop a more complicated interaction mechanism that strengthens its functions. In China’s western region, industrial parks primarily form a point-like agglomeration pattern in a few plain areas, which is consistent with Ji et al.’s evaluation of the region’s development potential [57]. Although the western region has some agricultural development potential, it continues to encounter hurdles in breaking through resource and environmental limits and attracting modern market aspects as it develops. This demonstrates that our country’s rural industry development remains regionally imbalanced. Furthermore, spatial autocorrelation analysis reveals a weak positive spatial autocorrelation in the agglomeration of industrial parks. This result initially appears to conflict with the spatial spillover effects emphasized by industrial agglomeration theory [1]. However, it actually confirms that due to the imbalanced development between eastern and western China, the distribution of industrial parks at the prefecture-level city scale exhibits a pattern of local agglomeration but global dispersion, which dilutes the global autocorrelation. Unlike traditional manufacturing agglomeration, industrial parks are more dependent on natural resource endowments, and their layout is resource-oriented rather than driven purely by spatial proximity [8]. Therefore, the weak positive autocorrelation does not negate the existence of regional spillover effects; instead, it suggests that the scale of such spillovers is more concentrated at the urban agglomeration or county level rather than across a wide area spanning multiple prefecture-level cities. In summary, the spatial distribution of industrial parks results from the interplay of market forces, resource endowments, and unbalanced regional development.
From an international perspective, the transition of agricultural development from supply-driven to market-driven growth is a common feature of global agricultural modernization, with diversified pathways across economies at different stages of development. Among developed countries, the European Union, under its Common Agricultural Policy, has experienced continuously strengthened market orientation, with spatial differentiation shaped by market reach and capacity for industrial support [58]. This is consistent with the distribution logic of agricultural industrial parks in China, which is also determined by market conditions. In developing countries, the commercialization of indigenous vegetables in Africa shows that market demand is pushing farmers to shift from subsistence to commodity production, with traditional sharing mechanisms being replaced by market-based coordination [59]. This pathway parallels the development trajectory of China’s industrial parks, which rely on industrial chain agglomeration, and also reveals that in areas with weak market conditions, low levels of organization and a lack of coordination mechanisms can exacerbate spatial disparities. Brazil, on the other hand, relies on agricultural research companies to translate scientific results into productive forces and enhance market competitiveness through supply chain optimization, confirming the key role of technological capacity in agricultural transformation [7]. Compared with the above transformation pathways, Southeast Asia, despite large-scale commercialization, still maintains stable smallholder farm sizes, yet the overall development shows a pattern of unbalanced scales [60], with market mechanisms still playing an important role. This indicates that global agricultural modernization remains in a transitional phase, with different regions exhibiting differentiated evolutionary rhythms in their marketization processes.
4.2. Analysis of Driving Factors and Interactions
Transportation location and linking and leading farmers constitute the dual driving forces of industrial park spatial radiation and industrial promotion. First, in the context of linking and leading farmers, new types of business entities such as farmer cooperatives are regarded as the primary driving force. This is consistent with previous research findings that farmer cooperatives, as the organizational hub of agricultural production and operation, have a unique ability to deeply integrate resources while amplifying external factors [13]. Second, in the context of geographic location, traffic accessibility exerts a significantly positive effect on the distribution of industrial parks by reducing transport costs, expanding market reach, and strengthening spatial spillover effects. This confirms that traffic accessibility is a major driver of agricultural industrial distribution and is crucial for the spatial allocation efficiency of agricultural factors and industrial agglomeration [18]. In the heterogeneity analysis, altitude emerges as a common driving factor across regions, revealing that modern agricultural development must follow a logic of adaptation to local conditions. When formulating agricultural industrial policies, it is necessary not only to consider the alignment between the stages of economic development and resource allocation but also to pay greater attention to the fundamental constraints imposed by natural geographical conditions. This echoes the findings of Li et al., further confirming that natural conditions remain an important factor influencing the form and function of agricultural systems [61]. Furthermore, as an important dimension in the construction foundation of industrial parks, the impact of the level of agricultural mechanization on industrial parks showed a weak negative effect in 2023, which differs from previous studies that concluded that mechanization has a significantly positive effect on agricultural development [18]. The construction of industrial parks is becoming increasingly sophisticated, and agglomeration effects are more pronounced. Consequently, the level of agricultural mechanization transitions from quantitative growth to qualitative improvement. While the mechanization level may experience a moderate decline during this transition, once it stabilizes at a high level, its impact on the construction of industrial parks becomes predominantly positive. Furthermore, while most existing studies suggest that cultivated land endowment has a consistently positive driving effect on the construction of agricultural industrial parks [62], this study finds that the impact of cultivated land is not linearly stable. With the expansion of industrial agglomeration, the conflict between cultivated land and construction land, along with other production factors, becomes increasingly acute, and the spatial crowding-out effect gradually intensifies. The centrifugal force brought on by the scarcity of land factors eventually surpasses the centripetal force of initial endowments, leading to the predominantly negative impact of cultivated land on industrial parks after 2020.
The interaction between different driving factors has varying effects on industrial parks. Farmers’ professional cooperatives, as the major interaction entity, might encourage the development of industrial parks in conjunction with other variables, since cooperatives serve as a critical link between agricultural resource integration and market access, propelling scattered individual farmers into large-scale agricultural output. This results in a dual radiation effect of industry and talent, strengthening interconnection and interaction between industries and acting as a powerful driving force for industrial agglomeration [63]. Furthermore, the existing research indicates that public transit and farmer cooperatives have a major impact on diversifying agricultural livelihoods [64]. The interaction between farmer cooperatives and traffic accessibility is most important, and the two can effectively drive the substantial construction of industrial parks by creating a two-way, mutually reinforcing closed loop of “circulation empowerment and organizational synergy.” It is noteworthy, however, that regional development levels correspond with agricultural mechanization. When their interaction is medium to low, they can generate effective synergy and mutual complementarity, which can considerably promote the development of agricultural industrial parks. However, when urbanization crosses a particular threshold, industrial park agglomeration is restricted. This phenomenon confirms the law of development revealed in Lewis’s dual economic theory: as regional urbanization levels rise rapidly, capital, motivated by profit, will accelerate the flow from the traditional agricultural sector to the modern industrial and service sectors [65]. This approach resulted in a large “resource displacement” impact, in which critical elements used for agricultural expansion were gradually encroached upon by non-agricultural activity. Specifically, this study validated some findings regarding trends in the non-agriculturalization of land: manufacturing parks tend to occupy high-quality cultivated land [66]; professional–intensive industries attract labor through wage premiums [67], which is consistent with Huang et al.’s discussion on the impact of non-agricultural employment on rural human capital [68]; and high-tech parks not only compete for water resources but also squeeze the ecological space of agriculture by raising environmental standards. Together, these findings suggest that the substitution of agricultural resources by non-agricultural uses is essentially a spatial restructuring process that deepens with the evolution of economic development stages. It is worth noting that industrial parks, as policy-oriented spatial carriers, exhibit a dual nature through government planning guidance and market-driven factor allocation. Social capital networks and technological innovation, as informal institutional factors, may also influence industrial agglomeration by facilitating resource integration and innovation diffusion [69]. Future research should incorporate more fine-grained micro-level data to deepen our understanding of how institutional factors and social capital shape the spatial distribution of industrial parks.
5. Research Conclusions and Implications
5.1. Conclusions
Based on data from 338 industrial parks, this study combines spatial analysis methods with the XGBoost–SHAP model to systematically explore the spatial differentiation characteristics and driving mechanisms of industrial parks, revealing their spatial distribution patterns, driving mechanisms, and regional heterogeneity. It provides a practical basis for differentiated development strategies, expands the theoretical methods of agricultural spatial research, and has significant value for promoting agricultural modernization and regional coordinated development. The primary conclusions are as follows:
- (1)
- The overall distribution pattern has the stepped characteristic of “sparse in the west, concentrated in the middle, and dense in the east”. The industrial park is evenly distributed in the east, the central area is close to the main grain-producing area, and the west is dotted. The agglomeration in the eastern region is more visible, whereas there are more blank areas in the center and western regions, and the spatial distribution variability is large.
- (2)
- The industrial park has created four high-density core zones in the center and eastern regions. These core zones act as hubs, spreading influence to neighboring areas and encouraging the formation of secondary high-density zones. Overall, the distribution remains concentrated in the center and eastern regions, with a belt-like radiating pattern across the Beijing–Hebei–Shandong area. The hot and cold zones are imbalanced. The industrial park’s hot spots include the junctions of Beijing–Tianjin–Hebei, Sichuan, Chongqing, and Guizhou, as well as Hubei, Hunan, and Shaanxi. The majority of cold zones are concentrated in the central and western areas.
- (3)
- Linking and leading farmers and geographical location are the core dimensions affecting the distribution of industrial parks, among which farmers’ professional cooperatives, traffic accessibility, and regional development levels have contributed the most in the past three years. Elevation was identified as a common driving factor in the heterogeneity study, confirming the importance of natural resource endowment in agricultural development and revealing modern agriculture’s dependence and adaptation to its physical geographical basis. The factor ranking demonstrates that China’s agriculture, from east to west, exhibits the development characteristics of “precision and intensification–resource integration–production guarantee.”
- (4)
- The interaction between farmers’ professional cooperatives and other driving factors is relatively significant. Through the two-way radiation of talent and industry, they can drive other factors to influence industrial parks. However, the interaction between regional development level and mechanization level presents adaptive characteristics. Too high a regional development level will intensify non-agricultural development, thus inhibiting the construction of industrial parks.
5.2. Suggestions
Industrial parks present an important topic for in-depth discussion: how to effectively plan and advance industrial park development based on their spatial differentiation characteristics and influencing factors. Therefore, the following insights are proposed:
- (1)
- Coordinate regional layout to enhance development quality. Given the spatial distribution and regional differences in industrial parks, differentiated pathways should be adopted for eastern, central, and western China. The east should leverage its resource advantages to develop smart and facility agriculture. The central region should strengthen farmer professional cooperatives and prioritize logistics hubs where traffic accessibility exceeds 500 km. The west should accelerate endogenous growth through industrial support and financial assistance, developing characteristic adaptive agriculture to form a nationally coordinated development pattern.
- (2)
- Precise site selection based on key driving factors. Guided by the factor thresholds revealed by SHAP analysis, priority for industrial park location should be given to areas within 500 km of a regional central city. A certain scale of farmer professional cooperatives should be simultaneously cultivated to create synergistic coordination between logistics infrastructure and organizational support. In addition, priority should be given to areas with an urbanization level below 60% to avoid blind expansion in over-urbanized regions. On this basis, administrative boundaries should be crossed to encourage the establishment of collaborative mechanisms among geographically adjacent parks with strong industrial linkages, attracting leading enterprises, family farms, and other diverse actors to form a specialized and coordinated industrial network.
- (3)
- Solve the problem of non-agricultural extrusion and strengthen industrial coordination. First and foremost, increase the guarantee of agricultural building materials. Encourage land intensification by land transfer premium subsidies, interest subsidies on agricultural machinery purchases, and the “cooperative + trusteeship” model. Second, enhance industrial integration by reserving land for deep processing growth, guiding the integration of agriculture, tourism, and e-commerce through tax cuts and exemptions, and attracting capital investment along the industrial chain. Furthermore, optimize policy guidance, include the completeness of the industrial chain in industrial parks and their contribution to increasing farmers’ income in the assessment, issue special bonds to ensure investment, avoid excessive resource allocation to non-agricultural industries, and achieve the coordinated development of industry, agriculture, and services.
6. Deficiencies and Prospects
This study mainly has two limitations. On the one hand, this study focuses on China’s agricultural industrial parks, and its conclusions have certain contextual specificity. Chinese industrial parks are policy-driven, with their formation being highly dependent on institutional guidance and the coordination of new agricultural business entities, which differs significantly from the market-driven evolution of agricultural clusters in Western countries. Nevertheless, agricultural industrialization is a global trend, and China’s experience may offer valuable lessons for developing countries. Thus, the dialectical relationship between specificity and universality should be considered when interpreting the findings. On the other hand, analyzing industrial parks at the national macro-scale makes it difficult to capture the heterogeneity of different park types at the micro-scale. Future research could disaggregate park types and combine micro-level survey data to conduct multi-scale nested analyses, thereby providing more precise theoretical support for differentiated policy making.
Author Contributions
Conceptualization, Y.M.; methodology, C.L. and Y.Y.; software, C.L.; validation, Y.L.; formal analysis, C.L.; investigation, C.L. and Y.Y.; resources, Y.C. and Y.M.; data curation, C.L.; writing—original draft preparation, C.L.; writing—review and editing, Y.M., S.Z. and C.L.; supervision, S.Z. and Y.M.; project administration, Z.C. and Y.C.; funding acquisition, Y.M. All authors have read and agreed to the published version of the manuscript.
Funding
This research was funded by the Financial Research Project of Fujian Province grant number (K8119A01A); The Finance Department of Fujian Province grant number (KLE21002A).
Data Availability Statement
All the data used in this manuscript are available on request from the corresponding author.
Conflicts of Interest
The authors declare no conflicts of interest.
References
- Wang, C.; Zhou, T.; Ren, M. Spatial agglomeration patterns and co-agglomeration rules of agribusiness: From the perspective of industrial chain. Appl. Geogr. 2025, 179, 103628. [Google Scholar] [CrossRef] [Scilit]
- Fan, W.; Dong, X.; Wei, H.; Weng, B.; Liang, L.; Xu, Z.; Wang, X.; Wu, F.; Chen, Z.; Jin, Y.; et al. Is it true that the longer the extended industrial chain, the better the circular agriculture? A case study of circular agriculture industry company in fuqing, fujian. J. Clean. Prod. 2018, 189, 718–728. [Google Scholar] [CrossRef] [Scilit]
- Ryschawy, J.; Tiffany, S.; Gaudin, A.; Niles, M.T.; Garrett, R.D. Moving niche agroecological initiatives to the mainstream: A case-study of sheep-vineyard integration in california. Land Use Policy 2021, 109, 105680. [Google Scholar] [CrossRef] [Scilit]
- Mikhailov, A.; Oliveira, C.; Padula, A.D.; Reichert, F.M. Californian innovation ecosystem: Emergence of agtechs and the new wave of agriculture. Innov. Manag. Rev. 2021, 18, 292–307. [Google Scholar] [CrossRef] [Scilit]
- Alarcón-Segura, V.; Roilo, S.; Paulus, A.; Beckmann, M.; Klein, N.; Cord, A.F. Farm structure and environmental context drive farmers’ decisions on the spatial distribution of ecological focus areas in germany. Landsc. Ecol. 2023, 38, 2293–2305. [Google Scholar] [CrossRef] [Scilit]
- Limpamont, A.; Kittipanya-ngam, P.; Chindasombatcharoen, N.; Cavite, H.J.M. Towards agri-food industry sustainability: Addressing agricultural technology adoption challenges through innovation. Bus. Strategy Environ. 2024, 33, 7352–7367. [Google Scholar] [CrossRef] [Scilit]
- Da Silva Medina, G.; Pokorny, B. Agro-industrial development: Lessons from brazil. Land Use Policy 2022, 120, 106266. [Google Scholar] [CrossRef] [Scilit]
- Ling, L.; Chen, X.; Wu, Y.; Li, S.; Wei, J.; Zhou, Q. National modern agricultural industrial parks: Development characteristics, regional differences, and experience inspiration—Case study of 200 nmaips in china. Agronomy 2023, 13, 653. [Google Scholar] [CrossRef] [Scilit]
- Zhou, Q.; Chen, X.; Han, X.; Ling, L.; Li, S. North china plain national modern agricultural industrial park: Regional characteristics, efficiency evaluation, and suggestions for countermeasures. Chin. J. Agric. Resour. Reg. Plan. 2025, 46, 190–201. [Google Scholar]
- Sun, X.; Liu, D.; Yang, X. Do Modern Agricultural Industrial Parks Promote the Income Growth of Farmers? An Empirical Analysis from the Perspective of Industrial Agglomeration. Chin. Rural Econ. 2024, 12, 23–43. [Google Scholar]
- Li, H.; Zhang, X. Analysis of the Benefit Connection Mechanism of Modern Agricultural Industrial Parks from the Perspective of Farmers. Rural Econ. 2019, 7, 119–126. [Google Scholar]
- Jiang, L.; Jiang, H.; Jiang, H. New Ideas and Measures to Promote the Development of National Modern Agricultural Industrial Park During the 14th Five-Year Plan Period. Reform 2021, 12, 106–115. [Google Scholar]
- Liu, Z.; Li, G.; Luo, Q. Research on the level of regional differences of farmers driven in modern agricultural industrial parks—Empirical analysis based on 114 parks in china. Chin. J. Agric. Resour. Reg. Plan. 2022, 43, 126–136. [Google Scholar]
- Yu, Y.; Lin, Z.; Liu, D.; Hou, Y. Exploring the spatially heterogeneous impacts of industrial agglomeration on regional sustainable development capability: Evidence from new energy industries. Environ. Dev. Sustain. 2024, 26, 16657–16682. [Google Scholar] [CrossRef] [Scilit]
- Hernandez, L.; Atienza, M.; Modrego, F. Is industrial related variety an enabling condition for regional entrepreneurship? A comparison between mining and non-mining regions in chile. Extr. Ind. Soc. 2022, 11, 101096. [Google Scholar] [CrossRef] [Scilit]
- Liu, T.; Li, J.; Huo, J. Spatial-temporal pattern and influencing factors of high-quality agricultural development in China. J. Arid. Land Resour. Environ. 2020, 34, 1–8. [Google Scholar]
- Jiang, L.; Wu, S.; Liu, Y. Change analysis on the spatio-temporal patterns of main crop planting in the middle yangtze plain. Remote Sens. 2022, 14, 1141. [Google Scholar] [CrossRef] [Scilit]
- Wang, T.; Ma, Y.; Luo, S. Spatial pattern and influencing factors of agricultural leading enterprises in heilongjiang province, china. Agriculture 2023, 13, 2061. [Google Scholar] [CrossRef] [Scilit]
- Kujala, S.; Hakala, O.; Viitaharju, L. Factors affecting the regional distribution of organic farming. J. Rural Stud. 2022, 92, 226–236. [Google Scholar] [CrossRef] [Scilit]
- Hou, M.; Cui, X.; Xie, Y.; Lu, W.; Xi, Z. Synergistic emission reduction effect of pollution and carbon in china’s agricultural sector: Regional differences, dominant factors, and their spatial-temporal heterogeneity. Environ. Impact Assess. Rev. 2024, 106, 107543. [Google Scholar] [CrossRef] [Scilit]
- Huang, X.; Liu, X.; Jin, Y.; Gao, X.; Chen, Y. Identification and attribution analysis of integrated ecological zones based on the xgboost-shap model: A case study of chengdu, china. Ecol. Indic. 2025, 177, 113787. [Google Scholar] [CrossRef] [Scilit]
- Qiao, B.; Yang, H.; Cao, X.; Zhou, B.; Wang, N.A. Driving mechanisms and threshold identification of landscape ecological risk: A nonlinear perspective from the qilian mountains, china. Ecol. Indic. 2025, 173, 113342. [Google Scholar] [CrossRef] [Scilit]
- Kaijian, Y.; Congjian, Y.; Jun, S. Agglomeration phenomena and evolutionary patterns of contemporary architectural interventions in traditional villages: An empirical analysis from 211 cases in songyang county, china. Habitat Int. 2025, 166, 103571. [Google Scholar] [CrossRef] [Scilit]
- Marshall, A.; Guillebaud, C.W. Principles of Economics; Springer: Berlin/Heidelberg, Germany, 1961. [Google Scholar]
- Ramachandran, R.; Sasidharan, S.; Doytch, N. Foreign direct investment and industrial agglomeration: Evidence from india. Econ. Syst. 2020, 44, 100777. [Google Scholar] [CrossRef] [Scilit]
- Krugman, P. Increasing returns and economic geography. J. Political Econ. 1991, 99, 483–499. [Google Scholar] [CrossRef] [Scilit] [PubMed]
- Jiang, Y.; Yao, G.; Xu, J.; Tian, Y. Study in driving strategy and analysis of sustainable and symbiosis development relationship between agricultural industrial clusters and agricultural logistics industry. Sustainability 2021, 13, 13800. [Google Scholar] [CrossRef] [Scilit]
- Wang, H.; He, J.; Aziz, N.; Wang, Y. Spatial distribution and driving forces of the vegetable industry in china. Land 2022, 11, 981. [Google Scholar] [CrossRef] [Scilit]
- Zheng, W. Land supply and industrial agglomeration: Extension of the new economic geography model with land elements incorporated. Land Use Policy 2023, 132, 106757. [Google Scholar] [CrossRef] [Scilit]
- Tang, Y.; Liu, C.; Li, Y. Multifunctional territorial differentiation of rural production spaces and functional zoning: A case study of western chongqing. Agriculture 2024, 14, 270. [Google Scholar] [CrossRef] [Scilit]
- Zhang, Q. The regional disparities and spatial agglomeration characteristics of modernization in China’s agriculture and rural areas. Stat. Decis. 2023, 39, 122–126. [Google Scholar]
- Yang, Z.; Liu, T.; Shen, N.; Guan, M.; Zheng, Y.; Jiang, H. Resource and environment constraints and promotion strategies of rural vitality: An empirical analysis of rural revitalization model towns. Front. Environ. Sci. 2022, 10, 956644. [Google Scholar] [CrossRef] [Scilit]
- Wang, Z.; Qiao, J.; Wang, G.; Zhu, Q.; Wang, W.; Feng, Y. Spatiotemporal patterns, regional differences, and formation mechanisms of demonstration villages and towns in china. J. Rural Stud. 2025, 117, 103644. [Google Scholar] [CrossRef] [Scilit]
- You, T.; Yan, S. Spatial differentiation and driving force detection of rural settlements in the yangtze river delta region. Sustainability 2023, 15, 8774. [Google Scholar] [CrossRef] [Scilit]
- Lu, Y.; Wang, L.; Zhou, Z. A Study on the Coupling Coordination Degree and Temporal and Spatial Evolution of China’s Agricultural Green Development Level and Agricultural Science and Technology Innovation Capability. Agric. Econ. Manag. 2024, 4, 90–104. [Google Scholar]
- Tao, H.; Zhou, J. Study on the geographic distribution and influencing factors of dai settlements in yunnan based on geodetector. Sci. Rep. 2024, 14, 8948. [Google Scholar] [CrossRef] [Scilit] [PubMed]
- Zhang, Q.; Wang, J. Spatial differentiation and driving factors of traditional villages in jiangsu province. Sustainability 2023, 15, 11448. [Google Scholar] [CrossRef] [Scilit]
- Li, D.; Gao, X.; Lv, S.; Zhao, W.; Yuan, M.; Li, P. Spatial distribution and influencing factors of traditional villages in inner mongolia autonomous region. Buildings 2023, 13, 2807. [Google Scholar] [CrossRef] [Scilit]
- Wu, S.; Li, B.; Xu, D. Agglomeration characteristics and influencing factors of urban innovation spaces based on the distribution data of high-tech enterprises in harbin. Buildings 2024, 14, 1615. [Google Scholar] [CrossRef] [Scilit]
- Qi, J.; Lu, Y.; Han, F.; Ma, X.; Yang, Z. Spatial distribution characteristics of the rural tourism villages in the qinghai-tibetan plateau and its influencing factors. Int. J. Environ. Res. Public Health 2022, 19, 9330. [Google Scholar] [CrossRef] [Scilit]
- Zou, Q.; Sun, J.; Luo, J.; Cui, J.; Kong, X. Spatial patterns of key villages and towns of rural tourism in china and their influencing factors. Sustainability 2023, 15, 13330. [Google Scholar] [CrossRef] [Scilit]
- Wang, Y.; Xue, H.; Li, A.; Ma, X.; Sun, A.; Zhang, J. Spatial-temporal differentiation and influencing factors of ecosystem health in three-river-source national park. Ecol. Indic. 2025, 171, 113183. [Google Scholar] [CrossRef] [Scilit]
- Zhang, H.; Wang, C.; Dong, H.; Zhao, X.; Zhang, Y.; Du, M. The game between quality induction and traffic constraint: A non-linear threshold study of park travel carbon emissions from an urban–rural differentiation perspective. Buildings 2026, 16, 867. [Google Scholar] [CrossRef] [Scilit]
- Chen, T.; Guestrin, C. Xgboost: A scalable tree boosting system. In Proceeding of the 22nd ACM SIGKDD International Conference on Knowledge Discovery and Data Mining; Association for Computing Machinery: New York, NY, USA, 2016; pp. 785–794. [Google Scholar]
- Sun, D.; Wu, X.; Wen, H.; Ma, X.; Zhang, F.; Ji, Q.; Zhang, J. Ecological security pattern based on xgboost-mcr model: A case study of the three gorges reservoir region. J. Clean. Prod. 2024, 470, 143252. [Google Scholar] [CrossRef] [Scilit]
- Yin, S.; Shi, R.; Wu, N.; Yang, J. Measuring the impact of technological innovation on urban resilience through explainable machine learning: A case study of the yangtze river delta region, china. Sustain. Cities Soc. 2025, 127, 106457. [Google Scholar] [CrossRef] [Scilit]
- Zhou, Y.; Li, X.; Liu, Y. Cultivated land protection and rational use in china. Land Use Policy 2021, 106, 105454. [Google Scholar] [CrossRef] [Scilit]
- Lou, H.; Shi, X.; Ren, X.; Yang, S.; Cai, M.; Pan, Z.; Zhu, Y.; Feng, D.; Zhou, B. Limited terrestrial carbon sinks and increasing carbon emissions from the hu line spatial pattern perspective in china. Ecol. Indic. 2024, 162, 112035. [Google Scholar] [CrossRef] [Scilit]
- Chen, Y.; Jiao, S.; Gu, X.; Li, S. Decoding the spatiotemporal effects of industrial clusters on carbon emissions in a chinese river basin. J. Clean. Prod. 2025, 516, 145851. [Google Scholar] [CrossRef] [Scilit]
- Zhang, L.; Xin, B. E-commerce and preferential credit to enable farmers’ cooperative financing. Emerg. Mark. Financ. Trade 2024, 60, 1246–1264. [Google Scholar] [CrossRef] [Scilit]
- Abbas Khan, M.; Ni, G.; Man, T.; Saud, S. Impacts of transport infrastructure on agricultural total factor productivity in asian countries. Transp. Policy 2025, 171, 18–27. [Google Scholar] [CrossRef] [Scilit]
- Zhao, D.; Cui, J. The Spatial-temporal Characteristics, Regional Disparities, and Influencing Factors of High-quality Agricultural and Rural Development in China. J. Huazhong Agric. Univ. Soc. Sci. Ed. 2024, 3, 10–24. [Google Scholar]
- Pan, C.; Feng, X.; Zhao, M. A novel framework for rural vitality evaluation and revitalization by classification: A case of china. Habitat. Int. 2025, 159, 103361. [Google Scholar] [CrossRef] [Scilit]
- Xu, Y.; Zhang, D.; Lin, J.; Peng, Q.; Lei, X.; Jin, T.; Wang, J.; Yuan, R. Prediction of phytoplankton biomass and identification of key influencing factors using interpretable machine learning models. Ecol. Indic. 2024, 158, 111320. [Google Scholar] [CrossRef] [Scilit]
- Shangshang, S.; Dan, Y.; Xiaojie, L. Achieving coordinated development of multi-functional urban agriculture in xiamen, china. Sustain. Cities Soc. 2024, 101, 105070. [Google Scholar] [CrossRef] [Scilit]
- Zhao, Y.; Yuan, X.; Liu, Y. Understanding the transformation of rural areal system from changes in farmland landscape: A case study of jiaocun township, henan province. Habitat. Int. 2025, 159, 103358. [Google Scholar] [CrossRef] [Scilit]
- Ji, M.; Li, J.; Zhang, M. What drives the agricultural carbon emissions for low-carbon transition? Evidence from china. Environ. Impact Assess. Rev. 2024, 105, 107440. [Google Scholar] [CrossRef] [Scilit]
- Penone, C.; Giampietri, E.; Trestini, S. Futures–spot price transmission in eu corn markets. Agribusiness 2022, 38, 679–709. [Google Scholar] [CrossRef] [Scilit]
- Kubitza, C.; Hackfort, S.; Opiyo, A.; Rauh, C.; Stokes, C.S.; Huyskens-Keil, S. The effects of market-oriented farming on living standards, nutrition, and informal sharing arrangements of smallholder farmers: The case of african indigenous vegetables in kenya. Food Secur. 2024, 16, 1363–1379. [Google Scholar] [CrossRef] [Scilit]
- Promkhambut, A.; Yokying, P.; Woods, K.; Fisher, M.; Li Yong, M.; Manorom, K.; Baird, I.G.; Fox, J. Rethinking agrarian transition in southeast asia through rice farming in thailand. World Dev. 2023, 169, 106309. [Google Scholar] [CrossRef] [Scilit]
- Li, S.; Pu, J.; Deng, X. Agricultural land use transition under multidimensional topographical gradients and its impact on ecosystem service interactions. J. Integr. Agric. 2025, 24, 3222–3241. [Google Scholar] [CrossRef] [Scilit]
- Yin, X.; Li, Z.; Xu, G.; Wan, C. Integrating resilience theory into a cultivated land system: Empirical insights from china’s key grain-producing regions. Land Degrad. Dev. 2024, 35, 5425–5438. [Google Scholar] [CrossRef] [Scilit]
- Zhu, X.; Wang, G. Impact of agricultural cooperatives on farmers’ collective action: A study based on the socio-ecological system framework. Agriculture 2024, 14, 96. [Google Scholar] [CrossRef] [Scilit]
- Ho, T.D.N.; Tsusaka, T.W.; Kuwornu, J.K.M.; Datta, A.; Nguyen, L.T. Do rice varieties matter? Climate change adaptation and livelihood diversification among rural smallholder households in the mekong delta region of vietnam. Mitig. Adapt. Strateg. Glob. Change 2021, 27, 8. [Google Scholar] [CrossRef] [Scilit]
- Vollrath, D. The dual economy in long-run development. J. Econ. Growth 2009, 14, 287–312. [Google Scholar] [CrossRef] [Scilit] [PubMed]
- Lee, B.; Chang, H.; Wang, S. Can environmental disamenities increase land values? A case study of manufacturing factories on farmland. J. Clean. Prod. 2021, 279, 123432. [Google Scholar] [CrossRef] [Scilit]
- de Souza Silva, E.; Da Silva, D.L.G.; de Moraes Rocha, R. Occupational specialization, skills, and urban wage premium in brazil. Ann. Reg. Sci. 2024, 73, 2019–2057. [Google Scholar] [CrossRef] [Scilit]
- Huang, K.; Cao, S.; Qing, C.; Xu, D.; Liu, S. Does labour migration necessarily promote farmers’ land transfer-in?—Empirical evidence from china’s rural panel data. J. Rural Stud. 2023, 97, 534–549. [Google Scholar] [CrossRef] [Scilit]
- Sánchez-García, E.; Marco-Lajara, B.; Seva-Larrosa, P.; Martínez-Falcó, J. Social capital, cooperation and innovation in the energy sector clusters. Reg. Stud. 2024, 58, 805–820. [Google Scholar] [CrossRef] [Scilit]
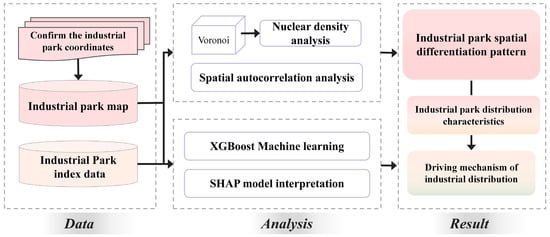
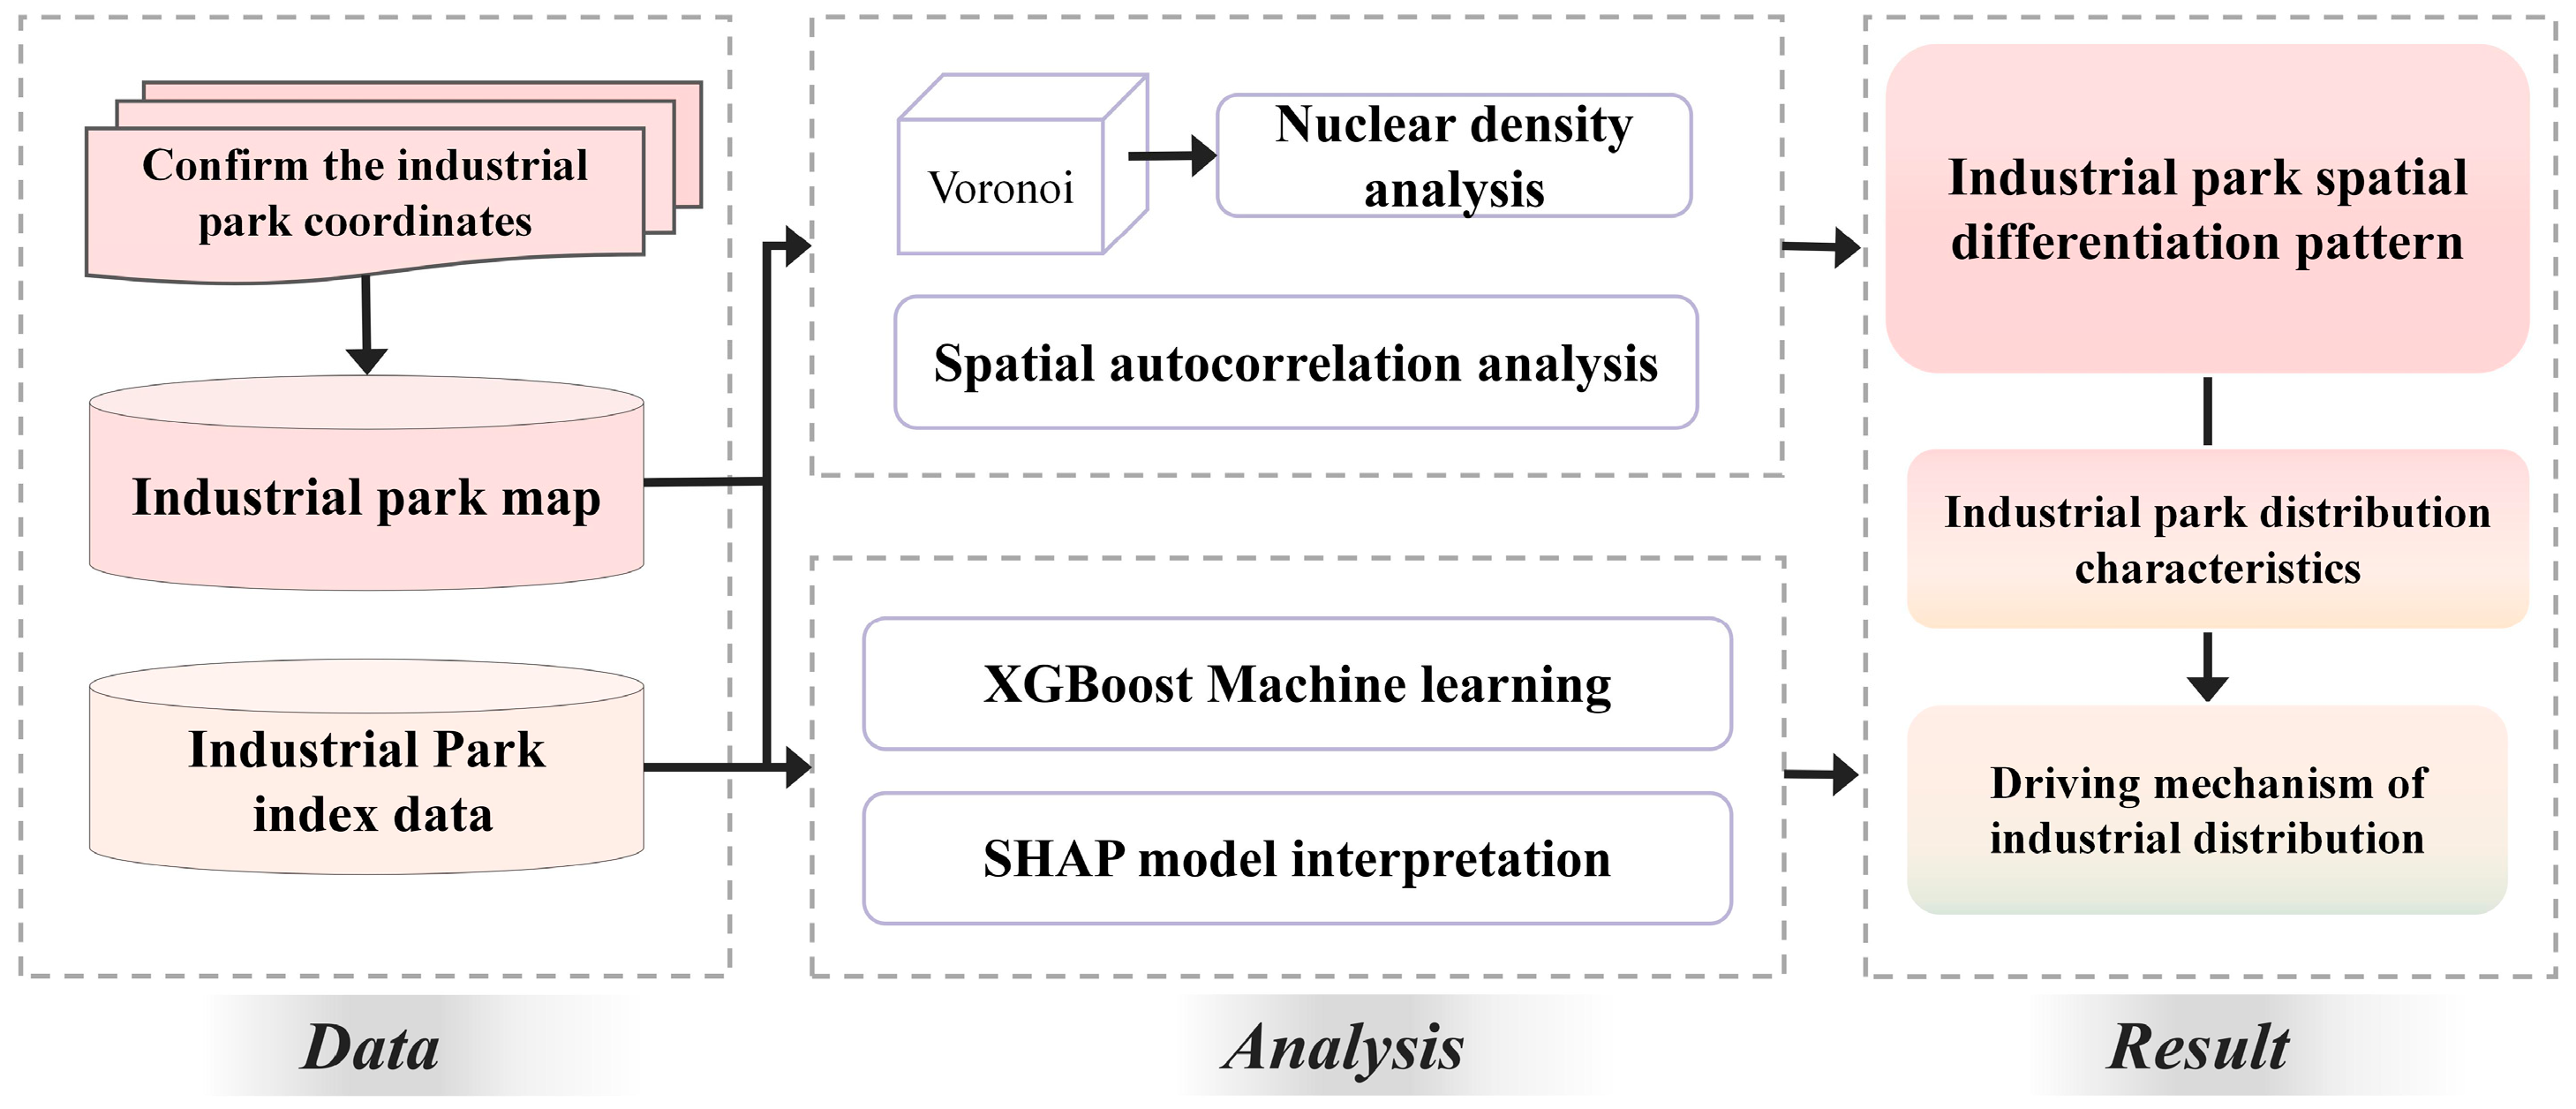
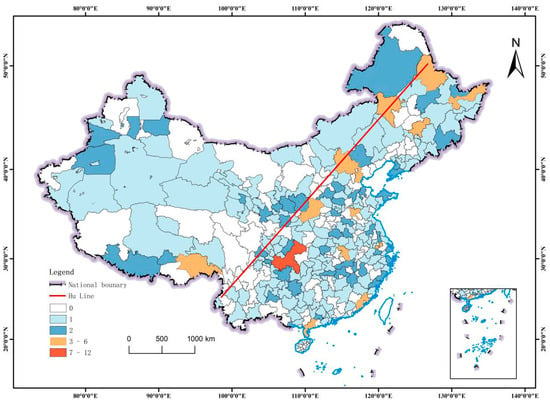
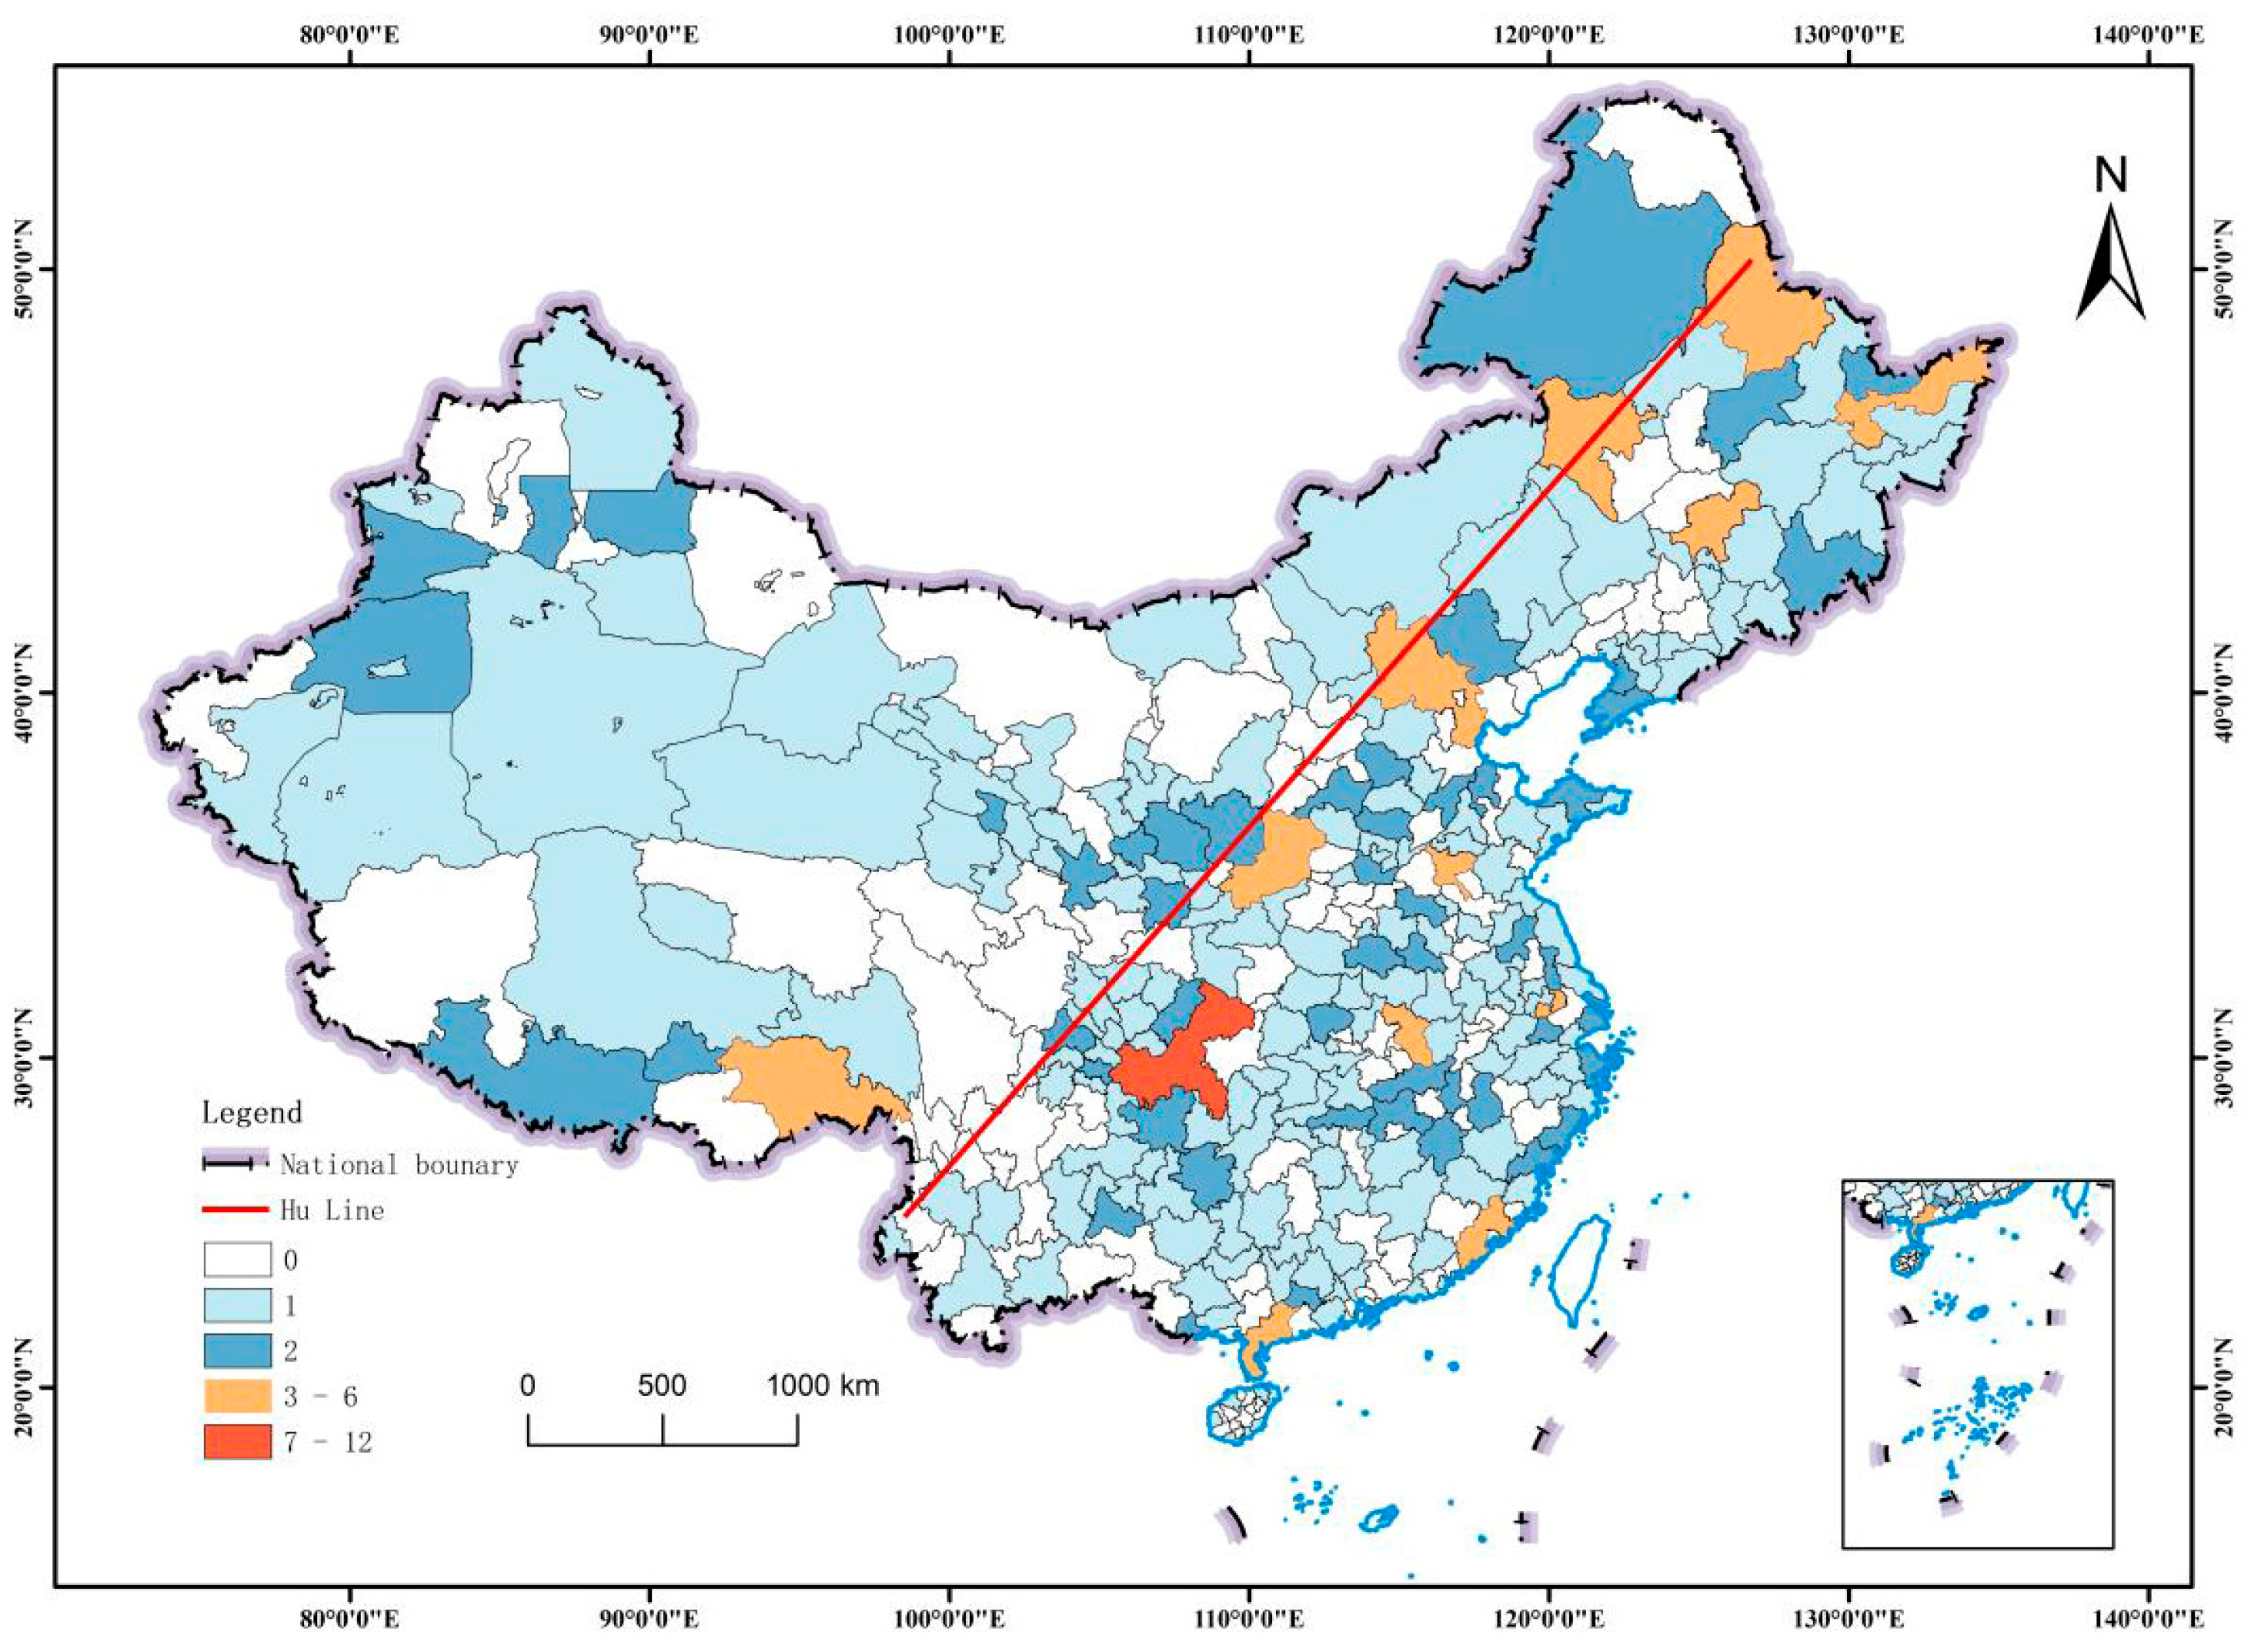
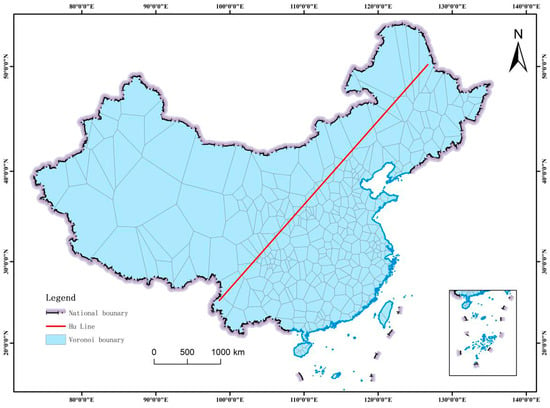
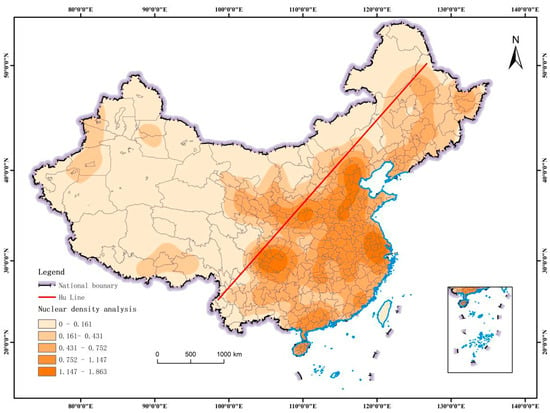
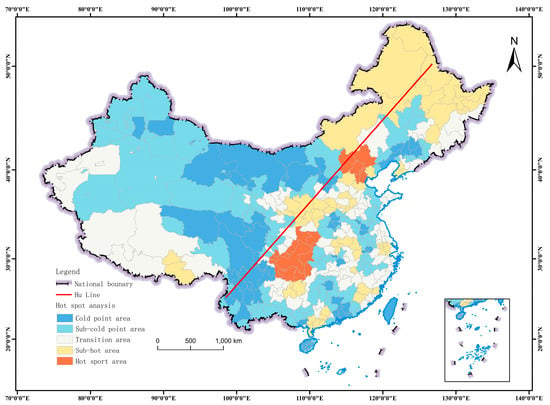
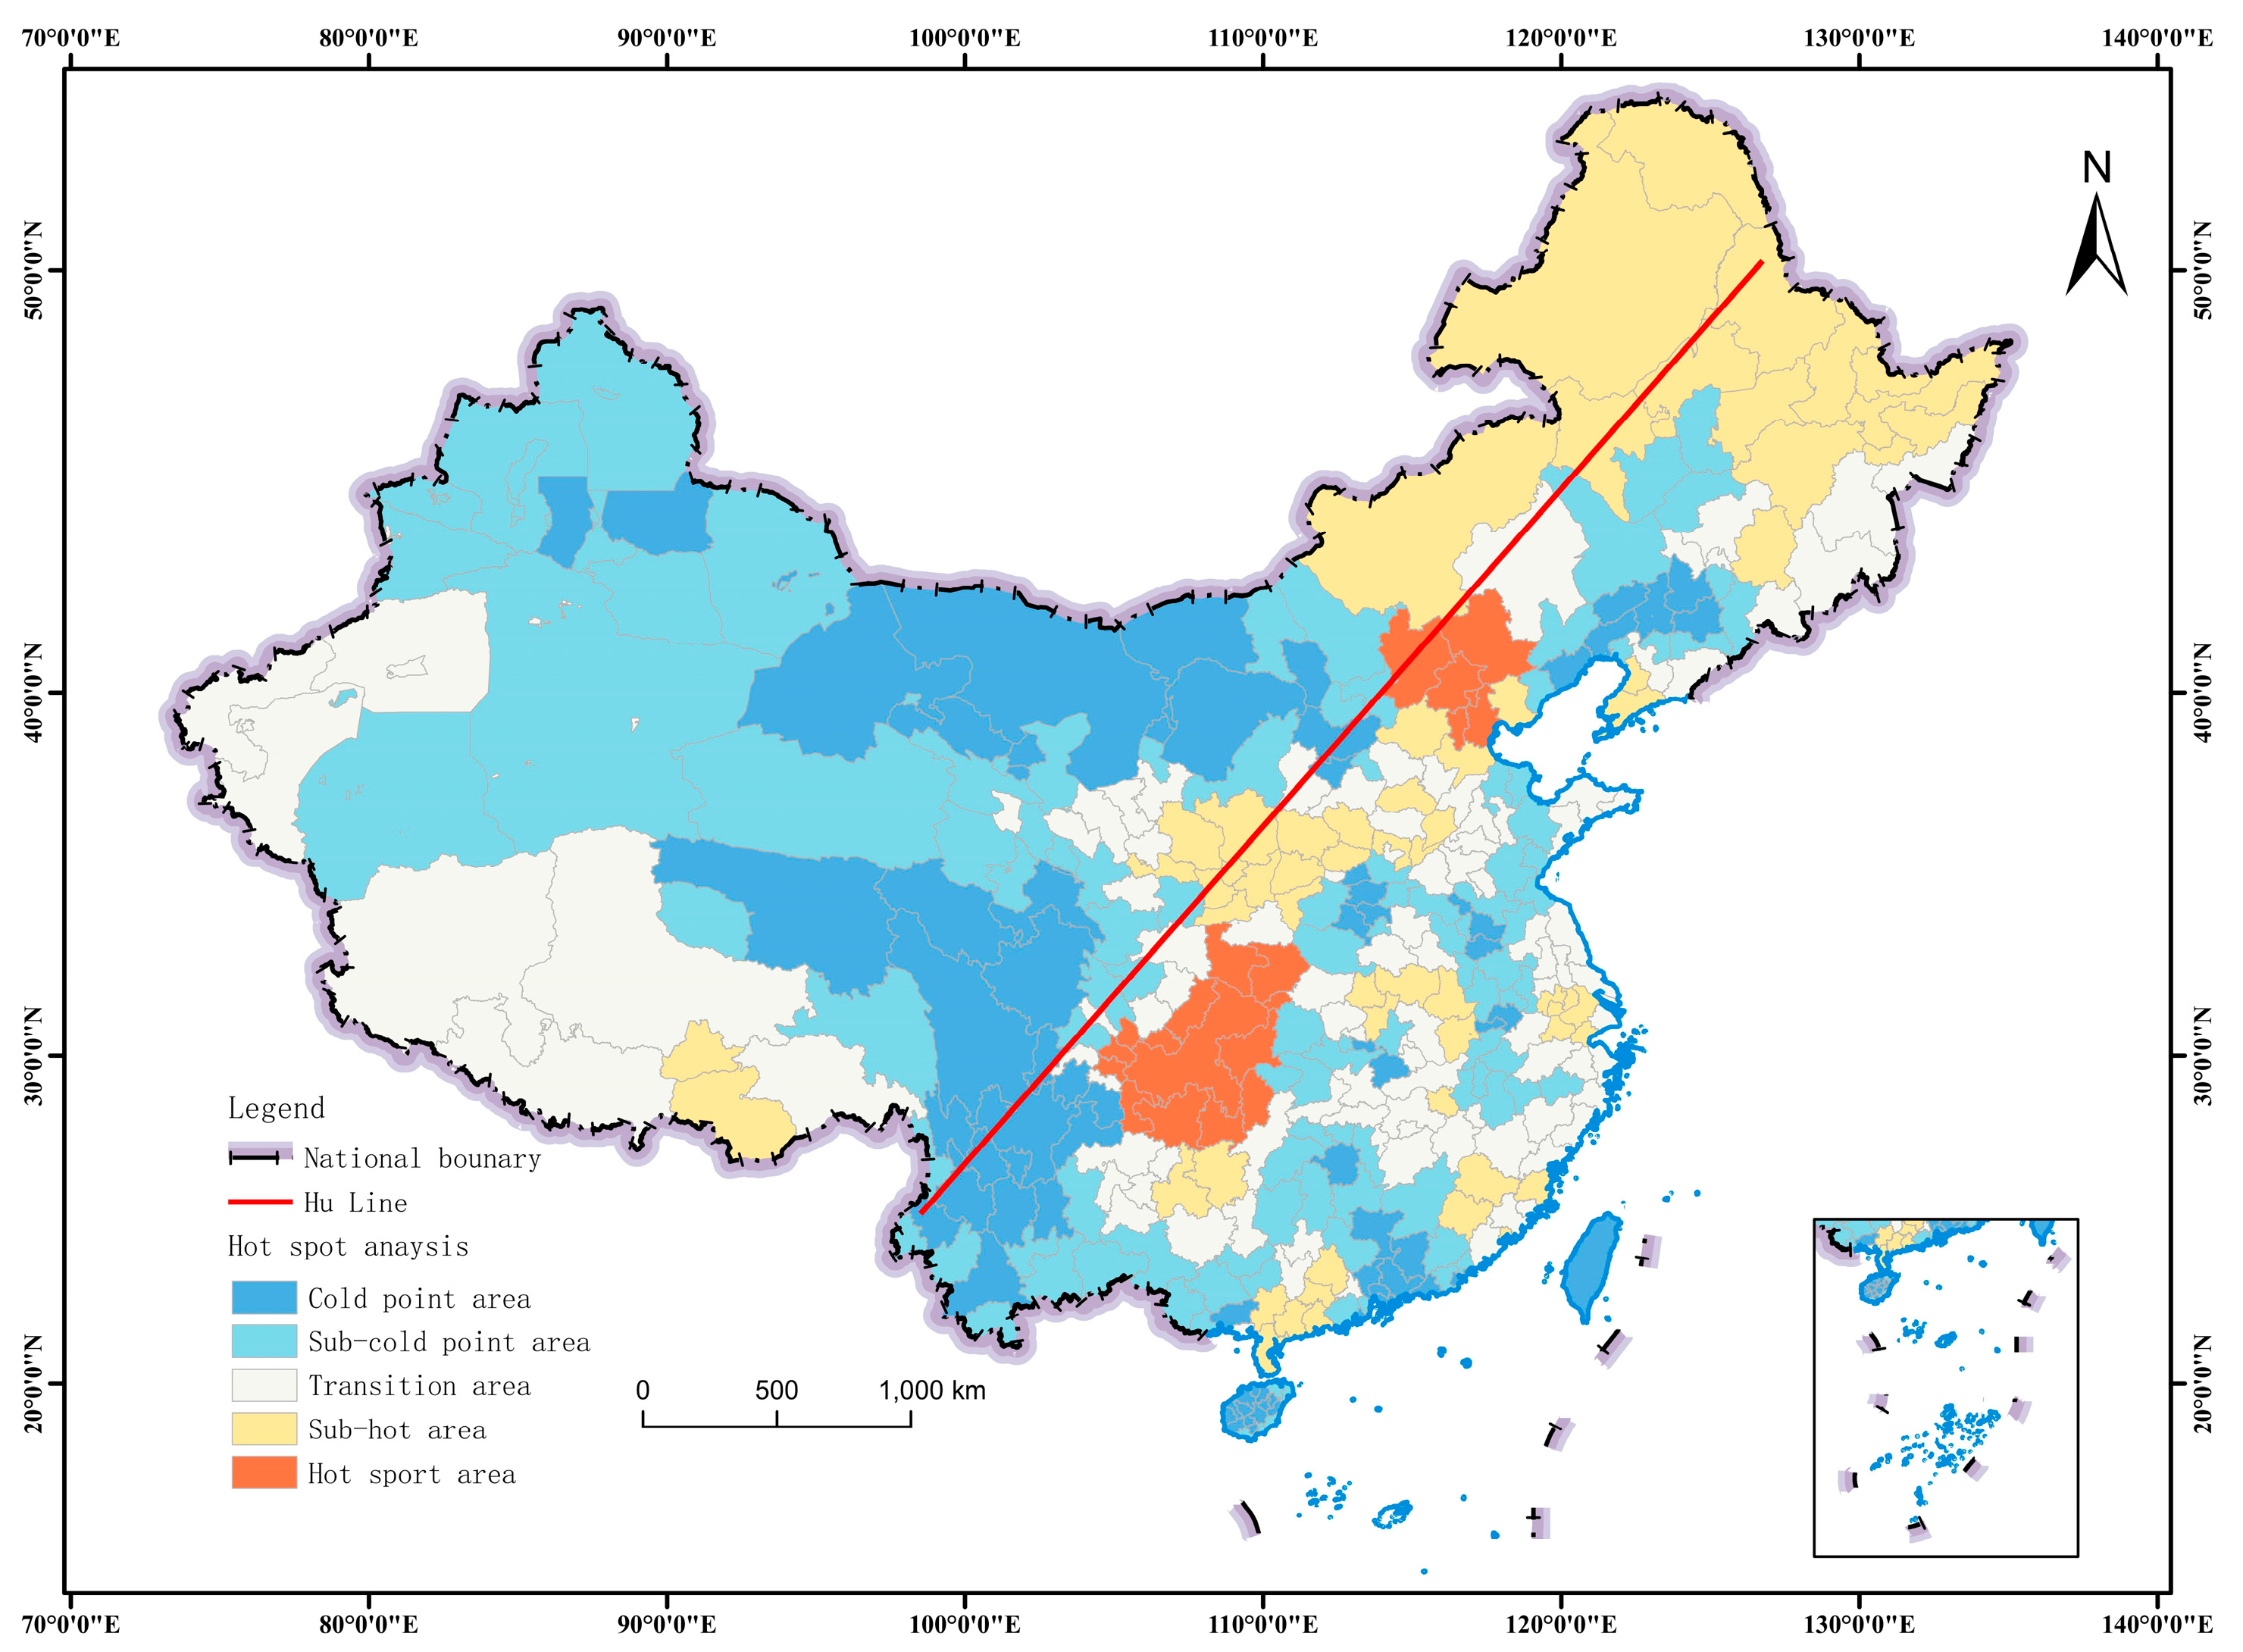
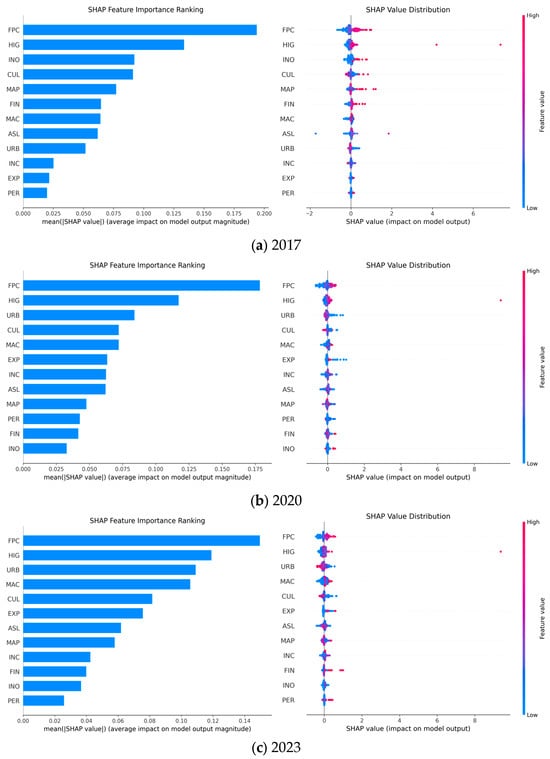
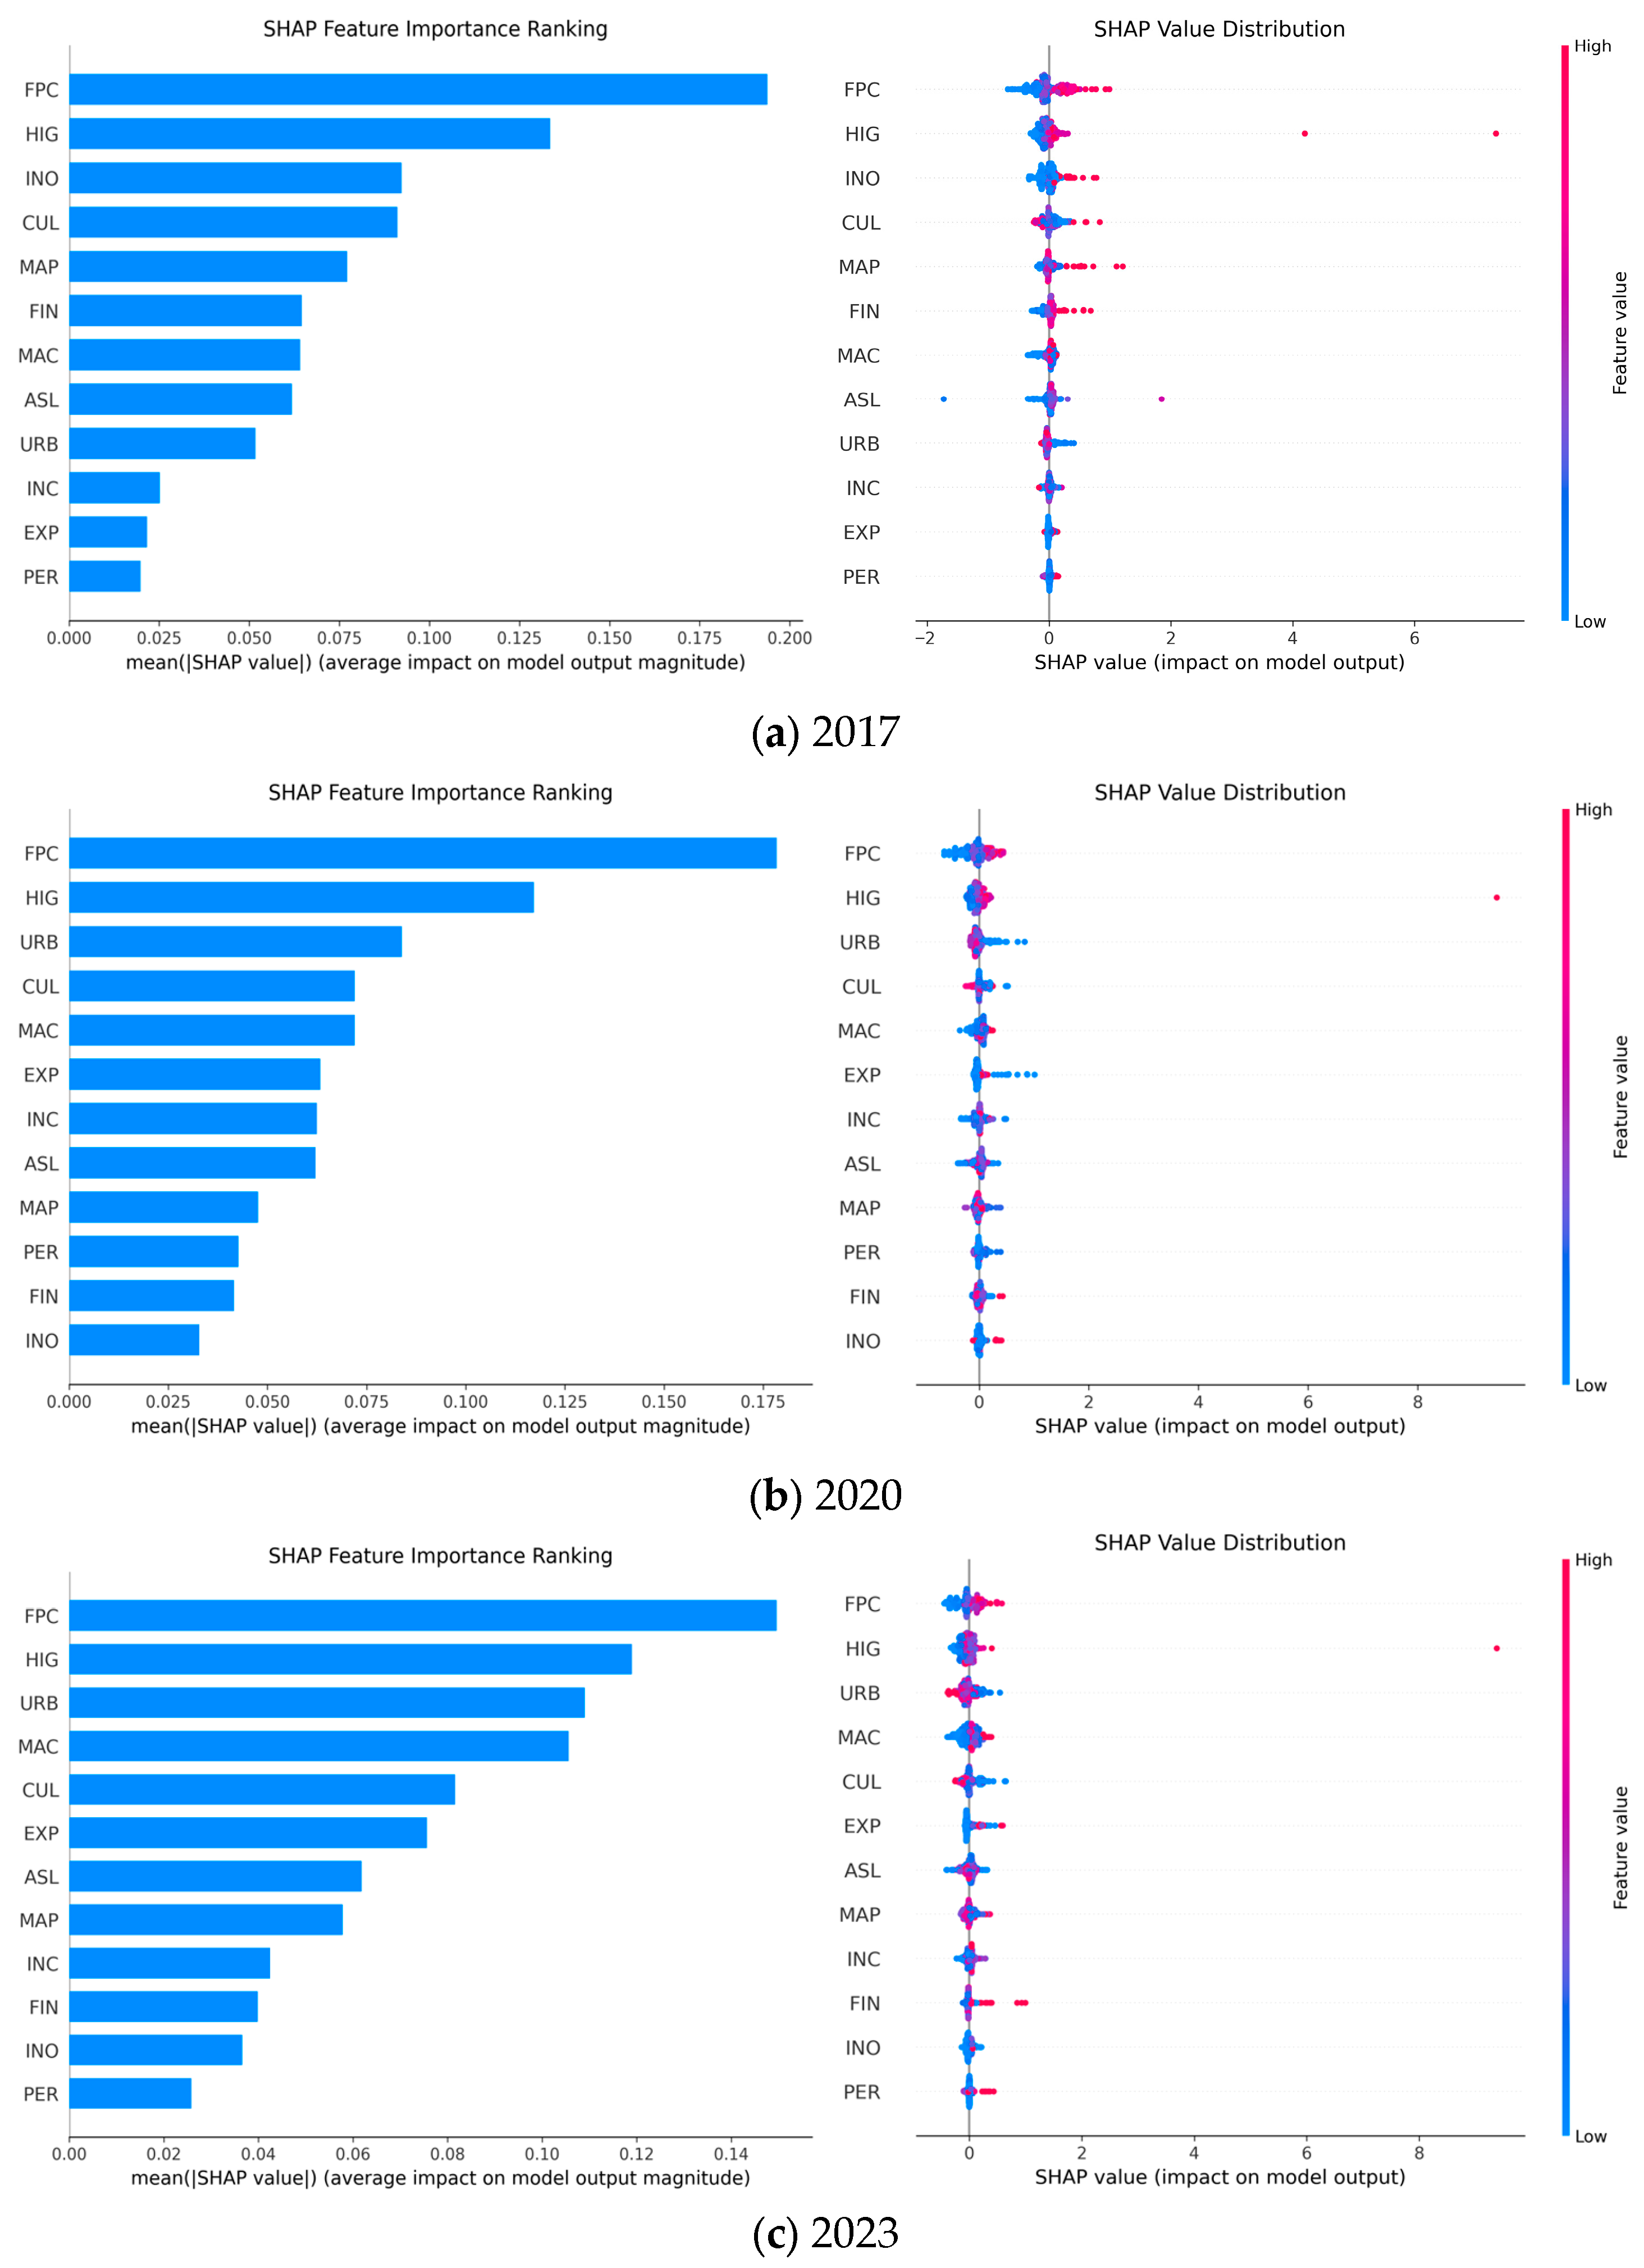
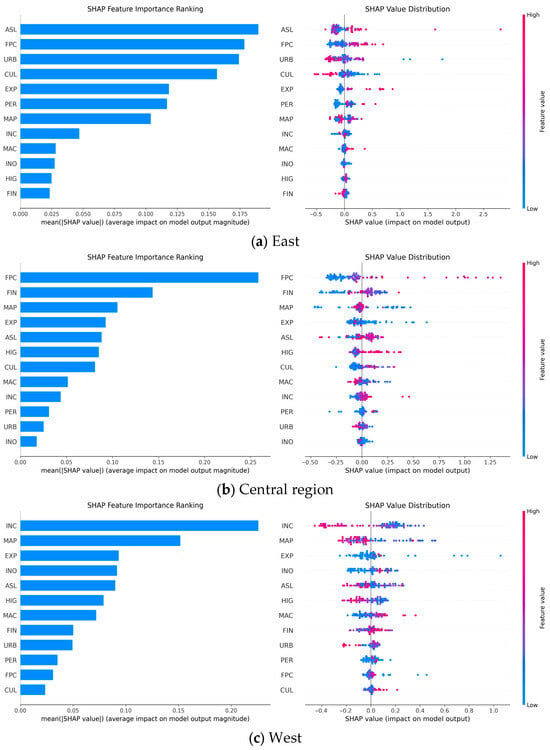
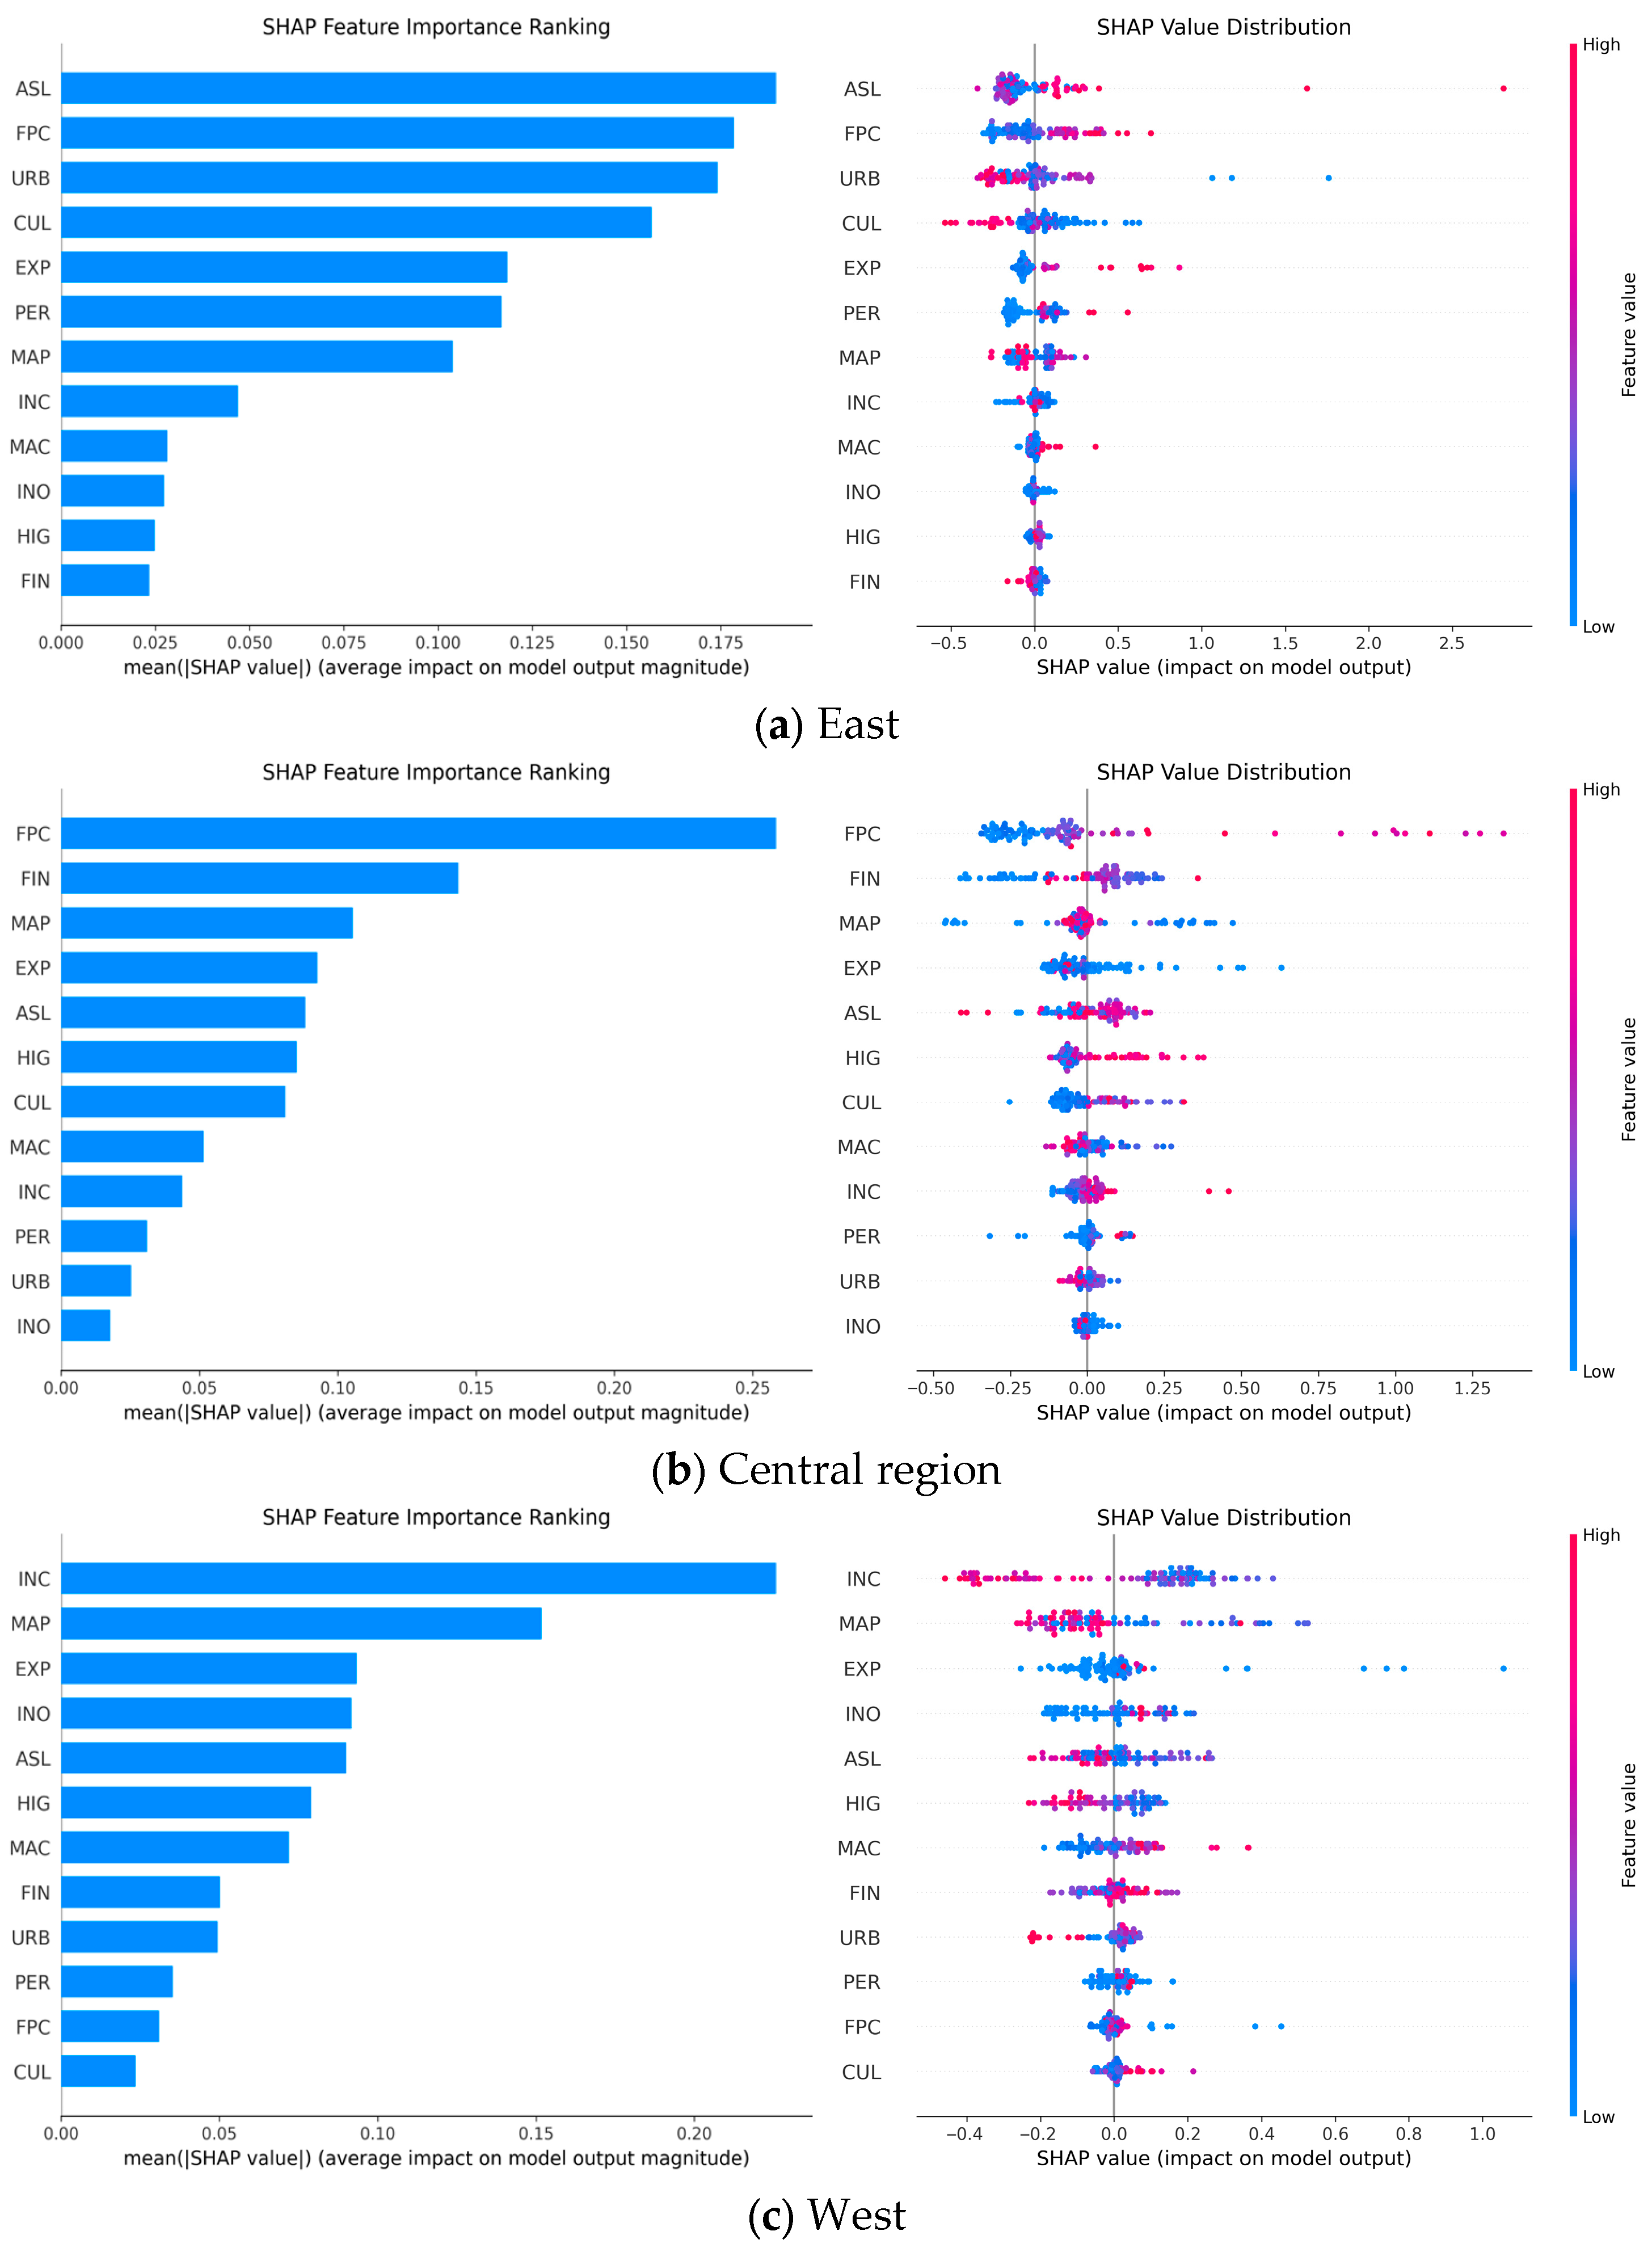
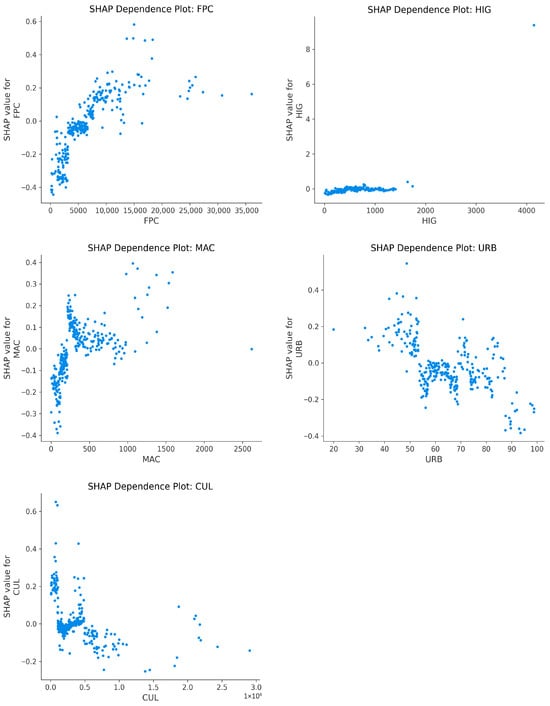
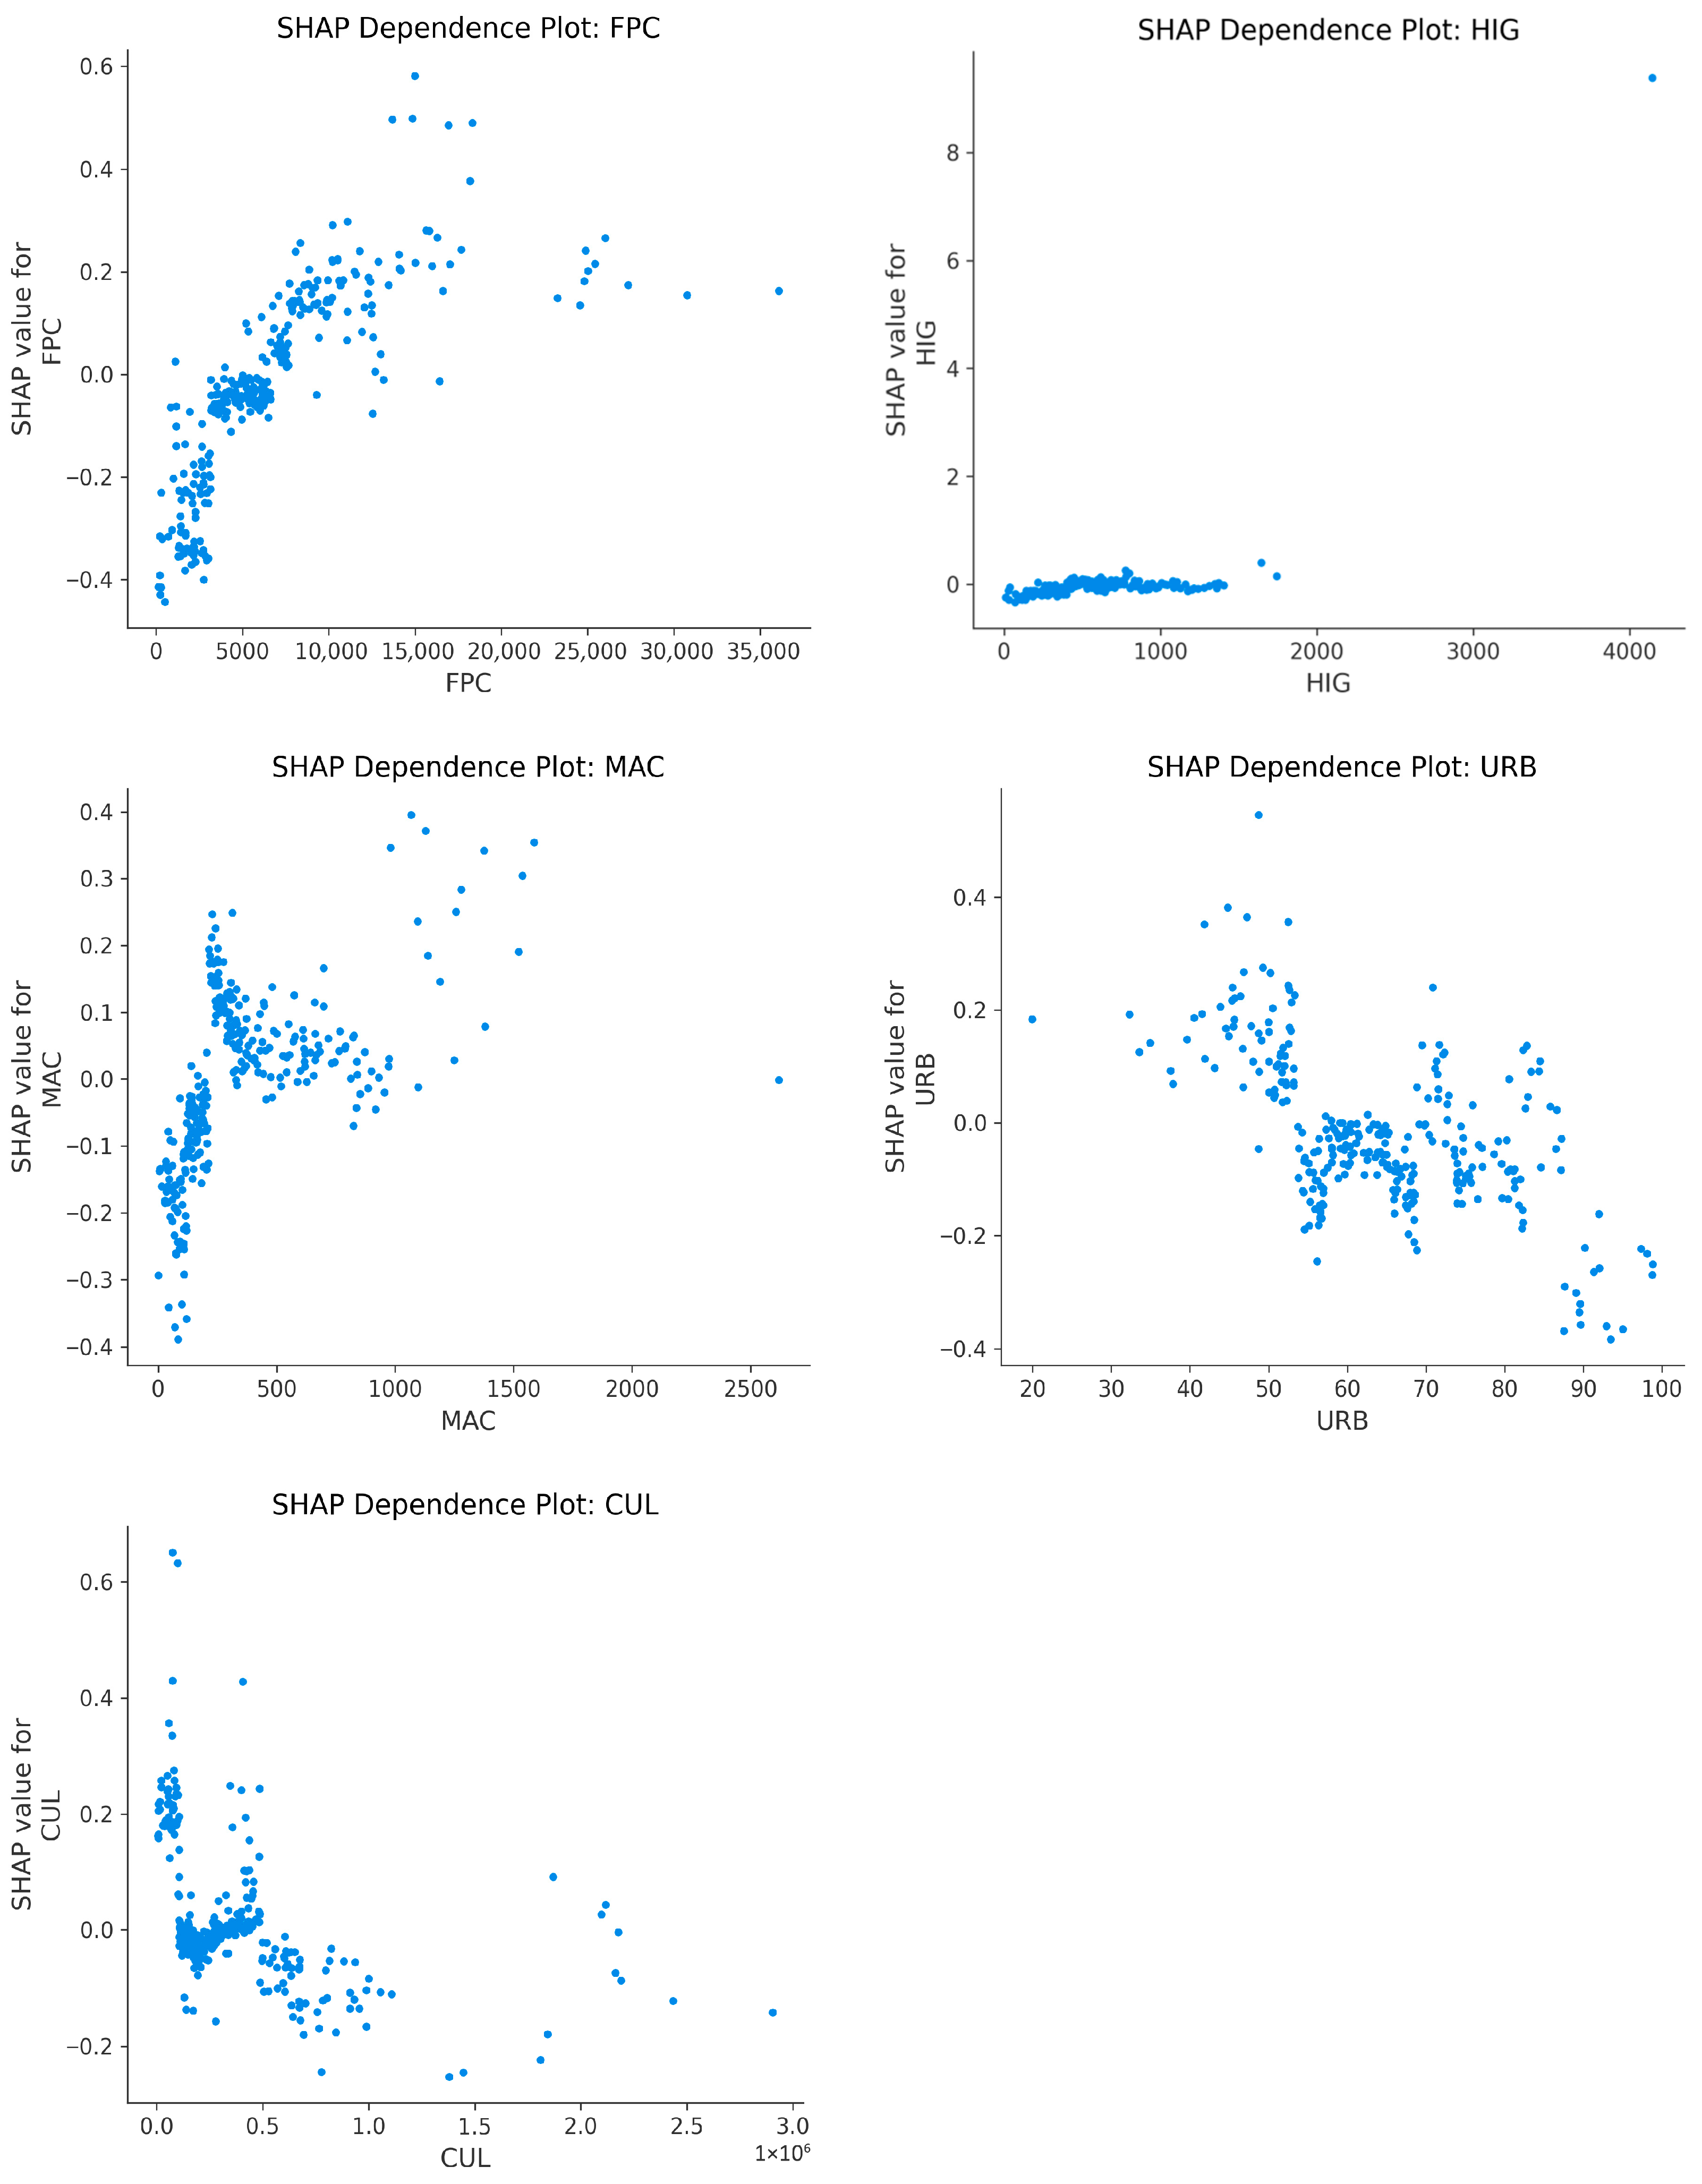
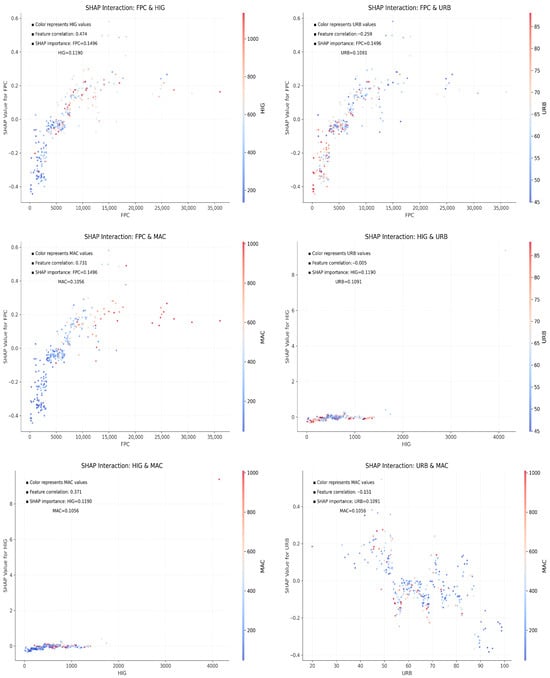
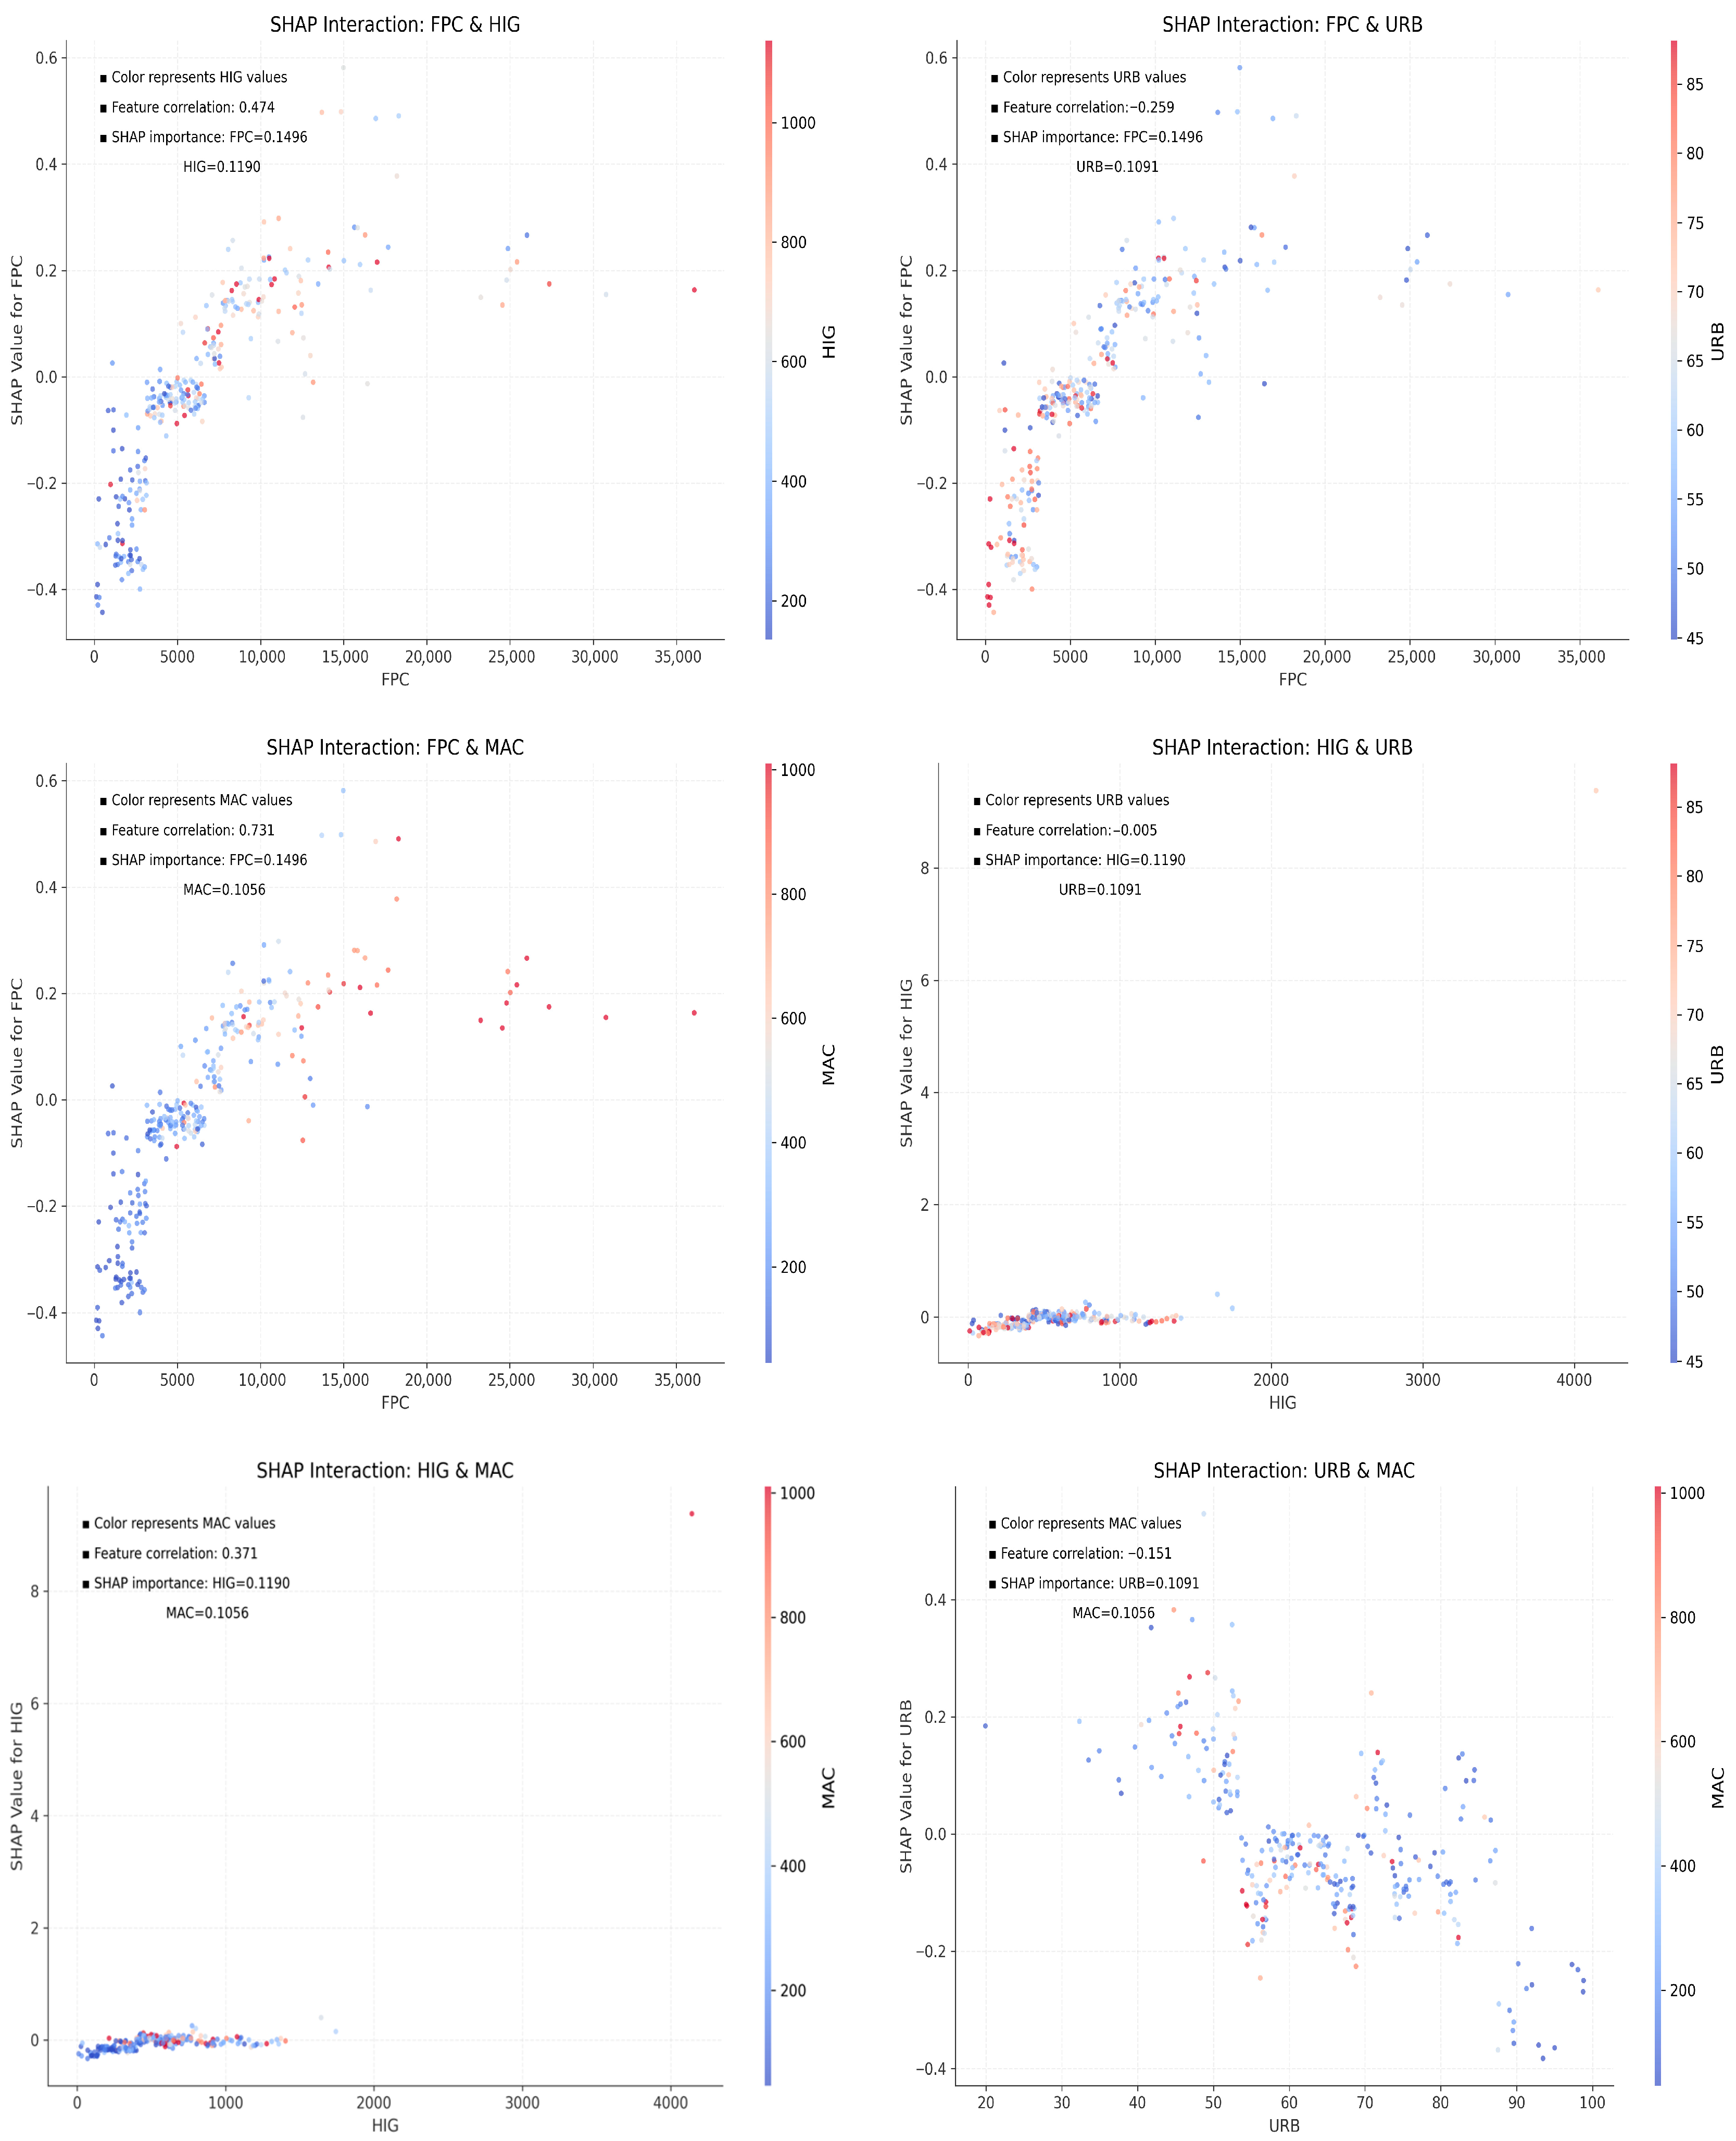

Disclaimer/Publisher’s Note: The statements, opinions and data contained in all publications are solely those of the individual author(s) and contributor(s) and not of MDPI and/or the editor(s). MDPI and/or the editor(s) disclaim responsibility for any injury to people or property resulting from any ideas, methods, instructions or products referred to in the content. |
© 2026 by the authors. Licensee MDPI, Basel, Switzerland. This article is an open access article distributed under the terms and conditions of the Creative Commons Attribution (CC BY) license.