


Abstract
This study presents a novel pneumatic seed-metering device for precision soybean breeding, engineered to deliver two seeds per hill with high operational reliability. Its design features a compartmentalized structure and an integrated seed-clearing mechanism, explicitly addressing the key limitations of conventional seeders, such as low automation levels and intervarietal contamination during seed switching. The seed-metering and clearing processes were analyzed using coupled discrete element method–computational fluid dynamics (DEM–CFD) simulations. The exploratory DEM–CFD analysis identified distinct operational thresholds for seeding failures: miss-seeding occurred at disc rotational speeds exceeding 2.55 rad s−1, while multiple-seeding issues were frequent at applied vacuum pressures above 5.6 kPa. Following this, a Central Composite Design (CCD) experiment was conducted in a controlled laboratory setting to examine the effects of operational speed and vacuum pressure on seeding quality indices. A multi-objective numerical optimization identified an optimal operational compromise with a seed-metering disc speed of 2.65 rad s−1 (approximately 1.82 km h−1) and an applied negative pressure of 5.80 kPa. This operating point effectively balances the competing failure modes of multiple seeding and miss-seeding, resulting in rates of 2.95% and 0.85% respectively. Field validation in saline–alkali soil conditions confirmed the device’s high precision, with actual multiple and miss-seeding rates maintained below 2% and 0.5%, respectively. Overall, this device significantly enhances seeding efficiency and operational reliability, providing a practical and effective solution for high-throughput soybean breeding programmes.
1. Introduction
China struggles with a long-term dependency on soybean imports to meet its domestic demand [1,2]. Cultivating new soybean varieties that have high yields and are tolerant to salt and alkali is essential for ensuring the nation’s food security [3,4]. Breeding-specific seed metering devices are crucial for this process, as they ensure accurate seeding and enhance breeding efficiency [5]. These specialized devices must distribute different seed varieties into designated plots, which requires two main functions: seed metering and seed clearing. During the pneumatic metering phase, seeds of a specific variety are selectively picked up using vacuum suction on a rotating disc. The following clearing phase is crucial for preventing contamination between different seed varieties. This phase removes any residual seeds from the disc apertures and the seed pool before switching to a new variety, ensuring that only seeds from the intended variety are dispensed [6]. Such contamination between experimental plots can invalidate trial results and compromise scientific integrity, often necessitating a complete restart of experiments. Despite the importance of this clearing process, conventional domestic soybean breeding seeders often suffer from structural complexity, low levels of automation, and inefficiently long seed-clearing times [7].
Breeding-specific seed metering devices are generally classified based on their seed-clearing functionality: stop-and-clear systems, which require operational halts between plots, and on-the-go clearing systems, which allow continuous operation. In China, most designs are stop-and-clear systems, creating a significant operational bottleneck. For instance, a socket-roller seed plate metering device has been developed where seed clearing relies on a manual, gravity-dependent process [8,9]. Subsequent iterations from the same research group include a rotary alternator type metering device [10], and a four-bar translational metering device [11]. However, both of these designs still require manual intervention, either rotating the seed disc or manipulating the mechanism, to clear residual seeds between different varieties. Although these devices represent important advancements and have utilized discrete element method (DEM) simulations to optimize parameters such as cell geometry and operational speed, their operational model remains labour-intensive and discontinuous. Recent research has focused on automation, such as a three-leaf pneumatic meter that achieves a clearing time of 0.3 s with a motor-driven mechanism [12]. Another strategy focuses on optimizing passive clearing elements, exemplified by studies on brush-type seeders that employ a “flexible gradual seed-clearing method” to improve clearing efficacy without damaging seeds [13]. However, these solutions often introduce mechanical complexity, function as adjunct subsystems, or are limited to a specific metering mechanism. Consequently, a critical and persistent research gap remains: the development of a fully integrated, rapid, and universally reliable automated seed-clearing system that eliminates operational downtime and fundamentally enhances the throughput of precision plot breeding.
The developed seed metering device is designed specifically for soybean breeding programmes in salt-affected soils. Numerous germination tests have demonstrated that high salt concentrations significantly reduce soybean seed germination rates [14]. In these salt-affected soils, soybean seeds are often sown in pairs per hole as a strategic management practice. This approach aims to mitigate the high risk of emergence failure and to ensure effective data collection from each plot. The objectives of this study were to (1) design and develop a pneumatic double-seed metering device featuring an integrated rapid seed-clearing mechanism to enable quick variety switching and prevent intervarietal contamination, (2) employ a coupled DEM-CFD simulation approach to analyze the seed-metering and clearing processes and understand the underlying mechanisms, (3) optimize the key operational parameters (seed-metering disc speed and vacuum pressure) to achieve minimal multiple and miss-seeding rates, and (4) validate the performance of the optimized prototype through field trials under saline–alkali soil conditions to confirm its practical reliability and precision.
The remainder of this paper is organized as follows: Section 2 outlines the materi-als and methods, including the device design, theoretical analysis, DEM-CFD modelling approach, and experimental design. Section 3 presents the results and discussions based on the numerical simulations, single-factor tests, response surface optimization, and field validation. Finally, Section 4 summarizes the main conclusions of this study. The results confirm that the proposed device achieves high seeding precision with minimal clearing time, thereby providing a practical and efficient solution to enhance the reliability and throughput of mechanized soybean breeding programmes.
2. Materials and Methods
2.1. Metering Device Design and Modelling
2.1.1. Structural Configuration and Operating Principle
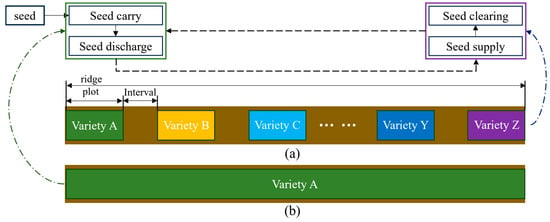
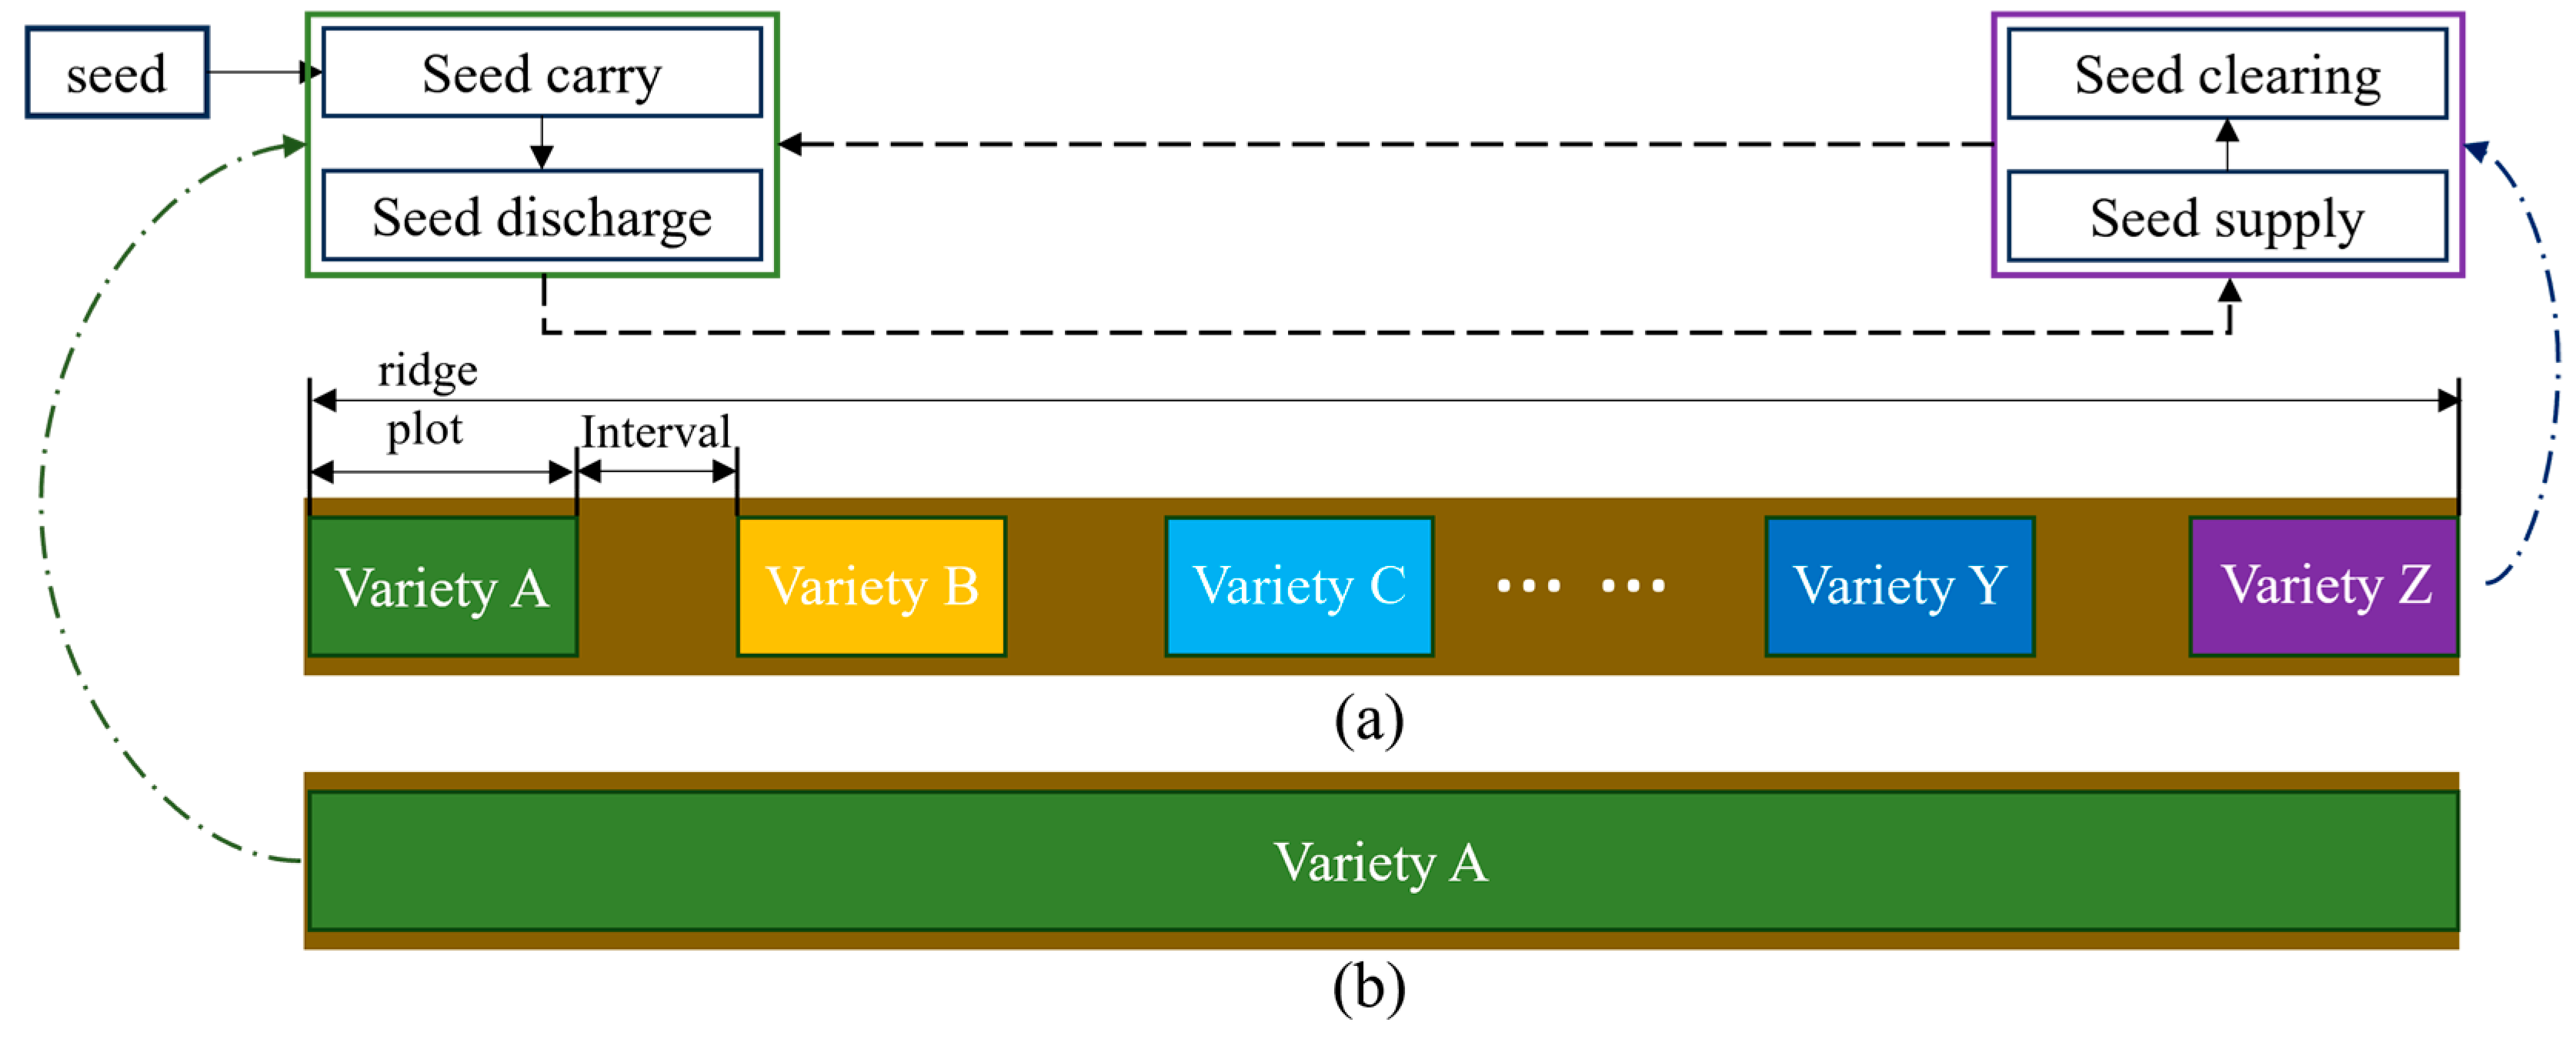
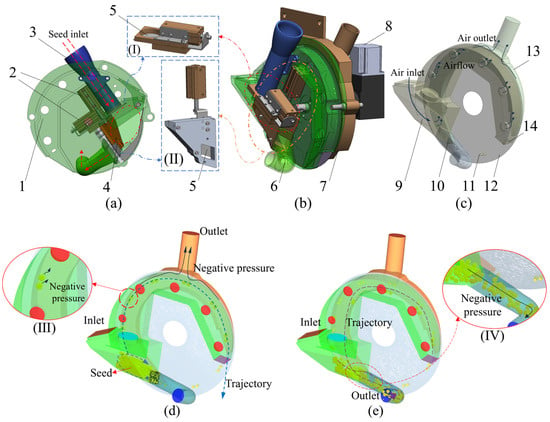
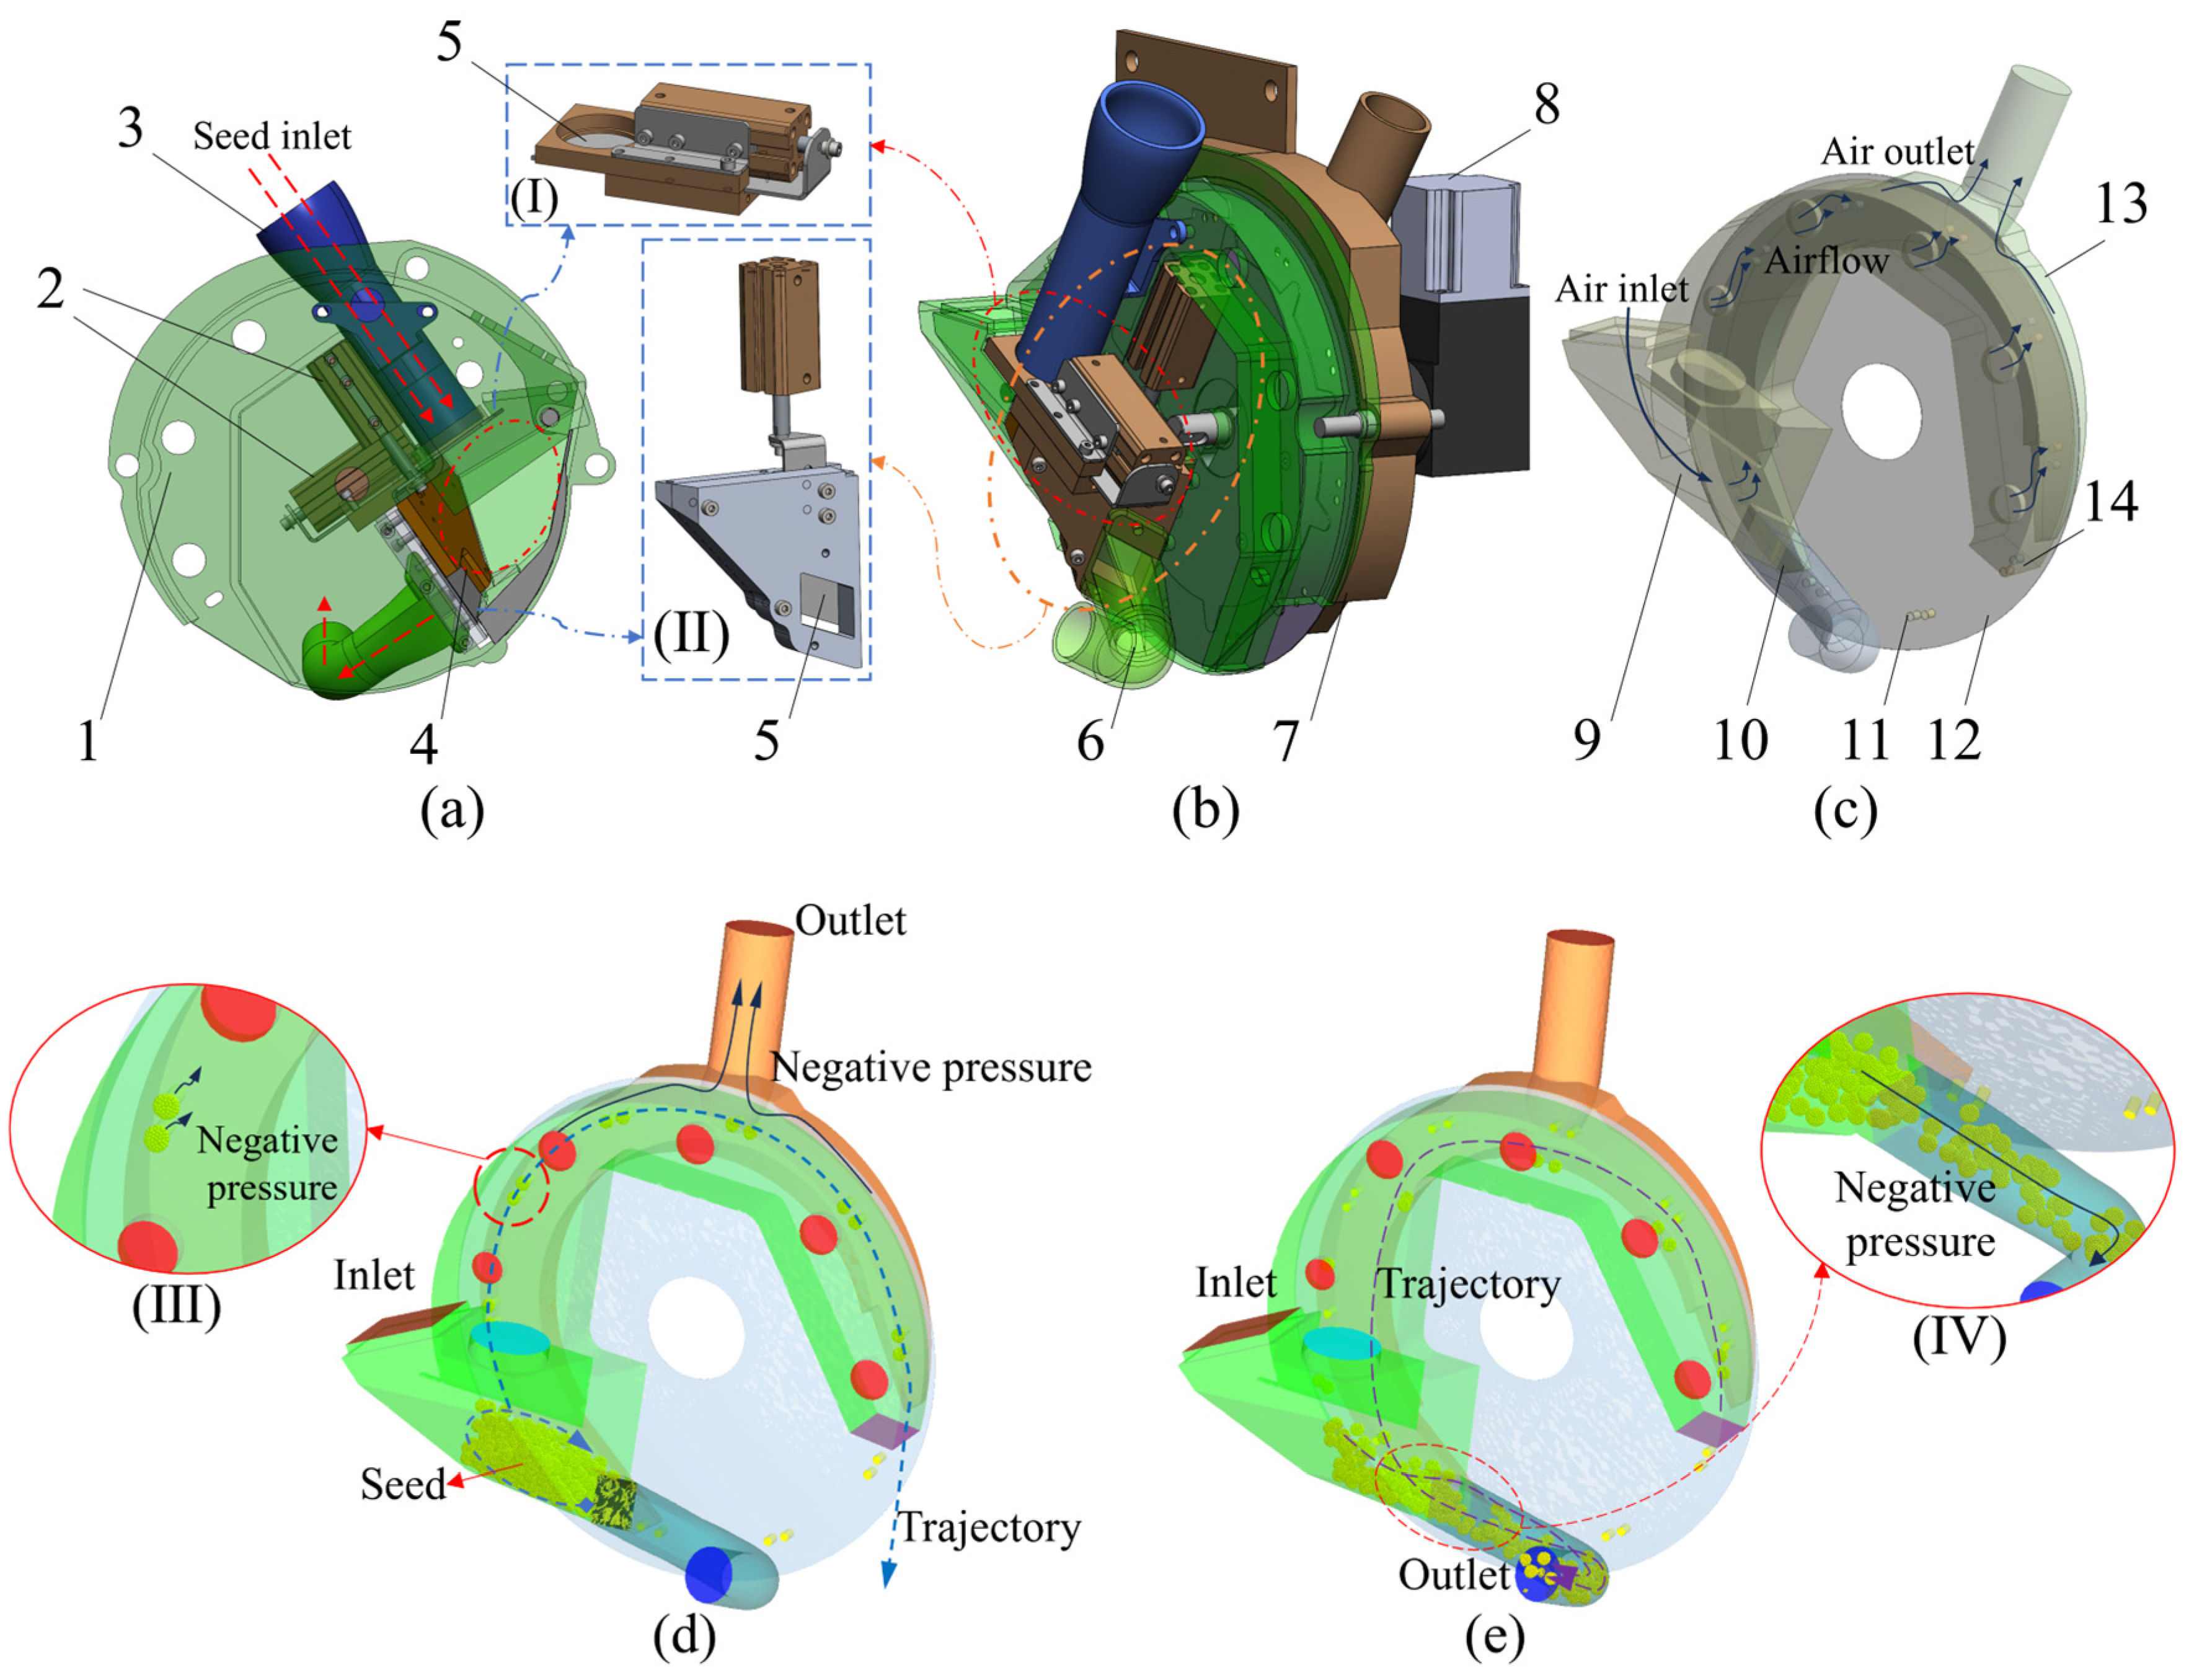
The breeding-specific seed metering device must perform three essential functions: seed supply, seed metering, and seed clearing (Figure 1). The specialized metering device developed in this study is designed to effectively prevent the mixing of different seed varieties (Figure 2). The internal architecture is functionally segmented into four distinct zones: the air supply inlet, the vacuum outlet, the seed pickup region, and the purging zone. The central functional zone is the rotational seed-pickup zone, which contains a set of seed supply and seed clearing valves. Seeds flow from the hopper through the seed inlet but are blocked by the closed seed supply valve, preventing them from entering the seed chamber until the valve opens. Once the seed supply valve is activated, seeds enter the seed pool, where the suction force picks them up on the suction hole of a seed metering disc (seed disc) for discharge. Once the sowing of a specific seed variety is completed, the residual seeds within the seed pool and those adhered to the suction holes are evacuated through the clearing pipe by applying a negative pressure differential at the purging outlet. In the proposed design, all flow-control valves are pneumatically actuated.
Figure 1.
Sowing pattern comparison between experimental breeding and conventional agriculture. (a) Individual row layout for small-plot breeding trials; (b) Contiguous row layout for large-scale conventional sowing.
Figure 2.
Exploded view and operational schematics of the pneumatic seed metering device. (a) External housing; (b) Cross-sectional view of the internal assembly; (c) Computational fluid dynamics (CFD) model of the internal fluid domains; (d) Schematic of the seed metering process; (e) Schematic of the seed clearing process. Key: (1) Seed Housing, (2) 3/2-Way Pneumatic Solenoid Valve, (3) Seed Delivery Tube, (4) Seed Chamber, (5) Baffle/Deflector, (6) Clearing Air Tube, (7) Exhaust Air Housing, (8) Drive Motor, (9) Seed Metering Zone (Fluid Domain), (10) Seed Clearing Zone (Fluid Domain), (11) Seed Pickup Hole (Fluid Domain), (12) Seed Disc, (13) Air Exhaust Zone (Fluid Domain), (14) Seed Outlet, (I) Seed Supply Valve, (II) Clearing Valve, (III) seed metering process, (IV) seed clearing process.
2.1.2. Determination of the Operational Speed Range
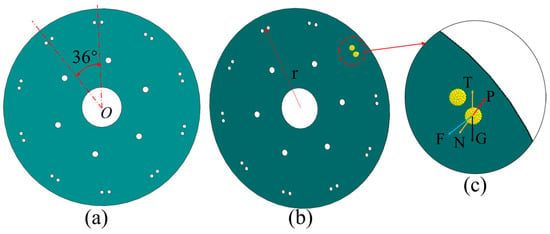
Based on agronomic planting guidelines, the recommended density for soybean sowing is between 16 and 20 plants per square metre. In this study, the seed meter is designed for hill sowing of soybeans, targeting a spacing of 120 mm with two seeds sown per hill. The design of the seed disc is crucial, as it directly affects the efficiency of seed pickup and retention during transport from the pickup point to the release point. As illustrated in Figure 3, the seed disc has 10 suction holes, with a central angle of 36° between each adjacent suction holes. During operation, seeds are held in place on the vacuum orifices by suction and are transported along the disc’s uniform circular motion to the release point. As illustrated in Figure 3c, during rotation, the seed is primarily influenced by three forces: gravitational force, the force resulting from the pressure differential, and the supporting force provided by the seed disc [15]. The combination of these forces generates the centripetal force necessary for the seed’s circular motion. As the seed’s position continuously changes, the direction of the centripetal force acting on the soybean seed also shifts accordingly. This leads to fluctuations in the forces experienced by the seed during discharge, reflecting a state of dynamic balance, as described in Equation (1). Among these forces, the gravitational force remains constant, while the centripetal force, although variable in direction, displays only minor changes in magnitude. The vacuum force maintains a consistent direction, but it may experience slight fluctuations in intensity. If the vacuum force becomes insufficient to keep the seed adhered to the suction hole, the seed may detach due to inertia and gravity. To ensure consistent seed adhesion by the seed disc, it is crucial to investigate both the maximum operational speed of the seed disc and the minimum vacuum force required.
where
Figure 3.
Schematic of the seed disc: (a) Central angle between adjacent suction holes; (b) Rotation radius of the suction holes; (c) Force analysis on a seed.
- Fc—Centripetal force required for seed motion, N;
- P—Vacuum force acting on the seed, N;
- G—Gravitational force on a single seed, N;
- T—Resultant force on the seed in the seed disc’s horizontal plane, N;
- N—Resultant force on the seed in the seed disc’s vertical plane, N;
- m—Mass of a single seed, kg;
- r—Radius of rotation, m;
- ω—Angular velocity of the seed disc, rad s−1.
The seed-metering device is an integral component of the seeder, operating synchronously with its forward travel. To achieve the desired hill spacing (S), the angular velocity of the seed disc (ω) must be coordinated with the seeder’s forward speed (v), as outlined by the fundamental sowing equation (Equation (2)). In this case, with a suction hole rotational radius (r) of 106 mm, a target hill spacing (S) of 120 mm, and a discharge rate (L) of 10 hills per disc revolution, the maximum allowable angular velocity for the seed disc is calculated to be = 3.67 rad s−1. This angular limit corresponds to a maximum operational forward speed of = 2.52 km h−1 for the seeder, given the specified spacing requirements.
where
- v—Forward speed of the seeder, m s−1;
- S—Hill spacing on the ground, m;
- L—Number of hills per revolution.
This study presents a double-seed-per-hill metering disc (hereafter, the double-seed disc), which is designed to sow two seeds per hill (Figure 4). The mechanism for picking up the seeds relies on suction created by airflow passing through holes in the seed metering disc.
Figure 4.
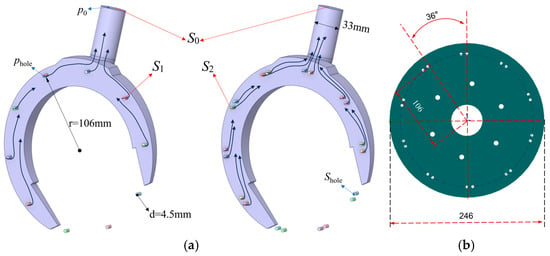
Configurations of the seed metering disc: (a) double-seed-per-hill disc; (b) dimensional drawing of the disc with measurements in mm.
For an incompressible airflow at a constant volumetric flow rate , the principle of mass conservation (continuity) requires that:
where is the airflow velocity and is the total effective area of the suction holes.
The double-seed disc has approximately twice the total area of suction holes compared to the single-seed disc (S2 ≈ 2S1). For a given pressure differential created by the vacuum system, the volumetric flow rate through an orifice is directly proportional to its area. Therefore, to maintain the same pressure differential, and consequently the same suction force for reliable seed pickup, the system must provide about twice the volumetric flow rate when using the double-seed disc. The pressure differential driving the airflow can be analyzed using a simplified form of the Bernoulli equation, assuming incompressible, steady, inviscid flow with negligible elevation change. For a streamline from the suction holes to the system outlet, the equation reduces to:
where and are the static pressures (Pa) at the suction hole and system outlet, respectively, and are the corresponding airflow velocities (m s−1), and represents the air density (kg m−3).
Applying the continuity condition for steady flow (), the pressure deficit at the suction hole relative to the outlet is derived as:
In an ideal scenario where the seed completely fills the hole without allowing air to escape, the main retention mechanism is the aerodynamic drag force generated by the resulting pressure deficit. This force can be described as:
2.1.3. Determination of the Operational Vacuum Pressure Range
In a pneumatic seed metering system, the vacuum dwell time for each suction hole on the rotating disc is inversely proportional to the disc’s rotational speed. To compensate for the reduced dwell time and ensure reliable seed pick-up, the applied vacuum pressure must be increased accordingly. The critical suction pressure required to lift and retain a single soybean seed was theoretically derived as a function of the seed mass, the coefficient of friction, the suction hole’s rotational radius and diameter, and the operational speed of the metering disc [16].
where
- —The maximum vacuum pressure at the filling stage to reliably pick up and hold a seed;
- —Seed suction reliability coefficient (1.8–2.0);
- —Operational reliability coefficient (1.6–2.0);
- m—Mass of a single seed, kg;
- g—Gravitational acceleration (9.81 m s−2);
- a—Distance between the seed centroid and the seed metering disc, m;
- d—Diameter of the suction hole, m;
- μ—Static coefficient of friction between the soybean seeds;
- —The linear velocity of the suction hole as the seed disc rotates, m s−1;
- r—suction hole rotational radius, m.
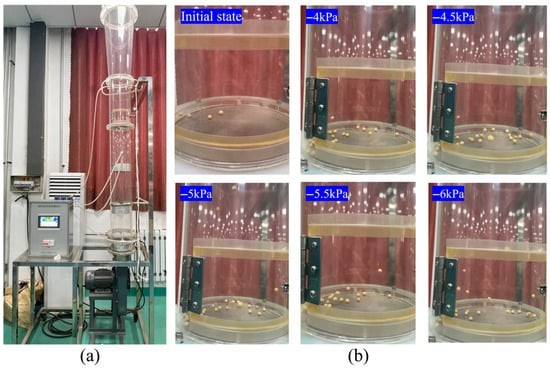
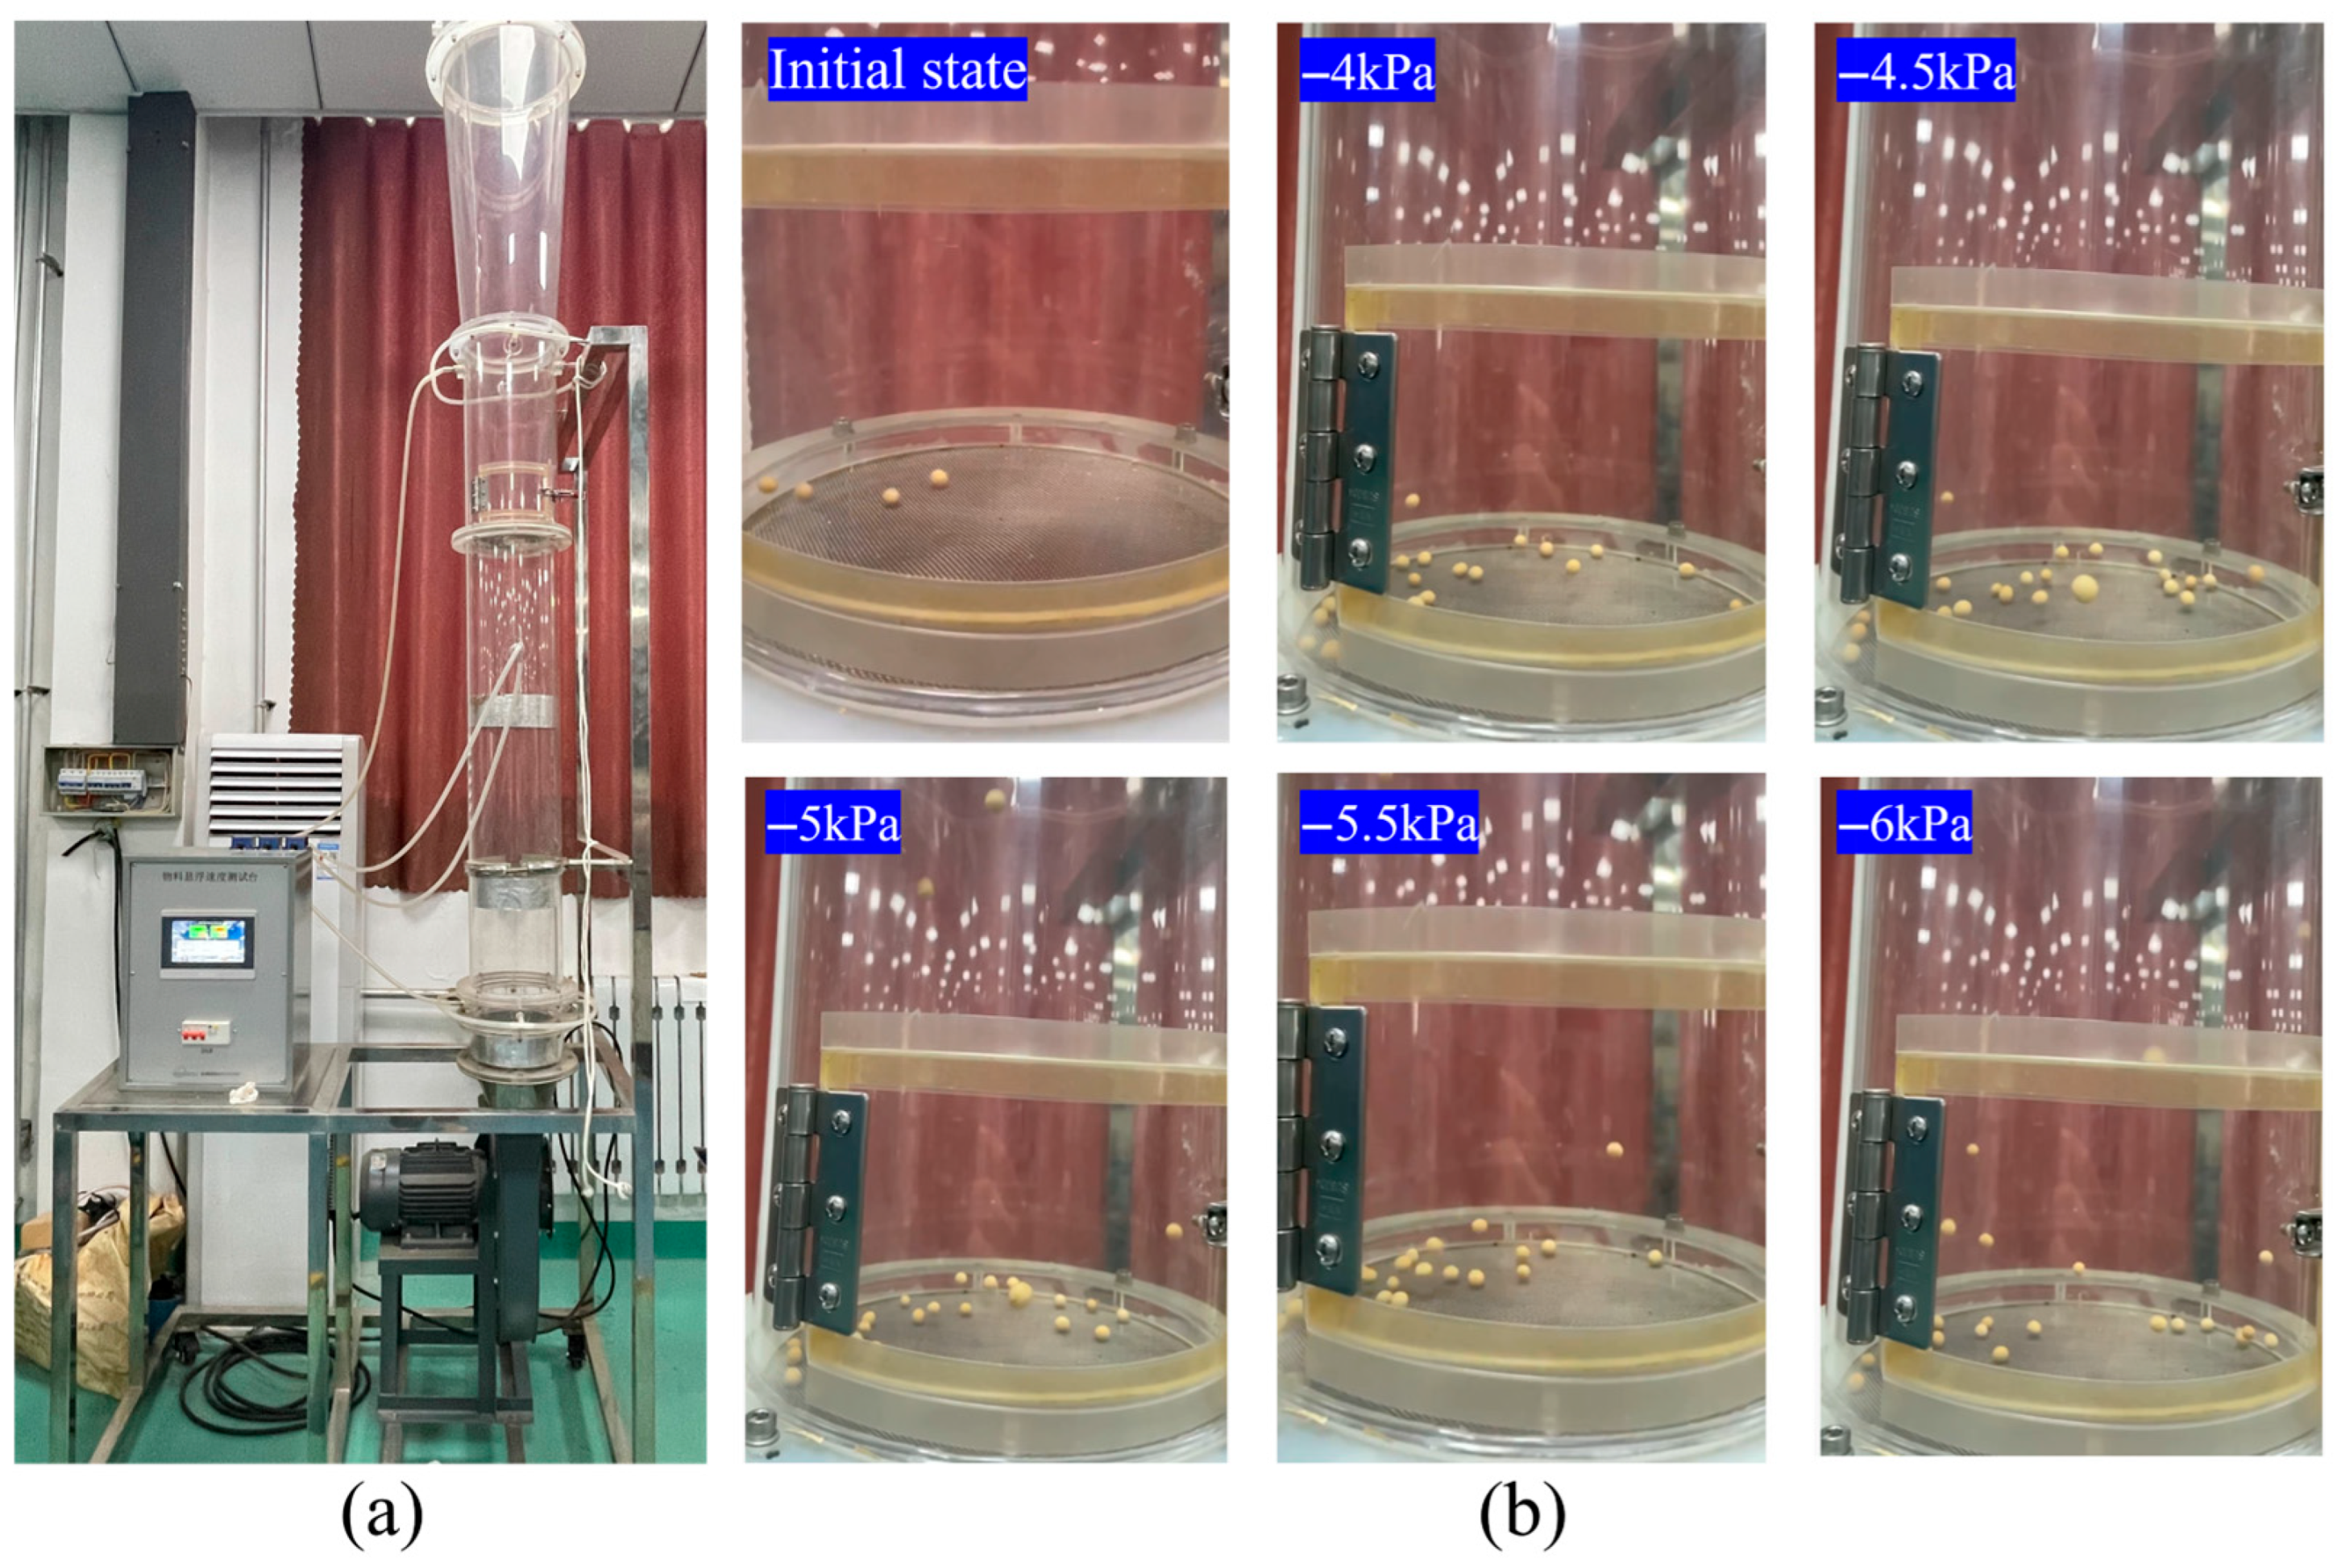
For this analysis, the following key parameters were specified: the static friction coefficient (μ) of 0.29, a suction hole diameter (d) of 4.5 × 10⁻³ m, and a seed plate pitch radius (r) of 0.106 m. Using these parameters in Equation (7), we calculated the theoretical suction pressure () required for reliable seed pick-up to be 6 kPa. This theoretical value was validated through empirical measurements of the minimum fluidization velocity for soybean seeds. A custom vacuum test apparatus was utilized to determine the critical suction pressure required to move soybean seeds against gravity (Figure 5). The setup included a sealed vacuum chamber connected to a variable-flow regulator and a digital pressure gauge. Twenty seeds were placed in the vacuum chamber, and the vacuum pressure was gradually increased by 0.5 kPa, starting from an initial pressure of 0 kPa. During each increment, the seeds were visually inspected, and the pressure at which all the seeds showed observable vertical movement of the vacuum chamber’s bottom was recorded as the critical suction pressure.
Figure 5.
Measurement of soybean seed fluidization pressure: (a) suction-based test apparatus; (b) seed suspension states at incremental suction pressure levels.
2.2. Soybean Seed Modelling
2.2.1. Determination of Soybean Seed Physical Dimensions
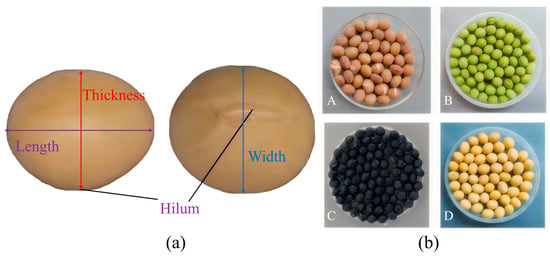
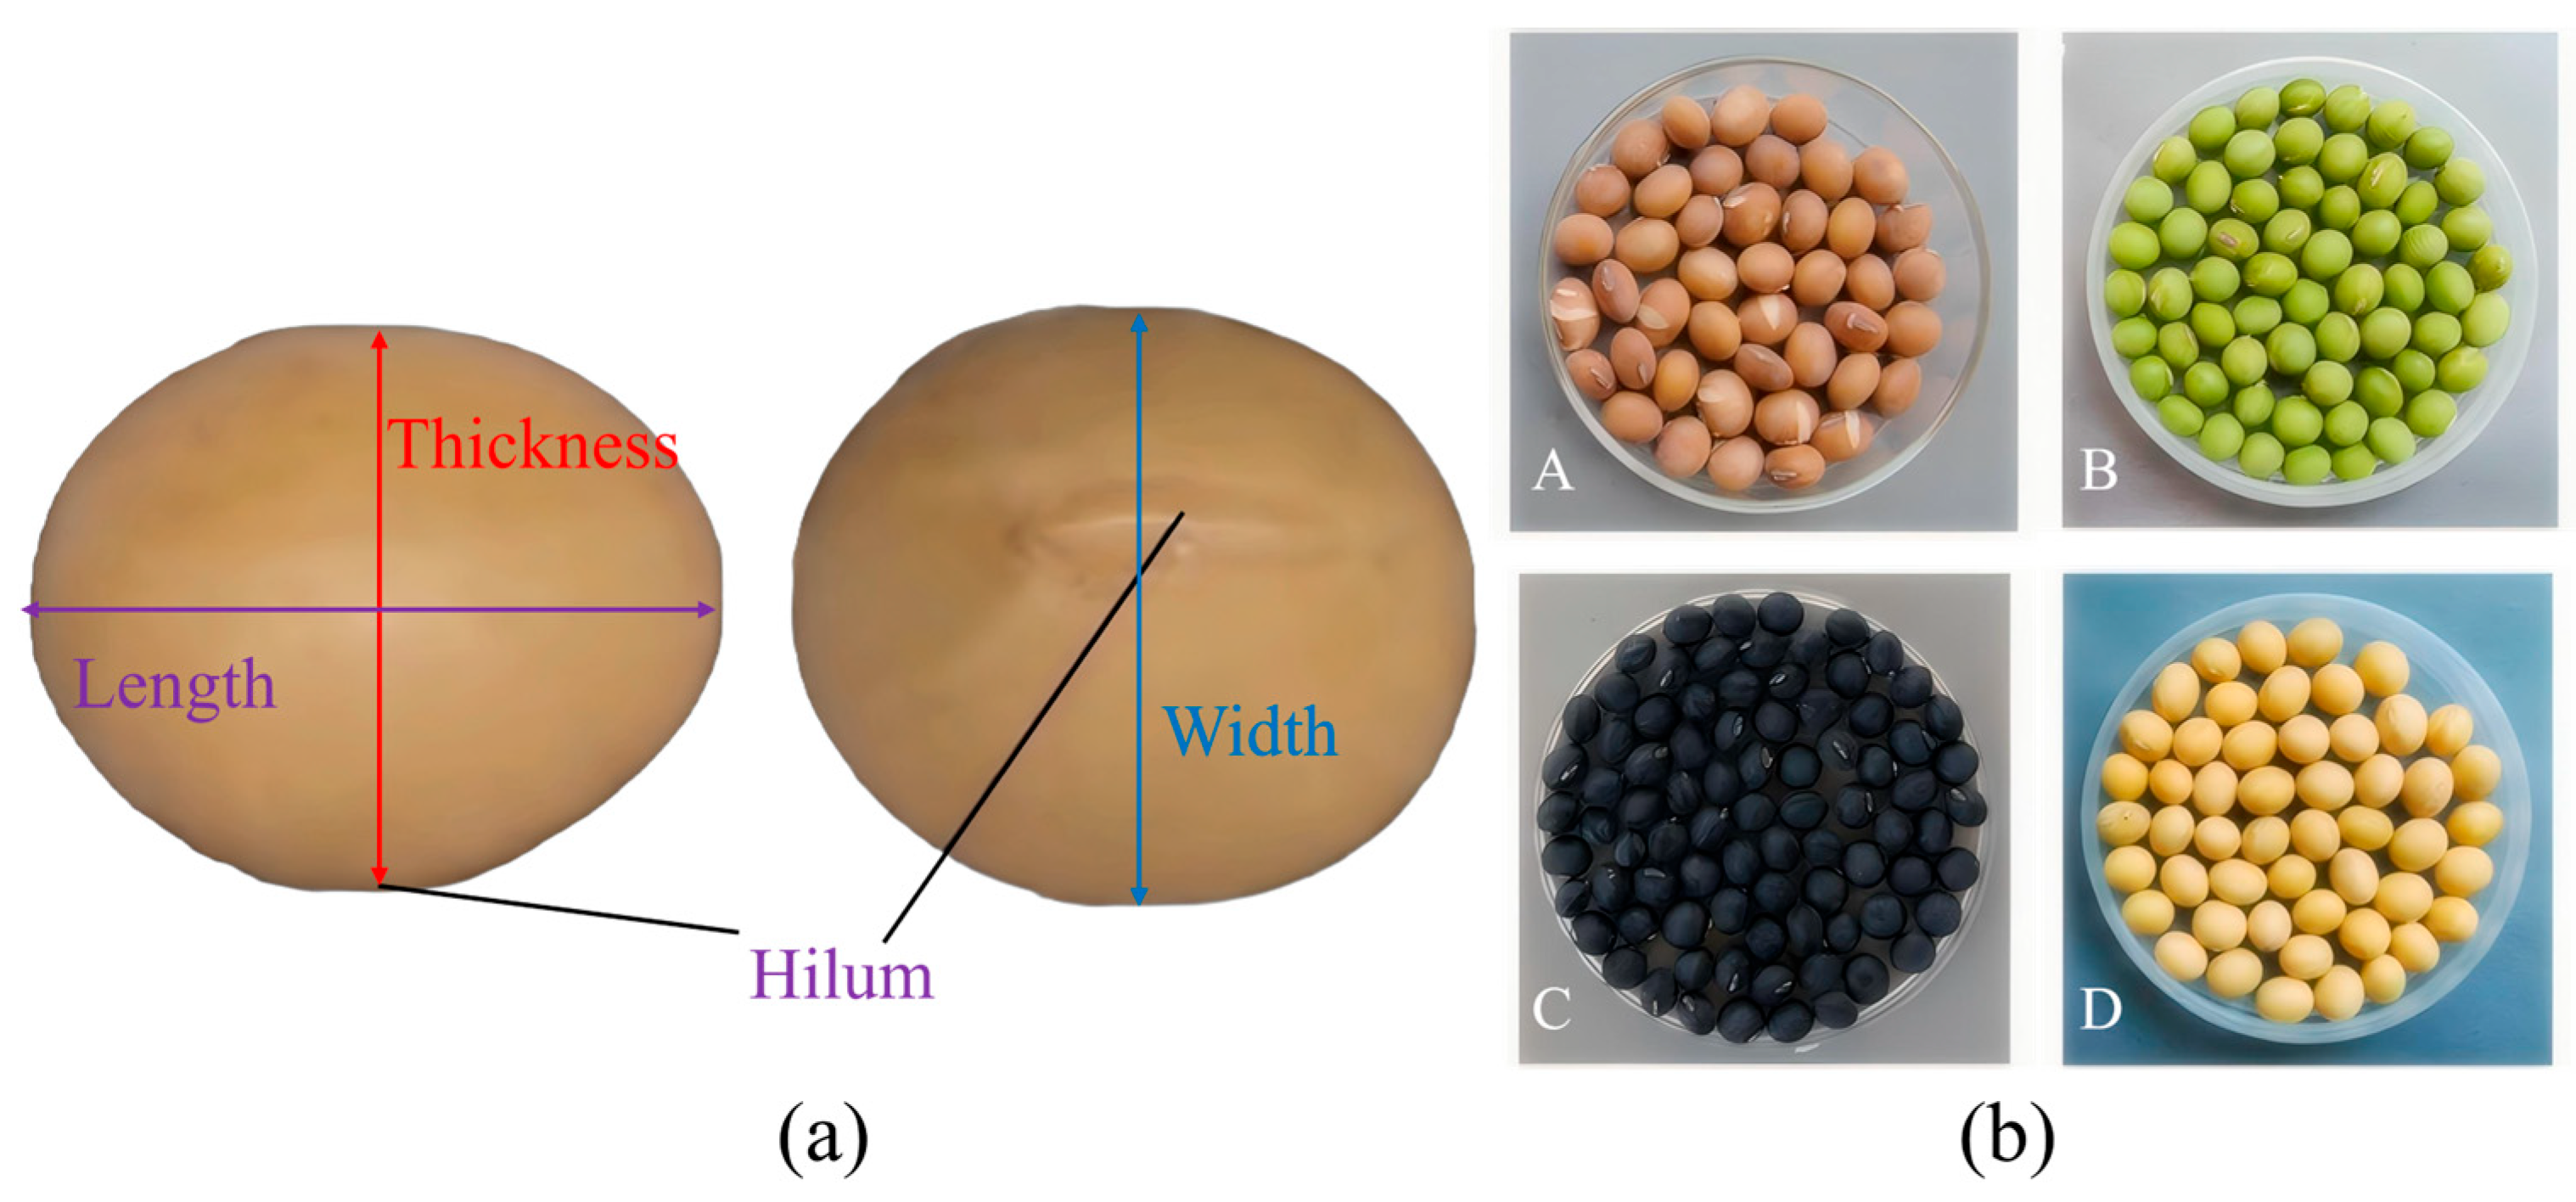
The seed metering device developed in this study accommodates various seed varieties. To thoroughly assess its adaptability, four distinct types of soybean seeds were selected, and their three primary dimensions (length, width, thickness) were measured (Figure 6).
Figure 6.
Measurement of Soybean Seeds. (a) Dimensional parameter measurement setup; (b) The four soybean varieties used in this study: (A) Longdou 13, (B) Zhonglong Qingdadou 1 (Green), (C) Zhonglong Heidadou 1 (Black), (D) Heinong 91.
The ellipsoidal shape of soybean seeds was analyzed by measuring their principal dimensions—length, width, and thickness. For each variety, a sample of thirty seeds was examined using an electronic digital calliper (NEIKO 01407A, Neiko Tools USA, Lincolnshire, IL, USA). Additionally, the mean seed mass was determined by gravimetric analysis of 100 seeds. From a homogenized sample of each variety, five independent replicates of 100 seeds each were randomly selected, counted manually, and weighed using a precision analytical balance (Lingyi JA3003, Lingyi, Taizhou, China) with a resolution of 0.01 g. The mean values and standard deviations for both the dimensional parameters and the estimated 100-seed mass are summarized in Table 1.
Table 1.
Seed morphological characteristics and estimated mass of four soybean varieties.
2.2.2. Determination of Seed-Metering Device Interaction Parameters
The Discrete Element Method (DEM) is the most widely used computer simulation technique in agriculture for modelling granular materials, including seeds, fertilizers, and soil [17]. More recently, coupled Discrete Element Method–Computational Fluid Dynamics (DEM–CFD) simulations have emerged as the pioneering approach for modelling and optimizing precision sowing with pneumatic seed metering devices [18,19,20,21]. The material properties and interfacial contact parameters for the coupled DEM–CFD simulation, including the material properties of soybean seeds, the 316 stainless steel metering disc, and the ABS housing, as well as their interfacial interactions, were derived from a combination of direct physical measurements, inherent material properties, and relevant published data on the simulation of soybean precision sowing [22,23], as outlined in Table 2. The static coefficient of friction (μ) between the soybean seeds and the surface of the 316 stainless steel disc was determined experimentally using the inclined plane method. The seeds within a given commercial variety are highly uniform genetically and phenotypically, leading to low variability in surface properties. Pilot tests confirmed that the mean and standard deviation of friction measurements changed negligibly after 4–5 replicates for all tested varieties. Therefore, for each soybean variety, a representative sample of 6 seeds was individually tested. A seed was placed on a clean, horizontal stainless steel plate mounted on a hinged platform. The inclination angle (θ) of the platform was increased at a controlled rate of 0.5° per second until the seed began to slide. The coefficient of friction was calculated using the formula μ = tan(θ). Combining data from all varieties yielded an average static friction coefficient of μ = 0.27 ± 0.04. The low pooled standard deviation of 0.04 indicates minimal variability between seeds and varieties, which was effectively captured by the sample size. This empirically derived value was then adopted in the theoretical model for seed pick-up dynamics.
Table 2.
Simulation input parameters for the seed metering process.
2.3. Coupling Methodology for the Seed Metering Process
2.3.1. Development of the Soybean Particle Model
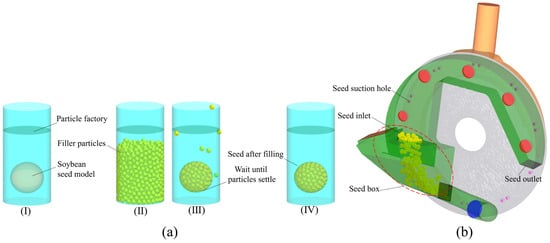
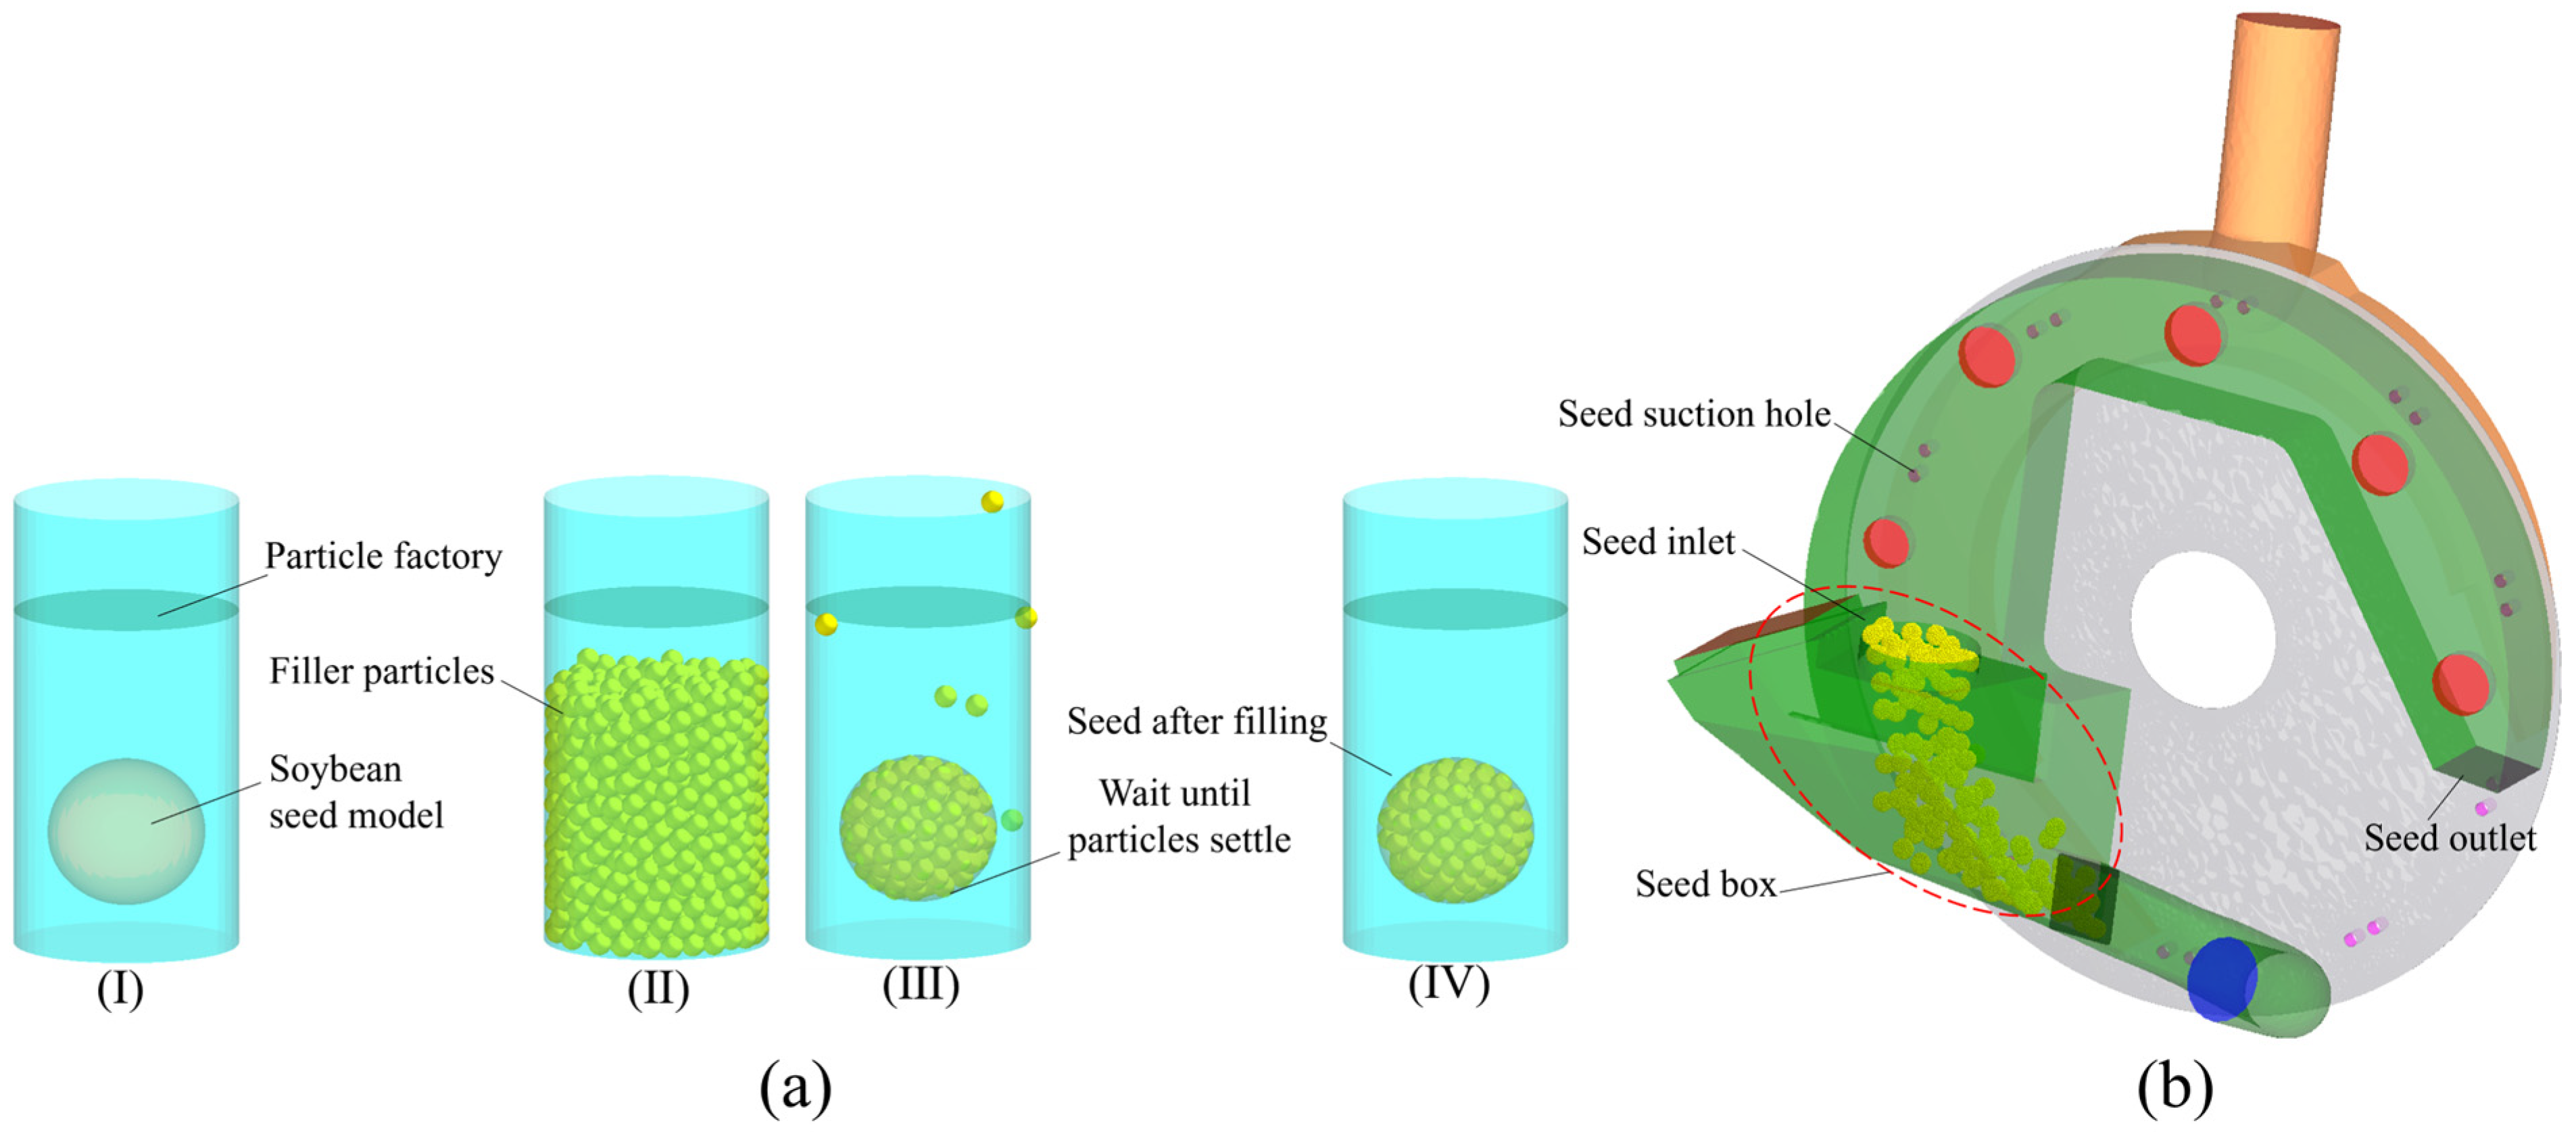
To create the soybean seed model, its 3D geometry was imported into EDEM 2022.2 (Figure 7a). The model was then positioned within a container that was filled with spherical particles, each measuring 0.45 mm in diameter. Once the model was fully submerged, the container was defined as virtual. This step effectively confined the internal particles to the shape of the soybean model, ensuring a uniform filling with the spherical particles. To ensure adequate seeding for the target of 150 hills (300 seeds) per plot, a population of 330 seeds was modelled within the seed pool. This surplus accounts for the multi-pick phenomenon, where some suction holes capture multiple seeds, preventing others from capturing any. The initial seed population is shown in Figure 7b.
Figure 7.
Model Generation. (a) Construction of the soybean particle model; (b) Simulation of the seed-filling process, (I) scanned 3D model of a soybean seed, (II) the 3D model fully submerged in spherical particles (0.45 mm diameter), (III) particles outside the seed model outline removed, (IV) final seed model with uniform internal particle filling.
2.3.2. Development of the Seed Metering Model
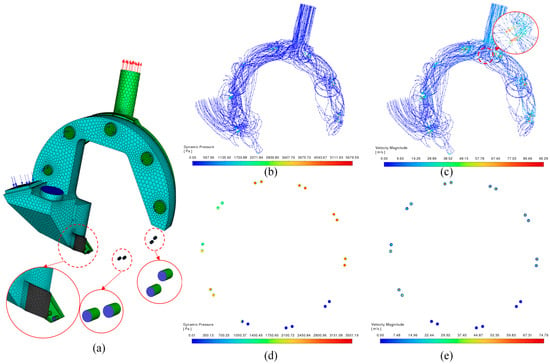
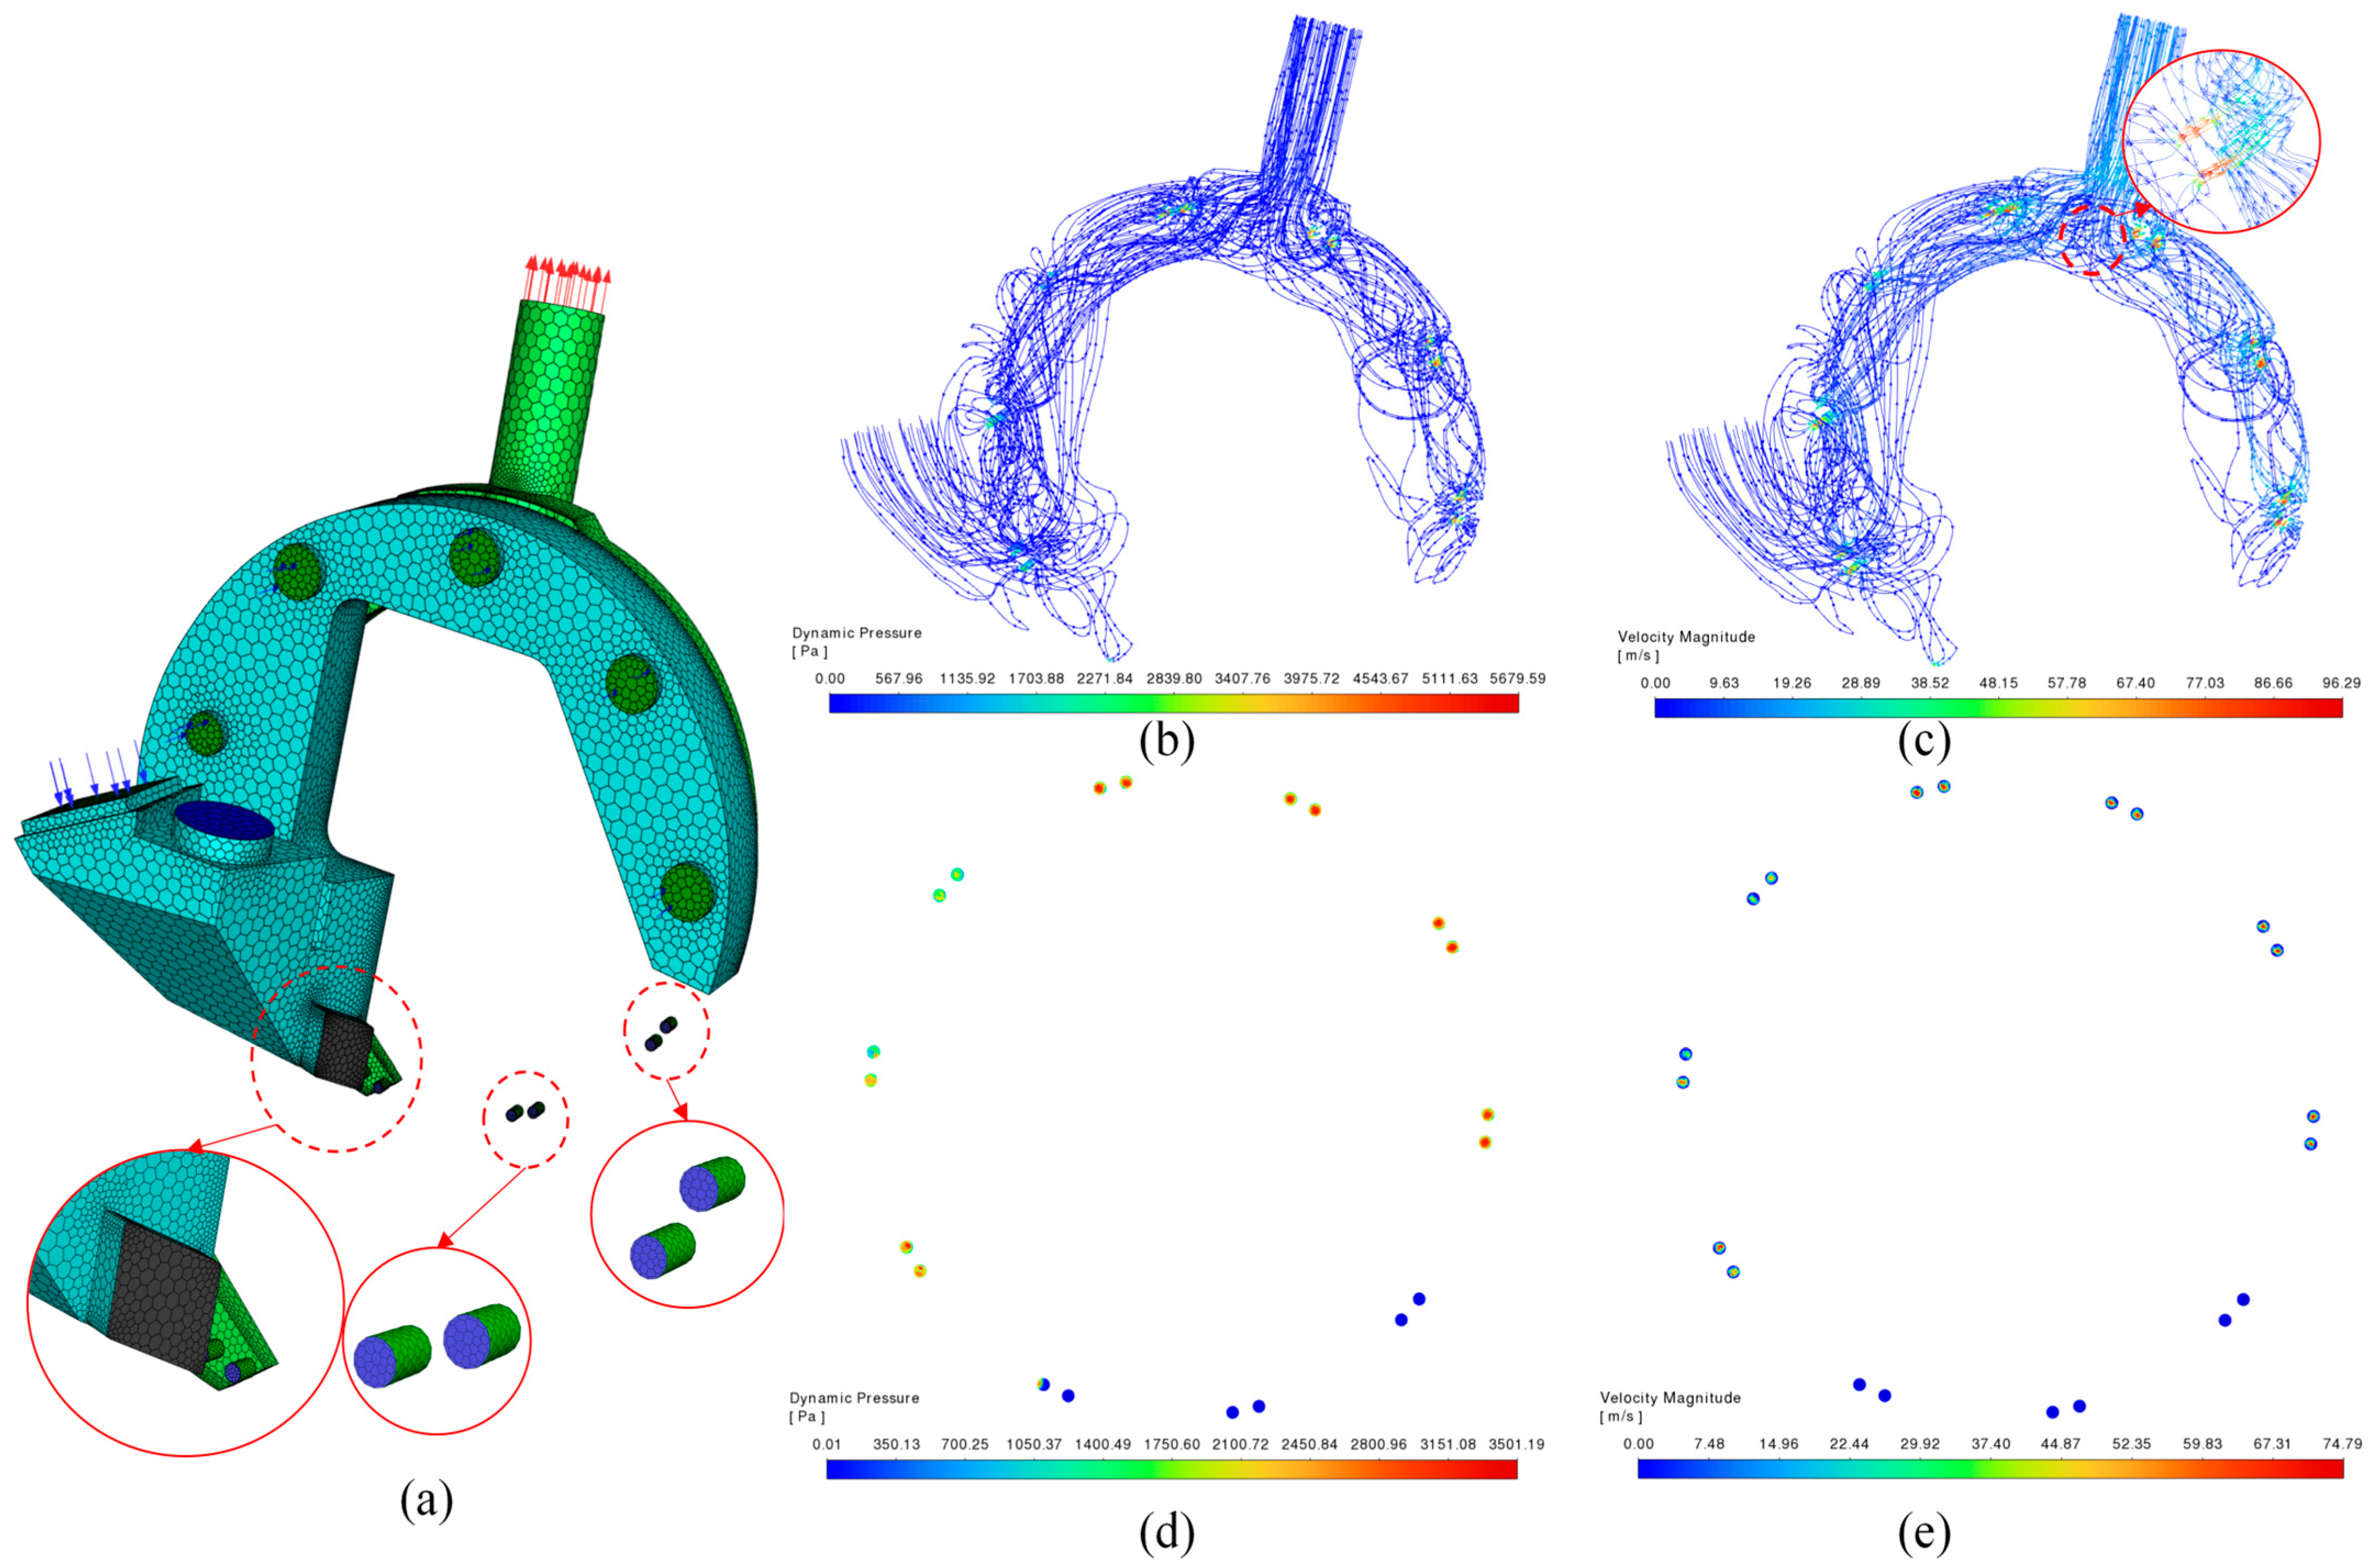
During the simulation of the seed metering process, the internal fluid domain was segmented by the seed supply and clearing valves. To reduce computational expense, the flow field within the clearing tube was excluded from the model. The fluid zone encompassing the suction holes was assigned a uniform circular motion to represent the rotation of the seed metering disc. A critical aspect of the model was the dynamic connection at the suction holes: a flow path was established only when a hole’s rotation brought it into simultaneous contact with the fluid domains on both the intake and exhaust sides. At all other positions, the path remained disconnected, accurately replicating the intermittent vacuum mechanism. The internal fluid domain of the seed meter was extracted using ANSYS 2024R1 software for CFD analysis, as shown in Figure 8a. To simulate the vacuum conditions, a negative pressure boundary condition of −8 kPa was applied at the exhaust outlet. The CFD simulation was then run to solve the governing flow equations. The results showed a maximum negative pressure of 5.679 kPa at the suction holes, which is consistent with the empirically tested value of approximately 6 kPa. This pressure differential drove a high airflow velocity, which reached 96.29 m s−1 at the suction holes.
Figure 8.
Internal airflow pathlines in the seed-metering device during seed metering process: (a) mesh of the computational fluid domain; (b) pathlines coloured according to dynamic pressure; (c) pathlines coloured based on velocity magnitude; (d) dynamic pressure profile at the air intake side of the suction hole; and (e) velocity profile at the air intake side of the suction hole.
2.3.3. Development of the Seed Clearing Model
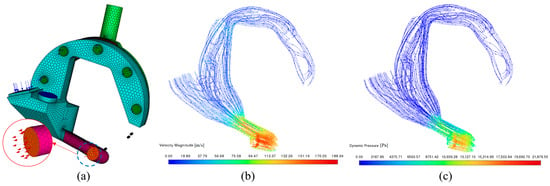
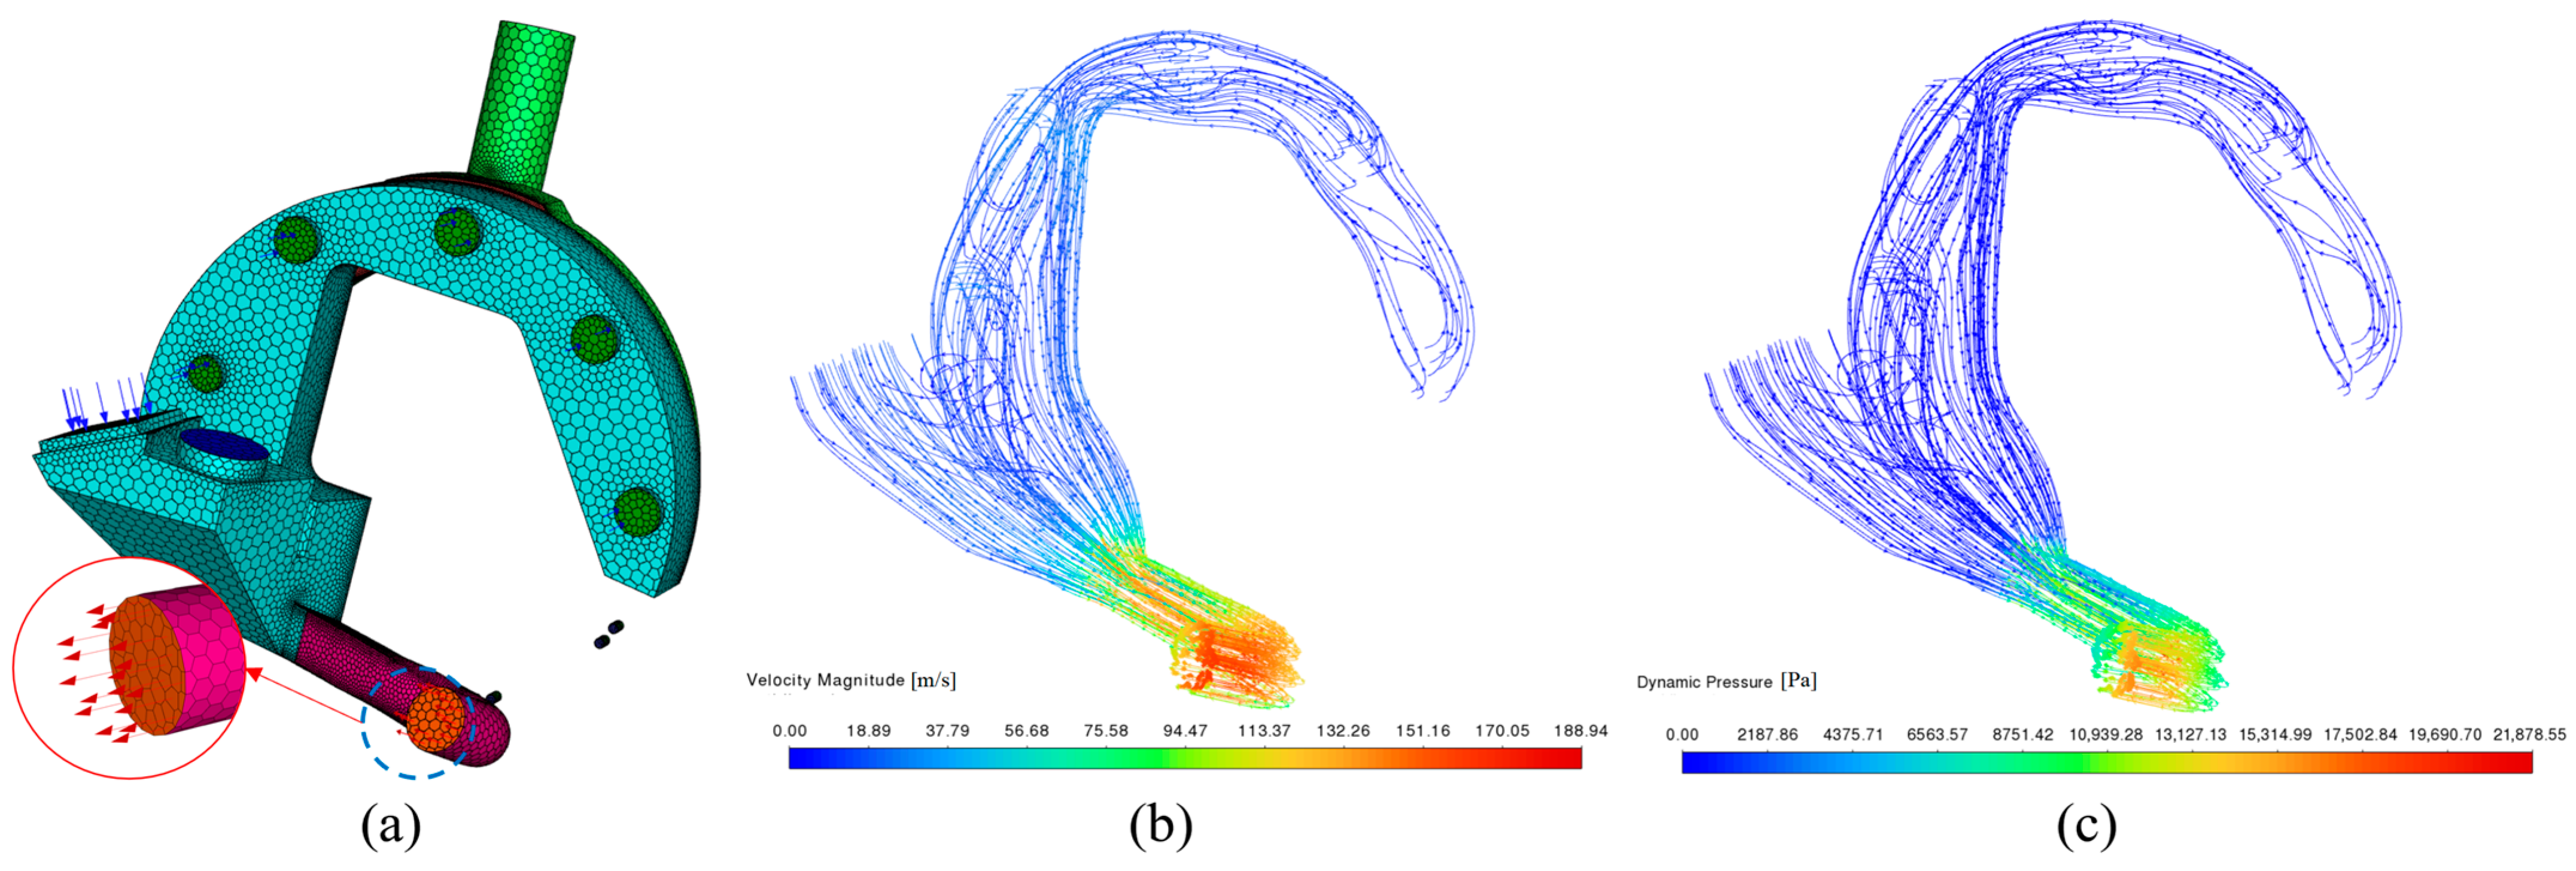
After seeding a plot, it is essential to purge the seed pool and the suction holes of any remaining seeds. During this clearing phase, the clearing valve opens, connecting the seed pool to a dedicated clearing pipe. This process ends the negative pressure at the primary outlet and creates a new negative pressure of 20 kPa within the clearing pipe. As shown in Figure 9, the internal airflow is redirected and extracted through the clearing pipe, leading to a concentrated pressure differential. The maximum flow velocity reached in the clearing pipe is 188.94 m s−1.
Figure 9.
Airflow pathlines inside the seed-metering device during the clearing process. (a) Fluid domain mesh during clearing; (b) Pathlines coloured by velocity magnitude; (c) Pathlines coloured by dynamic pressure.
2.4. Seeding Quality Metrics and Measurement
Seeding quality was evaluated according to the ISO 7256/1 standard defines seeding quality using three indices: the qualified, multiple, and miss-seeding rates. These calculations are based on a minimum sample size of 250 seeds. The standard also provides quality classifications based on the ranges of these indices, which are presented in Table 3.
Table 3.
Seeding quality classification thresholds according to ISO 7256/1 (1984) [24].
2.5. Single-Factor Test
A single-factor experiment was conducted to evaluate the effects of three key parameters on the seeding performance of the device: suction hole diameter, disc rotational speed, and applied vacuum pressure. For each parameter, a dedicated test series was performed in which its value was systematically varied while keeping the other two parameters constant at predetermined baseline levels: a suction hole diameter of 4.5 mm, a rotational speed of 2.55 rad s−1, and an applied vacuum pressure of 5.2 kPa. This approach allowed for the independent determination of each parameter’s specific influence on the seeding quality indices [25]. Two main criteria determine the appropriate suction hole diameter based on the geometric mean seed diameter. The first criterion states that the suction hole diameter should be half of the seed’s geometric mean diameter. The second criterion specifies that the suction hole diameter should fall within the range of 0.64 to 0.66 times the geometric mean diameter [16]. In this study, the tested range of suction hole diameters was based on the seed dimensional data shown in Table 1, following the second criterion (Equations (8) and (9)).
In this study, seeding quality indices were determined by analyzing playback from coupled DEM–CFD simulations. The total number of metering cycles was recorded by visually counting each instance a suction hole passed the discharge point, resulting in a total of 300 observed discharge events. Each event was classified into one of three categories: a qualified event (where a single seed was dispensed), a multiple event (where two or more seeds were dispensed), or a missed event (where no seeds were dispensed). The rate for each category was calculated by dividing the frequency of occurrences by the total number of discharge events (300).
2.6. Efficacy Assessment of the Seed Clearing Process
The effectiveness of the seed clearing process was assessed by determining the rate of intervarietal contamination. This was accomplished using visually distinct soybean varieties, chosen for their contrasting seed coat colours to facilitate clear identification (see Figure 6b). The planter’s seed metering system was first supplied with seeds from the first soybean variety to be sown. After following the standard field-clearing protocol, which included reversing the metering mechanism, the system was immediately refilled with seeds from the second soybean variety. Next, we collected a controlled discharge of seeds over the first 5 m of the next plot. All discharged seeds were manually gathered and sorted into two categories: residual seeds from the first variety and seeds from the second variety. The contamination rate was then calculated as the percentage of residual first-variety seeds relative to the total number of seeds recovered in the sample, according to the formula:
where is the number of residual seeds from the first variety and is the total number of seeds (first variety + second variety) collected after the clearing operation.
3. Results and Discussion
3.1. Numerical Simulation and Analysis of the Seed Metering and Clearing Processes
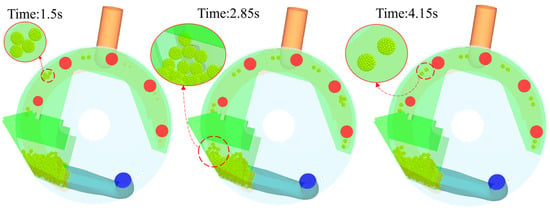
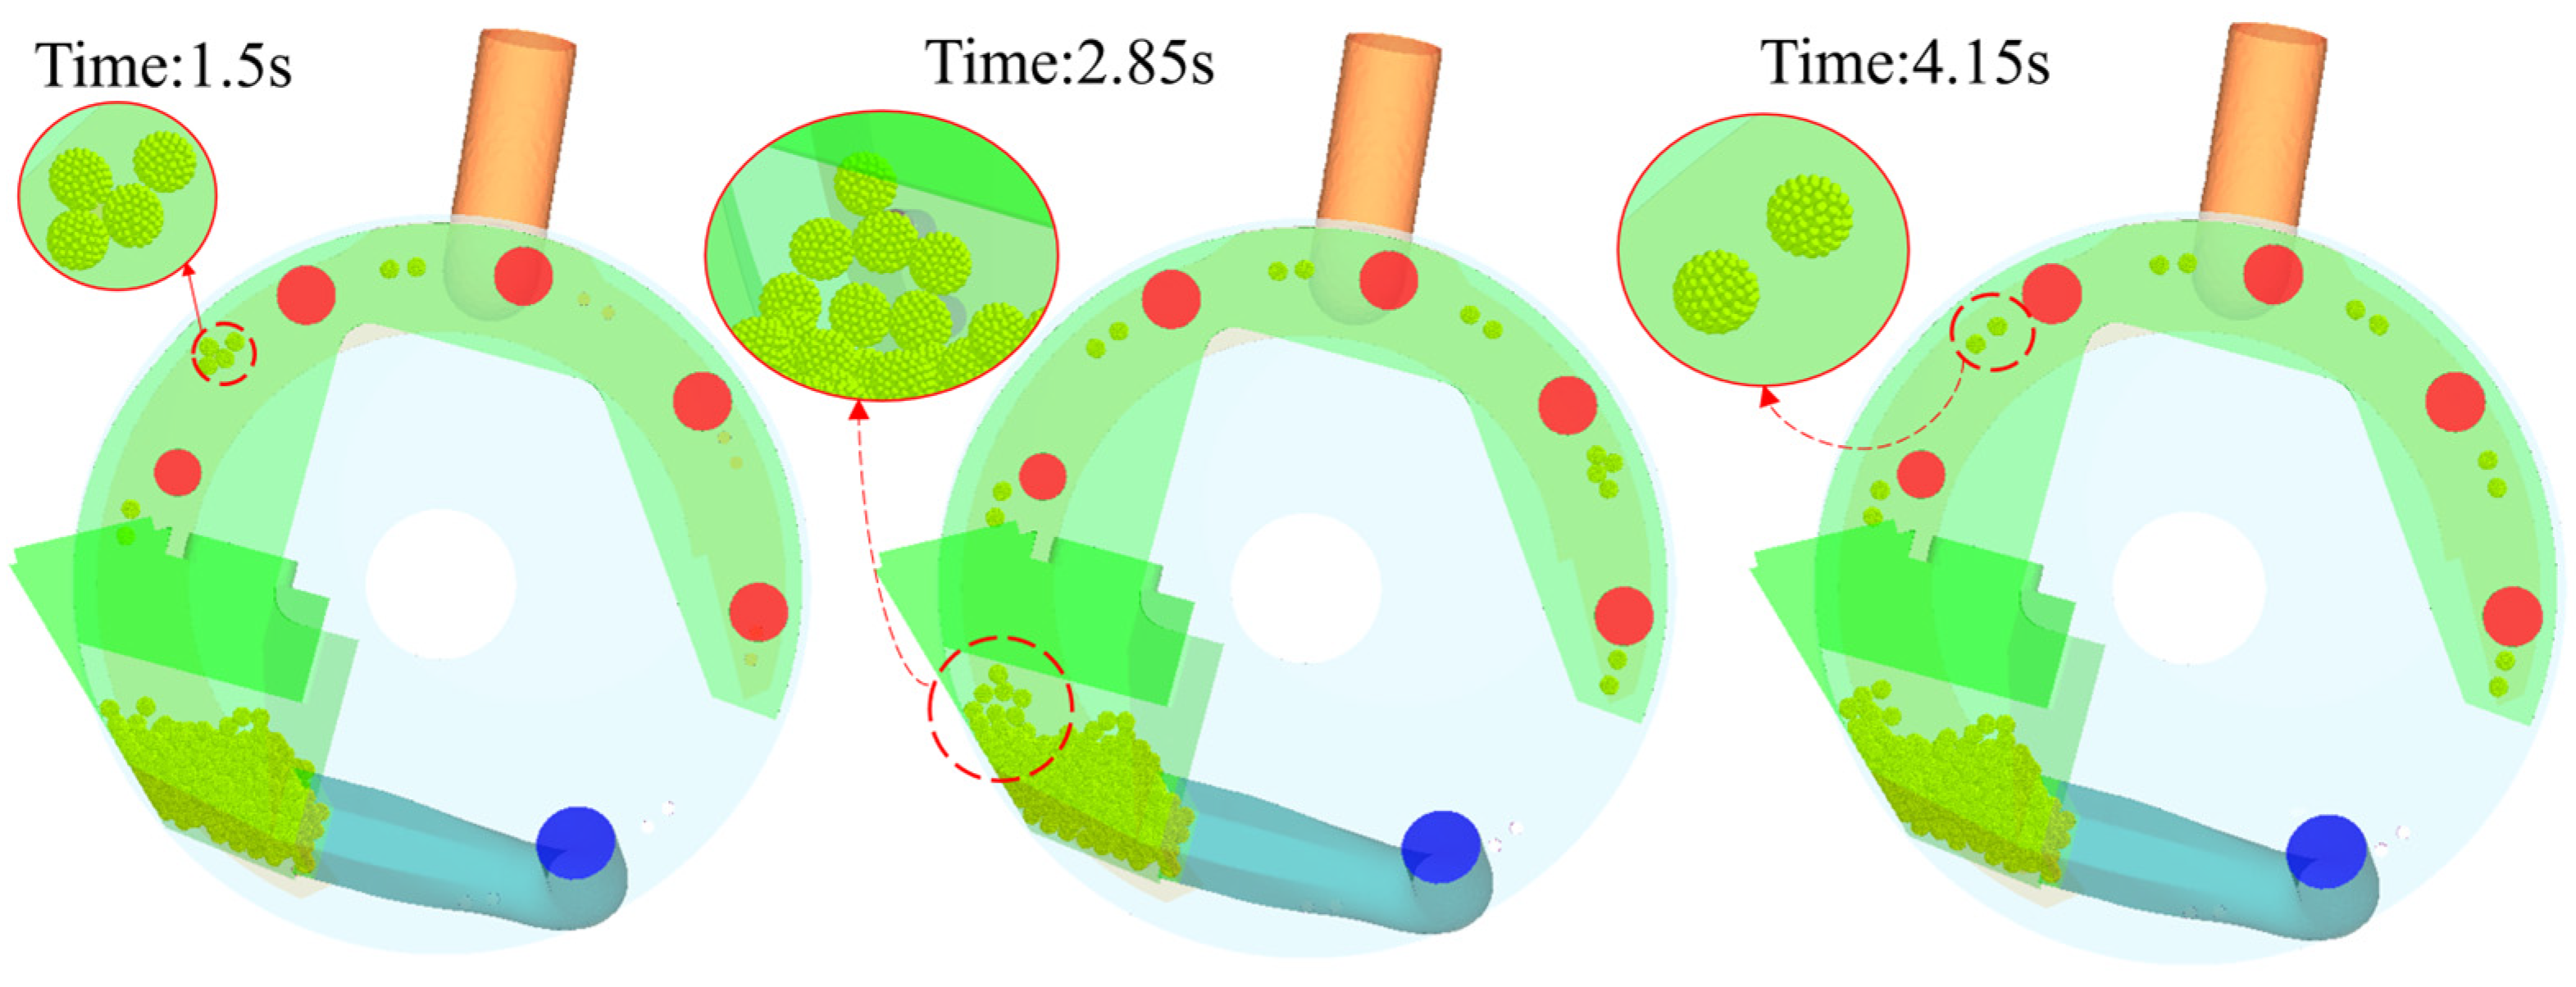
In this study, the performance of the proposed seed metering device was evaluated at seven distinct angular velocities: 1.45, 1.82, 2.18, 2.55, 2.91, 3.27, and 3.64 rad s−1. These were selected to correspond to operational forward speeds of 1.00, 1.25, 1.50, 1.75, 2.00, 2.25 and 2.50 km h−1, respectively, ensuring synchronization between the seeder’s travel velocity and the rotational speed of the metering disc under intended hill-spacing of 120 mm. At an angular velocity of 1.45 rad s−1, the metering disc completes one full revolution in approximately 4.32 s. Simulation results demonstrate that seed pickup was generally stable, with all suction holes successfully capturing seeds. However, one suction hole adsorbed more than one seed (multiseed pickup), as illustrated in Figure 10.
Figure 10.
Numerical simulation of the seed metering process. Key parameters include a suction hole diameter of 4.5 mm, a disc rotational speed of 1.45 rad s−1, and an applied vacuum pressure of 5.2 kPa. The red holes on the seed metering device are for visually monitoring each instance a suction hole passes.
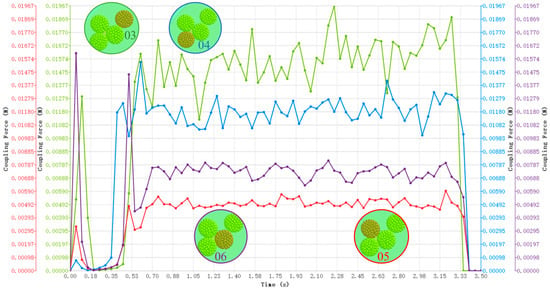
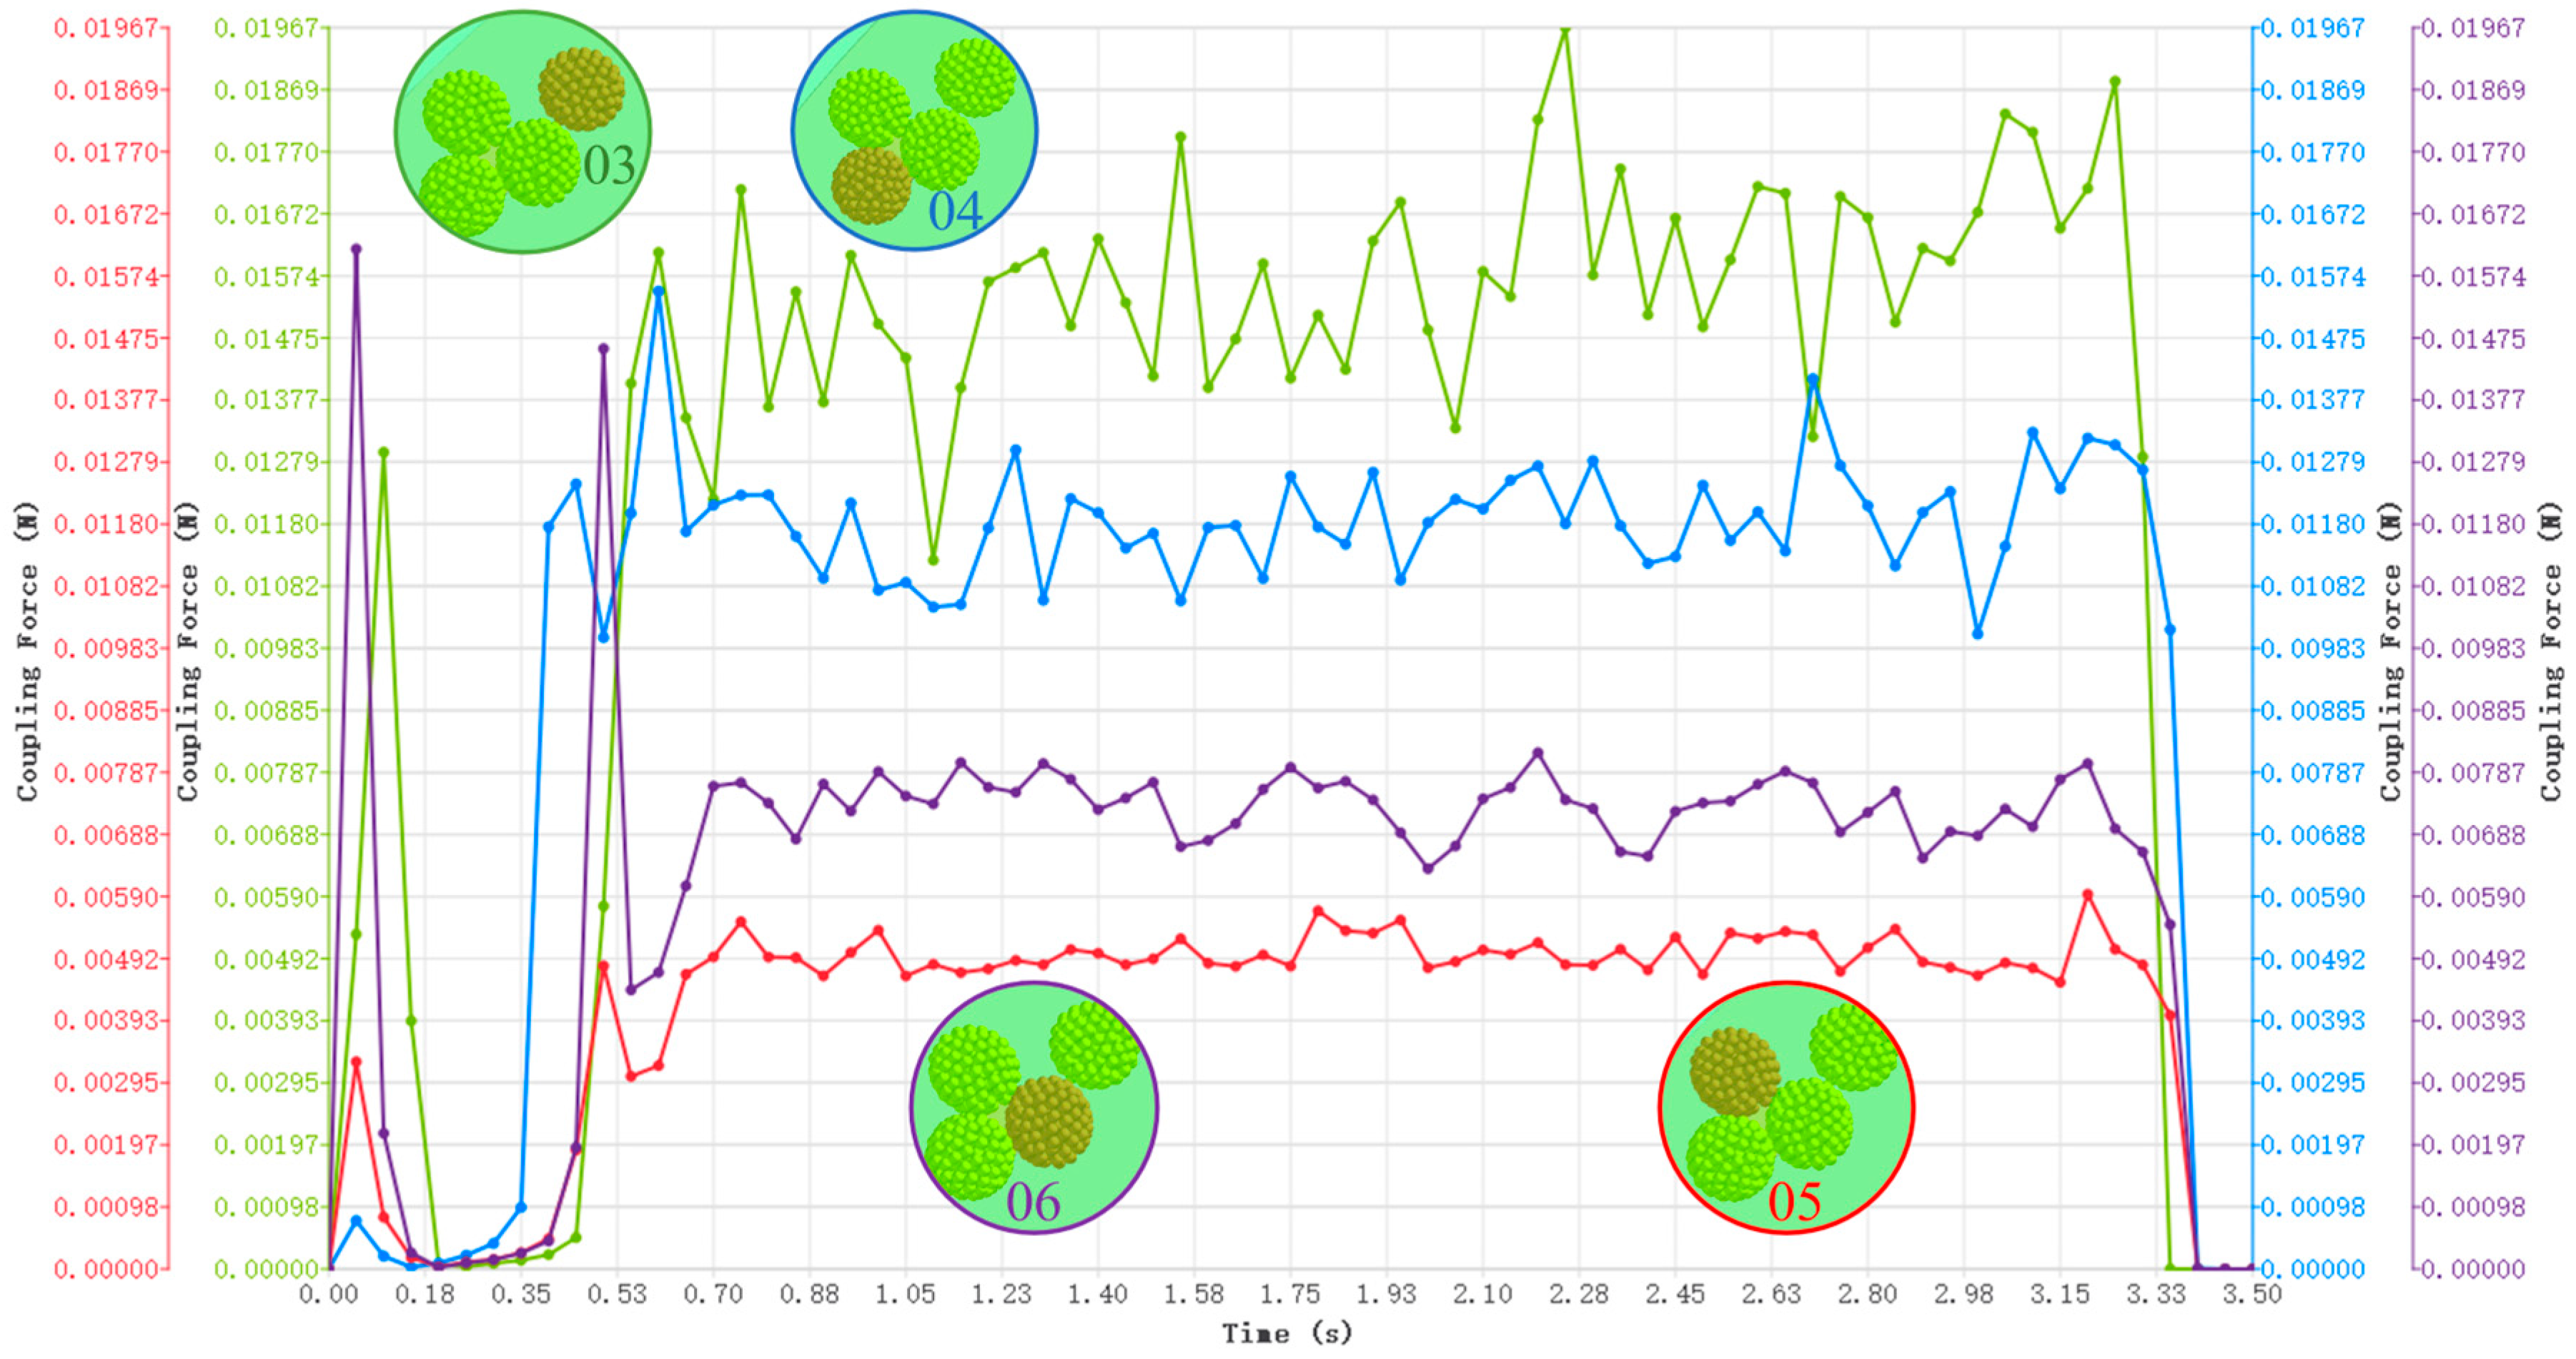
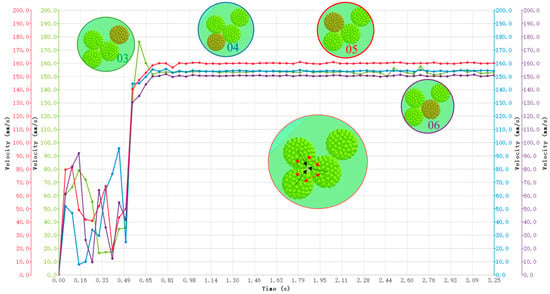
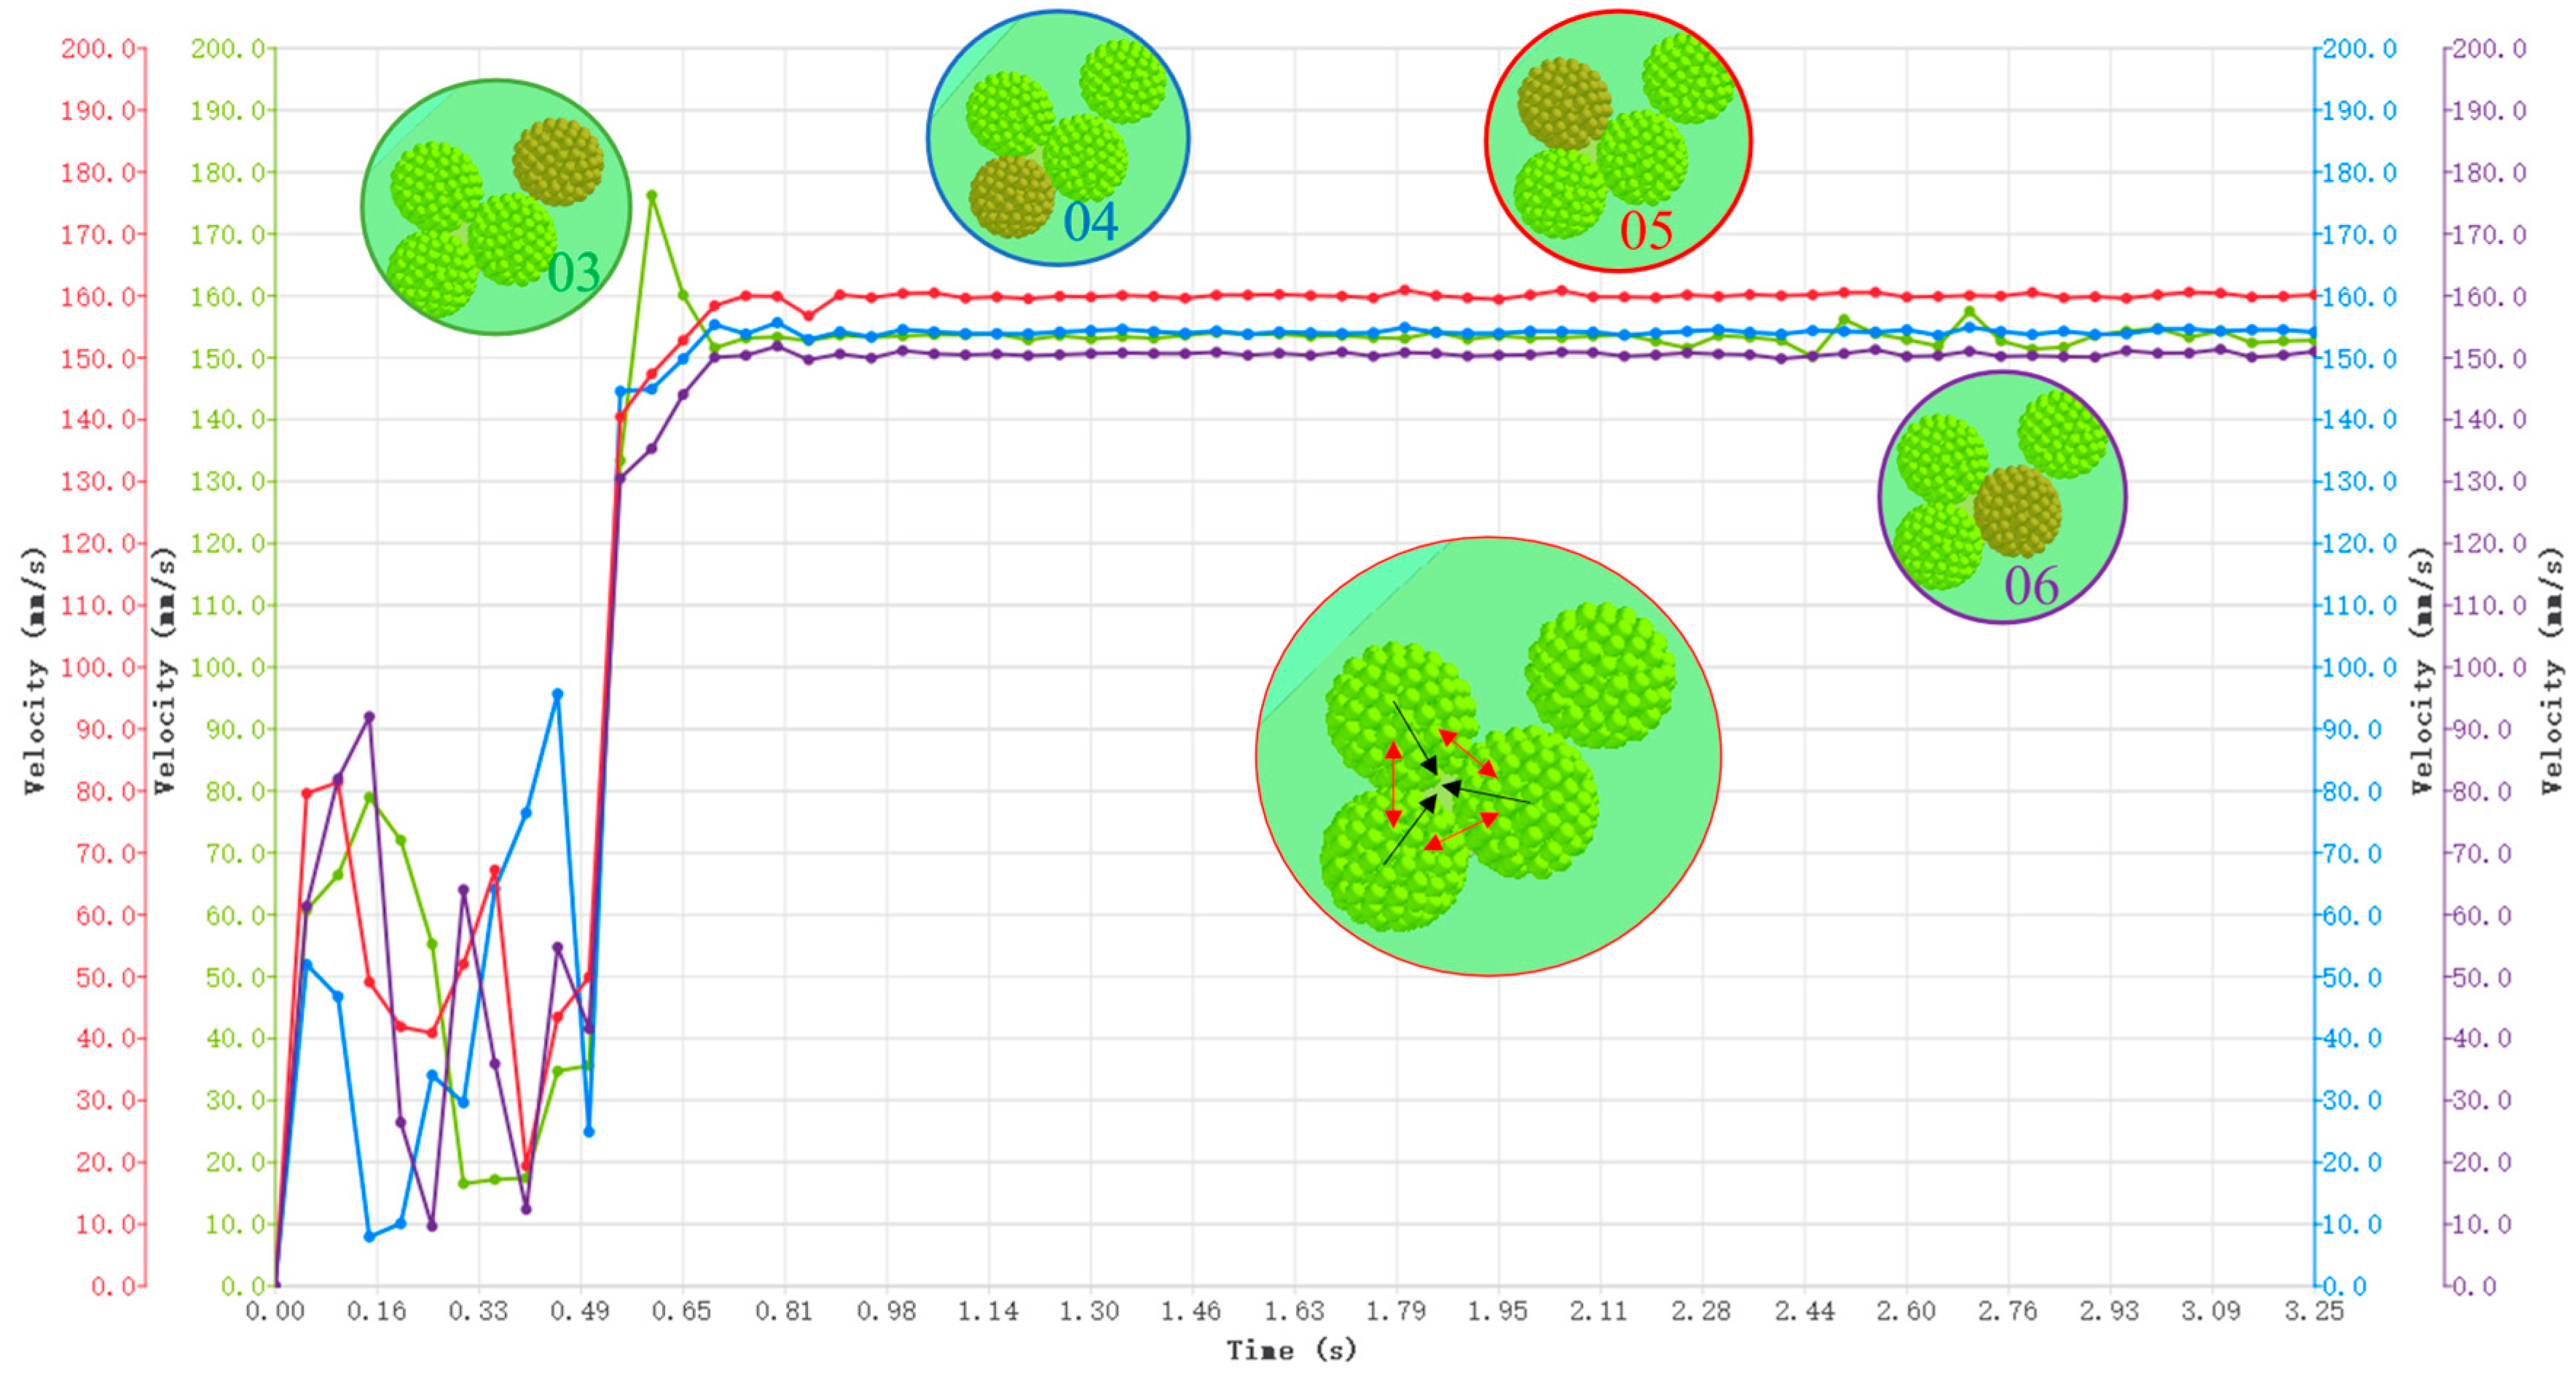
An analysis of the forces on both the singly adsorbed seed and the multiply adsorbed seeds at the suction holes is presented in Figure 11. In this figure, Seed 03 represents a singly adsorbed seed, while Seeds 04, 05, and 06 are seeds that were adsorbed simultaneously. The analysis of the coupling force data reveals that the adsorption force on the multiply adsorbed seeds is lower than that on the singly adsorbed seed. However, due to their physical stacking, these seeds remain attached and follow the rotational motion of the suction hole, as illustrated by Seed 05. The velocity profiles of these four seeds were also extracted and are presented in Figure 12. As expected from kinematic principles, seeds located farther from the centre of rotation exhibit higher linear velocities. Among these, Seed 04 and the singly adsorbed Seed 03 demonstrate nearly identical rotational speeds. However, the translational velocity of the singly adsorbed seed shows greater fluctuations compared to the three multiply adsorbed seeds. This is because a singly adsorbed seed has only one point of contact (the suction hole) and is more susceptible to air resistance, vibrations, and minor instabilities, which can lead to fluctuations in its velocity. In contrast, a cluster of seeds, being more massive and having multiple points of contact with each other, has greater rotational inertia and damping, resulting in a smoother velocity profile.
Figure 11.
Variation in the adsorbed forces on a single seed during the seed metering process.
Figure 12.
Variation in the Seed velocity during the seed metering process.
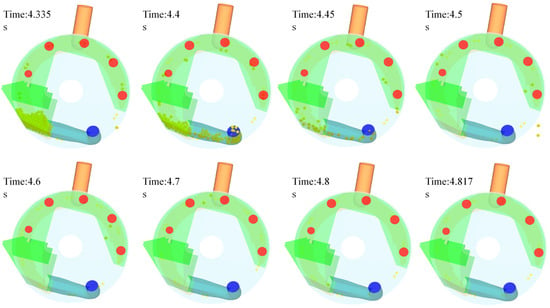
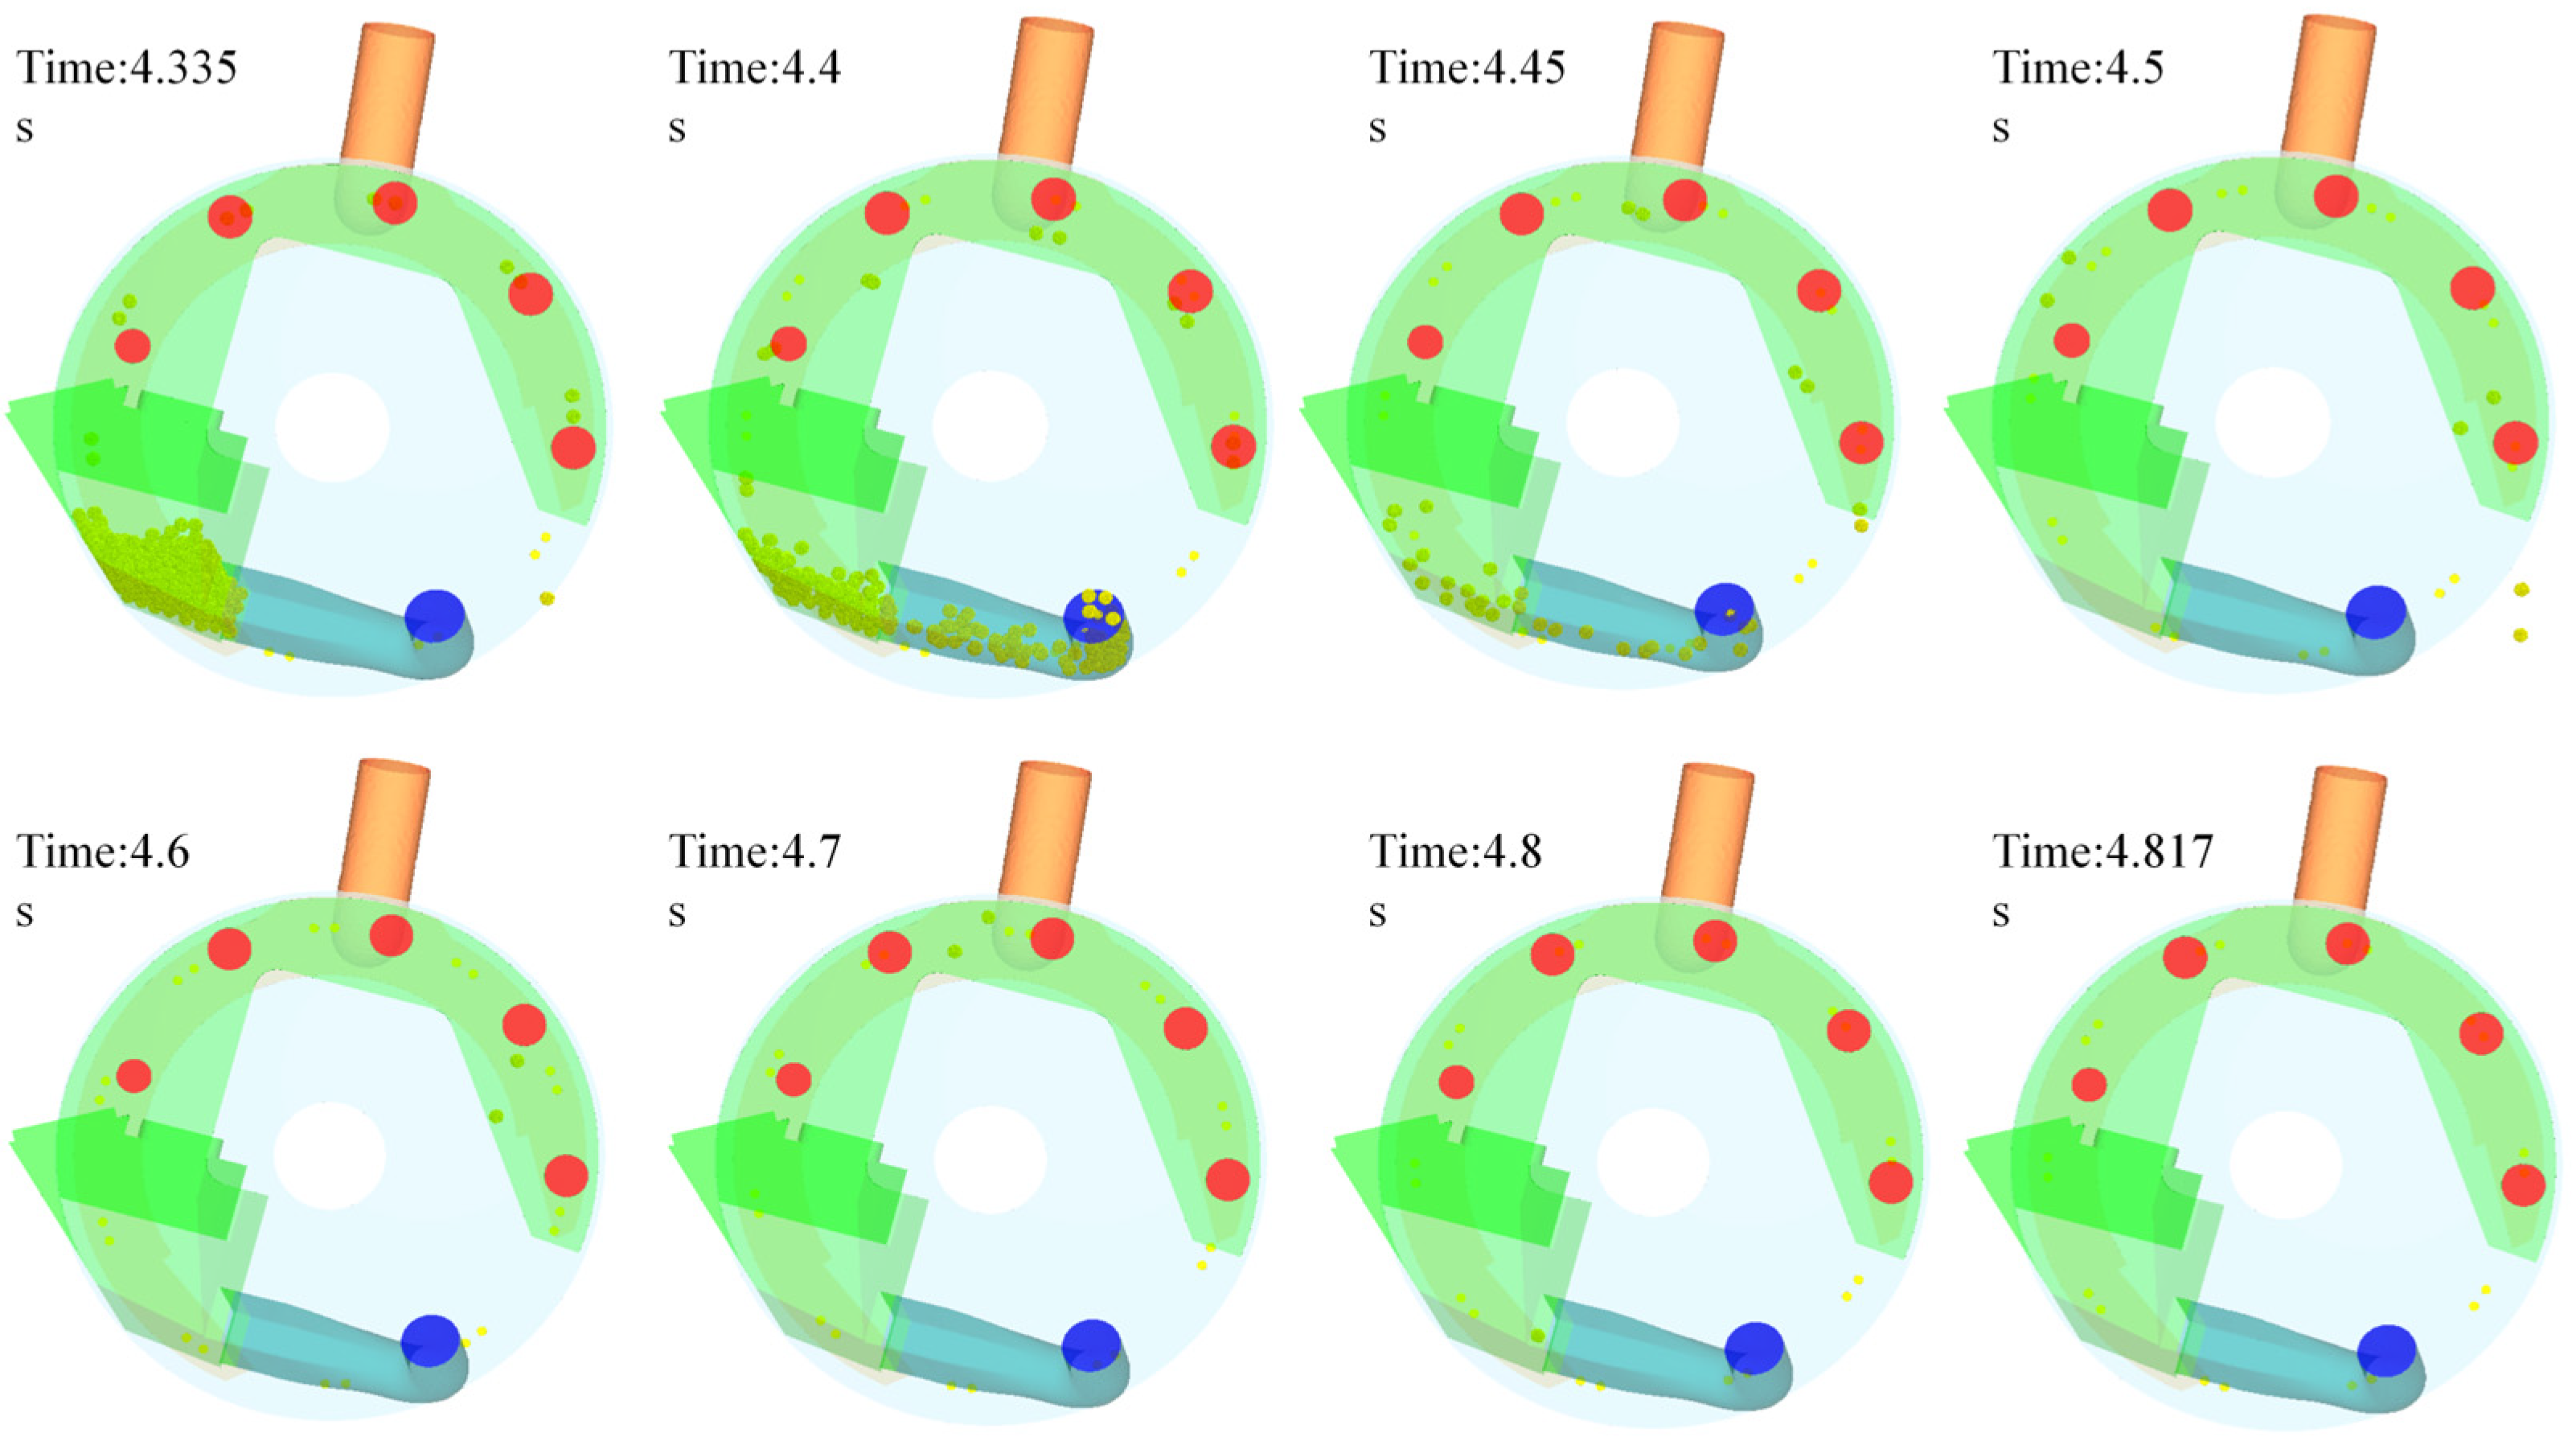
After the seed metering process, an automatic clearing operation is initiated. As shown in Figure 13, the negative pressure at the seed outlet is deactivated at t = 4.335 s, while a vacuum of 20 kPa is simultaneously applied to the clearing outlet. This change in pressure causes the seeds adhered to the suction holes to decelerate. As illustrated in Figure 13, the seeds detach from the suction holes after losing their suction force and are then ejected by gravity and the clearing pressure. The initial clearing phase expels seeds from the seed pool through the clearing tube. By t = 4.5 s, the seed pool is largely cleared, although seeds on the metering side continue to decelerate. At the beginning of the clearing process, the rapid transition of vacuum from the metering circuit to the clearing circuit causes a sharp decrease in the coupling force on the seeds near the metering outlet within a single simulation timestep. Although there is a subsequent slight increase in force due to transient airflow, it is not enough to retain these seeds. As a result, the seeds fall through the metering outlet, exit the metering zone, and accelerate downward under the influence of gravity, leaving the simulation domain. In this configuration, the clearing airstream was unable to redirect these specific seeds effectively. This outcome indicates a potential need for an auxiliary collection device at the drop point to prevent intervarietal contamination or seed loss. Complete clearance of all seeds within the device is achieved by 4.817 s, resulting in a total clearing process duration of 0.482 s. Chen et al. [12] developed a metering mechanism for soybean seeds that can quickly fill, clear, and replace seeds without interrupting the work between adjacent plots. The seeding performance of this mechanism was evaluated using discrete element simulations based on EDEM software. The results indicated that a seed clearing time of 0.3 s achieved optimal performance, with a qualified seeding rate of 95.29%, a multiple rate of 3.29%, and a miss seeding rate of 1.42%. Additionally, research on an air suction precision seed-metering device for rice breeding achieved a 100% clearing rate, with an average clearing time of less than 0.88 s [26].
Figure 13.
Numerical simulation of the seed-clearing process. Key parameters include a disc rotational speed of 1.45 rad s−1 and an applied vacuum pressure of 20 kPa.
3.2. Results of the Single-Factor Analysis
Table 4 presents the results of the single-factor test.
Table 4.
Simulated seeding quality indices across tested parameter levels.
3.2.1. Impact of Suction Hole Diameter on Seeding Quality
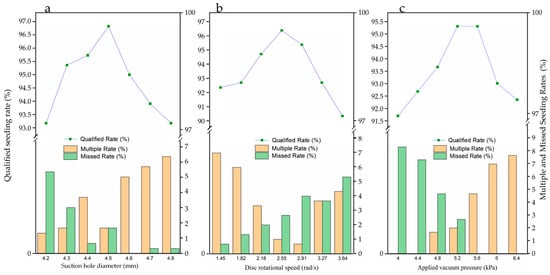
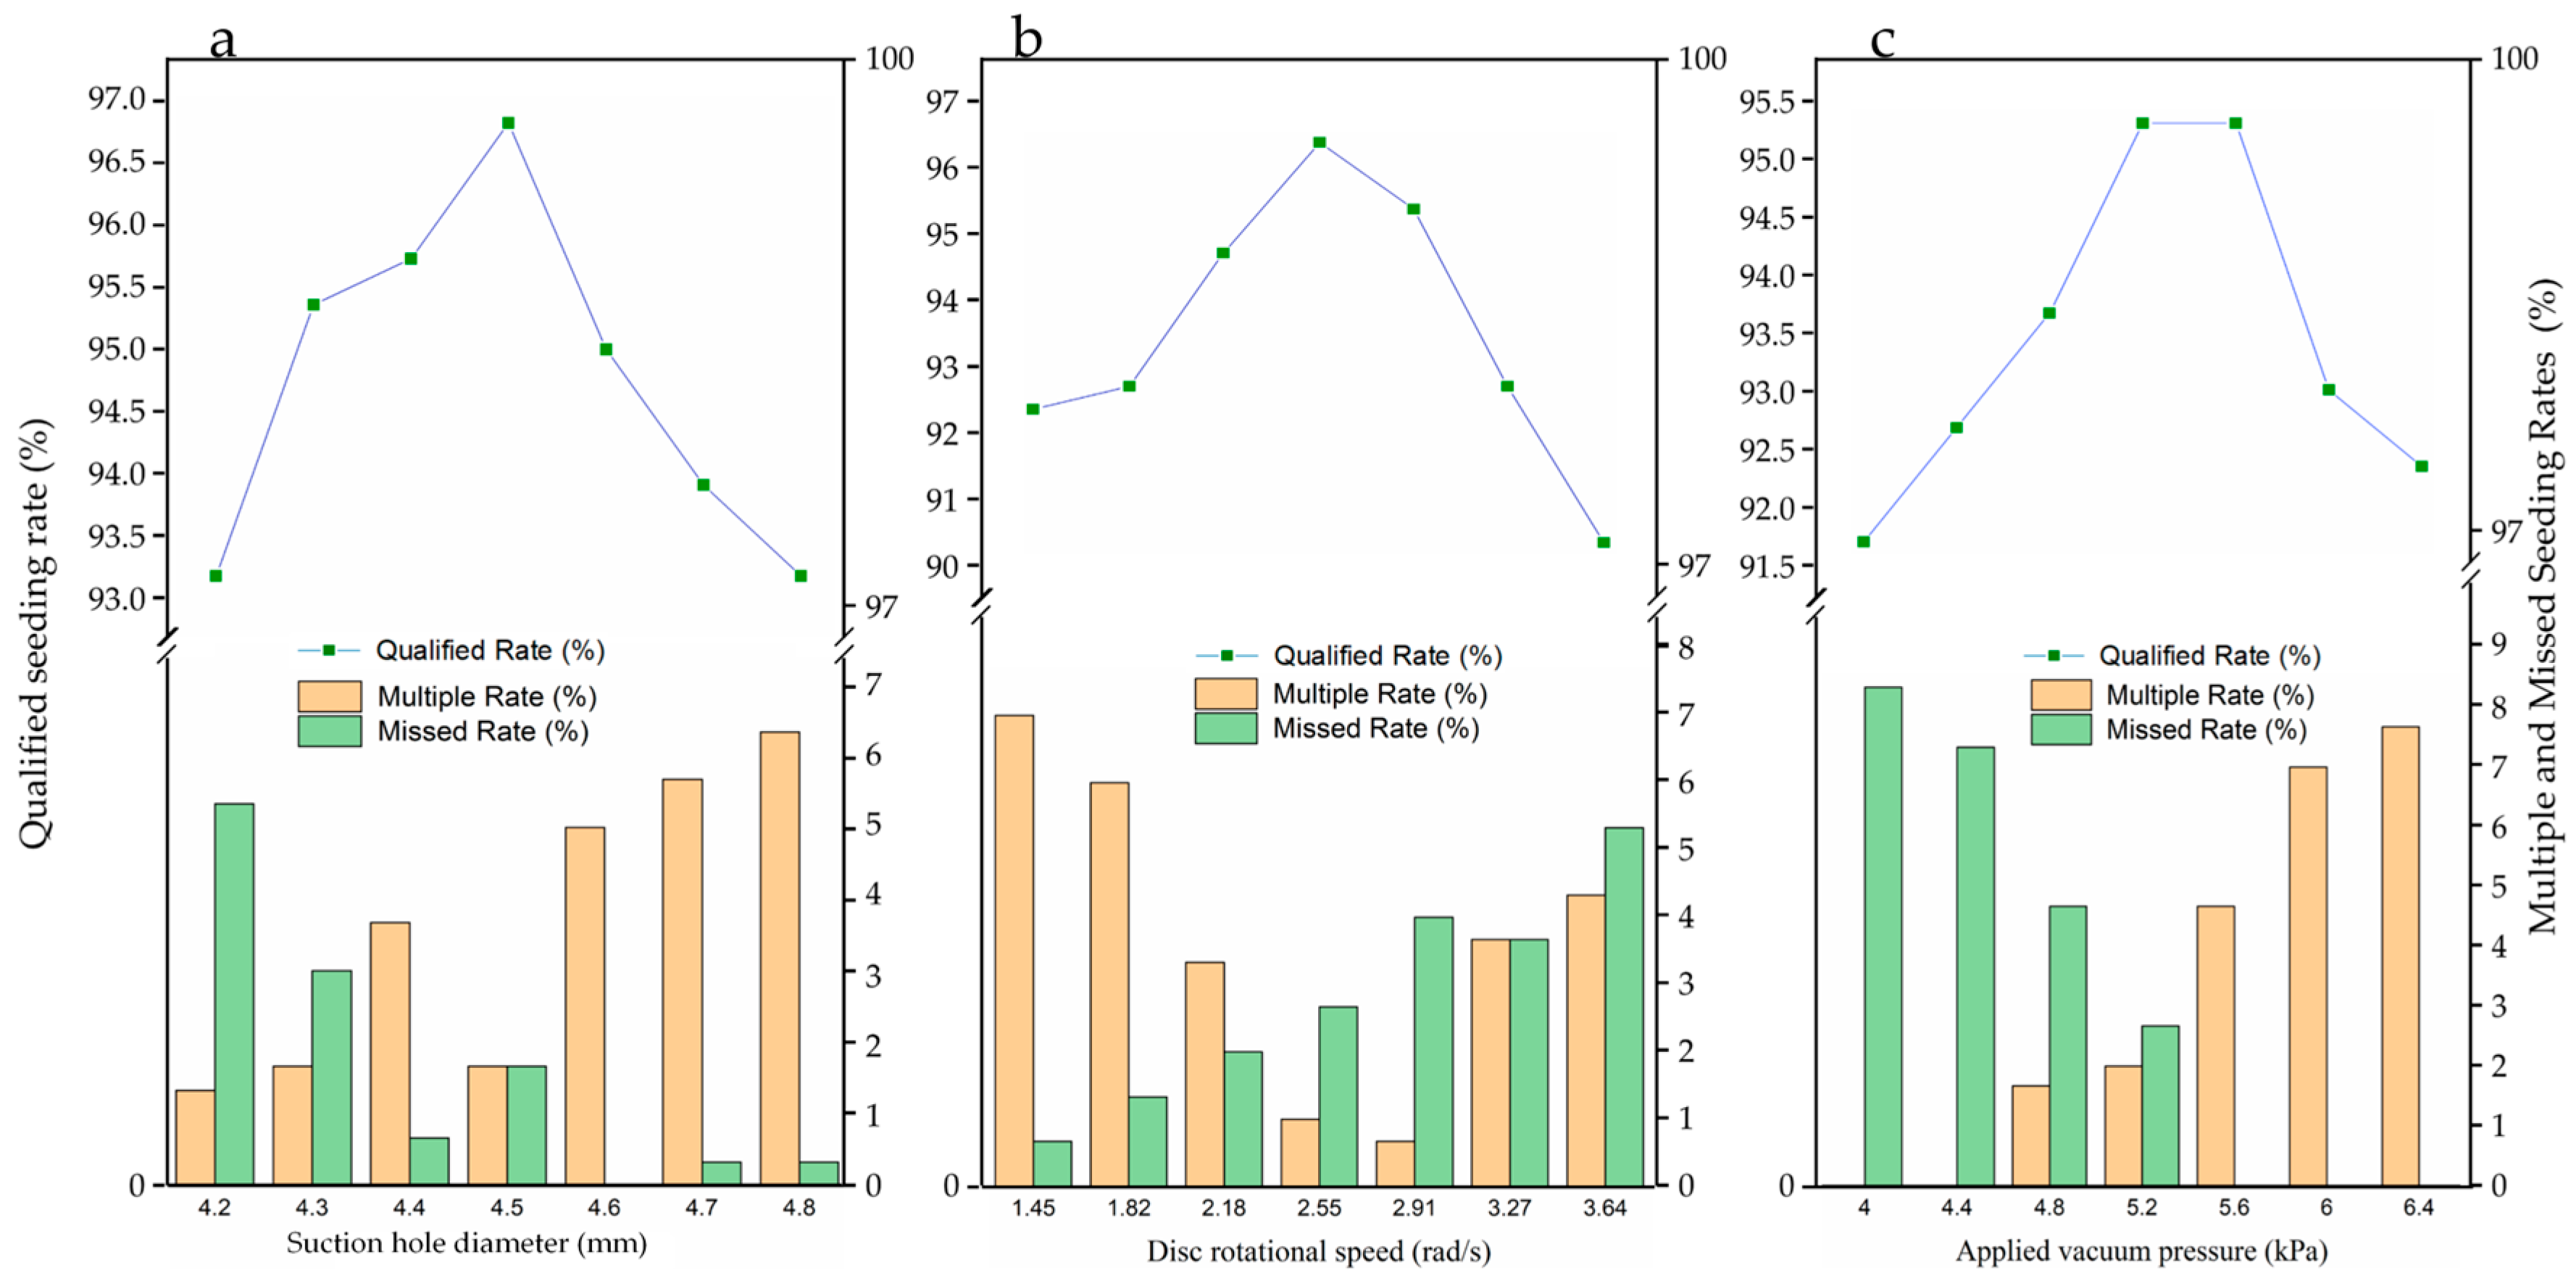
The results revealed an inverse U-shaped relationship between the suction hole diameter and the qualified seeding rate (Figure 14a). The optimal diameter of 4.5 mm achieved the highest qualified seeding rate of 96.67%. For suboptimal diameters, such as 4.2 mm, there was a significant decrease in the qualified rate. This reduction might be attributed to two primary factors: (1) inadequate suction force for reliable seed pickup and (2) increased sensitivity to seed orientation. Seeds presented at slight angular offsets may fail to create a proper seal at the smaller aperture, resulting in vacuum leakage and a higher miss rate. On the other hand, when the diameter was increased to 4.8 mm, the qualified rate also declined. In this case, the larger aperture area increased the likelihood of drawing in more than one seed simultaneously into the high-vacuum zone, directly increasing the rate of multiple seed pickups. Furthermore, when the hole area is enlarged with a constant vacuum source, the pressure gradient acting on each individual seed is reduced, which can diminish holding stability during transport. These findings confirm that the suction hole diameter is a crucial design parameter.
Figure 14.
Simulated seeding quality indices versus (a) suction hole diameter, (b) disc rotational speed, and (c) applied vacuum pressure. For each parameter, the qualified seeding rate is plotted against the left y-axis, while the multiple and miss-seeding rates are plotted against the right y-axis.
3.2.2. Impact of Disc Rotational Speed on Seeding Quality
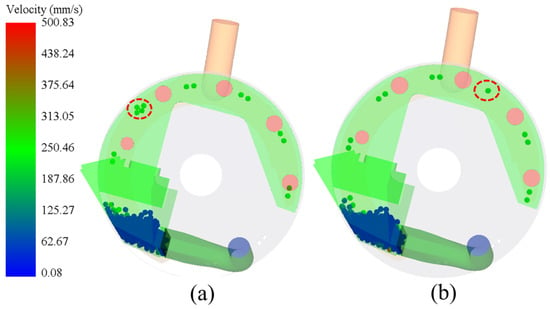
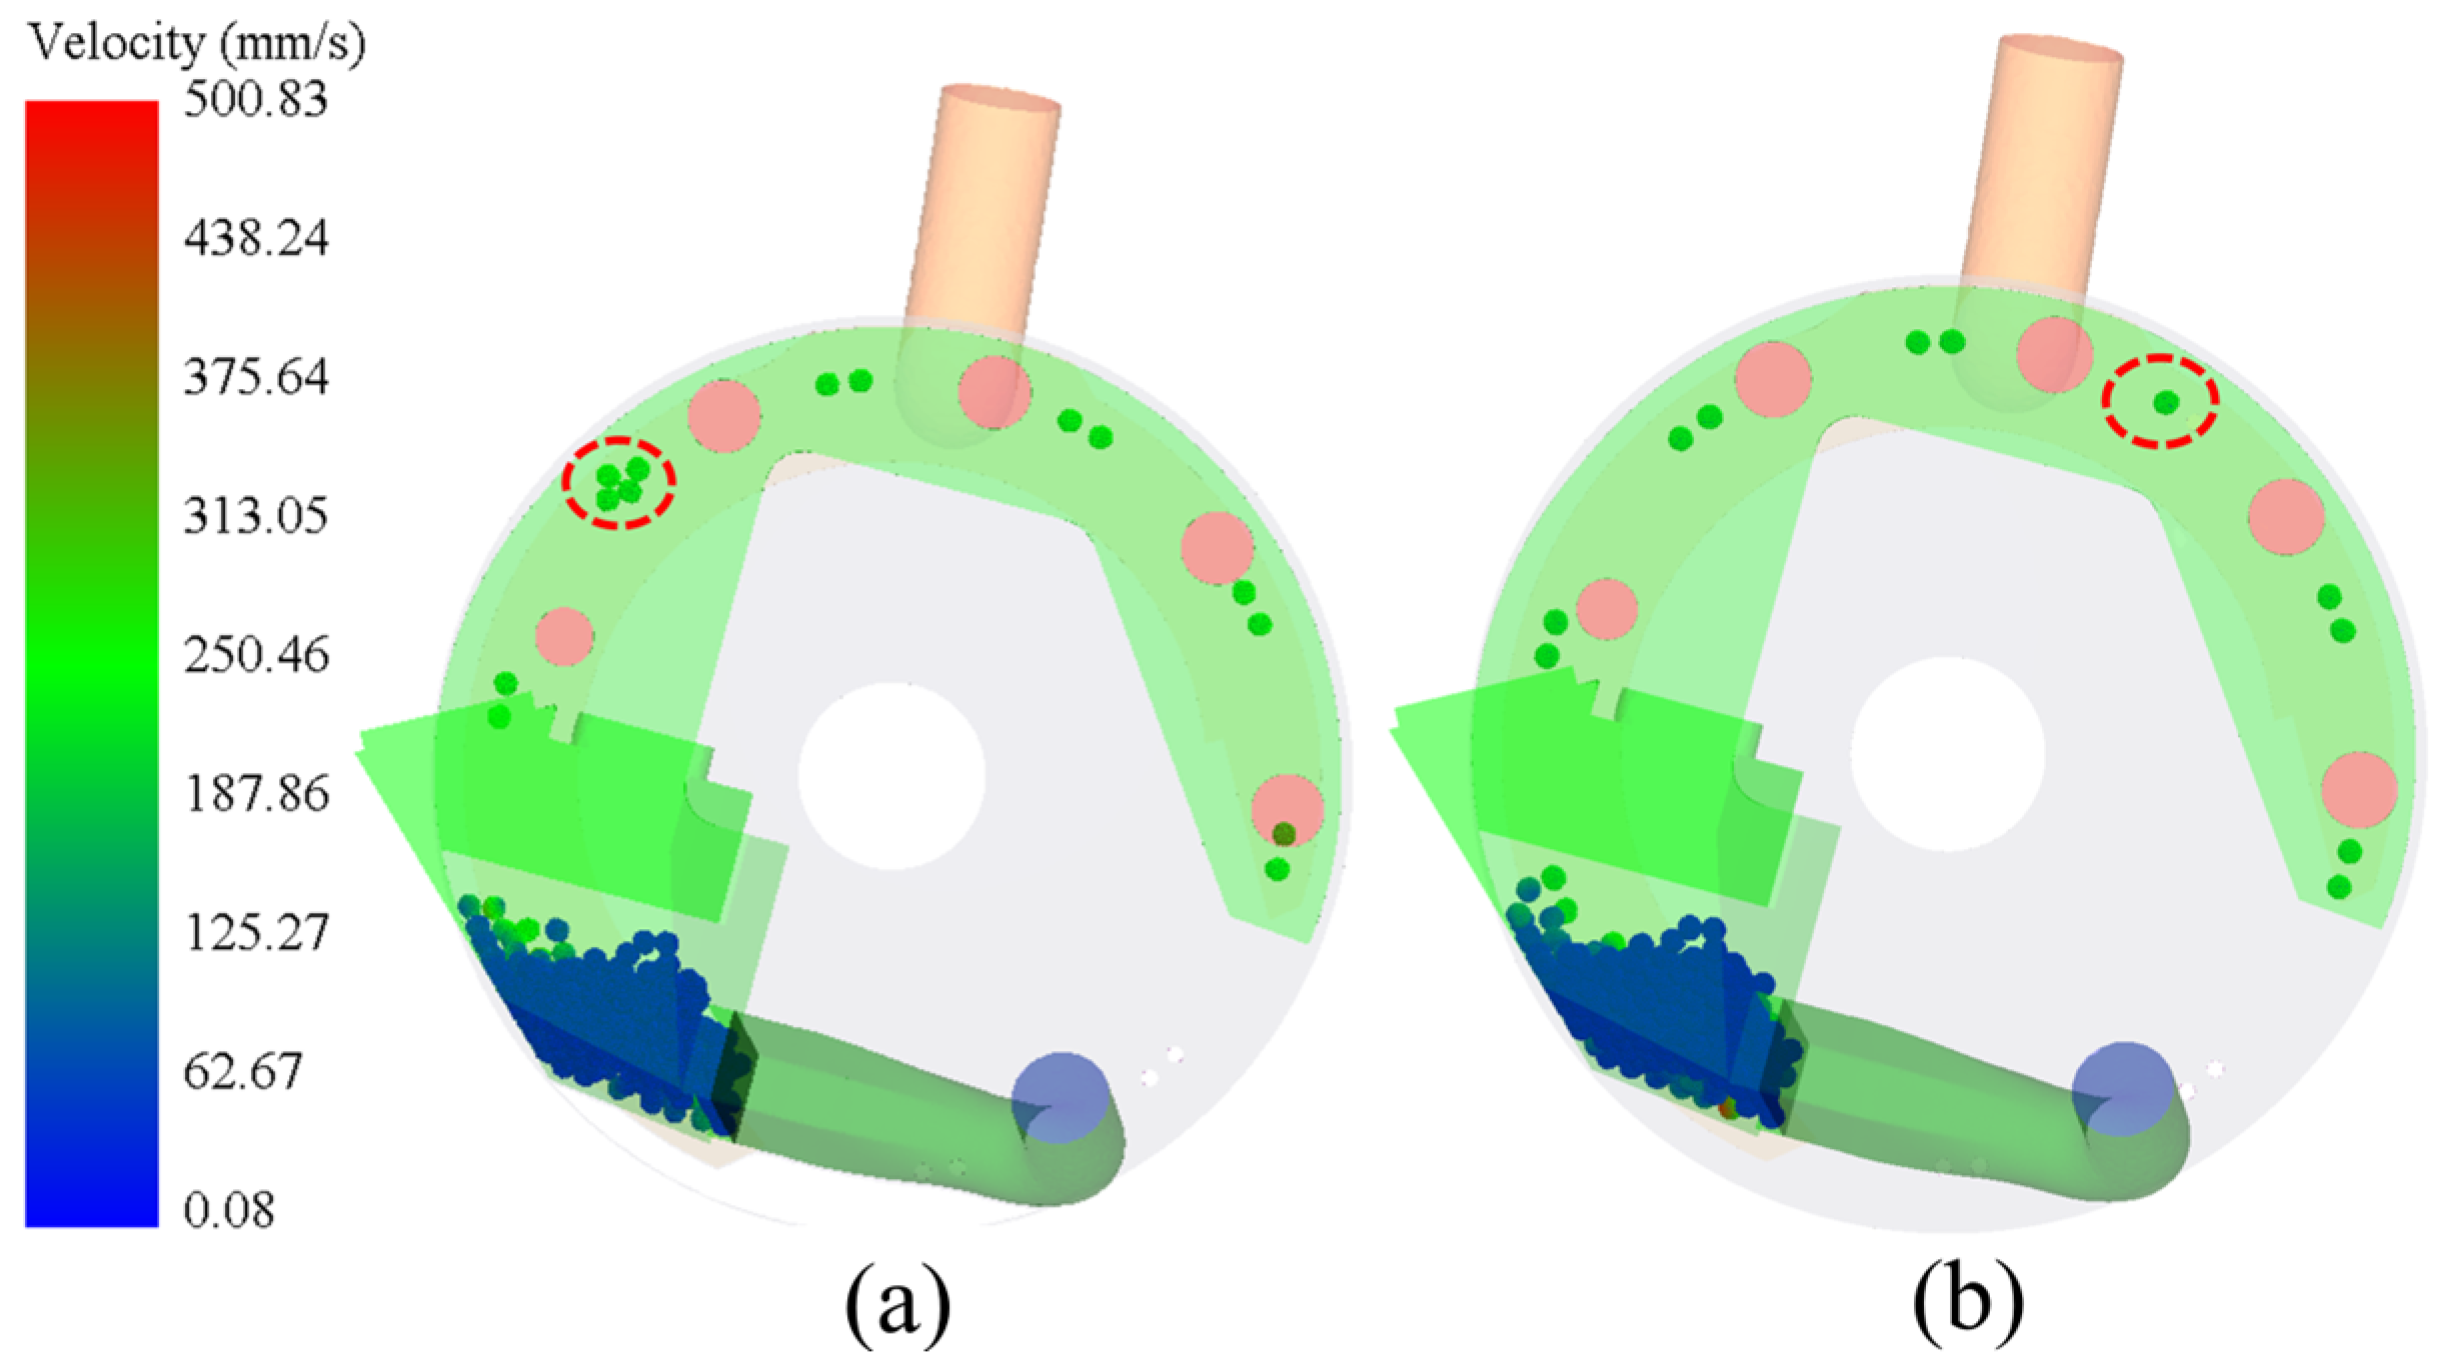
The relationship between the rotational speed of the seed metering disc and the qualified seeding rate showed a distinct concave trend within the tested speed levels (Figure 14b). The highest qualified seeding rate of 96.33% was achieved at a rotational speed of 2.55 rad s−1. As the speed increased beyond this optimal point, performance declined; at 3.64 rad s−1, the qualified rate dropped to 90.33%. This decrease can be explained by two speed-dependent factors: (1) increased centrifugal force, which competes with the vacuum adhesive force and can prevent excess seeds from detaching from the hole’s periphery, promoting the trapping of additional seeds and leading to multiples, and (2) reduced seed–suction hole dwell time, which limits the opportunity for a single seed to settle into and reliably seal the suction hole before exiting the seed pool, resulting in skipped pickups (misses). Therefore, the primary challenge in optimizing this metering system is to determine the operational speed that maximizes the qualified rate by balancing two competing failure modes: multiples (Figure 15a), caused by centrifugal entrapment, and misses (Figure 15b), resulting from inadequate dwell time [27].
Figure 15.
Coupling Force in seeding failure modes: (a) multiple seeding, where more than one seed is captured by a single suction hole, and (b) miss-seeding, where a suction hole fails to acquire any seed. The dashed line circles are used to highlight multiple seeding and missed seeding events.
3.2.3. Impact of Applied Vacuum Pressure on Seeding Quality
The results demonstrated an inverse U-shaped relationship between the applied vacuum pressure and the qualified seeding rate (Figure 14c). The vacuum pressures of 5.2 and 5.6 kPa achieved the highest qualified seeding rate of 95.33%. This indicates that these pressure levels are effective in reliably picking up and securely holding a single seed throughout the transport arc, without being so strong that they inadvertently pull in additional seeds. At a lower vacuum pressure of 4 kPa, a decrease in the qualified seeding rate was observed. This reduction is likely due to insufficient suction force, which fails to reliably pick up and retain a seed as it moves through the seed pool, leading to a higher miss rate and a lower qualified rate. Conversely, when the applied vacuum pressure was increased to 6.4 kPa, the qualified rate also declined. In this scenario, the excessive vacuum caused an overly aggressive pickup action, resulting in the capture of multiple seeds at once, thereby increasing the rate of multiple seed pickups [28].
3.3. Analysis of the Laboratory Test
3.3.1. Experimental Design
Exploratory DEM-CFD simulations demonstrated that miss-seeding began when the disc rotational speeds exceeded 2.55 rad s−1. On the other hand, multiple seeding, primarily due to multiple seeds sticking to a single suction hole, occurred frequently at a vacuum pressure of 6 kPa. To investigate these trade-offs systematically, the seed-metering disc speed (1.45–2.55 rad s−1) and applied negative pressure (3–6 kPa) were selected as experimental factors. Performance was evaluated using two metrics: multiple seeding rate (Y1) and miss-seeding rate (Y2). A properly designed and rotatable central composite design with 13 runs was used to model the response surfaces and identify optimal operating parameters. This design includes 8 factorial points (replicated once), 4 axial points (not replicated), and 5 centre points. The design matrix, showing both coded and actual factor levels, is presented in Table 5.
Table 5.
Coded and actual values of the experimental factors.
3.3.2. Regression Model Development and Significance Testing
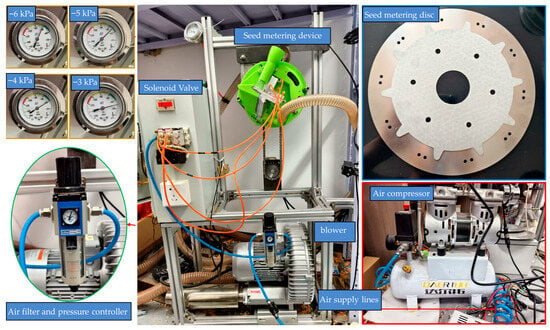
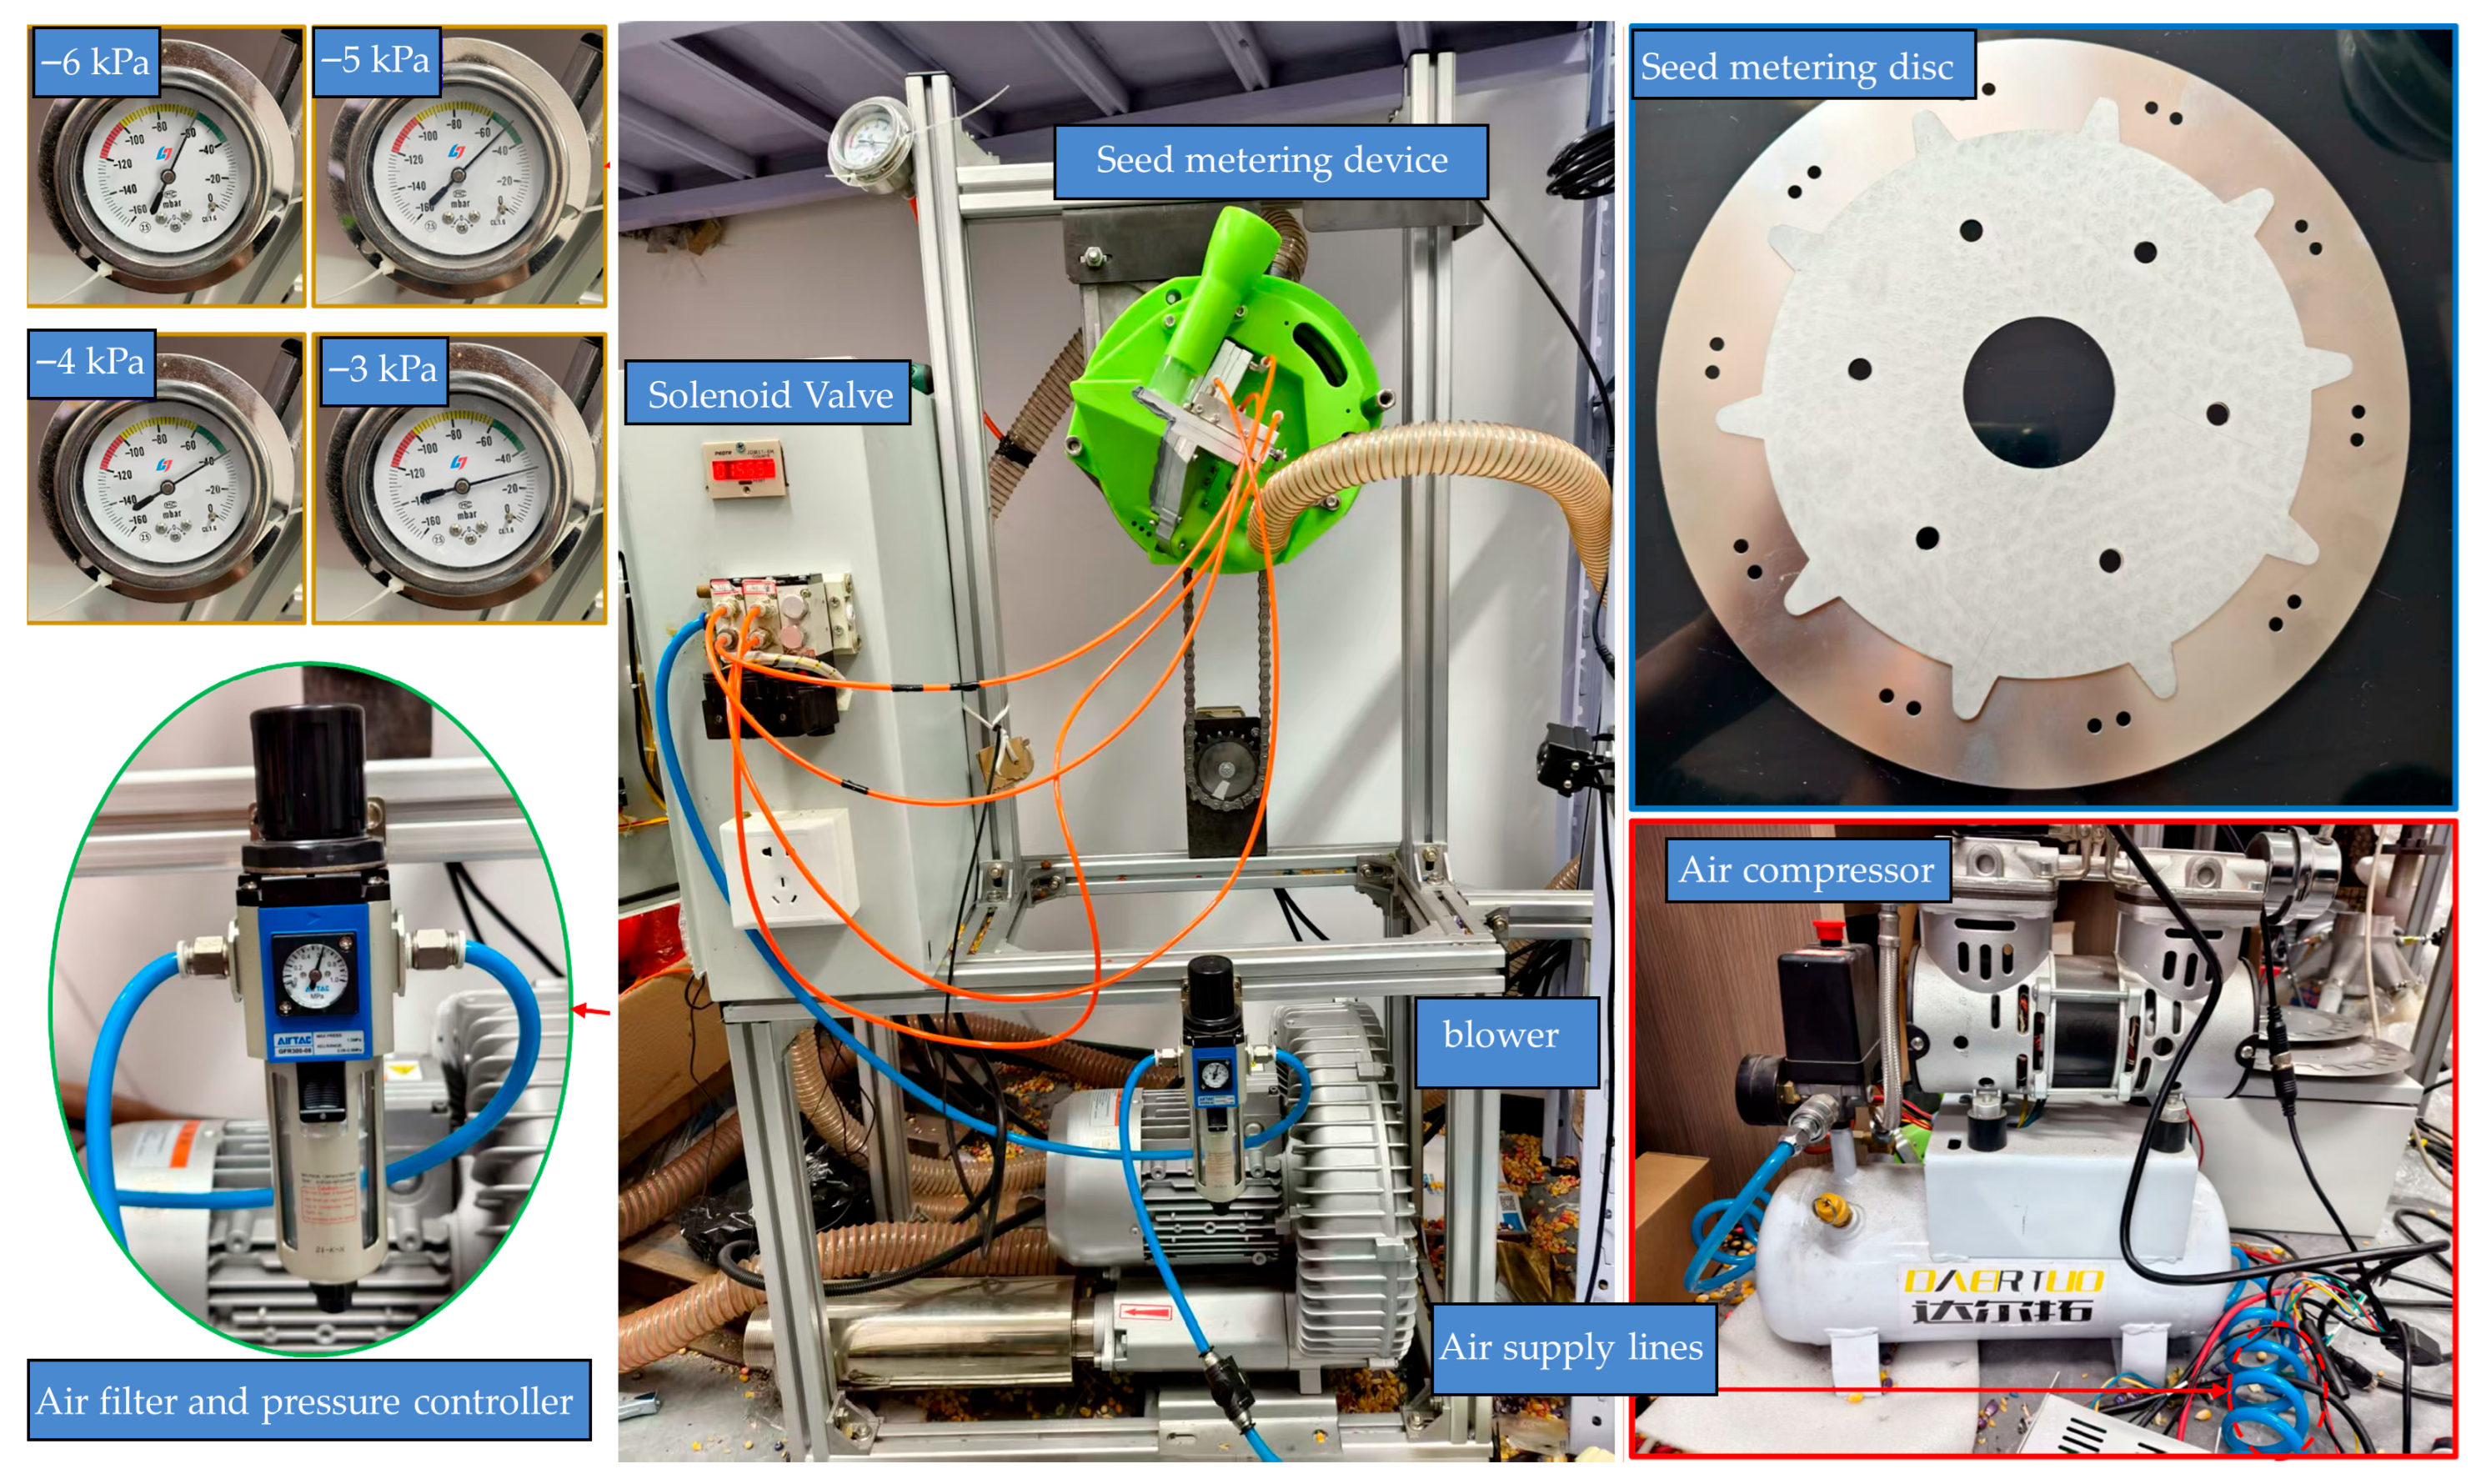
A dedicated test bench (Figure 16) was constructed to validate the performance of the seed-metering device and determine its optimal operating parameters. To achieve exceptionally stable and controllable airflow—crucial for isolating the effects of operational parameters—the bench utilized a two-stage air supply system. This system consisted of an air compressor with a pressure regulator that fed into a centrifugal blower. The compressor provided a steady, high-pressure air source to the blower’s intake, which then delivered the precise low-pressure, high-volume airflow required for the seed-metering disc. The system pressure was carefully regulated by adjusting the blower speed, and real-time monitoring was conducted using a pressure gauge. Additionally, the rotational speed of the seed disc was controlled independently by adjusting the drive motor’s speed setting. The CCD experimental matrix and corresponding results are shown in Table 6.
Figure 16.
A full compressor-blower combination test bench to determine the optimal operating parameters of the seed-metering device.
Table 6.
Central Composite Design matrix and experimental results.
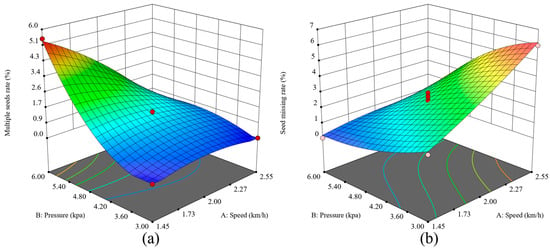
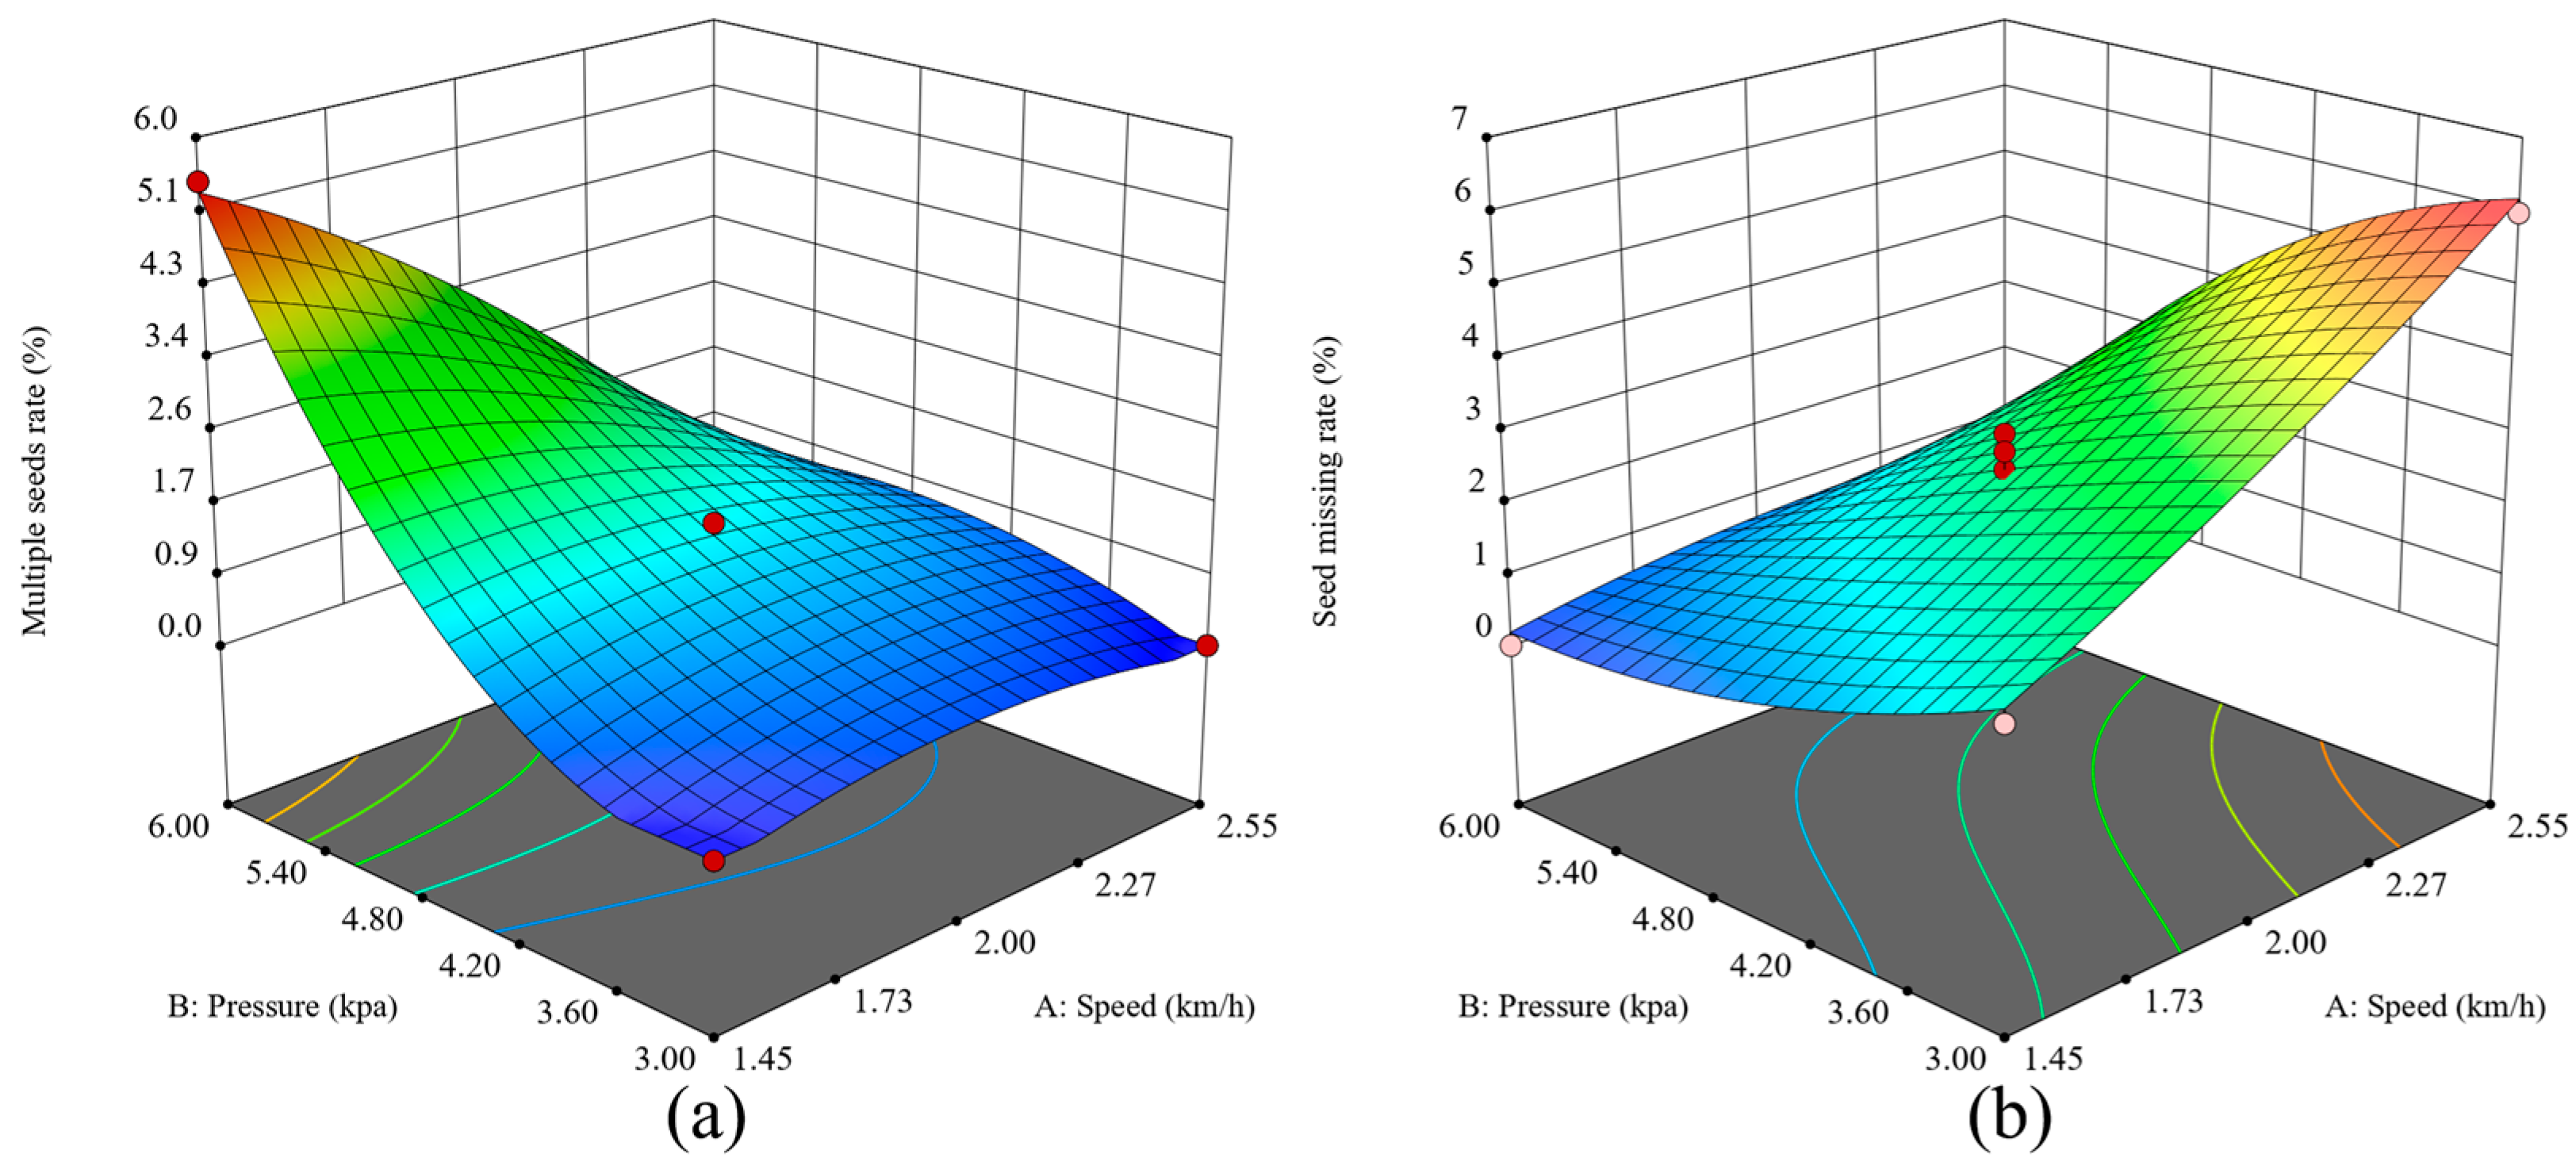
Data were analyzed using Design-Expert 13 software, which generated response surface plots (Figure 17) illustrating the relationships between the seeding quality metrics and the experimental factors. The assumptions of normality for the variables multiple seeding rate and miss-seeding rate were checked via a normal plot of residuals, which shows that the residuals align well with the theoretical normal distribution. Therefore, the normality assumption is satisfied for this model.
Figure 17.
Response surface plots for (a) multiple seeding rate and (b) miss-seeding rate.
The response surfaces (Figure 17) demonstrate clear trends: increasing disc speed reduces multiple seeding but increases miss-seeding. In contrast, higher negative pressure boosts multiple seeding while significantly decreasing miss-seeding. These opposing effects highlight the fundamental trade-off between operational speed and seeding precision. Higher disc speeds decrease the effective time available for seed pickup (dwell time), which lowers the probability of capturing multiple seeds (resulting in reduced multiple seeding). However, this also raises the likelihood of seed skips (increased miss-seeding) due to insufficient vacuum contact time. On the other hand, elevated negative pressure enhances seed adhesion, improving pickup consistency and reducing miss-seeding, although this comes at the cost of higher multiple seeding rates.
According to Table 7, the regression model for the multiple-seed rate is highly significant. The p-value for is greater than 0.05, suggesting that it does not have a significant effect on the multiple-seed rate. All other factors are significant, indicating that the experimental variables influence the multiple-seed rate in a quadratic manner. Additionally, the lack-of-fit term is not significant, indicating that the regression model is a good fit for the experimental range. After removing the non-significant factors, a multiple fitting was performed, and the regression equation for the multiple-seed rate is presented in Equation (11).
Table 7.
Analysis of variance (ANOVA) for multiple seeding rate.
Within the same analytical framework, the regression model for the mis-seeding rate demonstrates high statistical significance. According to Table 8, the p-values associated with the interaction term and the quadratic terms , , , and exceed the 0.05 significance level, indicating that these factors do not exert a statistically significant influence on the mis-seeding rate. Furthermore, the lack-of-fit test yields a non-significant result, confirming that the model provides an adequate fit to the observed data within the experimental domain. The primary and secondary factors affecting the mis-seeding rate, ranked in descending order of influence, are , , and the interaction term . Following the elimination of non-significant terms, the reduced regression equation for the mis-seeding rate is presented in Equation (12).
Table 8.
Analysis of variance (ANOVA) for miss-seeding rate.
The substantially higher F-values for pressure on multiple seeding and miss-seeding rates (F = 225.78 and 55.86, respectively) indicate that vacuum level is the dominant factor governing seed pickup and release accuracy. This strong dependence arises from the direct role of suction force in securing seeds to the metering holes: insufficient pressure leads to seed skips (increased miss-seeding), while excessive pressure promotes multiple seed pickup (increased multiple seeding). Disc speed exhibited the strongest effect on miss-seeding rate (F = 76.03).
3.3.3. Numerical Optimization
A multi-objective numerical optimization was performed to maximize forward working speed (via X1) and minimize miss-seeding rate (Y2), subject to the constraint that the multiple seeding rate (Y1) remains below 3%. The optimization function was formulated as:
The numerical optimization conducted using Design-Expert 13 identified an optimal compromise at a seed-metering disc speed (X1) of 2.65 rad s−1 and an applied negative pressure (X2) of 5.8 kPa, corresponding to a forward speed of approximately 1.82 km h−1. At this operating point, the predicted performance metrics are a multiple seeding rate (Y1) of 2.95% (satisfying the <3% constraint) and a miss-seeding rate (Y2) of 0.85%. This solution represents the most favourable trade-off, enabling high-speed field operations while maintaining precise seed placement. It effectively utilizes nearly the full allowable multiple seeding tolerance to simultaneously maximize forward speed and minimize miss-seeding. The soybean seed fluidization test validated that a vacuum level of 6 kPa was sufficient to initiate seed motion. This value was therefore established as the practical threshold for effective seed pick-up and was found to corroborate the upper bound of the theoretical prediction.
3.4. Field Experiment
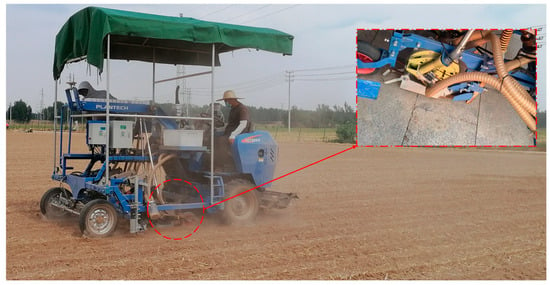
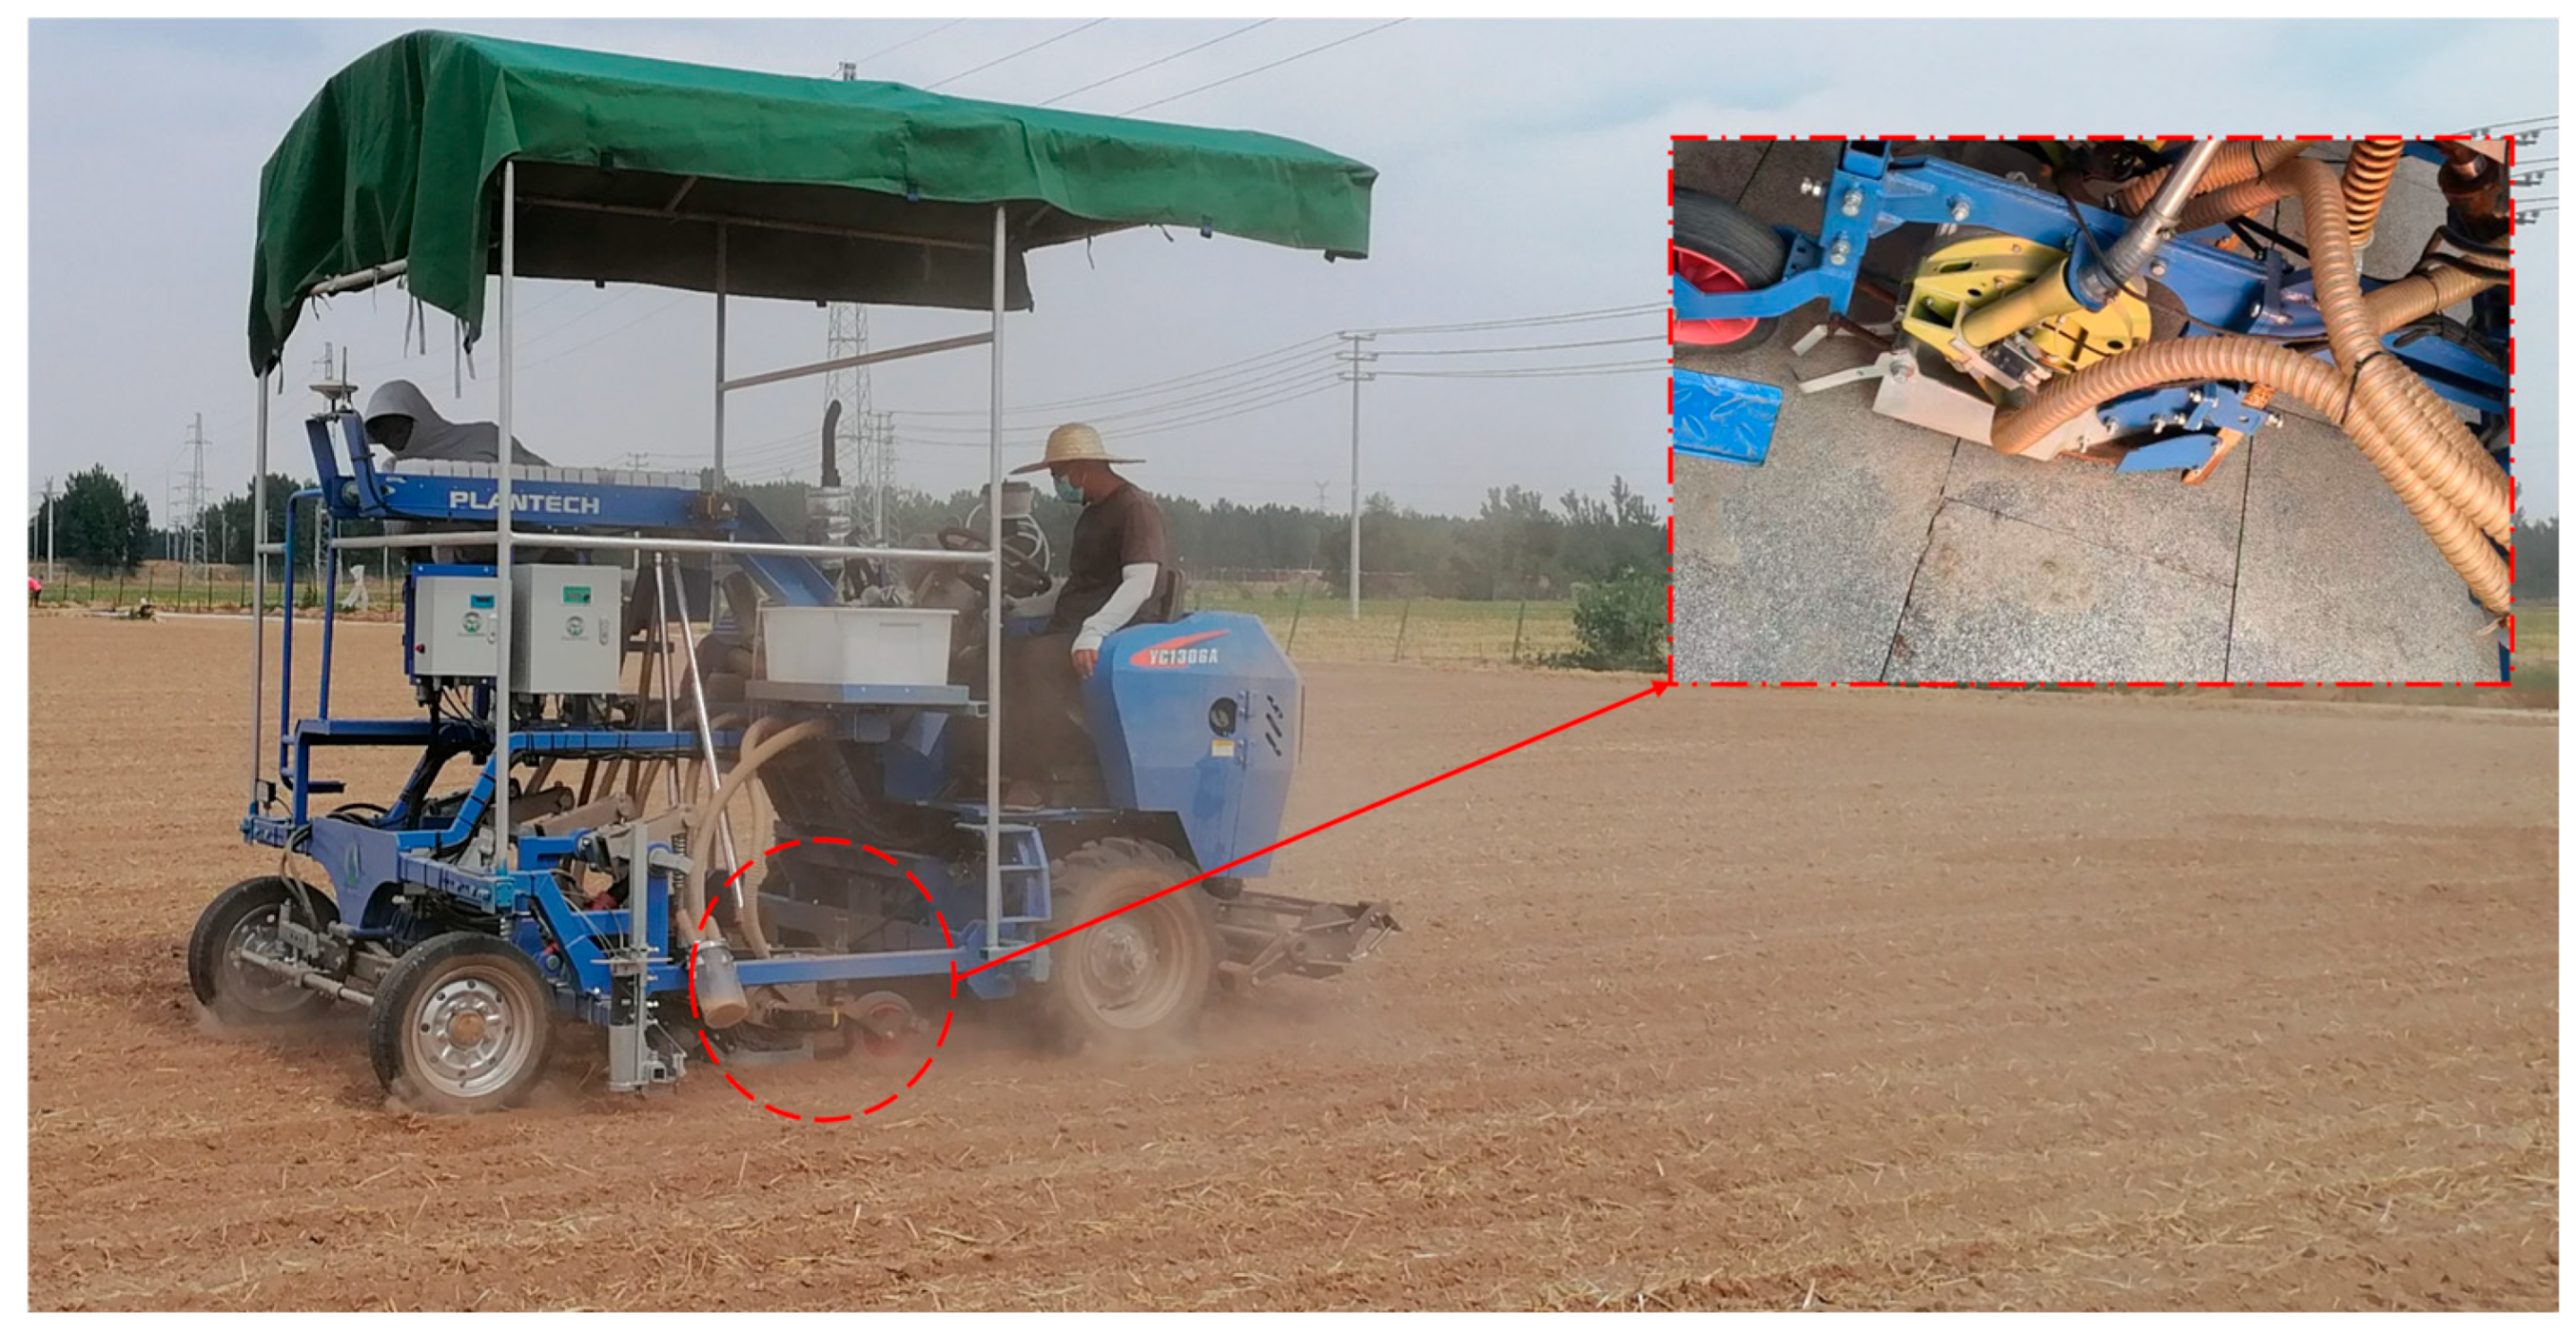
Field validation took place on 23 June 2025, at a saline–alkali soil test site in Dongying (Figure 18). The prototype seed metering device was attached to a commercial planter for operational testing. During this process, the optimized operational factor values established in previous optimization studies were validated. The experimental layout consisted of five ridges, each 60 m long. To facilitate repeated measurements and account for field variability, each ridge was subdivided into contiguous 12-m test plots, which were separated by 4-m buffer zones to prevent interference. A total of 100 seed hills were targeted for sowing within each test plot.
Figure 18.
Field validation trial of the optimized seed-metering device in a saline–alkali soil environment.
After the sowing was completed, the surfaces of the ridges were carefully excavated to expose the seeds. This allowed for direct measurement and statistical analysis of seeding accuracy parameters, including hill spacing, and the incidence of missed or multiple seeds. The Field validation results of the seed metering device are shown in Table 9. A performance level is considered optimal when the combination of speed and pressure results in a qualified seeding rate of at least 90.4% [16]. The seeder exhibited high precision, with both multiple seeding and miss-seeding rates kept below 2% and 0.5%, respectively. This confirms its reliability and effectiveness for practical soybean sowing operations.
Table 9.
Field validation results of the seed metering device under optimal operating parameters.
4. Conclusions
To address critical research gaps related to the efficiency of conventional domestic soybean breeding seeders, specifically their structural complexity, low automation, and inefficient seed-clearing times, this study developed a novel pneumatic double-seed metering device featuring an integrated, rapid seed-clearing mechanism. Key findings are summarized as follows.
The developed device successfully prevents the mixing of different seed varieties by enabling a quick, automated clearing operation.
A multi-objective numerical optimization identified an optimal operational compromise at a seed-metering disc speed of 2.65 rad s−1 (approximately 1.82 km h−1) and an applied negative pressure of 5.8 kPa. This operating point balances the competing failure modes of multiple and miss-seeding.
Field trials conducted in a saline–alkali soil environment confirmed the device’s reliability and effectiveness for practical soybean sowing operations. The prototype exhibited high precision, with average multiple and miss-seeding rates kept below 2% and 0.5%, respectively, during field tests.
In summary, this solution significantly improves seeding precision and field efficiency, providing an essential and reliable tool for modern, high-throughput soybean breeding programmes.
Although the metering device has shown promising performance, its current design is primarily tailored for soybeans. To effectively handle larger-seeded crops like maize, which demand greater negative pressure and altered orifice geometries, additional structural optimization is required. Key improvements should focus on developing a seed disc with dynamically adjustable orifice sizes and quantities and on implementing real-time monitoring and feedback control systems.
Author Contributions
Data curation, G.L. and Z.S.; funding acquisition, R.Z.; investigation, N.X. and Z.G.; methodology, X.C. and A.E.S.; project administration, R.Z.; supervision, X.H.; validation, R.Z. and X.H.; writing—original draft, X.C. and Z.S.; writing—review and editing, A.E.S. All authors have read and agreed to the published version of the manuscript.
Funding
This research was funded by Research and application of intelligent crop breeding equipment, grant number 2024LZGC004.
Institutional Review Board Statement
Not applicable.
Data Availability Statement
The original contributions presented in this study are included in the article. Further inquiries can be directed to the corresponding authors.
Conflicts of Interest
Author Guoying Li was employed by the company Qingdao Plantech Mechanical Technology Co., Ltd. The remaining authors declare that the research was conducted in the absence of any commercial or financial relationships that could be construed as a potential conflict of interest.
References
- Kong, W.; Wei, M.; Khan, N.; Liang, J.; Han, D.; Zhang, H. Assessing sustainable future of import-independent domestic soybean production in China: Policy implications and projections for 2030. Front. Sustain. Food Syst. 2024, 8, 1387609. [Google Scholar] [CrossRef] [Scilit]
- Dai, X.; Chen, L.; Hou, Y.; Ning, X.; Zhao, W.; Cui, Y.; Liu, J.; Wang, M. A comparative study of neural network models for China’s soybean futures price forecasting. Agriculture 2025, 15, 2586. [Google Scholar] [CrossRef] [Scilit]
- He, J.; Chen, Y.; Zhang, M.; Qiu, Y.; Zhou, H.; Li, M. Current perspectives on improving soybean performance on saline-alkaline lands. New Crops 2026, 3, 100079. [Google Scholar] [CrossRef] [Scilit]
- Cai, X.; Jia, B.; Sun, M.; Sun, X. Insights into the regulation of wild soybean tolerance to salt-alkaline stress. Front. Plant Sci. 2022, 13, 1002302. [Google Scholar] [CrossRef] [Scilit]
- Shang, S.; Wu, X.; Yang, R.; Li, G.; Yang, X.; Chen, D. Research status and prospect of plot-sowing equipment and technology. Trans. Chin. Soc. Agric. Mach. 2021, 52, 1–20. [Google Scholar]
- Ren, D.; Chang, X.; Liu, B.; Yang, Y.; Li, M.; Wang, D.; Gao, Z. Study on the design and performance of a seed discharger for peanut plot breeding based on the CFD-DEM method. Agriculture 2025, 15, 276. [Google Scholar] [CrossRef] [Scilit]
- Hou, S.; Zhang, Z.; Wang, Z.; Zhang, Y.; Chen, H. Design and experiment of flexible mechanical soybean precision seed-metering device. Trans. Chin. Soc. Agric. Mach. 2020, 51, 77–86, 108. [Google Scholar]
- Dun, G.; Yu, C.; Yang, Y.; Ye, J.; Du, J.; Zhang, J. Parameter simulation optimization and experiment of seed plate type hole for soybean breeding. Trans. CSAE 2019, 35, 62–73. [Google Scholar]
- Dun, G.; Wu, X.; Ji, X.; Zhang, F.; Ji, W.; Yang, Y. Simulation and optimization of soybean plot metering device with double swing plate. J. Agric. Sci. Technol. 2024, 26, 82–90. [Google Scholar] [CrossRef]
- Dun, G.; Li, W.; Mao, N.; Wu, X.; Ji, W.; Ma, H. Optimization design and experiment of alternate post changing seed metering device for soybean plot breeding. J. Jilin Univ. (Eng. Technol. Ed.) 2022, 53, 285–296. [Google Scholar]
- Dun, G.; Mao, N.; Li, W.; Wu, X.; Zheng, C.; Ji, W. Design and experiment of four-bar translational seed metering device for soybean plot breeding. Trans. Chin. Soc. Agric. Mach. 2022, 53, 70–78. [Google Scholar]
- Chen, H.; Wang, H.; Wang, Y.; Shi, N.; Wang, Z.; Ding, Y. Design and experiment of three-leaf type air-suction seed meter with automatic clear and replace seeds features for soybean plot test. Trans. Chin. Soc. Agric. Mach. 2020, 51, 75–85. [Google Scholar]
- Li, Y.; Zhao, S.; Yang, F.; Liu, P.; Li, B.; Song, Q.; Yan, S.; Li, X. Research on the flexible gradual seed-cleaning method of the brush-type single-seed soybean planter. Agriculture 2024, 14, 399. [Google Scholar] [CrossRef] [Scilit]
- Guan, R.-X.; Guo, X.-Y.; Qu, Y.; Zhang, Z.-W.; Bao, L.-G.; Ye, R.-Y.; Chang, R.-Z.; Qiu, L.-J. Salt Tolerance in Soybeans: Focus on Screening Methods and Genetics. Plants 2024, 13, 97. [Google Scholar] [CrossRef] [Scilit]
- Wang, W.; Song, L.; An, X.; Quan, L.; Xie, D.; Chen, Y.; Li, Z.; Wu, Z.; Chen, L. Optimizing seed filling performance of the double-filling air suction maize and soybean seed metering device based on DEM-CFD coupling method. Comput. Electron. Agric. 2025, 237, 110586. [Google Scholar] [CrossRef] [Scilit]
- Bustos-Gaytán, A.; Saldaña-Robles, N.; Joya-Cárdenas, D.R.; Gutiérrez-Vaca, C.; Alfaro-Ayala, J.A.; Barco-Burgos, J.; Saldaña-Robles, A. Advancements in pneumatic seed-metering devices: A review of numerical and experimental approaches. Results Eng. 2025, 26, 105626. [Google Scholar] [CrossRef] [Scilit]
- El Salem, A.; Shang, S.; Wang, D.; Zhang, G.; Wang, H.; Abdeen, M.A.; Shehabeldeen, T.A. Developing an adequate DEM model to simulate soil-tool interactions under sticky soil conditions. Soil Tillage Res. 2026, 256, 106893. [Google Scholar] [CrossRef] [Scilit]
- Ma, X.; Tan, A.; Guo, M.; Liu, H.; Hou, Z.; Guo, F.; Yu, R. Performance test of multi-channel pneumatic seeding device based on CFD-DEM. Powder Technol. 2025, 469, 121944. [Google Scholar] [CrossRef] [Scilit]
- Xing, H.; Cao, X.; Zhong, P.; Wan, Y.; Lin, J.; Zang, Y.; Zhang, G. DEM-CFD coupling simulation and optimisation of rice seed particles seeding a hill in double cavity pneumatic seed metering device. Comput. Electron. Agric. 2024, 224, 109075. [Google Scholar] [CrossRef] [Scilit]
- Lei, X.; Zhu, P.; Deng, X.; Li, M.; Chen, Y.; Ren, W. Seed motion and airflow characteristics in a centralized pneumatic seed-metering device for rice using CFD-DEM coupled approach and bench testing. Powder Technol. 2025, 469, 121884. [Google Scholar] [CrossRef] [Scilit]
- Li, H.; Yang, L.; Zhang, D.; Tao, C.; He, X.; Xie, C.; Li, C.; Du, Z.; Xiao, T.; Li, Z.; et al. Design and optimization of a high-speed maize seed guiding device based on DEM-CFD coupling method. Comput. Electron. Agric. 2024, 227, 109604. [Google Scholar] [CrossRef] [Scilit]
- Guo, P.; Sun, B.; Shang, S.; Hou, J.; Wang, D.; Zhao, Z.; Elshafie, A.; Zheng, X.; Eltoum, F. Effect of Auxiliary Air-Suction Seed-Filling Structure on Seed Discharge Performance of Peanut High-Speed Seed-Metering Machine. Agriculture 2025, 15, 1678. [Google Scholar] [CrossRef] [Scilit]
- Ding, Y.; Zheng, G.; Zhang, W.; Qi, B.; Wang, Y.; Xia, Q.; Wang, R.; Zhang, H. Design and evaluation of a high-speed airflow-assisted seeding device for pneumatic drum type soybean precision seed metering device. Agronomy 2025, 15, 2202. [Google Scholar] [CrossRef] [Scilit]
- ISO 7256-1:1984; Sowing Equipment, Test Methods, Part 1: Single Seed Drills (Precision Drills). International Standard ISO: Geneve, Switzerland, 1984.
- Zhu, H.; Zhang, S.; Wang, W.; Lv, H.; Chen, Y.; Zhou, L.; Li, M.; Zhao, J. Design and testing of soybean double-row seed-metering device with double-beveled seed guide groove. Agriculture 2024, 14, 1595. [Google Scholar] [CrossRef] [Scilit]
- Qin, W.; Li, Y.; Qian, C.; Fan, Z.; Yan, D.; Zou, G.; Liu, S.; Wang, Z.; Zang, Y.; Zhang, M. The Development of an Air Suction Precision Seed-Metering Device for Rice Plot Breeding. Agronomy 2025, 15, 1642. [Google Scholar] [CrossRef] [Scilit]
- Jia, H.; Chen, Y.; Zhao, J.; Guo, M.; Huang, D.; Zhuang, J. Design and key parameter optimization of an agitated soybean seed metering device with horizontal seed filling. Int. J. Agric. Biol. Eng. 2018, 11, 76–87. [Google Scholar] [CrossRef] [Scilit]
- Zha, X.; Li, J.; Zhao, H.; Chen, L.; Yang, W.; Yang, R.; Liu, W. Design optimization of an air-suction type seeder for rice breeding plots based on the discrete element method (DEM). Smart Agric. Technol. 2025, 12, 101658. [Google Scholar] [CrossRef] [Scilit]

Disclaimer/Publisher’s Note: The statements, opinions and data contained in all publications are solely those of the individual author(s) and contributor(s) and not of MDPI and/or the editor(s). MDPI and/or the editor(s) disclaim responsibility for any injury to people or property resulting from any ideas, methods, instructions or products referred to in the content. |
© 2026 by the authors. Licensee MDPI, Basel, Switzerland. This article is an open access article distributed under the terms and conditions of the Creative Commons Attribution (CC BY) license.