


Abstract
To achieve high-speed quantitative hole sowing of rice using an unmanned aerial vehicle (UAV), this study proposes an agricultural UAV pneumatic hole sowing system suitable for high-speed quantitative hole sowing. This system is based on pelletizing rice seeds. A pneumatic seed distribution system based on the Venturi effect was designed, with a seed feeding device that employs a computational fluid dynamics–discrete element method (CFD-DEM) coupled simulation method to construct a gas–solid two-phase flow simulation model that simulates actual field sowing conditions and analyzes seed transport characteristics. Using the seed feeding device blending chamber height, expansion section cone angle, and inlet airflow velocity as experimental factors, and evaluating seed distribution statistics based on the hole formation ratio(HFR) and hole spacing coefficient of variation (HSCV), the study achieved a comprehensive statistical analysis of seed distribution patterns. The Box–Behnken orthogonal experiment optimized the structural parameters of the seed feeding device, determining the optimal airflow velocity during seeding. The optimized parameter combination yielded a blending chamber height of 15.59 mm, an expansion section cone angle of 22.20°, and an inlet airflow velocity of 19.67 m/s, corresponding to an HFR of 84.66% and an HSCV of 6.95%. Field trials validated an HFR of 86.25% and an HSCV of 6.83%. This study provides theoretical and technical support for the design of high-speed hole -sowing equipment for rice using a UAV.
1. Introduction
Precision hole sowing technology for rice offers advantages such as labor and time savings along with high production efficiency, making it one of the primary cultivation methods for rice in China [1,2,3]. Hole sowing refers to depositing multiple seeds at specific intervals into concentrated holes or hills in the soil, facilitating field management and improving crop uniformity. To meet the agronomic requirements for different hole sowing densities in the precision hole sowing of conventional rice and hybrid rice, Zhang et al. [4] proposed a dual-chamber side-filling seed dispenser. When operating in single-chamber mode, it accommodates the hole sowing density for hybrid rice, while dual-chamber operation meets the density requirements for conventional rice. Zhang et al. [5] developed a combination-type hole-wheel seed distributor. Experiments confirmed the optimal hole volumes for different seeding rates in traditional rice and hybrid rice. Building upon this design, Wang et al. [6] proposed a stepless adjustment method for seeding rates. By controlling the motor rotation to adjust the relative angle between the inner and outer wheels, the hole volume is modified, enabling stepless adjustment of 3 to 10 seeds per hole. Due to the slender shape and rough surface of rice seeds, which exhibit high rolling friction resistance and tend to pile up chaotically in the filling zone [7,8,9], this study employed pelletization treatment to enhance seed flowability and filling efficiency. As a critical component of pneumatic seed dispensers, the structural parameters of the seed feeding device significantly influence seed trajectory within the discharge duct, acceleration efficiency, and seed placement accuracy in planting holes. To enhance the performance of pneumatic seed distributors, Lei et al. [10,11,12,13] employed a computational fluid dynamics–discrete element method (CFD-DEM) coupled simulation method to investigate seed migration characteristics within the pneumatic seed feeding device, seed delivery tube, pressure-boosting tube, and distributor. Xing et al. [14,15] designed a positive-pressure precision seed-throwing device to improve rice seeding performance on hilly terrain, utilizing a dual-chamber pneumatic seed distributor to address the uneven distribution of rice seeds in the field. This study aims to develop a pneumatic hole seeding system for pelleted rice using UAVs, optimizing structural parameters through CFD-DEM coupled simulation to achieve high-speed quantitative hole sowing.
Existing research indicates that current hole sowing practices for rice primarily rely on ground-based machinery. However, for rice fields characterized by significant elevation differences, deep muddy conditions prone to vehicle sinking, and irregular shapes, ground machinery faces considerable operational challenges when entering the field [16,17,18]. In contrast, unmanned aerial vehicles (UAVs) offer superior maneuverability, are less affected by terrain and topography, and can flexibly plan flight paths and operate autonomously [19,20,21]. Currently, agricultural UAVs primarily use broadcast seeding, with seeding devices categorized into centrifugal and pneumatic types. A drawback is that seeds are easily disrupted by the rotor wind field during descent, making it difficult to achieve uniform rows and holes after seeding, which complicates field management. Song et al. [22] designed a pneumatic unmanned aerial seeding device. Gao et al. [23] developed a rice and green manure seeding device that can be suspended on multiple UAV platforms. Huang et al. [24] addressed issues such as scattered and disordered seed distribution caused by the widespread use of broadcast seeding in the aerial seeding of rice and rapeseed. They designed a UAV seeding device capable of simultaneously adapting to the strip seeding agronomic requirements of both rice and rapeseed. Unlike traditional broadcast seeding where seeds are randomly scattered and easily disrupted by rotor downwash, precision hole sowing by UAV deposits seeds in organized patterns at predetermined intervals, enabling controlled field management and improved agronomic outcomes. Due to the high seed rate required for row seeding, poor ventilation and light penetration, and increased susceptibility to pests, diseases, and weeds, this study conducted experimental research on precision hole sowing for the UAV aerial seeding of pelleted rice. Pelleted rice seeds (PRSs) refer to seeds that have been processed into uniform spherical particles through a compaction process, distinct from simple coating. The research was based on a mechanized quantitative seed feeder and an airflow-assisted seed distribution system independently developed by our team.
With the rapid advancement of computer simulation technology, numerous scholars have employed the CFD-DEM method to conduct numerical investigations into fluid flow and particle motion behavior. Liao et al. [25] utilized a CFD-DEM coupled simulation model to simulate the motion characteristics of oat seeds, purple vetch seeds, and mixed seeds within an air-blown manifold distributor. Ji et al. [26] systematically analyzed the motion characteristics of grinding balls in vertical spiral agitator mills from four aspects: trajectory, velocity, force, and energy. Hosseini et al. [27] conducted a numerical study on the agglomeration behavior of bituminous particles in turbulent pipe flow. Han et al. [28] investigated the influence of seed conduit geometry on sowing uniformity through CFD-DEM coupled simulation. Alipoor et al. [29] employed CFD-DEM technology to investigate the effects of inlet gas velocity, fluidization state, and particle size on thermal behavior in fluidized beds. The research above demonstrates that simulation results based on the CFD-DEM coupling method can effectively explain the mechanisms of fluid and particle motion. These findings are consistent with experimental data and hold significant reference value.
While ground-based seeding systems face limitations in muddy fields and irregular terrain, this study advances UAV-based hole seeding by establishing a CFD-DEM coupled model that quantifies how seed feeding device geometry affects placement accuracy and by designing an optimized pneumatic device that integrates quantitative feeding with airflow-assisted distribution for precise pelleted rice hole sowing at flight speed—addressing gaps left by conventional broadcast seeding methods.
Although previous studies have investigated the seed feeding device, most prior research has failed to account for seed distribution patterns after acceleration through the seed feeding device and subsequent placement into the soil. To optimize structural parameters and determine suitable operating conditions, this study employs a CFD-DEM coupled simulation method to model the actual field operation conditions of an agricultural UAV. Using the hole formation ratio(HFR) and hole spacing coefficient of variation (HSCV) as evaluation metrics, the optimal combination parameters for the blending chamber height, expansion section cone angle, and inlet flow velocity were obtained. This research guides the development of high-speed hole sowing seed distribution technology.
2. Pneumatic Seeding System and Its Working Principle
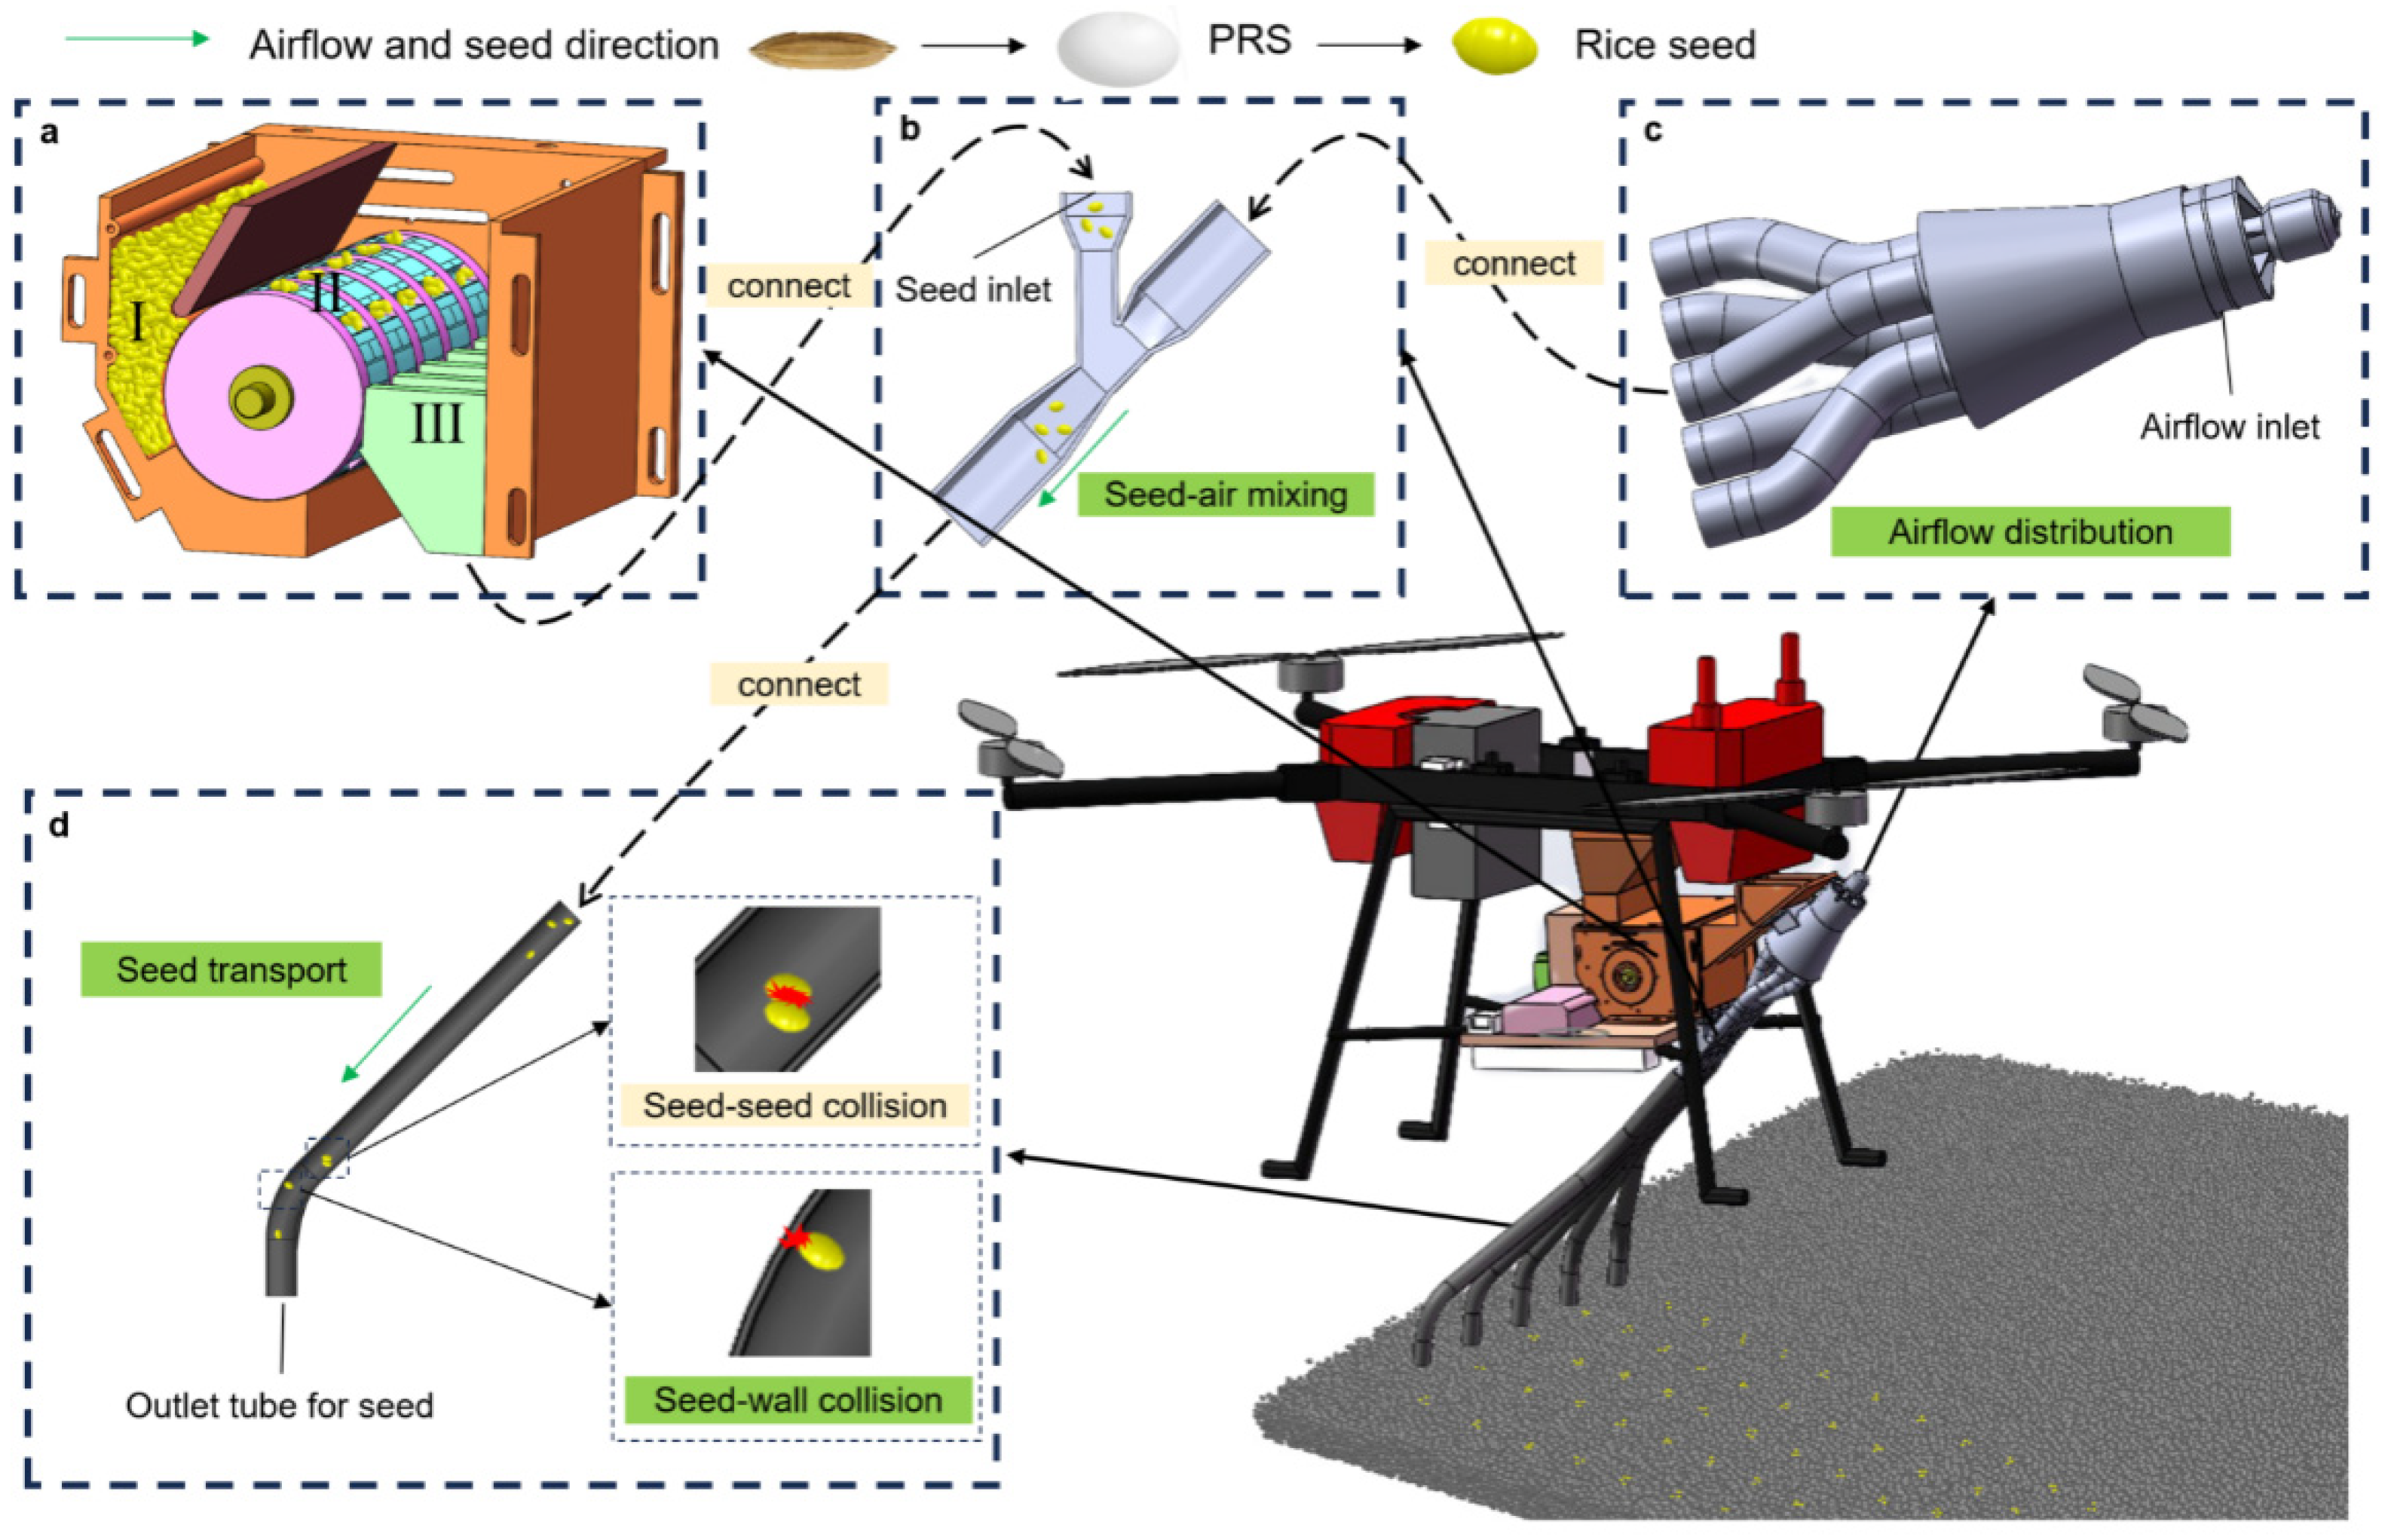
The pneumatic seeding system for agricultural UAV operates based on “mechanical quantitative seed feeding + airflow row distribution [30,31,32].” As shown in Figure 1, the mechanical seed feeder comprises a seed-filling zone I, a seed-carrying zone II, and a seed supply zone III. During operation, pelleted rice seeds (PRS) in the seed hopper enter the filling chamber under gravity. Seeds within the chamber are transported into the mold cavities by lateral seed pressure and serrated agitation, rotating with the cavities. By controlling the gap between the filling adjustment plate and the seed delivery mechanism, precise filling probability is ensured. When the seed-carrying port moves to the seed supply zone, seeds enter the seed feeding device at point b through the seed outlet under the combined action of gravity and centrifugal force, achieving precise seed metering. The high-speed airflow generated by the duct fan at point c is evenly divided into five rows by the airflow distribution device and then enters the seed feeding device. In the blending chamber and seed discharge tube, the confined high-velocity airflow continuously exerts drag on the seeds and forms a pressure gradient along the flow direction, thereby rapidly accelerating the seeds toward point d for deposition into the soil.
Figure 1.
Operational Mechanism of the Pneumatically Assisted Seed-Dispensing System for Pelleted Rice. (a) seed feeder; (b) seed feeding device; (c) airflow distribution device; (d) seed transfer tube.
2.1. Structure and Working Principle of the Seed Feeding Device
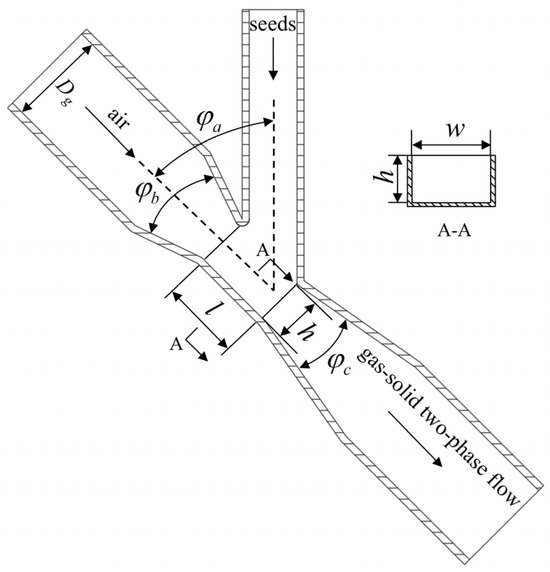
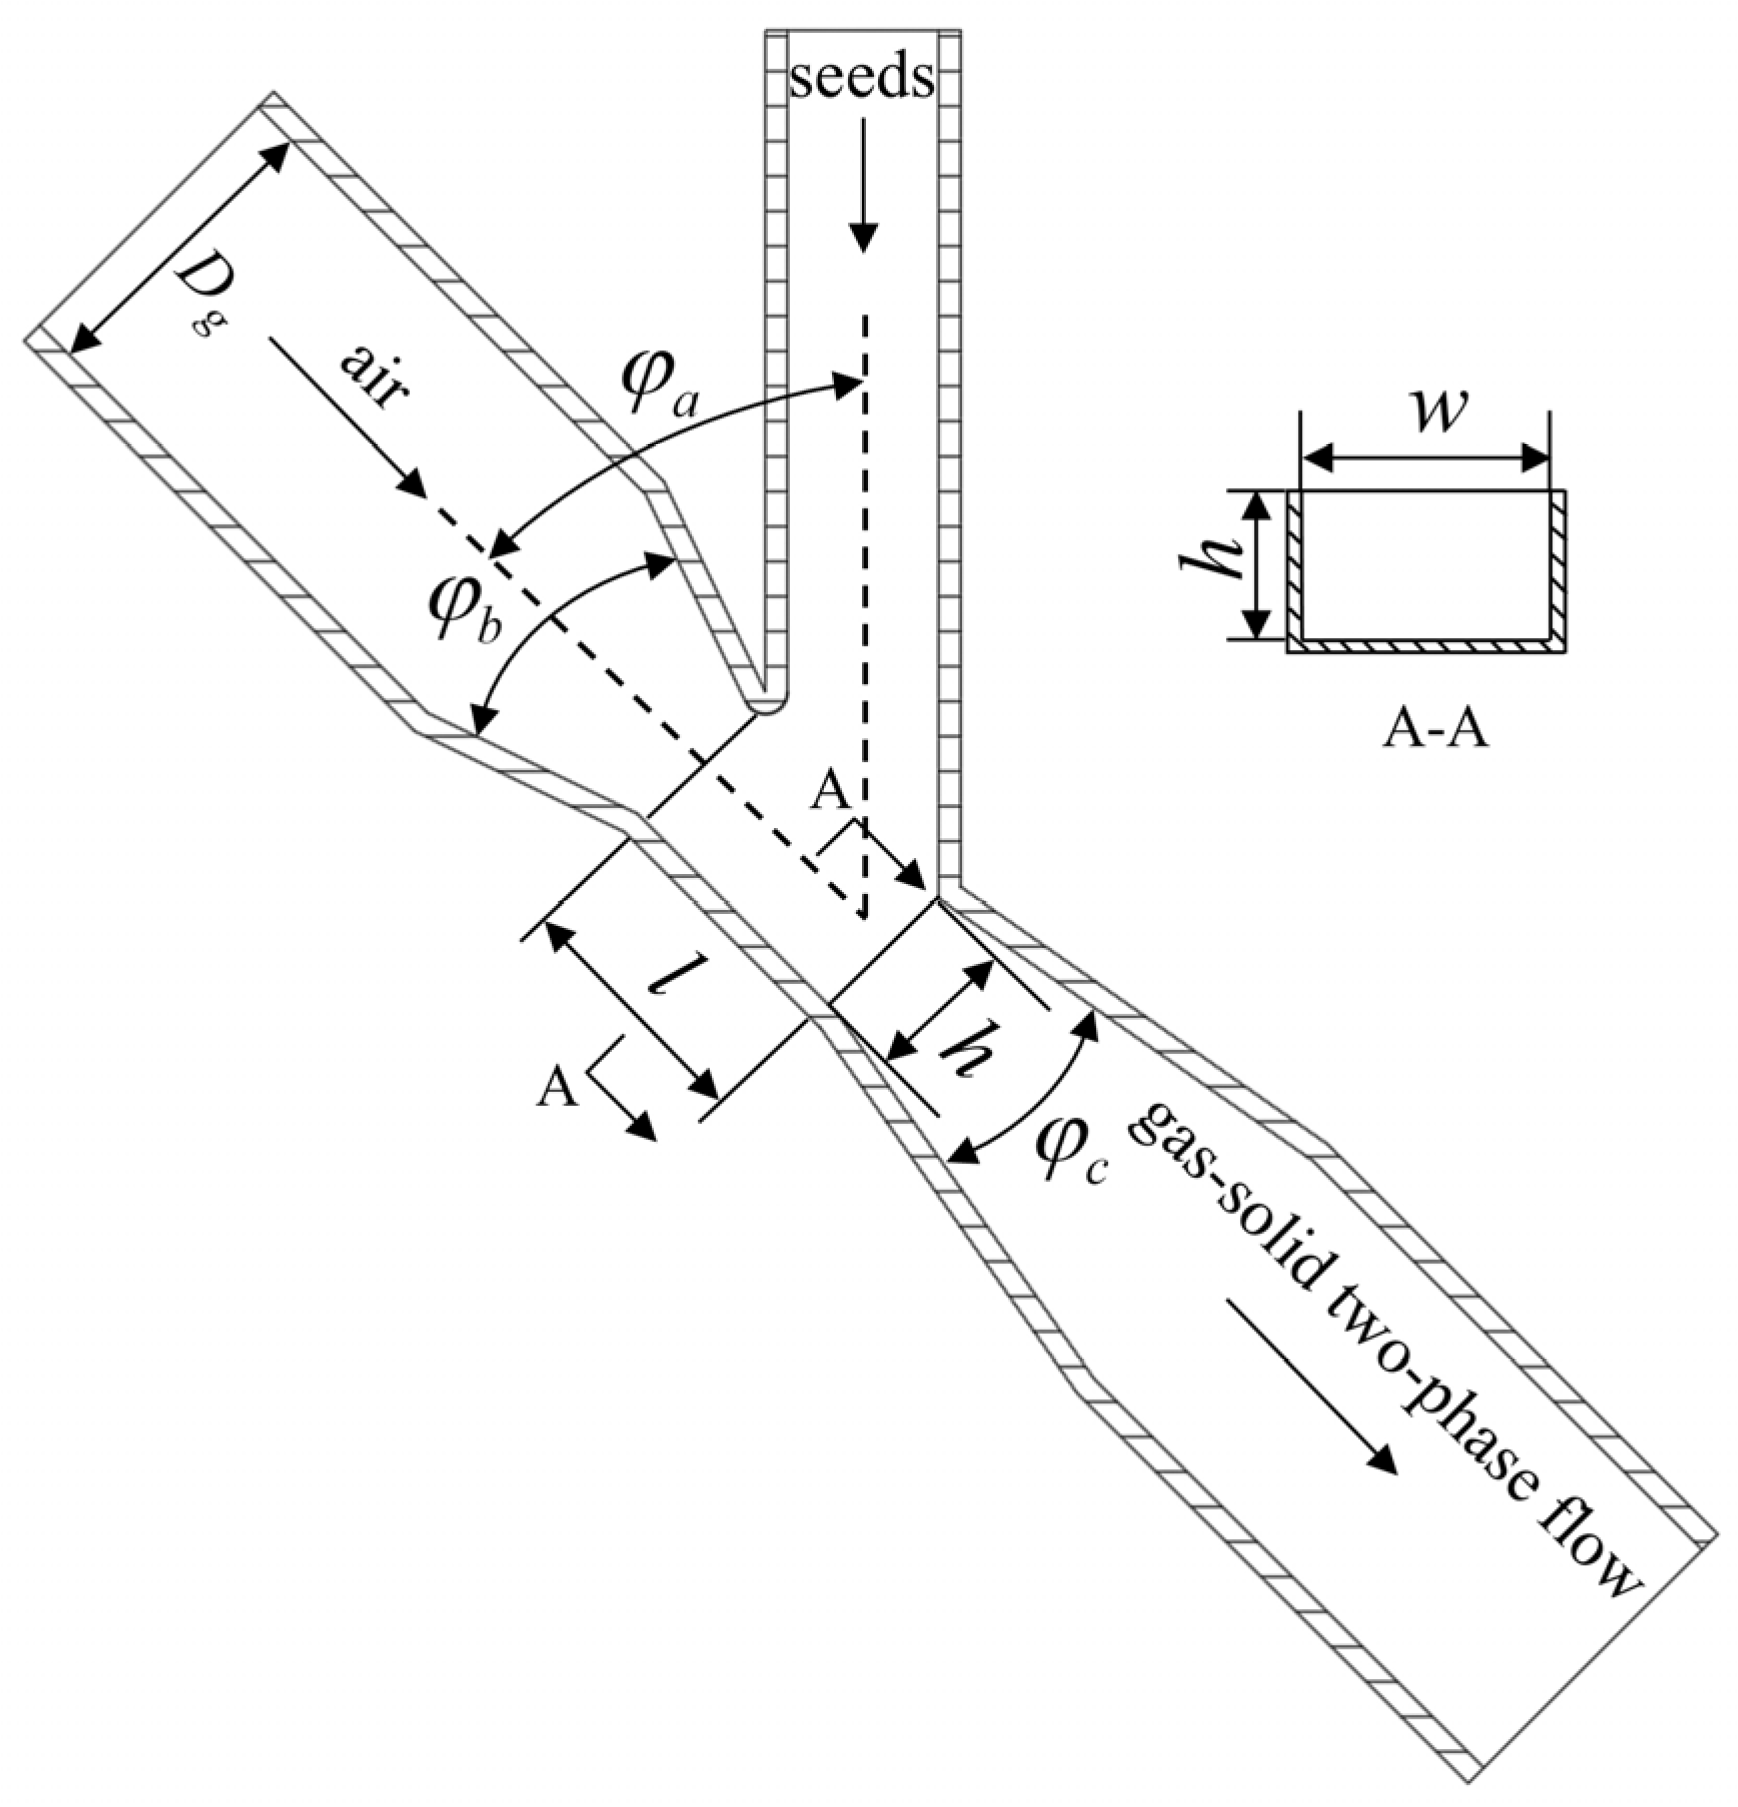
The seed feeding device applying Venturi theory serves as the core component of the pneumatic seed delivery system [33], playing a crucial role in determining seed movement characteristics within the delivery tube and post-sowing seed distribution. As shown in Figure 2, the seed feeding device consists of the air inlet tube, seed inlet tube, a Venturi nozzle (confusor, throat, and diffuser), and a gas–solid two-phase outlet tube. A rectangular seed feeding opening is arranged on the side wall of the Venturi nozzle for seed entry. The diameters of the air inlet tube and the gas–solid two-phase outlet tube are both D. The angle of the gas–solid two-phase flow inlet is φa. The cone angle of the contraction section is φb, and that of the expansion section is φc. The blending chamber is rectangular, with a width of w, a height of h, and a length of l.
Figure 2.
Two-dimensional schematic diagram of the seed feeding device.
The seed feeding device operates as follows: airflow enters the inlet tube with a diameter D, then passes through the blending chamber while seeds are fed into the chamber via the seed inlet tube. A pressure differential develops between the inlet tube and the blending chamber, causing the airflow pressure to decrease and its velocity to increase. Seeds encounter the airflow and are carried away by the high-velocity gas stream within the blending chamber. The two-phase flow outlet tube consists of a conical section and a cylindrical section, with the cross-sectional area gradually increasing from the blending chamber to the outlet tube. Affected parameters include the inlet diameter D, gas–solid two-phase flow inlet angle φa, contraction section cone angle φb, expansion section cone angle φc, blending chamber width w, height h, length l, and inlet airflow velocity v.
2.2. Basic Parameters of the Seed Feeding Device
Since the blending chamber tube is rectangular, its cross-sectional area is determined by the width w and height h of the blending chamber. Therefore, the width and height of the blending chamber will influence the velocity and pressure of the airflow [10]. The rice seeds used for pelleting in this study measured no more than 8 mm in length. Since the cross-sectional area of the blending chamber is smaller than that of the inlet tube, the blending chamber width w was selected as 16 mm, with a height h ranging from 12 mm to 18 mm. The length of the blending chamber determines the volume of the negative pressure zone and the seed acceleration capability. If the blending chamber is sufficiently long, the airflow and seed velocity will gradually accelerate to their respective maximum values. However, as the blending chamber length increases, pressure loss in the seed feeding device gradually rises due to pipeline friction. Therefore, while ensuring operational performance, the blending chamber length should be appropriately reduced. The blending chamber length l is set to 25 mm.
The geometric configuration of the seed feeding device is defined by three critical angles that collectively govern the gas–solid two-phase flow dynamics. The inlet angle φa, formed between the air inlet tube and the seed inlet tube, is set at 45° based on the vector decomposition of aerodynamic forces: this specific inclination generates a substantial vertically downward component force that ensures rapid soil penetration upon seed discharge while maintaining sufficient horizontal momentum to prevent seed accumulation and blockage in the pipeline. The contraction section cone angle φb is fixed at 40°, representing an engineering compromise between flow acceleration and energy loss; although a smaller angle would theoretically enhance the Venturi effect and local negative pressure generation, the selected 40° threshold minimizes boundary layer separation and turbulent dissipation at the blending chamber entrance, ensuring efficient kinetic energy transfer from the air stream to the seeds. Finally, the expansion section cone angle φc is constrained within 15° to 30° [10], as this range facilitates a gradual pressure recovery gradient downstream of the blending chamber; angles below 15° would result in excessive axial length and frictional losses, whereas angles exceeding 30° would induce flow recirculation and unstable pressure transitions, compromising the uniform acceleration required for consistent seed spacing.
2.2.1. Airflow Conveyance Velocity
According to the theory of pneumatic conveying of particles [34], the airflow conveyance velocity (defined here as the minimum speed required to maintain stable suspension transport of particles and serving as the design basis for the inlet airflow velocity) can be expressed as
In the equation, v1 represents the airflow conveyance velocity in m/s; kL denotes the particle size coefficient; indicates the true density (specific gravity) of pelleted rice seeds (kg·m−3); kd signifies the particle characteristic coefficient; and L represents the conveying tube length in meters. When particle sizes range from 1 mm to 10 mm, kL is set between 16 and 20 [30]. These parameters were determined through calibration of the seed feeding device [35]. Given that the triaxial dimensions of PRS are 8 × 5 × 5 mm (measured using a digital caliper with 0.01 mm precision based on a random sample of 100 pellets and averaged), kL is set to 16. The density of PRS is 1280 kg/m3 (determined by the liquid displacement method). The particle characteristic coefficient kd was set to 2 × 10⁻⁵–5 × 10⁻⁵. Since seed delivery tube lengths typically do not exceed 2 m, the influence of the particle characteristic coefficient on airflow velocity was neglected in this study. To ensure adequate airflow velocity within the delivery tube while maintaining a 10% margin, the airflow conveyance velocity for PRS was determined to be 19.91 m/s.
2.2.2. Particle-to-Gas Mass Ratio
The particle-to-gas mass ratio ψ is commonly used to quantify the relative amount of the particulate phase within the gas phase. It is defined as the ratio of the particulate mass flow rate to the gas mass flow rate.
where GP and Gg represent the mass flow rates of particles and gas, respectively, based on practical agronomic requirements, the GP range for PRS is 3.22–10.05 g/s. When the gas–solid two-phase flow is in dilute phase, the particle-to-gas mass ratio ψ ranges from 0.1 to 1.0 [36], with a value of 0.7 adopted in this study.
2.2.3. Inlet Tube Diameter
Gas mass flow affects particles within the tube, airflow velocity, and pressure. The mass flow rate of air through the circular inlet tube [10] can be expressed as
where ρg is the air density, taken as 1.205 kg/m3. Combining Equations (2) and (3), we obtain
Calculations indicate a diameter D of 27.6 mm. Considering commercially available tubes, the inlet and outlet tube diameters are set to 30 mm.
3. Materials and Methods
3.1. Mathematical Models of Gas-Solid Two-Phase Flow
CFD-DEM coupled models are categorized into two types: Eulerian–Eulerian and Eulerian–Lagrangian. In the Eulerian model [37,38], the particle phase and gas phase are treated as mutually permeable continuous phases. Particle shapes are restricted to spherical particles, and simulating particle rotation is challenging. In Lagrangian models, gas and particle phases are treated as constant and discrete phases, respectively, offering computational advantages for aspects like particle size, shape, and concentration. The application distinction between the two models lies in Lagrangian models being suitable for scenarios where the solid phase volume fraction constitutes less than 10% of the total volume fraction. Since the calculations in this paper involve dilute-phase transport, the Lagrangian coupling model is selected for computation.
Particle Motion Equation
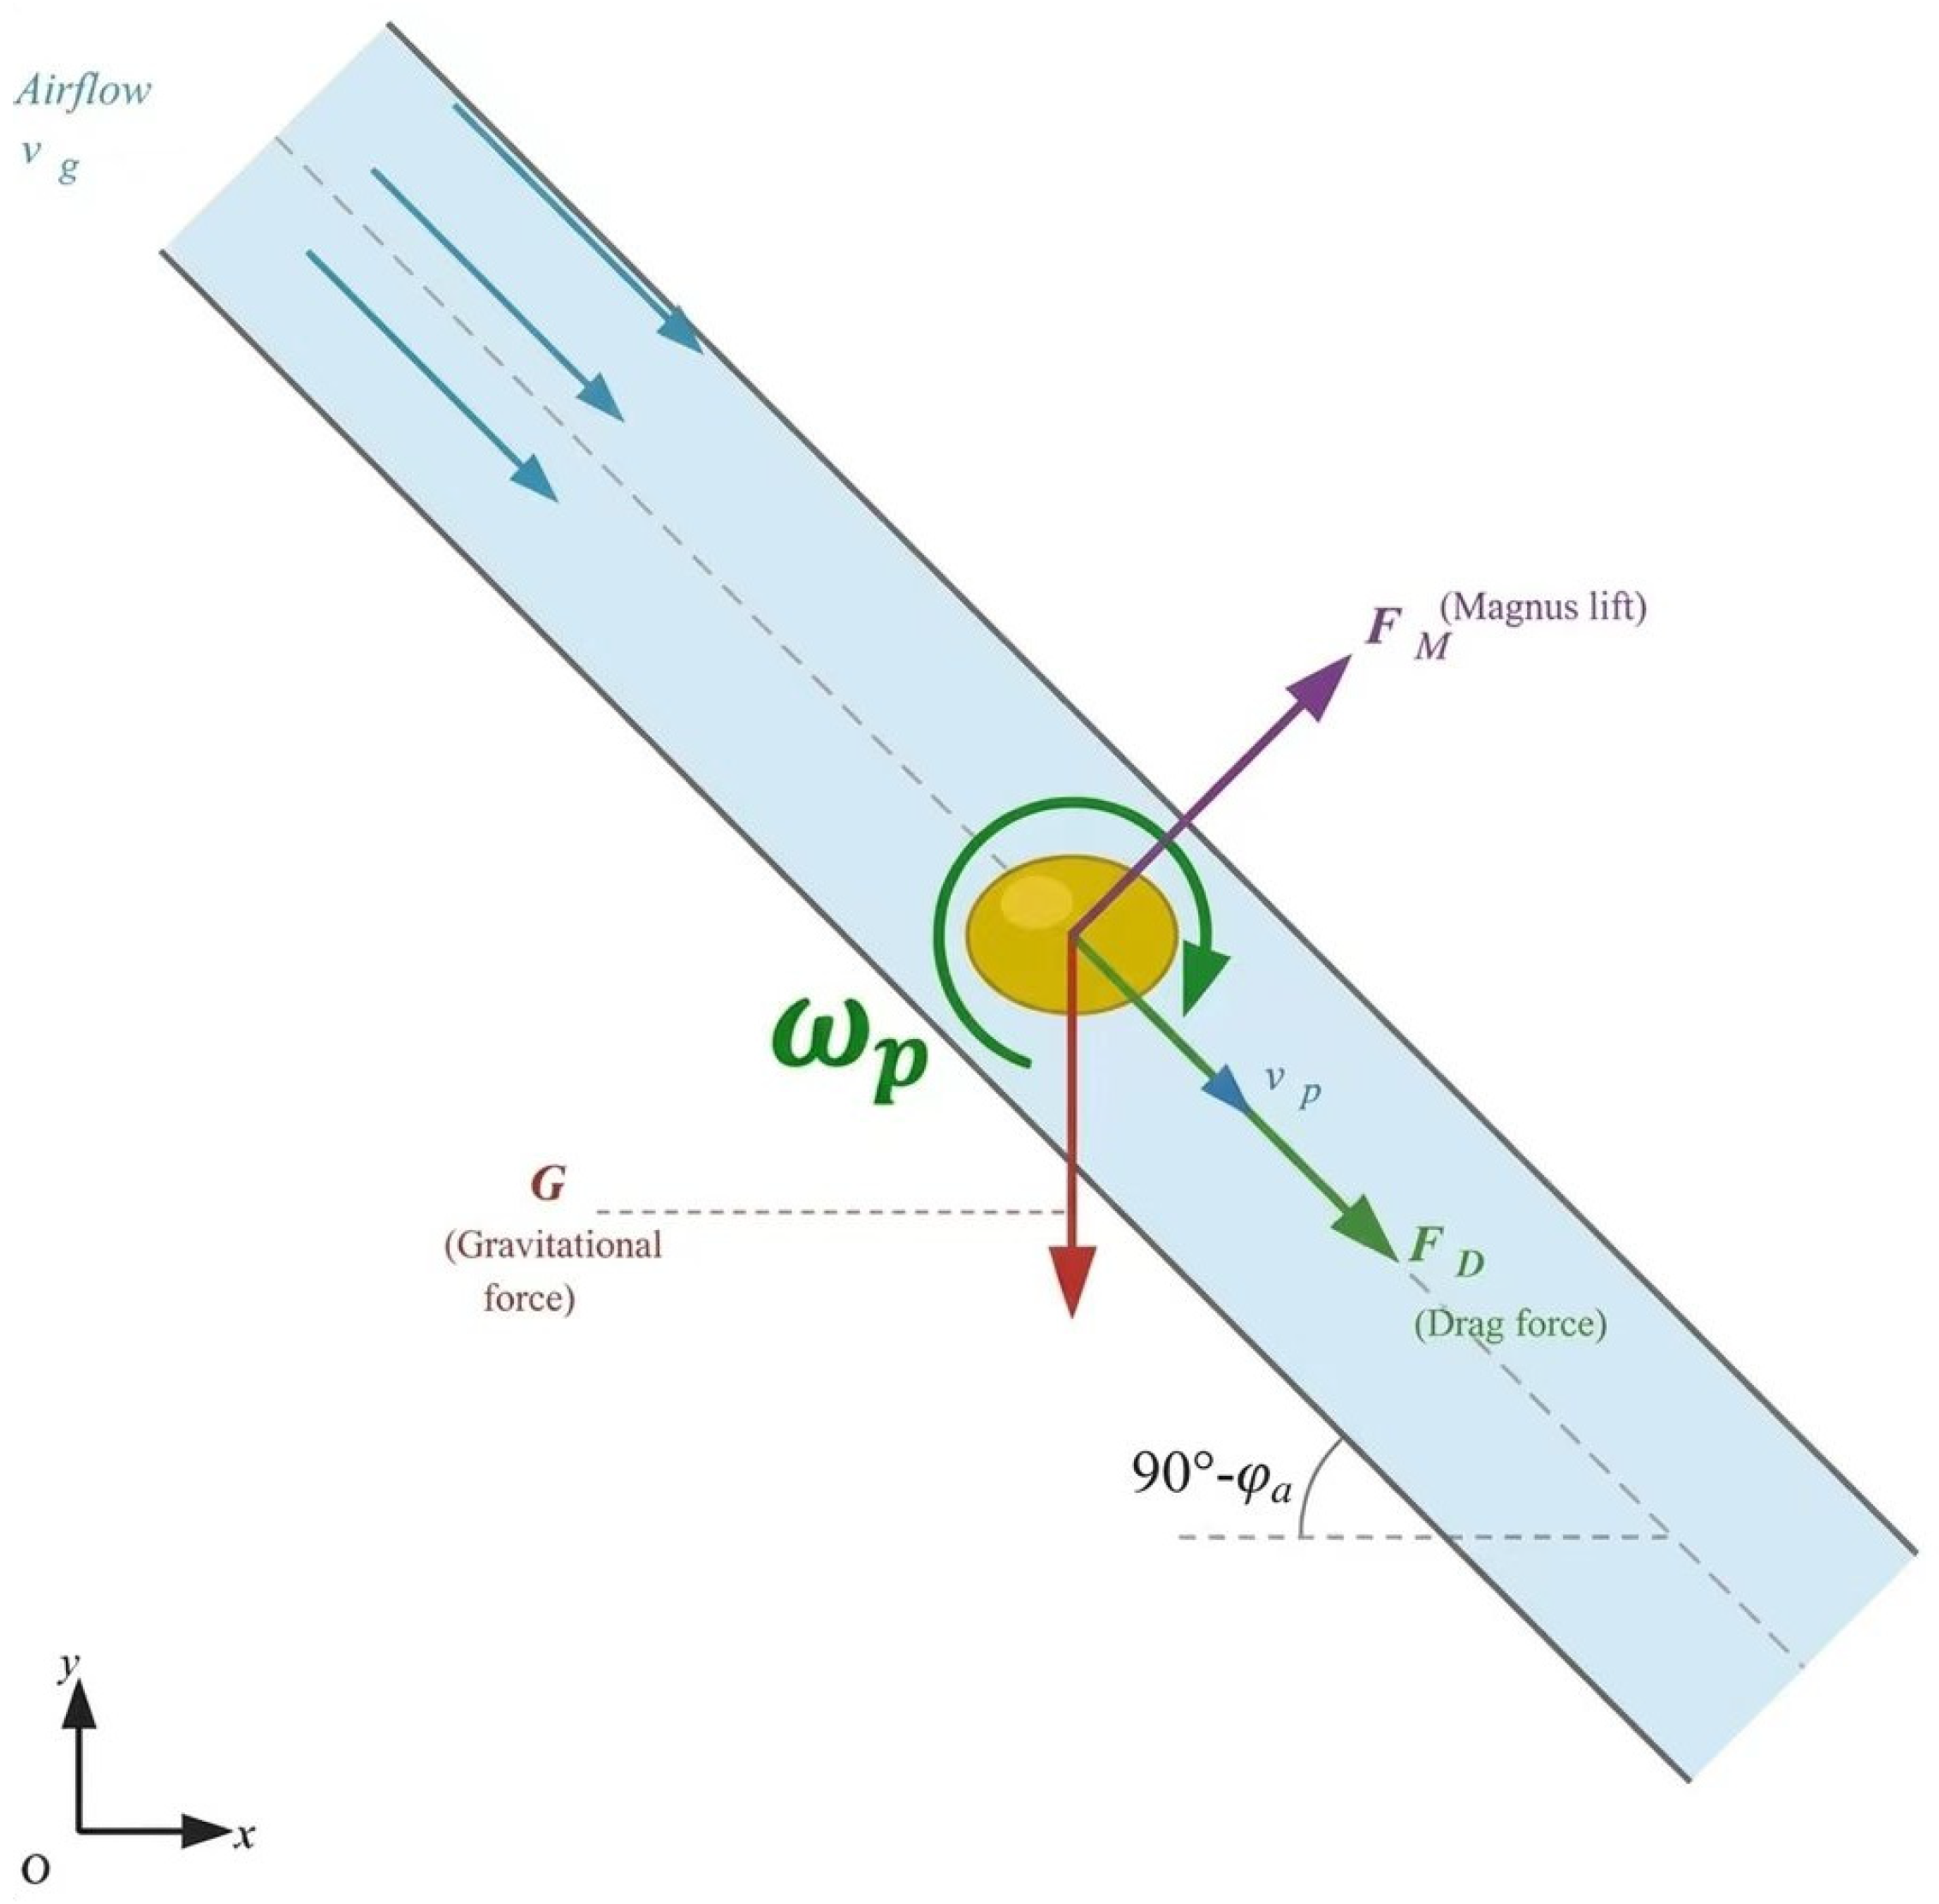
Based on Newton’s second law, the forces acting on seed particles within the seed feeding device and seed discharge tube are analyzed (Figure 3). Buoyancy, Saffman lift, and Basset force are neglected due to their negligible magnitude compared to gravity, drag force, and Magnus lift. The particle motion equation is expressed as
The bold symbol represents a vector, where mp is the mass of the seed particle, vp is the velocity vector of the seed particle, G is the gravitational force acting on the seed, FD is the drag force experienced by the seed in the flow field, FM is the Magnus lift generated by the seed’s own rotation, Tp is the total torque acting on the seed, Ip is the moment of inertia of the seed, ωp is the angular velocity, and t is time.
Figure 3.
Schematic diagram of forces acting on seed particles in the pneumatic tube.
The drag force model calculation formula is as follows:
where CD is the drag coefficient, dp is the particle equivalent diameter, ρp is the particle density, and Rep is the particle Reynolds number.
3.2. Simulation Model Construction
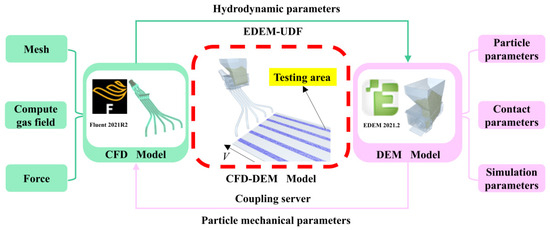
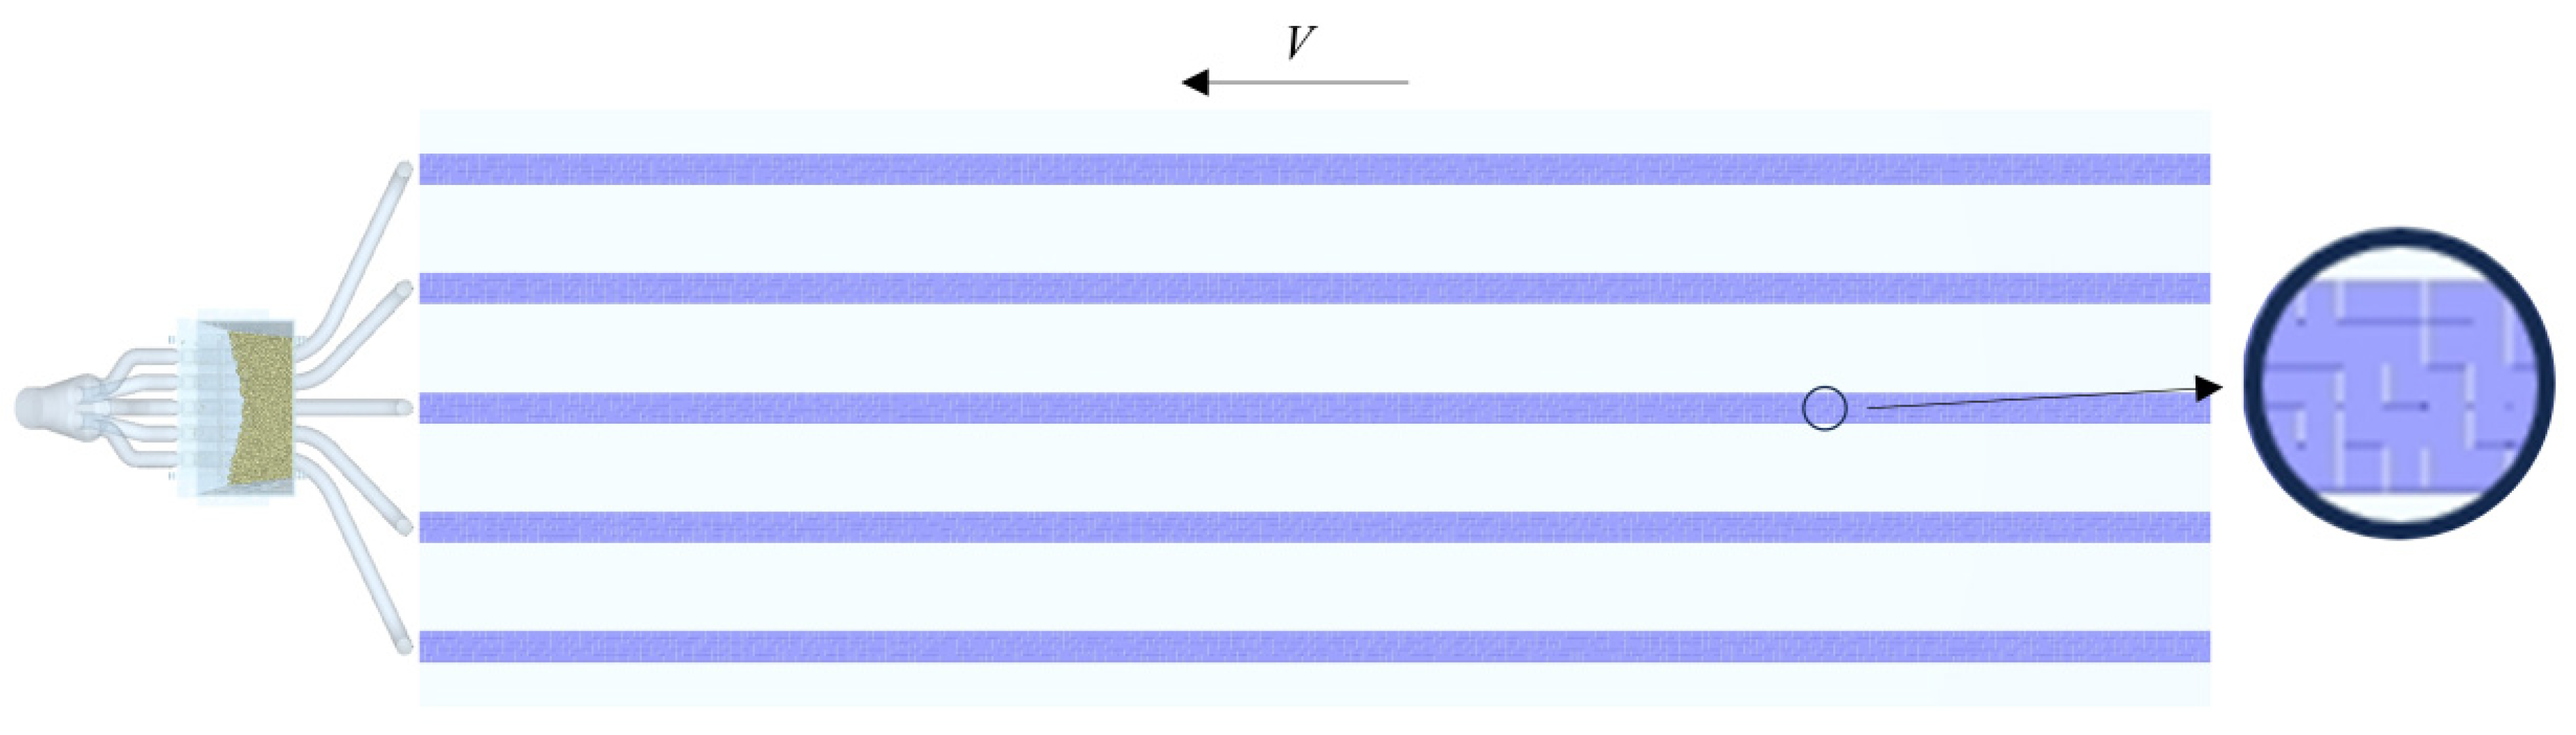
As shown in Figure 4, based on the established three-dimensional gas–solid coupled model of the seeder, a computational fluid domain model was constructed. As shown in Figure 4, the fluid domain was extracted from the three-dimensional model of the pneumatic seed feeding system using SpaceClaim (version 2021 R2), with boundary conditions defined as one velocity inlet, ten pressure outlets, and one wall surface. The fluid domain mesh was generated using the Fluent Meshing module (ANSYS Fluent 2021 R2). Surface mesh generation was performed first, with global size settings of minimum 0.5 mm, maximum 5 mm, growth rate 1.1, and normal angle 10°. Local refinement with a fixed element size of 0.5 mm was applied at the inlet, outlets, and the gas–solid two-phase flow mixing zone. The maximum skewness of the generated surface mesh was 0.49, indicating acceptable mesh quality. The volume mesh was subsequently generated using a hexahedral core type without boundary layer mesh, resulting in a total of 3.7 × 10⁵ elements with a minimum mesh quality of 0.62, satisfying the computational requirements of Fluent. The airflow inlet was set as a velocity inlet boundary condition, and the seed inlet and outlets were set as pressure outlet boundary conditions. The k-ε turbulence model was adopted for the solution. The flow field mesh was exported as a surface mesh file and imported into EDEM as the wall surface model for the pneumatic pathway. The seed inlet and outlet were set as pressure outlets, the pressure solver was selected, and the k-ε turbulence model was employed for the solution. We then exported the flow field mesh model as a surface mesh file in Fluent and imported it into DEM as the wall surface model for the air path section. The coupled simulation model in DEM also includes a seed feeder pre-filled with 12,000 PRS within the seed box. The research team independently developed the seed feeder used in this study. When the seed wheel dispenses seeds, each mold cavity contains 2–5 seeds. To facilitate subsequent statistical analysis of seed distribution, a seed detection zone was installed beneath the seed tube. The combined airflow field generated by the downward washflow from the UAV’s rotors during flight, the upward washflow from the ground, and the oncoming airflow from the UAV’s forward motion can influence the trajectory of seed descent. Therefore, the seed-dispensing tube in this study must ensure relative stability in the trajectory of seeds during their descent. Huang et al. [24] found that during UAV flight, the mixed flow shifts rearward along the direction of flight velocity. At a flight altitude of 1.5 m, the mixed flow directly below the UAV’s center exhibits a shift at approximately y = −1 m. The vertical distance between the gas–solid two-phase flow outlet of the seed feeding device and the rotor is 0.7 m. To avoid the influence zone of the mixed flow, the vertical distance between the bottom outlet of the seed discharge tube and the gas–solid two-phase flow outlet of the feeding device is set to 0.75 m. The perpendicular distance from the seed discharge tube outlet to the detection area is 5 cm, with a seeding row spacing of 20 cm. The material properties of the simulation model are shown in Table 1 [35,39,40].
Figure 4.
CFD-DEM Coupled Simulation Model.
Table 1.
Material properties of simulation model.
In the simulation model, the air inlet, seed inlet, gas–solid two-phase flow outlet, and seed discharge detection area are all configured as virtual components. The relationship between the implement’s forward speed V and the seed discharge wheel’s rotational speed n is as follows:
In the formula: Number of seed holes j = 8, and the hole spacing Q is typically 10–20 cm, set to 15 cm. In DEM, the seed dispenser wheel rotates around a fixed axis at a speed n of 60 rpm. The seed detection zone moves linearly relative to the seed dispenser at a speed V of 1.2 m/s to simulate the forward movement of the implement.
In DEM, the simulation step size is set to 2 × 10⁻⁶ s, with a total simulation duration of 2.5 s. Due to the high velocity of seeds after acceleration within the seed dispensing tube, a smaller saving interval is required to facilitate seed counting as they pass through the detection zone. The saving interval is set to 1 × 10⁻³ s. In Fluent, since the particles occupy a small volume fraction, the flow is classified as a dilute gas–solid two-phase flow. The Eulerian–Lagrangian coupling method is employed, with a simulation step size set to 1 × 10⁻⁴ s and a total simulation step count of 2.5 × 10⁴ steps.
3.3. Experimental Design and Evaluation Metrics
3.3.1. Experimental Design
To investigate the effects of airflow velocity and seed feeding device structural parameters on the operational performance of the pneumatic seed dispenser, a Box–Behnken orthogonal combination optimization experiment was conducted. The experimental factors selected were the blending chamber height h, expansion section cone angle φc, and inlet airflow velocity v. The experimental factors and their codes are listed in Table 2. A total of 17 simulation runs were conducted, with each run comprising 5 rows of data, each row contained 16 seed holes.
Table 2.
Orthogonal test factor coding.
3.3.2. Evaluation Indicators
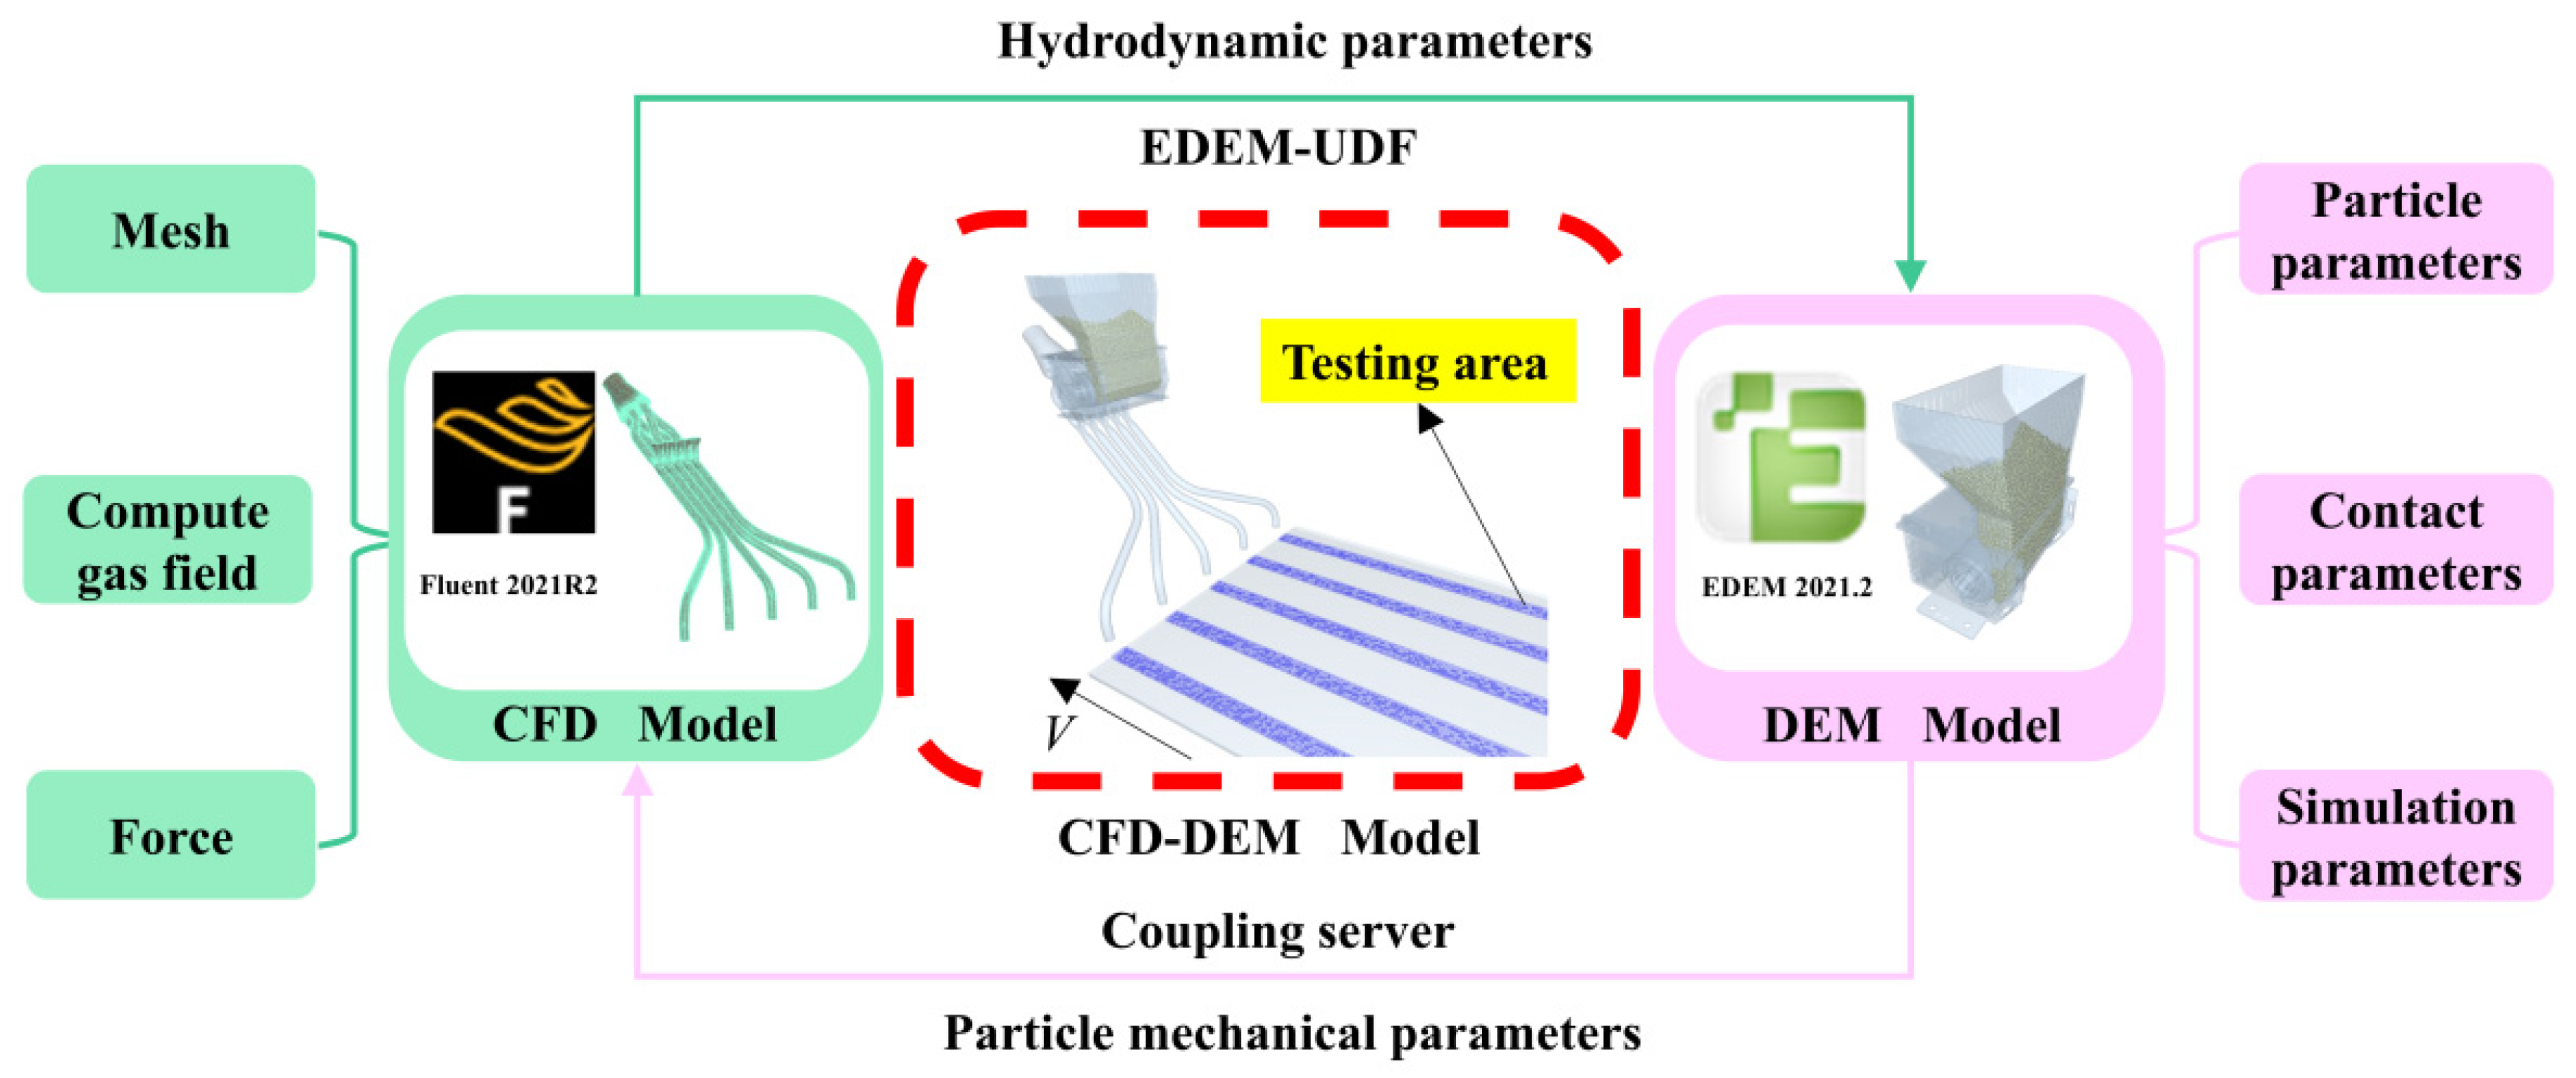
To evaluate the hole formation effect of the seed distributor, it is necessary to analyze the simulation results of seed distribution patterns and investigate the influence of the structural parameters of the seed feeding device and inlet airflow velocity on the HFR and HSCV. To visualize seed distribution patterns, post-processing of simulation results was performed in DEM. Each seed detection zone was subdivided into 1500 contiguous cubic regions with dimensions of 10 × 10 × 10 mm, as illustrated in Figure 5. The number of particles passing through each cubic region could then be statistically quantified.
Figure 5.
Seed placement detection zone division.
Two evaluation indicators were adopted: the hole Formation Rate and the hill spacing coefficient of variation (HSCV), which are widely used in precision rice seeding research [3,15]. HFR is defined as the proportion of hills in which at least one seed lands within a 5 cm radius circle centered at the target seeding point, reflecting whether seeds are accurately delivered to each designated hill position. HSCV quantifies the uniformity of inter-hill spacing. The 5 cm radius criterion is derived from agronomic requirements for rice hill seeding, within which seed germination can contribute to the target hill. The formulas are as follows:
In Equation (10), Ob denotes the number of hills in which at least one seed successfully landed within the 5 cm radius target circle in each simulation run, and O represents the total number of designated hill positions in each simulation run (O = 80, comprising 5 rows × 16 hills per row). In Equation (11), n denotes the total number of inter-hill distances measured in each simulation run, and represents the mean inter-hill spacing in Equation (11), n denotes the total number of hole distances in the sample of each simulation group, and Q represents the hole distance.
4. Results and Analysis
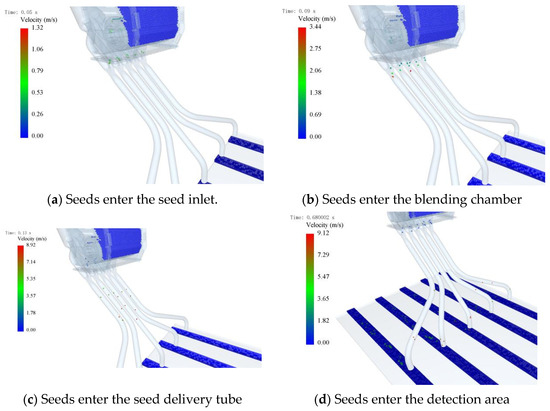
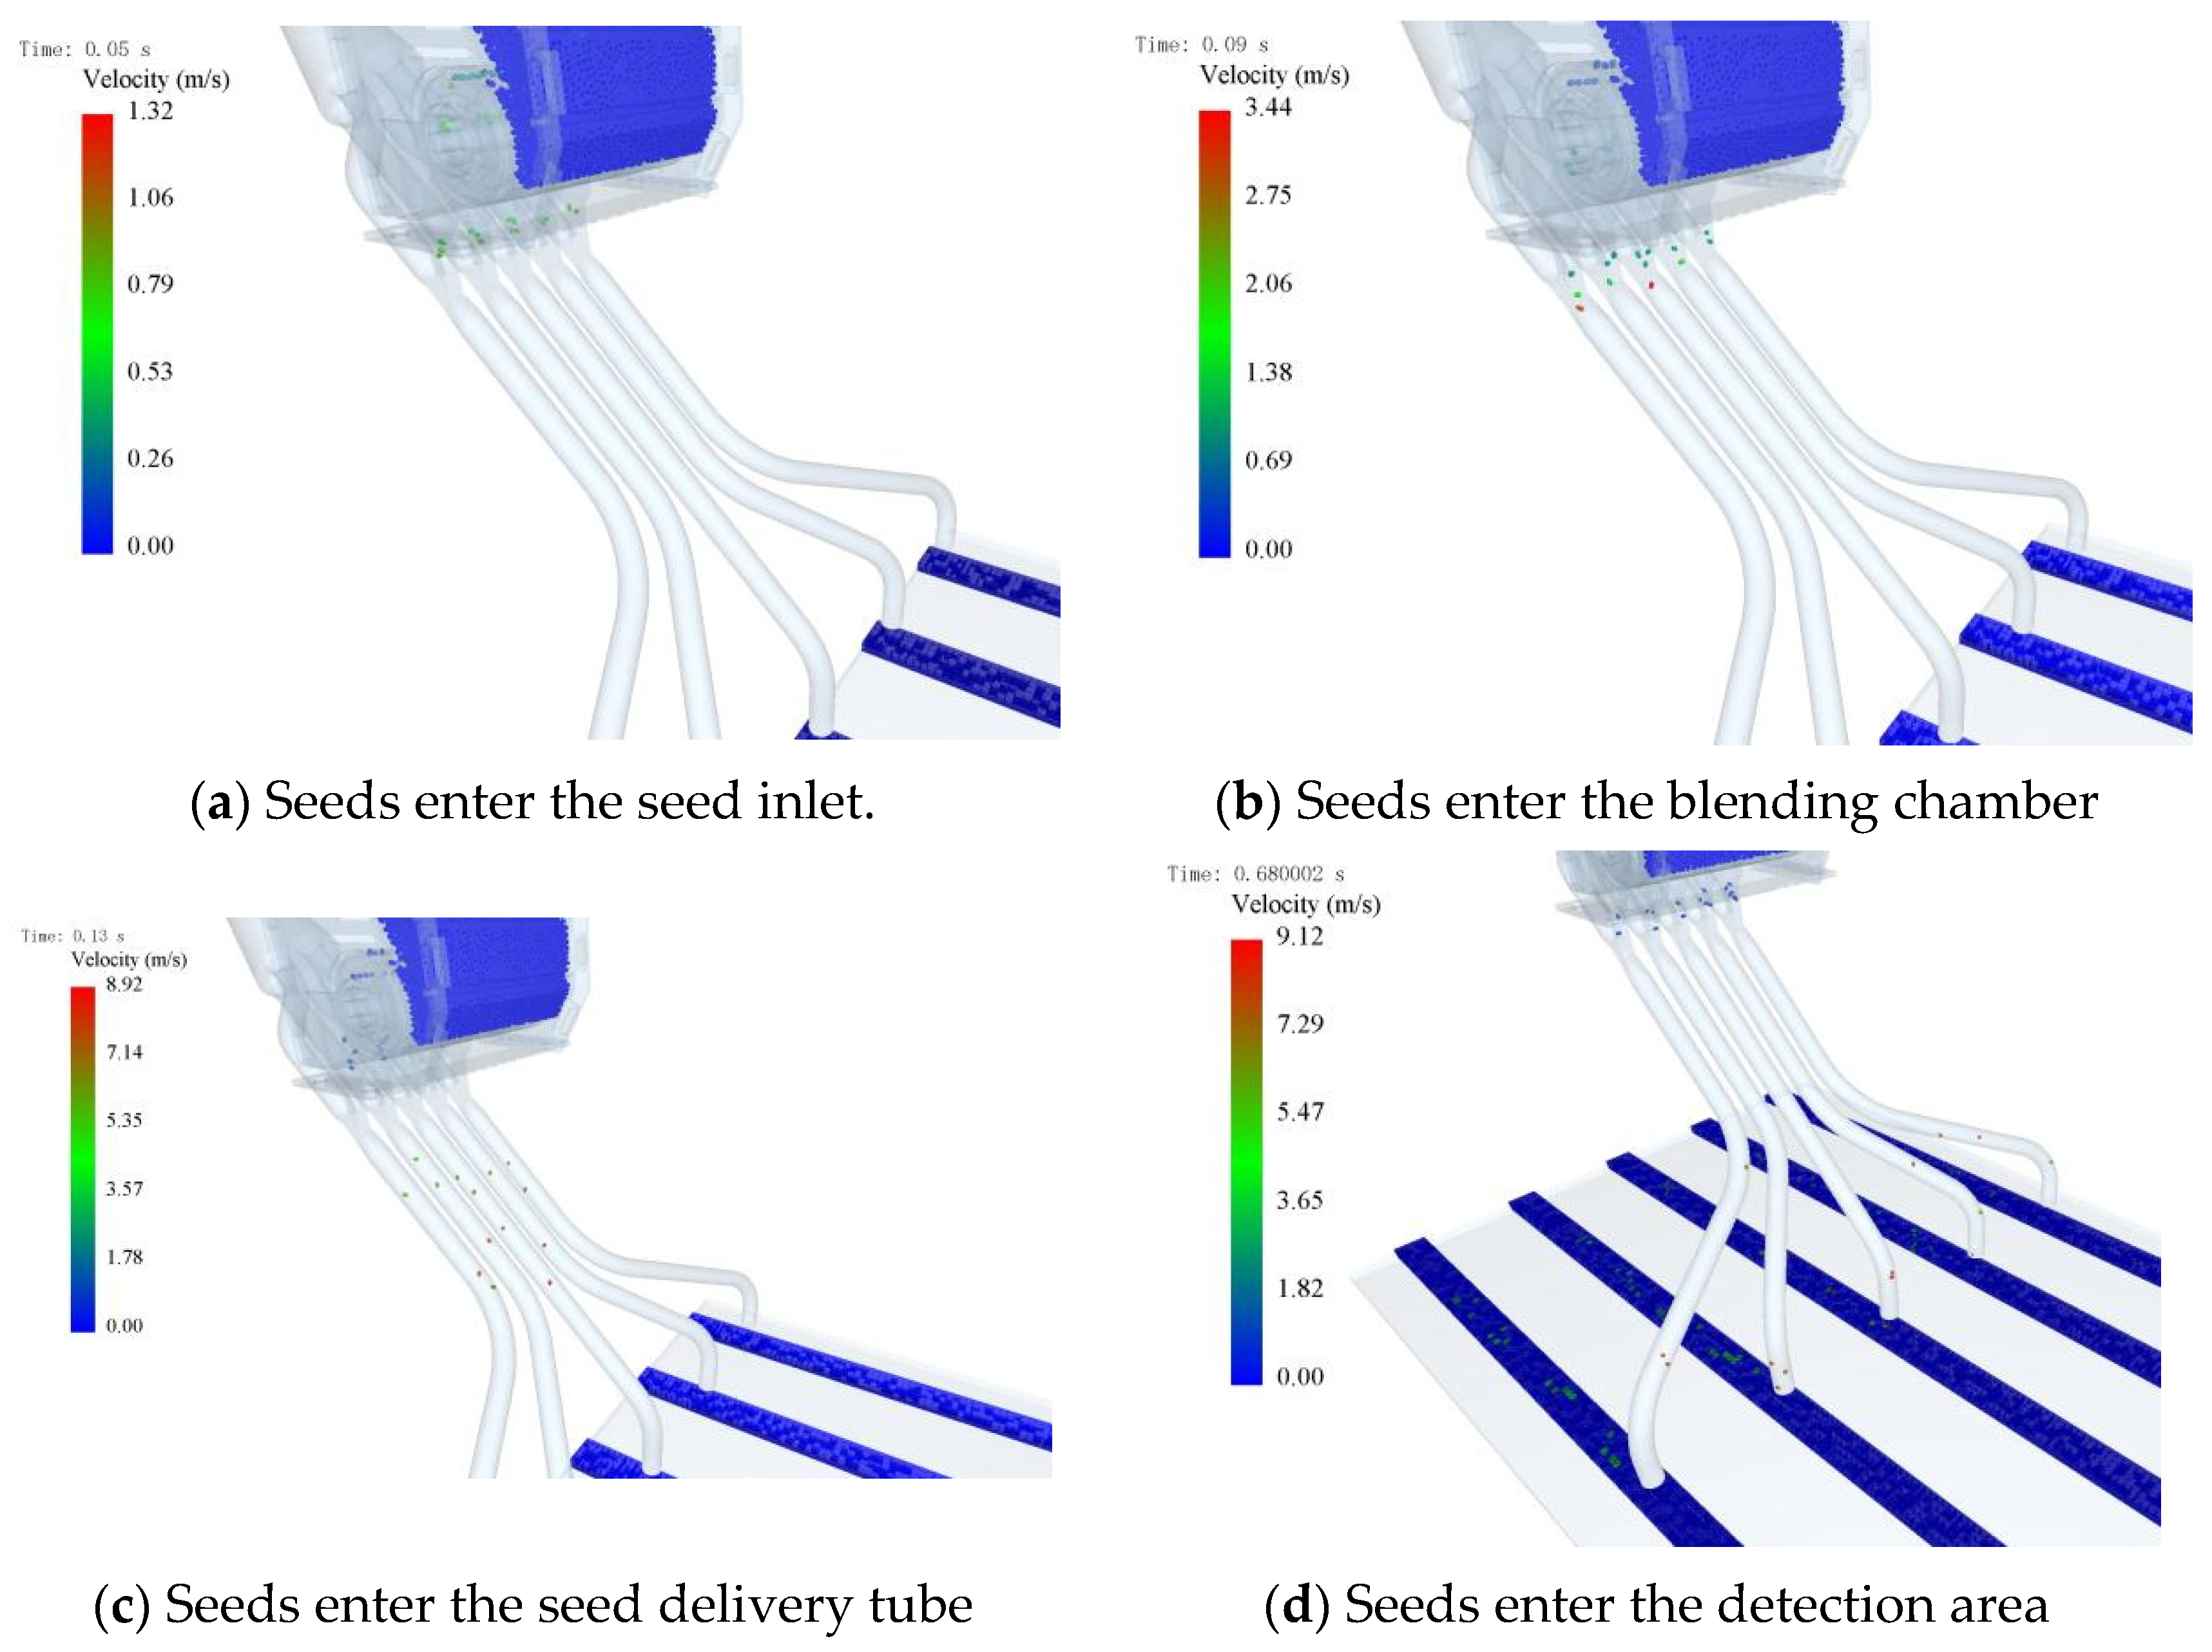
4.1. Analysis of Seed Movement States
The positional changes of seeds within each seed hole are illustrated in Figure 6. Above the seed outlet—the initial drop point—the distance between seeds is relatively small. As seeds descend into the blending chamber, the distance between them gradually increases. Once inside the blending chamber, airflow accelerates the seeds, further widening the spacing between them. This phenomenon causes each seed to depart the seed tube and enter the detection zone at different times. As the time interval between seed drops increases, the forward movement of the machine further widens the spacing between seeds.
Figure 6.
Seed Position Changes.
4.2. Analysis of Seed Dispensing into Holes Effect
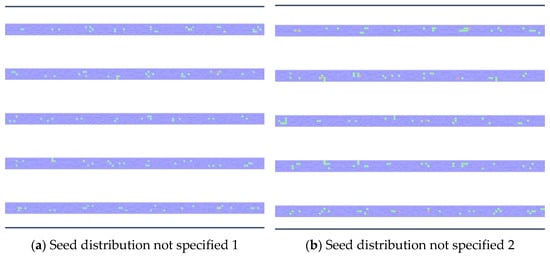
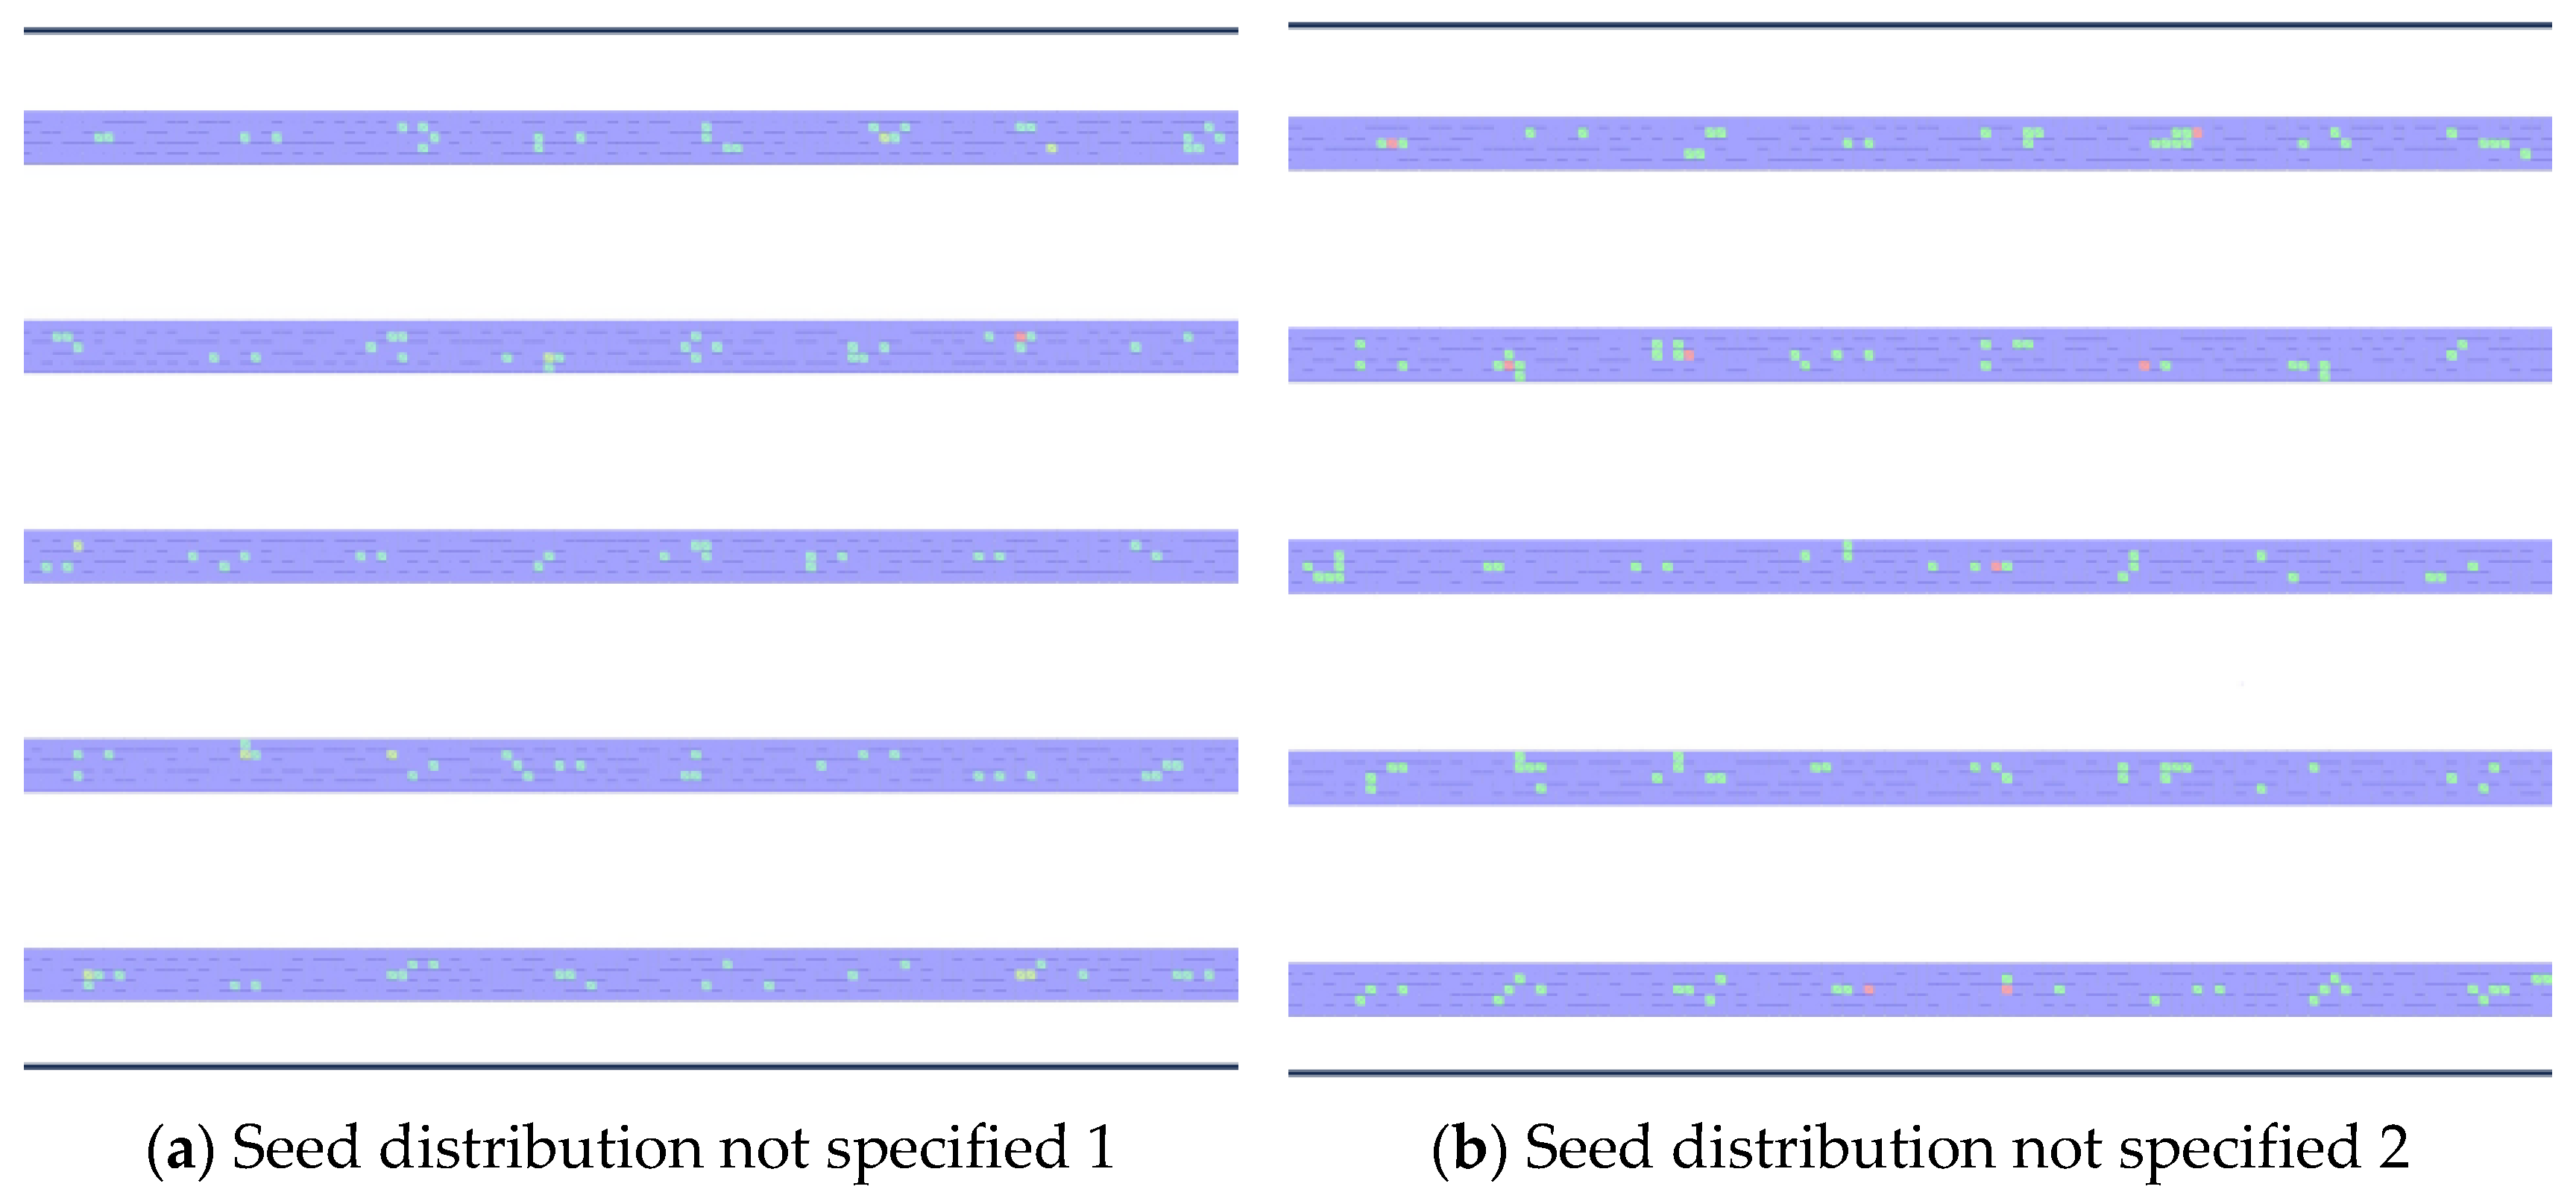
During the DEM post-processing phase, the frame-by-frame playback of simulation results yielded partial visualizations of the seed-planting operation and seed–hole distances, as shown in Figure 7 and Figure 8. Each grid cell displays the cumulative number of seeds that have passed through it, with color changes indicating seed density. This method clearly reveals the precise landing location of each individual seed.
Figure 7.
Partial view of seed drilling operation results.
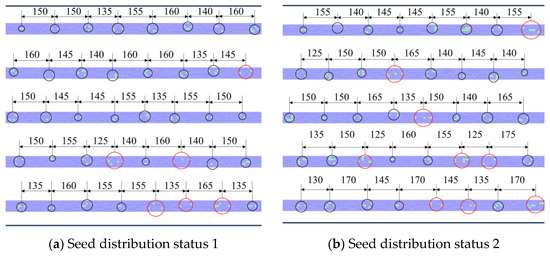
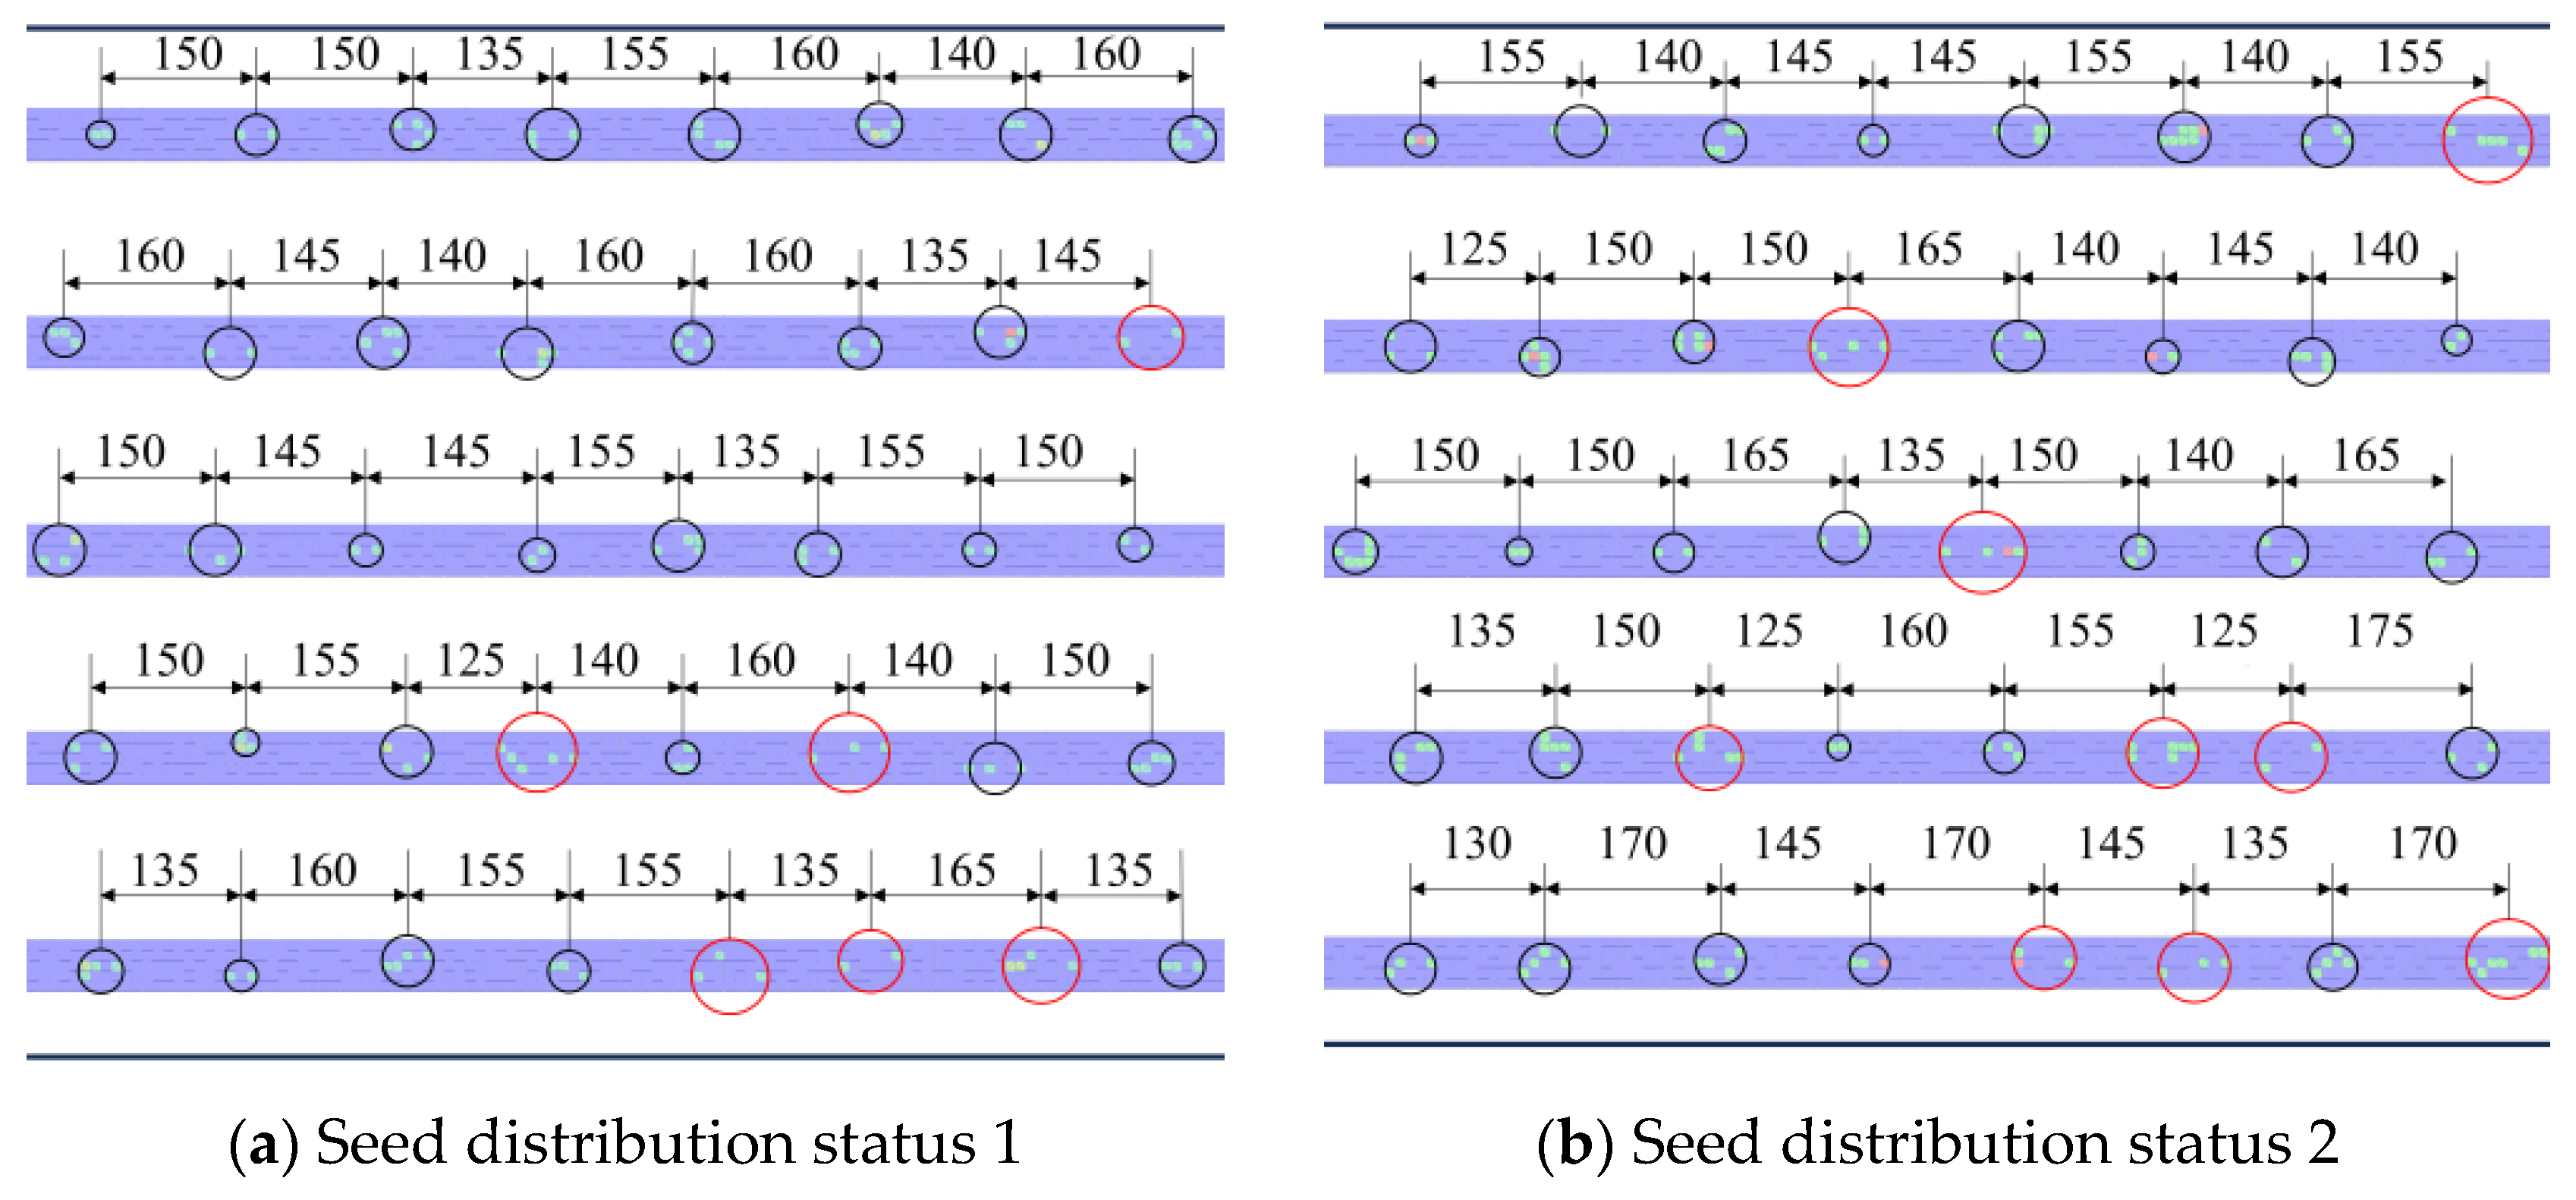
Figure 8.
Partial distribution of seed placement (Unit: mm).
Figure 8 illustrates the seed placement range per seed hole after the seeding system operation. Red indicates failed seed placement, black indicates successful placement, with hole spacing marked. As shown in Figure 8, the pelleted seeds generally achieve effective precision seeding. A small portion of seeds were placed at positions where holes failed to form, though they exhibited some dispersion. Overall, no instances of seed absence at intended positions or complete failure to dispense seeds were observed. Analysis of hole spacing variations reveals that under different pipelines, the patterns of hole spacing changes for seeds in each row exhibit certain differences. Within the same pipeline, although the hole spacing between adjacent seeds changes to some extent as seeds are discharged, the overall variation remains within 15 mm, meeting practical seeding requirements. Through the analysis of hole formation effectiveness and hole spacing changes, the feasibility of the pelletized rice hole seeding system designed in this study is validated. During sowing, seeds are accelerated by the high-speed airflow within the seed delivery tube, achieving exit velocities of no less than 6.5 m/s at the tube outlet. This high exit velocity enables seeds to rapidly penetrate the muddy soil surface of the paddy field upon landing, minimizing the risk of seeds remaining on the soil surface or being displaced by the rotor wash airflow. Once embedded in the mud, the seeds are effectively retained in position, as the viscous muddy soil resists the influence of the rotor downwash. This mechanism ensures reliable seed-to-soil contact and effective hole formation under actual field conditions.
4.3. Analysis of the Movement Velocity of Pelletized Seeds
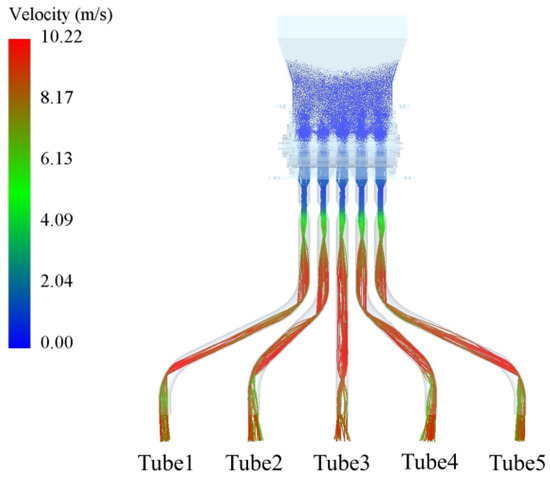
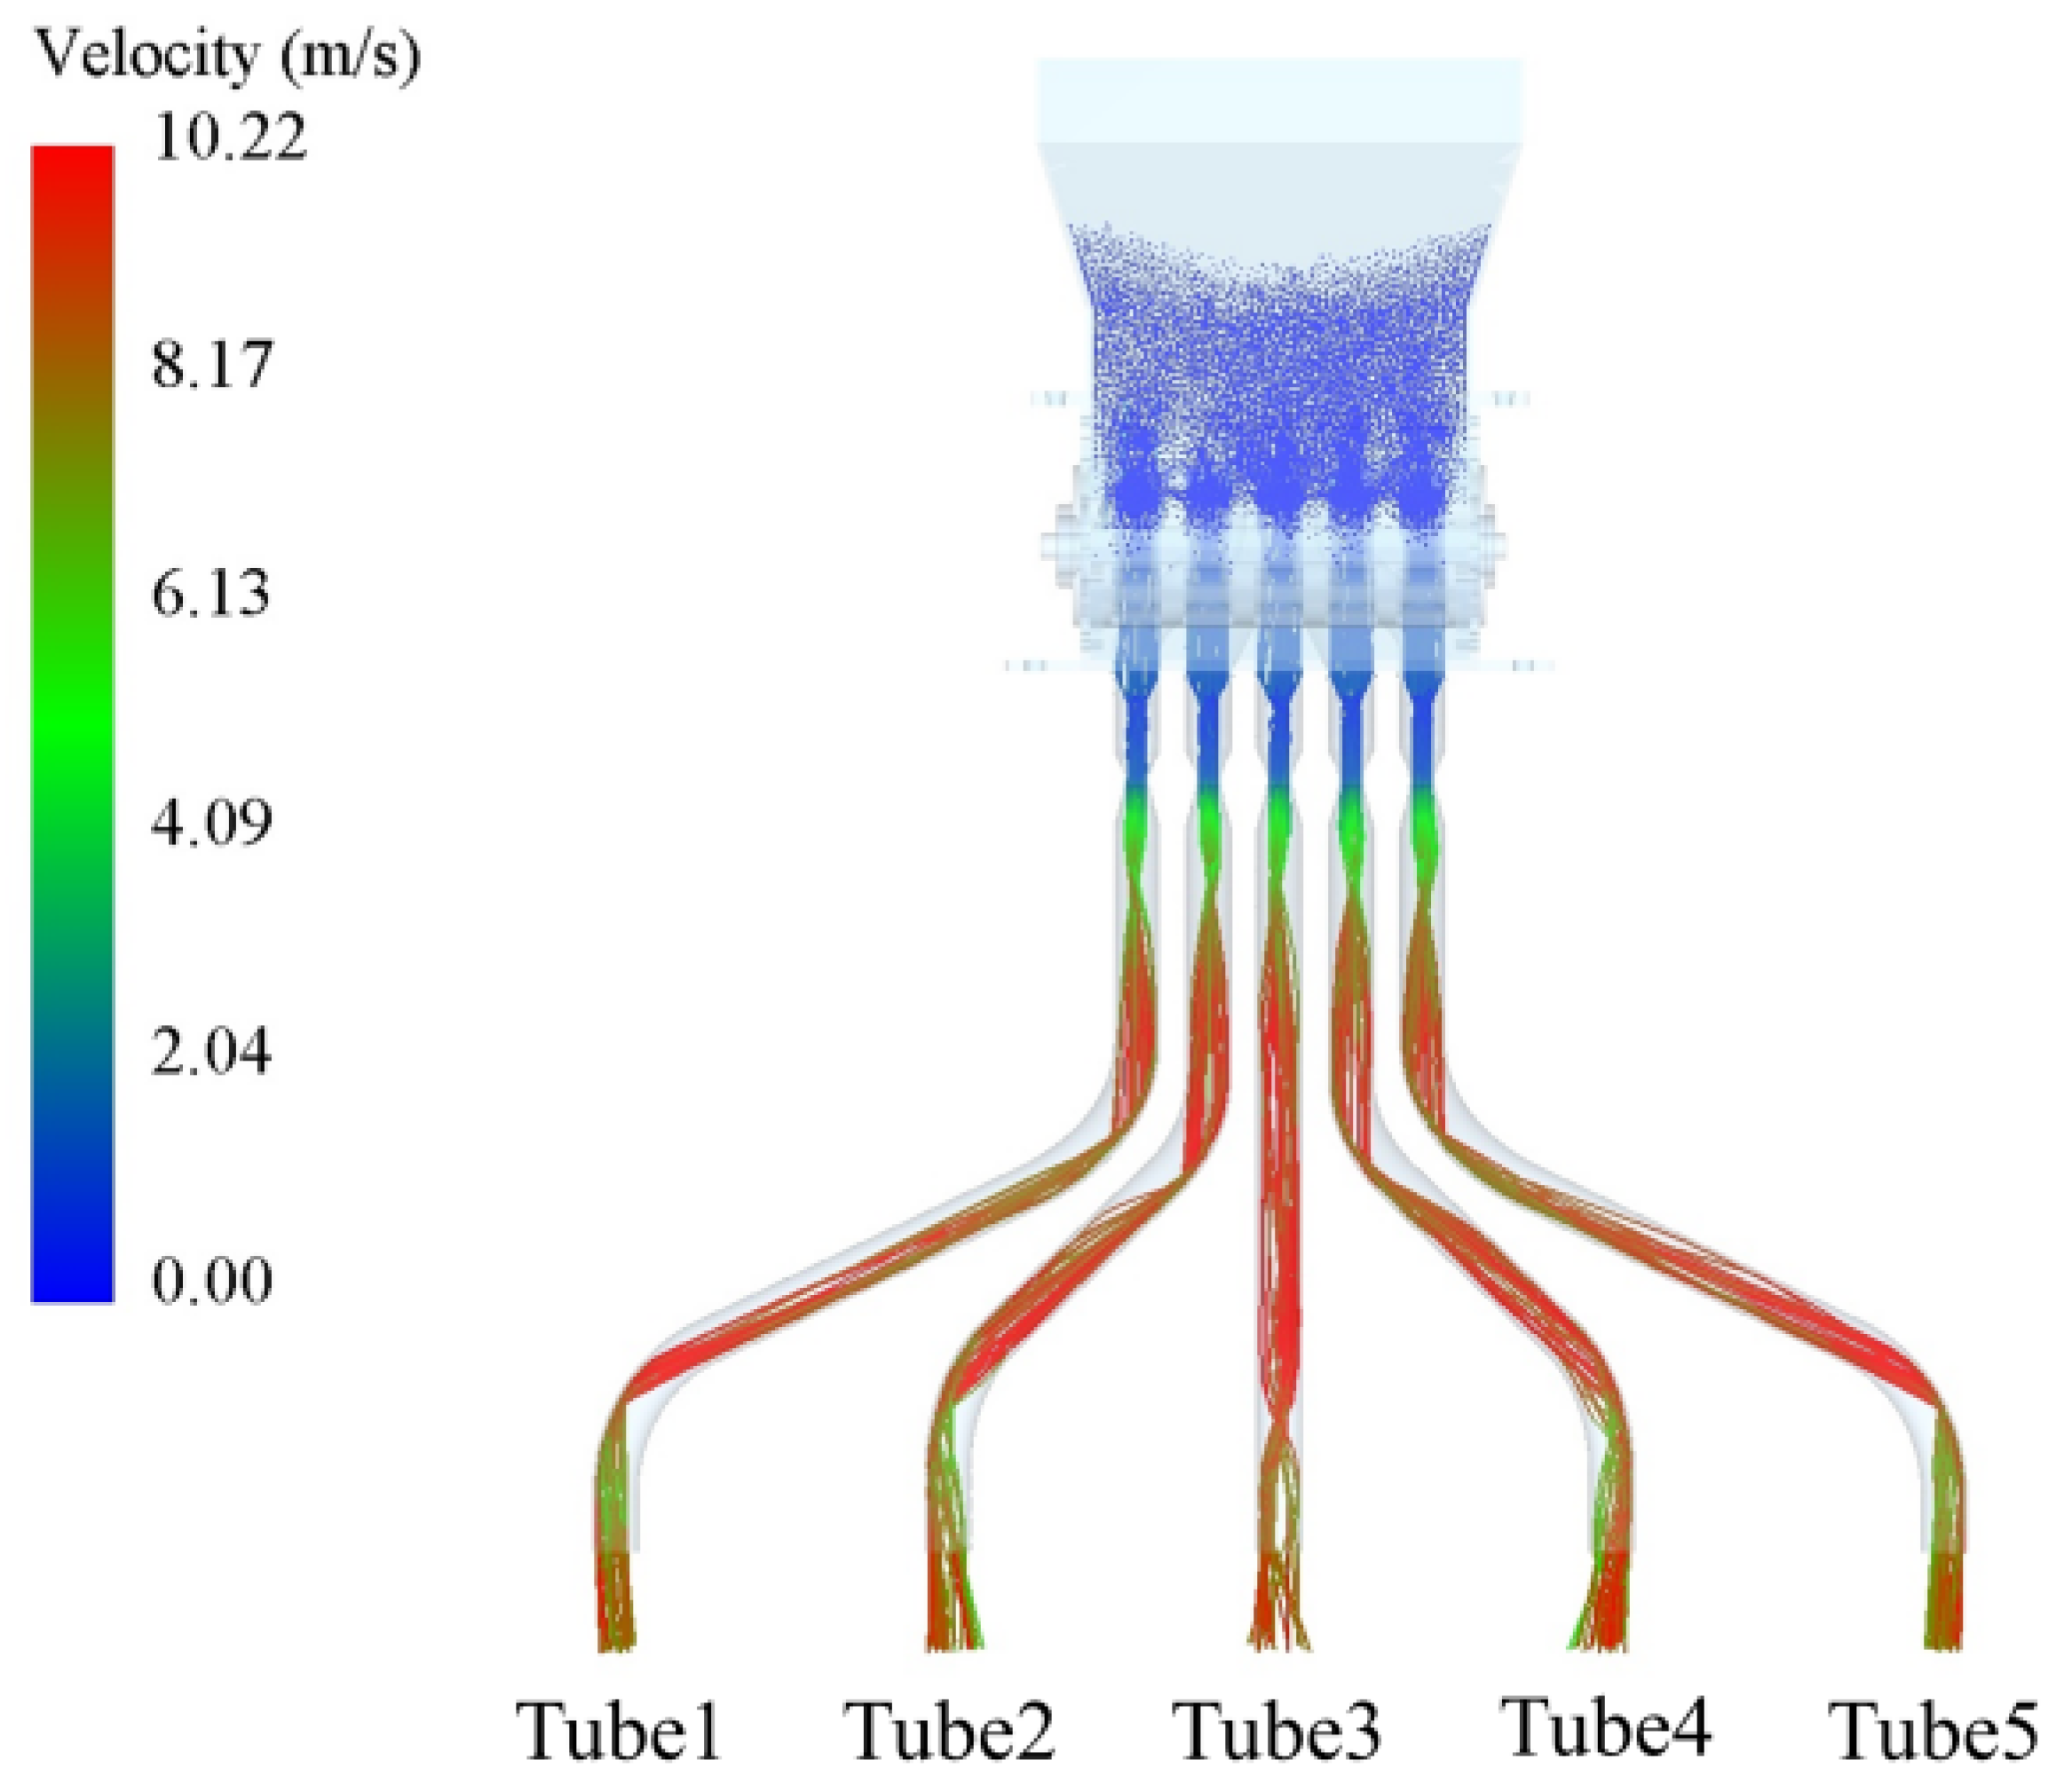
The trajectory of seeds in the seed-dispensing pipeline and the variation in seed velocity over time are shown in Figure 8 and Figure 9. The motion state of seeds within the airflow field can be categorized into two types: suspension within the airflow field and contact with the pipeline wall surface. Due to the relatively low airflow velocity along the pipeline wall surface and the presence of frictional resistance, sliding along the wall surface is detrimental to the rapid passage of seeds through the seed discharge pipeline. Therefore, by analyzing the motion trajectory of seeds within the airflow field, we investigate the influence of airflow velocity on the motion state of seeds. When the inlet airflow velocity is 20 m/s, the seed trajectory within the seed delivery tube is shown in Figure 9. Seeds experience drag and lift forces within the airflow field. Under the influence of high-speed airflow, they detach from the tube wall and remain suspended within the airflow field. Significant acceleration occurs in the middle section of the tube, reducing the time seeds spend traveling through the conduit. Although the curvature at the bottom of the seed discharge tube reduces seed velocity, it corrects the seed velocity direction toward the vertical axis. Furthermore, seeds do not exhibit significant dispersion after exiting the discharge tube, which is beneficial for improving HFR.
Figure 9.
Seed trajectory at an inlet velocity of 20 m/s.
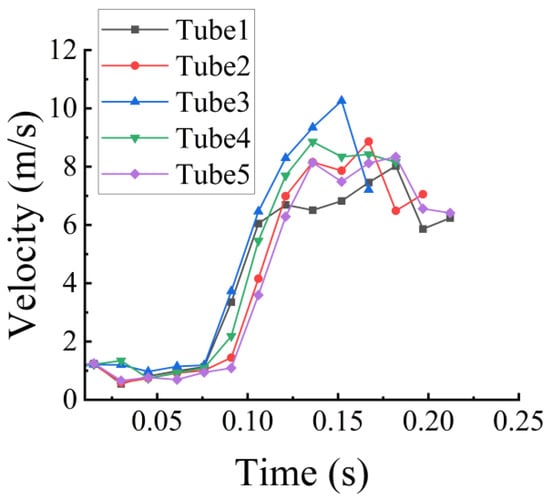
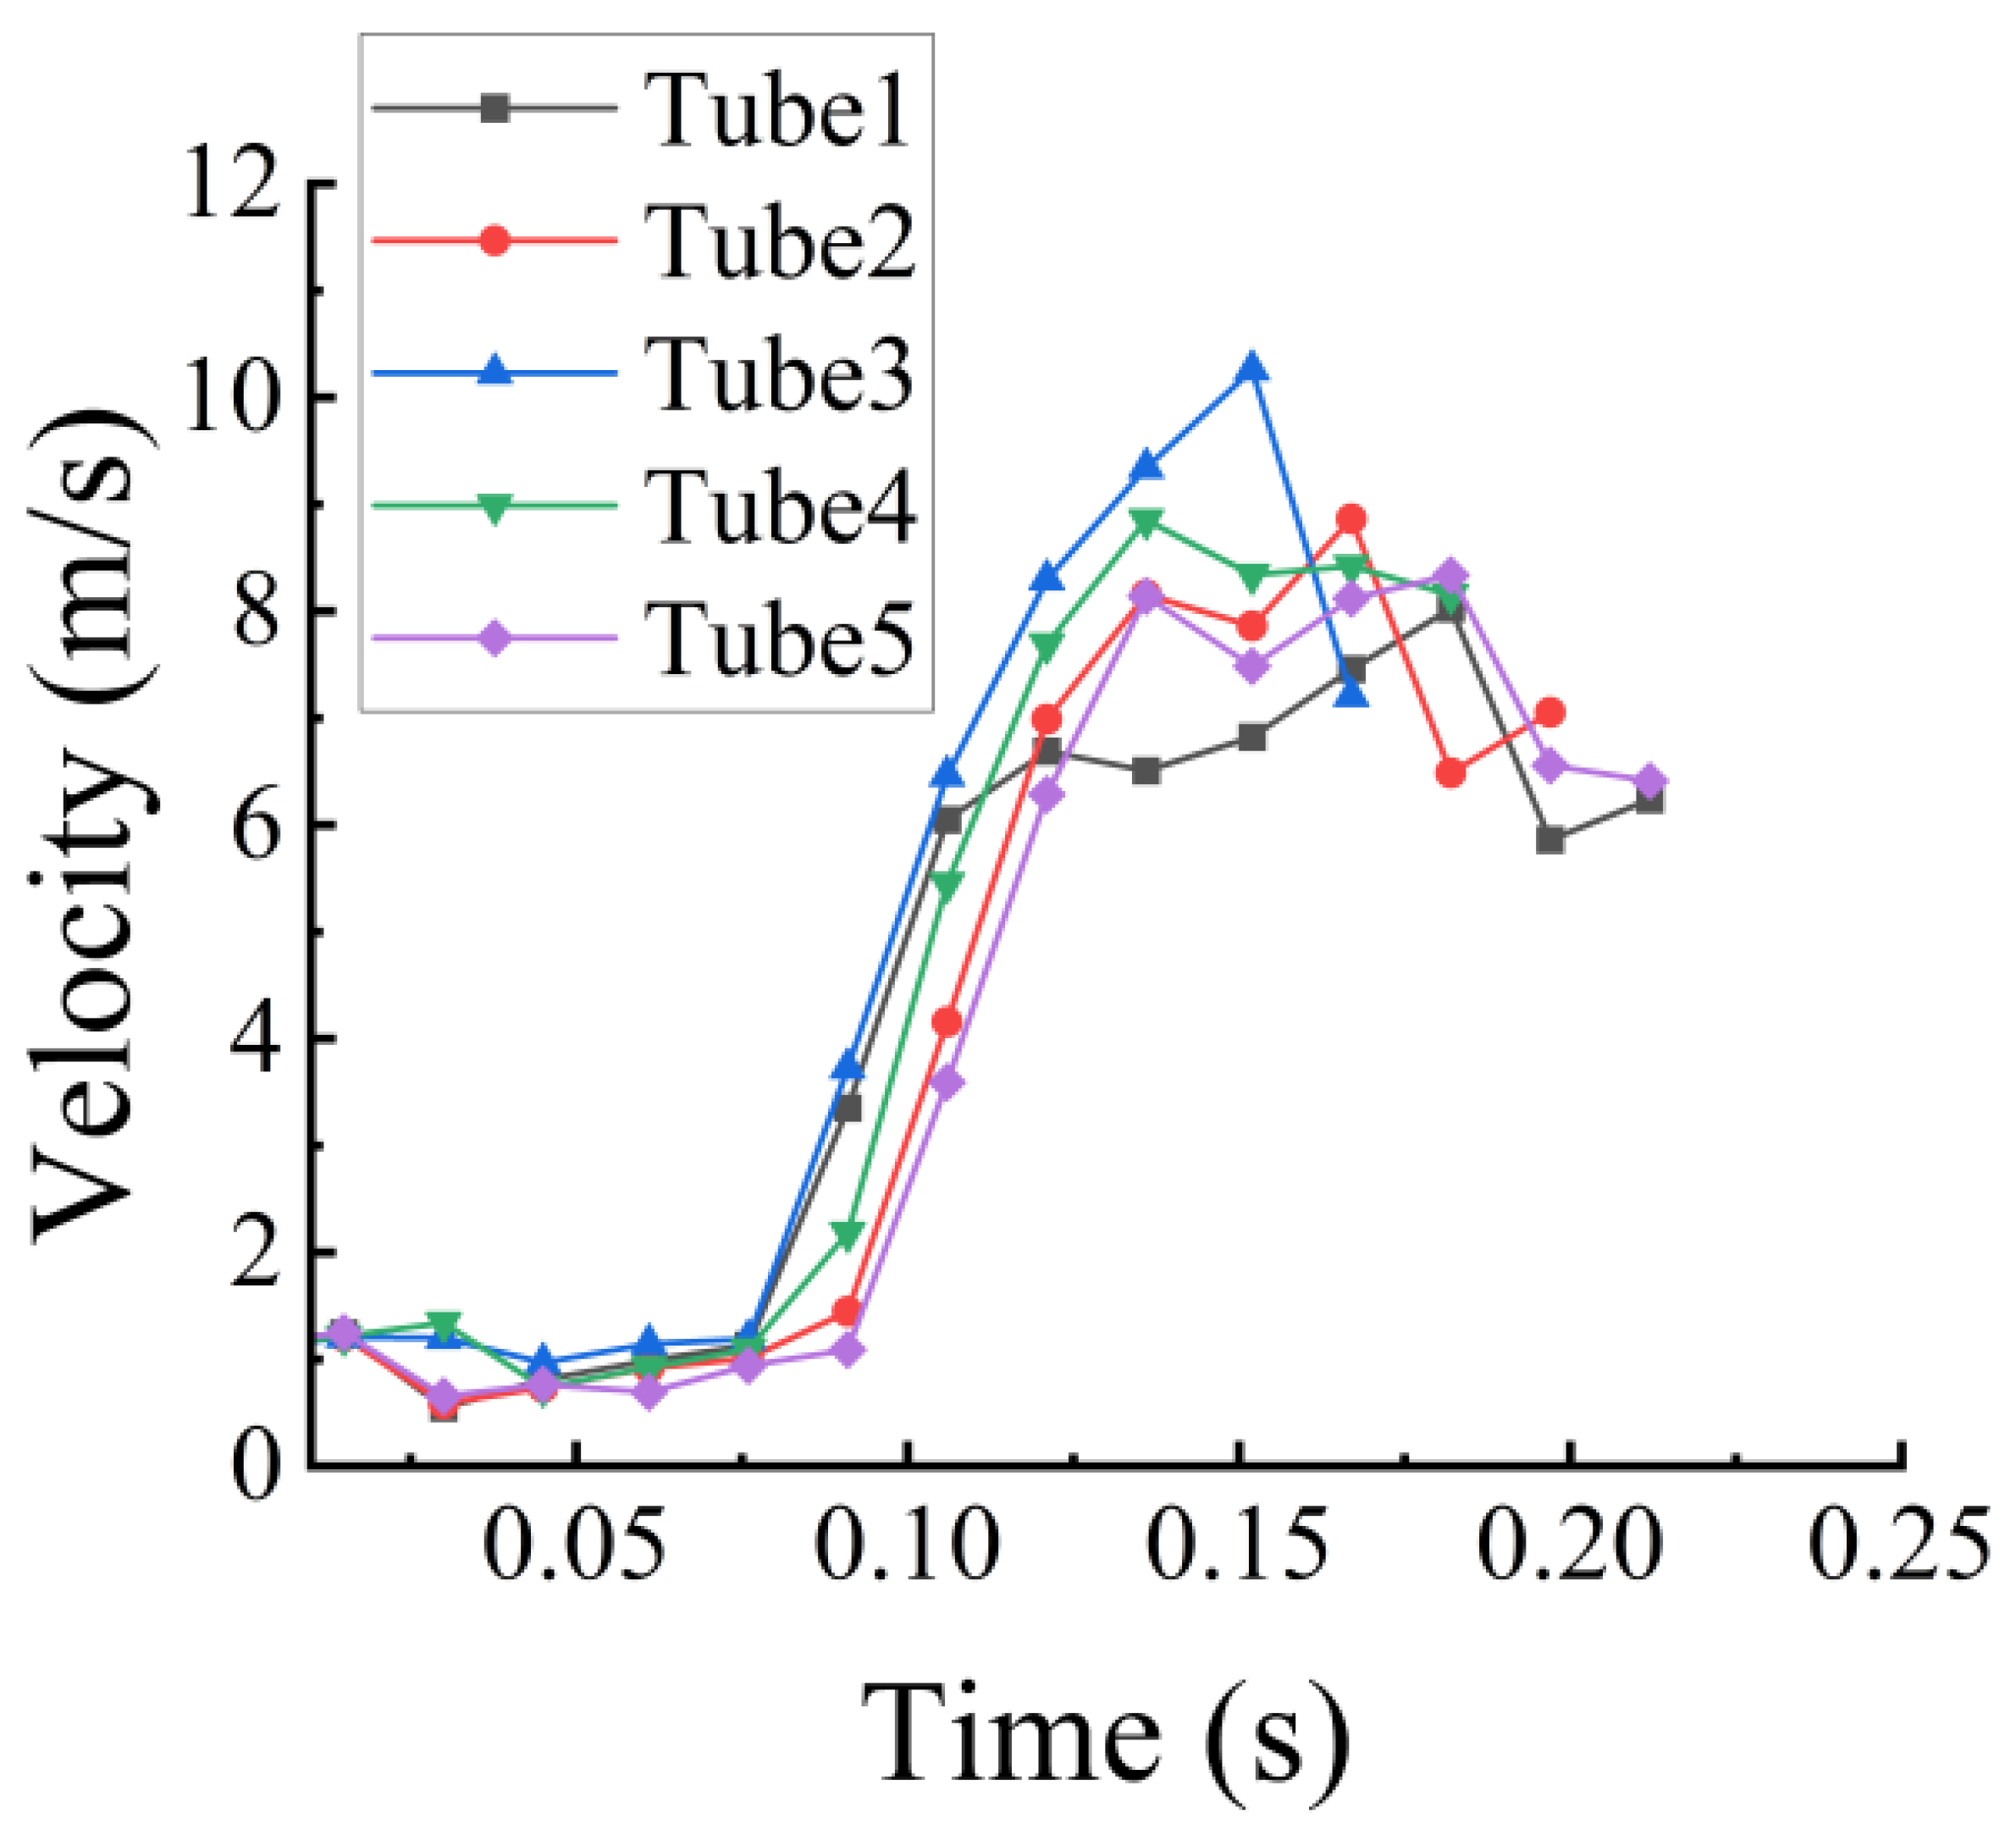
The seed velocity over time is shown in Figure 10. To meet the agronomic requirements for rice sowing, the row spacing between each sowing row is 20 cm. Tubes 1 and 5 exhibit the most significant curvature, requiring seeds to travel the longest distance through the pipes before being deposited into the soil. Due to the curvature of the seed delivery tubes, seeds collide with the tube walls during their movement within the tubes, resulting in a loss of kinetic energy and a subsequent decrease in seed velocity. Simultaneously, the high-speed airflow collides with the tube walls, causing localized pressure losses due to structural abrupt changes. Compared to Tube 3, this reduces the airflow’s ability to accelerate seeds. Consequently, seeds discharged through Tubes 1 and 5 experience the longest transit time within the tubes. This also results in a noticeable lateral offset between adjacent rows of seeds, as shown in Figure 8.
Figure 10.
Seed velocity over time.
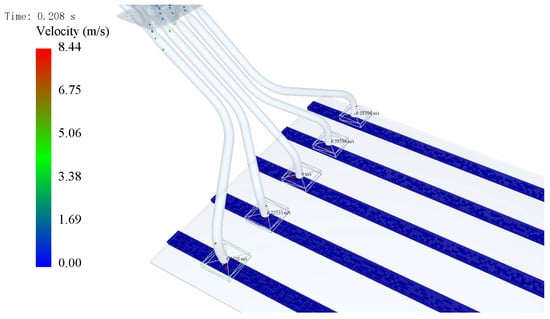
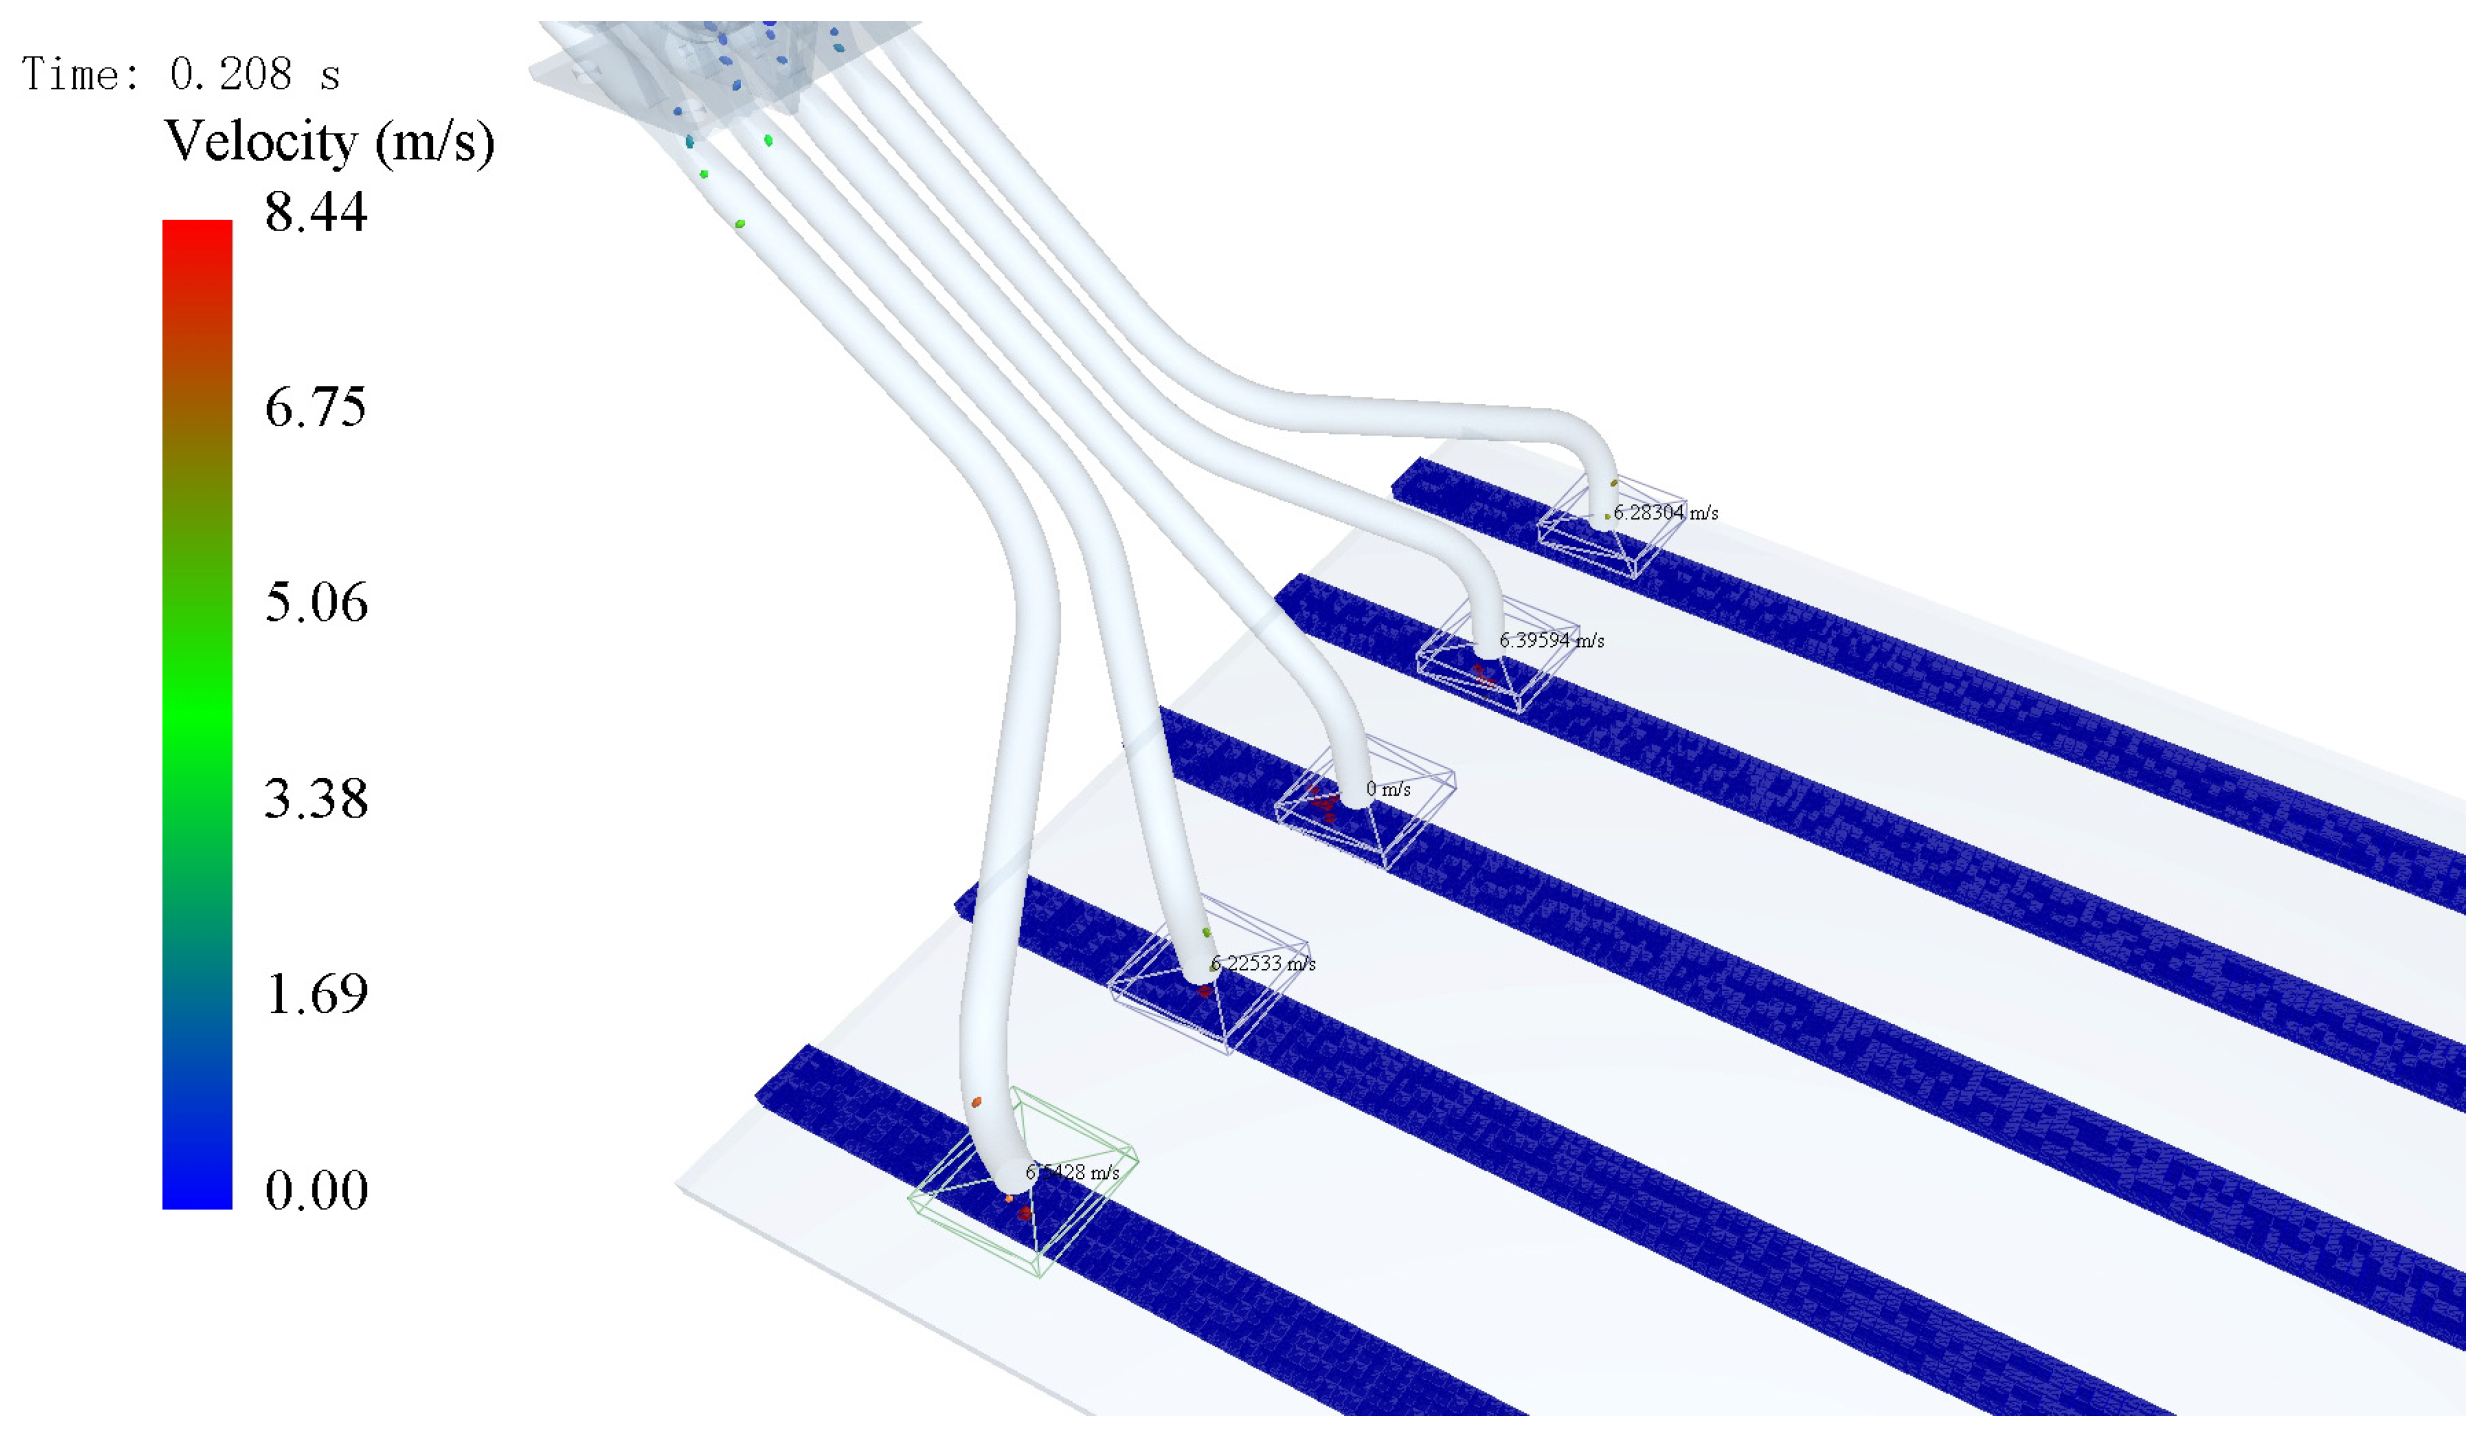
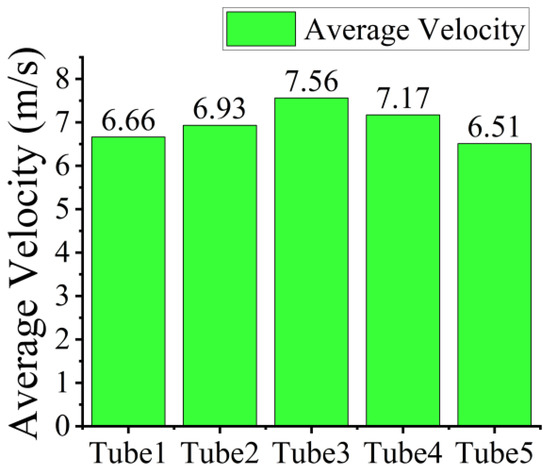
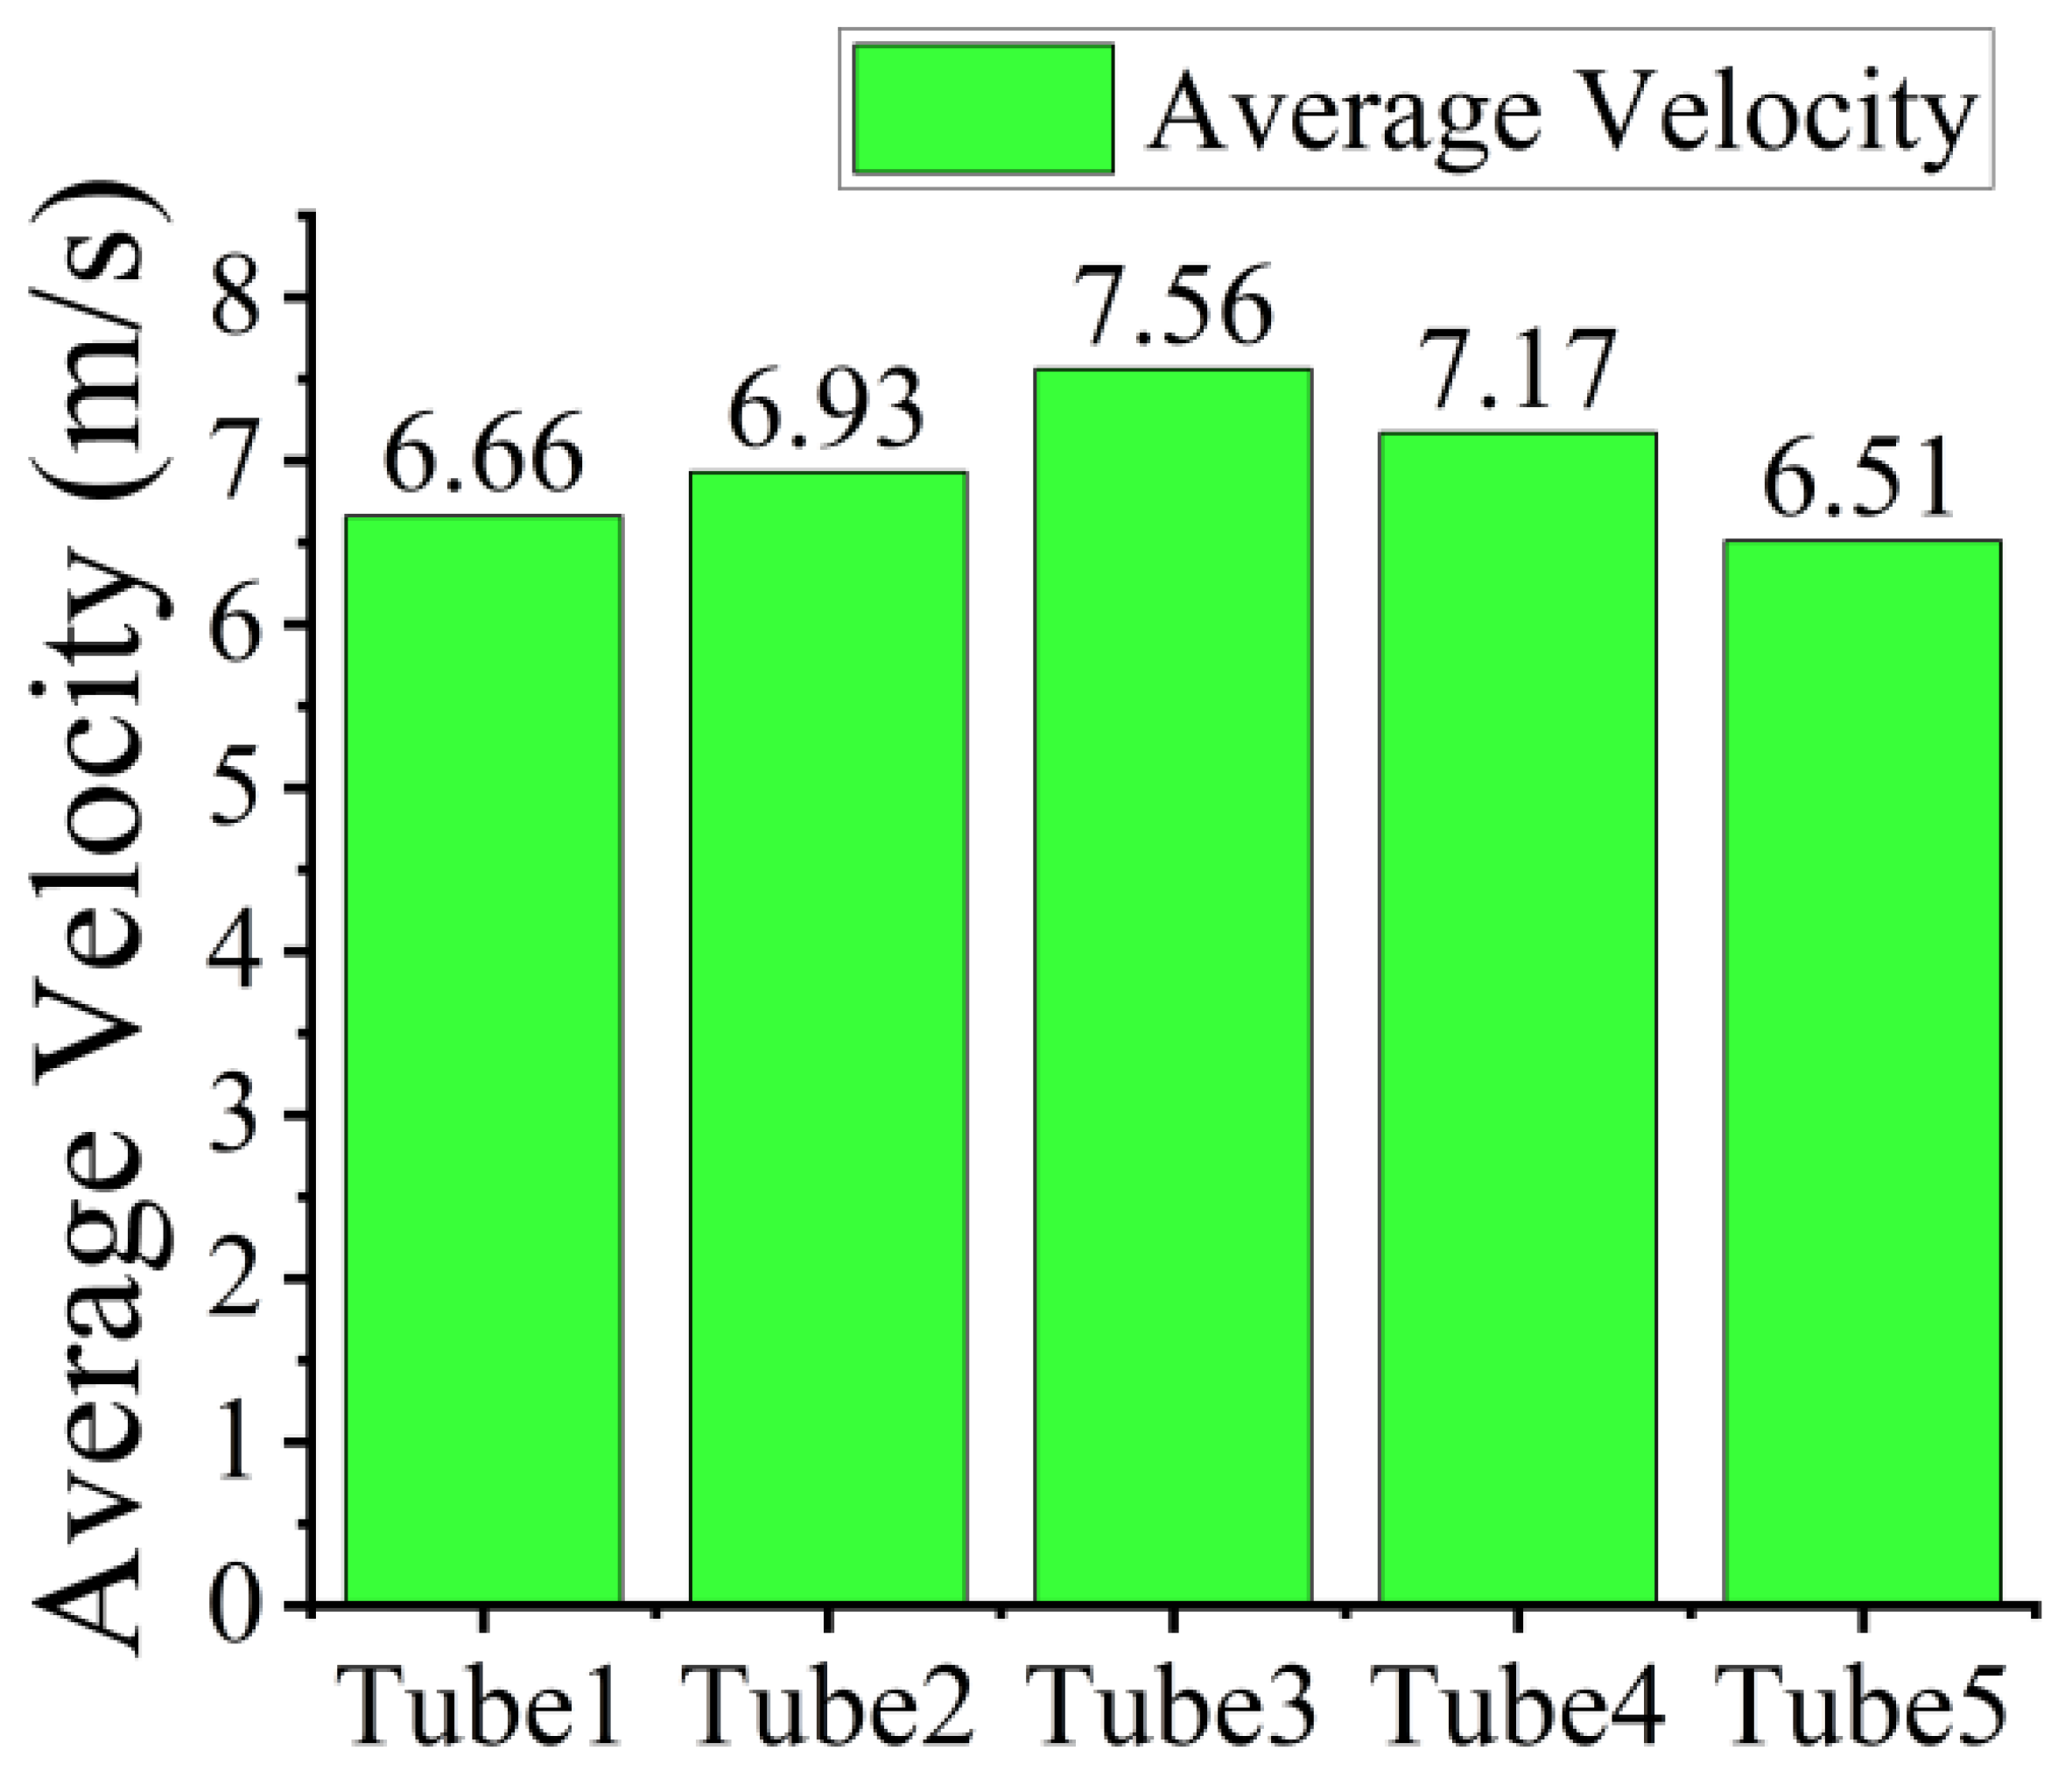
As shown in Figure 10, during the initial low-speed phase (0–0.075 s): seeds have not yet entered the blending chamber, and the effects of airflow are not yet apparent. The five curves are nearly identical, with velocities uniformly below 2 m/s at an extremely low level. During this phase, seeds are positioned just above the feeding inlet beneath the feeding device and have not yet entered the blending chamber. They primarily descend slowly under their own weight, with the high-speed airflow yet to exert a significant drag force. Consequently, seed velocities remain consistent across all pipelines. Rapid Acceleration Phase (0.075–0.15 s): Seeds enter the blending chamber, where the drag force from the airflow dominates acceleration. Velocity rapidly increases from 2 m/s to 7–11 m/s, reaching the maximum slope on the curve. This is the core stage for seed velocity gain. Differences between tubes begin to emerge: Tube 3 exhibits the fastest acceleration and highest peak velocity, while Tubes 1 and 5 show the slowest acceleration and lowest peak velocity. During this phase, seeds enter the blending chamber of the feeding device. Here, the high-velocity airflow accelerates further due to a reduction in cross-sectional area, exerting strong drag forces on the seeds and driving their rapid acceleration. The core reason for the differences between tubes lies in the degree of curvature and the conveying distance. Tube 3 has the least curvature and the shortest conveying distance. Seeds collide with the tube walls extremely rarely, resulting in minimal kinetic energy loss. The airflow acceleration effect is most direct here, leading to the fastest acceleration (reaching approximately 11 m/s at 0.15 s). Tube2 and Tube4: Moderate bending and moderate distance result in collision frequency and kinetic energy loss between Tube3 and Tube1/Tube5. Their acceleration and peak velocity also fall in the middle range. Tube1 and Tube5: These exhibit the most significant curvature and the longest transport distance. Seeds collide repeatedly with the pipe walls (causing kinetic energy loss), while high-speed airflow colliding with the walls generates localized pressure loss. This weakens the drag force exerted by the airflow on the seeds, resulting in the slowest acceleration (reaching only 7–8 m/s at 0.15 s). Mild deceleration phase (0.15–0.25 s): Seeds enter the respective seed distribution tubes from the expansion section, where airflow influence diminishes. The velocity increase gradient slows significantly, with some curves (e.g., Tube1/5) showing slight declines. Ultimately, all five curves stabilize at 7–9 m/s; inter-tube differences remain consistent (Tube3 > Tube2/4 > Tube1/5). During this phase, seeds transition from the expansion section of the feeding device into the respective seed discharge tubes. In this region, the cross-sectional area of the tubes increases with the cone angle, causing the airflow velocity to decrease and thereby weakening the drag force on the seeds, leading to a stagnation in velocity growth. Simultaneously, friction within the tubes and residual collisions still result in minor kinetic energy losses, causing slight deceleration in some tubes (e.g., Tube1/5). As shown in Figure 11, five average velocity detectors are installed at the seed discharge ports to measure the average speed of seeds passing through them. Although seed velocity and airflow velocity experience some loss after the pipe bend, Figure 12 indicates that the average seed velocity at all five ports remains no less than 6.5 m/s. This enables the seeds to overcome the influence of the airflow field at the bottom of the pipeline, ensuring rapid injection into the soil and facilitating seed hole formation.
Figure 11.
Average seed velocity measurement at seed tube outlet.
Figure 12.
Average seed velocity at the seed tube outlet.
4.4. Test Results and Analysis
4.4.1. Test Results and Significance Analysis
Using Design-Expert 13 software, a Box–Behnken orthogonal combination experiment was established. The experimental results obtained under different combinations are shown in Table 3. The analysis of variance for the effects of each factor and its interaction terms on the experimental indicators is presented in Table 4.
Table 3.
Experimental design and results.
Table 4.
Analysis of Variance for Hole Formation Rate and Hole Spacing Coefficient of Variation.
- (1)
- Regression Model and Significance Test for HFR
Table 4 indicates that the regression model for the HFR is highly significant. The p-values for X3 and X1X2 are both greater than 0.05, indicating they have no significant effect on S. All other terms are substantial, suggesting a quadratic relationship between the experimental factors and S. The lack of significance for the error term indicates that no other significant factors influence the experimental indicator. The order of importance for factors affecting S is X1, X2X3, X1X3, X2. Multivariate fitting yields the regression equation for HFR as shown in Equation (12), with R2 = 0.9814, Adjusted R2 = 0.9575, and Predicted R2 = 0.9517, indicating that the model explains 98.14% of the variance and has excellent predictive capability.
- (2)
- Regression Model and Significance Test for HSCV
Table 4 indicates that the regression model for the HSCV of hole spacing is highly significant. The p-values for X2, X1X2, and X2X3 are all greater than 0.05, indicating no significant effect on Cv. All other terms are substantial, suggesting a quadratic relationship between the experimental factors and Cv. The term for misfit is not significant, indicating that no other important factors influence the experimental indicator. The order of importance for factors affecting the HSCV is X1, X3, and X1X3. Multivariate fitting yields the regression equation for HSCV as shown in Equation (13), with R2 = 0.9888, Adjusted R2 = 0.9743, and Predicted R2 = 0.9087, indicating that the model explains 98.88% of the variance and has excellent predictive capability.
4.4.2. Response Surface Analysis
- (1)
- The influence of various factors on the HFR
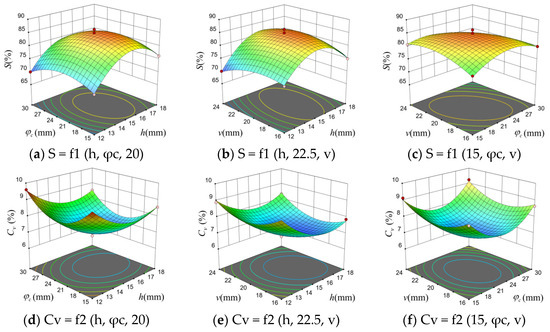
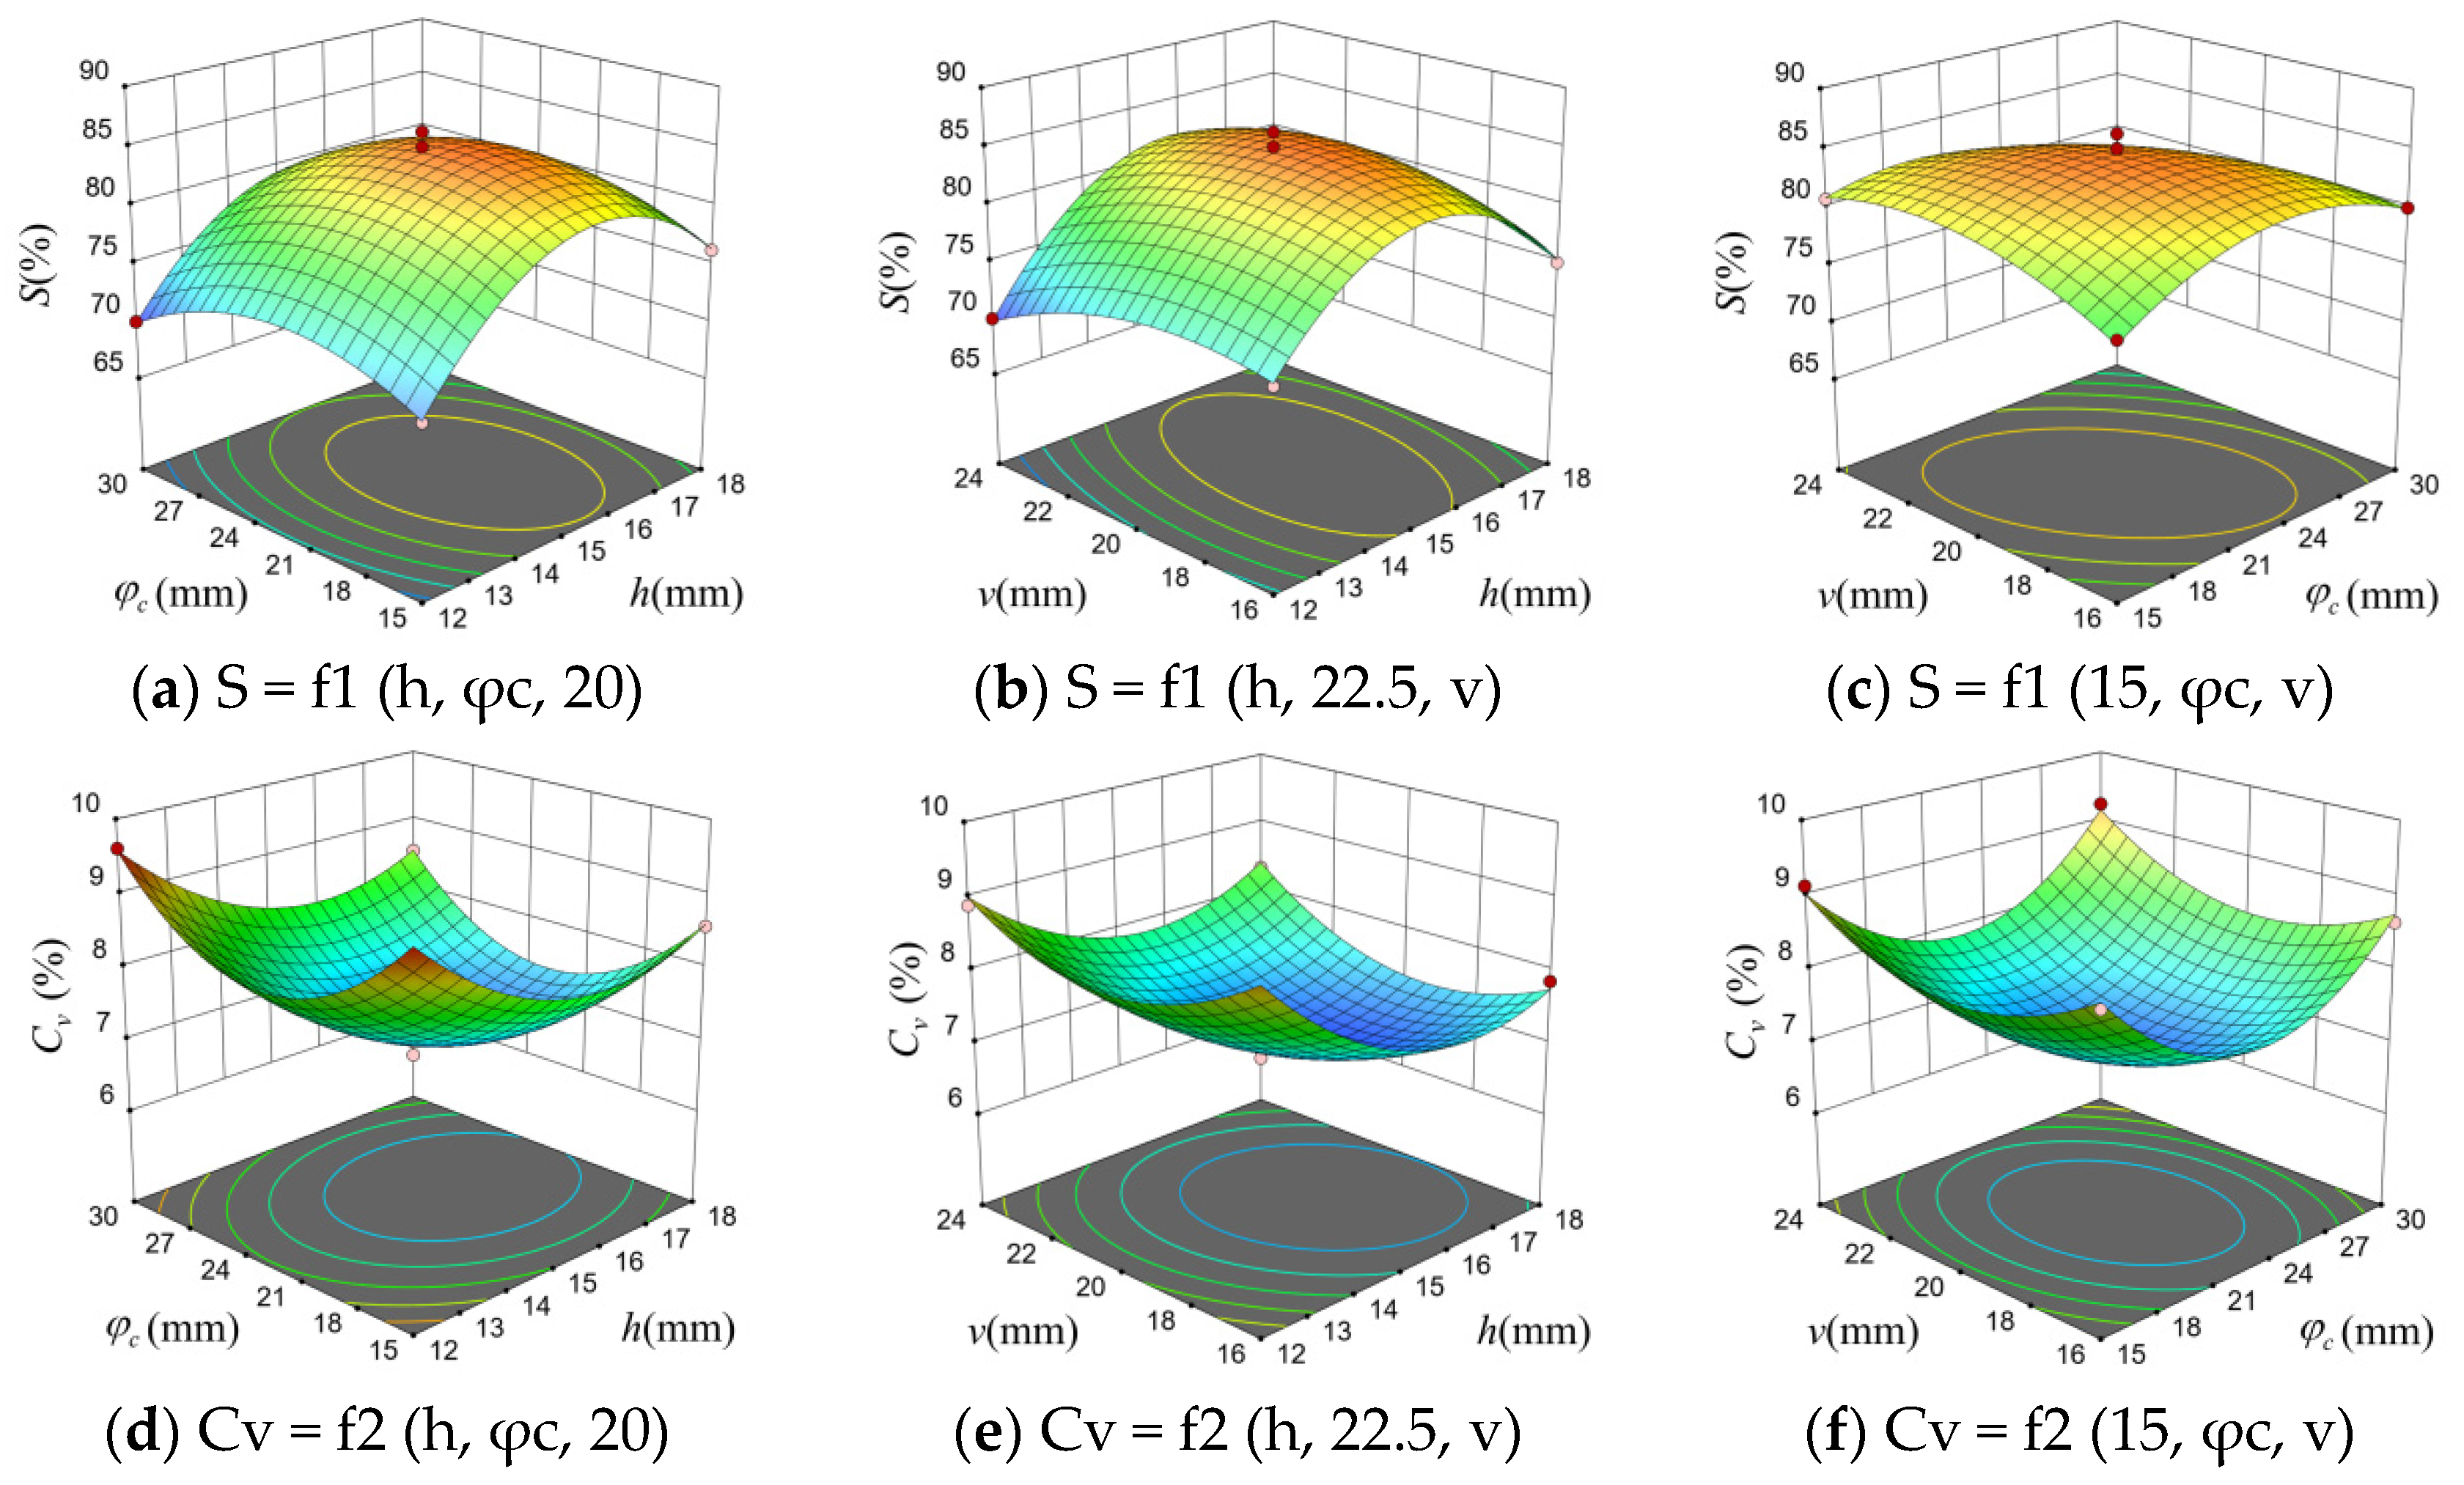
Based on the results of the Box–Behnken orthogonal combination test in Table 3, the interaction effect between the blending chamber height and the expansion section cone angle on S at an airflow velocity of 20 m/s is shown in Figure 13a. When the expansion section cone angle is fixed, S exhibits an initial increase followed by a decrease as the blending chamber height increases, reaching a maximum value between 14 and 16 mm. When the blending chamber height is fixed, S also shows an initial increase followed by a decrease as the expansion section cone angle increases, peaking between 21 and 24°. When the expansion section cone angle is 22.5°, the interaction between blending chamber height and inlet velocity on S is shown in Figure 13b. With a fixed blending chamber height, S increases slowly at first and then decreases slowly as the inlet velocity increases, reaching a maximum value at an inlet velocity of 18–22 m/s. When the inlet velocity is fixed, S increases with increasing blending chamber height before decreasing, reaching a maximum at a blending chamber height of 14–16 mm. The interaction between the expansion section cone angle and inlet velocity on S when the blending chamber height is 15 mm is shown in Figure 13c. When the expansion section cone angle is fixed, S increases slowly with increasing inlet velocity before decreasing slowly, reaching a maximum at an inlet velocity of 18–22 m/s. When the inlet velocity is fixed, S also increases slowly with increasing expansion section cone angle before decreasing slowly, reaching a maximum at an expansion section cone angle of 18–27°.
Figure 13.
Response surface of indicators for each factor.
- (2)
- The influence of various factors on the HSCV
At an airflow velocity of 20 m/s, the interaction between the blending chamber height and expansion section cone angle affects Cv, as shown in Figure 13d. When the expansion section cone angle is fixed, Cv exhibits a trend of first decreasing and then increasing with increasing blending chamber height, reaching a minimum value at a blending chamber height of 15–17 mm. When the blending chamber height is fixed, Cv also shows a trend of first decreasing and then increasing with increasing expansion section cone angle, reaching a minimum value at an expansion section cone angle of 21–24°. Figure 13e illustrates the interaction effect of blending chamber height and inlet velocity on Cv when the expansion section cone angle is 22.5°. With a fixed blending chamber height, Cv first decreases and then increases with increasing inlet velocity, reaching its minimum value at inlet velocities between 18 and 22 m/s. When the inlet velocity is fixed, Cv also decreases then increases with increasing blending chamber height, reaching a minimum between 15 and 17 mm. The interaction between the blending chamber height (15 mm) and the expansion section cone angle on Cv is shown in Figure 13f. With a fixed expansion section cone angle, Cv also exhibits a decrease followed by an increase as the inlet flow velocity increases, reaching a minimum at an inlet flow velocity of 18–22 m/s. When the inlet flow velocity is fixed, Cv decreases first and then increases as the expansion section cone angle increases, reaching a minimum at an expansion section cone angle of 21–24°.
4.5. Parameter Optimization and Experimental Validation
To obtain the optimal structural parameters of the seed feeding device and the optimal airflow velocity during seeding, the influence of the actual duct fan’s operating wind speed on the test indicators was optimized and solved, as shown in Equation (14).
Optimization results indicate that the highest HFR of 84.66% and the lowest HSCV of 6.95% were achieved when the blending chamber height was 15.59 mm, the expansion section cone angle was 22.20°, and the inlet airflow velocity was 19.67 m/s.
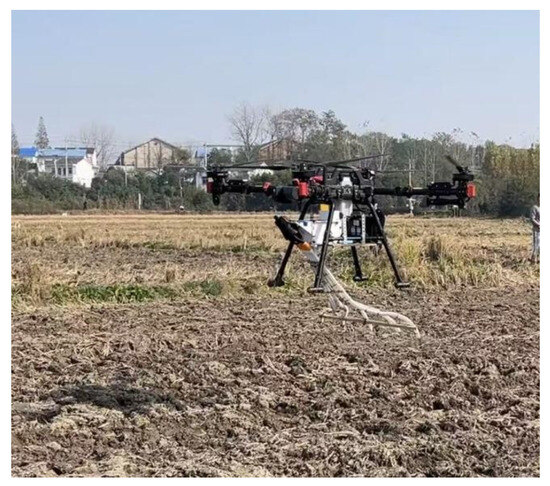
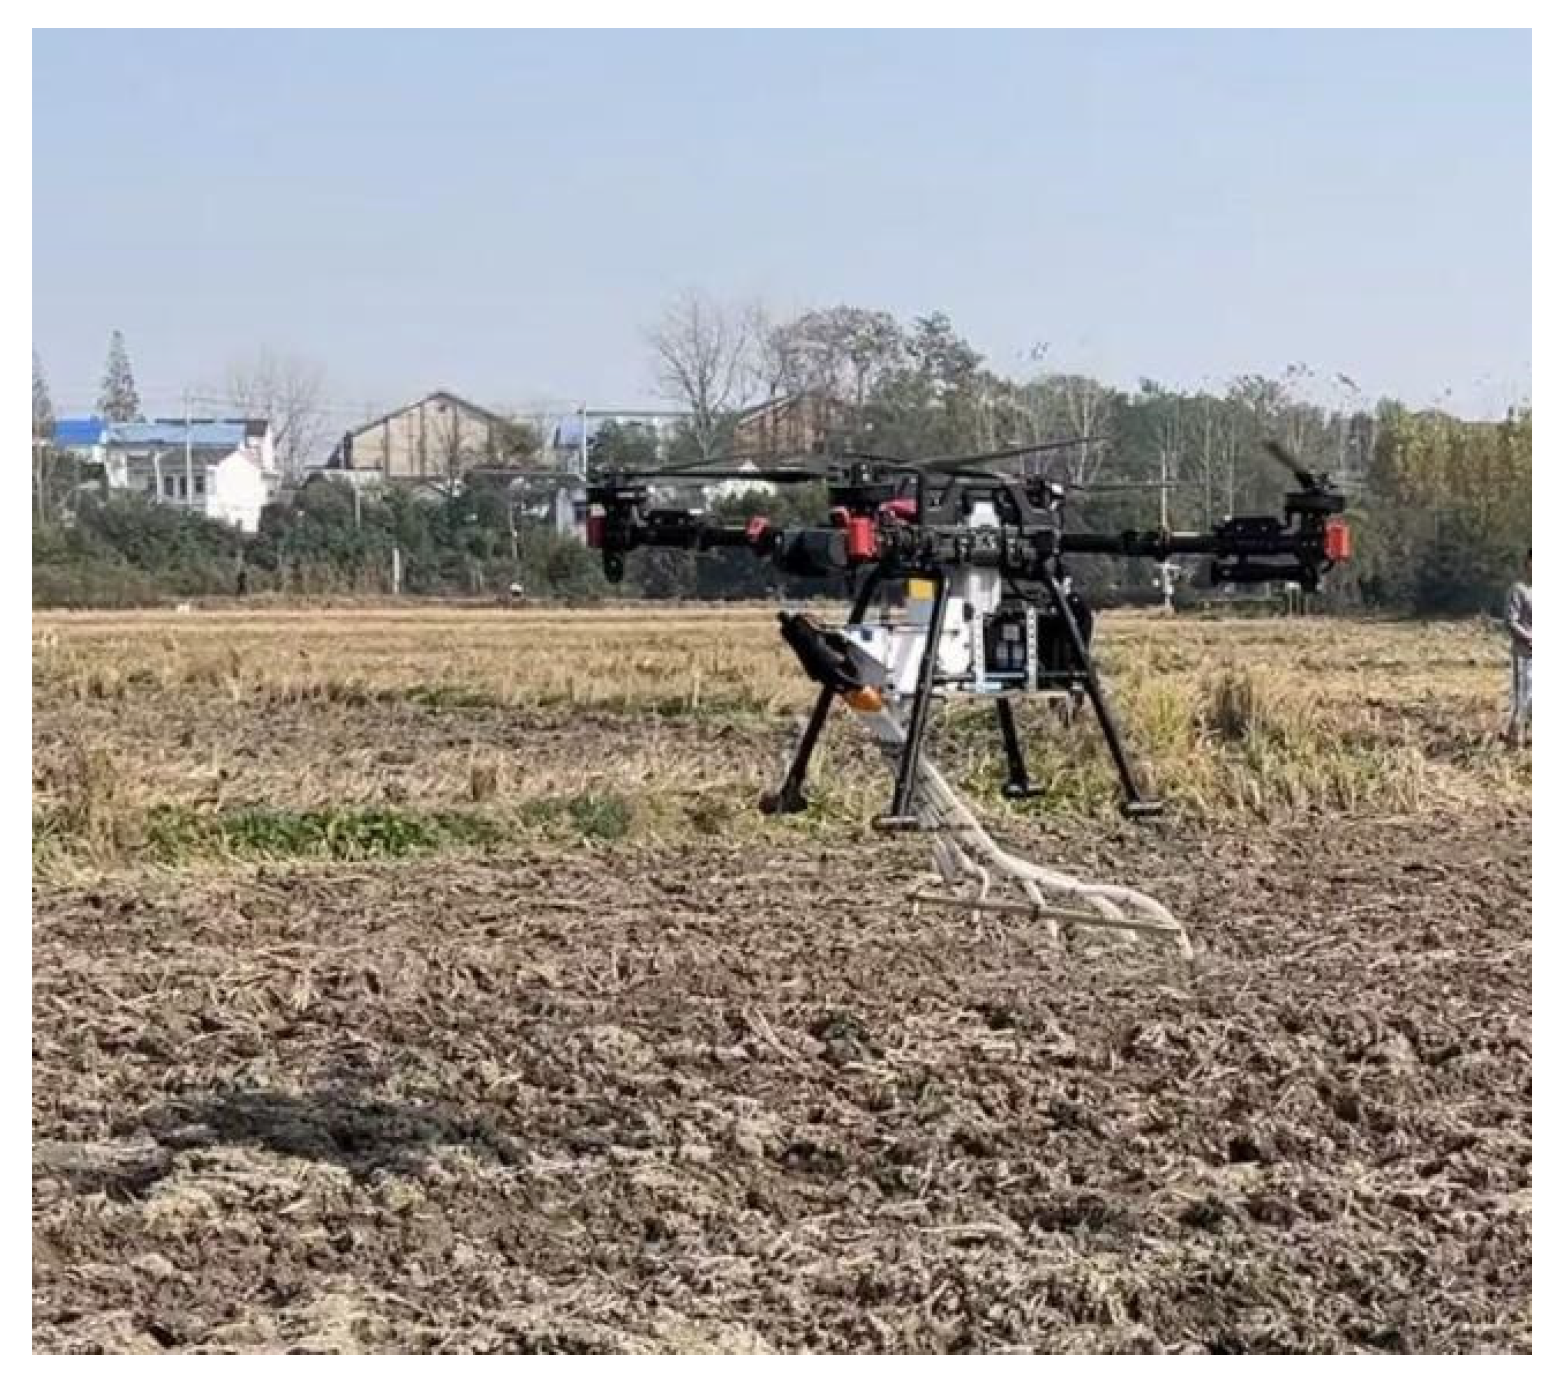
To validate the accuracy of the optimization results, a seed feeding device with optimal structural parameters was fabricated using 3D printing technology. During field trials, foldable seed delivery tubes were used. A servo motor installed on the seeding mechanism controls the folding and unfolding of the tubes to prevent damage during landing. Due to both friction losses and local losses within the duct, field tests were conducted at an inlet velocity of 20 m/s. The field trials were carried out using an XAG P60 agricultural UAV (manufactured by XAG Co., Ltd., Guangzhou, China) at a flight altitude of 1.5 m and a flight speed of 1.2 m/s, consistent with the simulation parameters. The actual inlet airflow velocity was measured using an SG312 anemometer (manufactured by Shanghai Leiruo Instrument Technology Co., Ltd., Shanghai, China) to ensure accuracy. As shown in Figure 14, consistent with simulation results, a total of 80 seed holes were counted across three repeated trials. The average HFR reached 86.25%, with an average HSCV at 6.83%. These findings align well with the multi-objective optimization outcomes, confirming both the accuracy and feasibility of the simulation.
Figure 14.
Field test.
5. Discussion
This study indicates that the structural parameters of the seed feeding device and the inlet airflow velocity significantly influence the hole formation effect after seeding. The height of the blending chamber exerts a greater impact on the HFR than the expansion section cone angle, while the blending chamber height has a more substantial effect on the HSCV than the inlet airflow velocity. Currently, few scholars have conducted research on hole seeding using agricultural UAV, with most studies focusing on UAV row seeding. Research findings [24,41] indicate that flight speed, flight altitude, and seed tube length influence the striping effect of rice seeds by altering the spatial distribution of the downward wash airflow, the unconstrained trajectory of seeds after leaving the seed tube, and the lateral movement speed of seeds, respectively. Huang et al. [42] analyzed the movement trajectories and velocity changes of seeds within the conveying airflow and the UAV rotor airflow field, using these findings to optimize the structure of a folding seed delivery device.
However, ground-based seeding machinery faces severe operational constraints in rice paddies, particularly due to muddy soil conditions prone to vehicle sinking and irregular field boundaries that limit maneuverability. To overcome these challenges, this paper proposes the use of pelleted rice for pre-sowing seed treatment in rice cultivation. As a high-tech solution meeting precision seeding requirements, this method mechanically processes seeds to achieve uniform size, smooth surfaces, and increased particle volume. It alters the original shape and size of seeds, enhancing their adaptability while improving seed flowability and filling efficiency. For hilly and mountainous regions where irregularly shaped seeds and ground machinery pose challenges, this paper proposes an agricultural UAV-based pneumatic precision seeding system for pelleted rice. This system operates through mechanical quantitative seed feeding and airflow-based row distribution. Addressing the challenge of mounting large fans on UAV, this study employs a duct system to generate high-speed airflow during pneumatic transport. This airflow is then distributed to each seed feeding device via an airflow distribution mechanism, consistent with the approach by Wang et al. [43]. This paper does not optimize the seed delivery pipeline structure. Future research should consider the effects of different pipeline designs, as well as UAV flight speed and altitude, on hole formation effectiveness.
6. Conclusions
This study aims to address the challenges of ground machinery operations in complex terrain rice fields and the difficulty of achieving uniform row and hole formation with traditional drone broadcasting, thereby enabling high-speed quantitative hole seeding of rice via drones. A pelleted rice pneumatic feeding device for seed delivery was designed based on the Venturi effect. Through CFD-DEM coupled simulation and experimental optimization, structural parameter design, performance validation, and practical feasibility analysis were completed, providing theoretical and technical support for the development of precision hole-seeding equipment for UAV rice cultivation.
6.1. Summary of Findings and Main Outcomes
A three-dimensional simulation model of gas–solid two-phase flow was constructed to accurately reflect actual field conditions. By setting relative motion between the detection zone and the seed distributor, the seed transport process was precisely simulated. Simulation results indicate that seeds undergo significant acceleration within the feeding device, exiting the seed tube at a velocity no less than 6.5 m/s. This enables resistance to rotor airflow interference without noticeable scattering, providing fundamental assurance for successful seed placement.
Using blending chamber height (12–18 mm), expansion section cone angle (15–30°), and inlet flow velocity (16–24 m/s) as key experimental factors, and evaluating performance based on HFR and HSCV, a Box–Behnken orthogonal combination simulation test was conducted. Through variance analysis and multi-objective optimization, the optimal parameter combination was determined: blending chamber height 15.59 mm, expansion section cone angle 22.20°, and inlet airflow velocity 19.67 m/s. This configuration achieved a HFR of 84.66% and a HSCV of 6.95%.
Field trial validation results indicate that the feeding device processed with optimized parameters achieved an actual HFR of 86.25% and a HSCV of 6.83%. The deviation from simulation results was less than 2%, meeting the agronomic requirements for precision hole seeding of rice. This validates the accuracy of the simulation model and the rationality of the device design.
6.2. Limitations
The seed delivery pipeline structure has not undergone targeted optimization. Due to significant bending angles and extended transport distances on both sides, seeds collide with the pipe walls more frequently, resulting in slightly higher kinetic energy loss compared to the central pipeline. This impacts the consistency of seed distribution across all channels.
The experiment did not fully account for the impact of operational parameters such as UAV flight speed and altitude on the rotor wind field. The stability of the excavated cavity under actual complex operational scenarios requires further validation.
6.3. Recommendations for Future Research
Conduct orthogonal experiments integrating aerial platform operational parameters (flight speed, altitude, flight path spacing) to analyze the effects of multi-factor interactions on seedling emergence outcomes. Optimize key operational parameters of the pelletized rice-seeding system to enhance operational efficiency and quality, and conduct comparative field tests for seeding and harvesting.
Optimize the seed delivery pipeline structure by employing variable-curvature pipes or incorporating drag-reducing linings to minimize seed-to-wall collision losses and enhance consistency in seed transport across all channels. Simultaneously, embed pressure sensors to enable the real-time monitoring and dynamic adjustment of airflow parameters.
However, we acknowledge that excessive collisions may affect seed integrity; therefore, the tube structure will be optimized in future work.
Author Contributions
Conceptualization, Q.W.; methodology, Q.W.; software, D.X.; validation, B.Z.; formal analysis, R.Y.; investigation, R.Y.; resources, Q.W.; data curation, R.Y.; writing—original draft preparation, Q.W.; writing—review and editing, C.J.; visualization, H.L.; supervision, Y.Q.; project administration, Q.W.; funding acquisition, Q.W. All authors have read and agreed to the published version of the manuscript.
Funding
This study was funded by Applied Peak Cultivation Discipline of Anhui Province (Grant No. 840123), the Key Project of the Department o Education of Anhui Province (Grant No. 2024AH050307), the National College Student Innovation Training Program Project (Grant No. 202510879054), Natural Science Research Project of Anhui Provincial Universities (Grant No. 2023AH051856), the Anhui Provincial Key Research and Development Program (2023N06020027), and the Anhui University of Science and Technology Talent Introduction Project (Grant No. JXYJ202201).
Institutional Review Board Statement
Not applicable.
Informed Consent Statement
Not applicable.
Data Availability Statement
The data presented in this study are available on request from the corresponding author.
Conflicts of Interest
The authors declare no conflicts of interest.
Abbreviations
The following abbreviations are used in this manuscript:
| UAV | unmanned aerial vehicle |
| HFR | hole formation ratio |
| HSCV | hole spacing coefficient of variation |
| PRS | pelleted rice seeds |
References
- Šarauskis, E.; Kazlauskas, M.; Naujokienė, V.; Bručienė, I.; Steponavičius, D.; Romaneckas, K.; Jasinskas, A. Variable Rate Seeding in Precision Agriculture: Recent Advances and Future Perspectives. Agriculture 2022, 12, 305. [Google Scholar] [CrossRef] [Scilit]
- Van Hung, N.; Thach, T.N.; Hoang, N.N.; Binh, N.C.Q.; Tâm, D.M.; Hau, T.T.; Anh, D.T.T.; Khuong, T.Q.; Chi, V.T.B.; Lien, T.T.K.; et al. Mechanized wet direct seeding for increased rice production efficiency and reduced carbon footprint. Precis. Agric. 2024, 25, 2226–2244. [Google Scholar] [CrossRef] [Scilit]
- Wang, J.; Yao, Z.; Xu, Y.; Guo, F.; Guan, R.; Li, H.; Tang, H.; Wang, Q. Mechanism Analysis and Experimental Verification of Side-Filled Rice Precision Hole Direct Seed-Metering Device Based on MBD-DEM Simulations. Agriculture 2024, 14, 184. [Google Scholar] [CrossRef] [Scilit]
- Xing, H.; Wang, Y.W.; Chen, Y.B.; Yang, R.; Bo, X.Z.; Zang, Y. Experiment and analysis of the seed suction model for rice pneumatic seed metering device using DEM-CFD approach. Int. J. Agric. Biol. Eng. 2025, 18, 191–197. [Google Scholar] [CrossRef] [Scilit]
- Xu, H.M.; Liu, W.R.; Liu, H.; Liu, Z.F.; Zhang, G.Z. Design and performance test of a combined and adjustable precise rice seed metering device. Int. J. Agric. Biol. Eng. 2025, 18, 101–114. [Google Scholar] [CrossRef] [Scilit]
- Qin, W.; Cao, X.; Zhong, P.; Lin, J.; Niu, Z.; Zang, Y. The Development of Air Suction Precision Seed-Metering Device for Rice Plot Breeding and Multi-Factor Coupling Performance Analysis. Agronomy 2025, 15, 1642. [Google Scholar] [CrossRef] [Scilit]
- Li, H.; Yang, K.; Ling, L.; Yan, B.; Wu, G.; Gao, X.; Liu, S. Design of Electrical Control System for Precision Rice Hill Direct-Seeding Device and Seeding Performance Comparison Test. Agriculture 2025, 15, 1716. [Google Scholar] [CrossRef] [Scilit]
- Yu, Y.; Yue, Y.; Liao, Q.; Lu, X.; Xiao, W.; Albasheer, A.H.; He, Z.; Wang, X.; Liao, Y. Design and experiment of the pneumatic double disc precision seed metering device for Chinese flowering cabbage. Int. J. Agric. Biol. Eng. 2024, 17, 128–135. [Google Scholar] [CrossRef] [Scilit]
- Valentin, M.T.; Białowiec, A.; Karayel, D.; Jasinskas, A.; Ciolkosz, D.; Lavarias, J.A. Investigation of the performance of a cylindrical hopper and metering device of a carrot seeder. Sci. Rep. 2023, 13, 813. [Google Scholar] [CrossRef] [Scilit]
- Hu, H.; Zhou, Z.; Wu, W.; Yang, W.; Li, T.; Chang, C.; Lei, X. Distribution characteristics and parameter optimisation of an air-assisted centralised seed-metering device for rapeseed using a CFD-DEM coupled simulation. Biosyst. Eng. 2021, 208, 246–259. [Google Scholar] [CrossRef] [Scilit]
- Lei, X.; Hu, H.; Wu, W.; Liu, H.; Liu, L.; Yang, W.; Zhou, Z.; Ren, W. Seed motion characteristics and seeding performance of a centralised seed metering system for rapeseed investigated by DEM simulation and bench testing. Biosyst. Eng. 2021, 203, 22–33. [Google Scholar] [CrossRef] [Scilit]
- Mahapatra, J.; Tiwari, P.S.; Singh, K.P.; Nandede, B.M.; Sahni, R.K.; Pagare, V.; Singh, J.; Shrinivasa, D.J.; Mandal, S. An Adjustable Pneumatic Planter with Reduced Source Vibration for Better Precision in Field Seeding. Sensors 2024, 24, 3399. [Google Scholar] [CrossRef] [Scilit]
- Cao, X.Y.; Wang, L.; Liao, Q.X.; Liao, Y.T. Simulation of the mixing component of a horizontal air-assisted centralised wheat metering device. Biosyst. Eng. 2024, 243, 13–26. [Google Scholar] [CrossRef] [Scilit]
- Li, Z.; Zhang, H.; Huang, J.; Lou, C.; Chen, Y.; Liu, L.; Zhang, T.; Chen, L. Design and parameter optimization of air-delivery auxiliary seed guide for pneumatic plate precision rapeseed metering device. Comput. Electron. Agric. 2025, 230, 109840. [Google Scholar] [CrossRef] [Scilit]
- Xing, H.; Cao, X.; Zhong, P.; Wan, Y.; Lin, J.; Zang, Y.; Zhang, G. DEM-CFD coupling simulation and optimisation of rice seed particles seeding a hill in double cavity pneumatic seed metering device. Comput. Electron. Agric. 2024, 224, 109075. [Google Scholar] [CrossRef] [Scilit]
- Liu, W.; Zou, S.; Xu, X.; He, W.; Huang, J.; Zang, Y. Evaluation method of rowing performance and optimization for a UAV-based shot seeding device on rice sowing. Comput. Electron. Agric. 2023, 209, 107718. [Google Scholar] [CrossRef] [Scilit]
- Jin, Z.; Guo, S.; Li, S.; Yu, F.; Xu, T. Research on the rice fertilizer decision-making method based on UAV remote sensing data assimilation. Comput. Electron. Agric. 2024, 216, 108508. [Google Scholar] [CrossRef] [Scilit]
- Xing, H.; Liu, Z.; Huang, T.; Dong, M.; Lv, J.; Tang, F. Wind Vortex Target Control of a Plant Protection UAV Based on a Rice Wind Vortex–Flight Parameter Model. Agriculture 2024, 14, 1413. [Google Scholar] [CrossRef] [Scilit]
- Yuan, P.; Yang, Y.; Wei, Y.; Zhang, W.; Ji, Y. Design and experimentation of rice seedling throwing apparatus mounted on unmanned aerial vehicle. Agriculture 2024, 14, 847. [Google Scholar] [CrossRef] [Scilit]
- Fan, G.; Liu, Z.; Qin, Y.; Long, B.; Li, H.; Li, J. Airflow characteristics of rotorcraft plant protection UAV operating in rice fields. Biosyst. Eng. 2023, 226, 209–222. [Google Scholar] [CrossRef] [Scilit]
- Shi, Q.; Liu, D.; Mao, H.; Shen, B.; Li, M. Wind-induced response of rice under the action of the downwash flow field of a multi-rotor UAV. Biosyst. Eng. 2021, 203, 60–69. [Google Scholar] [CrossRef] [Scilit]
- Liu, X.; Zhang, W.; Fu, H.; Fu, X.; Qi, L. Distribution regularity of downwash airflow under rotors of agricultural UAV for plant protection. Int. J. Agric. Biol. Eng. 2021, 14, 46–57. [Google Scholar] [CrossRef] [Scilit]
- Liu, W.; Zou, S.S.; Xu, X.L.; Gu, Q.Y.; He, W.Z.; Huang, J.; Huang, J.; Lyu, Z.; Lin, J.; Zhou, Z.; et al. Development of UAV-based shot seeding device for rice planting. Int. J. Agric. Biol. Eng. 2022, 15, 1–7. [Google Scholar] [CrossRef] [Scilit]
- Huang, X.; Liu, Y.; Zhu, Y.; Li, W.; Zhang, S. Design and Experiment of Striped Aerial Seeding Device for Rice and Oil Rape. Trans. Chin. Soc. Agric. Mach. 2023, 54, 111–121. [Google Scholar]
- Liao, Y.; You, Y.; Wang, D.; Hui, Y.; Xing, K.; Sun, W. Motion simulation of oat and vetch seeds in distributors based on DEM-CFD. Comput. Electron. Agric. 2025, 233, 110176. [Google Scholar] [CrossRef] [Scilit]
- Ji, H.; Wang, Z.; Qu, T.; Song, X.; Tang, B.; Li, Y.; Ma, L. Grinding Mechanism of Wet Vertical Spiral Stirred Mill Based on DEM-CFD: Role of Grinding Sphere Motion. Particuology, 2025; in press.
- Guzman, L.; Chen, Y.; Landry, H. Coupled CFD-DEM Simulation of Seed Flow in Horizontal-Vertical Tube Transition. Processes 2023, 11, 909. [Google Scholar] [CrossRef] [Scilit]
- Han, D.D.; Liu, L.; Wang, Y.X.; Xu, L.L.; Wu, Z.J.; Wang, Y.C.; Xu, Y. Seeding uniformity measurement and CFD-DEM coupling analysis on the structural features of the seed-guiding tube. Comput. Part. Mech. 2025, 12, 3355–3369. [Google Scholar] [CrossRef] [Scilit]
- Alipoor, M.; Kazemi, S.; Zarghami, R.; Mostoufi, N. CFD-DEM Investigation of the effects of particle size and fluidization regime on heat transfer in fluidized beds. Comput. Part. Mech. 2025, 12, 2037–2058. [Google Scholar] [CrossRef] [Scilit]
- Albasheer, A.H.; Liao, Q.; Wang, L.; Ibrahim, E.J.; Xiao, W.; Li, X. Design and Optimization of Divider Head Geometry in Air-Assisted Metering Devices for Enhanced Seed Distribution Accuracy. Agronomy 2025, 15, 769. [Google Scholar] [CrossRef] [Scilit]
- Liao, Y.; You, Y.; Hui, Y.; Zhang, X.; Wang, D. Mixed Seeds of Oat and Vetch Based on DEM-Fluent Coupling Motion Simulation in a Venturi Tube. Processes 2023, 11, 1095. [Google Scholar] [CrossRef] [Scilit]
- Guebsi, R.; Mami, S.; Chokmani, K. Drones in Precision Agriculture: A Comprehensive Review of Applications, Technologies, and Challenges. Drones 2024, 8, 686. [Google Scholar] [CrossRef] [Scilit]
- Gao, X.; Zhao, P.; Li, J.; Xu, Y.; Huang, Y.; Wang, L. Design and Experiment of Quantitative Seed Feeding Wheel of Air-Assisted High-Speed Precision Seed Metering Device. Agriculture 2022, 12, 1951. [Google Scholar] [CrossRef] [Scilit]
- Chang, J.; Zhang, X. Design and test of one-step centralized type pneumatic seeding system. Trans. CSAE 2011, 27, 136–141. [Google Scholar]
- Ma, Q.; Li, T.; Xu, D.; Wang, Q. Determination of Physical Parameters of Pelleted Rice Seeds and Calibration of Discrete Element Simulation parameters. INMATEH-Agric. Eng. 2025, 75, 490. [Google Scholar] [CrossRef] [Scilit]
- Song, Z.; Li, Q.; Li, F.; Chen, Y.; Ullah, A.; Chen, S.; Wang, W. MP-PIC simulation of dilute-phase pneumatic conveying in a horizontal pipe. Powder Technol. 2022, 410, 117894. [Google Scholar] [CrossRef] [Scilit]
- Zhou, P.; Wu, Y.; Cui, J.; E, D. Numerical Investigation of Wet Coke Particles Drying in a Silo Dryer Using CFD-DEM Simulation. Processes 2025, 13, 3164. [Google Scholar] [CrossRef] [Scilit]
- Cao, Y.; Nguyen, H.B.K.; Aikins, D.; Karim, M.R.; Rahman, M.M. Advances in Coupling Computational Fluid Dynamics and Discrete Element Method in Geotechnical Problems. Geotechnics 2023, 3, 1162–1179. [Google Scholar] [CrossRef] [Scilit]
- Liu, X.; Ding, Y.; Shu, C.; Wang, K.; Liu, W.; Wang, X. Mechanism analysis and test of disturbance and blockage prevention of spiral cone centrifugal fertilizer apparatus. Trans. Chin. Soc. Agric. Mach. 2020, 51, 44–54. [Google Scholar]
- Changbin, H.E.; Chaoyu, D.U.; Chao, W.A.G.; Meihong, W.U.; Yuanwen, Y.E. Reverse Engineering-based Discrete Element Model Construction and Parameter Calibration for Leymus chinensis Seeds. Trans. Chin. Soc. Agric. Mach. 2025, 56, 146–155. [Google Scholar]
- Zhu, Y.; Huang, X.; Yin, C.; Zhu, Q.; Shi, Y.; Li, W. Key parameters determination based on seed movement process simulation for rice strip aerial seeding via UAV. Comput. Electron. Agric. 2025, 237, 110596. [Google Scholar] [CrossRef] [Scilit]
- Huang, X.; Zhang, S.; Zhu, Y.; Liu, Y. Seeding process analysis and test of the air conveying rapeseed aerial seeding device. Trans. CSAE 2022, 38, 31–41. [Google Scholar]
- Wang, G.; Zhang, T.; Lan, Y. Strip fertilization device of unmanned aerial vehicle using a variable-diameter grooved wheel. Trans. CSAE 2025, 41, 13–21. [Google Scholar]

Disclaimer/Publisher’s Note: The statements, opinions and data contained in all publications are solely those of the individual author(s) and contributor(s) and not of MDPI and/or the editor(s). MDPI and/or the editor(s) disclaim responsibility for any injury to people or property resulting from any ideas, methods, instructions or products referred to in the content. |
© 2026 by the authors. Licensee MDPI, Basel, Switzerland. This article is an open access article distributed under the terms and conditions of the Creative Commons Attribution (CC BY) license.