


Abstract
Nature-based Solutions (NbS) such as rolled cover crops are increasingly adopted in rainfed vineyards to reduce soil degradation and drought risk, but their effectiveness depends on local soil physical conditions. We compared spontaneous inter-row vegetation managed by mowing (Control) with a cereal-based rolled cover crop (C-R) in two vineyards of the Oltrepò Pavese (Northern Italy) with contrasting texture, structure, and slope: Canevino (CNV) and Santa Maria della Versa (SMV). From 2021 to 2025, continuous soil moisture monitoring was combined with field measurements of saturated hydraulic conductivity (Ks) and bulk density, interpreted using temporal indicators (MRD, ITS) and a drought index (SWDI) calibrated to field moisture thresholds. During wet phases, average saturation at 50 cm was consistently higher at SMV (about 78 to 84 percent) than at CNV (about 68 to 75 percent). Under water-limited conditions, management contrasts were most evident at SMV: at 50 cm during the post-termination dry phase, saturation remained around 70 percent under C-R versus about 64 percent under the Control, and Ks was higher under C-R (8.32 × 10⁻⁶ m/s in topsoil) than under the Control (7.39 × 10⁻⁶ m/s). At CNV, SWDI at 50 cm indicated a moderate improvement in one agronomic year (median −1.2 under C-R versus −5.3 under the Control in 2021 to 2022), while a full tillage operation in 2024 defined a disturbed phase that was interpreted separately. SWDI occasionally suggested severe drought levels not fully matching field evidence, highlighting the need for site-calibrated reference thresholds in structured fine-textured soils. Overall, soil physical properties set the hydrological envelope, while rolled cover management can enhance buffering and preserve conductive pathways during dry phases; therefore, NbS performance should be evaluated with site-adapted monitoring and cautious inference from temporally autocorrelated time series.
1. Introduction
Climate change is increasing the frequency and severity of extreme weather events, accelerating land degradation processes such as soil erosion, shallow landslides, and drought, particularly in agricultural ecosystems. In hillside areas, such as vineyards on steep slopes, erosion and shallow landslides are often more frequent and severe. This trend is driven by both more intense rainfall events [1] and substantial human modifications of the landscape through agricultural practices [2]. Globally, agricultural land has expanded in recent decades, and satellite data show an approximately 9% increase in total cropland area between 2003 and 2019, primarily from the conversion of natural vegetation [3]. While estimates for sloping or marginal land use are less precise, multiple studies report their increasing use in various regions. In geomorphologically sensitive settings, the geological and physical features of cultivated lands, especially on slopes and under intensive soil management, can increase susceptibility to soil instability (including shallow landslides) and contribute to broader land degradation processes such as elevated erosion rates and reduced soil quality [2,4].
Droughts and heatwaves are also increasingly threatening European vineyards, reducing productivity and undermining long-term sustainability. As reported by Straffelini et al. [5], in July 2022, 18% of the European vineyard area was exposed to extreme drought and high temperatures, with rainfall reduced by 47% and soil moisture by 30%, particularly in Portugal, France, and Italy. These conditions accelerate land degradation, decrease fertility, and diminish biodiversity, making vineyards more vulnerable to further climate extremes [6]. Heat and water stress negatively affect grape yield and quality, altering berry composition and reducing organic acids and anthocyanins, which are crucial for wine typicity [7,8]. In some regions, heatwaves can decrease vineyard yields by as much as 35% [8]. Persistent adverse conditions may eventually compel farmers to abandon sloping or marginal lands, threatening the long-term viability of viticulture in traditional wine-growing areas [5].
To address these issues, Nature-based Solutions (NbS) are increasingly proposed to counter land degradation in vineyards. In this work, NbS is operationally defined as vegetation- and residue-based floor management implemented with low soil disturbance. Accordingly, the two systems tested here, spontaneous inter-row vegetation maintained by mowing (Control) and a cereal-based rolled cover crop that creates an in situ mulch layer (C-R), are treated as NbS options within the same floor-management domain. By contrast, intensive tillage and bare-soil management are considered conventional baselines discussed in the literature, but they are not the focus of the present comparison. Within this scope, NbS-oriented floor management is expected to improve near-surface soil structure and hydraulic functioning, enhance infiltration and aggregation, and reduce runoff and erosion, with potential co-benefits for soil organic matter and biodiversity [9,10,11,12,13]. However, in rainfed vineyards, these effects may be constrained by site-specific soil physical properties and by the risk of competition for water during dry periods, making long-term monitoring essential to interpret both benefits and trade-offs [9,12,13].
In viticulture, NbS-oriented soil management typically combines cover crops with their management through mulching and reduced tillage [9,12]. These approaches are often applied within rows and inter-rows to maintain soil health, sustain productivity, and contribute to carbon storage [9,13]. Conventional systems relying on intensive tillage have received growing criticism because of their negative effects on erosion, organic matter loss, and overall soil degradation [9]. Yet, in rainfed vineyards of hilly regions in northern Italy, cover crops can also compete with vines for water and nutrients, potentially intensifying drought stress [9,13]. Mulching offers an effective way to conserve soil moisture and suppress weeds, although its large-scale application in mature vineyards remains constrained by cost and operational complexity [12]. To address these limitations, temporary winter cover crops are increasingly adopted to improve soil structure and reduce nutrient loss, and recent trials are testing innovative termination methods (such as rolling or under-vine mulching) to create organic mulch directly in the field [14].
Despite the clear benefits of NbS, important research gaps remain. Many studies have measured soil erosion and surface runoff in different soil management systems, confirming that grass cover, mulching, and cover crops help reduce soil loss [11,15]. However, fewer studies have examined how sustainable floor management influences soil water processes and physical properties that underpin soil water regulation, such as infiltration capacity (including saturated hydraulic conductivity), soil water storage, and compaction. Furthermore, long-term soil water monitoring in vineyards remains limited. Short-term studies have provided valuable insights into soil moisture and runoff dynamics, but few have explored multi-year soil–plant–water interactions or used sensor-based monitoring technologies [16,17]. The increasing use of sensors highlights the need for high-frequency, long-term data to capture interannual variability and the effects of extreme weather [18]. In addition, deficit irrigation and precision water management are crucial for climate resilience and efficient resource use in viticulture [19]. Given this context, vineyards on hilly and mountainous terrains remain highly sensitive to hydroclimatic stress, where steep slopes, erodible soils, and intensive cultivation combine to increase erosion risk [20], and where the co-occurrence of intense rainfall and prolonged drought further exposes their vulnerability [21,22]. These conditions highlight the need for sustainable soil and water management supported by continuous monitoring in representative districts of the northern Apennines, such as the Oltrepò Pavese.
We hypothesised that the cereal-based rolled cover crop (C-R), compared with spontaneous groundcover managed by mowing (Control), can enhance soil water regulation during water-limited phases by improving near-surface hydraulic functioning and increasing soil-moisture buffering. We further hypothesised that the magnitude and direction of these responses are site-dependent, reflecting differences in soil texture and hillslope setting. To address this aspect, long-term hydrological monitoring is required, especially to follow the soil’s hydrological response to interannual variability on different soil managements and to the occurrence of extreme events.
In order to address these research gaps, this study investigates how two vineyard floor-management practices, periodic mowing of spontaneous vegetation (Control) and a cereal-based rolled cover crop (C-R) function as NbS to enhance drought resilience, improve soil water regulation, and preserve key soil physical properties. The experimental sites, located in the northern Italian Apennines, are representative of viticultural areas typical of the hilly environments of northern Italy, where soil management plays a key role in regulating water availability under increasing climatic variability (Figure 1a).
Figure 1.
Location and geological map of the study area: (a) regional setting; (b) lithological map.
The specific objectives:
- (a)
- Monitor multi-years (2021–2025) soil moisture dynamics under Control and C-R, capturing interannual variability and extreme wet and dry phases.
- (b)
- Quantify management-related differences in soil hydraulic functioning, including field-based saturated hydraulic conductivity.
- (c)
- Evaluate associated near-surface physical conditions, including soil compaction.
2. Materials and Methods
2.1. The Study Area and Experimental Vineyard Sites
The study was conducted in the Oltrepò Pavese wine district (Lombardy, northern Italy), a predominantly viticultural area on the northwestern edge of the Italian Apennines (Figure 1a). With elevations ranging from 50 to 600 m asl. and slopes between 5° and 45°, the district features a temperate mesothermal climate (Koppen–Geiger classification) and annual precipitation between 680 and 1000 mm, mostly concentrated in spring and autumn [2,23,24,25]. These conditions, together with a mosaic of soil types and topographies, make the area suitable for evaluating soil management strategies aimed at improving drought resilience in rainfed vineyards.
Geologically and pedologically, the Oltrepò Pavese wine district shows significant lithological and soil variability (Figure 1b). In the northern sector, the substrate mainly consists of Mio-Pliocene sandstones, conglomerates, marls, and evaporitic layers. The resulting soils are sandy-to-silty, with thicknesses between 0.2 and 2.5 m, and typically occur on slopes steeper than 20 degrees [24,26,27]. Toward the central area, the bedrock is dominated by Cretaceous flysch and Eocene–Miocene marls and shales, giving rise to finer-textured soils, ranging from silty clay to clay, with thicknesses of 1 to 4 m and being generally found on slopes of 5 to 20 degrees [26,27]. In the southern sector, Mesozoic flysch and mélange formations prevail, with silty clay soils 1 to 2 m thick, located on gentler slopes of about 5 to 15 degrees [24,27].
The area is drained by a dense hydrographic network dominated by the Versa River and its tributaries, which define the morphology of the Versa Valley. This basin exhibits a seasonal hydrological regime, typical of the northern Apennines, characterised by marked variability and rapid response to rainfall events [23,28]. Studies in the Northern Apennines have shown that intense precipitation can significantly affect runoff and sediment transport, highlighting the close interplay among topography, soil features, and land use in erosion-prone environments [27,28].
Land use in the Oltrepò Pavese wine district is characterised by a mix of agricultural and semi-natural systems, with vineyards representing a predominant component of the cultivated landscape (approximately 22%) [23,27]. The area exemplifies a representative hilly viticultural setting of the northern Apennines, where fine-textured soils, sloping terrains, and alternating wet and dry seasons create favourable conditions for testing NbSs. Practices such as cover cropping, organic mulching, and reduced tillage enhance soil moisture, reduce erosion, and support sustainable soil management in suitable pedoclimatic conditions.
Two experimental vineyard sites were selected in the Oltrepò Pavese hills (Figure 1b): Santa Maria della Versa (SMV) and Canevino (CNV), (Figure 2a,b). Both are equipped with automated soil and climate monitoring systems that have continuously recorded soil moisture and weather data since 2021. Although they differ in landform, geology and soil characteristics, the sites are representative of the main physical conditions found in the wine district. They share the same experimental design, allowing a direct comparison between two Nature-based Solution (NbS) practices in the inter-rows:
Figure 2.
Experimental vineyard sites equipped with soil and climate monitoring systems: (a) Santa Maria della Versa (SMV); (b) Canevino (CNV). Inter-rows refer to cover crop with rolling (C-R) and spontaneous grass cover (Control). METEO indicates the weather station.
- C-R (Cereal-based Rolled Cover Crop): as seeded cover crop flattened without tillage.
- Control: spontaneous grass cover managed by mowing.
The monitoring network was established within the LIFE19 ENV/IT/000035—DRIVE LIFE project (“Drought Resilience Improvement in Vineyard Ecosystems”), which aims to enhance drought resilience and water efficiency in vineyards of southern Europe through innovative soil management and sensor-based monitoring tools. Field demonstrations across the Oltrepò Pavese and Colli Piacentini wine districts test and validate these approaches, focusing on improving soil water storage, supporting irrigation scheduling, and promoting ecosystem service benefits. Within this framework, SMV and CNV serve as long-term reference sites for assessing soil–water dynamics and quantifying the hydrological advantages of NbS-based soil management.
The SMV site (Figure 2a) lies in the central part of the district on gentle-to-moderate slopes (5–15°) with a northwest-to-west aspect. The vineyard is planted along the slope with Pinot Noir grafted on SO4 rootstock, approximately 14 years old, trained to unilateral Guyot with vertical shoot positioning (VSP), and spaced at 2.2 × 1.0 m for a planting density of about 4545 vines ha−1 [14]. The underlying Val Lauretta Formation consists of turbiditic sandstones, marls, and marly limestones [29]. Field surveys in 2021 classified the soils as Calcaric Cambisols, with a fine texture (8% sand, 31% silt, 61% clay) and depths ranging from approximately 80–90 cm in the lower slope to 110–120 cm in the upper slope.
Further south, the CNV site (Figure 2b) lies on moderate slopes (10–20°) facing west–northwest. The vineyard is also planted along the slope with Pinot Noir grafted on SO4 rootstock, approximately 15 years old, and follows similar training (unilateral Guyot) and row orientation (NW–SE), with a slightly lower planting density of about 3470 vines ha−1 [14]. The bedrock belongs to the Argille Varicolori Formation, composed of vari-coloured shales, marls, and clay blocks [27,29]. The soils are also Calcaric Cambisols, but with a silty–clay texture (23% sand, 38% silt, 39% clay) and an average depth of approximately 140–150 cm.
While sharing the same soil management practices and experimental layout, SMV and CNV differ in geological substrate, soil texture, and topographic context, allowing the assessment of NbS performance under contrasting physical conditions within the same viticultural framework.
At both vineyards, the inter-rows were sown with a commercial cover crop mixture (HumusFert® mix) exclusively in the C-R treatment, whereas the Control treatment maintained spontaneous vegetation. The C-R approach involved flattening the cereal-based cover crop without tillage to form a continuous mulch layer, while the Control plots were managed through periodic mowing of the spontaneous grass cover.
Each vineyard was equipped with one monitoring point per treatment (two probes per site; four probes in total), vertically installed within the vine row to avoid interference with vineyard operations. Accordingly, the soil-moisture series are interpreted as treatment-associated dynamics at fixed monitored positions within each site, rather than as fully replicated treatment effects at the whole-vineyard scale. This long-term monitoring setup provides a multi-year basis for examining soil–water dynamics and for supporting the indicator-based comparisons presented in the Results, while explicitly acknowledging potential confounding by within-site spatial heterogeneity (e.g., microtopography, traffic patterns, or local soil variability).
A summary of the main site characteristics is shown in Table 1.
Table 1.
Main features of the Santa Maria della Versa (SMV) and Canevino (CNV) experimental vineyards.
2.2. Nature-Based Solutions (NbSs) in the Test Sites
At both experimental vineyards, soil management was based on NbSs designed to enhance soil–water regulation and drought resilience under rainfed conditions typical of viticultural areas of the northern Italian Apennines. These approaches rely on ecological processes such as root reinforcement, organic matter accumulation, and improved soil aggregation to increase infiltration, water retention, and overall soil health [30,31].
Two complementary strategies were applied: rolling of cereal-based cover crop as an active NbS (C-R), and spontaneous grass cover as a passive NbS (Control). The C-R treatment involved mechanically flattening the biomass of cover crops without disturbing the soil, forming a continuous layer of organic mulch that protects the surface from erosion, buffers temperature fluctuations, enhances infiltration, and reduces evaporation losses [14,15,32]. Such residue cover has been shown to improve soil structure and water-holding capacity in vineyard systems, thereby supporting drought resilience while maintaining vine performance comparable to conventional tillage [14,33].
In contrast, the Control consisted of spontaneous vegetation maintained by periodic mowing; because spontaneous weed communities shift with pedoclimatic conditions and management, and no systematic floristic survey was conducted, the Control was defined as mowed spontaneous groundcover rather than by a prescribed botanical composition, typically including mixed grasses and ruderal broadleaf weeds common in vineyard inter-rows (e.g., Lolium spp., Avena spp., Chenopodium spp.). Vegetation structure and projective cover were not quantified; therefore, the Control treatment is described here as a management regime (mowing-maintained herbaceous cover) rather than as a plant community with fixed composition and cover attributes. This low-disturbance system supports soil stability, organic carbon buildup, and biodiversity compared with bare or tilled soils [12,20,34,35,36]. Well-developed root systems reinforce the topsoil and enhance its structure, reducing runoff and erosion while providing ecosystem services such as carbon storage and habitat for pollinators [37,38].
At both vineyards, inter-rows under the C-R treatment were sown in October with the commercial cover crop mixture (HumusFert®, Padana Sementi Elette S.r.l., Italy) composed of cereals (83%), legumes (10%), brassicas (4%), and minor species (3%), including Avena strigosa, Hordeum vulgare, Trifolium incarnatus, Brassica napus, and Phacelia tanacetifolia.
It should be noted that the implementation of the C-R management was not fully consistent across all years. In particular, between 2023 and 2025, the establishment and persistence of the commercial mixture were occasionally limited due to (i) site-specific operational decisions by vineyard owners and (ii) unfavourable climatic conditions affecting germination and early growth. Therefore, C-R is interpreted here as an intended management regime whose effective biomass development could vary among years.
Rolling was carried out in late spring, before the summer season, to maximise mulch formation and minimise evaporation losses [14,37].
The annual management cycle was divided into three hydrological periods:
- (i)
- A wet period (1 October–28 February), during which cover crops grow and develop root systems that enhance infiltration and protect the soil surface.
- (ii)
- A dry pre-termination period (1 March–31 May), when evaporation increases and rolling is performed to conserve soil moisture and create the mulch layer.
- (iii)
- A dry post-termination period (1 June–30 September), when the mulch maintains soil humidity and prevents crusting and erosion.
These active and passive NbSs support water regulation, organic matter accumulation, and long-term soil resilience. Their performance varies according to local soil properties, slope, and climatic conditions [12,33,36,38]. Comparing results from Santa Maria della Versa (SMV) and Canevino (CNV) provides insight into how NbSs perform under contrasting geomorphological and hydrological conditions typical of rainfed vineyards in the northern Apennines.
2.3. Hydrological Monitoring
Continuous hydro-meteorological monitoring was carried out between 2021 and 2025 at both experimental vineyards to quantify soil moisture dynamics and assess how different NbSs affect soil water consumption and availability under rainfed conditions. Each site (SMV and CNV) was equipped with an automated system combining an automatic weather station (MeteoSense 4.0, Netsens s.r.l., Calenzano, FI, Italy) and a capacitance soil-moisture probe (Drill & Drop, Sentek Technologies, Stepney, SA, Australia; measurement depth 0–90 cm). This setup enabled high-resolution observations and aligns with current sensor-based monitoring approaches in viticulture and hydrological studies in Italian vineyards [19,39].
The meteorological station (METEO in Figure 2a,b) recorded rainfall (mm), air temperature (°C), relative humidity (%), solar radiation (W m−2), wind speed (m s−1), and atmospheric pressure (hPa), establishing the local climatic baseline for interpreting soil water dynamics.
Soil moisture and temperature were measured using vertically installed probes placed within the vine rows to avoid interference with vineyard operations. Each device recorded volumetric water content (θ, vol%) and soil temperature (°C) at 10 cm intervals down to 90 cm. According to the manufacturer specifications, volumetric water content measurement accuracy is ±0.03%. At each site, one monitoring point per treatment (Control and C-R) was instrumented (four probes in total across the two vineyards). Therefore, the soil-moisture time series are interpreted as treatment-associated dynamics at the monitored positions within each vineyard, rather than as fully replicated treatment effects at the whole-site scale.
Probes were installed under the vine row between two plants. After installation, the hole was backfilled with the same soil material to maximise sensor–soil contact and minimise air gaps. A field verification of soil water content measurements was performed by comparing probe readings with laboratory water content obtained from undisturbed soil samples collected at the same time and depth. Overall agreement was good across all tests. Site-specific statistics confirmed a better correspondence for SMV (n = 12; R2 = 0.87; MAE = 4.7%), while CNV showed the lowest correspondence (n = 8; R2 = 0.78; MAE = 7.9%). Absolute θ (and derived SD) values may retain site-specific uncertainty, whereas relative temporal patterns are expected to be more robust.
Saturation degree (SD, %), was calculated for each depth using Equation (1):
where is the volumetric soil moisture measured at a given depth, and represents the maximum volumetric soil moisture recorded during the entire observation period, used as an empirical estimate of soil saturation.
Measurements were taken every 10 min, aggregated into daily means, and transmitted via cellular telemetry to a remote server. All data were stored and visualised through the Netsens LiveData cloud platform (Netsens s.r.l., Calenzano, FI, Italy), allowing real-time control and quality assurance, consistent with current practices in sensor-based vineyard monitoring [19].
Occasional data gaps were caused by sensor or power-supply malfunctions, such as battery failures, water infiltration into electronic components, or accidental damage during vineyard operations. Delays in spare-part replacement further contributed to temporary interruptions. All missing records were documented and treated as data gaps. Overall data continuity remained high throughout the 2021–2025 period, with missing values accounting for less than 1% in the CNV Control, 16% in CNV C-R, 9% in the SMV Control, and 28% in SMV C-R. Despite these losses, the dataset remained sufficiently complete for multi-year analysis of soil–water dynamics under contrasting soil management conditions [39].
2.4. Field Measurements of Soil Saturated Hydraulic Conductivity and Soil Bulk Density
In addition to continuous soil moisture monitoring, field measurements of saturated hydraulic conductivity (Ks) were conducted using an Amoozemeter (Ksat, Inc., Raleigh, NC, USA), a compact constant-head permeameter for in situ Ks measurements [40]. The measurements were carried out during the dry season at both experimental vineyards, exclusively within the inter-row areas managed either with spontaneous grass cover or seeded cover crops, which represent the main soil management units affecting infiltration and water storage. The campaigns began in July 2023 and were repeated in April 2024 and July 2024 to capture seasonal variability and evaluate how grass cover and its management influence Ks throughout the year.
Measurements were not conducted during the wet season (October–February) because the inter-row zones under rolled cover crops tended to remain bare or only partially vegetated after termination, while the Control plots maintained continuous spontaneous vegetation cover. These differing surface conditions influenced water infiltration and soil structure, making it difficult to compare the two treatments under equivalent hydrological conditions.
For each site and treatment, Ks was measured at one fixed inter-row position (co-located with the soil-moisture monitoring point) and repeated at two depths (0–20 cm and 20–40 cm). Bulk density was measured in July 2024 using undisturbed cores collected in both inter-row and under-vine zones; two cores were collected per point and averaged to represent bulk density at that position.
This method effectively captures near-saturated hydraulic behaviour in situ, incorporating both vertical and lateral flow. Recent evaluations indicate that, although the Amoozemeter tends to yield slightly lower Ks estimates than ring-based infiltrometers, it provides consistent and reliable results well suited for assessing management-related differences in soil hydraulic properties [41].
To assess near-surface soil compaction under the two floor-management systems, bulk density was measured concurrently with the Ks campaigns. Undisturbed soil cores were collected from the inter- and under-row topsoil (0–20 cm) at both vineyards (SMV and CNV) for both treatments (Control and C-R).
Cylindrical steel rings of known volume were gently driven into the soil, excavated and trimmed, and then sealed for transport to the laboratory. Each core was weighed at field moisture and after oven-drying at 105 °C to constant mass. From these measurements, bulk density () and dry bulk density () were calculated. Dry bulk density was used as the primary indicator of soil compaction, because it reflects changes in pore space and structural degradation with minimal influence of soil water content.
In vineyard systems, dry bulk density () is commonly used as an indicator of near-surface compaction, as higher values are often associated with reduced macroporosity, lower infiltration, and limited root penetration under intensive machinery use and frequent tillage [12,34,38]. In contrast, permanent or well-managed cover crops in the inter-rows are reported to help mitigate compaction and maintain lower and improved soil structure [34,36].
2.5. Assessment of Soil Moisture-Based Drought Resilience
Since the vineyards examined in this study rely exclusively on rainfall and do not employ irrigation, precipitation is the only source of water. To evaluate the system’s capacity to buffer water stress under changing climatic and management conditions, we applied a soil moisture-based resilience framework developed by Eeswaran et al. [42], which uses in situ sensor data to quantify the temporal stability and responsiveness of soil moisture in rainfed agricultural systems.
For each site, depth, agronomic period, and daily saturation degree (SD) time series were also summarised using boxplots. These plots serve as a descriptive tool to visualise the distribution and variability of SD, whereas formal statistical comparisons between sites and treatments were carried out on soil moisture-based drought resilience indicators: Mean Relative Difference (MRD), Variance of Relative Difference (VRD), Index of Temporal Stability (ITS), and Soil Water Deficit Index (SWDI).
2.5.1. Temporal Indicators of Soil Moisture Dynamic
Three soil moisture-based temporal indicators were employed to characterise treatment-associated soil moisture dynamics within each site: the Mean Relative Difference (MRD), the Variance of Relative Difference (VRD), and the Index of Temporal Stability (ITS). MRD summarises the relative wetness or dryness of each management treatment with respect to the daily site mean, VRD describes the dispersion of these relative deviations over time, and ITS integrates MRD and VRD into a single descriptor of temporal consistency. The mathematical definitions of MRD, VRD and ITS are provided in the following subsections. These indicators have been widely applied to evaluate soil-moisture temporal stability in agricultural and hydrological studies, and they are adopted here to support the comparison between floor-management strategies under rainfed conditions [43,44,45,46,47].
2.5.2. Mean Relative Difference
The Mean Relative Difference (MRD), originally introduced by Vachaud et al. [45], was developed within the temporal stability framework to summarise relative soil-moisture behaviour. Along with the Index of Temporal Stability (ITS), it has been widely applied to characterise soil-moisture patterns under varying environmental and management regimes [44,47,48,49]. In this study, MRD was computed for each treatment and period using Equation (2):
where is the volumetric soil moisture (cm3/cm−3) of a given management treatment on day t, and is the mean soil moisture across all management treatments on the same day. Nₜ represents the total number of observations (sampling days) during the growing season. Negative MRD values indicate drier-than-average soil conditions for the given treatment, while positive values reflect wetter-than-average behaviour [44]. Because is computed from the same treatment series (and, in our case, from two treatments only), MRD is interpreted here as a within-site, time-averaged, normalised contrast between the paired treatment series, rather than as an independent or “pure” descriptor of a single treatment. Accordingly, MRD is used as a comparative descriptor within each site and period, not as an absolute indicator of soil-water status or a standalone causal estimate of management effects.
2.5.3. Variance of Relative Difference
The Variance of Relative Difference (VRD) quantifies the temporal variability of each treatment’s deviation from the field mean, offering insight into the consistency of relative moisture dynamics over time [44]. VRD was calculated according to Equation (3):
In this formulation, VRD is a dispersion statistic of the normalised deviations computed at the daily time step (from daily mean θ); therefore, it is interpreted as the persistence/consistency of relative departures within the analysed period, rather than as a general measure of “dynamic stability” of the underlying (potentially non-stationary) soil-moisture time series. To reduce the influence of seasonal drift and regime shifts, MRD and VRD were computed separately by agronomic year and by hydrological period (wet, dry pre-termination, dry post-termination), so that comparisons refer to internally more homogeneous climatic phases. Lower VRD values indicate more consistent relative departures from the site mean over time, whereas higher values indicate less consistent departures within the analysed window [44,47,48,49].
2.5.4. Index of Temporal Stability
The Index of Temporal Stability (ITS) integrates both MRD and VRD to provide a single measure of temporal consistency in relative soil moisture content [43,44,47,49]. ITS was computed using Equation (4):
Treatments with MRD values near zero and low ITS are interpreted as more stable over time [44,47,49]. In this study, particular emphasis was placed on treatments with positive MRD values, as maintaining higher-than-average soil moisture under rainfed conditions is indicative of greater hydrological resilience in vineyard soils.
2.5.5. Evaluation of Treatment Effects on Soil Moisture Deficits
The effectiveness of soil management practices in mitigating soil moisture deficit conditions was evaluated using the Soil Water Deficit Index (SWDI), calculated from volumetric soil moisture at 20 cm and 50 cm. Daily SWDI values were used to describe within-site, treatment-associated differences in soil water deficit dynamics over the season. Statistical comparisons between the paired Control and C-R series were performed using the Wilcoxon signed-rank test, a non-parametric approach for paired observations that does not assume normality; given the temporal autocorrelation of daily time series and the single monitoring point per treatment within each site, p-values are interpreted as evidence of consistent directional differences within each site–depth series rather than as fully independent whole-site inference. Treatments exhibiting higher SWDI values were interpreted as maintaining comparatively better soil water availability under rainfed conditions.
2.5.6. Soil Water Deficit Index
The Soil Water Deficit Index (SWDI), developed by Martínez-Fernández et al. [50], was used to quantify soil water availability and agricultural drought intensity based on soil moisture dynamics within the root zone. The index expresses the ratio between the difference in volumetric soil moisture ( and field capacity (, and the plant’s available water content (, scaled by a factor of ten, as shown in Equation (5):
In this study, and were obtained using a combined approach based on both laboratory measurements and field-based estimators derived from the multi-year time series, following the timeseries logic proposed by Martínez-Fernández et al. [50]. As a laboratory reference, and were first obtained from Soil Water Characteristic Curves measured on undisturbed soil cores using the HYPROP system (METER Group AG, München, Germany) at 20 cm and 50 cm depth. In parallel, alternative effective thresholds were derived directly from the multi-year time series for each site and depth, in order to reduce potential mismatch between laboratory-derived thresholds and in situ water retention in structured fine-textured soils.
For the field-based estimation, daily data were analysed separately for each site and depth using the full monitoring record. Because and were intended to represent reference thresholds at a given site and depth, they were estimated using the pooled time series across both floor-management treatments (Control and C-R). Missing days were excluded from the calculations. This pooling was used to define site-specific reference thresholds, while management effects were assessed through SWDI dynamics and drought-class distributions. As a sensitivity check, treatment-specific threshold estimation was also explored and did not materially alter the resulting drought-class patterns.
Field-based candidate thresholds were derived from simple descriptors of the observed soil moisture range. In particular, we considered:
- i.
- High and low quantiles of the multi-year distribution, specifically the 95th and 5th percentiles.
- ii.
- The lowest values observed during the growing season (April to October) as a conservative proxy for the lower limit reached under field conditions.
- iii.
- A robust proxy for field capacity based on the minimum, across years, of the annual maximum observed during the growing season.
These candidates were combined into four calibration options spanning from laboratory-derived thresholds (HYPROP) to fully field-derived thresholds. Specifically, we defined:
- (1)
- A laboratory-based option, with and taken directly from HYPROP measurements.
- (2)
- A percentile-based option, with equal to the 95th percentile and equal to the 5th percentile of the multi-year distribution.
- (3)
- A mixed option, with given by the minimum of seasonal maxima and by the 5th percentile.;
- (4)
- A fully field-derived option, with equal to the minimum of seasonal maxima and equal to the minimum observed during the growing season.
Across the tested calibration options, the fully field-derived thresholds provided physically plausible values and avoided unrealistically frequent extreme drought classes. This option was therefore adopted for SWDI computation throughout the manuscript.
Calibration performance was evaluated based on three criteria: (i) physical plausibility of thresholds ( > ) and consistency with the ranges obtained from HYPROP measurements; (ii) realism of the resulting SWDI distributions, avoiding systematic saturation or an unrealistically high frequency of extreme drought; and (iii) agreement with field observations of vine conditions during dry phases, used as a qualitative plausibility check and not as an independent calibration target, because no direct physiological measurements were available.
The fully field-derived option provided the best compromise among these criteria and was adopted throughout the manuscript. The final and values used for SWDI computation are summarised in Table 2.
Table 2.
Laboratory-derived and field-derived FC and WP thresholds at 20 and 50 cm depth for SMV and CNV.
Positive SWDI values indicate wet conditions above the adopted field-capacity threshold, values close to zero indicate conditions near field capacity, and negative values indicate increasing soil water deficit. Following Martínez-Fernández et al. [50], SWDI was categorised into drought severity classes: no drought (SWDI > 0), mild (0 > SWDI > −2), moderate (−2 > SWDI > −5), severe (−5 > SWDI > −10), and extreme drought (SWDI ≤−10). To evaluate management effects during water-limited conditions, SWDI was analysed for two fixed dry periods that were consistent across years: dry pre-termination (1 March to 31 May) and dry post-termination (1 June to 30 September). SWDI was computed daily for each site and floor-management treatment and averaged across 20 cm and 50 cm to represent the main active root zone.
2.5.7. Statistical Analysis
Treatment contrasts (Control vs. C-R) were evaluated within each site and depth using paired daily series. Non-parametric Wilcoxon signed-rank tests were applied to compare treatment-associated differences in the derived indicators (MRD/ITS) and SWDI-related summaries by agronomic year and period. Because the dataset consists of time series with temporal autocorrelation and only one monitoring point per treatment within each vineyard, p-values are interpreted as evidence of consistent directional differences within paired series rather than as fully independent whole-site inference. All analyses were performed in R (R Foundation for Statistical Computing, Vienna, Austria; version 2025.05.0+496).
To provide inferential context for SD% patterns, we analysed period-specific SD% summaries using a factorial ANOVA with site, depth, and floor management as fixed factors, including their two-way interactions. Annual medians were used as the analytical units. SD% was analysed after arcsine square-root transformation, and Type III sums of squares were adopted. Post hoc comparisons were restricted to soil depth (Tukey, p < 0.05). Given the single monitored position per treatment at each site, results are interpreted as position-based evidence and used to support, rather than replace, the main indicator-based comparisons.
3. Results
3.1. Climatic Conditions During the Monitoring Period
Meteorological records collected from 2021 to 2025 at the two experimental vineyards, SMV and CNV, highlighted pronounced interannual variation in climatic conditions (Figure 3a,b). All data were recorded by automated weather stations installed on site and checked for consistency against ARPA Lombardia datasets to minimise sensor-related errors. Mean annual air temperature ranged from 14.4 °C to 16.2 °C, with the highest summer peaks occurring in 2022 (up to 38.5 °C), and occasional winter minima dropping below −5 °C. The 2022 season was exceptionally hot and dry, characterised by limited rainfall even during typically wetter periods and prolonged summer drought. These conditions contributed to severe soil moisture depletion and were conducive to vine water stress, consistent with widespread drought events reported across Europe during the same year [5,51].
Figure 3.
Meteorological conditions at the two experimental vineyards from 2021 to 2025: (a) SMV; (b) CNV. Panels show air temperature and precipitation data.
In contrast, the 2023–2024 agronomic year was considerably wetter and milder, with cumulative precipitation reaching approximately 1381 mm at SMV and 1278 mm at CNV, which led to sustained soil saturation during spring and early summer. The following year (2024–2025) remained relatively humid overall 913 mm at SMV and 732 mm at CNV, but featured an irregular rainfall distribution, alternating intense precipitation events with short dry spells.
Over the four-year observation period, total annual rainfall ranged from 492 mm to 1381 mm at SMV and from 566 mm to 1278 mm at CNV (Table 3). On average, SMV received more precipitation than CNV, except during the 2022–2023 period, with site differences varying between 8% and 25%. Seasonal partitioning of precipitation, detailed in Table 3, reveals distinct hydrological regimes: the 2021–2022 and 2022–2023 periods were relatively dry, while 2023–2024 and 2024–2025 were characterised by wetter autumn and spring seasons.
Table 3.
Seasonal distribution of total precipitation during the main agronomic periods at SMV and CNV (2021–2025). Data were recorded by vineyard weather stations and cross-validated with ARPA Lombardia records.
3.2. Hydrologic Monitoring of Management Practices in the Whole Period
The 2021 to 2025 monitoring captured the seasonal and interannual evolution of soil water status at the two vineyards, SMV and CNV, under the two inter-row regimes, Control and rolled cover crop (C-R). Because each site was instrumented with one monitoring point per treatment, SD time series are interpreted as treatment-associated dynamics at the monitored positions. The full multi-year SD trajectories are provided as supporting material (Supplementary Figure S1; panels ordered as (a) SMV Control, (b) SMV C-R, (c) CNV Control, and (d) CNV C-R) and serve as descriptive context for the indicator-based analyses presented in Section 3.4 and Section 3.5.
In 2023 to 2025, the C-R treatment was not always fully effective, because the seeded mixture did not consistently establish and produce a continuous mulch layer. Therefore, results from those years are interpreted considering a variable degree of C-R implementation.
Soil water status, expressed as degree of saturation (SD, %), closely tracked precipitation and showed clear depth-dependent responses. The 10, 50, and 70 cm depths represent the near-surface layer most affected by evaporation and surface management, the main rooting zone, and the deeper storage layer, respectively. Across the years, SMV generally exhibited higher saturation at depth than CNV, consistent with the contrasting soil physical context of the two sites. During wet phases, saturation at 50 cm frequently exceeded 70 percent in both vineyards, while treatment differences were small and not systematic (Supplementary Figure S1).
During the dry pre-termination phase, SD decreased markedly in the surface layer, particularly at CNV, and treatment contrasts remained limited. More distinct differences emerged during the dry post-termination phase at SMV, especially at 50 cm, where SD under C-R was typically higher than under the Control, suggesting a potential increase in hydrological buffering at the monitored position during water-limited conditions. At CNV, treatment-related differences during the dry post-termination phase were smaller and more variable among years, indicating that rainfall timing and local soil conditions modulated management effects.
Overall, SD patterns confirm a strong site control and indicate that treatment contrasts, when present, are most evident during water-limited phases and at intermediate depths. To support this descriptive interpretation, a complementary statistical evaluation was conducted on annual median SD values computed separately for each agronomic year and hydrological period and restricted to the 2020 to 2022 baseline phase (Table 4). The analysis confirmed a dominant site-related contribution to SD variability and a marked depth dependency, while management-related differences (Control vs. C-R) were generally smaller and more variable. Interaction terms indicated that any management signal was not uniform across sites or depths, suggesting that the expression of rolled cover crop effects is modulated by local soil properties and seasonal hydrological conditions. Given the position-based monitoring design (one probe per treatment per site), these outcomes are interpreted as structured within-site contrasts that support the descriptive SD analysis, rather than replicated whole-site causal effects.
Table 4.
ANOVA results for annual median saturation degree (SD, %) in the 2020–2022 baseline period, testing the effects of Site, Depth, Management (Control and C-R), and their two-way interactions. “F” is the ANOVA F-statistic; “signif”. indicates statistical significance (ns: p ≥ 0.05; * p < 0.05; ** p < 0.01).
For this reason, the following sections quantify treatment differences using MRD and ITS (temporal stability index) and SWDI-based drought-class distributions, which provide a more objective and agronomically interpretable comparison than the full SD trajectories [52,53,54,55,56,57].
3.3. Saturated Hydraulic Conductivity Measured with a Constant-Head Permeameter
Saturated hydraulic conductivity (Ks) was measured during three field campaigns (July 2023, April 2024, and July 2024) using a constant-head permeameter to assess differences between floor-management treatments at two depths: topsoil (0–20 cm), the layer most influenced by surface processes and management, and subsoil (20–40 cm), which reflects longer-term structural conditions (Figure 4). At each vineyard, measurements were conducted at one fixed monitoring position per treatment within the inter-row, located close to the instrumented soil-moisture station, and repeated at both depths. Accordingly, Ks results are interpreted as treatment-associated dynamics at fixed monitored positions across time, rather than as fully replicated treatment effects at the whole-site scale. All campaigns were carried out under dry soil conditions to ensure operational consistency and minimise variability related to transient near-saturated surface states.
Figure 4.
Mean hydraulic conductivity (Ks, m s−1) with standard errors indicated at two depths (topsoil: 0–20 cm; subsoil: 20–40 cm) in the two experimental vineyards (CNV and SMV) for the different soil management systems (Control and C-R), measured in July 2023, April 2024 and July 2024.
Across all campaigns, except for July 2024, SMV consistently showed higher mean Ks than CNV. This difference is likely related to the presence of shrinkage cracks and preferential flow paths in the clay-rich soils at SMV, which can enhance macropore connectivity and infiltration capacity despite the fine texture. Similar effects have been documented in clayey vineyard soils of the same region, where water was observed infiltrating to over 1 m depth through desiccation cracks using ERT-based methods [36,58]. In contrast, the silty–clay soils at CNV exhibited fewer shrinkage features and a more compact structure, limiting infiltration and promoting surface runoff.
Overall, Ks values ranged from 2.3 × 10⁻⁶ to 1.29 × 10⁻⁵ m/s. These values fall within the upper 10−6 and lower 10−5 order of magnitude, which is typical of moderately-to-highly permeable loamy soils with well-developed structure [36].
In July 2023, SMV recorded the highest Ks values, especially under rolled cover crop management (C-R), which reached 1.29 × 10⁻⁵ m/s in the topsoil and 9.25 × 10⁻⁶ m/s in the subsoil. CNV, by contrast, showed lower Ks values ranging from 3.22 × 10⁻⁶ to 5.08 × 10⁻⁶ m/s, with reduced subsoil permeability (3.9–4.8 × 10⁻⁶ m/s). These differences reflect inherent site conditions, particularly the role of soil structure and slope [36].
In April 2024, average Ks values decreased slightly at both sites, especially in the 20–40 cm layer. The lowest value was recorded at the CNV Control (2.31 × 10⁻⁶ m/s), while SMV under C-R retained relatively high topsoil conductivity (6.43 × 10⁻⁶ m/s). This seasonal reduction likely results from temporary pore clogging due to winter wetting. Repeated wet–dry cycles may partially occlude macropores with fine particles or biological residues, limiting hydraulic continuity and reducing infiltration capacity [59,60]. At the monitored positions, C-R generally maintained higher Ks than Control, consistent with a mulch-mediated protection of the soil surface and preservation of macropore connectivity [59].
By July 2024, following alternating wet and dry conditions, Ks values generally recovered, particularly in surface layers. At CNV, C-R reached 9.24 × 10⁻⁶ m/s, compared with 7.39 × 10⁻⁶ m/s under the Control, while subsoil values increased to 7.39 × 10⁻⁶ m/s and 1.11 × 10⁻⁵ m/s, respectively. However, at CNV, a full tillage operation was carried out in 2024 following the owner’s management decision. Therefore, the July 2024 CNV measurements are interpreted as a disturbed phase snapshot and are not used to infer long-term treatment effects relative to the pre-disturbance campaigns. This intervention can temporarily increase surface permeability by loosening the soil, while potentially compromising aggregate stability and hydraulic continuity over time, especially below the tilled layer [1,36]. In this context, aggregate stability refers to the soil’s ability to maintain aggregates integrity and hydraulic conductivity under external forces such as rainfall or machinery [36].
At SMV, Ks remained higher under C-R (8.32 × 10⁻⁶ m/s in topsoil and 5.54 × 10⁻⁶ m/s in subsoil) than under the Control (7.39 × 10⁻⁶ m/s and 4.16 × 10⁻⁶ m/s, respectively), consistent with a greater persistence of conductive pathways at the monitored position under rolled cover management. Some variability in Ks was also observed in SMV Control plots across campaigns. Although these were not tilled, the presence of spontaneous vegetation can influence soil structure by root growth and organic inputs, enhancing aggregation and pore formation. This may explain the fluctuations observed, as highlighted in previous research showing that even unmanaged vegetated surfaces can significantly affect soil physical properties [36].
Overall, across the fixed monitoring positions, C-R tended to show higher Ks than the Control in most campaigns and depths, consistent with the capacity of cover-crop-based systems to preserve macropore networks and mitigate compaction; however, given the limited spatial replication, these results are presented as position-based mechanistic evidence and as a complement to the multi-year soil-moisture indicators, rather than as whole-site causal estimates [1,36].
3.4. Bulk Density Under Different Floor-Management Systems
Bulk density () and dry density () were measured in July 2024, together with the field saturated hydraulic conductivity (Ks) campaign, to characterise near-surface soil physical condition under the two floor-management systems. At each sampling position, undisturbed cores were collected in both the inter-row and under-vine zones. Duplicate cores were taken per position, and their mean value was used to represent bulk density at that position. It is worth noting that the measures of these two parameters in CNV followed a full tillage operation performed by the owner of the vineyard at the beginning of 2024.
At SMV, sampling included four positions in C-R (two inter-row and two under-vine) and five positions per zone in the Control (five inter-row and five under-vine). At CNV, four positions per treatment were sampled (two inter-row and two under-vine per treatment). Given the position-based design and limited sample size, and are reported as descriptive supporting evidence within each site rather than as a standalone basis for inferential statistical comparison between treatments.
Figure 5 highlights a clear site contrast, with higher density levels in CNV than in SMV. Within CNV, Control positions tended to show higher and especially higher than C-R, a pattern consistent with reduced macroporosity and the lower Ks observed under more compacted conditions. In SMV, treatment distributions largely overlapped, suggesting that any management-related differentiation in near-surface compaction was small relative to within-site variability at the sampled positions. Overall, these measurements support the interpretation of Ks and soil-moisture dynamics by indicating that the physical response of the near-surface layer to management was more apparent in CNV than in SMV. This is consistent with the literature reporting that inter-row vegetation or mulching can mitigate traffic-related compaction and help preserve infiltration capacity in mechanised vineyards [34,38,61], although responses are strongly site-dependent [12,15,58].
Figure 5.
Total bulk density () (blue) and dry bulk density () (orange) in the inter-row topsoil of the two experimental vineyards (CNV and SMV) under the Control and rolled cover crop (C-R) management. Boxplots show median, interquartile range, and outliers for each treatment.
3.5. Result of Soil Moisture-Based Drought Resilience
3.5.1. Temporal Stability and Soil Moisture Distribution
The analysis of the Mean Relative Difference (MRD) and the Index of Temporal Stability (ITS) from 2021 to 2025 highlighted consistent patterns in soil moisture dynamics at both experimental vineyards (SMV and CNV) under the two management treatments (Control and C-R). Because MRD and ITS are computed relative to the site mean at each time step, they are interpreted here as indicators of within-site, treatment-associated deviations and their temporal consistency, rather than as absolute soil-water status indicators. These indices, together with the Soil Water Deficit Index (SWDI), were used as complementary descriptors of drought response based on soil moisture behaviour across the monitored topsoil and subsoil layers.
Across both sites, the alternation of dry and wet agronomic years influenced the magnitude and persistence of soil moisture variability. Across site–depth–year combinations with paired treatment data, ITS ranged from approximately 0.024 to 0.559 (Table 5). Indicators for CNV 2024–2025 are not interpreted in terms of temporal stability because the paired treatment comparison was not available following the 2024 disturbance.
Table 5.
MRD, ITS, median SWDI and Wilcoxon p-values for the Control and C-R at CNV and SMV by year and soil depth.
At CNV, MRD in the topsoil (20 cm) was markedly positive under the Control and negative under C-R during the drier agronomic years 2021–2022 and 2022–2023 (approximately ±0.50), while MRD values were closer to neutral under wetter conditions (e.g., 2023–2024). ITS values at CNV generally remained in the lower-to-moderate range (approximately 0.07–0.33), with larger values in the topsoil during dry years. Following the full tillage operation carried out at CNV in 2024 (owner decision), the 2024–2025 period is treated as a disturbed phase; therefore, CNV indicators for 2024–2025 are not used to infer continuity of treatment-associated patterns relative to pre-disturbance years.
At SMV, both treatments showed larger MRD amplitudes and generally higher ITS values than CNV, particularly under C-R. MRD values under C-R were negative (down to approximately −0.37 in the topsoil and −0.34 in the subsoil during 2021–2022 and 2022–2023), indicating relatively drier conditions compared to the site mean. These behaviours are consistent with the site-specific physical setting at SMV, where crack formation and preferential pathways can increase vertical connectivity and drainage dynamics even under fine texture, thereby shaping treatment contrasts across depths [52,60].
The overall behaviour of MRD, ITS and SWDI, together with paired-series Wilcoxon results, is summarised in Table 5. Given the single monitoring point per treatment at each site and the strong temporal autocorrelation of daily soil moisture series, the Wilcoxon signed-rank test is used here as an exploratory tool to assess the consistency and direction of treatment-associated differences within paired time series, rather than as a formal test of independent treatment effects. Within these constraints, Table 5 shows that treatment-associated contrasts were more frequently expressed during dry years and in specific layers, supporting the combined use of MRD, ITS and SWDI to describe drought response and temporal consistency in rainfed vineyards [14,44,49,53,62]. Figure 6a,b provides a descriptive overview of MRD and ITS dynamics, while Table 5 reports the corresponding values.
Figure 6.
Temporal trajectories of drought resilience indicators (MRD and ITS) for the Control and rolled cover crop (C-R) treatments at the two experimental vineyards (CNV and SMV), shown at two depths: (a) 20 cm; (b) 50 cm. Trends are presented across agronomic years and hydrological periods.
3.5.2. Seasonal Water Deficit Response
SWDI values shown here were computed using the field-derived FC and WP thresholds described in Section 2.5.6. The Soil Water Deficit Index (SWDI) complemented MRD and ITS by describing seasonal drought response in terms of drought-severity classes, providing an agronomically intuitive representation of drought-risk structure [50]. Figure 7 summarises the interannual distribution of SWDI classes computed from daily soil moisture at 20 and 50 cm (arithmetic mean) during the dry phases (dry pre-termination and dry post-termination) and reports the full class distribution; the text focuses on the percentage of severe-to-extreme deficit days (SWDI ≤ −5) across the combined dry phase as a concise quantitative indicator of drought risk.
Figure 7.
Interannual distribution of SWDI drought-severity classes computed from daily soil moisture at 20 and 50 cm (arithmetic mean) during the dry phases (dry pre-termination: 1 March–31 May; dry post-termination: 1 June–30 September) for each agronomic year (2021–2022 to 2024–2025) at CNV and SMV under the Control and C-R. SWDI classes follow Martínez-Fernández et al. [50]: no drought (>0), mild (0 to −2), moderate (−2 to −5), severe (−5 to −10), extreme (≤−10). Stacked bars show the percentage of valid days within the selected dry phases; years with insufficient valid-day coverage are omitted.
These interannual SWDI patterns should be interpreted considering that the effective development of C-R biomass and mulch varied among years, particularly between 2023 and 2025, potentially reducing the magnitude and consistency of treatment contrasts. In addition, SWDI responses reflect not only management effects but also the interaction between soil physical properties and seasonal climatic forcing, which governs the timing and persistence of water-limited conditions.
At CNV, the proportion of severe-to-extreme deficit days under the Control increased from 4.7% (2021–2022) to 25.7% (2022–2023) and reached 35.2% (2024–2025). Under C-R, severe-to-extreme deficit days decreased from 65.9% (2021–2022) and 54.7% (2022–2023) to 26.6% (2023–2024); the dry-phase summary for 2024–2025 is not reported for CNV–C-R due to insufficient valid-day coverage in the dry-phase record and for the full tillage disturbance of the owner in 2024. This shift indicates a more buffered drought-risk structure under rolled cover management during the undisturbed monitoring phase, consistent with improved infiltration continuity and moisture regulation at the monitored position [50,63].
At SMV, the Control showed 0.0% severe-to-extreme deficit days in 2021–2022, followed by 14.8% (2022–2023) and 7.5% (2023–2024), with a marked increase to 30.5% (2024–2025). Under C-R, severe-to-extreme deficit days decreased from 64.2% (2021–2022) to 49.7% (2022–2023) and were 0.0% in 2023–2024 and 2024–2025; however, these latter estimates are based on reduced data coverage and should therefore be interpreted with caution. In this context, SWDI patterns at SMV reflect an active water-use regime, where soil moisture is frequently drawn below field capacity without necessarily implying functional stress, consistent with the temporal stability analysis and with previous interpretations of soil moisture dynamics in structured clay soils [50,63].
Separating the dry phases indicates that severe-to-extreme deficits were largely concentrated in the dry post-termination period, whereas dry pre-termination under the Control showed 0% severe-to-extreme days at both sites in all years. For example, severe-to-extreme days reached 61.0% in CNV–Control and 67.6% in SMV–Control during the dry post-termination phase of 2024–2025, highlighting the importance of post-termination conditions in shaping drought-risk structure.
Overall, SWDI class distributions provide a complementary, agronomically interpretable summary of interannual drought-risk structure and reinforce the temporal stability analysis by highlighting when and where treatment contrasts are most evident during water-limited phases. Following Martínez-Fernández et al. [50], SWDI classes are interpreted here as a comparative descriptor within each site and agronomic year rather than as an absolute diagnosis of vine water stress, particularly in structured fine-textured soils where field-derived thresholds better represent effective water availability [50,63].
4. Discussion
This study examined how two vineyard floor-management systems, natural grass cover (Control) and rolled cover crops (C-R), influence soil moisture dynamics under rainfed conditions in the Oltrepò Pavese. The two experimental sites (CNV and SMV) differ in soil texture, structure, and topographic setting; therefore, site properties are interpreted as the primary drivers of baseline hydrological behaviour, whereas floor management is expected to modulate the expression of moisture regimes over time rather than override dominant site control. By integrating temporal stability indicators (MRD, VRD, ITS) with a drought-severity descriptor (SWDI), we evaluated how management-associated contrasts emerge within each site under variable climatic forcing, with particular attention to water-limited phases [33,64,65,66].
Across years, climatic forcing controlled the timing and persistence of dry phases, but the two sites expressed distinct modes of soil-water regulation consistent with their soil physical setting. The conservative versus functional regime distinction is therefore attributed primarily to site-specific soil physical properties that define the hydrological envelope (texture, structure, and redistribution pathways), while floor management modulates the expression of this envelope, particularly during water-limited phases, without overriding dominant site control [17,57,64]. This framing is important to avoid over-translating site-dependent regimes into universal management effects [10,33].
The statistical evaluation of annual median saturation degree (SD) for the 2020–2022 baseline period provides structured support to the descriptive interpretation of soil moisture patterns. Across hydrological phases, depth was generally the dominant source of variability, confirming strong vertical organisation of soil water within the profile. SD was systematically lower in the surface layer than at 50 and 70 cm, consistent with the greater sensitivity of near-surface conditions to evaporative losses and short-term atmospheric forcing, whereas deeper layers behaved as more persistent storage compartments.
Although the main effect of Site was not consistently expressed as a uniform shift in SD magnitude, the significant Site by Depth interaction indicates that the vertical SD profile differed between SMV and CNV. This supports the interpretation that local soil texture and structure modulate redistribution pathways and the depth at which water is retained, rather than acting as a simple site-wide offset.
Management differences between the Control and rolled cover crop (C-R) were detectable but secondary to depth effects and were not uniform across sites, as shown by the significant Site by Management interaction. In addition, the Depth by Management interaction indicates that management-related contrasts varied across the profile, with clearer differentiation in some phases and depths than others. Overall, these interaction patterns are consistent with a context-dependent expression of rolled cover crop effects, conditioned by local soil properties and seasonal hydrological conditions, rather than a generalised management response.
Within the position-based monitoring design adopted here, this SD-based analysis is interpreted as evidence of structured within-site contrasts that complement the descriptive SD trajectories, not as replicated whole-vineyard causal effects. Subsequent sections therefore emphasise relative, indicator-based metrics (MRD, ITS and SWDI) to provide a more process-oriented and agronomically interpretable assessment of drought response under contrasting management regimes.
Because the analysis relies on continuous time series at fixed monitored positions, inferential limits must be stated explicitly. Each site includes one monitoring position per treatment; therefore, treatment contrasts are interpreted as position-based, within-site comparisons that may also reflect local micro-heterogeneity and operational history, and they are not intended as replicated whole-vineyard causal effects [57]. In 2023 to 2025, the intended C-R regime was not consistently achieved because the seeded mixture did not always establish and produce a continuous mulch layer. Therefore, treatment-associated contrasts in those years should be interpreted as the response of an intended NbS practice under incomplete or climatically constrained implementation, rather than as a fully developed rolled-mulch system. In addition, MRD, VRD, and ITS are computed from daily normalisation to the same-day site mean; consequently, they are interpreted as within-site descriptors of consistent directional contrasts between paired treatment series, not as autonomous treatment properties. In practical terms, the daily reference is formed by the same series under comparison, so each treatment metric is partially linked to the behaviour of the other treatment. Moreover, VRD is a dispersion statistic of normalised deviations; for seasonal, non-stationary time series, it can conflate short-term fluctuations with seasonal drift or event-driven regime shifts. For this reason, VRD is discussed as an indicator of persistence or consistency of relative departures within the analysed window rather than a general measure of dynamic stability of the underlying process. Accordingly, interpretation prioritises coherence between (i) the direction and persistence of relative contrasts (MRD and ITS), (ii) drought-class distributions during fixed dry windows (SWDI), and (iii) supporting soil physical evidence (Ks and bulk density) at the monitored positions, rather than relying on hypothesis testing alone [43,44,45,50,59]. Because capacitance probes can be sensitive to salinity and air gaps, and even when calibration/verification procedures are applied, some uncertainty in absolute water contents may persist; therefore, the results are interpreted with greater confidence for relative temporal patterns and paired within-site contrasts than for absolute drought severity [57,62].
Within these constraints, results indicate that management effects were conditional on local soil physical setting. At CNV, C-R was associated with dampened short-term fluctuations and reduced drought-risk extremes in the monitored root-zone layers, consistent with mulch-mediated moderation of evaporative losses and protection of near-surface structure [12,33,37,59]. SWDI class distributions supported this interpretation, showing a lower frequency of severe-to-extreme deficit days under C-R during the undisturbed monitoring phase [50]. These outcomes are consistent with previous findings indicating that cover-based systems can improve soil physical functioning and reduce hydrological extremes in sloping vineyards, although responses remain site-dependent [10,33,34,36]. At SMV, the clay-rich structured soil expressed a more dynamic regime, where vertical redistribution and preferential pathways can shape treatment contrasts across depths; therefore, management-associated differences were most evident during water-limited phases, but their magnitude and direction were constrained by site-specific structure-driven connectivity [17,57,64]. In this interpretative framework, SWDI provides a comparative summary of drought-risk structure within each site and year rather than an absolute diagnosis of vine water stress [50].
A major limitation concerns drought-index parameterisation in structured fine-textured soils. Laboratory-derived FC and WP thresholds reflect standardised retention conditions and may not fully represent effective water storage and operational water availability under field conditions where aggregation, cracking, preferential flow, and hysteresis are important [59]. This can generate SWDI classifications that do not align with qualitative vineyard observations when static laboratory thresholds are applied. For this reason, SWDI was computed using site- and depth-specific field-derived FC and WP thresholds estimated from the multi-year sensor record, selected among alternative calibration options to avoid implausible threshold values and unrealistically frequent extreme drought classes. Under this framework, SWDI classes are interpreted as a comparative descriptor of drought-risk structure within each site and agronomic year rather than as an absolute diagnosis of vine water stress, particularly because no direct physiological measurements were available for independent validation [50,57]. This choice addresses the discrepancy previously observed when laboratory thresholds were applied to structured fine-textured soils and provides an agronomically interpretable summary of when and where water-limited conditions are most persistent [33].
These site-dependent regimes highlight the need to decouple site effects from treatment effects when interpreting the performance of Nature-based Solutions. Soil texture and structure define the hydrological envelope within which a given practice operates, while rolled cover management can amplify or dampen the expression of moisture variability depending on local conditions. Similar context-dependence of cover-crop effects on soil water dynamics has been reported across vineyards with contrasting textures and rainfall patterns [10,33,36].
The full tillage operation at CNV in 2024 introduces a major confounding factor for long-term continuity and must be treated as a separate disturbed phase rather than pooled into the multi-year resilience assessment. Therefore, the post-tillage period is not used as a direct continuation of pre-disturbance treatment-associated contrasts, and the 2024 to 2025 CNV series is discussed as a post-disturbance regime in which comparability with earlier years is limited. At the same time, this episode provides mechanistic support for the sensitivity of the monitoring framework to mechanical disruption, consistent with evidence that tillage and machinery traffic can alter soil structure and hydraulic functioning in sloping vineyards by affecting infiltration pathways and near-surface porosity [20,61].
Finally, statistical comparisons are interpreted conservatively. Given temporal autocorrelation and limited spatial replication, paired Wilcoxon tests are treated as evidence of consistent directional differences within paired series and analysis windows rather than formal whole-site inference. More generally, the indicator-based approach intentionally summarises complex non-stationary trajectories into interpretable descriptors of directionality and drought-risk structure; however, it does not explicitly model temporal autocorrelation and other shared forcing, such as seasonal trends [43,44]. Future work should complement these descriptors with dedicated timeseries or hierarchical models that account for temporal dependence and non-stationarity, and with spatial replication to separate management effects from micro-heterogeneity [57].
Overall, the combined use of MRD and ITS with SWDI provides a practical sensor-based approach to describe within-site drought-risk structure and the temporal consistency of soil moisture dynamics under contrasting floor management [45,50,62]. The results indicate that the effectiveness of NbS-based practices is inherently site-specific: rolled cover management can reduce drought-risk extremes and dampen short-term variability during water-limited phases, but the baseline regime is largely set by soil physical properties and can be strongly altered by mechanical disturbance [33,59,61,64]. These insights support adaptive strategies for rainfed vineyards in the northern Apennines, where drought and intense rainfall can occur within the same growing season [5,7,8].
5. Conclusions
Across the 2021–2025 monitoring period, climate variability and site-specific soil physical properties primarily controlled the baseline soil water regime and conditioned management effects. The clay-rich, structured SMV site expressed a more dynamic regime dominated by redistribution processes, whereas CNV showed a more conservative regime with slower depletion and dampened variability. Within this site-defined envelope, rolled cover crops (C-R) generally supported more buffered soil moisture dynamics during water-limited phases, with a shift toward milder drought-risk classes at CNV during the undisturbed (pre-disturbance) period, while SMV maintained a higher drought-risk structure despite greater subsoil moisture, indicating that resilience can arise through different mechanisms depending on soil physical setting.
Field measurements were consistent with these patterns: saturated hydraulic conductivity was higher under C-R at SMV, whereas CNV was more sensitive to mechanical disturbance. The full tillage operation in 2024 at CNV defines a separate disturbed phase and represents a major confounding factor; therefore, the post-tillage period should not be pooled with the undisturbed multi-year assessment when interpreting treatment-associated contrasts. Because indicators are based on one monitoring position per treatment and daily observations are temporally autocorrelated, conclusions are framed as within-site evidence rather than replicated whole-vineyard causal effects.
Overall, C-R can contribute to enhanced drought resilience in sloping rainfed vineyards by moderating soil moisture variability and supporting consistent hydrological functioning, but effectiveness is inherently site-specific and sensitive to mechanical disturbance. Future work should add spatial replication and link soil moisture indicators to vine physiological and yield indices to validate drought-risk thresholds and agronomic relevance.
Supplementary Materials
The following supporting information can be downloaded at https://www.mdpi.com/article/10.3390/agriculture16030316/s1. Figure S1: Temporal evolution of saturation degree, expressed as %, at three depths (10 cm = yellow, 50 cm = green, 70 cm = black) in the two experimental vineyards (2021–2025): (a) SMV–Control; (b) SMV–C-R; (c) CNV–Control; (d) CNV–C-R.
Author Contributions
Conceptualization, A.G. and C.M.; methodology, A.G.; software, A.G.; validation, A.G., M.G. (Matteo Giganti) and V.V.; formal analysis, A.G.; investigation, A.G.; resources, C.M. and A.V.; data curation, A.G.; writing—original draft preparation, A.G.; writing—review and editing, M.B., M.G. (Matteo Giganti), V.V., M.G. (Matteo Gatti), S.P. and A.V.; visualisation, A.G.; supervision, C.M. and A.V.; project administration, C.M.; funding acquisition, C.M. All authors have read and agreed to the published version of the manuscript.
Funding
This research was funded by the Italian Ministry of University and Research (MUR) through the National Recovery and Resilience Plan (PNRR), in accordance with the NextGenerationEU initiative (DM 117-118/2023) and supported by seven municipalities of the Oltrepò Pavese, promoters and stakeholders of the project (COMUNE DI CANNETO PAVESE—Prot 0001178 del 14/04/2023 Tit III Cl 15 Fasc 5). The study also received funding from the NODES project—Nord Ovest Digitale e Sostenibile (Ecosystem for Innovation, M4C2—Investment 1.5, CUP: E13C22001860001) and from the European Union LIFE Programme under the DRIVE LIFE project (grant agreement No. LIFE19 ENV/IT/000035). Additional support was provided by seven municipalities of the Oltrepò Pavese, promoters and stakeholders of the project. The Article Processing Charge (APC) was funded by the University of Pavia—Department of Earth and Environmental Sciences.
Data Availability Statement
The raw data supporting the conclusions of this article will be made available by the authors on request.
Acknowledgments
The authors sincerely thank the local winegrowers who supported the research by providing access to their vineyards and technical assistance throughout the experimental period. In particular, we gratefully acknowledge Enrico Ottina (Santa Maria della Versa, Pavia; SMV site) and Maurizio Piaggi (Canevino, Pavia; CNV site) for kindly making their vineyard plots available for continuous monitoring and hydrological assessments. The authors also thank the municipalities of the Oltrepò Pavese area for their active collaboration and support during the study.
Conflicts of Interest
The authors declare no conflicts of interest.
Abbreviations
The following abbreviations are used in this manuscript:
| NbSs | Nature-based Solutions |
| SMV | Santa Maria della Versa experimental vineyard |
| CNV | Canevino experimental vineyard |
| SD | Saturation degree |
| SWDI | Soil Water Deficit Index |
| MRD | Mean Relative Difference |
| VRD | Variance of Relative Difference |
| ITS | Index of Temporal Stability |
| Ks | Saturated hydraulic conductivity |
| Bulk density (total) | |
| Dry bulk density | |
| C-R | Rolled cover crop (conservation management) |
| FC | Field capacity |
| WP | Wilting point |
| EU | European Union |
References
- Biddoccu, M.; Guzman, G.; Capello, G.; Thielke, T.; Strauss, P.; Winter, S.; Zaller, J.; Nicolai, A.; Cluzeau, D.; Popescu, D.; et al. Evaluation of soil erosion risk and identification of soil cover and management factor (C) for RUSLE in European vineyards with different soil management. Int. Soil Water Conserv. Res. 2020, 8, 337–353. [Google Scholar] [CrossRef] [Scilit]
- Visconti, F.; López, R.; Olego, M.Á. The Health of Vineyard Soils: Towards a Sustainable Viticulture. Horticulturae 2024, 10, 154. [Google Scholar] [CrossRef] [Scilit]
- Pazhanivelan, S.; Lad, S.; Selvakumar, S.; Ravikumar, V.; Ramesh, A.; Karale, O.; Jadhav, R. Assessment of Climate Change on Soil Erosion Using Geospatial Techniques: A Review. Int. J. Environ. Clim. Change 2025, 15, 191–209. [Google Scholar] [CrossRef] [Scilit]
- Xu, Y.; Luo, L.; Guo, W.; Jin, Z.; Tian, P.; Wang, W. Revegetation Changes Main Erosion Type on the Gully–Slope on the Chinese Loess Plateau Under Extreme Rainfall: Reducing Gully Erosion and Promoting Shallow Landslides. Water Resour. Res. 2024, 60, e2023WR036307. [Google Scholar] [CrossRef] [Scilit]
- Straffelini, E.; Wang, W.; Tarolli, P. European vineyards and their cultural landscapes exposed to record drought and heat. Agric. Syst. 2024, 219, 104034. [Google Scholar] [CrossRef] [Scilit]
- Cataldo, E.; Fucile, M.; Mattii, G. A Review: Soil Management, Sustainable Strategies and Approaches to Improve the Quality of Modern Viticulture. Agronomy 2021, 11, 2359. [Google Scholar] [CrossRef] [Scilit]
- Leeuwen, C.; Destrac-Irvine, A.; Dubernet, M.; Duchêne, É.; Gowdy, M.; Marguerit, E.; Pieri, P.; Parker, A.; Resseguier, L.; Ollat, N. An Update on the Impact of Climate Change in Viticulture and Potential Adaptations. Agronomy 2019, 9, 514. [Google Scholar] [CrossRef] [Scilit]
- Fraga, H.; Molitor, D.; Leolini, L.; Santos, J. What Is the Impact of Heatwaves on European Viticulture? A Modelling Assessment. Appl. Sci. 2020, 10, 3030. [Google Scholar] [CrossRef] [Scilit]
- López-Vicente, M.; Calvo-Seas, E.; Álvarez, S.; Cerdà, A. Effectiveness of Cover Crops to Reduce Loss of Soil Organic Matter in a Rainfed Vineyard. Land 2020, 9, 230. [Google Scholar] [CrossRef] [Scilit]
- Zalai, M.; Bujtás, O.; Sárospataki, M.; Dorner, Z. Grassy and Herbaceous Interrow Cover Crops in European Vineyards: A Review of Their Short-Term Effects on Water Management and Regulating Ecosystem Services. Land 2025, 14, 1526. [Google Scholar] [CrossRef] [Scilit]
- Stanchi, S.; Zecca, O.; Hudek, C.; Pintaldi, E.; Viglietti, D.; D’Amico, M.; Colombo, N.; Goslino, D.; Letey, M.; Freppaz, M. Effect of Soil Management on Erosion in Mountain Vineyards (N-W Italy). Sustainability 2021, 13, 1991. [Google Scholar] [CrossRef] [Scilit]
- Abad, J.; De Mendoza, I.; Marín, D.; Orcaray, L.; Santesteban, L. Cover crops in viticulture. A systematic review (1): Implications on soil characteristics and biodiversity in vineyard. OENO One 2021, 55, 295–312. [Google Scholar] [CrossRef] [Scilit]
- Winter, S.; Bauer, T.; Strauss, P.; Kratschmer, S.; Paredes, D.; Popescu, D.; Landa, B.; Guzmán, G.; Gómez, J.; Guernion, M.; et al. Effects of vegetation management intensity on biodiversity and ecosystem services in vineyards: A meta-analysis. J. Appl. Ecol. 2018, 55, 2484–2495. [Google Scholar] [CrossRef] [Scilit]
- Cunial, L.; Diti, I.; Bonini, P.; Patelli, R.; Gatti, M.; Cola, G.; Bordoni, M.; Nguyen, T.; Meisina, C.; Confalonieri, R.; et al. Novel termination techniques of winter cover crops in the vineyard: Effects on physiology and performance of Pinot Noir and Malvasia di Candia aromatica grapevines. Eur. J. Agron. 2025, 164, 127514. [Google Scholar] [CrossRef] [Scilit]
- Dugan, I.; Bogunović, I.; Pereira, P. Soil management and seasonality impact on soil properties and soil erosion in steep vineyards of north-western Croatia. J. Hydrol. Hydromech. 2023, 71, 91–99. [Google Scholar] [CrossRef] [Scilit]
- Tardáguila, J.; Stoll, M.; Gutiérrez, S.; Proffitt, T.; Diago, M. Smart applications and digital technologies in viticulture: A review. Smart Agric. Technol. 2021, 1, 100005. [Google Scholar] [CrossRef] [Scilit]
- Krevh, V.; Groh, J.; Weihermüller, L.; Filipović, L.; Defterdarović, J.; Kovač, Z.; Magdić, I.; Lazarević, B.; Baumgartl, T.; Filipović, V. Investigation of Hillslope Vineyard Soil Water Dynamics Using Field Measurements and Numerical Modeling. Water 2023, 15, 820. [Google Scholar] [CrossRef] [Scilit]
- Moresi, F.; Cirigliano, P.; Rengo, A.; Brunori, E.; Biasi, R.; Mugnozza, S.; Maesano, M. Monitoring Abiotic Stressors in Rainfed Vineyards Involves Combining UAV and Field Monitoring Techniques to Enhance Precision Management. Remote Sens. 2025, 17, 803. [Google Scholar] [CrossRef] [Scilit]
- Finco, A.; Bentivoglio, D.; Chiaraluce, G.; Albéri, M.; Chiarelli, E.; Maino, A.; Mantovani, F.; Montuschi, M.; Raptis, K.; Semenza, F.; et al. Combining Precision Viticulture Technologies and Economic Indices to Sustainable Water Use Management. Water 2022, 14, 1493. [Google Scholar] [CrossRef] [Scilit]
- Bagagiolo, G.; Biddoccu, M.; Rabino, D.; Cavallo, E. Effects of rows arrangement, soil management, and rainfall characteristics on water and soil losses in Italian sloping vineyards. Environ. Res. 2018, 166, 690–704. [Google Scholar] [CrossRef] [Scilit] [PubMed]
- Crespo, N.; Pádua, L.; Santos, J.; Fraga, H. Satellite remote sensing tools for drought assessment in vineyards and olive orchards: A systematic review. Remote Sens. 2024, 16, 2040. [Google Scholar] [CrossRef] [Scilit]
- Romero, P.; Navarro, J.; Ordaz, P. Towards a sustainable viticulture: The combination of deficit irrigation strategies and agroecological practices in Mediterranean vineyards. A review and update. Agric. Water Manag. 2022, 259, 107216. [Google Scholar] [CrossRef] [Scilit]
- Bordoni, M.; Corradini, B.; Lucchelli, L.; Valentino, R.; Bittelli, M.; Vivaldi, V.; Meisina, C. Empirical and physically based thresholds for the occurrence of shallow landslides in a prone area of Northern Italian Apennines. Water 2019, 11, 2653. [Google Scholar] [CrossRef] [Scilit]
- Fusco, F.; Bordoni, M.; Tufano, R.; Vivaldi, V.; Meisina, C.; Valentino, R.; Bittelli, M.; De Vita, P. Hydrological regimes in different slope environments and implications on rainfall thresholds triggering shallow landslides. Nat. Hazards 2022, 114, 907–939. [Google Scholar] [CrossRef] [Scilit]
- Bordoni, M.; Vivaldi, V.; Ciabatta, L.; Brocca, L.; Meisina, C. Temporal prediction of shallow landslides exploiting soil saturation degree derived by ERA5-Land products. Bull. Eng. Geol. Environ. 2023, 82, 308. [Google Scholar] [CrossRef] [Scilit]
- Zizioli, D.; Meisina, C.; Valentino, R.; Montrasio, L. Comparison between different approaches to modeling shallow landslide susceptibility: A case history in Oltrepo Pavese, Northern Italy. Nat. Hazards Earth Syst. Sci. 2013, 13, 559–573. [Google Scholar] [CrossRef] [Scilit]
- Bordoni, M.; Vercesi, A.; Maerker, M.; Vivaldi, V.; Meisina, C. Impact of Agricultural Management in Vineyards to Landslides Susceptibility in Italian Apennines. In Understanding and Reducing Landslide Disaster Risk; Guzzetti, F., Mihalić Arbanas, S., Reichenbach, P., Sassa, K., Bobrowsky, P.T., Takara, K., Eds.; WLF 2020; ICL Contribution to Landslide Disaster Risk Reduction; Springer: Cham, Switzerland, 2021. [Google Scholar] [CrossRef] [Scilit]
- Bosino, A.; Szatten, D.A.; Omran, A.; Crema, S.; Crozi, M.; Becker, R.; Bettoni, M.; Schillaci, C.; Maerker, M. Assessment of suspended sediment dynamics in a small ungauged badland catchment in the Northern Apennines (Italy) using an in-situ laser diffraction method. Catena 2022, 209, 105796. [Google Scholar] [CrossRef] [Scilit]
- Manenti, S.; Amicarelli, A.; Palazzolo, N.; Bordoni, M.; Creaco, E.; Meisina, C. Post-Failure Dynamics of Rainfall-Induced Landslide in Oltrepò Pavese. Water 2020, 12, 2555. [Google Scholar] [CrossRef] [Scilit]
- Cohen-Shacham, E.; Walters, G.; Janzen, C.; Maginnis, S. Nature-Based Solutions to Address Global Societal Challenges; IUCN: Gland, Switzerland, 2016. [Google Scholar] [CrossRef] [Scilit]
- Seddon, N.; Chausson, A.; Berry, P.; Girardin, C.A.; Smith, A.; Turner, B. Understanding the value and limits of nature-based solutions to climate change and other global challenges. Philos. Trans. R. Soc. B 2020, 375, 20190120. [Google Scholar] [CrossRef] [Scilit]
- Cabrera-Pérez, C.; Llorens, J.; Escolà, A.; Royo-Esnal, A.; Recasens, J. Organic mulches as an alternative for under-vine weed management in Mediterranean irrigated vineyards: Impact on agronomic performance. Eur. J. Agron. 2023, 145, 126798. [Google Scholar] [CrossRef] [Scilit]
- Horel, Á.; Bakacsi, Z.; Vass, C.; Zsigmond, T. Inter-row soil management affecting soil moisture in non-irrigated vineyard ecosystems: A meta-analysis. Soil Use Manag. 2024, 40, e13159. [Google Scholar] [CrossRef] [Scilit]
- Capello, G.; Biddoccu, M.; Cavallo, E. Permanent cover for soil and water conservation in mechanized vineyards: A study case in Piedmont, NW Italy. Ital. J. Agron. 2020, 15, 323–331. [Google Scholar] [CrossRef] [Scilit]
- Guzmán, G.; Cabezas, J.; Sánchez-Cuesta, R.; Lora, Á.; Bauer, T.; Strauss, P.; Winter, S.; Zaller, J.; Gómez, J. A field evaluation of the impact of temporary cover crops on soil properties and vegetation communities in southern Spain vineyards. Agric. Ecosyst. Environ. 2019, 272, 135–145. [Google Scholar] [CrossRef] [Scilit]
- Liebhard, G.; Guzmán, G.; Gómez, J.; Winter, S.; Zaller, J.; Bauer, T.; Nicolai, A.; Cluzeau, D.; Popescu, D.; Bunea, C.; et al. Vineyard cover crop management strategies and their effect on soil properties across Europe. Eur. J. Soil Sci. 2024, 75, e13573. [Google Scholar] [CrossRef] [Scilit]
- Novara, A.; Cerda, A.; Barone, E.; Gristina, L. Cover crop management and water conservation in vineyard and olive orchards. Soil Tillage Res. 2021, 208, 104896. [Google Scholar] [CrossRef] [Scilit]
- Telak, L.; Pereira, P.; Bogunović, I. Management and seasonal impacts on vineyard soil properties and the hydrological response in continental Croatia. Catena 2021, 202, 105267. [Google Scholar] [CrossRef] [Scilit]
- Ortuani, B.; Facchi, A.; Mayer, A.; Bianchi, D.; Bianchi, A.; Brancadoro, L. Assessing the Effectiveness of Variable-Rate Drip Irrigation on Water Use Efficiency in a Vineyard in Northern Italy. Water 2019, 11, 1964. [Google Scholar] [CrossRef] [Scilit]
- Amoozegar, A. A compact constant-head permeameter for measuring saturated hydraulic conductivity of the vadose zone. Soil Sci. Soc. Am. J. 1989, 53, 1356–1361. [Google Scholar] [CrossRef] [Scilit]
- Michaud, M.E.; Gan, H. Comparison of common methods to quantify field saturated hydraulic conductivity in glacial till soils of Northeastern United States. Soil Sci. Soc. Am. J. 2025, 89, e70112. [Google Scholar] [CrossRef] [Scilit]
- Eeswaran, R.; Nejadhashemi, A.P.; Alves, F.C.; Saravi, B. Evaluating the applicability of soil moisture-based metrics for gauging the resiliency of rainfed agricultural systems in the midwestern United States. Soil Tillage Res. 2021, 205, 104818. [Google Scholar] [CrossRef] [Scilit]
- Jacobs, J.M.; Mohanty, B.P.; Hsu, E.C.; Miller, D. SMEX02: Field scale variability, time stability and similarity of soil moisture. Remote Sens. Environ. 2004, 92, 436–446. [Google Scholar] [CrossRef] [Scilit]
- Joshi, C.; Mohanty, B.P.; Jacobs, J.M.; Ines, A.V. Spatiotemporal analyses of soil moisture from point to footprint scale in two different hydroclimatic regions. Water Resour. Res. 2011, 47. [Google Scholar] [CrossRef] [Scilit]
- Vachaud, G.; Passerat de Silans, A.; Balabanis, P.; Vauclin, M. Temporal stability of spatially measured soil water probability density function. Soil Sci. Soc. Am. J. 1985, 49, 822–828. [Google Scholar] [CrossRef] [Scilit]
- Gao, L.; Lv, Y.; Wang, D.; Muhammad, T.; Biswas, A.; Peng, X. Soil water storage prediction at high space–time resolution along an agricultural hillslope. Agric. Water Manag. 2016, 165, 122–130. [Google Scholar] [CrossRef] [Scilit]
- Liu, Z.; Wang, Y.; Yu, P.; Tian, A.; Wang, Y.; Xiong, W.; Xu, L. Spatial Pattern and Temporal Stability of Root-Zone Soil Moisture during Growing Season on a Larch Plantation Hillslope in Northwest China. Forests 2018, 9, 68. [Google Scholar] [CrossRef] [Scilit]
- Gao, L.; Shao, M. Temporal stability of soil water storage in diverse soil layers. Catena 2012, 95, 24–32. [Google Scholar] [CrossRef] [Scilit]
- He, Z.B.; Zhao, M.M.; Zhu, X.; Du, J.; Chen, L.F.; Lin, P.F.; Li, J. Temporal stability of soil water storage in multiple soil layers in high-elevation forests. J. Hydrol. 2019, 569, 532–545. [Google Scholar] [CrossRef] [Scilit]
- Martínez-Fernández, J.; González-Zamora, A.; Sánchez, N.; Gumuzzio, A. A soil water based index as a suitable agricultural drought indicator. J. Hydrol. 2015, 522, 265–273. [Google Scholar] [CrossRef] [Scilit]
- Bevacqua, E.; Rakovec, O.; Schumacher, D.L.; Kumar, R.; Thober, S.; Samaniego, L.; Seneviratne, S.I.; Zscheischler, J. Direct and lagged climate change effects intensified the 2022 European drought. Nat. Geosci. 2024, 17, 1100–1107. [Google Scholar] [CrossRef] [Scilit]
- Marques, M.J.; Ruiz-Colmenero, M.; Bienes, R.; García-Díaz, A.; Sastre, B. Effects of a permanent soil cover on water dynamics and wine characteristics in a steep vineyard in the Central Spain. Air Soil Water Res. 2020, 13, 1178622120948069. [Google Scholar] [CrossRef] [Scilit]
- Horel, Á.; Zsigmond, T. Plant Growth and Soil Water Content Changes under Different Inter-Row Soil Management Methods in a Sloping Vineyard. Plants 2023, 12, 1549. [Google Scholar] [CrossRef] [Scilit]
- López-Vicente, M.; Álvarez, S. Stability and patterns of topsoil water content in rainfed vineyards, olive groves, and cereal fields under different soil and tillage conditions. Agric. Water Manag. 2018, 201, 167–176. [Google Scholar] [CrossRef] [Scilit]
- Benettin, P.; Tagliavini, M.; Andreotti, C.; Di Villahermosa, F.; Verdone, M.; Dani, A.; Penna, D. Ecohydrological Dynamics and Temporal Water Origin in a European Mediterranean Vineyard. Ecohydrology 2024, 18, e2711. [Google Scholar] [CrossRef] [Scilit]
- Darouich, H.; Ramos, T.; Pereira, L.; Rabino, D.; Bagagiolo, G.; Capello, G.; Simionesei, L.; Cavallo, E.; Biddoccu, M. Water Use and Soil Water Balance of Mediterranean Vineyards under Rainfed and Drip Irrigation Management: Evapotranspiration Partition and Soil Management Modelling for Resource Conservation. Water 2022, 14, 554. [Google Scholar] [CrossRef] [Scilit]
- Gao, Y.; Zhou, Z.; Hao, X.; Li, T.; Kang, S. Spatio-temporal variability of soil water content across plot scales within a vineyard. J. Hydrol. 2024, 642, 131882. [Google Scholar] [CrossRef] [Scilit]
- Vivaldi, V.; Torrese, P.; Bordoni, M.; Viglietti, F.; Meisina, C. ERT-based experimental integrated approach for soil hydrological characterization in rainfall-induced shallow landslides prone areas. Bull. Eng. Geol. Environ. 2024, 83, 167. [Google Scholar] [CrossRef] [Scilit]
- Blanco-Canqui, H.; Ruis, S. Cover crop impacts on soil physical properties: A review. Soil Sci. Soc. Am. J. 2020, 84, 1527–1576. [Google Scholar] [CrossRef] [Scilit]
- Fernando, M.; Scott, N.; Shrestha, A.; Gao, S.; Hale, L. A native plant species cover crop positively impacted vineyard water dynamics, soil health, and vine vigor. Agric. Ecosyst. Environ. 2024, 367, 108972. [Google Scholar] [CrossRef] [Scilit]
- Capello, G.; Biddoccu, M.; Ferraris, S.; Cavallo, E. Effects of Tractor Passes on Hydrological and Soil Erosion Processes in Tilled and Grassed Vineyards. Water 2019, 11, 2118. [Google Scholar] [CrossRef] [Scilit]
- Hao, X.; Qiu, Y.; Fan, Y.; Li, T.; Leng, D.; Li, S.; Kang, S. Applicability of temporal stability analysis in predicting field mean of soil moisture in multiple soil depths and different seasons in an irrigated vineyard. J. Hydrol. 2020, 588, 125059. [Google Scholar] [CrossRef] [Scilit]
- Zhang, R.; Li, L.; Zhang, Y.; Huang, F.; Li, J.; Liu, W.; Mao, T.; Xiong, Z.; Shangguan, W. Assessment of Agricultural Drought Using Soil Water Deficit Index Based on ERA5-Land Soil Moisture Data in Four Southern Provinces of China. Agriculture 2021, 11, 411. [Google Scholar] [CrossRef] [Scilit]
- Feng, M.; Liu, P.; Cai, X.; Wallington, K.; Shi, L.; Li, Y. Understanding the resilience of soil moisture regimes. Water Resour. Res. 2019, 55, 7541–7563. [Google Scholar] [CrossRef] [Scilit]
- Aqel, N.; Groh, J.; Weihermüller, L.; Gründling, R.; Carminati, A.; Lehmann, P. Detecting the resilience of soil moisture dynamics to drought periods as function of soil type and climatic region. EGUsphere 2025. [Google Scholar] [CrossRef] [Scilit]
- Eash, L.; Berrada, A.F.; Russell, K.; Fonte, S.J. Cover crop impacts on water dynamics and yields in dryland wheat systems on the Colorado Plateau. Agronomy 2021, 11, 1102. [Google Scholar] [CrossRef] [Scilit]
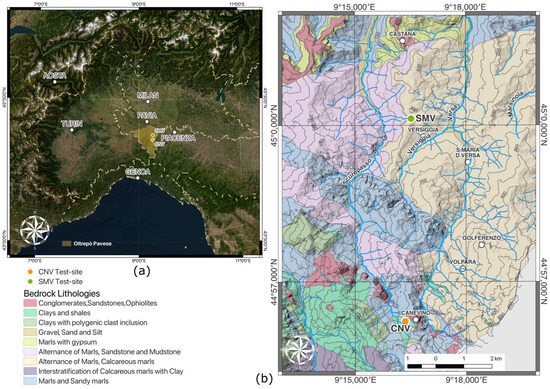
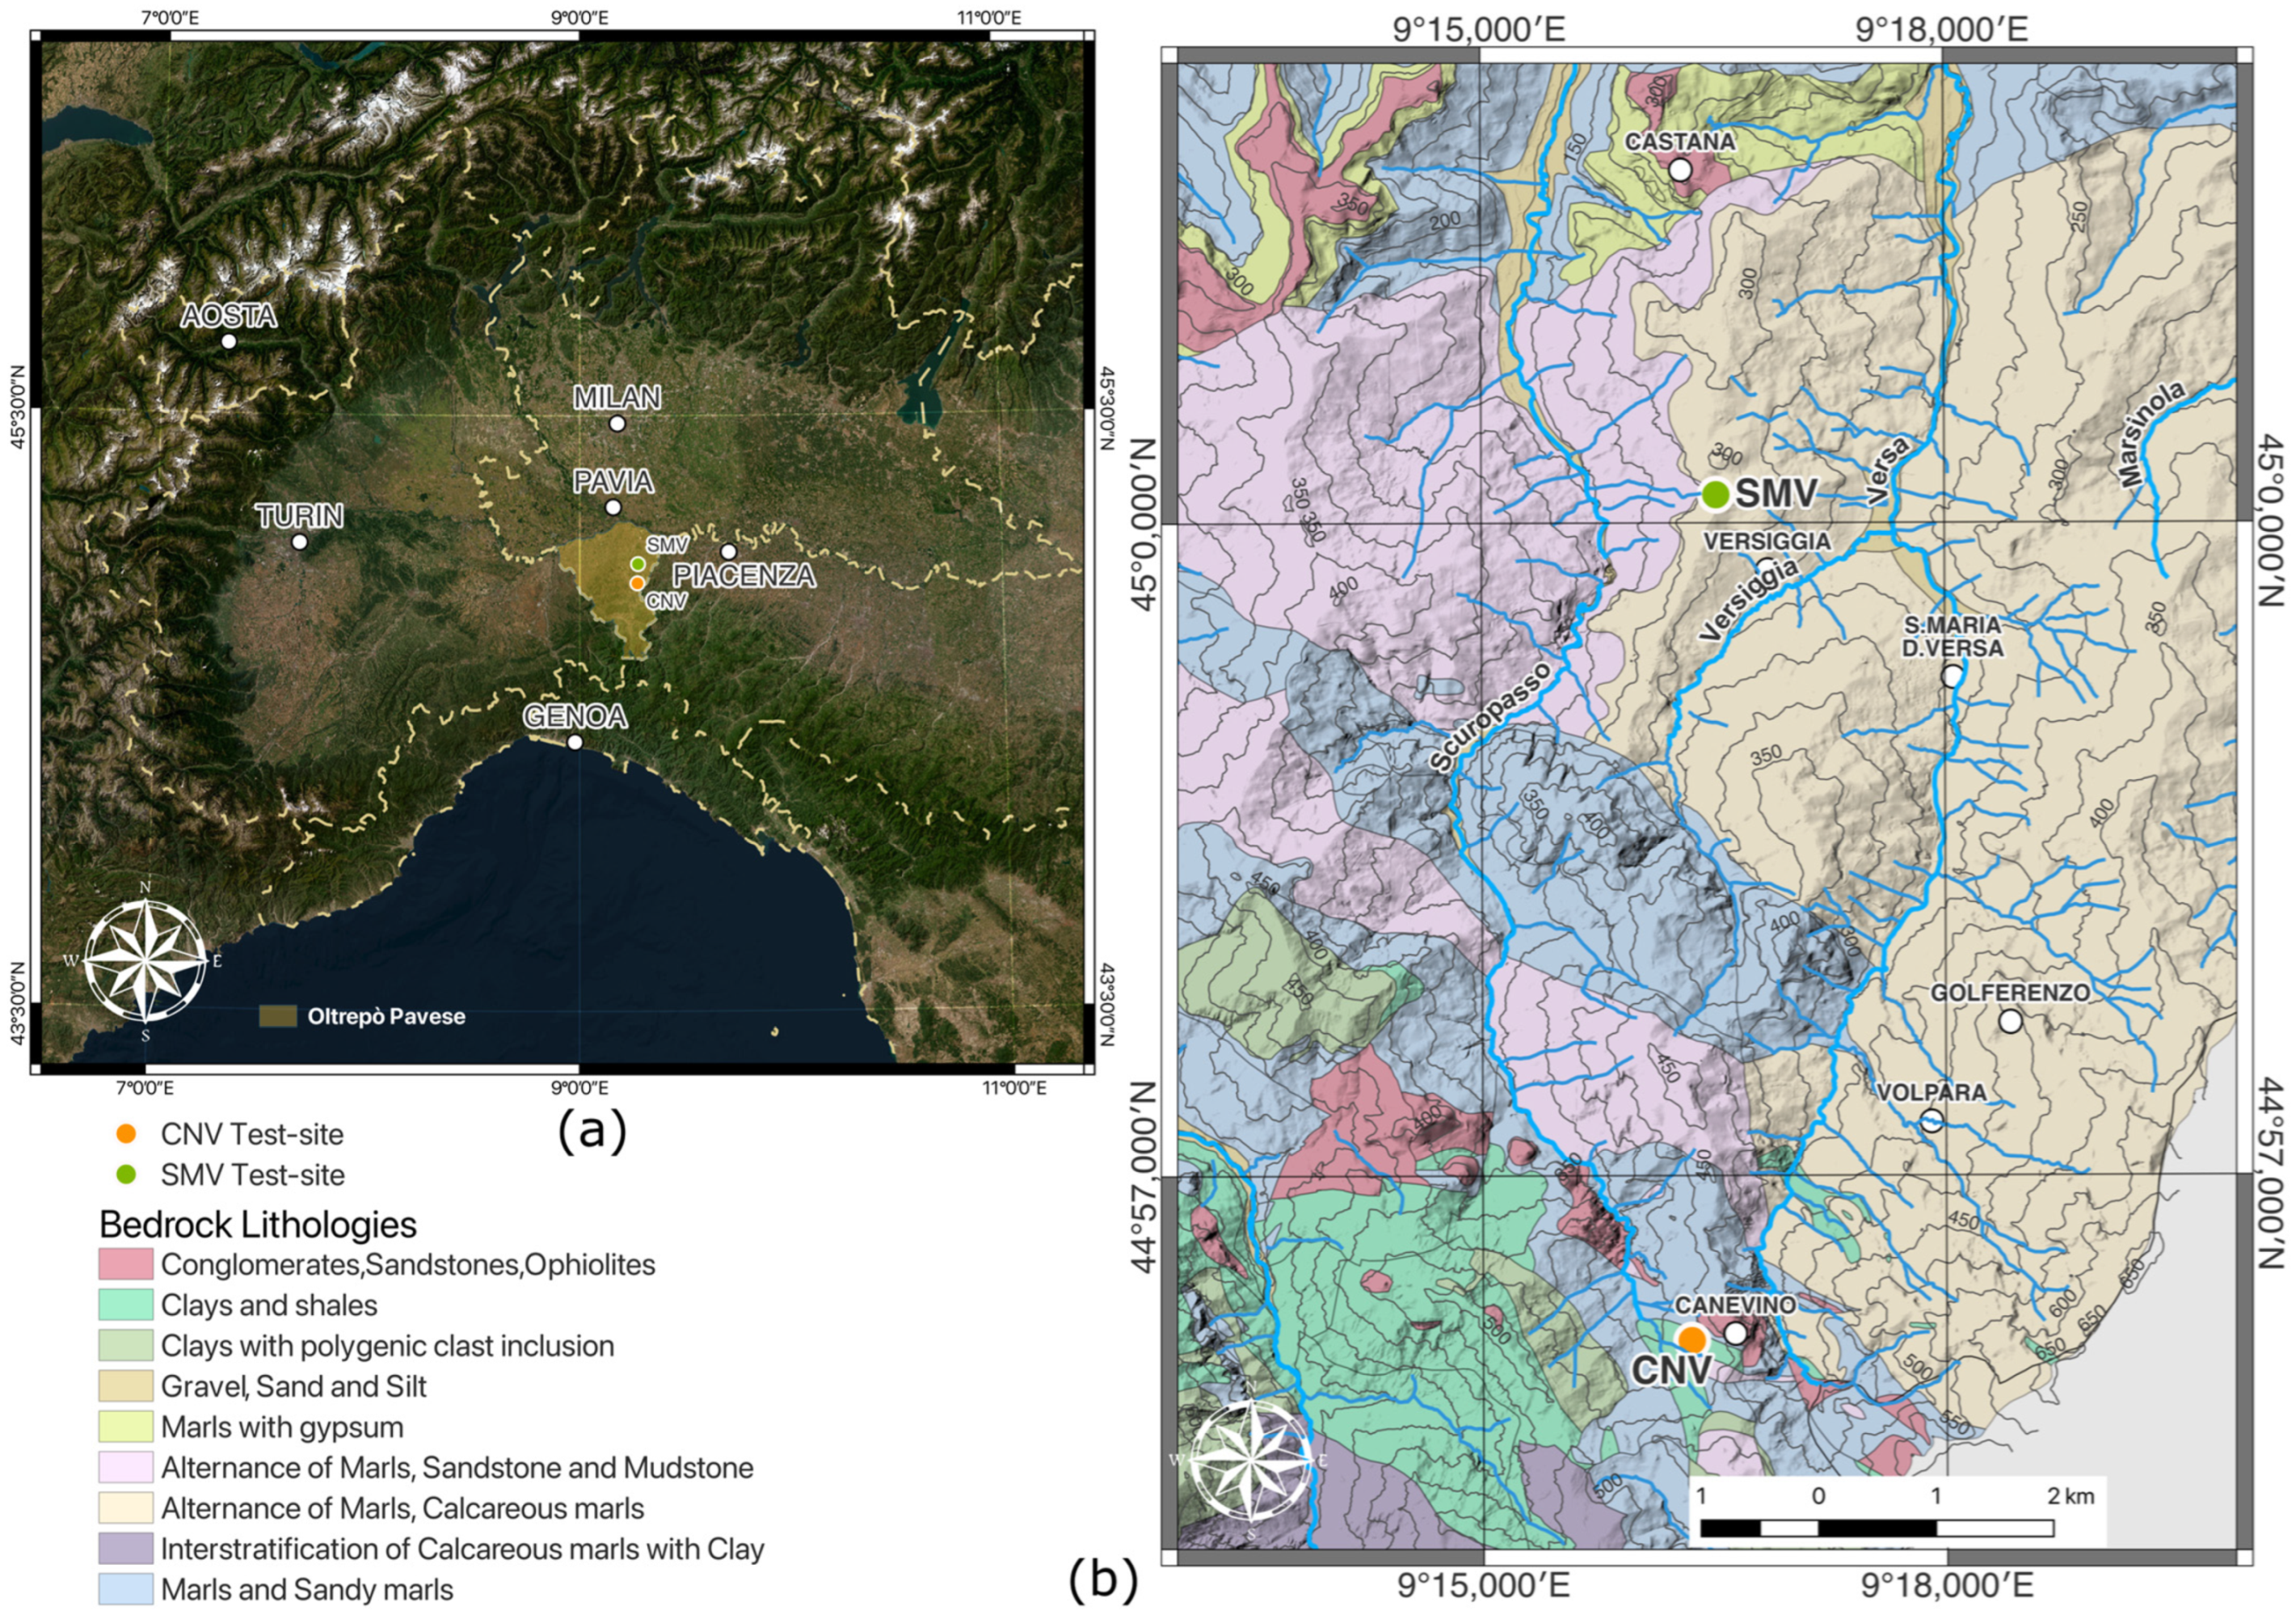
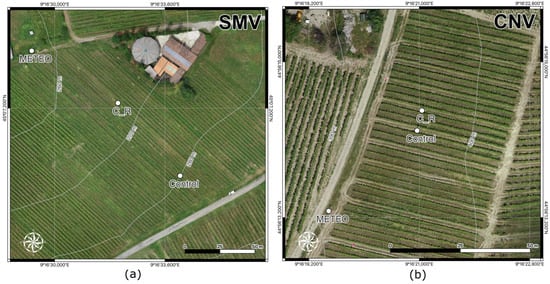
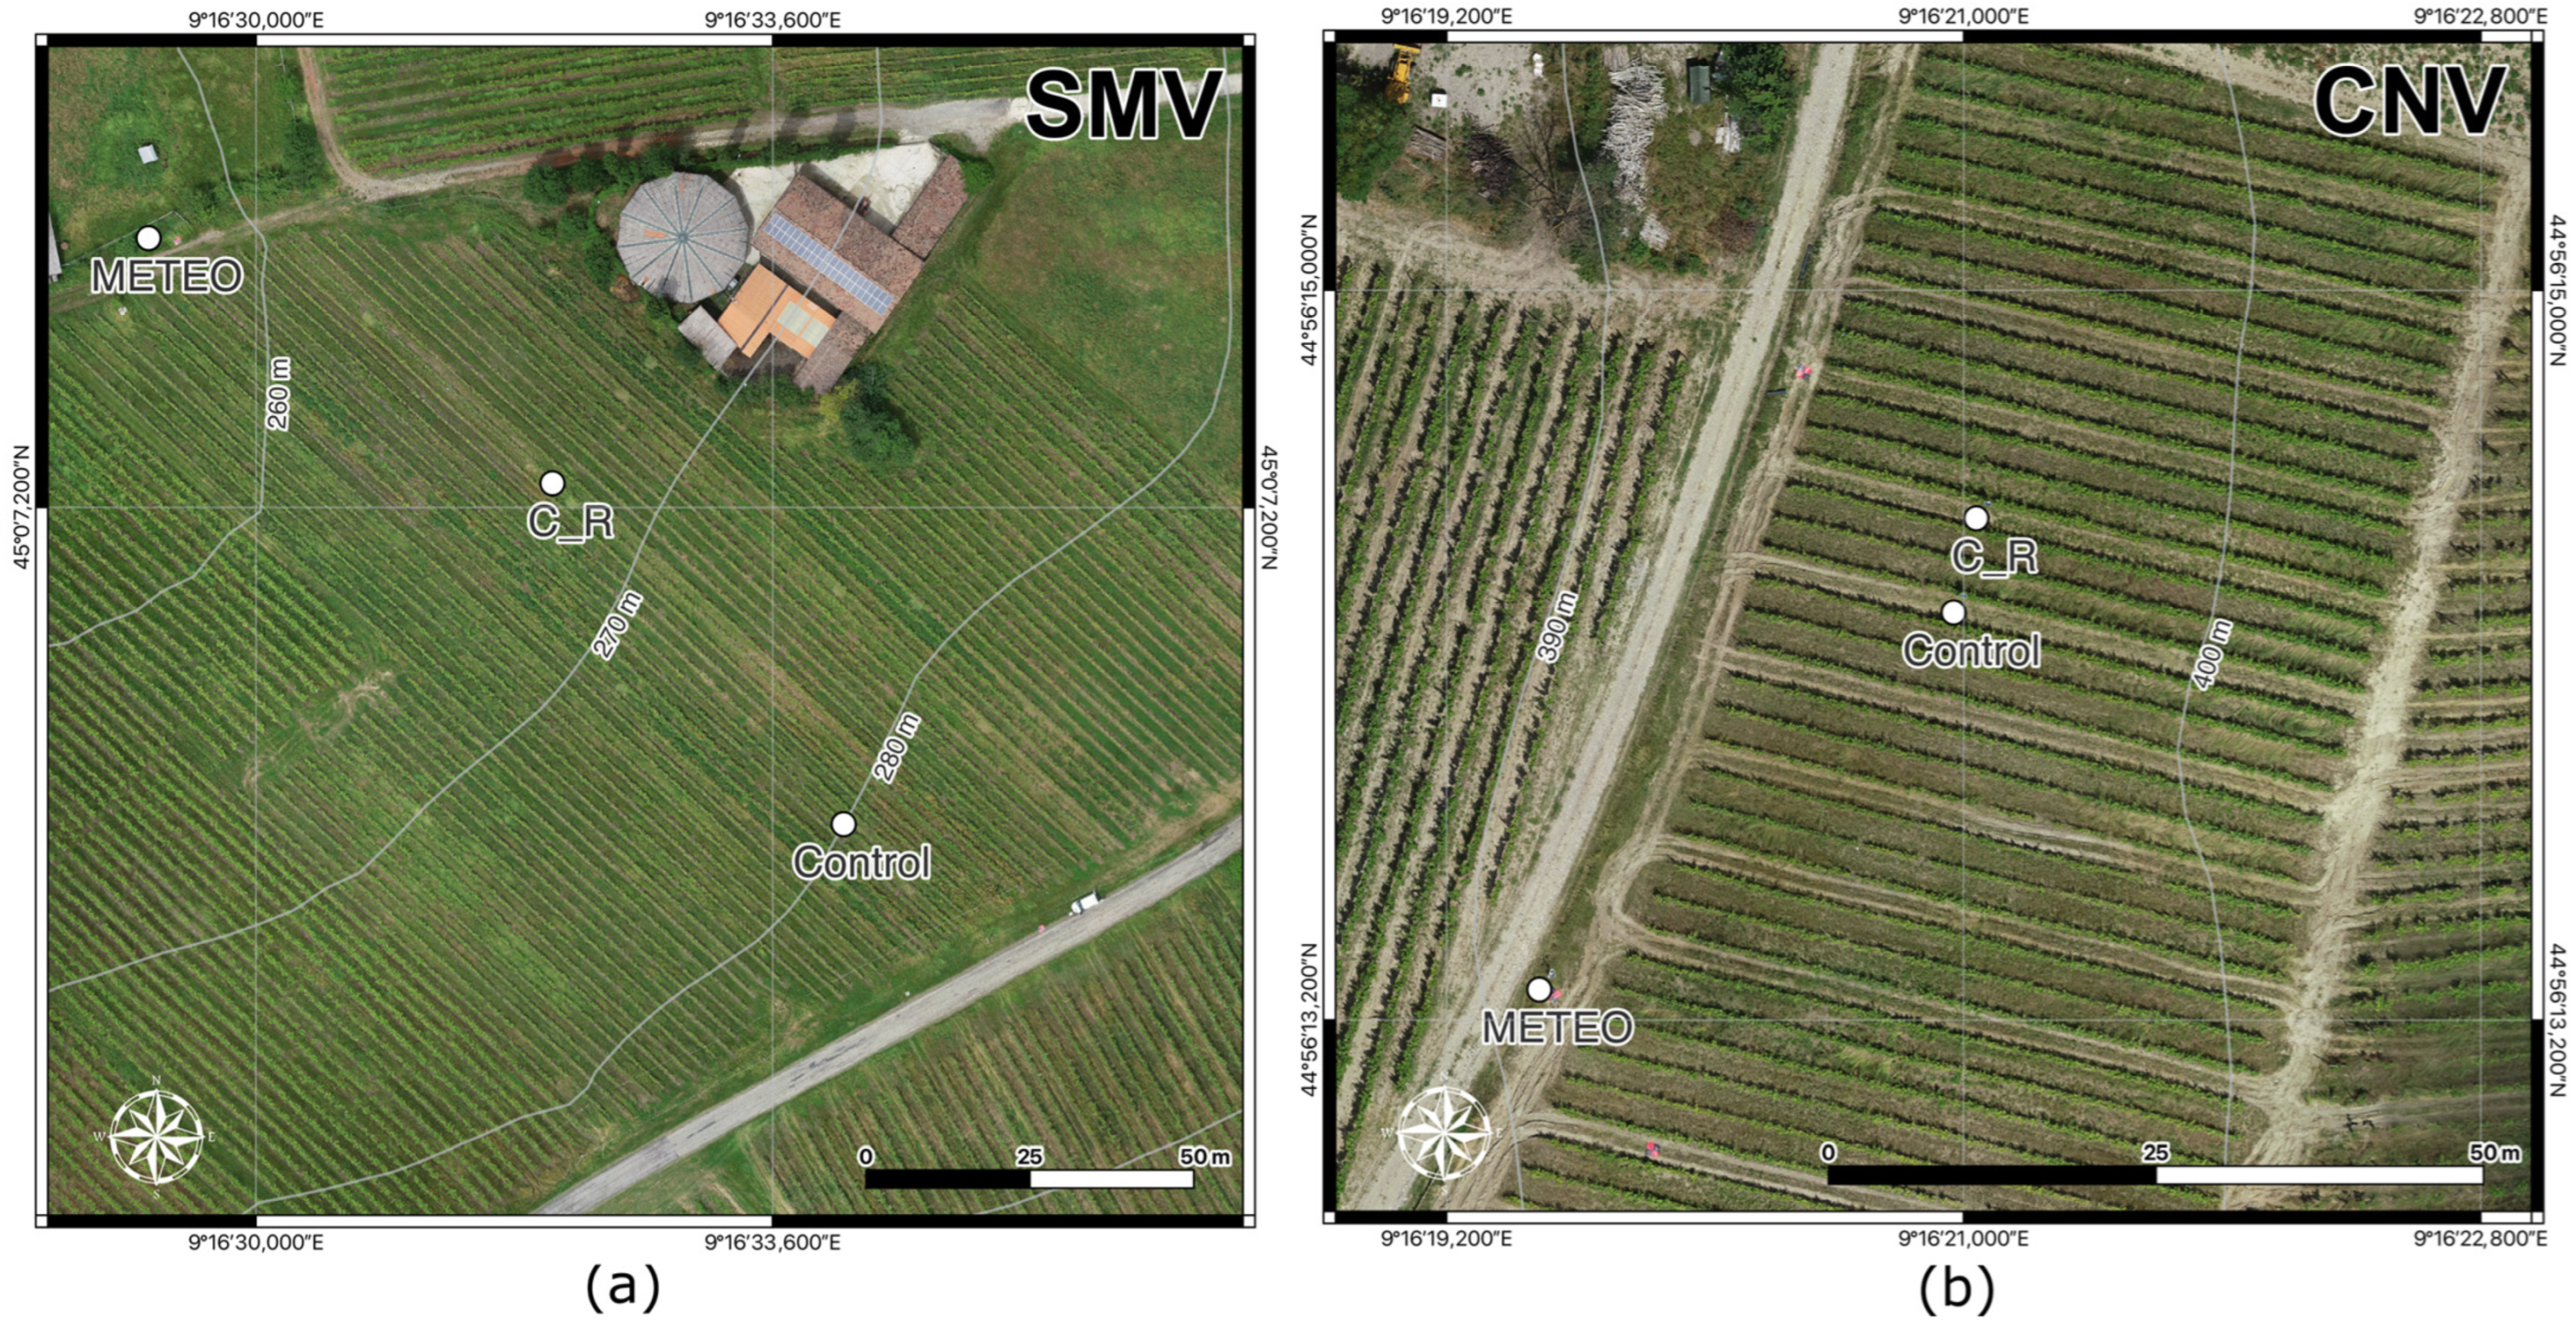
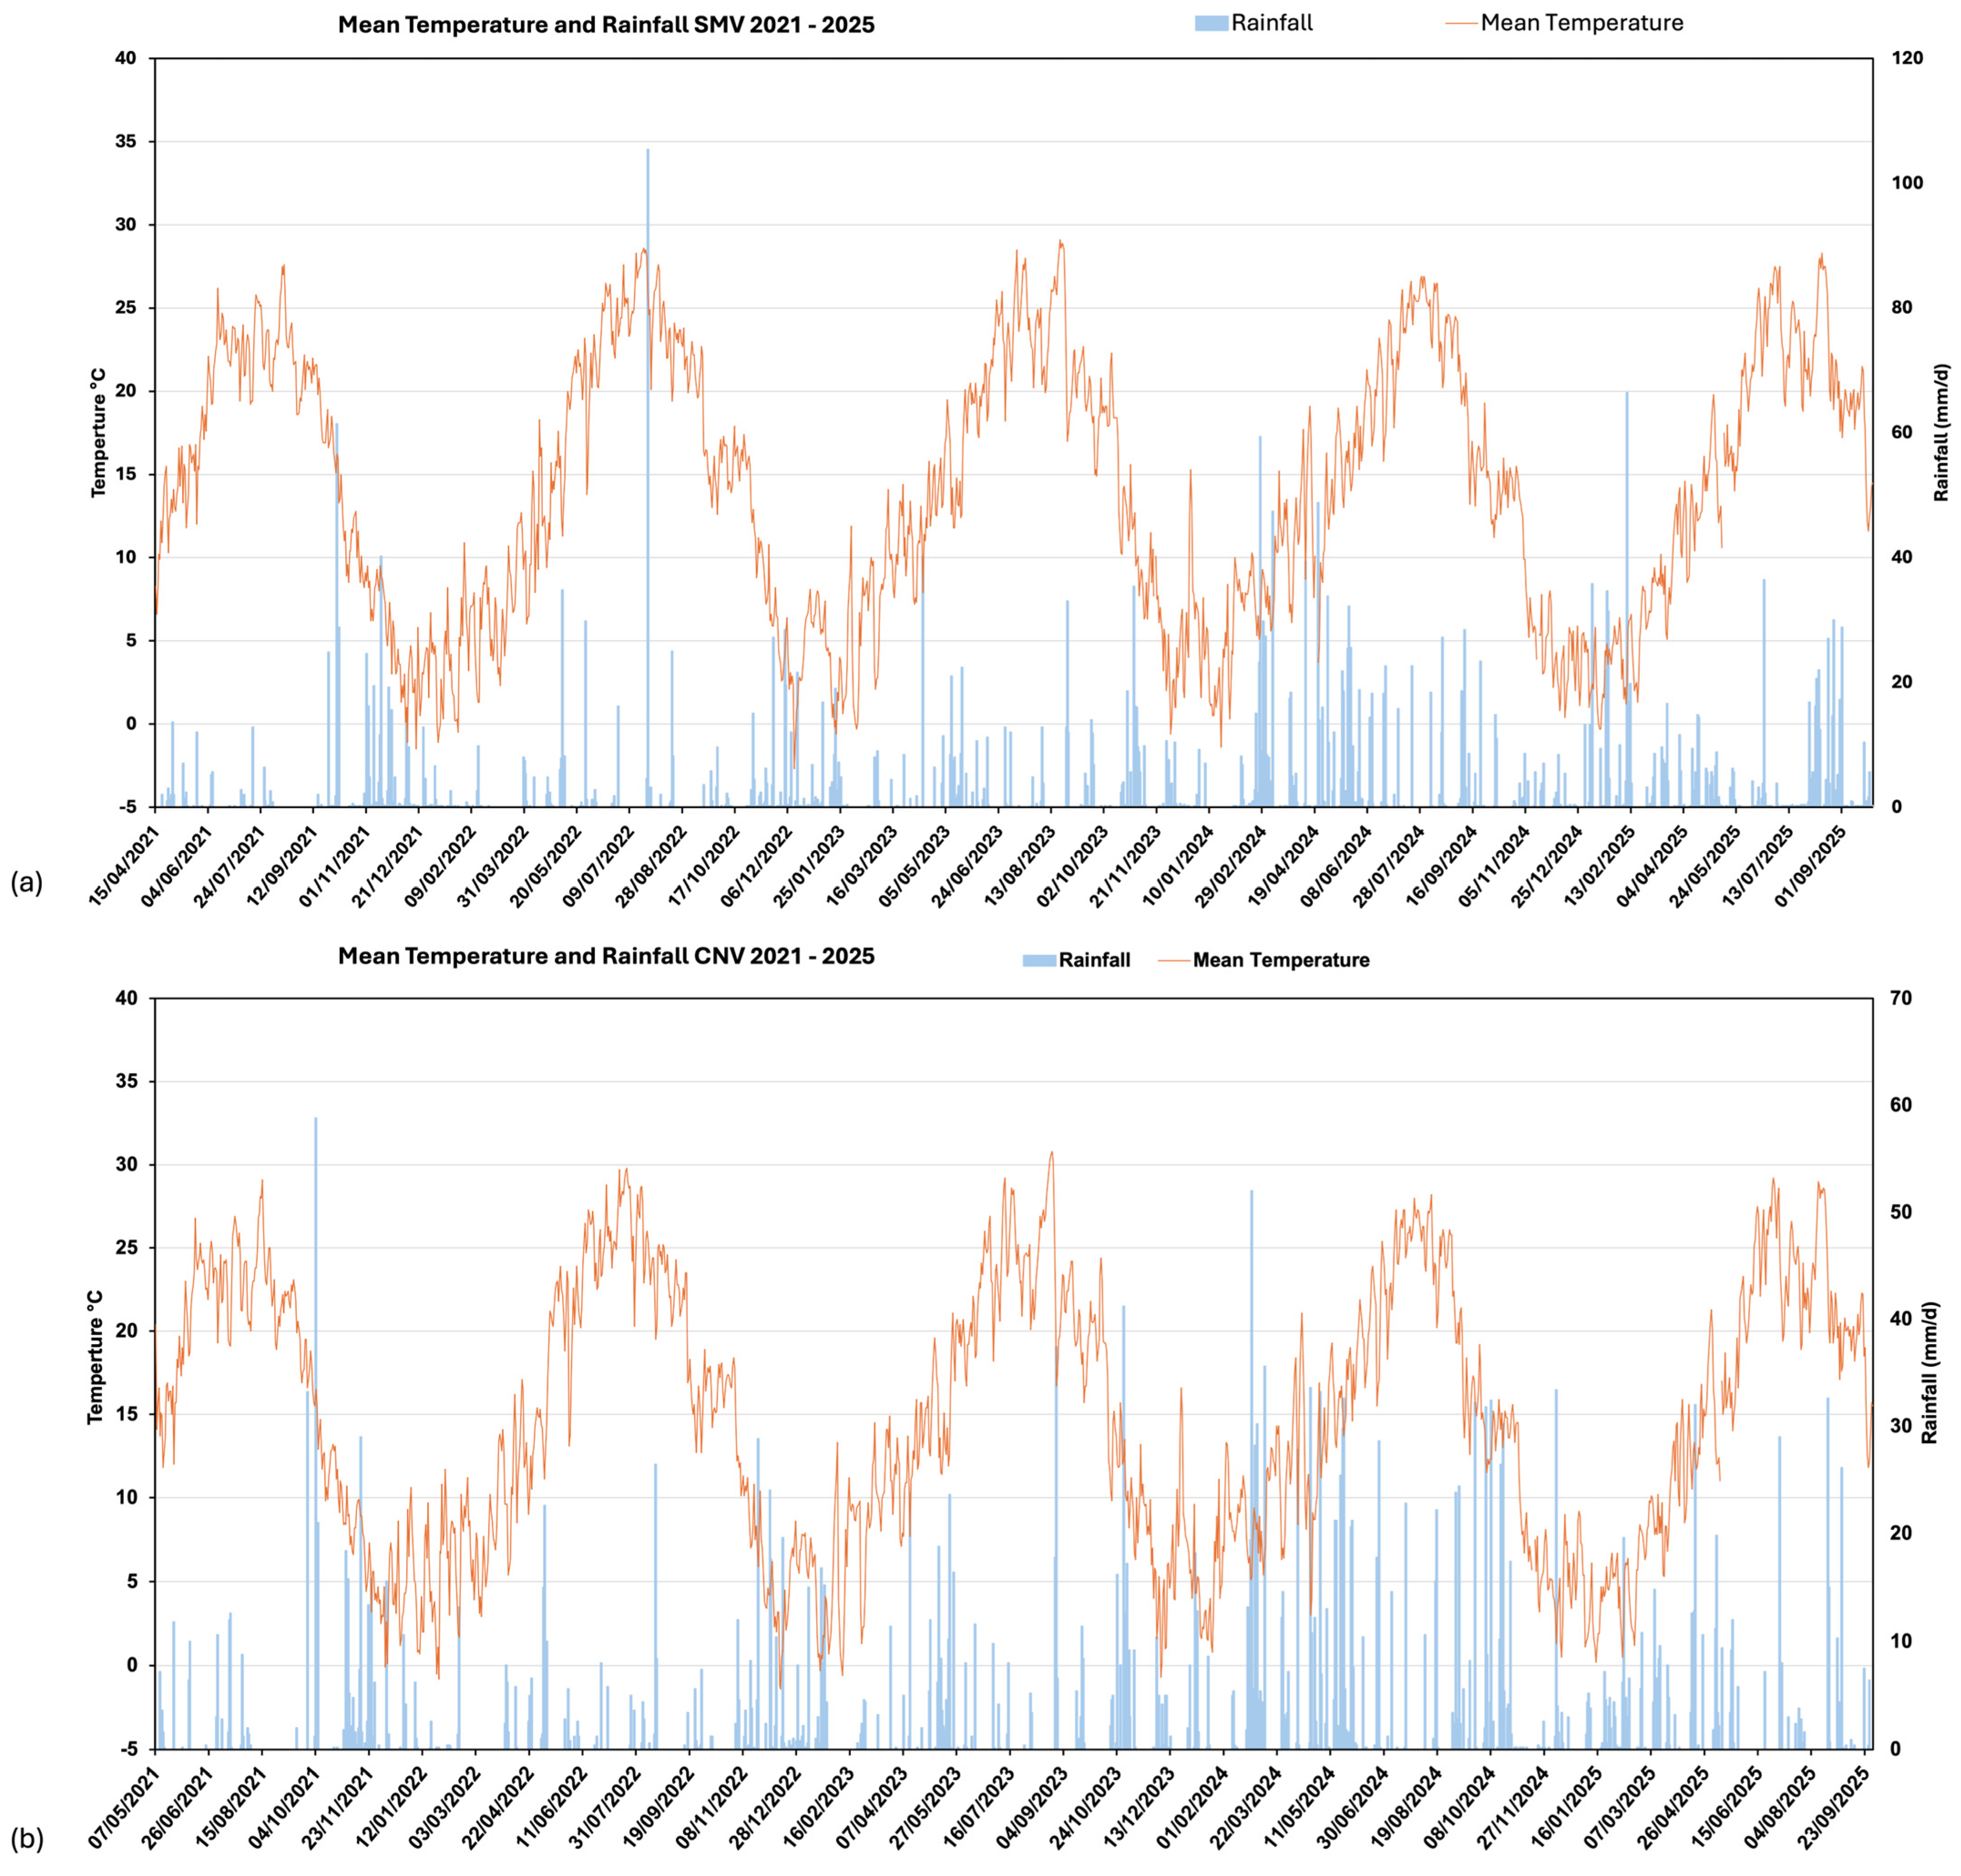
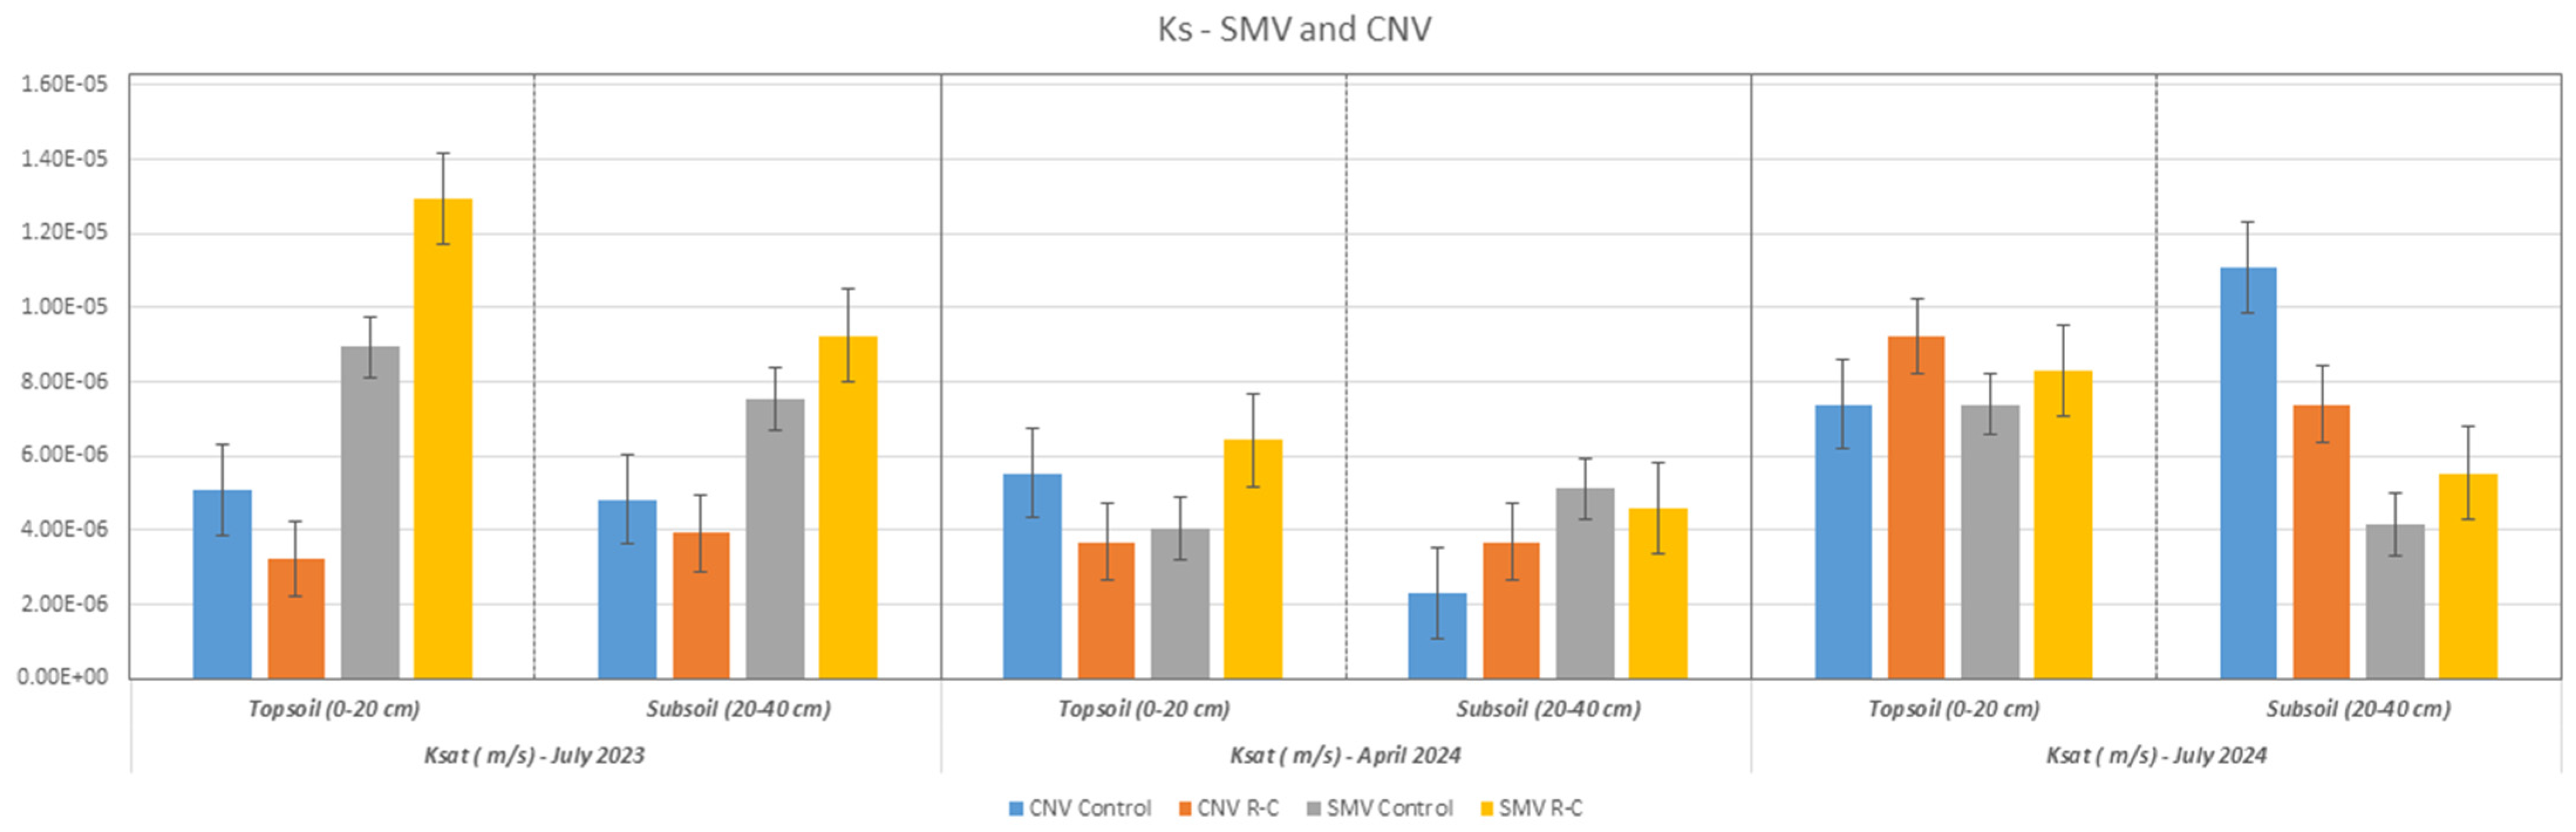
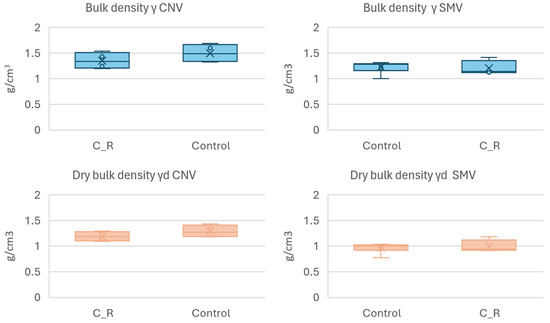
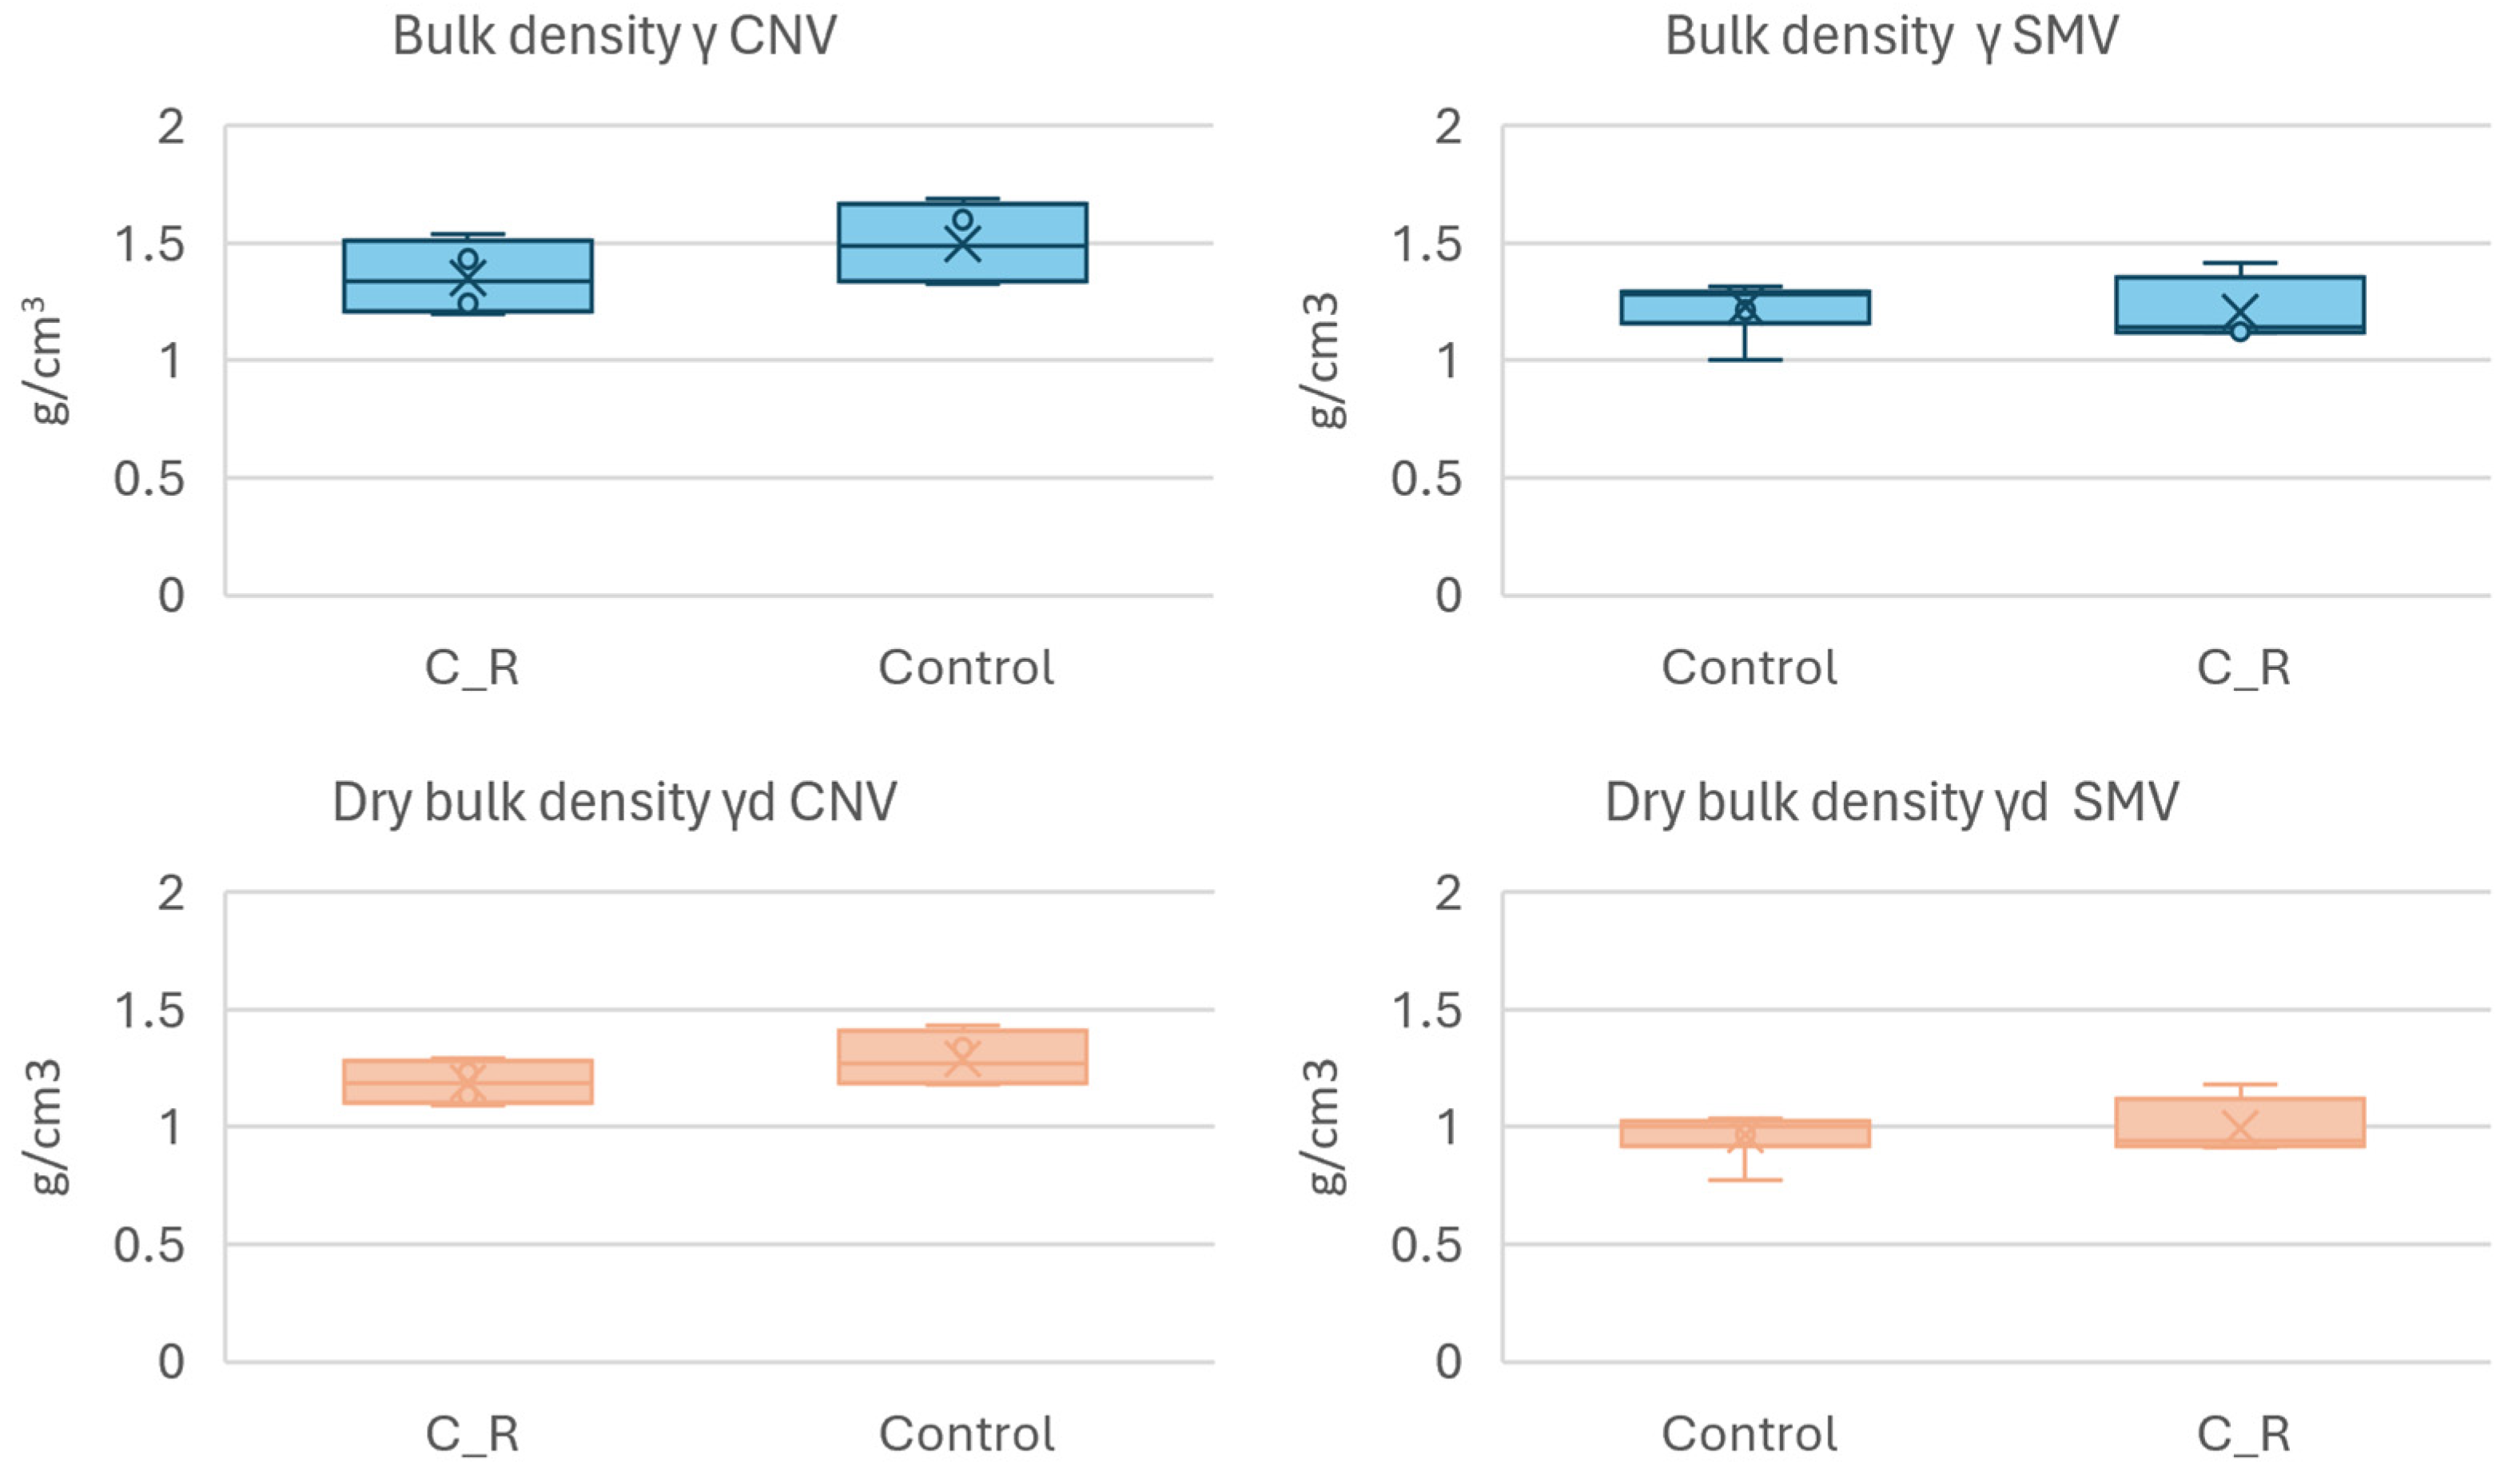
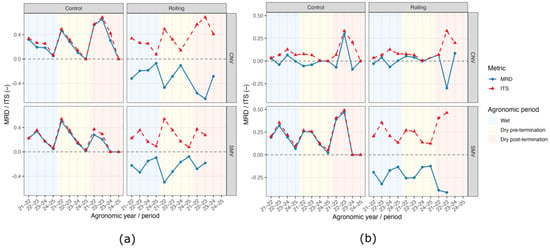
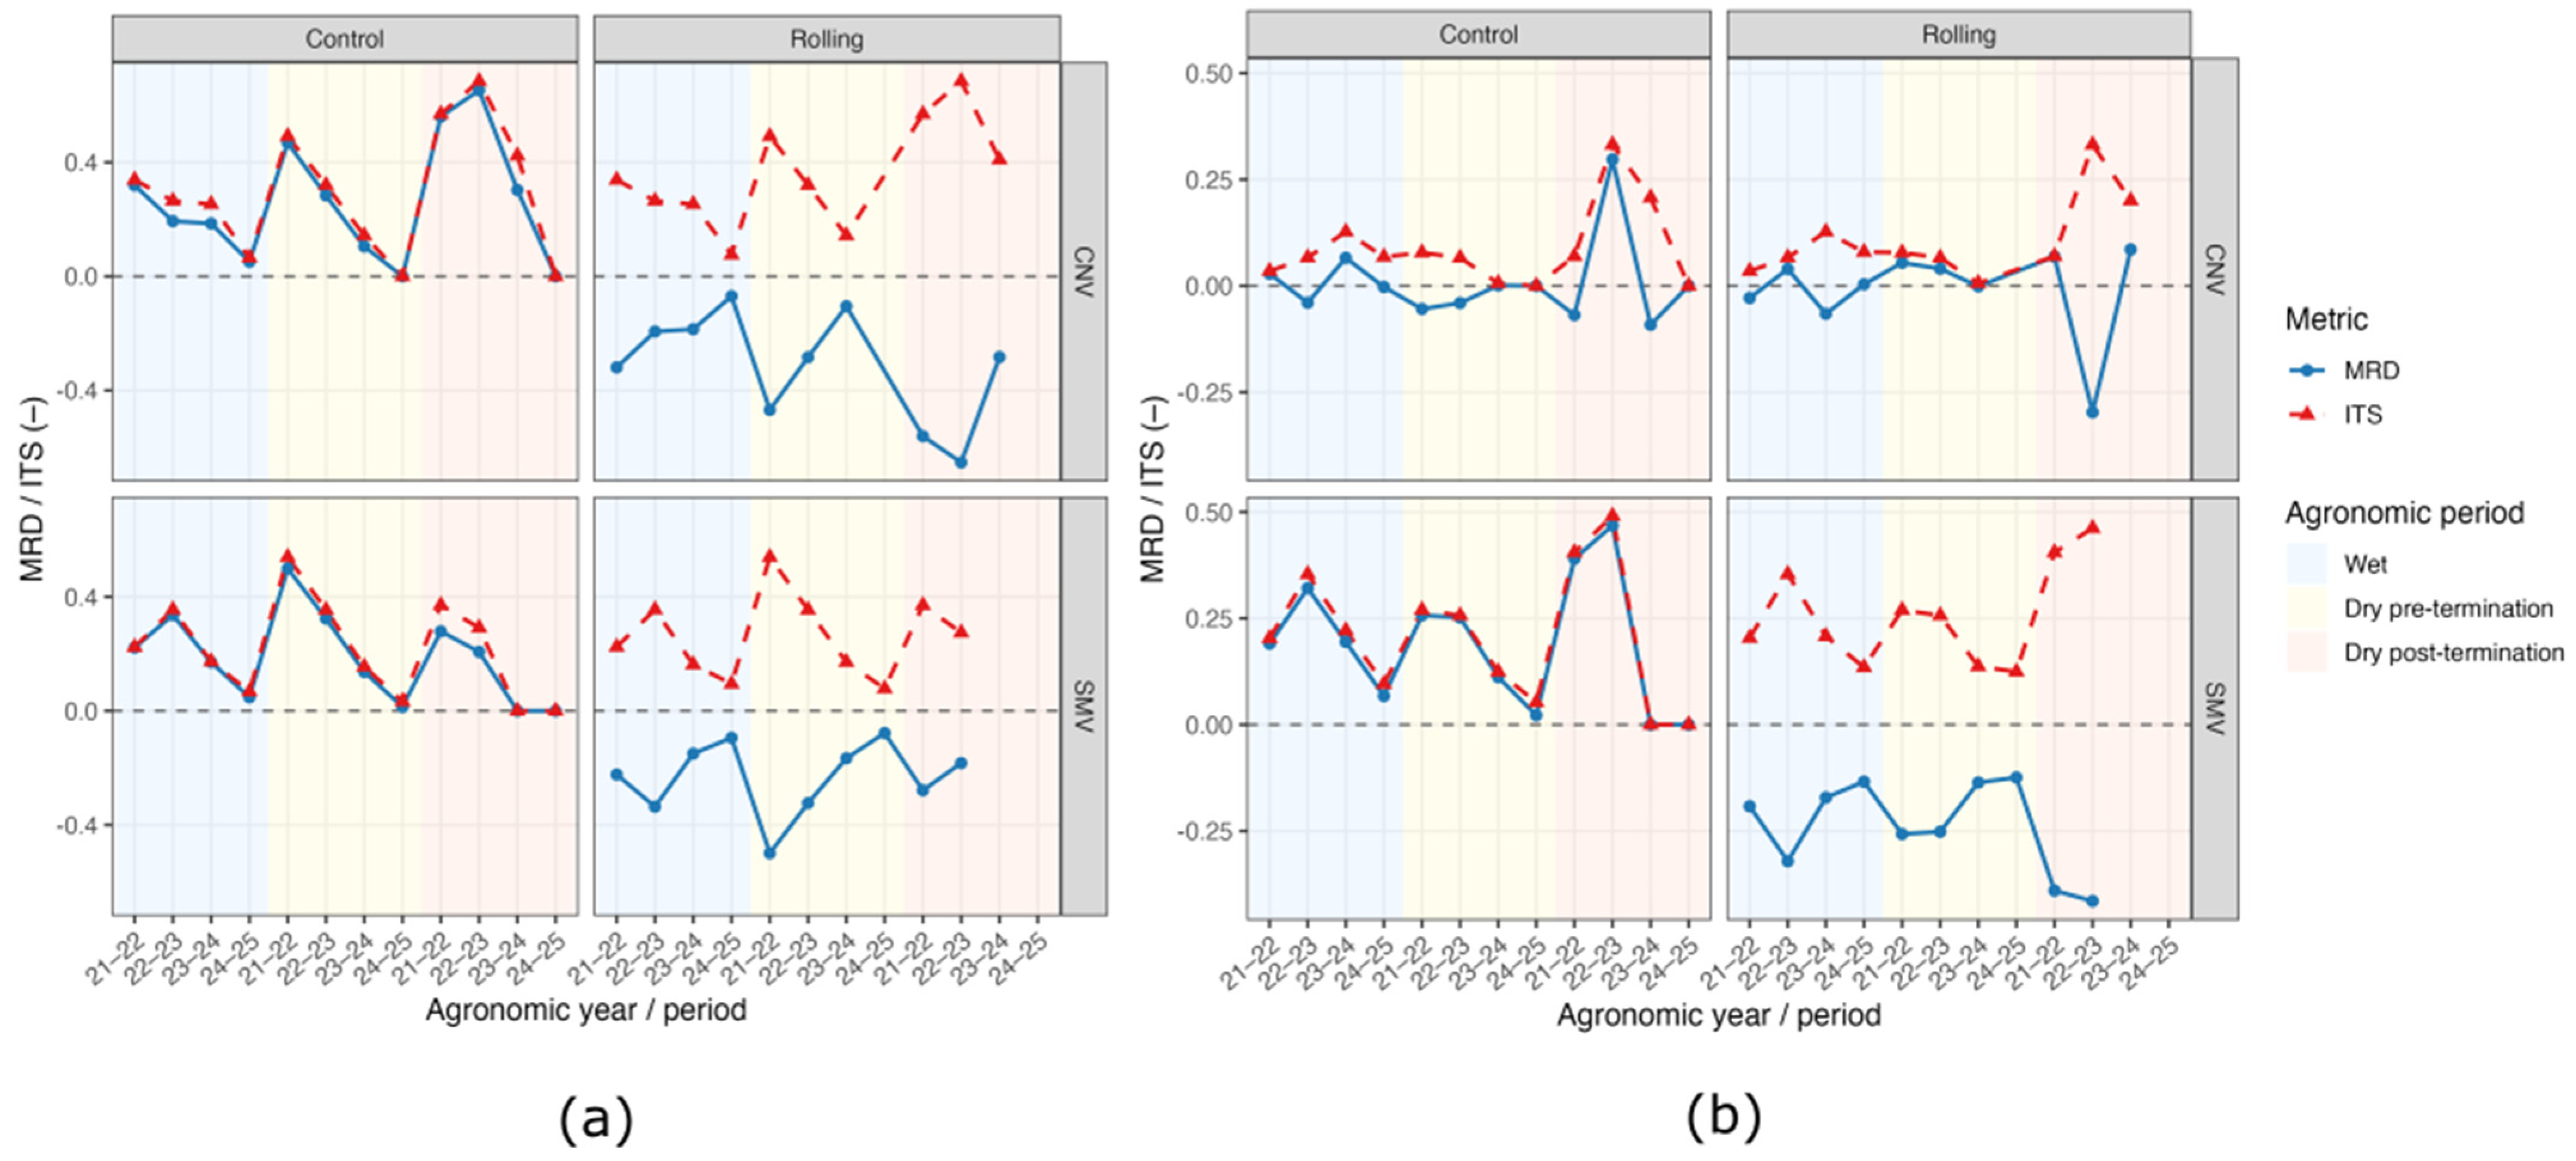
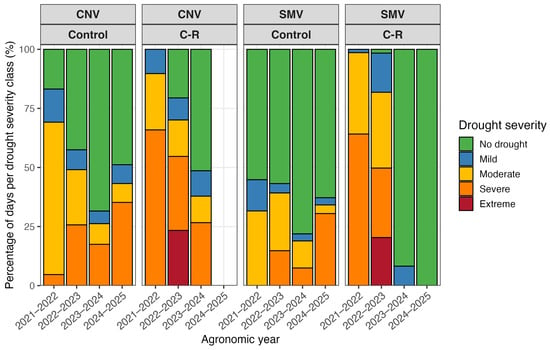
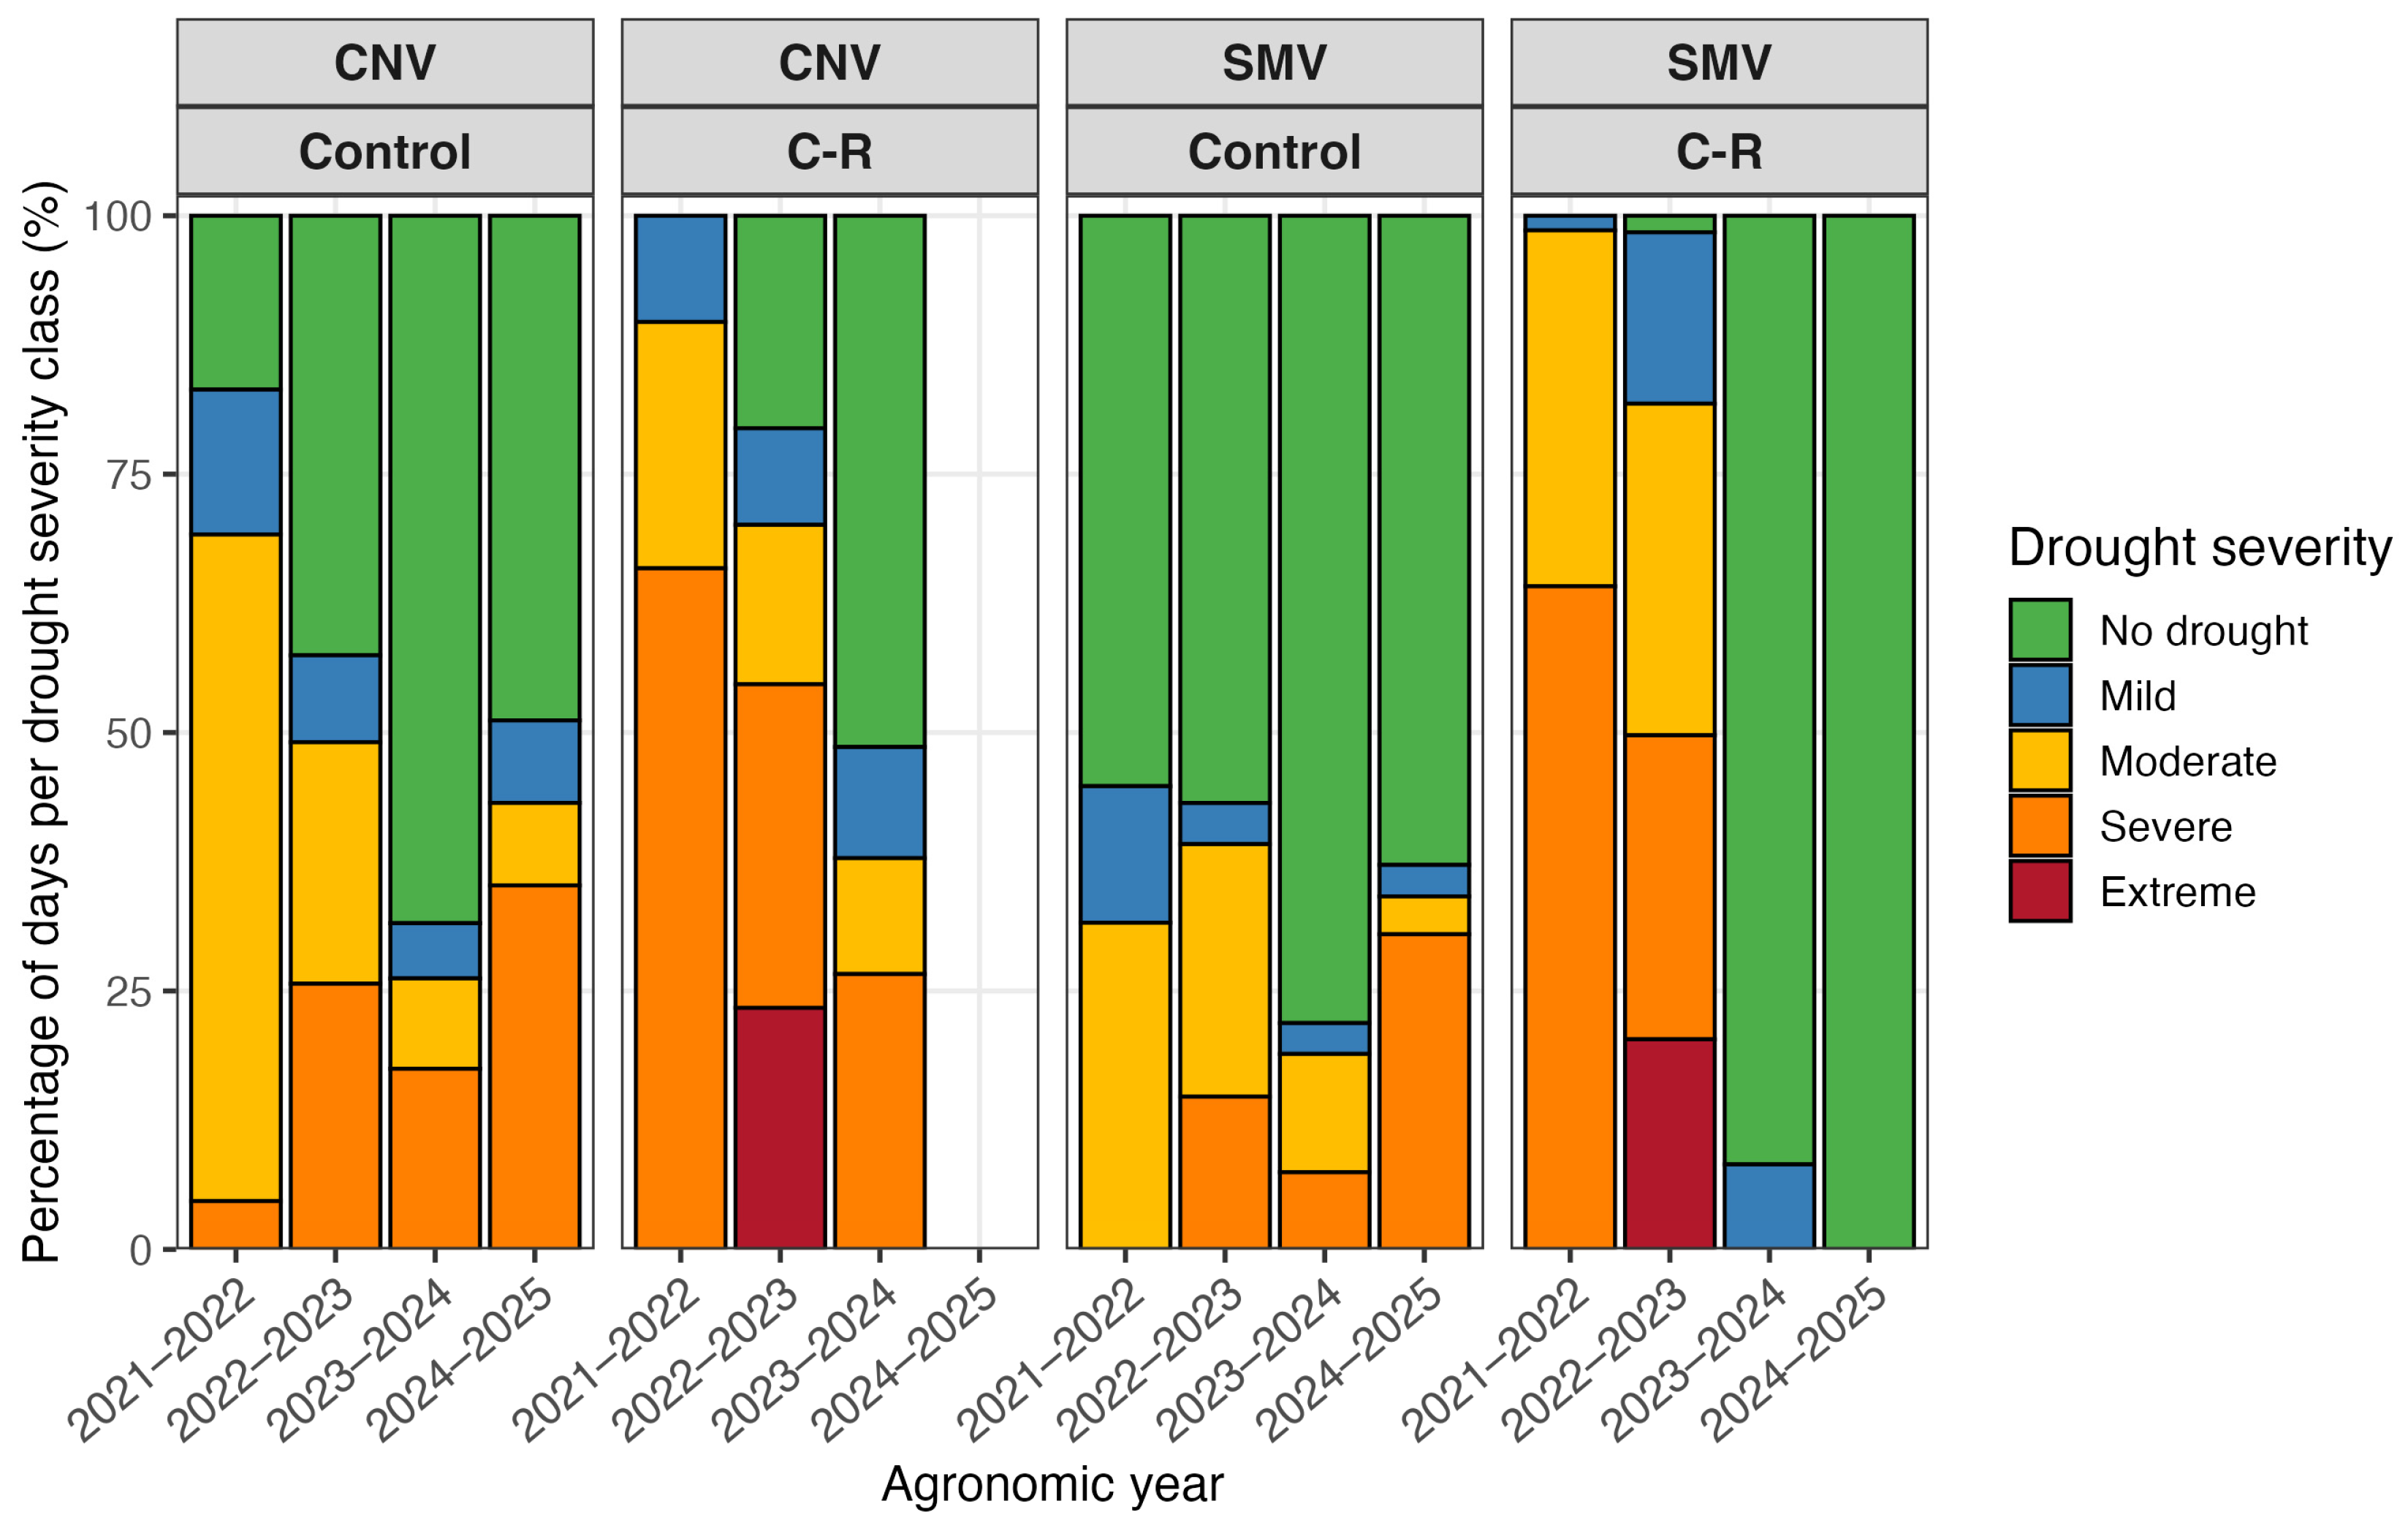

Disclaimer/Publisher’s Note: The statements, opinions and data contained in all publications are solely those of the individual author(s) and contributor(s) and not of MDPI and/or the editor(s). MDPI and/or the editor(s) disclaim responsibility for any injury to people or property resulting from any ideas, methods, instructions or products referred to in the content. |
© 2026 by the authors. Licensee MDPI, Basel, Switzerland. This article is an open access article distributed under the terms and conditions of the Creative Commons Attribution (CC BY) license.