


Abstract
Against the backdrop of increasing demand for intelligent, high-efficiency, and low-loss harvesting, the operational performance of threshing and cleaning devices directly affects the loss rate, grain quality, and operational efficiency of grain combine harvesters. However, continuous variations in crop type, moisture content, feed rate, and material composition make the threshing and cleaning processes highly complex. Existing devices still encounter problems such as grain breakage, threshing losses, cleaning losses, and increased impurity content under high loads and complex operating conditions. This paper systematically reviews the current research status and development progress of threshing and cleaning devices for grain harvesters and analyzes the structural composition and working principles of threshing and cleaning systems. In terms of threshing, particular attention is given to research progress on tangential-flow, axial-flow, and combined tangential- and longitudinal-flow cylinders, as well as fixed, variable-clearance, rotary, and load-adaptive concave structures. The applications of the discrete element method (DEM) and its coupling with multibody dynamics in analyzing material motion and forces and optimizing parameters are also examined. In terms of cleaning, approaches to structural improvement are summarized with respect to vibrating screen structures, fan and air duct configurations, and related aspects. The applications of DEM, computational fluid dynamics (CFD), and coupled CFD–DEM simulations in studies of particle stratification, passage through screen openings, and gas–solid motion are analyzed. Existing cleaning airflow designs have gradually shifted from single-variable airflow rate adjustment toward zoned and multi-source air supply to accommodate material loads in different screen sections. In addition, this paper further reviews technologies for feed rate and operational load sensing, online detection of threshing and cleaning quality, and coordinated control of multiple parameters. Issues concerning material state coupling, simulation model credibility and transferability, and sensing delays are also discussed. Finally, it is proposed that threshing and cleaning devices should evolve from the optimization of individual structures and parameters toward the integration of structural design, numerical simulation, state sensing, and coordinated regulation and control. This review provides a theoretical and technical reference for the low-loss, high-efficiency, and intelligent design of threshing and cleaning devices for grain combine harvesters.
1. Introduction
With changes in the structure of the agricultural labor force and the adoption of large-scale planting systems, low-loss, high-efficiency mechanized harvesting has become essential for ensuring grain production efficiency and harvest quality. Grain combine harvesters perform cutting, conveying, threshing, and cleaning in a single field operation [1]. The operating conditions of each stage affect grain losses, breakage rates, and impurity content, as well as subsequent storage, transportation, and processing costs. Threshing and cleaning are two successive stages in this process. The threshing device detaches grains from the rachises or pods, and the detached grains, together with some fine residues, pass through the concave [2] before being collected and conveyed to the cleaning device. The cleaning device then separates grains from non-grain material through airflow and sieve motion.
Threshing and cleaning are connected by the continuous transfer of material. Cylinder speed, concave clearance, and flow-guiding structures affect grain detachment as well as the composition, stem length, and spatial distribution of the discharged material. Increasing threshing intensity can reduce unthreshed grain, but may also increase grain breakage and fine debris, making subsequent cleaning more difficult [3,4]. Once material enters the cleaning unit, its flow rate and distribution affect layer thickness, resistance to airflow through the layer, and the likelihood of grain passing through the sieves. These issues have prompted notable research. Domestic and international scholars have advanced the structural design, numerical simulation, and intelligent control of threshing and cleaning units in grain combine harvesters. The discrete element method (DEM) can track particle motion, contact forces, and residence time to assess how cylinder and concave designs affect threshing performance. Computational fluid dynamics (CFD) can be used to study airflow distribution in the fan, air ducts, and cleaning chamber. Coupled CFD-DEM simulations can also examine how airflow moves particles and how the material layer resists airflow [5,6]. Structural design sets the units’ basic processing capacity, while changing field conditions require corresponding adjustments to operating parameters. Manual observation and experience-based adjustments make it difficult to detect changes in machine load and grain loss promptly. Load sensing, quality monitoring, and adaptive control enable the harvester to adjust its settings in response to operating conditions [7]. Measurements of feed rate, torque, pressure, and vibration indicate material input and mechanical load; impact sensors and machine vision can assess grain loss, impurity content, and breakage rate [8,9,10]. These variables link changes in individual components to downstream processing performance and inform parameter selection for the combine harvester as a whole.
Existing reviews have synthesized research on structural design, simulation, and control. Reviews of the equipment have covered the types and current development of threshing units, as well as the evolution and design challenges of cleaning units [11,12,13]. Reviews of simulation methods have summarized the use of DEM, CFD, and coupled methods to model agricultural materials, collisions during threshing, and air-and-screen cleaning [14,15]. Condition sensing and intelligent decision-making, harvester control algorithms, and grain loss sensors have also been examined in dedicated reviews [16,17,18,19]. These reviews help establish the state of research in each area, but most focus on one type of unit, a particular simulation method, or a control technique. Threshing and cleaning act in sequence on the same material flow, yet how the material’s condition carries over between them and affects design and control remains insufficiently reviewed. This review examines threshing and cleaning units in grain combine harvesters, focusing on rice, wheat, and maize while including studies of soybean, rapeseed, and peanut that clarify threshing or cleaning mechanisms or offer transferable simulation methods. Combining a narrative synthesis with critical analysis, the review compares the mechanisms, test conditions, and performance of different designs and methods, then identifies areas of agreement, divergent findings, and questions for further research.
2. Materials and Methods
This review is based on a structured literature search and thematic synthesis of research on threshing and cleaning technologies for grain combine harvesters. The literature was retrieved primarily from Web of Science, Scopus, Engineering Village, and the China National Knowledge Infrastructure (CNKI). Publisher platforms, including ScienceDirect, IEEE Xplore, and MDPI, together with reference-list searches, were used as supplementary resources to verify full texts, examine related articles, trace citations, and identify additional relevant studies. The search covered studies published between 1990 and 2026, with priority given to those published from 2016 to 2026. Earlier foundational studies were retained where necessary to explain the operating mechanisms of threshing cylinders and concaves, grain detachment and separation processes, and the mechanisms of cleaning airflow and screening.
The scope of this review was deliberately limited to studies that help explain or implement mechanical design, structural optimization, numerical simulation, state sensing, adaptive control, coordinated control, or whole-machine integration for threshing and cleaning devices in grain combine harvesters, primarily for rice, wheat, and maize. Studies on crop breeding, general agronomy, pest and disease management, food processing, postharvest storage, and general smart agriculture were excluded unless they directly supported the interpretation of threshing losses, cleaning losses, grain damage, or sensing for control purposes. From a scientific perspective, this review aims to synthesize how crop conditions and field disturbances translate into material flow conditions, threshing and separation loads, cleaning sieve loads, losses, and grain damage, together with the resulting sensing requirements and control variables. From a practical perspective, it aims to identify how these mechanisms can guide structural design, simulation validation, sensing and control of actuators, and whole-machine coordination to achieve stable harvesting with low losses and minimal grain damage.
The search strategy combined three groups of keywords: machines and components; threshing and cleaning processes or mechanisms; and structural optimization, numerical simulation, and sensing and control technologies. Terms related to machines and components included “combine harvester”, “threshing device”, “rasp bar”, “spike tooth”, “concave”, “cleaning device”, “vibrating sieve”, “louvered sieve”, “fan”, and “air duct”. These terms were combined with process- and mechanism-related terms, including lodging, high moisture content, feed rate, material layer, material flow, grain detachment, separation, threshing loss, cleaning loss, grain breakage, impurity content, material other than grain (MOG), airflow field, and screening. Technology-related terms included the discrete element method (DEM), multibody dynamics (MBD), computational fluid dynamics (CFD), CFD–DEM coupling, response surface optimization, machine vision, sensors, online monitoring, soft sensing, adaptive control, fuzzy control, model predictive control, and coordinated control. The thematic composition of the retrieved literature is summarized in Figure 1 as a keyword co-occurrence network. In this network, “combine harvester”, “threshing”, and “cleaning” form the core nodes; “crop”, “discrete element method”, and “computational fluid dynamics” connect the material-property and methodological clusters; and “feed rate”, “loss”, “monitoring”, and “control” link structural design with research on sensing and control. The search and screening process is described below and summarized in Figure 2.
Figure 1.
Distribution of keywords related to threshing and cleaning systems.
Figure 2.
Workflow of the literature search, screening, and thematic synthesis for the review.
Because this study is a narrative review supported by a structured search and thematic synthesis, rather than a formal PRISMA-style systematic review, the search process was intended to identify technically relevant literature rather than establish complete record counts at every stage. The numbers reported for individual stages are therefore approximate. Searches of the main databases and checks of supplementary sources identified approximately 950 candidate records before title and abstract screening. After deduplication and record standardization, approximately 700 records proceeded to screening. The retrieved literature then underwent several stages, including preliminary relevance screening, which excluded approximately 320 records; full-text technical relevance assessment, which excluded approximately 210 studies; thematic organization; and final narrative synthesis. Ultimately, 164 sources were included in the narrative synthesis. Approximately 780 records were removed or excluded throughout the process, giving an inclusion rate of approximately 18% of the initially identified records. These sources were selected because they either directly supported connections between threshing and cleaning mechanisms and structural design, simulation, and control strategies, or provided essential background evidence for explaining the associated challenges in loss formation, sensing and control, and whole-machine integration.
Within this workflow, the retrieved studies were initially screened according to their titles, abstracts, keywords, publication types, and thematic relevance. Full-text assessment considered their methodological, experimental, modeling, or review value in relation to the structural configurations of threshing and cleaning devices, material flow and load evolution, loss and grain-damage formation, numerical simulation methods, intelligent sensing, adaptive and coordinated control, or whole-machine integration. Studies were included if they addressed threshing, separation, or cleaning in grain combine harvesters or closely related harvesting machinery, covering field and crop conditions, load evolution, material-flow instability, loss formation, grain damage, structural and parameter optimization, numerical simulation, sensing, monitoring, control, or whole-machine integration. They were excluded if they concerned only crop breeding, agronomy, pest and disease management, food processing, post-harvest storage or general smart agriculture; patents, manuals, news reports, and non-academic web pages lacking technical detail were also excluded, and commercial web pages were used only as visual or structural references. Retained studies were not treated as equivalent evidence: priority was given to field validation, bench or prototype experiments, quantitative performance data, documented sensor or control implementations, and validated models, whereas simulation-only studies were kept where they offered mechanistic insight into processes difficult to observe directly—airflow–sieve–material interaction, DEM-based grain redistribution, impact damage, or the dynamic response of concaves and frames—but were read as mechanistic or model support rather than as evidence of field readiness. Where findings overlapped, the more recent, experimentally validated or more completely reported work was preferred, so that the synthesis balanced methodological relevance, technological maturity, and strength of evidence.
3. Overall Configuration and Operating Principles of Threshing and Cleaning Systems
3.1. Overall System Configuration
A threshing unit consists mainly of a cylinder, concave, guide elements, feeding and residue discharge mechanisms, and a drive system [20,21]. Rasp bars, spike teeth, or plate teeth on the cylinder act on the crop material to detach the grain. The cylinder and concave form a threshing zone, and detached grain and fine residue can pass through the concave. Guide elements regulate the direction and residence time of the material, while the feeding and residue discharge mechanisms maintain its continuous passage through the unit. Based on cylinder orientation and material flow path, threshing units are classified as tangential-flow, axial-flow, or combined tangential–axial-flow designs [22,23]. After threshing, the straw passes through straw walkers or a rotor separator to recover grain still carried with it.
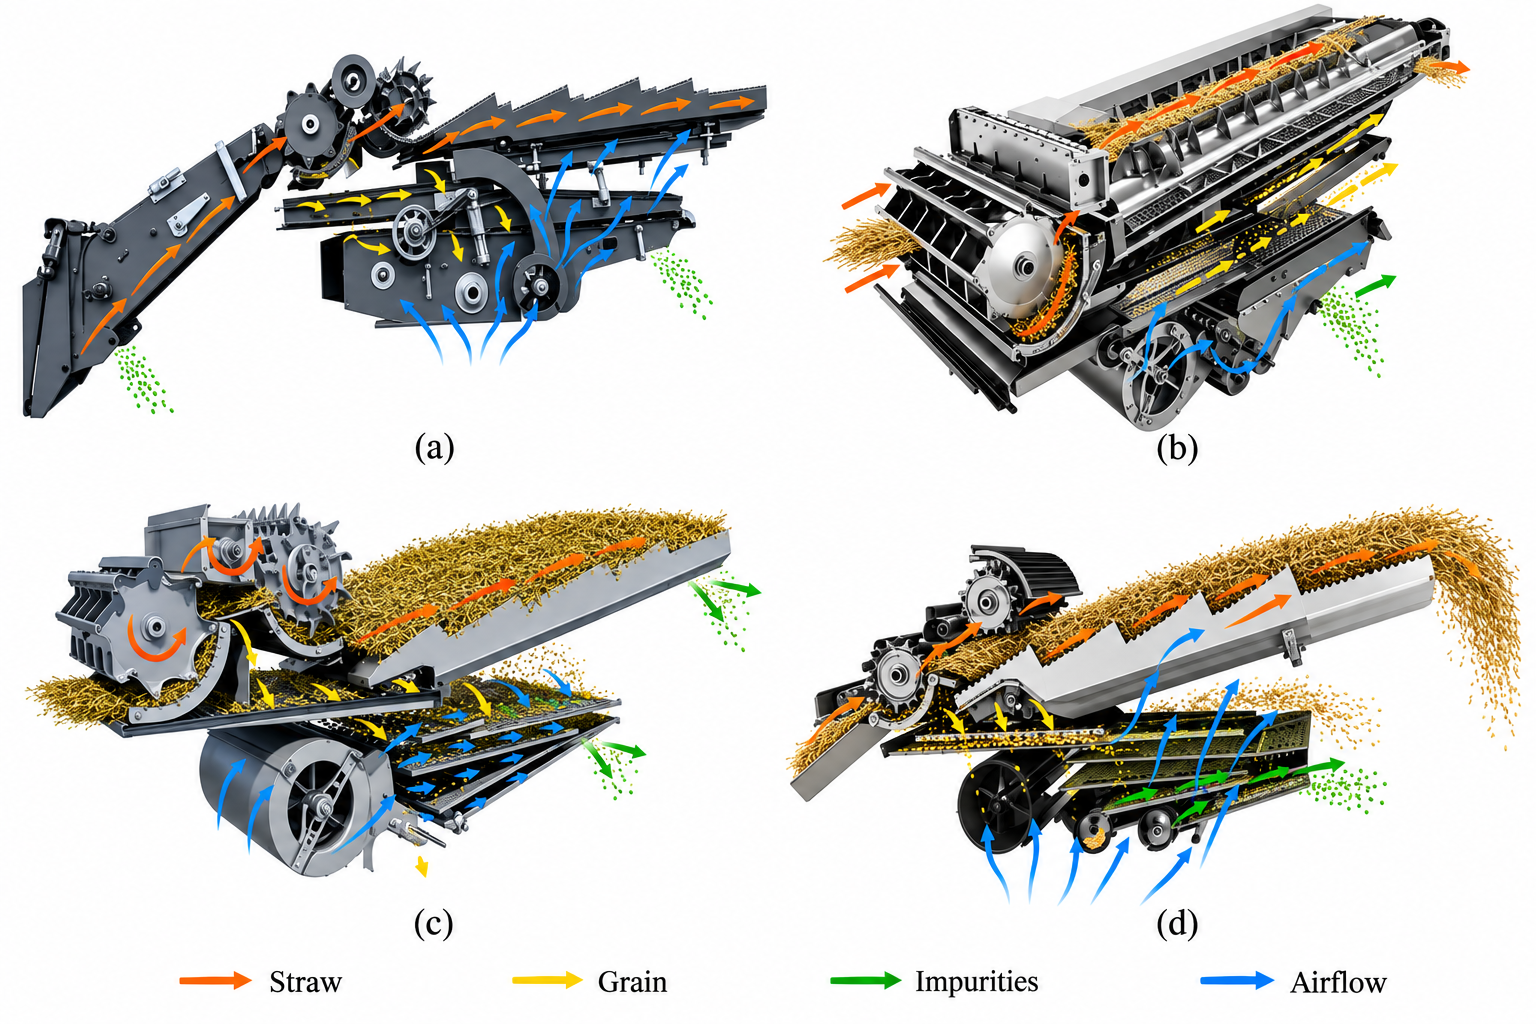
The cleaning unit consists mainly of a conveying system, upper and lower sieves, and a fan. Grain, husks, short straw, and other residue from threshing and separation fall onto the sieves, where reciprocating sieve motion, gravity, and airflow promote stratification and separation [24,25]. Sieve openings are adjusted according to crop type and grain size. Airflow carries away light residue, while grain passes through the sieve openings into the collection and conveying system [26,27,28]. Table 1 compares the equipment configurations of four combine harvester model series, and Figure 3 shows the corresponding material flow paths. The configurations in Figure 3a,c,d use straw walkers for separation, whereas that in Figure 3b uses two longitudinal rotors. Both separation systems deliver the separated grain and fine residue to the air-and-screen cleaning unit below.
Table 1.
Configurations and features of threshing and cleaning systems in representative combine harvesters.
3.2. Operating Principles of Threshing and Cleaning
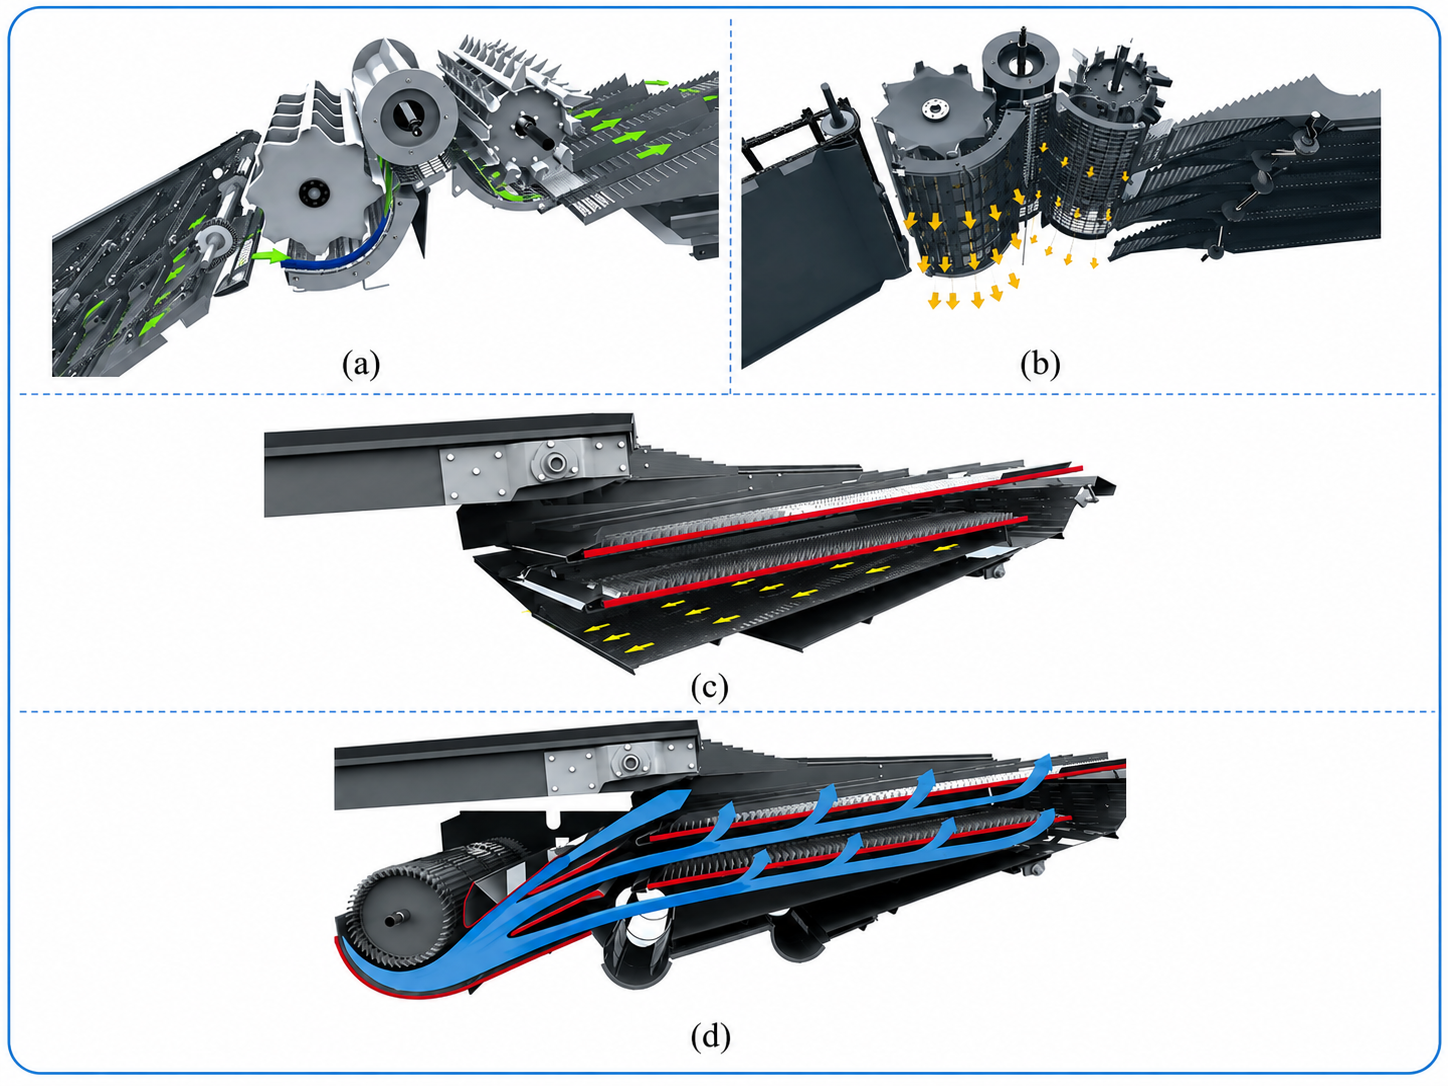
Threshing involves three successive processes: grain detachment, movement through the material layer, and passage through the concave. In the threshing zone, the cylinder subjects the crop to impact, compression, rubbing, and combing actions, detaching grain from the heads before it passes through the material layer and concave for separation (Figure 4a,b). Increasing cylinder speed or reducing concave clearance intensifies threshing, but excessive threshing intensity increases grain breakage and power consumption. Excessive concave clearance may reduce threshing efficiency, while an overly thick material layer can hinder grain passage through the concave [33,34]. Moisture content, feed rate, concave opening characteristics, and material residence time also affect the forces acting on grain and its movement. Threshing parameters should therefore ensure complete grain detachment, prompt separation, and smooth material flow to minimize grain breakage and grain losses in discharged residue.
Figure 3.
Overall configurations of threshing and cleaning systems in representative combine harvesters [29,30,31,32]. (a) DEUTZ-FAHR C9000 series; (b) CLAAS LEXION APS SYNFLOW HYBRID; (c) New Holland TC series; (d) Fendt C series.
Cleaning uses airflow and sieve motion to separate grain from husks, short straw, broken heads, and dust based on differences in aerodynamic properties, size, and mass [8,35] (Figure 4c,d). Airflow loosens the material layer and suspends and transports light residue, while sieve vibration rearranges and stratifies the particles, allowing grain to move downward and pass through the sieve openings [35,36,37,38,39]. The terminal velocity ranges of different components overlap, so insufficient air velocity allows residue to accumulate, whereas excessive air velocity may carry grain away. Through suspension tests on threshed foxtail millet material, Hou et al. [40] found that moisture content significantly affected the terminal velocities of grain, panicle fragments, stems, and leaves, indicating that cleaning air velocity should account for each component’s moisture content. Excessive vibration may also disrupt established stratification [41,42]. Increasing the feed rate also changes material layer thickness, porosity, and airflow resistance, affecting airflow through the layer and grain passage through the sieves [43,44]. Cleaning parameters should be adjusted to the material load so that airflow removes light residue and sieve motion promotes stratification and grain passage, thereby limiting cleaning losses and impurity content.
Figure 4.
Operating principles of threshing and cleaning [29]. (a) Crop feeding and grain detachment; (b) Grain separation through the concave; (c) Material transport on vibrating sieves; (d) Airflow-assisted cleaning.
4. Structural Design and Simulation of Threshing Systems
4.1. Threshing System Configurations
4.1.1. Cylinder Threshing Systems
Cylinder threshing units detach grain from crop heads through mechanical action between the cylinder and concave. As shown in Figure 5, these units are classified as tangential-flow, axial-flow, or combined tangential–axial-flow designs according to the direction of material movement relative to the cylinder. The three designs differ mainly in material flow path, duration of mechanical loading, and threshing intensity, so selection should account for crop type, feed rate, and moisture content.
Figure 5.
Threshing cylinder configurations [23,45,46,47,48].
A tangential-flow threshing unit consists of a transverse cylinder and a grate concave. Material passes tangentially around the cylinder along a short path with brief exposure to mechanical forces, making the unit suitable for rapid initial threshing. Li et al. [23] found that the tangential-flow cylinder completed 67.19–82.37% of threshing while accounting for approximately 20% of the total threshing power demand. In a tangential–axial test device threshing rice at a feed rate of 7 kg/s, a cutter-tooth tangential cylinder discharged 47.71% of the grain through the concave, the highest initial separation rate among the five threshing elements tested [49]. Tangential-flow cylinders are therefore often installed ahead of longitudinal axial-flow units to perform part of the threshing before the material enters the latter. A tangential-flow cylinder can also operate independently at low feed rates with crops that are easy to thresh, as demonstrated by Hao et al. [50] in oilseed sunflower threshing trials, where a cut-flow machine achieved an impurity content of 1.94% and a loss rate of 2.64% at a cylinder speed of 264 r/min, a feed rate of 1.9 kg/s, and a threshing clearance of 36 mm. At higher feed rates or with crops that are harder to thresh, a downstream unit is usually needed to continue threshing.
In axial-flow threshing units, material follows a helical path around the cylinder while moving along its axis. The longer path extends the duration of mechanical loading, promoting grain detachment. Cylinder speed, feed rate, and material moisture content affect threshing performance, with suitable settings varying among crops. For maize, cylinder speeds of 254–486, 278–466, and 313–445 r/min were optimal at feed rates of 8, 10, and 12 kg/s, respectively, keeping the kernel breakage rate below 5% and the unthreshed rate below 2% [51]; for soybean, a moisture content of no more than 16%, a rotor speed of 10–12 m/s, and a feed rate below 150 kg/h were recommended [52]. To limit grain damage from repeated impacts, Teng et al. [53] set a segmented cylinder to adjust threshing intensity in different sections, which reduced the breakage rate from 1.46% to 1.00%, the impurity content from 1.85% to 1.43%, and the loss rate from 1.72% to 1.20% in wheat at a cylinder speed of 905 r/min and a feed rate of 4 kg/s, while Zhang et al. [45] rigid–flexible coupled threshing elements to reduce grain breakage in maize with high moisture content, obtaining a breakage rate of 3.78% and an unthreshed rate of 1.47% at a feed rate of 7.8 kg/s, 1.79 percentage points lower in breakage than a conventional open cylinder. These approaches reduce excessive impacts during threshing by segmenting the cylinder or modifying how the threshing elements contact the crop, respectively.
A combined tangential–axial-flow threshing unit consists of a front tangential-flow cylinder, transition components, and a longitudinal axial-flow cylinder. Material undergoes initial threshing in the tangential-flow cylinder before entering the longitudinal axial-flow cylinder for further threshing. Researchers showed through rice experiments that this configuration maintained high threshing efficiency at high feed rates while limiting threshing losses and grain breakage: with a longitudinal cylinder 3160 mm long and a guide vane angle of 7.64°, the entrainment loss was about 0.29% at a feed rate of 7 kg/s [54], while the optimized combination of 862 r/min for the tangential cylinder and 806 r/min for the longitudinal cylinder gave a total threshing and separating loss of 0.62% at a power consumption of 40.42 kW [55]. Behind a cutter-tooth tangential cylinder, spike-tooth re-threshing raised the threshing rate to 99.96% with an entrainment loss of 0.31% at a feed rate of 8 kg/s [49]. Wang et al. [48] applied this configuration to oats to reduce entanglement of long straw and improve material flow, and the threshing rate and the mass fraction of long stalks were optimized at an axial-flow drum speed of 800 r/min, a horizontal center distance of 820 mm, and a vertical height difference of 10 mm. Material transfer between the front and rear cylinders directly affects the continuity of staged threshing. Tang et al. [56] found that material tended to accumulate between the cylinders, highlighting the need for appropriate transition components and coordinated operating parameters for both cylinders. Table 2 summarizes the structural features and suitability of the three types of threshing units. Selecting a tangential-flow unit primarily depends on its capacity for rapid initial threshing, whereas axial-flow units must balance threshing completeness against grain damage, and combined tangential–axial-flow units also require smooth material transfer between cylinders. Table 3 systematically summarizes the structural and operating parameters of different threshing devices reported in the literature, highlighting the typical ranges of key parameters, including cylinder speed, cylinder diameter, concave clearance, and threshing-zone length, for different crops and threshing configurations. This summary provides a reference for parameter comparison and the structural design of different threshing devices.
Table 2.
Structural features and functions of threshing cylinder configurations.
Table 3.
Structural and working parameters of threshing devices for major grain crops [22,52,53,57,58,59,60,61,62,63,64].
4.1.2. Concaves and Auxiliary Threshing Devices
The concave and cylinder together define the threshing zone, while the concave also provides an outlet for detached grain. Figure 6 illustrates how concave design affects the forces acting on the material, material movement, and grain discharge, alongside the development from fixed to adjustable configurations. The concave must work with the cylinder to thresh the crop while allowing detached grain to exit promptly, reducing repeated impacts.
Fixed concave design must balance threshing capacity, structural strength, and the amount of material other than grain passing through the concave. Liu et al. [65] replaced the grid concave of a longitudinal axial-flow sunflower device with a round-tube concave to limit sunflower head fragmentation, and the optimized device reached a threshing loss of 2.35% and an undersize grain mass ratio of 81.34% at a threshing gap of 24.9 mm, a drum speed of 244 r/min, and a feed rate of 2.95 kg/s; Fan et al. [66] combined rounded-tip spike teeth with a segmented round-tube concave arranged from sparse to dense to reduce grain breakage, grain losses in the discharged residue, and concave blockage when threshing maize with high moisture content, lowering the grain breakage rate from 13.73% to 8.64% and the unthreshed rate from 0.60% to 0.20% in field trials against a conventional trapezoidal-tooth cylinder with a grid concave. Crossbar shape and concave profile also affect the forces acting on the material and its movement. At a feed rate of 16.8 kg/s and a grain moisture content of about 35%, an Archimedean-spiral concave fitted with oblique crossbars 19 mm wide and inclined at 25° reduced the unthreshed grain loss to 0.03% while keeping the total breakage rate below 3%, whereas a circular-arc concave with rectangular crossbars gave an unthreshed loss of 9.10% [67]. Pužauskas et al. [68] compared rectangular, rounded, and oblique crossbars in a variable-radius concave and found that oblique crossbars with a working-plane tilt of 45° gave the lowest threshing loss and grain damage at a cylinder speed of 350 r/min and a grain moisture content of 36.36%. Steponavičius et al. [69] found that progressively narrowing the clearance along the material flow direction, with the concave surface following an Archimedean spiral, prevented maize ears from slowing markedly in the rear section; the threshing loss fell from 2.2% to below 0.3%, and the damaged grain fraction remained within 3%. These studies extended concave design beyond open area ratio to include crossbar shape, concave profile, and clearance distribution, helping maintain appropriate mechanical loading and material velocity during threshing.
Figure 6.
Technological development of concaves and auxiliary threshing devices [53,68,69,70,71,72].
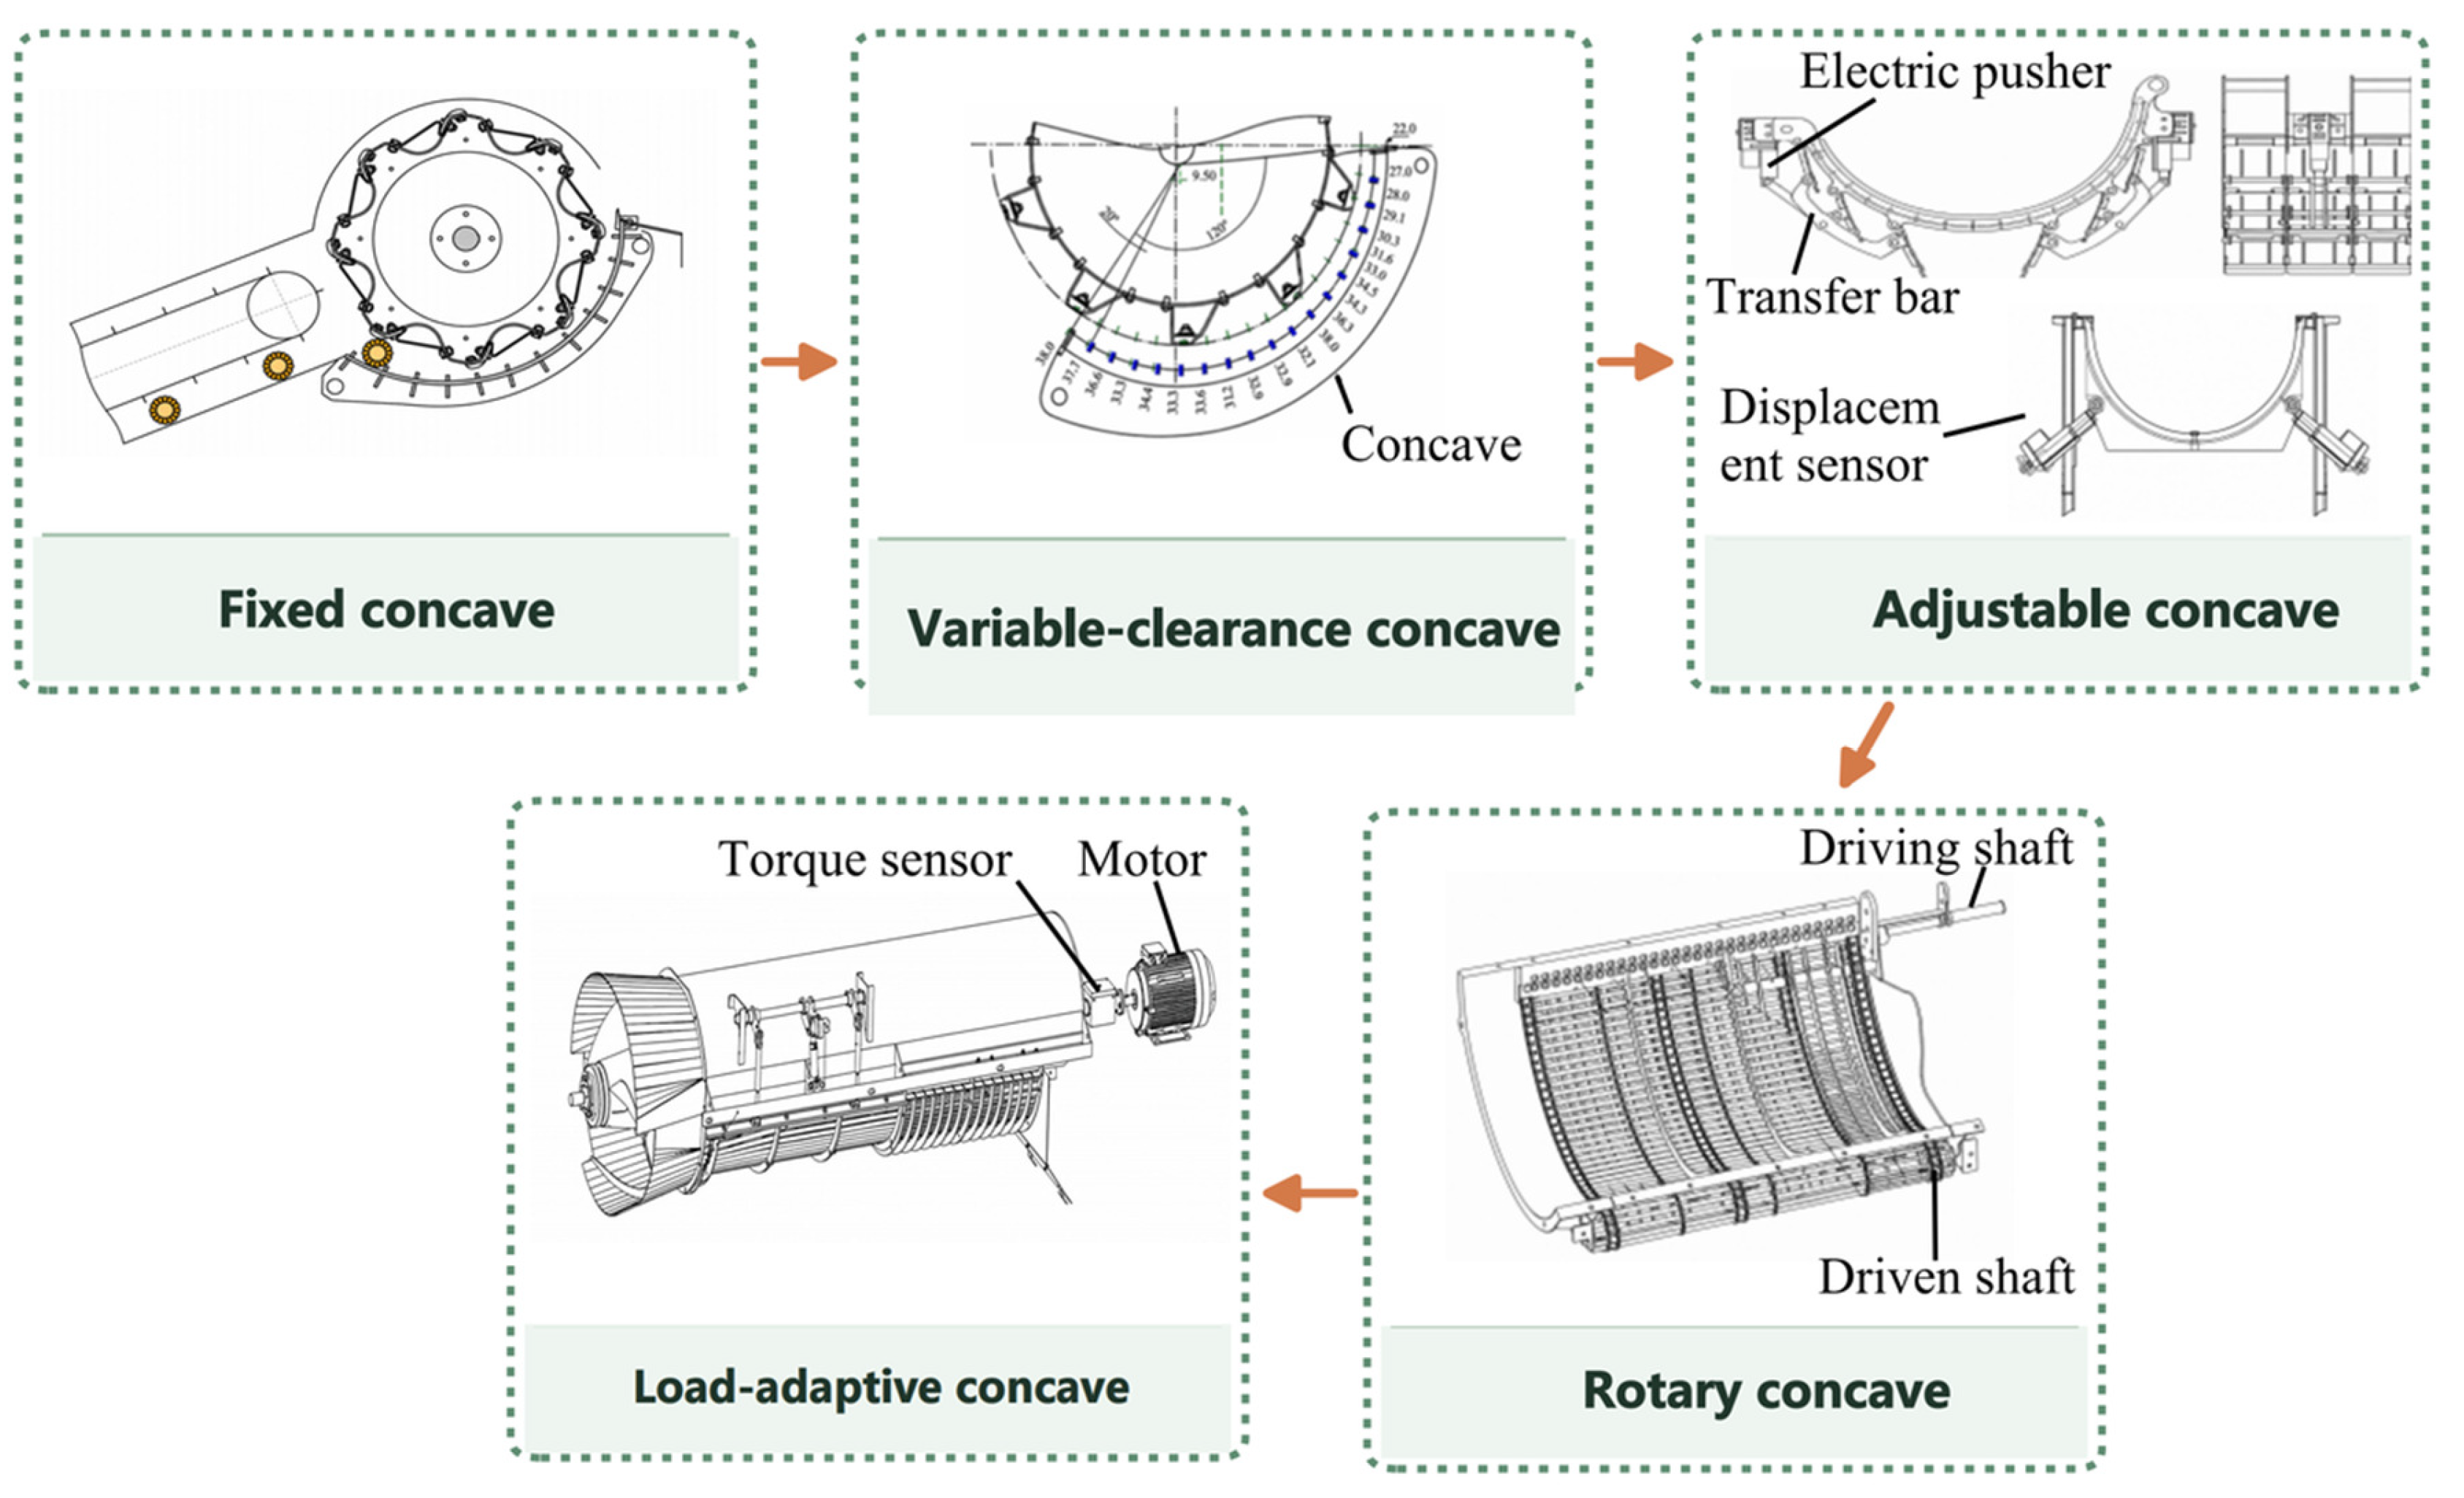
Concave clearance determines how tightly material is confined as it passes through, and setting and adjusting the clearance by section allows threshing intensity to vary along the concave. In rice threshing tests, Liu et al. [10] used a multiple-clearance configuration to address the difficulty of balancing threshing efficiency and grain breakage with a single clearance, reducing the total loss rate by an average of 5.77% compared with the single-clearance configuration. Li et al. [73] used the oil pressure on the rear side of the concave as a measure of cylinder load and showed that, at the rated feed rate of 6.0 kg/s, enlarging the clearance from 35 mm to 45 mm lowered the oil pressure from 1114 N to 758 N, but raised the total threshing and separating loss from 1.08% to 1.31%, the best performance being obtained at 35 mm. Kang et al. [74] developed an independently adjustable concave in which the front and rear sections and the left and right sides are set separately; for soybean at a feed rate of 3.4 kg/s, an asymmetric clearance layout gave a breakage rate of 2.64%, a loss rate of 1.12%, and an impurity content of 1.97%. Compared with whole-concave or symmetrical adjustment, such sectional and independent adjustment allows clearances in different regions to be varied separately, helping balance threshing intensity, material discharge, and downstream cleaning load. Concave clearance design should therefore consider both the clearance size and its distribution across the inlet, outlet, and intermediate sections.
At high moisture contents or feed rates, material tends to accumulate over the concave and cause blockages. Liu et al. [71] used a rotary grate concave whose active motion promoted material passage through the concave openings and reduced blockages; at a cylinder speed of 550 r/min, a concave linear speed of 1 m/s, and a feeding-chain speed of 1.2 m/s, the loss, breakage, and impurity rates were 2.14%, 0.20%, and 0.60%, and the working efficiency was more than 30% higher than that of a machine with a fixed grate concave when harvesting high-yield rice. In addition to modifying concave motion, adjusting the guide vanes on the top cover can regulate the axial velocity and residence time of material; Wu et al. [75] found that a guide-vane spiral angle of 28° maximized the material axial velocity, and field trials at a cylinder speed of 550 r/min and a travel speed of 3 km/h reduced the loss rate from 1.36% to 1.26%, the impurity content from 1.10% to 0.73%, and the grain breakage rate from 0.99% to 0.61%. Milišauskas et al. [57] compared guide-vane configurations with full-length linked adjustment and local adjustment in winter wheat field trials. Setting all eight guide vanes to 25° achieved a feed rate of 20.6 kg/s and a threshing loss of 0.96%, supporting the use of guide-vane adjustment to regulate material transport and balance throughput against threshing loss (Figure 7a).
Figure 7.
Active adjustment mechanisms for concaves and auxiliary flow-guiding devices [22,57]. (a) Adjustable guide vanes for crop flow; (b) Hydraulic concave clearance control.
Building on these studies, concaves and auxiliary threshing devices are beginning to shift from passive structural optimization towards closed-loop adjustment based on load monitoring. Using threshing cylinder shaft torque as an indicator of feed load, Fan et al. [22] developed an automatic clearance adjustment system comprising a hydraulic cylinder, a proportional valve, and a displacement sensor (Figure 7b). The controller determines the target clearance from the measured load, drives the hydraulic cylinder to move the concave, and uses displacement feedback to correct its position. Compared with a fixed clearance of 50 mm, automatic switching between 45, 50, and 55 mm reduced the fluctuation range and peak value of threshing cylinder torque by 38.27% and 18.38%, respectively, while reducing the grain breakage rate by an average of 2.08% and the unthreshed grain rate by 0.10%. Liu et al. [76] automatically adjusted the soybean threshing clearance based on the feed rate measured in the feederhouse, reducing grain breakage and loss rates to 2.36% and 0.70%, respectively. Both studies show that concave clearance can be adjusted in response to changes in feed load to reduce grain breakage and threshing losses. Guide vanes can also enable load-adaptive adjustment, as demonstrated by Fan et al. [77], who automatically adjusted the angle of the top-cover guide vanes in a maize threshing device according to feed rate; the optimum inclinations were 22°, 24°, and 26° at feed rates of 6, 8, and 10 kg/s, and compared with a constant inclination of 20°, the control system achieved a steady-state response time of 0.15 s with an error within 0.27° and reduced the grain breakage rate by 1.63 percentage points, the unthreshed grain rate by 0.06 percentage points and the grain entrainment loss by 0.19 percentage points.
Improvements to concaves and auxiliary threshing devices focus on three areas: adapting concave openings, crossbar shapes, and surface structures to crop characteristics to reduce grain damage; replacing a fixed clearance along the full length with sectional settings or independent adjustment to vary local threshing intensity; and using rotary concaves, adjustable guide vanes, and clearance adjustment mechanisms to control material movement and discharge, with load monitoring enabling automatic adjustment. Table 4 summarizes the functions of these structures and the conditions under which they are suitable. Understanding how these structures alter material movement requires further analysis of material transport and collisions within the concave region and passage through its openings. Because these processes are difficult to observe directly, the discrete element method can simulate interactions among the threshing cylinder, material, and concave, assess how structural and parameter changes affect threshing and separation, and screen parameter combinations to reduce the number requiring experimental testing.
Table 4.
Comparison of structures, adjustment variables, and applicability of concaves and auxiliary threshing devices.
4.2. Simulation Applications in Threshing Systems
The discrete element method (DEM) can reveal how threshing device structures alter material movement and forces, and how these changes affect threshing performance. Material velocities, contact forces, residence times, and locations of passage through the concave are difficult to measure directly within the threshing cylinder, but DEM can continuously track these variables to compare the effects of different threshing clearances, threshing element types, cylinder orientations, and adjustment methods. Simulation results can help screen structural designs, reduce the need for prototype fabrication, and explain the causes of changes in threshing performance [5,79].
Crop models and contact parameters form the basis of simulation analysis. Chen et al. [80] and Shu et al. [81] calibrated contact parameters using shape measurements and impact or friction tests in combination with response surface methodology. Metrics such as the angle of repose are used to assess how well a model reproduces bulk material behavior; for device design, the model must also be validated against experimental measurements of threshing completeness, threshing rate, axial material distribution, load, or damage rate to assess its ability to reproduce actual operating processes. A typical DEM workflow involves building the device model; incorporating the crop model and operating conditions; analyzing material velocities, forces, and threshing performance to select parameters; and validating the results through bench tests. Pang et al. [82] developed a model of wheat threshing in a single longitudinal axial-flow unit to examine how cylinder speed, inclination angle, and threshing clearance affect unthreshed grain, threshing loss, and grain breakage rates. The selected settings were 850 r/min, 6° and 20 mm, with relative errors below 5% between simulated and bench-test results for all three metrics (Figure 8a). To reduce seed damage, Yang et al. [83] conducted simulations using an orthogonal rotatable composite design with cylinder speed, feed rate, and threshing clearance as factors. Compared with conventional steel spike teeth, flexible drum teeth reduced the grain breakage rate by 55.9% and entrainment losses by 15.3% while maintaining threshing capacity (Figure 8b). Physical tests confirmed these results, indicating that changing how threshing elements contact the crop can reduce grain damage and entrainment losses.
Figure 8.
Representative applications of DEM simulations to threshing systems [33,34,82,83,84]. (a) Wheat threshing; (b) Flexible-tooth rice threshing; (c) Ratoon rice threshing; (d) Rasp-bar maize threshing; (e) Maize kernel losses.
DEM simulations are used both to screen operating parameters and to compare the shapes, materials, and arrangements of threshing elements. Zeng et al. [33] compared the forces on rigid, flexible, and rigid–flexible coupled rod teeth in rice threshing simulations; the rigid teeth produced the largest average normal impact and tangential rubbing forces and the flexible teeth the smallest, and in bench tests at 900 r/min, the breakage rates of the flexible, rigid, and rigid–flexible teeth were 1.63%, 1.93%, and 2.56%, with unthreshed rates of 0.29%, 0.07%, and 0.24% and entrainment losses of 1.60%, 0.73%, and 1.34% at 850 r/min (Figure 8c). Li et al. [34] analyzed how rasp bar spacing and material affected grain contact forces and velocities, selecting 50 Mn steel rasp bars with a spacing of 250 mm. The resulting device gave a kernel breakage rate of 1.93% at a cylinder speed of 356 r/min, a concave clearance of 40 mm, and a feed rate of 8 kg/s (Figure 8d). Cui et al. [84] compared trapezoidal rod teeth, round-headed spike teeth, and rasp bar blocks. The simulated average normal contact forces on the grain were 12.50, 12.32, and 8.03 N, respectively, in agreement with the ranking of the measured breakage rates. The simulated unthreshed rates were 0.15%, 0.37%, and 0.35%, and differed from the bench tests by no more than 0.25 percentage points. The cumulative contact-force curve also gave a critical force of 550 N for kernel breakage (Figure 8e).
The space between the threshing cylinder and concave, together with the shape and arrangement of threshing elements, affects material transport, forces and passage through the concave openings. Su et al. [9] compared concentric and non-concentric clearances using material velocities and axial distributions. They found that concentric clearance favoured stable transport and uniform threshing. Yu et al. [20] evaluated spike tooth widths based on contact forces and material accumulation. A width of 25 mm at a cylinder speed of 187.5 r/min raised the threshing rate to 98.04% and lowered the grain breakage rate to 2.56%, against 88.66% and 5.13% for conventional 15 mm spike teeth. Excessively wide 30 mm teeth caused overlapping impacts and a higher breakage rate of 3.19%. Wu et al. [85] examined a 360° rotary concave by analyzing particle velocities, forces, and the spatial distribution of threshing. At a cylinder speed of 81.89 rad/s, a concave speed of 9.34 rad/s, and a guide plate angle of 40°, the field threshing loss and grain breakage rates were 4.25% and 0.93%, compared with 6.42% and 2.58% for a conventional 180° concave; harvesting efficiency increased by 0.31 km/h. These processes link structural changes to threshing outcomes, helping explain performance changes and identify where adjustments are needed. For devices with moving mechanisms or airflow assistance, DEM can be coupled with other methods to analyze how mechanism motion or airflow affects the material. Liu et al. [86] coupled MBD with DEM (MBD-DEM) to study a variable-diameter rice threshing cylinder. They resolved a guide-rail angle of 30°, at which a piston stroke of ±8.66 mm adjusts the threshing gap by ±5 mm, and established relationships among feed rate, concave clearance, and hydraulic actuator load. Yuan et al. [87] coupled CFD with DEM (CFD-DEM) to simulate airflow and particle collisions in an airflow cylinder sieve for threshed rice. They identified an airflow velocity of 11 m/s, a sieve aperture of 11 mm, and two-turn deflectors as the combination that best separated grain from the mixture. MBD-DEM is used to analyze relationships among mechanism motion, forces on the material, and actuator load, whereas CFD-DEM is used to analyze interactions between airflow and material.
4.3. Common Design Criteria for Threshing Systems
Although tangential-flow, axial-flow, and combined tangential–longitudinal axial-flow devices differ in structure and material movement, threshing and separation involve three successive stages: grain detachment from the ear, movement of detached grains through the material layer, and grain discharge through the concave. Device design should provide suitable threshing intensity for the target crop, ensure material transport and grain discharge, reduce grain damage, and control the material load entering the cleaning unit. Figure 9 groups the relevant design criteria into five areas.
Figure 9.
Framework of design criteria for threshing systems.
The device structure must first be suited to the physical properties of the crop material. Grain size, grain attachment strength, moisture content, and the properties of non-grain material all influence the choice of cylinder configuration, threshing elements, concave clearance, and opening geometry. Operating parameters also need to be adjusted when crop type or moisture content changes [78]. Before design begins, the loading thresholds for grain detachment and damage, together with material flow characteristics, should be determined to guide the selection of structures and parameters. As material moves along the cylinder, grains detach progressively, and the primary function of each section changes accordingly. The front section primarily performs threshing, the middle section promotes detached grain movement through the material layer, and the rear section facilitates passage through the concave to reduce repeated impacts [53]. Cylinder elements, concave clearances, openings, and guide structures can be configured by section to discharge detached grains promptly and prevent excessive mechanical loading in the rear section. Low-damage design requires control over the magnitude and distribution of contact loads, as simply reducing cylinder speed may compromise threshing capacity. Smooth, rounded contact surfaces, suitable contact areas, and flexible elements can reduce local peak loads, allowing threshing through repeated, gentle compression, rubbing, and combing actions [20,21]. Small contact areas or sharp, protruding edges on threshing elements can concentrate loads and increase the risk of grain breakage. Threshing elements should therefore meet threshing requirements while limiting excessive local impacts.
Material residence time should be matched to the threshing capacity of the device. Axial transport velocity, effective working length, the capacity of the concave to pass material through its openings, and feed rate jointly determine whether threshing is completed and material is discharged promptly. Insufficient residence time can cause incomplete threshing and entrainment losses, whereas excessive residence time increases repeated impacts, blockage risk, and power consumption [69]. Cylinder speed, guide vane settings, and concave clearance should therefore be coordinated to maintain stable material transport while ensuring effective threshing [22]. In addition to the overall threshing rate, relevant characteristics include grain flow rate; the mass fraction of non-grain material, particle size, or stalk length distribution; moisture content; flow rate fluctuations; and lateral distribution. These characteristics affect material layer thickness on the sieve and local cleaning loads, providing inlet conditions for the design and adjustment of the cleaning unit.
Threshing device evaluation should cover grain detachment, movement through the material layer, and discharge through the concave, while also assessing grain damage and discharge characteristics. When crop properties or feed rate change, active adjustment should account for both threshing quality and discharge load, keeping the discharged material flow rate and distribution within the cleaning system’s handling capacity.
5. Structural Design and Simulation of Cleaning Systems
5.1. Cleaning System Configurations in Combine Harvesters
5.1.1. Vibrating Sieves
Reciprocating double-deck flat sieves are the most widely used cleaning sieves in combine harvesters, with common sieve surfaces including louvred, woven-wire, and round-hole types (Figure 10). While retaining the reciprocating drive, structural modifications mainly focus on sieve opening geometry and sieve surface layout. Stepped openings, combined opening geometries, and recessed openings with inclined sidewalls can alter particle orientation and sliding direction after impact, helping particles enter the openings. At an air velocity of 16 m/s, an air angle of 25°, a step height of 8.36 mm, and a vibration frequency of 4.45 Hz, a stepped vibrating screen combined with a cross-flow fan lowered the grain loss rate by 1.14 percentage points to 2.12% and raised grain cleanliness by 1.98 percentage points to 99.16% in comparison with a flat sieve, while the corresponding simulated values were 1.69% and 98.8% [88]. A countersunk screen with side walls inclined at 40–60° increased the probability of grain penetration and improved the screening efficiency of a maize cleaning device by 35.20% relative to a standard round-hole screen, with the best screening performance at an air velocity of 11.2 m/s [89]. Curved, segmented, and variable-amplitude sieves modify material motion intensity and residence time along the sieve, reducing accumulation at the front and allowing more material to reach the rear for screening. Using simulations and high-speed imaging, Ma et al. [41,42] analyzed a variable-amplitude screen whose motion was reduced to three degrees of freedom (two translations and one rotation); particles at the front of the screen were thrown up and moved rearward more quickly, but segregation and separation at the screen front were not favored, and increasing the turning angle of the front swing bar strengthened particle migration at the cost of stratification. Sieve surface design should therefore balance transport and stratification, with improvements assessed by where material passes through the sieve and the grain losses at its rear end.
Figure 10.
Structural types of sieve surfaces and apertures [90]. (a) Fish-scale sieve; (b) Oblong-hole sieve; (c) Woven-wire sieve; (d) Round-hole sieve.
Sieve opening geometry primarily affects particle passage through the sieve, whereas sieve motion can regulate material distribution and transport. Zhu et al. [91] improved the lateral uniformity of material distribution by increasing the degrees of freedom of sieve motion (Figure 11a); for a rice grain–stem mixture fed at 1.2 kg/s, the sieving loss reached a minimum at a sieve attitude angle of 1.2–1.9° depending on the non-uniformity of the feed, and the simulated and measured optimum angles differed by 6.8–14.6%. Inspired by earthworm locomotion, Wang et al. [92] developed a biomimetic sieve with multiple sieve plates that generated travelling waves to move material from front to rear, shortening the total screening time by 1.53 s compared with a reciprocating flat sieve at a feed rate of 7 kg/s (Figure 11b) and, at the same feed rate, lowering the grain loss by 0.54 percentage points and the impurity content by 1.40 percentage points. Automatic leveling can compensate for sieve inclination during operation on slopes, reducing material accumulation on one side. Wu et al. [93] developed an automatic leveling system for the cleaning sieve (Figure 11c), using fuzzy PID control to adjust sieve orientation in response to machine inclination. At machine inclinations of up to 10°, the maximum leveling time in laboratory tests was 1.85 s, and the sieve remained level during field tests through real-time adjustment. This extends sieve adjustment from setting parameters before operation to automatically responding to changes in machine orientation during operation.
Figure 11.
Representative mechanisms for complex sieve motion and active leveling [91,92,93]. (a) Vibrating sieve test bench with adjustable attitude; (b) Earthworm-inspired sieve test bench; (c) Self-leveling system for the cleaning sieve.
Vibrating sieve improvements address particle passage, material layer motion, and sieve orientation: opening geometry helps particles enter the openings; curved surfaces, segmented designs, variable amplitudes, and biomimetic wave motion modify material transport and residence time, while motion with multiple degrees of freedom regulates lateral distribution; and automatic leveling reduces material accumulation on one side during operation on slopes. Table 5 summarizes these structural designs and adjustment methods.
Table 5.
Vibrating sieve configurations and operating mechanisms.
5.1.2. Fans and Air Ducts
Cleaning fans and air ducts should be designed to distribute airflow across sieve regions according to material load, the terminal velocities of individual components, and the cleaning requirements at each stage. Existing configurations mainly include single-duct and multi-duct systems, multistage air supply, and combined blowing and suction systems with multiple airflow sources (Figure 12). Air supply performance should be assessed using total airflow rate, airflow distribution across the sieve width and length, and air velocity reduction under material loading, cleaning losses, impurity content, and energy consumption [15].
Cleaning fan selection should consider both air supply pressure and airflow distribution. Centrifugal fans provide relatively high static pressure and a compact structure suited to supplying multiple ducts, but wide outlets can produce uneven lateral air velocity distributions. Cross-flow fans deliver relatively uniform airflow across their width, with flow patterns influenced by the vortex core, vortex wall, and casing outlet geometry. For a 1.5 m-wide centrifugal fan with two parallel outlets, adding a cross-flow opening along the full width markedly increased the uniformity of airflow across the outlet width and increased the flow through the upper outlet [95]. Combined with a cross-flow fan at the rear of the cleaning shoe, a double-fan arrangement produced a high-speed flow of 4.76 m·s−1 in simulation and 4.03 m·s−1 in experiment at the shoe tail, which acted effectively on unfilled grains and short straws [83]. To improve lateral airflow distribution in centrifugal fans, Wada et al. [96] introduced a staggered multi-blade configuration in a three-duct fan. At a stagger angle of 10.5° and a rotational speed of 1200 r·min−1, the coefficients of variation in air velocity for the three ducts were 15.83%, 13.68%, and 14.68%, respectively, all below the reported values of 47.22% and 28.29% for the original four-blade fan. This study shows that modifying blade arrangement can improve outlet air velocity uniformity and provide a stable air supply to each duct.
The impeller, volute casing, outlet, and air ducts jointly influence the distribution of cleaning airflow. Specially shaped impellers and volute casings can modify lateral airflow distribution before the air enters the ducts, but their design should be coordinated with blade arrangement and outlet geometry, and air supply performance assessed with the ducts connected and sieve resistance accounted for. A double-conical centrifugal fan with K-shaped blades, in which the pressure difference between the large and small ends of the impeller generates a lateral airflow, produced a maximum lateral air velocity of 3.26 m·s−1 at a large-end diameter of 308.72 mm, a rotational speed of 1186.71 r·min−1, and a blade taper of 3.12°, lowering the cleaning loss rate to 1.08% and the grain impurity content to 0.68%, against about 1.5% and above 0.8% for existing machines [97]. In multi-duct systems, CFD-predicted duct air velocities agreed with hot-wire measurements within 15% when the resistance of the working load was represented by perforated plates [98]. Once air enters the ducts, guide plates, and the return pan distribute it among sieve sections to loosen the material layer, promote grain passage through the sieve, and remove impurities at the rear. Multi-duct configurations allow staged air supply according to the cleaning task of each sieve section [92,93]. For a rice combine harvester, replacing the single-duct system with a multi-duct fan and a return pan reduced the grain sieve loss from 2.46% to 0.08% and the grain impurity ratio from 4.78% to 0.511% in field tests [99]. Because the terminal velocities of full grains (6–8 m·s−1), short straws (3.12–5.21 m·s−1) and leaves (2.72–3.38 m·s−1) differ markedly, the multi-duct shoe delivered about 9 m·s−1 at the upper outlet, 4–6 m·s−1 in the middle section, and 3–4 m·s−1 at the tail [100]. Li et al. [101] combined a fan, guide plates, and a double-deck sieve to develop a cleaning system suited to the material load. The study found that fan speed and guide plate angle required coordinated adjustment because their effects on cleaning performance were interdependent; at a feed rate of 7.5 kg·s−1, a fan speed of 900 r·min−1, and a guide plate angle of 24°, the cleaning loss rate and impurity content were 1.27% and 2.41%, respectively. Guide plates shift the locations of high- and low-velocity airflow regions, directing air where needed to meet local cleaning requirements.
Researchers have used different fan configurations to address airflow distribution problems in different directions. Wang et al. [102] equipped a small ratooning rice combine harvester with a multi-duct cross-flow fan and a louver sieve; in field tests at a yield of 11,250 kg·hm−2 the total loss rate was 2.5%, the grain impurity content 1.74%, and the grain breakage rate 0.07%, with a working efficiency of 0.9 hm2·h−1. To counter airflow decay along the sieve and insufficient rear airflow, Liang et al. [90] used a centrifugal fan to supply the front and middle sections, and a cross-flow fan to supplement airflow at the rear. Yin et al. [103] added a rear induced-draft fan to an existing front-blowing arrangement, creating an air-and-sieve cleaning platform with front blowing and rear suction. The mean rear air velocity increased from 6.50 to 8.07 m·s−1, and the airflow non-uniformity coefficient decreased from 27.74% to 11.37%, indicating that rear suction can supplement local airflow and improve air velocity uniformity.
Cleaning airflow design should account for the airflow rate, where the air is directed, and how the airflow changes under material loading. The impeller supplies energy to the airflow and shapes its initial distribution; the volute casing and outlet influence pressure recovery and flow distribution; and the ducts and guide components determine where the air is delivered. Resistance from the material layer also alters the actual air velocity, so component configurations should be matched to the material load on the sieve. Table 6 summarizes the relevant structures and their performance characteristics. Table 7 summarizes typical fan–sieve configurations and their operating parameters in cleaning systems for rice, maize, and wheat, with particular emphasis on comparing sieve vibration amplitude, vibration frequency, and optimum air velocity across different cleaning mechanisms.
Figure 12.
Development of cleaning fan configurations [90,96,101,103,104,105,106,107].
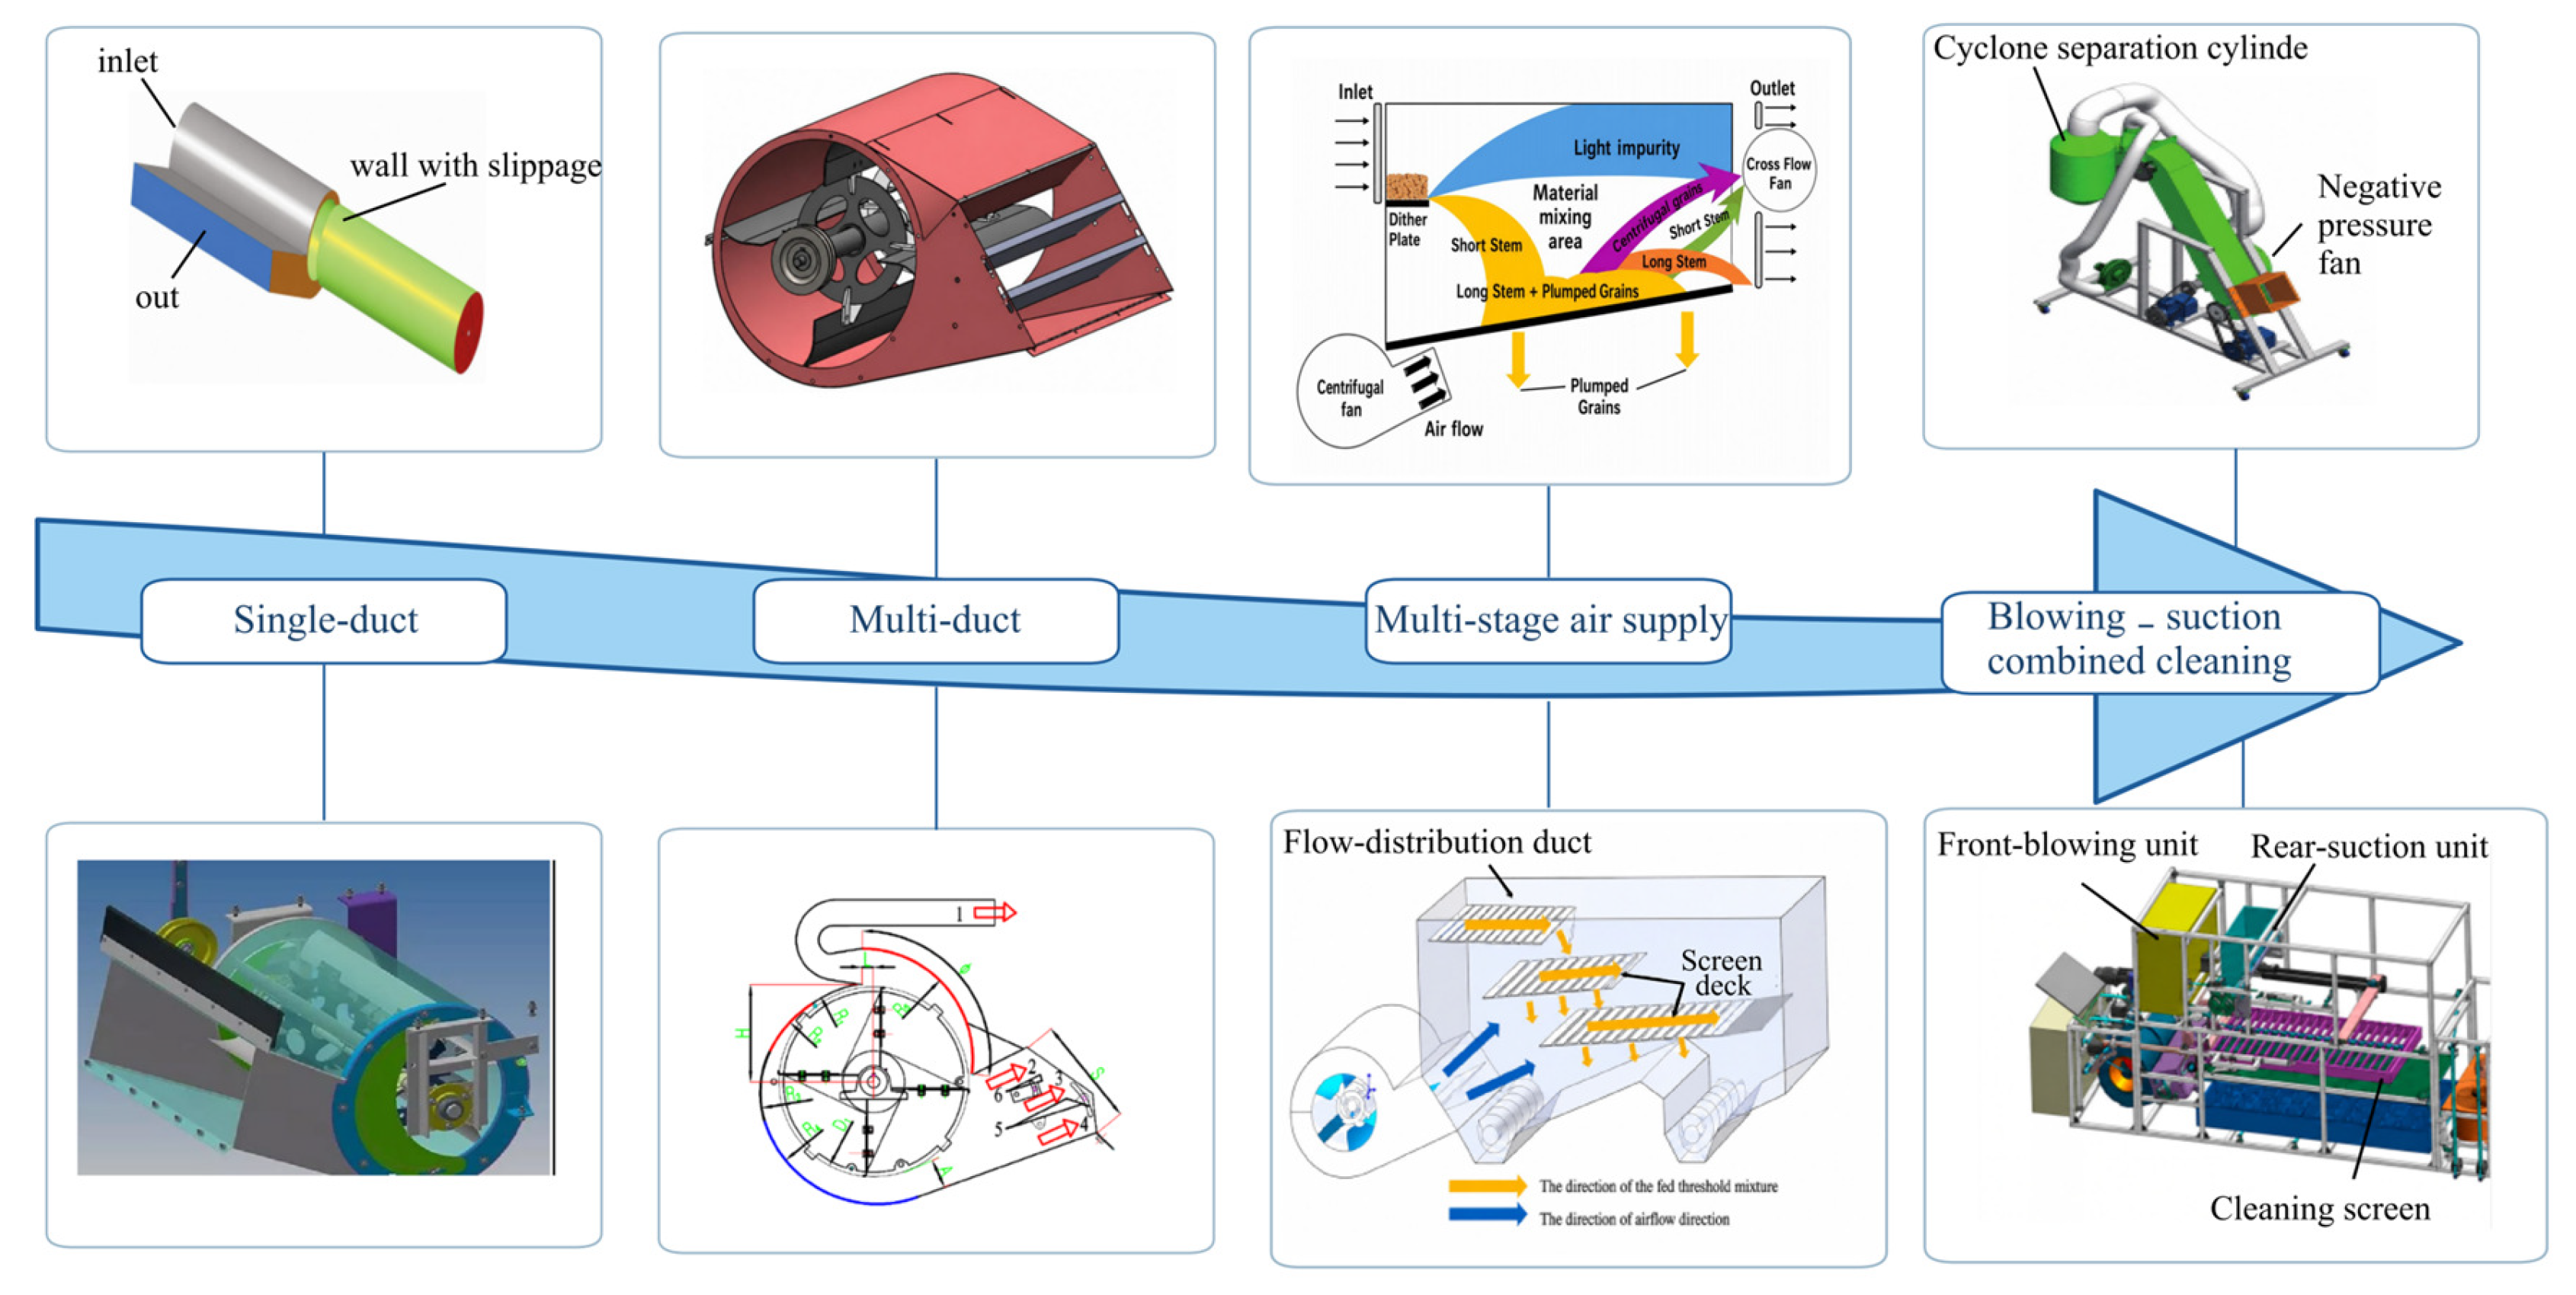
Table 6.
Fan–duct and air-and-sieve configurations.
Table 7.
Key structural and operating parameters of cleaning systems [88,109,110,111,112].
5.2. Simulation Applications in Cleaning System Design
5.2.1. Material Modeling and Parameter Calibration
Material models and parameter calibration enable simulations to represent the motion, contact interactions, and aerodynamic responses of actual materials. The material entering the cleaning unit includes grains, short stalks, husks, and light residues, each requiring appropriate particle models and parameters to account for differences in shape, density, flexibility, surface condition, and aerodynamic properties. Coetzee classified DEM parameter determination methods into direct measurement and inverse calibration against bulk behavior, identifying particle shape, contact parameters, and parameter sensitivity as key factors affecting model reliability [113]. Modeling and calibration therefore comprise geometric modeling, mechanical parameter calibration, aerodynamic characterization, and validation at successive levels, from material properties to device behavior.
Particle models should be selected according to material morphology and research objectives, while accounting for computational cost. Based on geometric complexity and deformability, existing models fall into three categories: regular geometric shapes and multi-sphere clumps, detailed non-spherical particles, and stalk and flexible-body models (Figure 12). Tubular models can represent short stalks when the focus is on void spaces within the material layer, aerodynamic separation, or motion without deformation. Analyses of bending, entanglement, fracture, or blockage require approaches that capture deformation, such as bonded-sphere chains, flexible fiber models, or MBD-DEM. Measured particle sizes, lengths, widths, and thicknesses; stalk length distributions; and component proportions should also be incorporated to preserve differences in material size and composition.
The six models in Figure 13 represent the same material at different levels of geometric fidelity, and the accuracy reached at each level has been quantified. In the regular and multi-sphere group (Figure 13a,b), a grain is rebuilt as a cluster of spheres whose mass, volume, and projected area match the measured values, and the bulk response is matched by calibration of the contact parameters, as the soybean and rice parameter sets above show. What such clumps cannot reproduce are the flat faces, edges, and surface roughness that control interlocking, so the resistance of the material layer tends to be underestimated and the deficit is absorbed by the calibrated friction coefficients [113,114]; the same simplification removes the shape-induced spread of terminal velocities on which pneumatic separation depends. The higher-fidelity models (Figure 13c,d), built by scanning or reconstructing the real outline, retain the wedge shape and germ depression of maize and the crease of wheat. For a maize-ear assembly built in this way, the simulated normal contact forces of three threshing elements, 12.50, 12.32, and 8.03 N, reproduced the ranking of the measured breakage rates, the simulated unthreshed rates stayed within 0.25 percentage points of the bench values, and a critical contact force of 550 N for kernel breakage was resolved [84]. For wheat, a five-ball kernel aggregate combined with a spherical-particle rachis and stem and Hertz–Mindlin bonding reproduced the measured angle of repose to within 0.58% and the bending failure force to within 1.99%, and the assembled device model predicted the unthreshed rate, the separation loss, and the breakage rate with errors below 5% [82]. The gain is paid for in computation, since the same study had to reduce the particle radius to reach this accuracy, which lengthened the simulation time.
Figure 13.
Representative material models for cleaning simulations [82,84,113,115,116,114]. (a) Soybean grain model; (b) Rice grain model; (c) Maize grain model; (d) Wheat grain model; (e) Bonded short-straw model; (f) Flexible bonded-chain straw model.
The two straw representations differ in what they are able to deform. The bonded short-straw model (Figure 13e) approximates a stem as a chain of bonded spheres whose bonds fail above a critical stress, and thereby reproduces bending stiffness, fracture, and the fragment sizes that determine the load imposed on the concave; its bond stiffness, critical stress, and damping cannot be measured directly but are calibrated against a three-point bending test. The flexible bonded-chain model (Figure 13f) uses a longer chain with more compliant bonds and therefore follows large deflection, entanglement, and the formation of a coherent material layer, at a cost that grows with the number of segments; in return it allows wrapping and blockage to be analyzed, which neither a rigid tube nor a short bonded segment can represent. In both cases the bond parameters remain calibrated rather than measured, so the models support comparison of straw behavior between geometries but not the prediction of absolute bending forces without a matching mechanical test. Model selection therefore reduces to choosing the lowest fidelity that still resolves the mechanism of interest: multi-sphere clumps for transport, sieving, and aerodynamic classification; high-fidelity non-spherical grains where contact forces and damage are the target; and bonded or flexible chains where deformation, fracture, or blockage must be represented.
Different methods are needed to determine different types of parameters. Properties such as density and dimensions can be measured directly, whereas contact parameters governing friction, rolling resistance and adhesion are often inferred from experimental results, with the methods and corresponding responses summarized in Table 8. Ghodki et al. [115] calibrated the material and contact parameters of the Hertz–Mindlin model for soybeans using a box piling test, comparing pile profiles, grain pile heights at the retaining plate, and angles of repose. Adhesive interactions must also be accounted for when modelling wet materials. Zhao et al. [116] used the Hertz–Mindlin contact model for dry materials and introduced surface energy through the JKR model for wet materials. At a rice moisture content of 16.49% and an intergranular surface energy of 0.006 J·m−2, the simulated angle of repose was 35°, consistent with the measured value. The angle of repose can be used to calibrate contact parameters, but different combinations of friction and adhesion parameters may yield similar results. Sensitivity analysis can therefore first identify the most influential parameters [117], after which impact, sliding, shear, and piling tests can be combined to determine suitable parameter combinations.
Table 8.
Input parameters and calibration methods for material models.
5.2.2. CFD and Coupled Gas–Solid Simulations
Coupled CFD–DEM simulations typically involve geometric modeling, mesh generation, particle parameter calibration, coupled solution, and experimental validation (Figure 14). This approach can analyze local airflow, particle forces, and motion that are difficult to observe directly, helping explain how fan, duct, and sieve structures affect cleaning performance. CFD calculates pressure and velocity distributions within the cleaning chamber, while DEM describes particle collisions, stratification, transport, and passage through the sieve. By exchanging particle force and momentum information, the two methods jointly account for the resistance of the material layer to airflow and the forces exerted by airflow on particles [118].
Figure 14.
Workflow for coupled simulations.
The simulation method should be selected according to solids concentration and particle contact conditions. At low solids concentrations with infrequent particle collisions, a CFD discrete phase model can predict particle trajectories during pneumatic separation. Vibratory cleaning involves a distinct material layer and frequent particle contacts, making two-way coupled CFD–DEM with calibrated material models suitable for analyzing airflow–particle interactions.
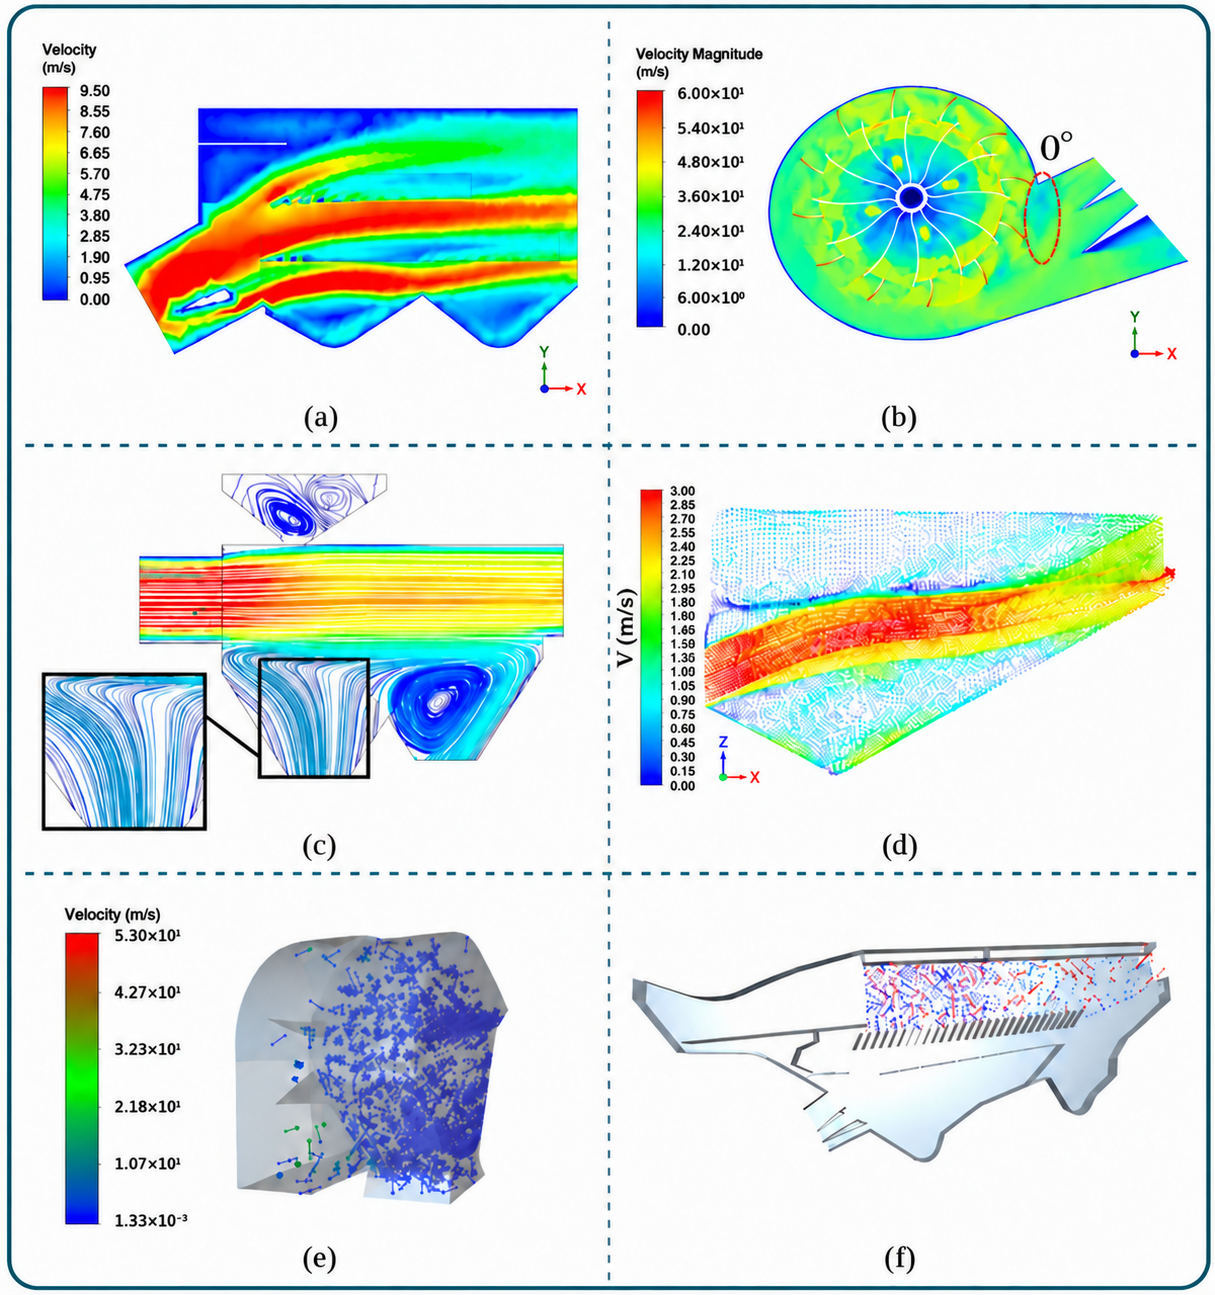
CFD is widely used to analyze airflow distribution within fans and cleaning chambers, guiding modifications to blades, ducts, and airflow guides (Figure 15). Li et al. [101] adjusted guide plate angles according to material loads in different sieve sections, aligning high-velocity airflow regions with areas of greater load, and obtained a cleaning loss rate of 1.27% and an impurity content of 2.41% at a feed rate of 7.5 kg·s−1, a fan speed of 900 r·min−1, and a guide plate angle of 24° (Figure 15a). Wada and Liang [96] compared blade stagger angles and selected a configuration that produced more uniform air velocity distributions in each duct; at a stagger angle of 10.5° and a rotational speed of 1200 r·min−1, the coefficients of variation of air velocity in the three ducts were 15.83%, 13.68%, and 14.68%, against 47.22% and 28.29% for the original four-blade fan (Figure 15b). The former improved airflow uniformity through blade arrangement, whereas the latter used guide plates to direct air to the required regions, matching air supply to sieve loading.
CFD–DEM can reveal how local airflow alters grain and residue trajectories, and its applications now extend from individual components, such as fans and ducts, to complete cleaning units. Li et al. [119] developed a CFD–DEM model of an air-and-sieve cleaning unit to analyze grain–residue separation under the combined effects of airflow and sieve motion; grains concentrated mainly in sections 4–12 beneath the screen surface, and raising the inlet airflow velocity increased the screening capacity but also the grain loss (Figure 15d). Liu et al. [120] designed a spiral stepped cleaning unit for ratoon rice, used CFD–DEM to examine how vortices within the trough affected residue transport and sieve opening blockage, and validated cleaning performance through bench tests, obtaining a grain impurity rate of 1.35%, a grain loss rate of 1.62%, and a screen plugging rate below 0.1%, with the impurity and loss rates 2.5–3.4 and 2.3–3.5 percentage points lower than those of conventional devices. Ding et al. [100] incorporated particle terminal velocities, sieve motion, and airflow effects into a model of the complete cleaning system, finding that a single duct could not adequately loosen material at the front while removing impurities at the rear under high feed rates, which prompted a design incorporating multiple ducts and a return conveying structure (Figure 15c). Zhao et al. [116] developed a multicomponent model comprising rice grains, stalks, and stalk fragments, finding that increasing air velocity or device inclination reduced impurity content but increased grain entrainment losses: raising the air velocity from 5 to 9 m·s−1 lowered the impurity rate from 10.58% to 0.31% while raising the entrainment loss from 0.07% to 1.28%, whereas a sieve inclination of 10° combined with 20 Hz vibration reduced the impurity rate to 3.29% and the entrainment loss to 1.84% (Figure 15e). To compare these changes, simulations should track each component’s residence time, sieve passage locations, and distribution among outlets, and calculate impurity content and loss rate.
CFD–DEM has also been applied to the cleaning of non-cereal crops. Ling et al. [121] used coupled gas–solid simulations to analyze material motion and separation in the cleaning chamber of a fresh peanut picking combine harvester, validating model predictions through bench tests; at a fan speed of 2905 r·min−1, a feed rate of 0.80 kg·s−1, and an air inlet angle of 43.14°, the simulated impurity content and loss rate were 7.32% and 4.78%, and the measured values were 0.68 and 1.24 percentage points higher, respectively (Figure 15). Applications to different crops require particle model selection and parameter calibration based on crop morphology, aerodynamic properties, and material composition. CFD and CFD–DEM can compare structural designs, identify the main factors affecting cleaning performance, and explain the causes of performance changes. Combining these simulations with tests at different feed rates and moisture contents under continuous material loading can identify suitable combinations of airflow distribution, sieve motion, and local structural features, along with their operating ranges.
Figure 15.
Examples of coupled gas–solid simulations [96,100,101,116,119,121]. (a) Guide-plate airflow; (b) Fan airflow at 0° stagger; (c) Multi-duct streamlines; (d) Air-and-screen simulation; (e) Rice mixture motion; (f) Fresh peanut mixture motion.
5.3. Common Design Criteria for Cleaning Systems
Sieve area and air supply capacity limit the throughput of the cleaning system. After reaching the sieve, material must first loosen and stratify, then move towards the rear at a suitable speed, giving grains sufficient opportunities to encounter and pass through the openings. Airflow distribution, sieve motion, and material load jointly influence this process, so airflow rate, vibration frequency, and sieve opening size should be set in coordination [38,39,43].
Air supply should be adjusted to meet the different requirements of each sieve section. The front section primarily loosens material and provides initial separation, the middle maintains stratification and promotes grain passage through the sieve, and the rear removes light impurities while limiting grain entrainment [8,99]. The fan, volute casing, ducts, airflow guides, and louvre opening jointly determine air velocity, airflow direction, and penetration through the material layer in each section. Excessive local air velocity can carry grains away, whereas insufficient airflow limits material loosening and hinders stratification and passage through the sieve. Sieve motion must balance material loosening, vertical stratification, rearward transport, and grain passage through the openings, with amplitude, frequency, vibration direction angle, and sieve inclination set accordingly [38,41,42]. Insufficient transport causes material to accumulate at the front and block sieve openings, whereas excessive transport speed reduces the time available for stratification and passage through the sieve. Parameter ranges should therefore be selected according to material load to ensure smooth rearward transport while allowing sufficient time for screening.
Sieve opening size and shape directly affect grain passage and also alter particle orientation, the number of impurities passing through, opening blockage, and airflow distribution near the sieve surface [88,122]. Stepped openings, recessed openings, curved surfaces, and combined sieve surfaces can provide more opportunities for grains to encounter openings and reorient themselves. These structures should be evaluated by comparing the proportion of grains passing through the sieve, the number of impurities passing through, and grain losses at the rear [89]. Oversized openings allow more impurities to pass through, whereas overly dense arrangements may increase blockage, so opening size and arrangement should be selected together. Under material loading, layer thickness, porosity, moisture content, and lateral distribution alter local resistance, affecting airflow penetration and particle motion [99]. Fan, duct, and vibrating sieve parameters should be tested using actual multicomponent materials under representative loads [101]. Simulations and experiments must use comparable material compositions and loading conditions to allow comparison of the relationships among airflow distribution, material motion, and cleaning outcomes.
The capacity of the cleaning system is limited by the load per unit sieve area, airflow penetration, material transport velocity, and the effective time available for passage through the sieve. When material flow rate, the proportion of material other than grain, or local bed thickness is excessive, increasing fan speed or vibration intensity may increase grain losses and power consumption without effectively reducing impurity content. Airflow distribution, sieve louver opening, and sieve motion parameters should be adjusted together according to the flow rate, composition, particle size, moisture content, and spatial distribution of incoming material; when capacity is exceeded, the upstream feed rate must also be controlled, with performance evaluated in terms of grain loss rate, impurity content, processing capacity, lateral load uniformity, and energy consumption (Figure 16). Material flow rate and distribution can be used to monitor load variations, grain loss rate, and impurity content to assess cleaning quality, and processing capacity and energy consumption to define the adjustment range, providing a basis for subsequent automatic control.
Figure 16.
Framework of design criteria for cleaning systems.
6. Intelligent Sensing and Coordinated Control
6.1. Material Flow and Operating Load Sensing
Monitoring material flow rate and operating load provides a basis for automatic adjustment of combine harvester operating parameters. As material passes through the header, conveying components, threshing unit, and cleaning system, signals collected at different locations indicate conditions at each stage. Signals from the front of the header and the feederhouse can be used to estimate the amount of material approaching the threshing unit; torque, power, and vibration measurements from the threshing cylinder and conveying components indicate local mechanical loads; pressure on the sieve surface and material bed conditions indicate the cleaning load. Depending on sensor location and the conditions measured, these signals can be used to predict changes in feed rate, confirm local loads, detect abnormalities, and provide feedback on cleaning conditions.
Upstream monitoring can estimate the feed rate before material enters the threshing unit, allowing time to adjust operating parameters. Available signals include forces acting on the header, image data, and the motion response of the feederhouse. Sun et al. [123] estimated feed rate from power signals, and in a later system [124] used header power-shaft torque, header height, and grain moisture content as inputs to a particle-swarm-optimized back-propagation network, reaching an average relative error of 7.69% in field tests, an R2 of 0.93 for the stem-to-grain ratio model, and a yield distribution estimation accuracy above 90%. Chen et al. [7] combined header forces, forward speed, reel speed, and header height to predict feed rate; the biomass taken by a single reel bar was detected with a correlation coefficient of 0.952, an MSE of 1.45%, and an RMSE of 0.06 kg, and forward speed, plant bending force, and reel speed ranked first to third in importance in the resulting GA–BP model. This information can support advance adjustments to threshing cylinder speed, concave clearance, and fan and sieve settings. Crop composition, lodging severity, and actual cutting width can affect these estimates, while image signals are also affected by field lighting conditions. Upstream signals can therefore be used to predict short-term changes in feed rate, with load signals from within the combine then used to refine the estimates.
Once material enters the conveying and threshing stages, floor plate pressure, drive shaft torque, and motor current can be used to estimate material throughput and mechanical load. Abdeen et al. [125] installed flexible force-sensitive resistors on the threshing cylinder cover to monitor forces exerted by the material bed (Figure 17a); at feed rates of 0.8, 1.1, and 1.4 kg/s and thresher speeds of 1100, 1300, and 1500 r·min−1, the film-sensor force signals correlated significantly with both rotor speed and feed rate, providing an early warning of thresher blockage. Zhang et al. [126] estimated feed rate from the floor plate pressure of a chain-and-slat conveyor, achieving a coefficient of determination (R2) of 0.9963 and errors below 5% under most operating conditions. Jiang et al. [127] installed a torque measurement and wireless data acquisition unit on the input shaft (Figure 17b) and developed a support vector machine prediction model with an R2 of 0.967 and a mean deviation of 7.7% in field tests. These methods estimate feed rate from material interactions with mechanical components, requiring calibration that accounts for measurement location and transmission operating conditions. Pressure signals depend on sensor location and material distribution, whereas torque and current depend on transmission efficiency, rotational speed, and friction in mechanical components. Accounting for these factors during calibration helps distinguish changes in feed rate from changes in mechanical load.
Vibration monitoring requires no direct sensor contact with the material and allows continuous signal acquisition at locations such as the feederhouse, threshing cylinder bearing housings, and cleaning system frame. Liang et al. [128] installed accelerometers at different feederhouse locations (Figure 17c) and developed a feed rate prediction model with relative errors of 3.1–4.9% in field tests. Gao et al. [129] used triaxial accelerometers to examine vibration in a tracked whole-crop combine harvester during field operation at different feed rates, finding that maintaining a certain feed rate helped reduce overall machine vibration. Hao et al. [130] identified blockage and slippage of a rice threshing drum from vibration features: blockage produced a peak at 25 Hz in the Z direction with a maximum displacement of about 0.55 mm, whereas slip produced a peak concentrated at 50 Hz with a maximum displacement of about 0.184 mm. Ma et al. [131] fused time-domain, frequency-domain and time–frequency features with kernel principal component analysis and machine learning, and recognized threshing load conditions with accuracies of 100% and 98% for the training and prediction sets using a random forest, and of 100% and 90% with the shortest analysis time of 6.206 s using an extreme learning machine. Tang et al. [132] measured vibration at the threshing cylinder bearing housings to identify imbalance-induced vibration during rice threshing. Bhandari and Jotautienė [133] used mounting brackets where direct sensor installation was difficult to assess the bearing condition of a tangential-flow threshing cylinder through vibration analysis. Vibration signals contain information on material impacts but are also affected by frame damping, rotational speed fluctuations, and loose components. In practice, characteristic frequency bands associated with material impacts can be extracted from multichannel signals and combined with rotational speed or torque signals to identify increased loads, material blockages, and mechanical faults.
Sieve loading reflects the distribution of threshed material on the cleaning sieve and provides a basis for adjusting cleaning parameters. Craessaerts et al. [134] used differential pressure beneath the upper sieve to track changes in the material bed and developed a model to predict sieving losses. Liang et al. [135] reviewed a four-point pressure sensor arrangement on the upper sieve for detecting uneven loading along and across the sieve. Compared with single-point loss monitoring, pressure, or differential pressure measurements at multiple locations can reveal where material accumulates and how loading shifts within the cleaning chamber. The control system can use this information to adjust airflow rate, sieve opening, and sieve motion, then evaluate the adjustments using downstream measurements of grain loss rate and grain purity.
6.2. Threshing and Cleaning Quality Monitoring
Threshing and cleaning performance is primarily evaluated using indicators such as unthreshed grain percentage, separation loss rate, grain breakage rate, cleaning loss rate, and impurity content. Online monitoring requires sensor signals to be converted into these performance indicators. Impact sensors record impact counts or electrical signals, and vision systems determine object counts or pixel areas, whereas most performance indicators are expressed as mass fractions. Online evaluation therefore requires identifying lost grains or impurities, estimating their total number or mass from local measurements, and calculating the corresponding indicators. These conversion relationships can be calibrated against measurements obtained by manually collecting, sorting, and weighing samples from the same material batch, enabling continuous performance monitoring with onboard sensors [136].
Figure 17.
Representative load sensor arrangements in combine harvesters [125,127,128]. (a) Thresher cover force sensing; (b) Input shaft torque sensing; (c) Feederhouse vibration sensing.
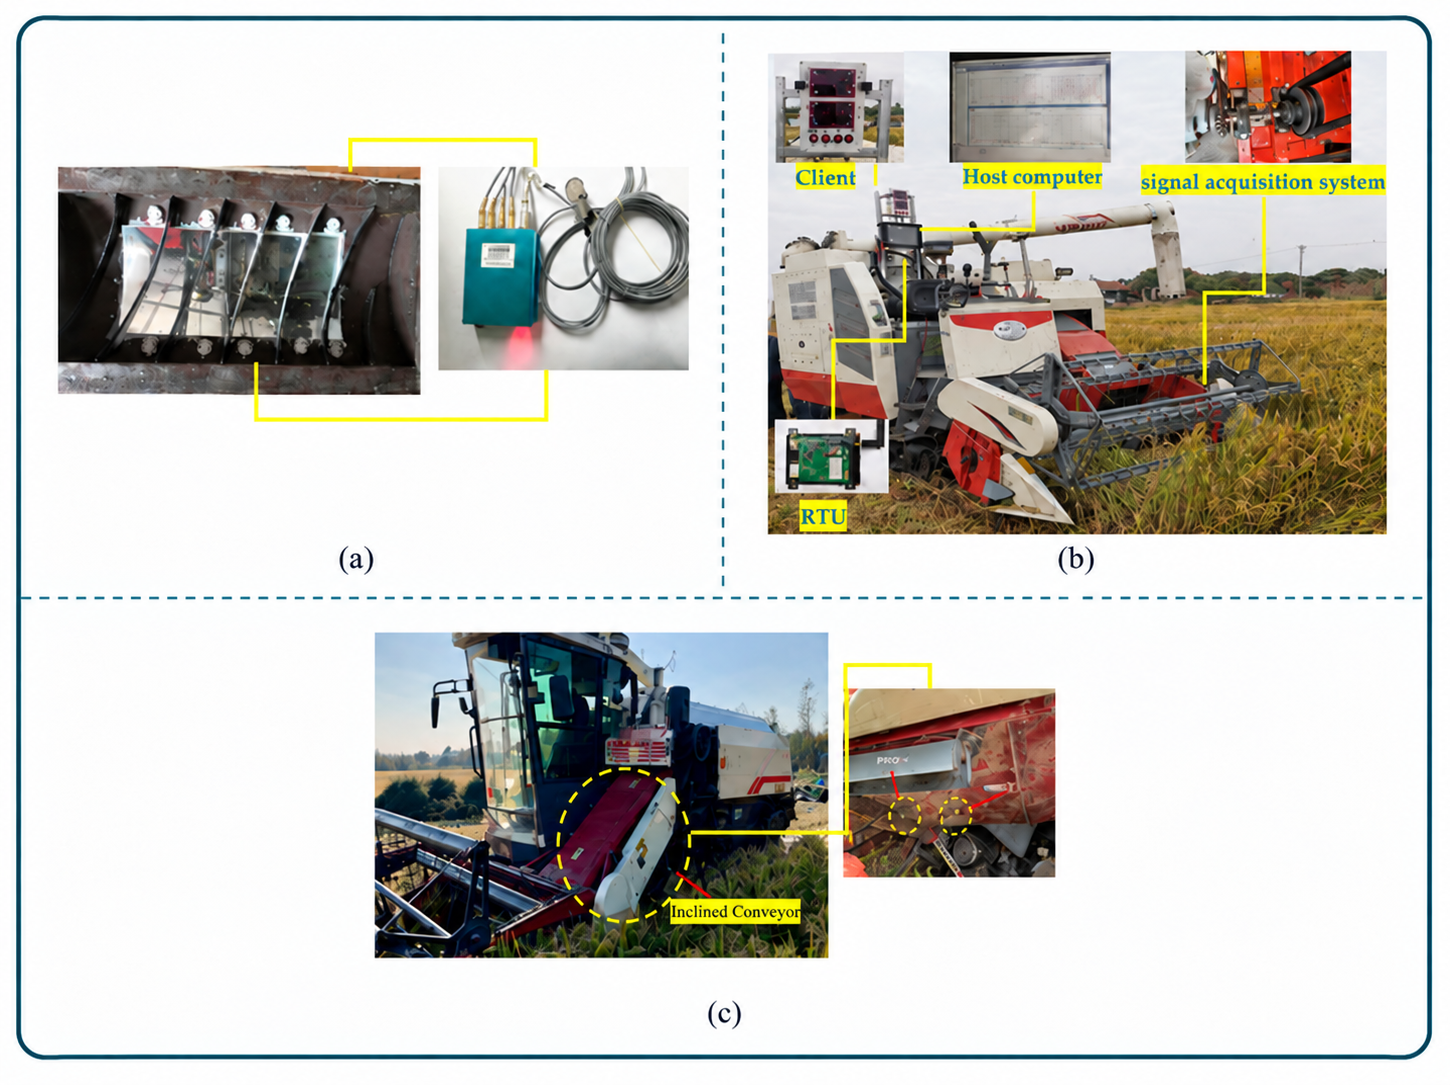
The spatial distribution of lost grains provides a basis for estimating total machine losses from local measurements. Existing studies mainly use two approaches: one approach established a mathematical model relating locally detected grain losses to total cleaning losses based on the spatial distribution of grains lost at the rear of the sieve. Combined with piezoelectric sensors, this model enabled online monitoring of cleaning losses, with a maximum relative error of 3.26% in field trials [137] (Figure 18a); piezoelectric impact sensing assemblies installed at the rear of the sieve detect cleaning losses from local impact signals at the cleaning outlet, and a single sensitive plate carrying one piezoelectric sensor identified kernels with accuracies of 93%, 88%, 80%, and 68% when one, two, three, and five kernels struck the plate simultaneously, at a measured counting capacity of 20–30 kernels per minute against a theoretical 50 [138] (Figure 18b). Acoustic array studies show that signals from a single outlet cannot adequately capture conditions throughout the threshing process: with nine acoustic impact sensors arranged three by three beneath the separating grate, the loss predicted by integrating an exponential grain-separation curve agreed statistically with the measured loss at the 95% probability level for barley fed at 6 and 12 t·h−1 with rotor speeds of 800 and 1200 r·min−1 [139]. Estimating the overall machine loss rate from local counts therefore requires corrections based on the spatial distribution of losses, using probability distribution models or coefficients derived from multiple lateral measurement points.
Figure 18.
Representative sensing and sampling configurations for online monitoring of threshing and cleaning quality [137,138]. (a) Separation-loss sensor placement; (b) Piezoelectric impact sensor.
Impact-based loss detection also requires identifying grain loss events within mixed signals from grain impacts, straw impacts, and machine vibration. Liang et al. [140] combined discrete element method (DEM) impact analysis with band-pass filtering to distinguish rice grains from short straw fragments, with field measurement errors below 4.48%. Shen et al. [141] found that grain and stalk impact sounds had dominant frequencies near 15 kHz and 7 kHz, respectively, allowing the impact sources to be distinguished. Detection thresholds should be set according to crop type and device configuration. At high feed rates, simultaneous particle impacts produce overlapping signals, while residual vibration, dust, and wear can also alter sensor responses, potentially causing missed or duplicate counts. Under these conditions, time-frequency features and multichannel signals can be combined to identify impact events, with the detection baseline adjusted according to background noise.
Online monitoring of impurity content and grain breakage rate primarily relies on imaging material at the grain tank inlet to identify whole grains, broken grains, and impurities. Detection accuracy depends on object recognition, sample representativeness, and lighting conditions. For grain breakage monitoring, Chen et al. [142] combined a sampling device with lateral illumination and color-based machine vision, achieving 96% recognition accuracy for whole and broken rice kernels in laboratory tests. Mahirah et al. [143] used frontlighting and backlighting to reveal rice panicle branches, stems, and leaves, brown rice, and cracked grains, achieving coefficients of determination above 0.70 for all object categories (Figure 19a,b). Chen et al. [144] used morphological features and a color model to identify grains and impurities, achieving a classification accuracy of approximately 76% (Figure 19c,d). Material overlap can obscure objects, while sampling variations during continuous operation can also affect detection results. Guan et al. [145] combined a flow-through continuous sampling device with Mask R-CNN (Figure 20), using guided material flow, conveying, and controlled lighting to improve object visibility in images. These systems require coordinated design of the sampling device, lighting, and recognition algorithm to ensure representative sampling and allow grains and impurities to be readily identified.
Figure 19.
Vision-based rice inspection models [143,144]. (a) Front-lit paddy mixture; (b) Front-lit object-detection result; (c) Original grain sample; (d) Binary image of the segmented grains and impurities.
Figure 20.
Impurity detection system for a rice combine harvester [145].
Converting recognition results into field performance indicators requires continuous sampling and conversion of object counts or pixel areas into material mass. Guan et al. [145] reported detection accuracies of 91.15–97.26% in bench tests with five rice varieties and relative errors of 5.71–11.72% in field estimates of impurity content. For soybean material, Jin et al. [146] used a modified U-Net to segment whole grains, broken grains, and impurities, achieving mean absolute errors of 0.18 and 0.10 percentage points for grain breakage rate and impurity content, respectively, in field tests. Wu et al. [147] combined a modified Mask R-CNN with a continuous sampling device to produce results approximately every 1.5 s, with relative errors of 7.99% for impurity content and 8.46% for grain breakage rate in field tests. These studies extended object recognition to continuous quality monitoring, making sampling methods and mass estimation integral to system design. Cui et al. [148] combined images with other material characteristics, reducing the mean relative error in impurity content estimates from 8.92% to 4.00% in laboratory tests and from 9.94% to 4.89% in field tests. This result indicates that supplementing images with other material information can improve the accuracy of impurity content estimates. Improving online monitoring systems requires attention to object recognition, sample representativeness, and the relationships used to convert image measurements into material mass.
For quality indicators that are difficult to measure continuously or provide delayed feedback, soft sensor models can estimate operational quality from operating load, equipment parameters, and measured loss signals. Maertens et al. [149] aligned crop throughput, grain flow rate, and threshing loss signals to account for material transport delays, then used recursive identification to estimate threshing performance online. Craessaerts et al. [134] developed a fuzzy soft sensor model using cleaning chamber pressure distribution, sieve opening, and operating load to estimate current sieve losses. Chai et al. [150] combined grey prediction with a fuzzy model to predict rapeseed cleaning losses approximately 3 s ahead, with relative errors within 5%. Guo et al. [151] combined a surrogate model of discrete element simulations with a neural network to develop a threshing digital twin; Jiang et al. [152] used optimized support vector regression to predict both cleaning loss rate and impurity content. These methods estimate current operational quality and predict changes in losses, providing a basis for adjusting operating parameters.
6.3. Intelligent Coordinated Control of Threshing and Cleaning Systems
Threshing parameters affect the material entering the cleaning system, while cleaning capacity constrains the overall feed rate of the combine harvester. Threshing cylinder speed and concave clearance affect unthreshed grain percentage, separation losses, and grain breakage rate, while also changing the composition of material entering the cleaning system. Fan operating conditions, sieve motion parameters, and sieve louver opening determine the load that the cleaning system can handle. The effects of threshing parameter adjustments become apparent in the cleaning stage only after the material has traveled through the machine. Threshing and cleaning control must therefore account for interactions among operating parameters and material transport delays while adapting to changing operating conditions. Control effectiveness should be assessed through overall machine performance, particularly whether loss rate, impurity content, grain breakage rate, and processing capacity simultaneously meet requirements as the load changes.
Multivariable control requires models that describe how parameter changes affect operational quality and independently adjustable actuators with position feedback to execute control commands. Li et al. [153] identified a state-space model using a wavelet neural network optimized by particle swarm optimization, with sieve louver opening, fan inlet area, and concave clearance as inputs and threshing loss rate, cleaning loss rate, impurity content, and grain breakage rate as outputs. The model explained at least 81.7% of the variance in validation tests across multiple crops. The study also developed electric adjustment mechanisms for these three parameters, using displacement sensors to provide feedback on their actual positions (Figure 21). Building on this work, Yang et al. [154] applied model predictive control, bringing all operational quality indicators close to their target values within 3 s, with deviations no greater than 0.23%. The model calculates the required parameter adjustments, the electric mechanisms execute them, and position feedback confirms whether the intended settings have been reached. For online parameter optimization, Guo et al. [155] built a digital twin from a small online dataset using ensemble modelling and data augmentation, and combined it with a digital-twin-assisted evolutionary algorithm to search among thousands of possible setting combinations. When applied to the threshing settings of a maize combine harvester, the method reduced the grain breakage rate and improved working efficiency; in the field validation reported by the same group [151], the mean grain breakage rate was 2.08% and 1.00% lower than under manual and feedback-control operation, respectively, and the working speed was 1.12 and 1.47 km·h−1 higher.
Figure 21.
Electric adjustment mechanisms for multiple actuators [153]. (a) Motorized concave-clearance adjustment mechanism; (b) Motorized sieve-opening adjustment mechanism; (c) Motorized fan-inlet-area adjustment mechanism.
The control system can be further organized into hierarchical levels according to response time. The upper level adjusts travel speed based on crop conditions ahead and internal machine load, responding to load changes over seconds to keep feed rate within processing capacity. Measurements of separation losses, grain breakage rate, sieve loading, cleaning losses, and impurity content become available sequentially as material passes through the conveying and processing stages. The middle level accounts for material transport delays to align these measurements with the same material batch, then determines actuator settings from quality requirements, typically taking several seconds to adjust. The lower level uses proportional–integral–derivative (PID), fuzzy, or model predictive control to track position and rotational speed setpoints, with response times as short as milliseconds. The upper level primarily uses feed rate feedforward and load feedback to regulate travel speed. Feedforward signals indicate feed rate trends before material enters the threshing unit, enabling anticipatory speed adjustments; load feedback reflects the current threshing cylinder load and corrects prediction errors. Chen et al. [156] combined grey prediction with fuzzy control to adjust forward speed, reducing settling time and overshoot in a system with a long delay. Kang et al. [157] used motor current to indicate threshing cylinder load, reducing the coefficient of variation in current from 10.7% to 7.4% through closed-loop control. Sun et al. [158] algorithmically optimized the weights in model predictive control, reducing the mean absolute error in feed rate control to below 0.1 kg·s−1. These methods reduce feed rate fluctuations, lowering the risk of overloading the threshing cylinder and cleaning system.
Even at a constant feed rate, changes in moisture content, straw proportion, and material distribution can affect loss rate and impurity content. The middle level must therefore adjust parameters using quality feedback, balancing cleaning losses and impurity content. Liang et al. [159] used sieve loss signals as feedback for fuzzy control of fan speed, air deflector angle, and sieve louver opening, primarily to reduce losses. Incorporating impurity content into the feedback allows the system to use both indicators to determine the direction of parameter adjustments. Liu et al. [160] determined fuzzy adjustment levels from the weights assigned to loss rate and impurity content, reducing these indicators by 0.19% and 0.98%, respectively, compared with a conventional air-and-sieve cleaning device. Lou et al. [161] used discrete-time PID control for both objectives, stabilizing loss rate and impurity content at approximately 2.7% and 2.8%, respectively.
Because impurity content is difficult to measure directly and continuously, online predictions can supplement feedback for dual-objective control. Pang et al. [162] used measured loss rate and impurity content predicted by Gaussian process regression as two feedback signals, reducing quality deterioration under moderate feed rate disturbances. When the disturbance amplitude reached ±50%, the system could not fully restore the target performance. This indicates that quality feedback should be coordinated with feed load control, using predicted impurity content to adjust cleaning parameters and reducing feed rate as the load approaches processing capacity.
Material transport delays affect the controller’s assessment of operating conditions. Grains detected at the rear of the sieve typically originate from material that entered the threshing unit several seconds earlier. Directly pairing the current feed rate with current quality signals may cause the controller to adjust parameters based on earlier operating conditions, leading to repeated adjustments. Short-term prediction can be used to compensate for delays in feedback. Chai et al. [150] used a GM(1,1) model to predict cleaning losses approximately 3 s ahead and fuzzy control to adjust the louvered sieve opening, with relative prediction errors within 5%. Interactions among actuators must also be accounted for in the control strategy. Zhu et al. [163] identified a linear parameter-varying model for an electrically driven cleaning system and used event-triggered adaptive model predictive control to coordinate fan speed and sieve vibration frequency. Output prediction accuracy exceeded 85%, and the computational load was reduced by approximately 50%. This method accounts for actuator dynamics in its predictions and reduces computation through event triggering. Extending this approach to include threshing parameters such as concave clearance [154] would allow coordinated adjustment of upstream material output and downstream cleaning capacity.
7. Discussion
7.1. Coupling of Material States
Research on threshing and cleaning systems needs to integrate structural design, numerical simulation, and control methods. Structural design determines processing capacity, simulations explain material collisions, transport, and gas–solid separation, and sensing and control enable parameter adjustments as operating conditions change [17]. Linking these three areas requires material state variables that can be consistently related across design, simulation, and control. Material states considered in structural optimization do not always correspond to control model inputs, and simulation outputs often lack a direct relationship with quantities measured by onboard sensors. These gaps make it difficult to apply findings from structural design and simulation studies directly to control during field operation.
The threshing outlet and cleaning inlet form the key interface between the two stages. Threshing studies commonly assess unthreshed grain percentage, separation loss rate, and grain breakage rate, whereas cleaning studies typically prescribe mixture feed rate and component proportions, with limited attention to how cylinder parameters, concave conditions, and material interactions produce these inlet conditions. Consequently, the effects of changes in threshing parameters on cleaning performance are often not traced through both stages. Even with unchanged cleaning parameters, changes in the composition or spatial distribution of material discharged upstream can alter cleaning performance. Tracing these effects requires characterizing the material state at the cleaning inlet. Alongside grain flow rate, this characterization should include the mass fraction of material other than grain, particle size or stalk length distribution, moisture content, bed thickness, and lateral distribution. These variables capture how threshing structures affect the material and describe the load entering the cleaning system, providing inputs for sensing and control systems. Establishing how these variables change along the material flow allows changes in threshing structures to be linked to cleaning inlet conditions, enabling assessment of their effects on overall machine loss rate, impurity content, and processing capacity.
7.2. Simulation Credibility and Model Transferability
Numerical simulations analyze material collisions, transport, and gas–solid interactions during threshing and cleaning, and can screen structural designs and operating parameters to reduce the number of experimental combinations. Simulation accuracy depends on material parameters, boundary conditions, and how faithfully the model represents the actual materials and equipment. Korn et al. [6] demonstrated the feasibility of CFD–DEM simulations of the cleaning process and noted that biomass particle parameterization and contact models affect simulation results. Chen [164] likewise noted that material parameters, boundary conditions, and model simplifications jointly affect simulation accuracy, and that experimentally validated optimization results apply primarily to similar operating conditions. Existing simplified models are better suited to analyzing overall material motion, whereas flexible deformation, fracture, grain breakage, and moisture-induced adhesion affect predictions of loss rate and impurity content. Designs can therefore first be compared using particle trajectories, spatial distributions, and parameter sensitivity, followed by bench and field tests to verify quality indicators and finalize structural designs and parameter settings.
The applicability of models and optimized parameter settings depends on the operating conditions covered by the experiments. Parameter combinations obtained through orthogonal experimental designs, response surface methodology, and multi-objective optimization are specific to the tested crop varieties, moisture contents, feed rates, and parameter ranges. The effectiveness of these settings must be reassessed when the degree of crop lodging, field slope, or proportion of material other than grain changes. Performance comparisons between devices also require clearly specified test conditions, because sampling location, test duration, calibration methods, and calculation procedures all affect the reported loss rate and impurity content. Studies should report optimal settings alongside material composition, moisture content, load per unit sieve area, operating slope, test duration, and uncertainty in the results, and validate models at multiple load levels. Beyond goodness of fit, model evaluation should assess performance across crop varieties, moisture contents, and extended continuous operation to establish the range of applicable operating conditions.
7.3. Sensing Delays and Constraints on Coordinated Control
Sensor signals must be aligned with the same material batch before they are used for control. Load signals are available as material enters or passes through the threshing stage, whereas quality signals, such as loss rate and impurity content, become available only after downstream processing. Pairing signals solely by acquisition time may associate load conditions with quality measurements from different material batches. Signals should therefore be aligned according to material transport time, allowing quality measurements to reveal the effects of earlier load conditions and parameter settings. Signal processing must also account for specific interference sources: machine vibration, material orientation at impact, and crop residues affect impact-based loss detection, while dust, lighting, occlusion, and sample representativeness affect vision-based detection. Chai et al. [150] compensated for feedback delays through loss prediction, while Yang et al. [154] combined system identification with model predictive control to adjust threshing and cleaning parameters, providing approaches for using delayed quality feedback.
Coordinated control requires joint consideration of indicators such as loss rate, impurity content, and energy consumption. Jiang et al. [152] used a Pareto front to analyze the trade-off between cleaning loss rate and impurity content, providing a basis for selecting parameters to meet different operational requirements. Model predictive control can jointly account for interactions among parameters, control signal delays, and actuator adjustment limits. Data-driven and digital twin methods can estimate operating states that are difficult to measure directly. In practice, control models should be developed using data from varied operating conditions, with update frequencies set according to the computing capacity of the onboard controller. Beyond control accuracy, performance evaluation should consider feed rate fluctuations, communication delays, sensor faults, and actuator saturation. Different control methods should be compared under the same test conditions using the same evaluation metrics to assess their practical effectiveness.
7.4. Limitations and Future Research Directions
This review systematically examines research advances in grain combine harvester threshing and cleaning devices from three perspectives: structural design, numerical simulation, and intelligent sensing and control. Overall, threshing and cleaning technologies for grain combine harvesters are evolving from traditional experience-based design approaches toward greater efficiency, reduced grain damage and loss, intelligence, precision, and coordinated operation. Significant progress has been made in structural optimization of threshing and cleaning devices, numerical simulation, and intelligent sensing and control. However, several limitations remain. The interactions between crop materials and machinery, as well as the mechanisms underlying loss formation, are not yet fully understood under different crop conditions and complex operating environments. Research on the coupling relationships among multiple operating parameters and the corresponding coordinated optimization mechanisms during threshing and cleaning remains insufficient. The real-time performance, accuracy, and adaptability of intelligent sensing technologies under complex operating conditions also require improvement. Furthermore, coordinated regulation between threshing and cleaning systems and their integration at the whole-machine level need to be further enhanced. Future research should strengthen the investigation of the relationships among crop material properties, machine structures, operating parameters, and control strategies. Further efforts are needed to elucidate the mechanisms governing threshing and cleaning processes and to advance multiphysics coupled simulation analyses, thereby promoting the coordinated optimization and integrated innovation of threshing and cleaning devices. Meanwhile, greater emphasis should be placed on multi-source information sensing, operating condition monitoring, and adaptive control technologies. Key scientific and technological challenges associated with efficient threshing, low-loss cleaning, and stable operation under complex working conditions should be addressed to promote the development of grain combine harvesters toward greater efficiency, reduced losses, intelligent operation, and energy-efficient and environmentally friendly performance.
8. Conclusions
Advances in agricultural mechanization and intelligent technologies have raised expectations for the operating efficiency and harvesting quality of grain combine harvesters. Threshing and cleaning are key processes that determine grain losses, grain breakage, and impurity content. Changes in crop type, moisture content, and feed rate alter material loading, transport, and separation, making it difficult to maintain consistent performance with fixed parameter settings. Threshed material passes directly into the cleaning system, so the composition and distribution of the upstream output affect the downstream processing load. Improving overall harvesting quality therefore requires joint advances in threshing with minimal grain damage, efficient cleaning, and coordinated adjustment under changing loads.
This review systematically examines structural design, numerical simulation, and intelligent control of threshing and cleaning systems for grain combine harvesters. First, it outlines the overall system configuration and operating principles, examining the links among grain detachment, separation, and cleaning. Second, it reviews advances in tangential-flow, axial-flow, and combined tangential–axial-flow threshing systems, comparing improvements to cylinder elements, concave clearance, and flow-guiding structures, and examining how DEM and coupled simulations support analyses of material forces and motion and parameter optimization. Third, focusing on vibrating sieves, fans, and air ducts, it reviews methods for optimizing sieve aperture geometry, sieve motion, and airflow distribution, discusses multicomponent material modeling, parameter calibration, and coupled gas–solid simulations, and identifies design requirements shared by threshing and cleaning systems. Fourth, it reviews material flow and load sensing, grain loss and quality monitoring, and coordinated control of multiple parameters, examining how measurements inform operating parameter adjustments. Finally, it discusses current challenges and future research directions concerning links between upstream and downstream material states, the applicability of simulation models, and control feedback delays.
Future research should strengthen the links among crop characteristics, equipment design, material states, and control methods. At the interface between the threshing outlet and cleaning inlet, material flow rate, crop residue proportion, moisture content, and spatial distribution should be recorded to support structural evaluation, simulation modeling, and online adjustment. Tests across load levels and moisture contents, together with continuous field trials, should establish the applicability of models and optimized settings, with improvements compared using consistently calculated performance indicators. Control strategies should combine upstream feed rate prediction with downstream quality feedback, accounting for material transport time and actuator capabilities to match threshing output to cleaning capacity. This review can inform the design, simulation analysis, and operating parameter control of threshing and cleaning systems for grain combine harvesters.
Author Contributions
Conceptualization, B.W. and H.Y.; methodology, B.W. and H.Y.; software, B.W.; validation, Z.Y. and F.W.; formal analysis, H.X. and B.W.; investigation, H.X., F.G. and B.W.; resources, B.W. and F.G.; data curation, B.W. and Z.Y.; writing—original draft preparation, H.P. and B.W.; writing—review and editing, B.W., H.X., F.G., H.Y., J.P., H.P., Z.Y. and F.W.; visualization, J.P. and B.W.; supervision, Z.Y.; project administration, H.Y. and F.G.; funding acquisition, Z.Y. and F.W. All authors have read and agreed to the published version of the manuscript.
Funding
This research was funded by the Natural Science Foundation of Jiangsu Province (BK20241739), the Key R&D Program of Henan Province (251111113100), the pilot project for the integrated development, manufacturing, promotion, and application of agricultural machinery equipment in Jiangxi Province (YCTY202502), the pilot project for the integrated development, manufacturing, promotion, and application of agricultural machinery equipment in Shandong Province (SDNJYTH-202505), Science and Technology Innovation Project of Chinese Academy of Agricultural Sciences (ASTIP), and the China Agriculture Research System (CARS-13).
Data Availability Statement
No new data were created or analyzed in this study. Data sharing is not applicable to this article.
Acknowledgments
During the preparation of this manuscript, the authors used DeepSeek(V4 Pro)solely for English language polishing. The authors carefully reviewed and edited all AI-assisted content and assume full responsibility for the final content of the manuscript.
Conflicts of Interest
The authors declare no conflicts of interest.
References
- Miu, P.I. Combine Harvesters: Theory, Modeling, and Design; CRC Press: Boca Raton, FL, USA, 2016. [Google Scholar] [CrossRef] [Scilit]
- Miu, P.I.; Kutzbach, H.D. Modeling and simulation of grain threshing and separation in threshing units—Part I. Comput. Electron. Agric. 2008, 60, 96–104. [Google Scholar] [CrossRef] [Scilit]
- Sudajan, S.; Salokhe, V.M.; Chusilp, S. Effect of concave hole size, concave clearance and drum speed on rasp-bar drum performance for threshing sunflower. AMA Agric. Mech. Asia Afr. Lat. Am. 2005, 36, 52–60. [Google Scholar]
- Petkevičius, S.; Špokas, L.A.; Kutzbach, H.D. Investigation of the maize ear threshing process. Biosyst. Eng. 2008, 99, 532–539. [Google Scholar] [CrossRef] [Scilit]
- Horabik, J.; Molenda, M. Parameters and contact models for DEM simulations of agricultural granular materials: A review. Biosyst. Eng. 2016, 147, 206–225. [Google Scholar] [CrossRef] [Scilit]
- Korn, C.; Herlitzius, T. Coupled CFD–DEM simulation of separation process in combine harvester cleaning devices. Landtechnik 2017, 72, 247–262. [Google Scholar] [CrossRef]
- Chen, X.; Wu, S.; Li, C.; Liu, F.; Yuan, L.; Wang, W. Design and experiment of feed rate monitoring system based on the action force of grain combine harvester reel. Comput. Electron. Agric. 2025, 230, 109837. [Google Scholar] [CrossRef] [Scilit]
- Liang, Z.; Li, Y.; De Baerdemaeker, J.; Xu, L.; Saeys, W. Development and testing of a multi-duct cleaning device for tangential-longitudinal flow rice combine harvesters. Biosyst. Eng. 2019, 182, 95–106. [Google Scholar] [CrossRef] [Scilit]
- Su, Z.; Li, Y.; Dong, Y.; Tang, Z.; Liang, Z. Simulation of rice threshing performance with concentric and non-concentric threshing gaps. Biosyst. Eng. 2020, 197, 270–284. [Google Scholar] [CrossRef] [Scilit]
- Liu, Y.; Li, Y.; Chen, L.; Zhang, T.; Liang, Z.; Huang, M.; Su, Z. Study on performance of concentric threshing device with multi-threshing gaps for rice combines. Agriculture 2021, 11, 1000. [Google Scholar] [CrossRef] [Scilit]
- Fu, J.; Chen, Z.; Han, L.J.; Ren, L.Q. Review of grain threshing theory and technology. Int. J. Agric. Biol. Eng. 2018, 11, 12–20. [Google Scholar] [CrossRef] [Scilit]
- Tang, X.; Jin, C.; Zhang, G.; Guo, Z.; Zhao, N.; Xu, B. Research status of threshing and separating device for combine harvester in China. J. Agric. Mech. Res. 2022, 44, 1–9+15. [Google Scholar]
- Lei, C.; Jin, C.; Li, P.; Yang, X.; Zhao, Z.; Lyu, L. Development status of threshing technology and equipment of grain combine harvester. J. Agric. Sci. Technol. 2025, 27, 90–102. [Google Scholar]
- Xu, L.; Li, Y.; Li, Y.; Chai, X.; Qiu, J. Research progress on cleaning technology and device of grain combine harvester. Trans. Chin. Soc. Agric. Mach. 2019, 50, 1–16. [Google Scholar]
- Liang, Z.; Wada, M.E. Development of cleaning systems for combine harvesters: A review. Biosyst. Eng. 2023, 236, 79–102. [Google Scholar] [CrossRef] [Scilit]
- Gu, X.; Tang, Z.; Wang, B. Sensor-centric intelligent systems for soybean harvest mechanization in challenging agro-environments of China: A review. Sensors 2025, 25, 6695. [Google Scholar] [CrossRef] [Scilit] [PubMed]
- Chen, Z.; Qian, Z.; Jin, C.; Yang, T. Research progress on control algorithms for grain combine harvesters. Appl. Sci. 2025, 15, 9176. [Google Scholar] [CrossRef] [Scilit]
- Dong, J.; Zhao, S.; Zhang, A.; Meng, Z.; Wang, F.; Qin, W.; Li, M. Research status and trend of grain loss monitoring sensor technology. INMATEH Agric. Eng. 2025, 77, 238–250. [Google Scholar] [CrossRef] [Scilit]
- Wang, L. Digital twins in agriculture: A review of recent progress and open issues. Electronics 2024, 13, 2209. [Google Scholar] [CrossRef] [Scilit]
- Yu, Y.; Li, L.; Zhao, J.; Wang, X.; Fu, J. Optimal design and simulation analysis of spike tooth threshing component based on DEM. Processes 2021, 9, 1163. [Google Scholar] [CrossRef] [Scilit]
- Zhao, J.; Zhao, H.; Tang, H.; Wang, X.; Yu, Y. Bionic threshing component optimized based on MBD–DEM coupling simulation significantly improves corn kernel harvesting rate. Comput. Electron. Agric. 2023, 212, 108075. [Google Scholar] [CrossRef] [Scilit]
- Fan, C.; Zhang, D.; Yang, L.; Cui, T.; He, X.; Dong, J.; Zhao, H. Power consumption and performance of a maize thresher with automatic gap control based on feed rate monitoring. Biosyst. Eng. 2022, 216, 147–164. [Google Scholar] [CrossRef] [Scilit]
- Li, Y.; Jia, B.; Xu, L.; Qiao, M.; Zhao, Z. Development and experiments on tangential flow threshing and separating device of axial flow combine. Trans. Chin. Soc. Agric. Eng. 2009, 25, 93–96. [Google Scholar]
- Craessaerts, G.; Saeys, W.; Missotten, B.; De Baerdemaeker, J. A genetic input selection methodology for identification of the cleaning process on a combine harvester, Part I: Selection of relevant input variables for identification of the sieve losses. Biosyst. Eng. 2007, 98, 166–175. [Google Scholar] [CrossRef] [Scilit]
- Gebrehiwot, M.G.; De Baerdemaeker, J.; Baelmans, M. Numerical and experimental study of a cross-flow fan for combine cleaning shoes. Biosyst. Eng. 2010, 106, 448–457. [Google Scholar] [CrossRef] [Scilit]
- Ma, Z.; Li, Y.; Xu, L. Testing and analysis on rape threshing outputs characteristics in floating, friction and wettability. Trans. Chin. Soc. Agric. Eng. 2011, 27, 13–17. [Google Scholar]
- Chen, L.; Liao, Q.; Zong, W.; Liao, Y.; Li, H.; Huang, P. Aerodynamic characteristics measurement of extraction components for rape combine harvester. Trans. Chin. Soc. Agric. Mach. 2012, 43, 125–130. [Google Scholar]
- Ren, S.; Xie, F.; Wang, X.; Liu, D.; Li, X.; Chen, L. Gas–solid two-phase separation operation mechanism for 4LZ-0.8 rice combine harvester cleaning device. Trans. Chin. Soc. Agric. Eng. 2015, 31, 16–22. [Google Scholar]
- DEUTZ-FAHR. Series C9000—Combine Harvesters: Threshing or Separation and Cleaning; SAME DEUTZ-FAHR Italia S.p.A.: Treviglio, Italy, 2014; Available online: https://www.deutz-fahr.com/en-gb/combine-harvesters/c9000-series (accessed on 18 August 2026).
- CLAAS. LEXION 8000/7000: APS SYNFLOW HYBRID Threshing and ROTO PLUS Secondary Separation System; CLAAS KGaA mbH: Harsewinkel, Germany, 2019; Available online: https://www.claas.com/en-us/agricultural-machinery/combine-harvesters/lexion-8000 (accessed on 18 August 2026).
- New Holland Agriculture. TC Combine Harvesters: Threshing and Separation and Cleaning Systems; CNH Industrial N.V.: London, UK, 1992; Available online: https://agriculture.newholland.com/en/cis/products/combine-harvesters/tc (accessed on 18 August 2026).
- AGCO GmbH. Fendt C-Series: Threshing Systems. Available online: https://www.fendt.com/int/agricultural-machinery/combines/fendt-c-series-threshing-systems (accessed on 18 August 2026).
- Zeng, S.; Zeng, L.; Liu, W.; Wei, S.; Tu, Q.; Chen, H. Design and experiment of rigid-flexible coupling rod tooth threshing device of harvester for ratooning rice. J. South China Agric. Univ. 2022, 43, 61–69. [Google Scholar]
- Li, X.; Du, Y.; Mao, E.; Zhang, Y.; Liu, L.; Guo, D. Design and experiment of corn low damage threshing device based on DEM. Int. J. Agric. Biol. Eng. 2023, 16, 55–63. [Google Scholar] [CrossRef] [Scilit]
- Shellard, J.E.; Macmillan, R.H. Aerodynamic properties of threshed wheat materials. J. Agric. Eng. Res. 1978, 23, 273–281. [Google Scholar] [CrossRef] [Scilit]
- Ma, X.; Zhao, L.; Guo, B.; Dang, H. Simulation and experiment of rice cleaning in air-separation device based on DEM–CFD coupling method. Int. J. Agric. Biol. Eng. 2020, 13, 226–233. [Google Scholar] [CrossRef] [Scilit]
- Xu, L.; Li, Y.; Chai, X.; Wang, G.; Liang, Z.; Li, Y.; Li, B. Numerical simulation of gas–solid two-phase flow to predict the cleaning performance of rice combine harvesters. Biosyst. Eng. 2020, 190, 11–24. [Google Scholar] [CrossRef] [Scilit]
- Li, H.; Wang, J.; Yuan, J.; Yin, W.; Wang, Z.; Qian, Y. Analysis of threshed rice mixture separation through vibration screen using discrete element method. Int. J. Agric. Biol. Eng. 2017, 10, 231–239. [Google Scholar] [CrossRef] [Scilit]
- Ma, X.; Guo, B.; Li, L. Simulation and experiment study on segregation mechanism of rice from straws under horizontal vibration. Biosyst. Eng. 2019, 186, 1–13. [Google Scholar] [CrossRef] [Scilit]
- Hou, H.; Cui, Q.; Guo, Y. Effects of moisture contents of threshed materials from whole-feeding combine for foxtail millet on their suspension characteristics. Trans. Chin. Soc. Agric. Eng. 2018, 34, 29–35. [Google Scholar]
- Ma, Z.; Li, Y.; Xu, L. Discrete-element method simulation of agricultural particles’ motion in variable-amplitude screen box. Comput. Electron. Agric. 2015, 118, 92–99. [Google Scholar] [CrossRef] [Scilit]
- Ma, Z.; Li, Y.; Xu, L.; Chen, J.; Zhao, Z.; Tang, Z. Dispersion and migration of agricultural particles in a variable-amplitude screen box based on the discrete element method. Comput. Electron. Agric. 2017, 142, 173–180. [Google Scholar] [CrossRef] [Scilit]
- Li, Y.; Xu, L.; Zhou, Y.; Li, B.; Liang, Z.; Li, Y. Effects of throughput and operating parameters on cleaning performance in air-and-screen cleaning unit: A computational and experimental study. Comput. Electron. Agric. 2018, 152, 141–148. [Google Scholar] [CrossRef] [Scilit]
- Yuan, J.; Wu, C.; Li, H.; Qi, X.; Xiao, X.; Shi, X. Movement rules and screening characteristics of rice-threshed mixture separation through a cylinder sieve. Comput. Electron. Agric. 2018, 154, 320–329. [Google Scholar] [CrossRef] [Scilit]
- Zhang, J.; Hu, J.; Zhou, Z.; Li, S.; Liu, X.; He, X.; Zhang, H. Design and experimental study of the rigid-flexible coupled structure for longitudinal axial-flow threshing device in high-moisture corn. Trans. Chin. Soc. Agric. Eng. 2026, 42, 58–70. [Google Scholar]
- Liu, W.; Zhou, Y.; Xu, H.; Fu, J.; Zhang, N.; Xie, G.; Zhang, G. Optimization and Experiments of the Drum Longitudinal Axial Threshing Cylinder with Rod Tooth for Rice. Trans. Chin. Soc. Agric. Eng. 2023, 39, 34–45. [Google Scholar]
- Yuan, L.; He, X.; Zhu, C.; Wang, W.; Wang, M.; Wu, S. Design and Test of Tangential and Longitudinal-Axial Threshing and Separating Unit for Wheat. Results Eng. 2024, 21, 101774. [Google Scholar] [CrossRef] [Scilit]
- Wang, R.; Zhao, X.; Ji, J.; Jin, X.; Li, B. Design and performance analysis of tangential-axial flow threshing device for oat harvester. Int. J. Agric. Biol. Eng. 2021, 14, 61–67. [Google Scholar] [CrossRef] [Scilit]
- Tang, Z.; Li, Y.; Xu, L.; Zhao, Z.; Li, H. Effects of different threshing components on grain threshing and separating by tangential-axial test device. Trans. Chin. Soc. Agric. Eng. 2011, 27, 93–97. [Google Scholar]
- Hao, J.; Wei, W.; Qin, J.; Zhu, Z.; Lü, X.; Yang, S. Design and test of cut-flow type oil sunflower threshing and screening machine. Trans. Chin. Soc. Agric. Mach. 2022, 53, 139–148. [Google Scholar]
- Qu, Z.; Zhang, D.; Yang, L.; Zhang, T.; Wang, Z.; Cui, T. Experiment on feed rate and cylinder speed of longitudinal axial-flow threshing and separating device for maize. Trans. Chin. Soc. Agric. Mach. 2018, 49, 58–65. [Google Scholar]
- Chansrakoo, W.; Chuan-Udom, S. Factors of operation affecting performance of a short axial-flow soybean threshing unit. Eng. J. 2018, 22, 109–120. [Google Scholar] [CrossRef] [Scilit]
- Teng, Y.; Jin, C.; Chen, Y.; Liu, P.; Yin, X.; Wang, T.; Yu, K. Design and optimization of segmented threshing device for rice and wheat combine harvester. Trans. Chin. Soc. Agric. Eng. 2020, 36, 1–12. [Google Scholar]
- Tang, Z.; Li, Y.; Xu, L. Design and optimization for length of longitudinal-flow threshing cylinder of combine harvester. Trans. Chin. Soc. Agric. Eng. 2014, 30, 28–34. [Google Scholar]
- Li, Y.; Chen, Y.; Xu, L.; Li, L. Optimization of structural parameters for threshing and separating device in oblique tangential-longitudinal combine. Trans. Chin. Soc. Agric. Mach. 2016, 47, 56–61. [Google Scholar]
- Tang, Z.; Li, X.; Chen, X.; Chen, Y. Design of negative pressure spiral feeding device for tangential and longitudinal axial intersection of combine harvester. Adv. Mater. Sci. Eng. 2019, 2019, 1647230. [Google Scholar] [CrossRef] [Scilit]
- Milišauskas, M.; Petersen, N.; Milišauskienė, G.; Petrulis, M.; Savickas, D. Crop flow control in a longitudinal axial threshing unit using fully adjustable guide vanes: A field study in winter wheat harvesting. Appl. Sci. 2025, 15, 6864. [Google Scholar] [CrossRef] [Scilit]
- Sahu, S.K. Harvesting and Threshing Methods for Paddy-II: A Review. Agric. Rev. 2025, 46, 200–209. [Google Scholar]
- Tang, Z.; Li, Y.; Liang, Z. Optimal parameters prediction and control of rice threshing for longitudinal axial threshing apparatus. Trans. Chin. Soc. Agric. Eng. 2016, 32, 70–76. [Google Scholar]
- Caoili, R.M.; Suministrado, D.C.; Amongo, R.M.C.; Resurreccion, A.N.; Peralta, E.K. Optimization of performance of a sweet sorghum peg-tooth type threshing cylinder. IOP Conf. Ser. Earth Environ. Sci. 2022, 1038, 012054. [Google Scholar] [CrossRef] [Scilit]
- Saeidirad, M.H.; Esaghzaeh, M.; Arabhosseini, A.; Zarifneshat, S. Influence of machine-crop parameters on the threshability of sorghum. Agric. Eng. Int. CIGR J. 2013, 15, 55–59. [Google Scholar]
- Melkamu, E. Development of a Motor Driven Sorghum Thresher. Master’s Thesis, Bahir Dar Institute of Technology, Bahir Dar University, Bahir Dar, Ethiopia, 2019. [Google Scholar]
- Tan, Y.; Chen, L.; Hu, S.; Wang, J.; Chen, Z.; Lyu, X. Design and experiment of a longitudinal-axial flow flexible bent-tooth soybean thresher. Acta Agric. Zhejiangensis 2023, 35, 2954–2965. [Google Scholar]
- IS 8122 (Part 2):2000; Combine-Harvester—Test Code, Part 2: Performance Test (First Revision). Bureau of Indian Standards: New Delhi, India, 2000.
- Liu, W.; Ma, L.; Zong, W.; Liu, J.; Li, M.; Lian, G. Design and experimentation of a longitudinal axial flow sunflower oil threshing device. Agriculture 2023, 13, 876. [Google Scholar] [CrossRef] [Scilit]
- Fan, C.; Cui, T.; Zhang, D.; Yang, L.; Qu, Z.; Li, Y. Design and experiment of low-damage combined corn threshing and separating device. Trans. Chin. Soc. Agric. Mach. 2019, 50, 113–123. [Google Scholar]
- Steponavičius, D.; Kemzūraitė, A.; Pužauskas, E.; Domeika, R.; Grigas, A.; Karalius, D. Shape Optimization of Concave Crossbars to Increase Threshing Performance of Moist Corn Ears. Agriculture 2023, 13, 983. [Google Scholar] [CrossRef] [Scilit]
- Pužauskas, E.; Steponavičius, D.; Jotautienė, E.; Petkevičius, S.; Kemzūraitė, A. Substantiation of concave crossbar shape for corn ear threshing. Mechanika 2016, 22, 553–561. [Google Scholar] [CrossRef] [Scilit]
- Steponavičius, D.; Pužauskas, E.; Špokas, L.; Jotautienė, E.; Kemzūraitė, A.; Petkevičius, S. Concave design for high-moisture corn ear threshing. Mechanika 2018, 24, 80–91. [Google Scholar] [CrossRef] [Scilit]
- Kang, J.; Wang, X.; Xie, F.; Luo, Y.; Li, Q.; Chen, Z. Design and experiment of symmetrical adjustable concave for soybean combine harvester. Trans. Chin. Soc. Agric. Eng. 2022, 38, 11–22. [Google Scholar]
- Liu, Z.; Dai, S.; Tian, L.; Chen, N.; Wang, Z.; Chen, D. Design and experiment on rotary grate concave threshing-separating unit of head-feeding combine harvester. Trans. Chin. Soc. Agric. Mach. 2018, 49, 169–178. [Google Scholar]
- Cui, T.; Fan, C.; Zhang, D.; Yang, L.; Wang, Z.; Zhao, H.; Wu, H.; Yang, R.; Zhong, X.; Jing, H.; et al. An Automatic Concave Clearance Adjustment System Based on Feed Rate. Chinese Patent CN110149917B, 8 June 2021. [Google Scholar] [CrossRef] [Scilit]
- Li, Y.; Wang, J.; Xu, L.; Tang, Z.; Xu, Z.; Wang, K. Design and experiment on adjusting mechanism of concave clearance of combine harvester cylinder. Trans. Chin. Soc. Agric. Mach. 2018, 49, 68–75. [Google Scholar]
- Kang, J.; Wang, X.; Xie, F.; Hou, J.; Li, Q.; Liu, A. Design and test of the independently-adjustable concave plate screen for a multi-crop combine harvester. Trans. Chin. Soc. Agric. Eng. 2025, 41, 11–21. [Google Scholar]
- Wu, L.; Chen, D.; Xu, X.; Wu, Y. Experimental design and validation of an adjustable straw guide structure for a grain combine harvester thresher based on a material movement model. Appl. Sci. 2023, 13, 8476. [Google Scholar] [CrossRef] [Scilit]
- Liu, A.; Li, P.; Xie, F.; Ashwehmbom, L.G.; Wang, X.; Zhu, L.; Ji, B. Design and experiment of adaptive adjustment of threshing gaps based on the feed rate monitoring of soybean combine harvester conveyor trough. Comput. Electron. Agric. 2025, 237, 110687. [Google Scholar] [CrossRef] [Scilit]
- Fan, C.; Zhang, D.; Yang, L.; Cui, T.; He, X.; Zhao, H.; Dong, J. Development and performance evaluation of a guide vane inclination automatic control system for corn threshing unit based on feedrate monitoring. Comput. Electron. Agric. 2022, 194, 106745. [Google Scholar] [CrossRef] [Scilit]
- Di, Z.; Cui, Z.; Zhang, H.; Zhou, J.; Zhang, M.; Bu, L. Design and experiment of rasp bar and nail tooth combined axial-flow corn threshing cylinder. Trans. Chin. Soc. Agric. Eng. 2018, 34, 28–34. [Google Scholar]
- Zhao, H.; Huang, Y.; Liu, Z.; Liu, W.; Zheng, Z. Applications of discrete element method in the research of agricultural machinery: A review. Agriculture 2021, 11, 425. [Google Scholar] [CrossRef] [Scilit]
- Chen, Z.; Wassgren, C.; Veikle, E.; Ambrose, K. Determination of material and interaction properties of maize and wheat kernels for DEM simulation. Biosyst. Eng. 2020, 195, 208–226. [Google Scholar] [CrossRef] [Scilit]
- Shu, C.; Yang, J.; Wan, X.; Yuan, J.; Liao, Y.; Liao, Q. Calibration and experiment of the discrete element simulation parameters of rape threshing mixture in combine harvester. Trans. Chin. Soc. Agric. Eng. 2022, 38, 34–43. [Google Scholar]
- Pang, J.; Hu, T.; Du, Z.; Wang, S.; Jin, X.; Xie, W. Research into simulation optimization and a specialist system for single-longitudinal-axial-flow threshing devices for grain harvesters. Appl. Sci. 2026, 16, 4570. [Google Scholar] [CrossRef] [Scilit]
- Yang, D.; Jiang, D.; Shen, Y.; Gao, L.; Wan, L.; Wang, J. Design and test on soybean seed thresher with tangential-axial flow double-roller. Trans. Chin. Soc. Agric. Mach. 2017, 48, 102–110. [Google Scholar]
- Cui, T.; Jing, M.; Zhang, D.; Yang, L.; He, X.; Wang, Z. Construction of the discrete element model for maize ears and verification of threshing simulation. Trans. Chin. Soc. Agric. Eng. 2023, 39, 33–46. [Google Scholar]
- Wu, J.; Tang, Q.; Mu, S.; Jiang, L.; Hu, Z. Test and optimization of oilseed rape (Brassica napus L.) threshing device based on DEM. Agriculture 2022, 12, 1580. [Google Scholar] [CrossRef] [Scilit]
- Liu, Y.; Li, Y.; Dong, Y.; Huang, M.; Zhang, T.; Cheng, J. Development of a variable-diameter threshing drum for rice combine harvester using MBD–DEM coupling simulation. Comput. Electron. Agric. 2022, 196, 106859. [Google Scholar] [CrossRef] [Scilit]
- Yuan, J.; Li, H.; Qi, X.; Hu, T.; Bai, M.; Wang, Y. Optimization of airflow cylinder sieve for threshed rice separation using CFD–DEM. Eng. Appl. Comput. Fluid Mech. 2020, 14, 871–881. [Google Scholar] [CrossRef] [Scilit]
- Wang, L.; Feng, X.; Wu, Z.; Li, R.; Cui, Y.; Li, Y. Design and test of stepped vibrating screen with cross-flow fan for maize combine harvester. Trans. Chin. Soc. Agric. Mach. 2018, 49, 115–123. [Google Scholar]
- Wang, L.; Chai, J.; Wang, H.; Wang, Y. Design and performance of a countersunk screen in a maize cleaning device. Biosyst. Eng. 2021, 209, 300–314. [Google Scholar] [CrossRef] [Scilit]
- Liang, Y.; Tang, Z.; Zhang, H.; Li, Y.; Ding, Z.; Su, Z. Cross-flow fan on multi-dimensional airflow field of air screen cleaning system for rice grain. Int. J. Agric. Biol. Eng. 2022, 15, 223–235. [Google Scholar] [CrossRef] [Scilit]
- Zhu, L.; Chen, S.; Zhao, Z.; Ding, H.; Zhu, Y. Influence of sieve surface attitude on sieving performance of granular materials with non-uniform feeding conditions. Agriculture 2022, 12, 2023. [Google Scholar] [CrossRef] [Scilit]
- Wang, L.; Yu, Y.; Zhang, S.; Feng, X.; Song, L. Bionic design and performance test of maize grain cleaning screen through earthworm motion characteristics. Int. J. Agric. Biol. Eng. 2021, 14, 12–21. [Google Scholar] [CrossRef] [Scilit]
- Wu, J.; Tang, Q.; Mu, S.; Yang, X.; Jiang, L.; Hu, Z. Design and test of self-leveling system for cleaning screen of grain combine harvester. Agriculture 2023, 13, 377. [Google Scholar] [CrossRef] [Scilit]
- Ma, Z.; Han, M.; Li, Y.; Gao, H.; Lu, E.; Chandio, F.A.; Ma, K. Motion of cereal particles on variable-amplitude sieve as determined by high-speed image analysis. Comput. Electron. Agric. 2020, 174, 105465. [Google Scholar] [CrossRef] [Scilit]
- Gebrehiwot, M.G.; De Baerdemaeker, J.; Baelmans, M. Effect of a cross-flow opening on the performance of a centrifugal fan in a combine harvester: Computational and experimental study. Biosyst. Eng. 2010, 105, 247–256. [Google Scholar] [CrossRef] [Scilit]
- Wada, M.E.; Liang, Z. Design optimization of cleaning fan blades for rice combine harvesters: An experimental and CFD simulation study. Appl. Sci. 2025, 15, 9043. [Google Scholar] [CrossRef] [Scilit]
- Chen, N.; Tian, L.; Zhang, Z.; Li, L.; Wang, Z.; Chen, D. Design and experiment of double-conical centrifugal cleaning fan for head-feeding combine harvester. Trans. Chin. Soc. Agric. Mach. 2022, 53, 193–202. [Google Scholar]
- Xu, L.; Hansen, A.C.; Li, Y.; Liang, Z.; Yu, L. Numerical and experimental analysis of airflow in a multi-duct cleaning system for a rice combine harvester. Trans. ASABE 2016, 59, 1101–1110. [Google Scholar] [CrossRef] [Scilit]
- Liang, Z.; Xu, L.; De Baerdemaeker, J.; Li, Y.; Saeys, W. Optimisation of a multi-duct cleaning device for rice combine harvesters utilising CFD and experiments. Biosyst. Eng. 2020, 190, 25–40. [Google Scholar] [CrossRef] [Scilit]
- Ding, B.; Liang, Z.; Qi, Y.; Ye, Z.; Zhou, J. Improving Cleaning Performance of Rice Combine Harvesters by DEM–CFD Coupling Technology. Agriculture 2022, 12, 1457. [Google Scholar] [CrossRef] [Scilit]
- Li, D.; He, Q.; Yue, D.; Geng, D.; Yin, J.; Guan, P.; Zha, Z. Research and Experiment on Airflow Field Control Technology of Harvester Cleaning System Based on Load Distribution. Agriculture 2024, 14, 779. [Google Scholar] [CrossRef] [Scilit]
- Wang, H.; Li, Y.; Xu, L.; Huang, M. Design and experimental study of cleaning device of small-scale ratooning rice combine harvester. J. Agric. Mech. Res. 2021, 43, 85–90, 103. [Google Scholar]
- Yin, J.; Cui, Y.; Zha, Z.; Yu, Q.; Guan, P.; Wang, Y.; Wang, X.; Geng, D. Study and Testing of a Front-Blowing and Rear-Suction Enhanced Cleaning Technology for Grain Combine Harvesters. Agriculture 2025, 15, 1722. [Google Scholar] [CrossRef] [Scilit]
- Badretdinov, I.; Mudarisov, S.; Khasanov, E.; Nasyrov, R.; Tuktarov, M. Operation technological process research in the cleaning system of the grain combine. J. Agric. Eng. 2021, 52, 1129. [Google Scholar] [CrossRef] [Scilit]
- Li, D. Numerical Simulation of Internal Flow Field of Centrifugal Fan for Clearing and Selecting Grain Harvester. J. Eng. Mech. Mach. 2020, 5, 12–18. [Google Scholar]
- Liang, Z.; Li, D.; Li, J.; Tian, K. Effects of Fan Volute Structure on Airflow Characteristics in Rice Combine Harvesters. Span. J. Agric. Res. 2020, 18, e0209. [Google Scholar] [CrossRef] [Scilit]
- Sun, X.; Zong, W.; Ma, L.; Wan, X. Design and test of the dual-airduct cleaning device for oilseed rape harvesters in hilly and mountainous areas. Trans. Chin. Soc. Agric. Eng. 2025, 41, 72–82. [Google Scholar]
- Chai, X.; Xu, L.; Sun, Y.; Liang, Z.; Lu, E.; Li, Y. Development of a cleaning fan for a rice combine harvester using computational fluid dynamics and response surface methodology to optimise outlet airflow distribution. Biosyst. Eng. 2020, 192, 232–244. [Google Scholar] [CrossRef] [Scilit]
- Geng, D.; Mu, X.; Zhang, G.; Wang, Z.; Zhu, J.; Xu, H. Analysis and optimization test of cleaning mechanism of wheat combine harvester. J. Jilin Univ. (Eng. Technol. Ed.) 2022, 52, 219–230. [Google Scholar]
- Zhang, C.; He, J.; Yang, S.; Qiao, Y.; Zhou, L.; Dai, L. Optimization of airflow field and experimental verification for wheat cleaning device based on CFD-DEM. Fluids 2026, 11, 85. [Google Scholar]
- Guo, B.; Ma, X.; Liu, Z.; Chen, G.; Wang, Z. Simulation study and parameters discussion on wind-sieve type grain cleaning. J. Agric. Mech. Res. 2021, 43, 10–15. [Google Scholar]
- Mu, P. Research on High Net and Low Loss Cleaning Screen of Corn Grain Harvester. Master’s Thesis, Jilin University, Changchun, China, 2020. [Google Scholar]
- Coetzee, C.J. Review: Calibration of the discrete element method. Powder Technol. 2017, 310, 104–142. [Google Scholar] [CrossRef] [Scilit]
- Zhang, X.; Wang, H.; Wang, F.; Lian, Z. Parameter calibration of discrete element model for alfalfa seeds based on EDEM simulation experiments. Int. J. Agric. Biol. Eng. 2024, 17, 33–38. [Google Scholar] [CrossRef] [Scilit]
- Ghodki, B.M.; Patel, M.; Namdeo, R.; Carpenter, G. Calibration of discrete element model parameters: Soybeans. Comput. Part. Mech. 2019, 6, 3–10. [Google Scholar] [CrossRef] [Scilit]
- Zhao, L.; Chen, L.; Yuan, F.; Wang, L. Simulation Study of Rice Cleaning Based on DEM–CFD Coupling Method. Processes 2022, 10, 281. [Google Scholar] [CrossRef] [Scilit]
- Yan, Z.; Wilkinson, S.K.; Stitt, E.H.; Marigo, M. Discrete element modelling (DEM) input parameters: Understanding their impact on model predictions using statistical analysis. Comput. Part. Mech. 2015, 2, 283–299. [Google Scholar] [CrossRef] [Scilit]
- Tsuji, Y.; Kawaguchi, T.; Tanaka, T. Discrete particle simulation of two-dimensional fluidized bed. Powder Technol. 1993, 77, 79–87. [Google Scholar] [CrossRef] [Scilit]
- Li, H.; Li, Y.; Gao, F.; Zhao, Z.; Xu, L. CFD–DEM simulation of material motion in air-and-screen cleaning device. Comput. Electron. Agric. 2012, 88, 111–119. [Google Scholar] [CrossRef] [Scilit]
- Liu, W.; Zeng, S.; Chen, X. Design and experiment of spiral step cleaning device for ratooning rice based on CFD–DEM coupling. Comput. Electron. Agric. 2024, 224, 109207. [Google Scholar] [CrossRef] [Scilit]
- Ling, J.; Gu, M.; Luo, W.; Shen, H.; Hu, Z.; Gu, F.; Wu, F.; Zhang, P.; Xu, H. Simulation Analysis and Test of a Cleaning Device for a Fresh-Peanut-Picking Combine Harvester Based on Computational Fluid Dynamics–Discrete Element Method Coupling. Agriculture 2024, 14, 1594. [Google Scholar] [CrossRef] [Scilit]
- Wang, L.; Feng, X.; Zheng, Z.; Yu, Y.; Liu, T.; Ma, Y. Design and experiment of combined-hole screen for maize cleaning. Trans. Chin. Soc. Agric. Mach. 2019, 50, 104–113. [Google Scholar]
- Sun, Y.; Liu, R.; Ou, H.; Zhang, Z.; Zhang, M.; Li, H. Analysis and comparison of feed rate detection methods of combine harvester based on power detection. Trans. Chin. Soc. Agric. Mach. 2020, 51, 118–123. [Google Scholar]
- Sun, Y.; Liu, R.; Zhang, M.; Li, M.; Zhang, Z.; Li, H. Design of feed rate monitoring system and estimation method for yield distribution information on combine harvester. Comput. Electron. Agric. 2022, 201, 107322. [Google Scholar] [CrossRef] [Scilit]
- Abdeen, M.A.; Xie, G.; Salem, A.E.; Fu, J.; Zhang, G. Longitudinal axial flow rice thresher feeding rate monitoring based on force sensing resistors. Sci. Rep. 2022, 12, 1369. [Google Scholar] [CrossRef] [Scilit] [PubMed]
- Zhang, C.; Li, Q.; Ye, S.; Zheng, D. Design and test of a wireless monitoring system for feed rate in combine harvester based on bottom plate pressure of chain-rake conveyor. INMATEH Agric. Eng. 2025, 77, 894–903. [Google Scholar] [CrossRef] [Scilit]
- Jiang, T.; Guan, Z.; Li, H.; Mu, S.; Wu, C.; Zhang, M.; Wang, G.; Chen, X. A feeding quantity monitoring system for a combine harvester: Design and experiment. Agriculture 2022, 12, 153. [Google Scholar] [CrossRef] [Scilit]
- Liang, Z.; Qin, Y.; Su, Z. Establishment of a feeding rate prediction model for combine harvesters. Agriculture 2024, 14, 589. [Google Scholar] [CrossRef] [Scilit]
- Gao, Z.; Xu, L.; Li, Y.; Wang, Y.; Sun, P. Vibration measure and analysis of crawler-type rice and wheat combine harvester in field harvesting condition. Trans. Chin. Soc. Agric. Eng. 2017, 33, 48–55. [Google Scholar]
- Hao, S.; Tang, Z.; Guo, S.; Ding, Z.; Su, Z. Model and method of fault signal diagnosis for blockage and slippage of rice threshing drum. Agriculture 2022, 12, 1968. [Google Scholar] [CrossRef] [Scilit]
- Ma, Z.; Jiang, S.; Li, Y.; Xu, L.; Zhu, Y.; Shi, M.; Traore, S.N. Recognition methods of threshing load conditions based on machine learning algorithms. Comput. Electron. Agric. 2022, 200, 107250. [Google Scholar] [CrossRef] [Scilit]
- Tang, Z.; Zhang, H.; Zhou, Y. Unbalanced vibration identification of tangential threshing cylinder induced by rice threshing process. Shock Vib. 2018, 2018, 4708730. [Google Scholar] [CrossRef] [Scilit]
- Bhandari, S.; Jotautienė, E. Vibration analysis of a roller bearing condition used in a tangential threshing drum of a combine harvester for the smooth and continuous performance of agricultural crop harvesting. Agriculture 2022, 12, 1969. [Google Scholar] [CrossRef] [Scilit]
- Craessaerts, G.; Saeys, W.; Missotten, B.; De Baerdemaeker, J. Identification of the cleaning process on combine harvesters, Part II: A fuzzy model for prediction of the sieve losses. Biosyst. Eng. 2010, 106, 97–102. [Google Scholar] [CrossRef] [Scilit]
- Liang, Z.; Jiang, Q. Sensors in combine harvesters for process monitoring and control. Agriculture 2026, 16, 1315. [Google Scholar] [CrossRef] [Scilit]
- Reyns, P.; Missotten, B.; Ramon, H.; De Baerdemaeker, J. A review of combine sensors for precision farming. Precis. Agric. 2002, 3, 169–182. [Google Scholar] [CrossRef] [Scilit]
- Liang, Z.; Li, Y.; Zhao, Z.; Xu, L.; Tang, Z. Monitoring mathematical model of grain cleaning losses on longitudinal-axial flow combine harvester. Trans. Chin. Soc. Agric. Mach. 2015, 46, 106–111. [Google Scholar]
- Zhang, M.; Jiang, L.; Wu, C.; Wang, G. Design and test of cleaning loss kernel recognition system for corn combine harvester. Agronomy 2022, 12, 1145. [Google Scholar] [CrossRef] [Scilit]
- Liu, C.; Leonard, J. Monitoring actual grain loss from an axial flow combine in real time. Comput. Electron. Agric. 1993, 9, 231–242. [Google Scholar] [CrossRef] [Scilit]
- Liang, Z.; Li, Y.; Xu, L.; Zhao, Z. Sensor for monitoring rice grain sieve losses in combine harvesters. Biosyst. Eng. 2016, 147, 51–66. [Google Scholar] [CrossRef] [Scilit]
- Shen, Y.; Gao, J.; Jin, Z. Research on acoustic signal identification mechanism and denoising methods of combine harvesting loss. Agronomy 2024, 14, 1816. [Google Scholar] [CrossRef] [Scilit]
- Chen, J.; Lian, Y.; Zou, R.; Zhang, S.; Ning, X.; Han, M. Real-time grain breakage sensing for rice combine harvesters using machine vision technology. Int. J. Agric. Biol. Eng. 2020, 13, 194–199. [Google Scholar] [CrossRef] [Scilit]
- Mahirah, J.; Yamamoto, K.; Miyamoto, M.; Kondo, N.; Ogawa, Y.; Suzuki, T.; Habaragamuwa, H.; Ahmad, U. Monitoring harvested paddy during combine harvesting using a machine vision-double lighting system. Eng. Agric. Environ. Food 2017, 10, 140–149. [Google Scholar] [CrossRef] [Scilit]
- Chen, J.; Lian, Y.; Li, Y. Real-time grain impurity sensing for rice combine harvesters using image processing and decision-tree algorithm. Comput. Electron. Agric. 2020, 175, 105591. [Google Scholar] [CrossRef] [Scilit]
- Guan, Z.; Li, H.; Chen, X.; Mu, S.; Jiang, T.; Zhang, M.; Wu, C. Development of impurity-detection system for tracked rice combine harvester based on DEM and Mask R-CNN. Sensors 2022, 22, 9550. [Google Scholar] [CrossRef] [Scilit] [PubMed]
- Jin, C.; Liu, S.; Chen, M.; Yang, T.; Xu, J. Online quality detection of machine-harvested soybean based on improved U-Net network. Trans. Chin. Soc. Agric. Eng. 2022, 38, 70–80. [Google Scholar]
- Wu, Z.; Chen, J.; Ma, Z.; Li, Y.; Zhu, Y. Development of a lightweight online detection system for impurity content and broken rate in rice for combine harvesters. Comput. Electron. Agric. 2024, 218, 108689. [Google Scholar] [CrossRef] [Scilit]
- Cui, Z.; Liu, P.; Hu, J.; Guo, E.; He, Z.; Chai, X.; Chen, H.; Song, Z.; Xu, L. An online precision estimation method for impurity mass in grain flow of rice combine harvesters based on multimodal data fusion. Comput. Electron. Agric. 2026, 242, 111308. [Google Scholar] [CrossRef] [Scilit]
- Maertens, K.; Ramon, H.; De Baerdemaeker, J. An on-the-go monitoring algorithm for separation processes in combine harvesters. Comput. Electron. Agric. 2004, 43, 197–207. [Google Scholar] [CrossRef]
- Chai, X.; Xu, L.; Li, Y.; Qiu, J.; Li, Y.; Lv, L.; Zhu, Y. Development and experimental analysis of a fuzzy grey control system on rapeseed cleaning loss. Electronics 2020, 9, 1764. [Google Scholar] [CrossRef] [Scilit]
- Guo, D.; Du, Y.; Wang, L.; Zhang, W.; Sun, T.; Wu, Z. Digital twin for monitoring threshing performance of combine harvesters. Measurement 2025, 239, 115411. [Google Scholar] [CrossRef] [Scilit]
- Jiang, T.; Guan, Z.; Li, H.; Zhang, M.; Mu, S.; Wu, C.; Jin, M. Collaborative optimization method of cleaning operational performance and multiparameter online control system for combine harvesters. Comput. Electron. Agric. 2025, 235, 110389. [Google Scholar] [CrossRef] [Scilit]
- Li, Y.; Xu, L.; Lv, L.; Shi, Y.; Yu, X. Study on modeling method of a multi-parameter control system for threshing and cleaning devices in the grain combine harvester. Agriculture 2022, 12, 1483. [Google Scholar] [CrossRef] [Scilit]
- Yang, L.; Xu, L.; Li, Y.; Lv, L.; Shi, M. Modeling and control methods of a multi-parameter system for threshing and cleaning in grain combine harvesters. Comput. Electron. Agric. 2024, 225, 109251. [Google Scholar] [CrossRef] [Scilit]
- Guo, D.; Wang, L.; Du, Y.; Wu, Z.; Zhang, W.; Qiao, Z.; Ma, R. Online optimization of adjustable settings for agricultural machinery assisted by digital twin. Comput. Electron. Agric. 2024, 227, 109504. [Google Scholar] [CrossRef] [Scilit]
- Chen, J.; Zheng, S.; Li, Y.; Lü, S. Grey predictive fuzzy control system of forward speed for combine harvester. Trans. Chin. Soc. Agric. Mach. 2011, 42, 110–115. [Google Scholar]
- Kang, J.; Yuan, Y.; Liu, H.; He, J.; Jiang, M.; He, P. Load control of threshing cylinder of small-sized harvester based on current detection. Eng. Agric. Environ. Food 2017, 10, 150–156. [Google Scholar] [CrossRef] [Scilit]
- Sun, Y.; Liu, R.; Li, S.; Zhang, M.; Li, H. Feed rate control method and simulation experiment of combine harvester based on GWO-MPC. Trans. Chin. Soc. Agric. Mach. 2023, 54, 83–91. [Google Scholar]
- Liang, Z.; Li, Y.; Xu, L. Grain sieve loss fuzzy control system in rice combine harvesters. Appl. Sci. 2019, 9, 114. [Google Scholar] [CrossRef] [Scilit]
- Liu, P.; Wang, X.; Jin, C. Research on the adaptive cleaning system of a soybean combine harvester. Agriculture 2023, 13, 2085. [Google Scholar] [CrossRef] [Scilit]
- Lou, X.; Li, M.; Du, Y.; Mao, E.; Fu, L. Design and experiment of cleaning control system for corn combined harvester. J. Chin. Agric. Mech. 2024, 45, 1–8. [Google Scholar]
- Pang, J.; Tian, Y.; Dai, Z.; Du, Z.; Dang, F.; Chen, X.; Li, X. Modeling and experimental study of fuzzy control system for operating parameters of grain combine harvester cleaning device. Appl. Sci. 2026, 16, 3137. [Google Scholar] [CrossRef] [Scilit]
- Zhu, Z.; Chai, X.; Xu, L.; Quan, L.; Yuan, C.; Weng, S.; Cao, G.; Jiang, W. Research on predictive control of a novel electric cleaning system for combine harvester based on data-driven. Comput. Electron. Agric. 2025, 232, 110075. [Google Scholar] [CrossRef] [Scilit]
- Chen, P.; Yang, H.; Zhao, C.; Pei, J.; Gu, F.; Wang, Y.; Yu, Z.; Wu, F. Current status and future prospects of simulation technology in cleaning systems for crop harvesters. Agriculture 2026, 16, 446. [Google Scholar] [CrossRef] [Scilit]
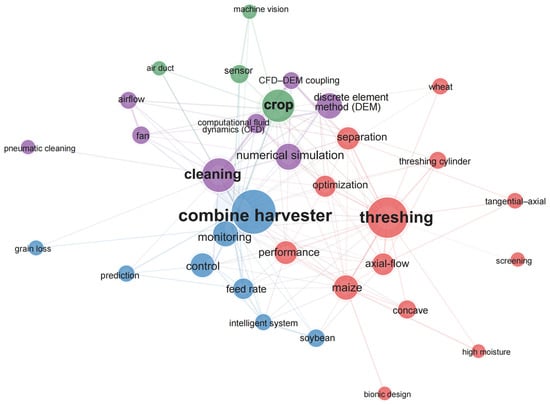
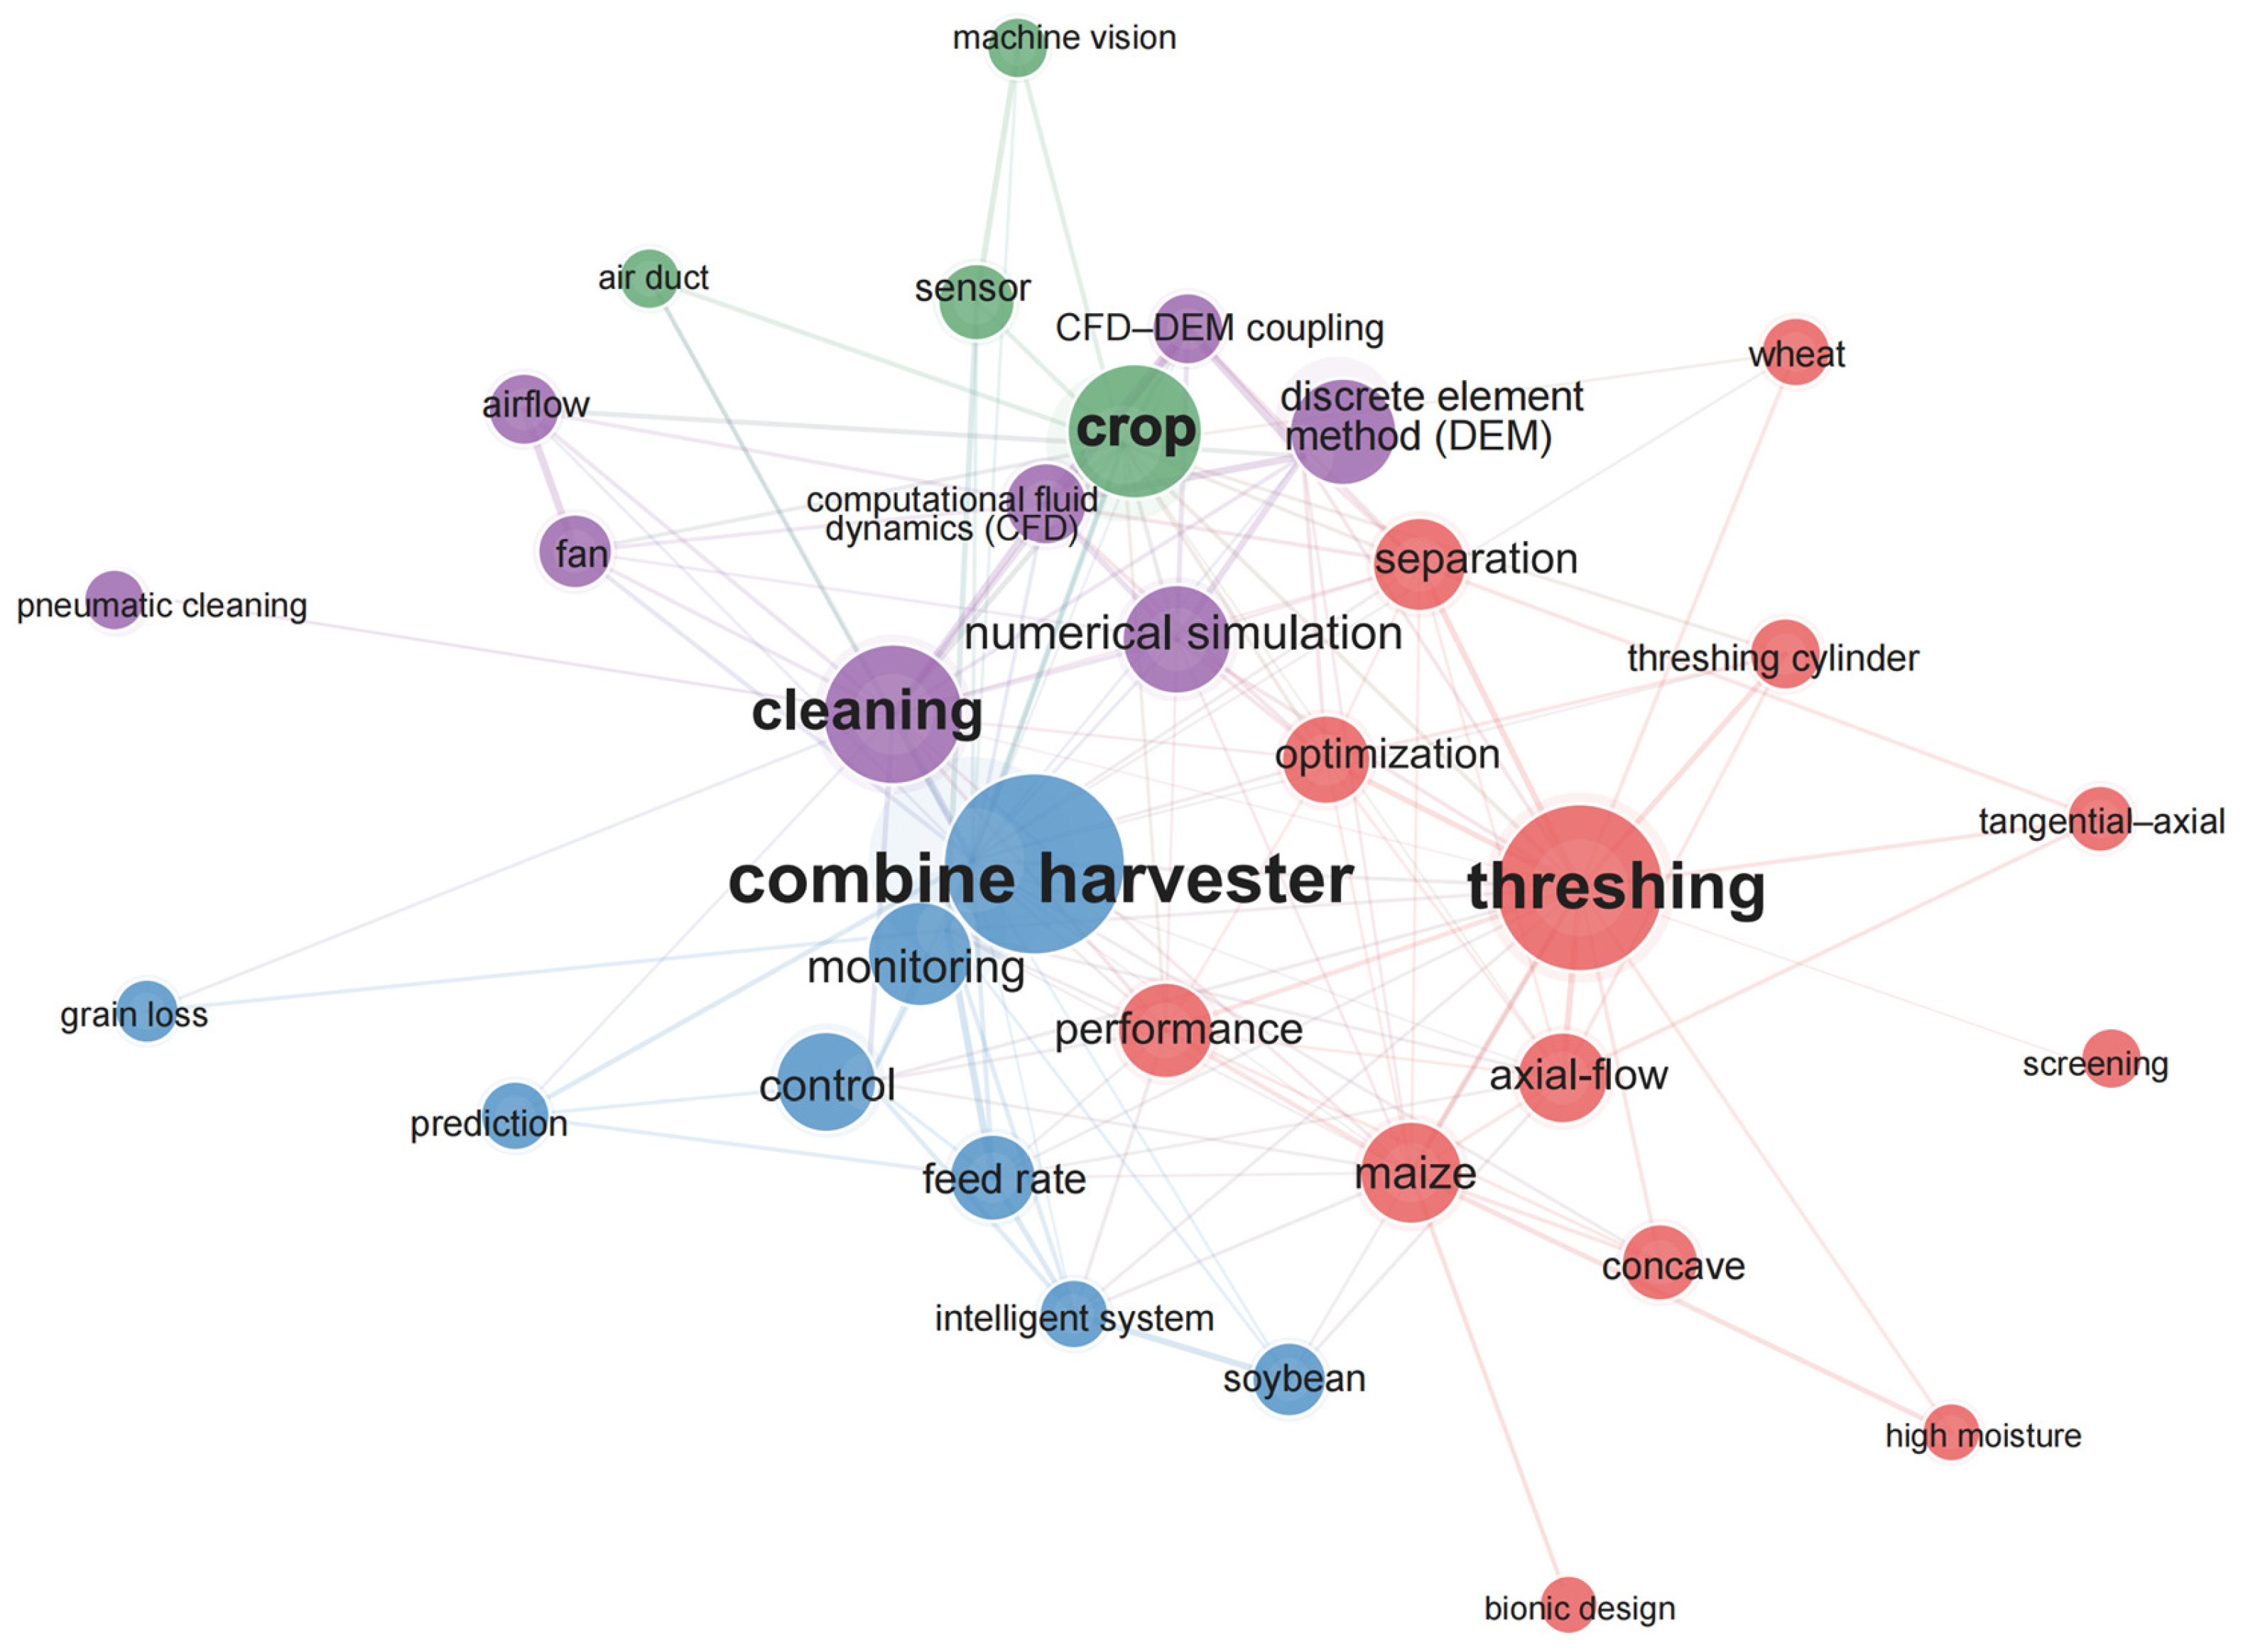
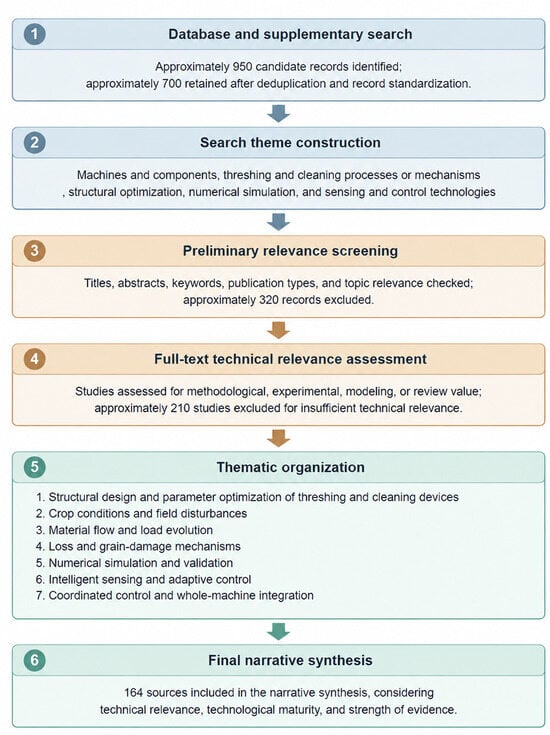
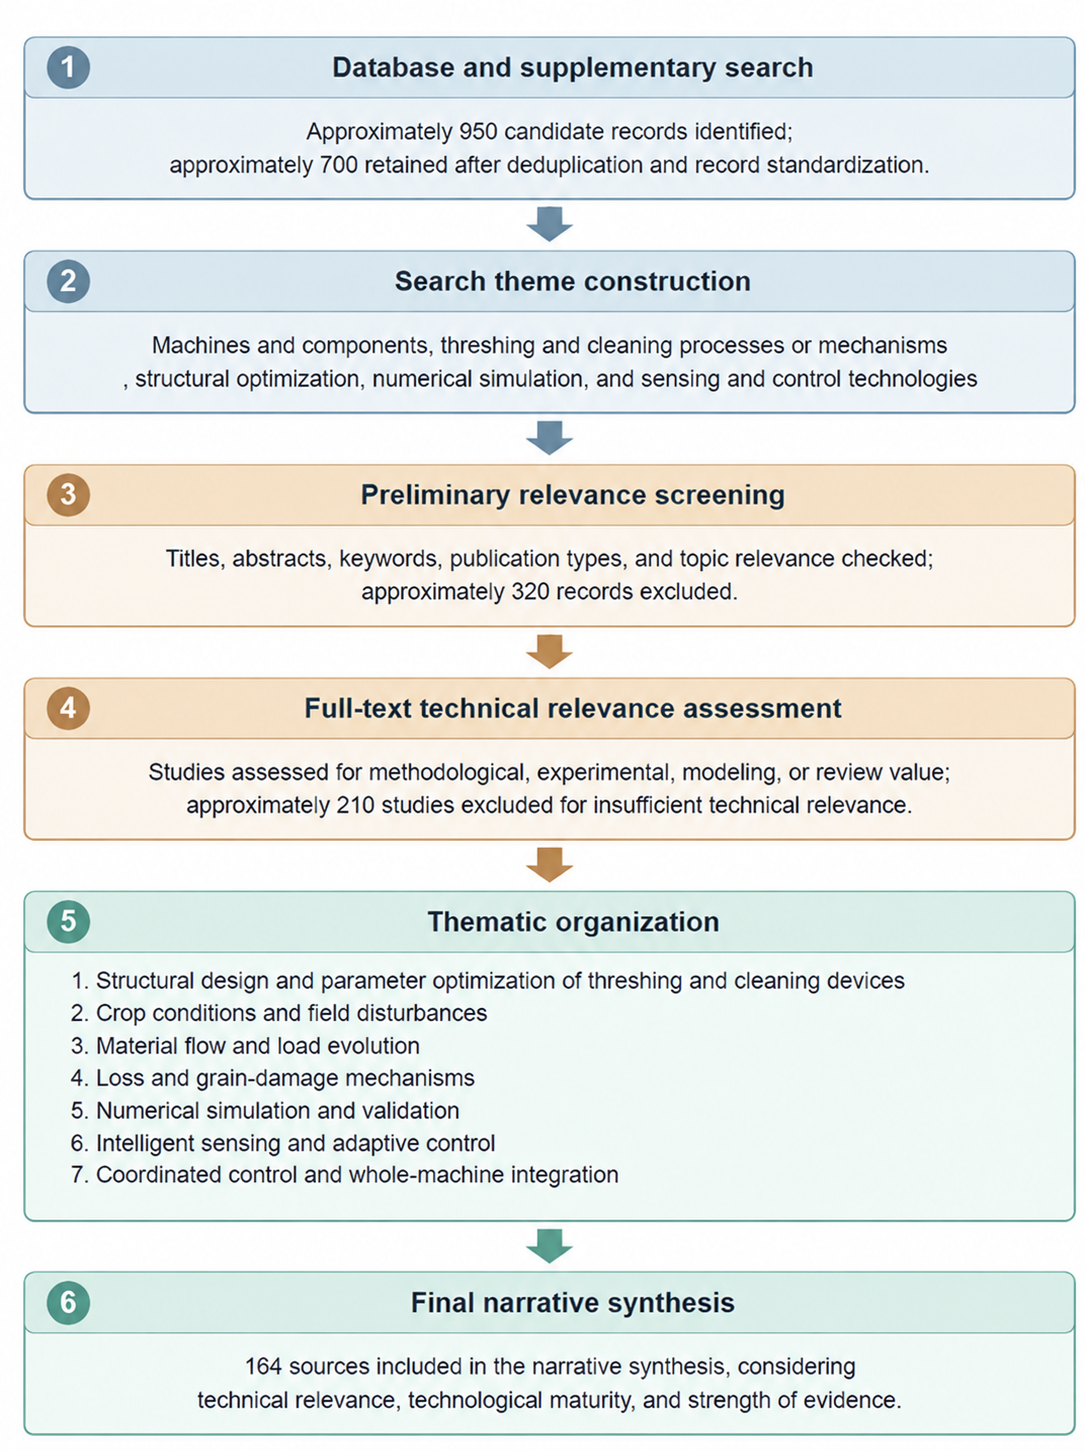
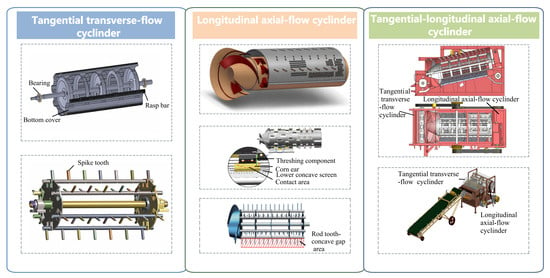
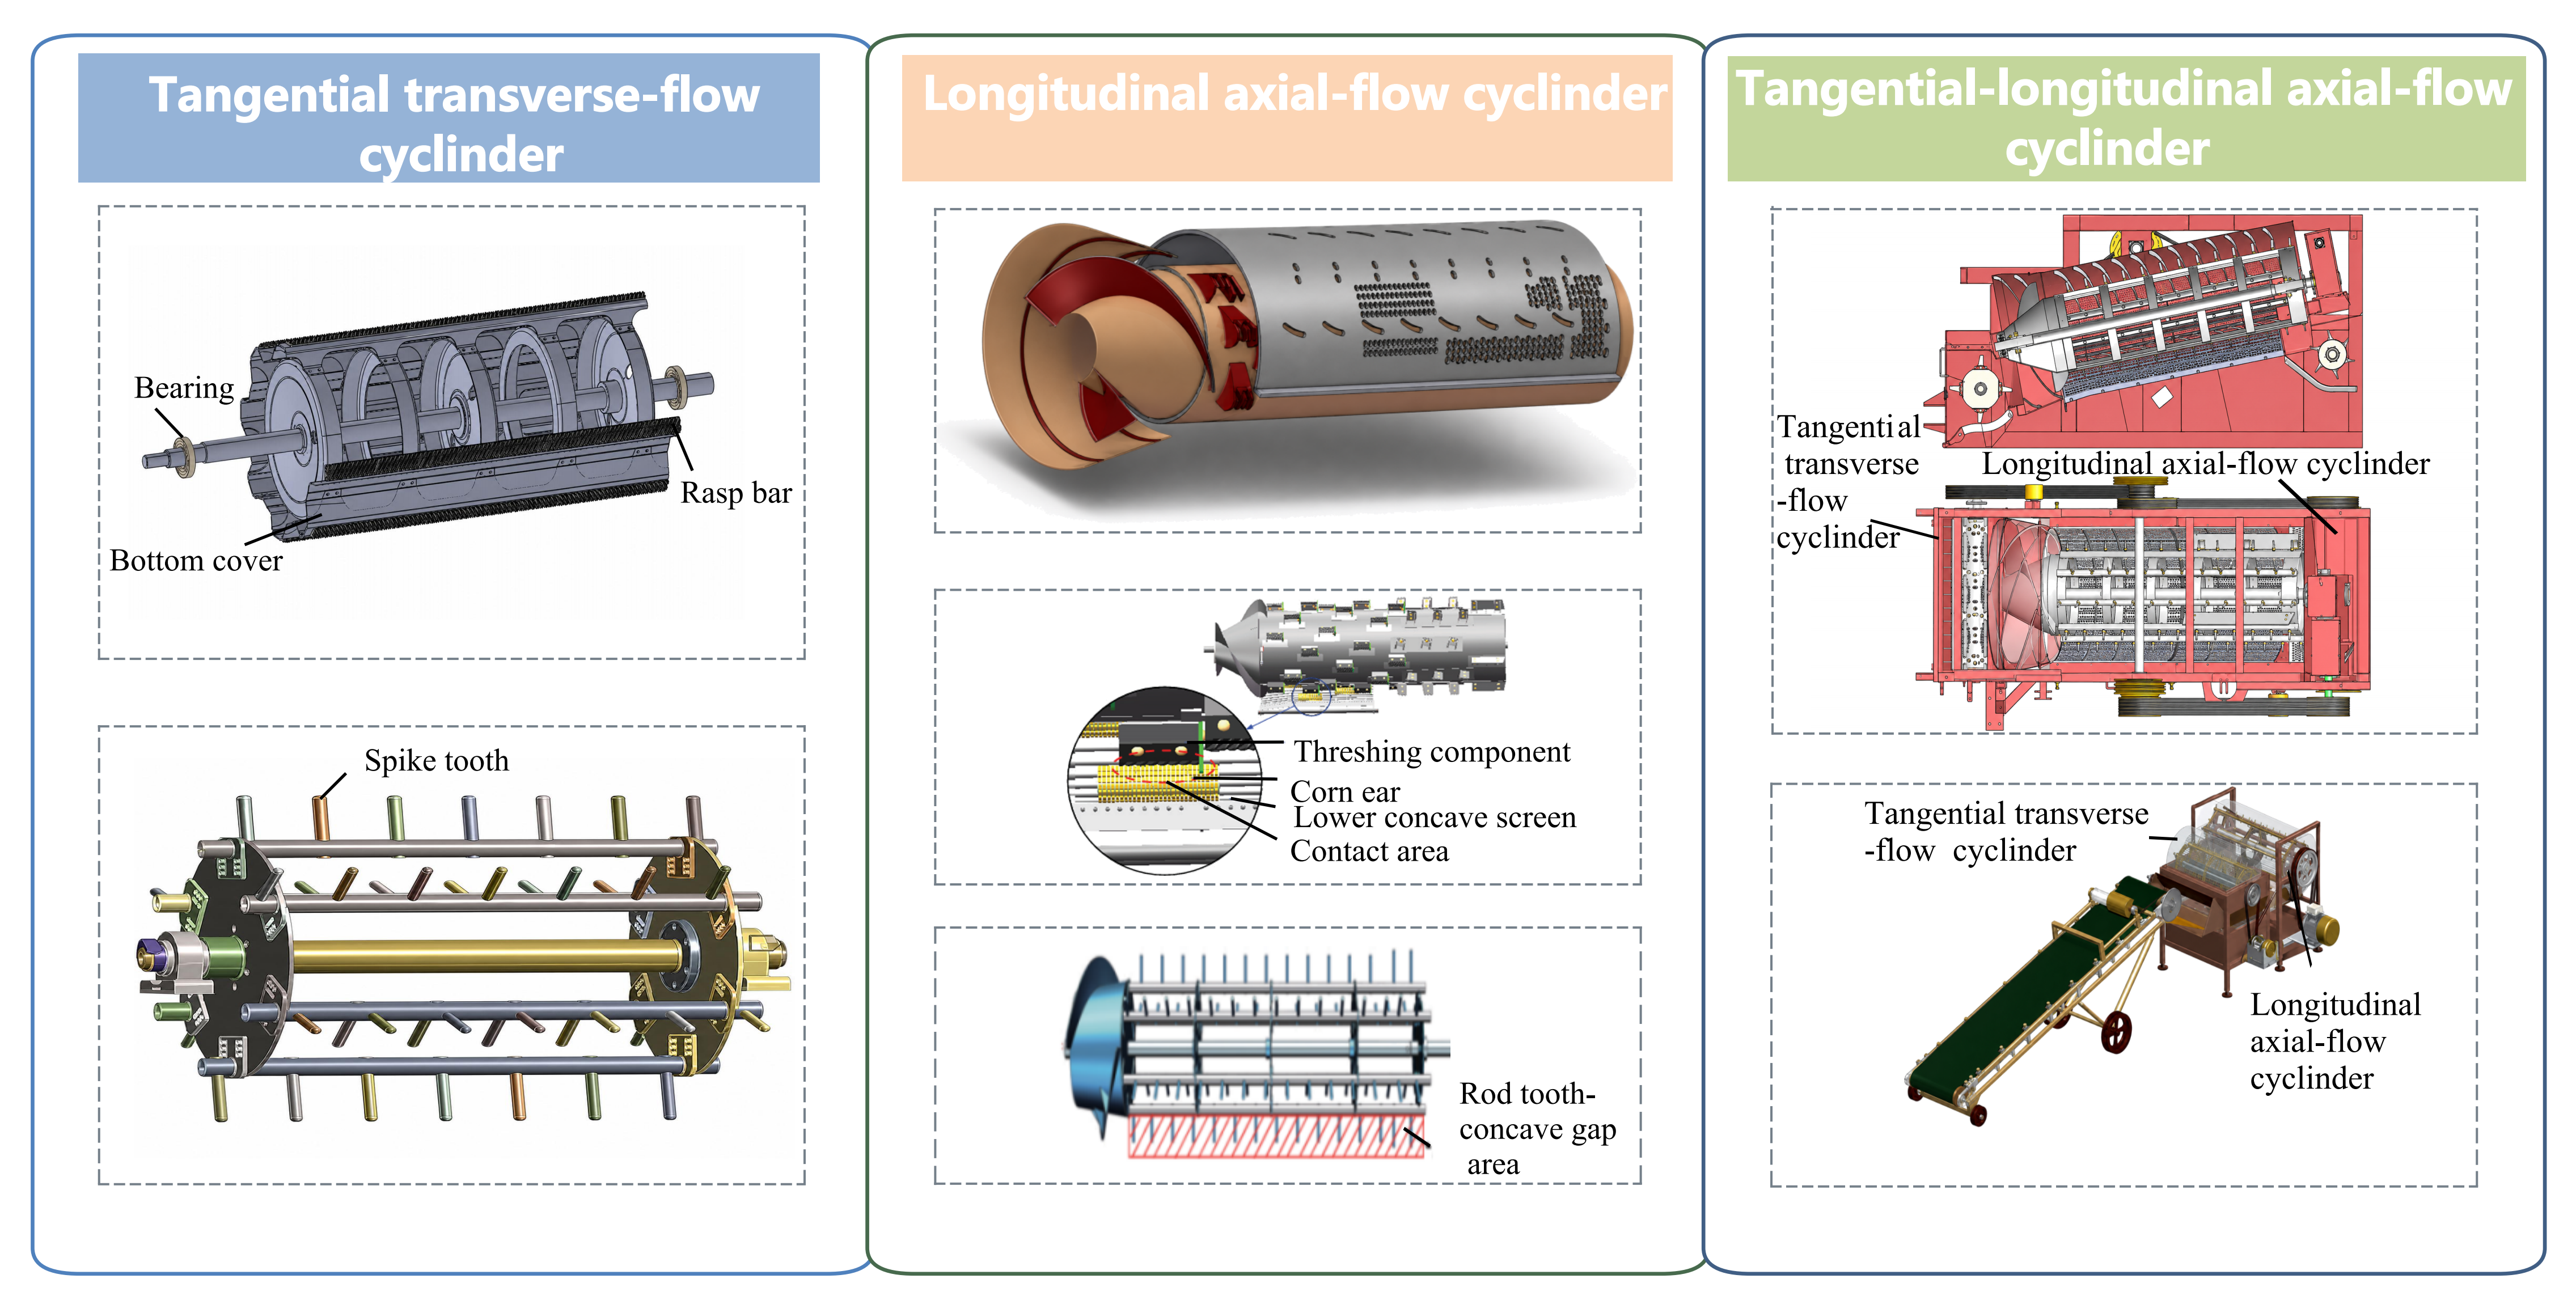
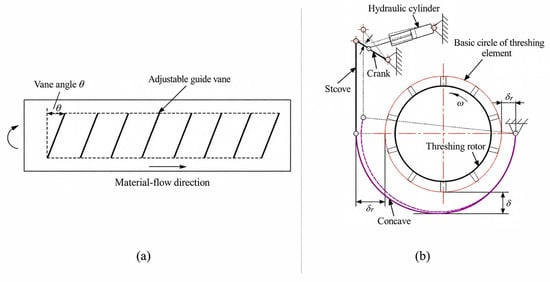
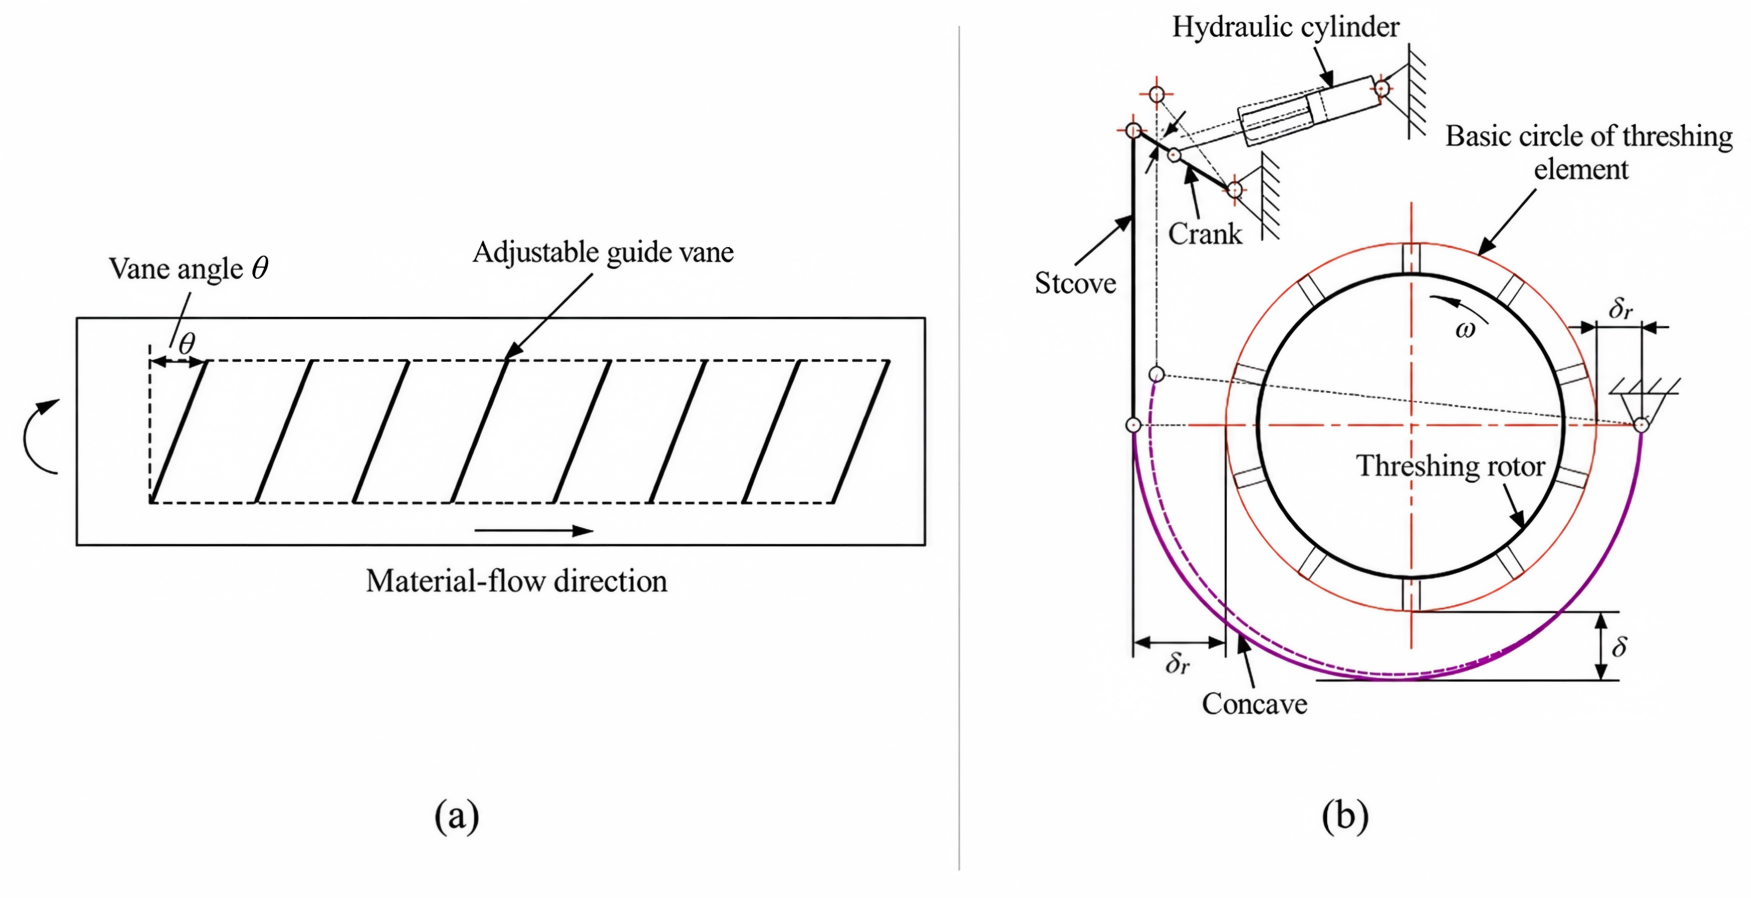
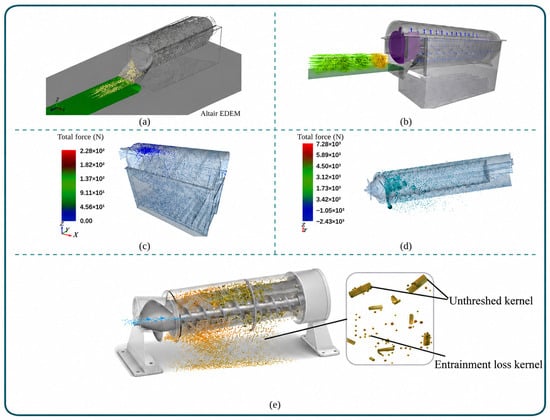
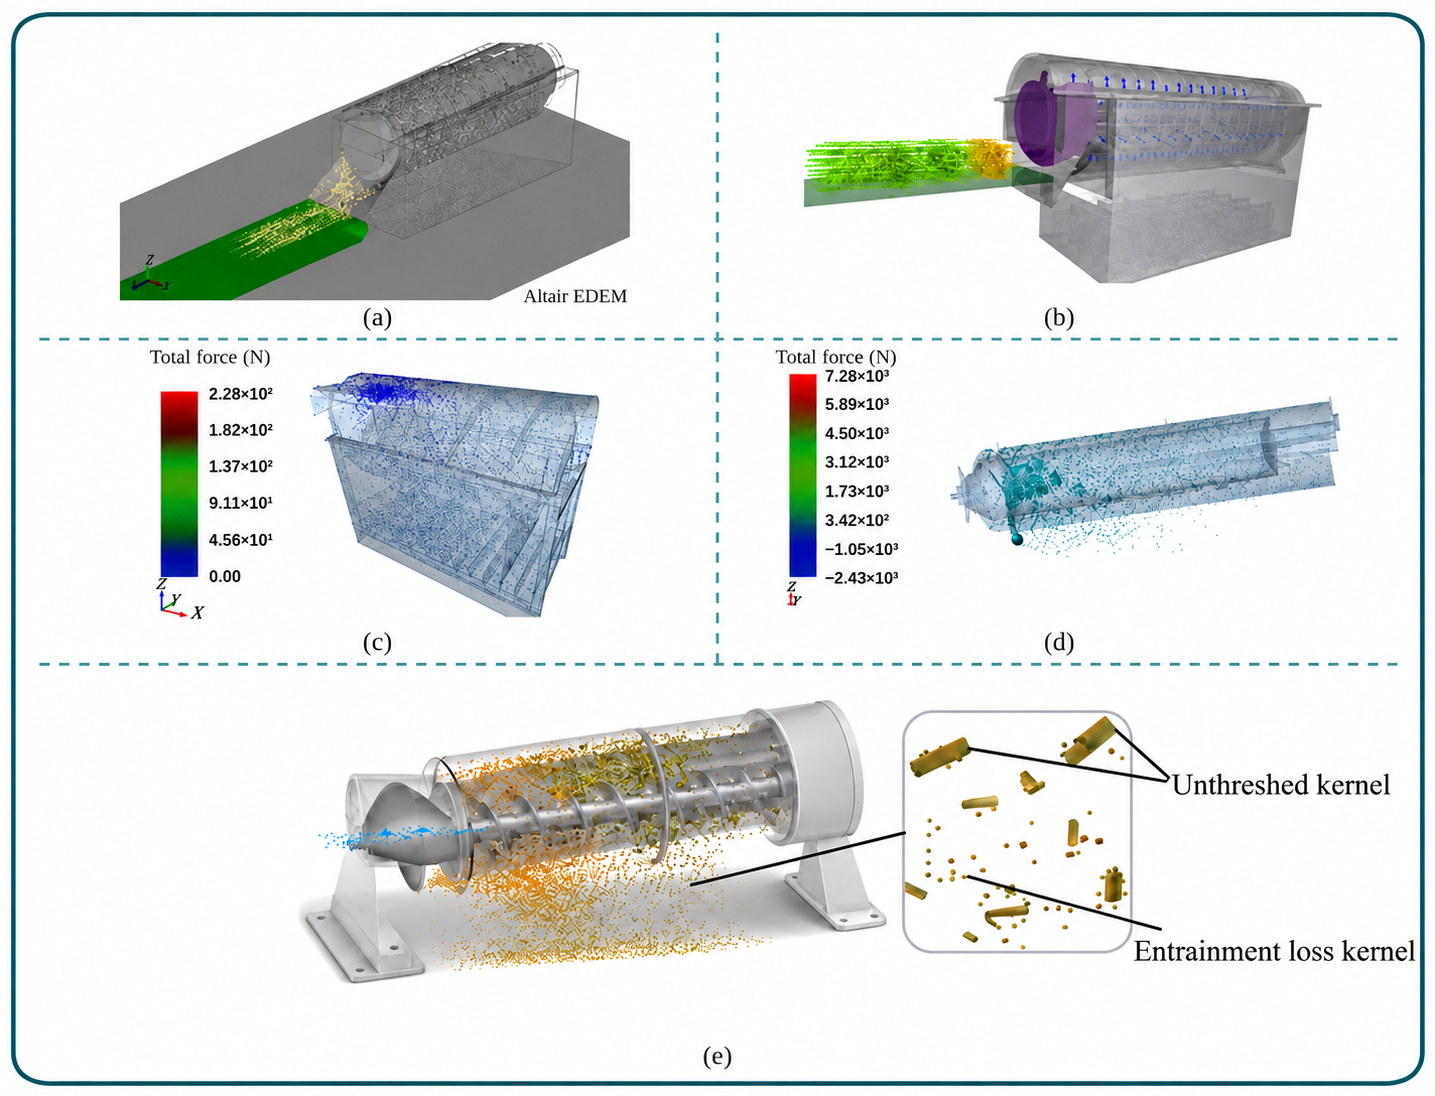
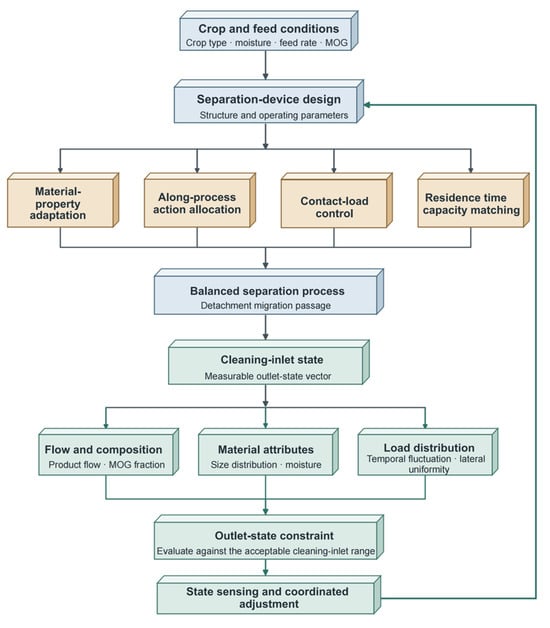
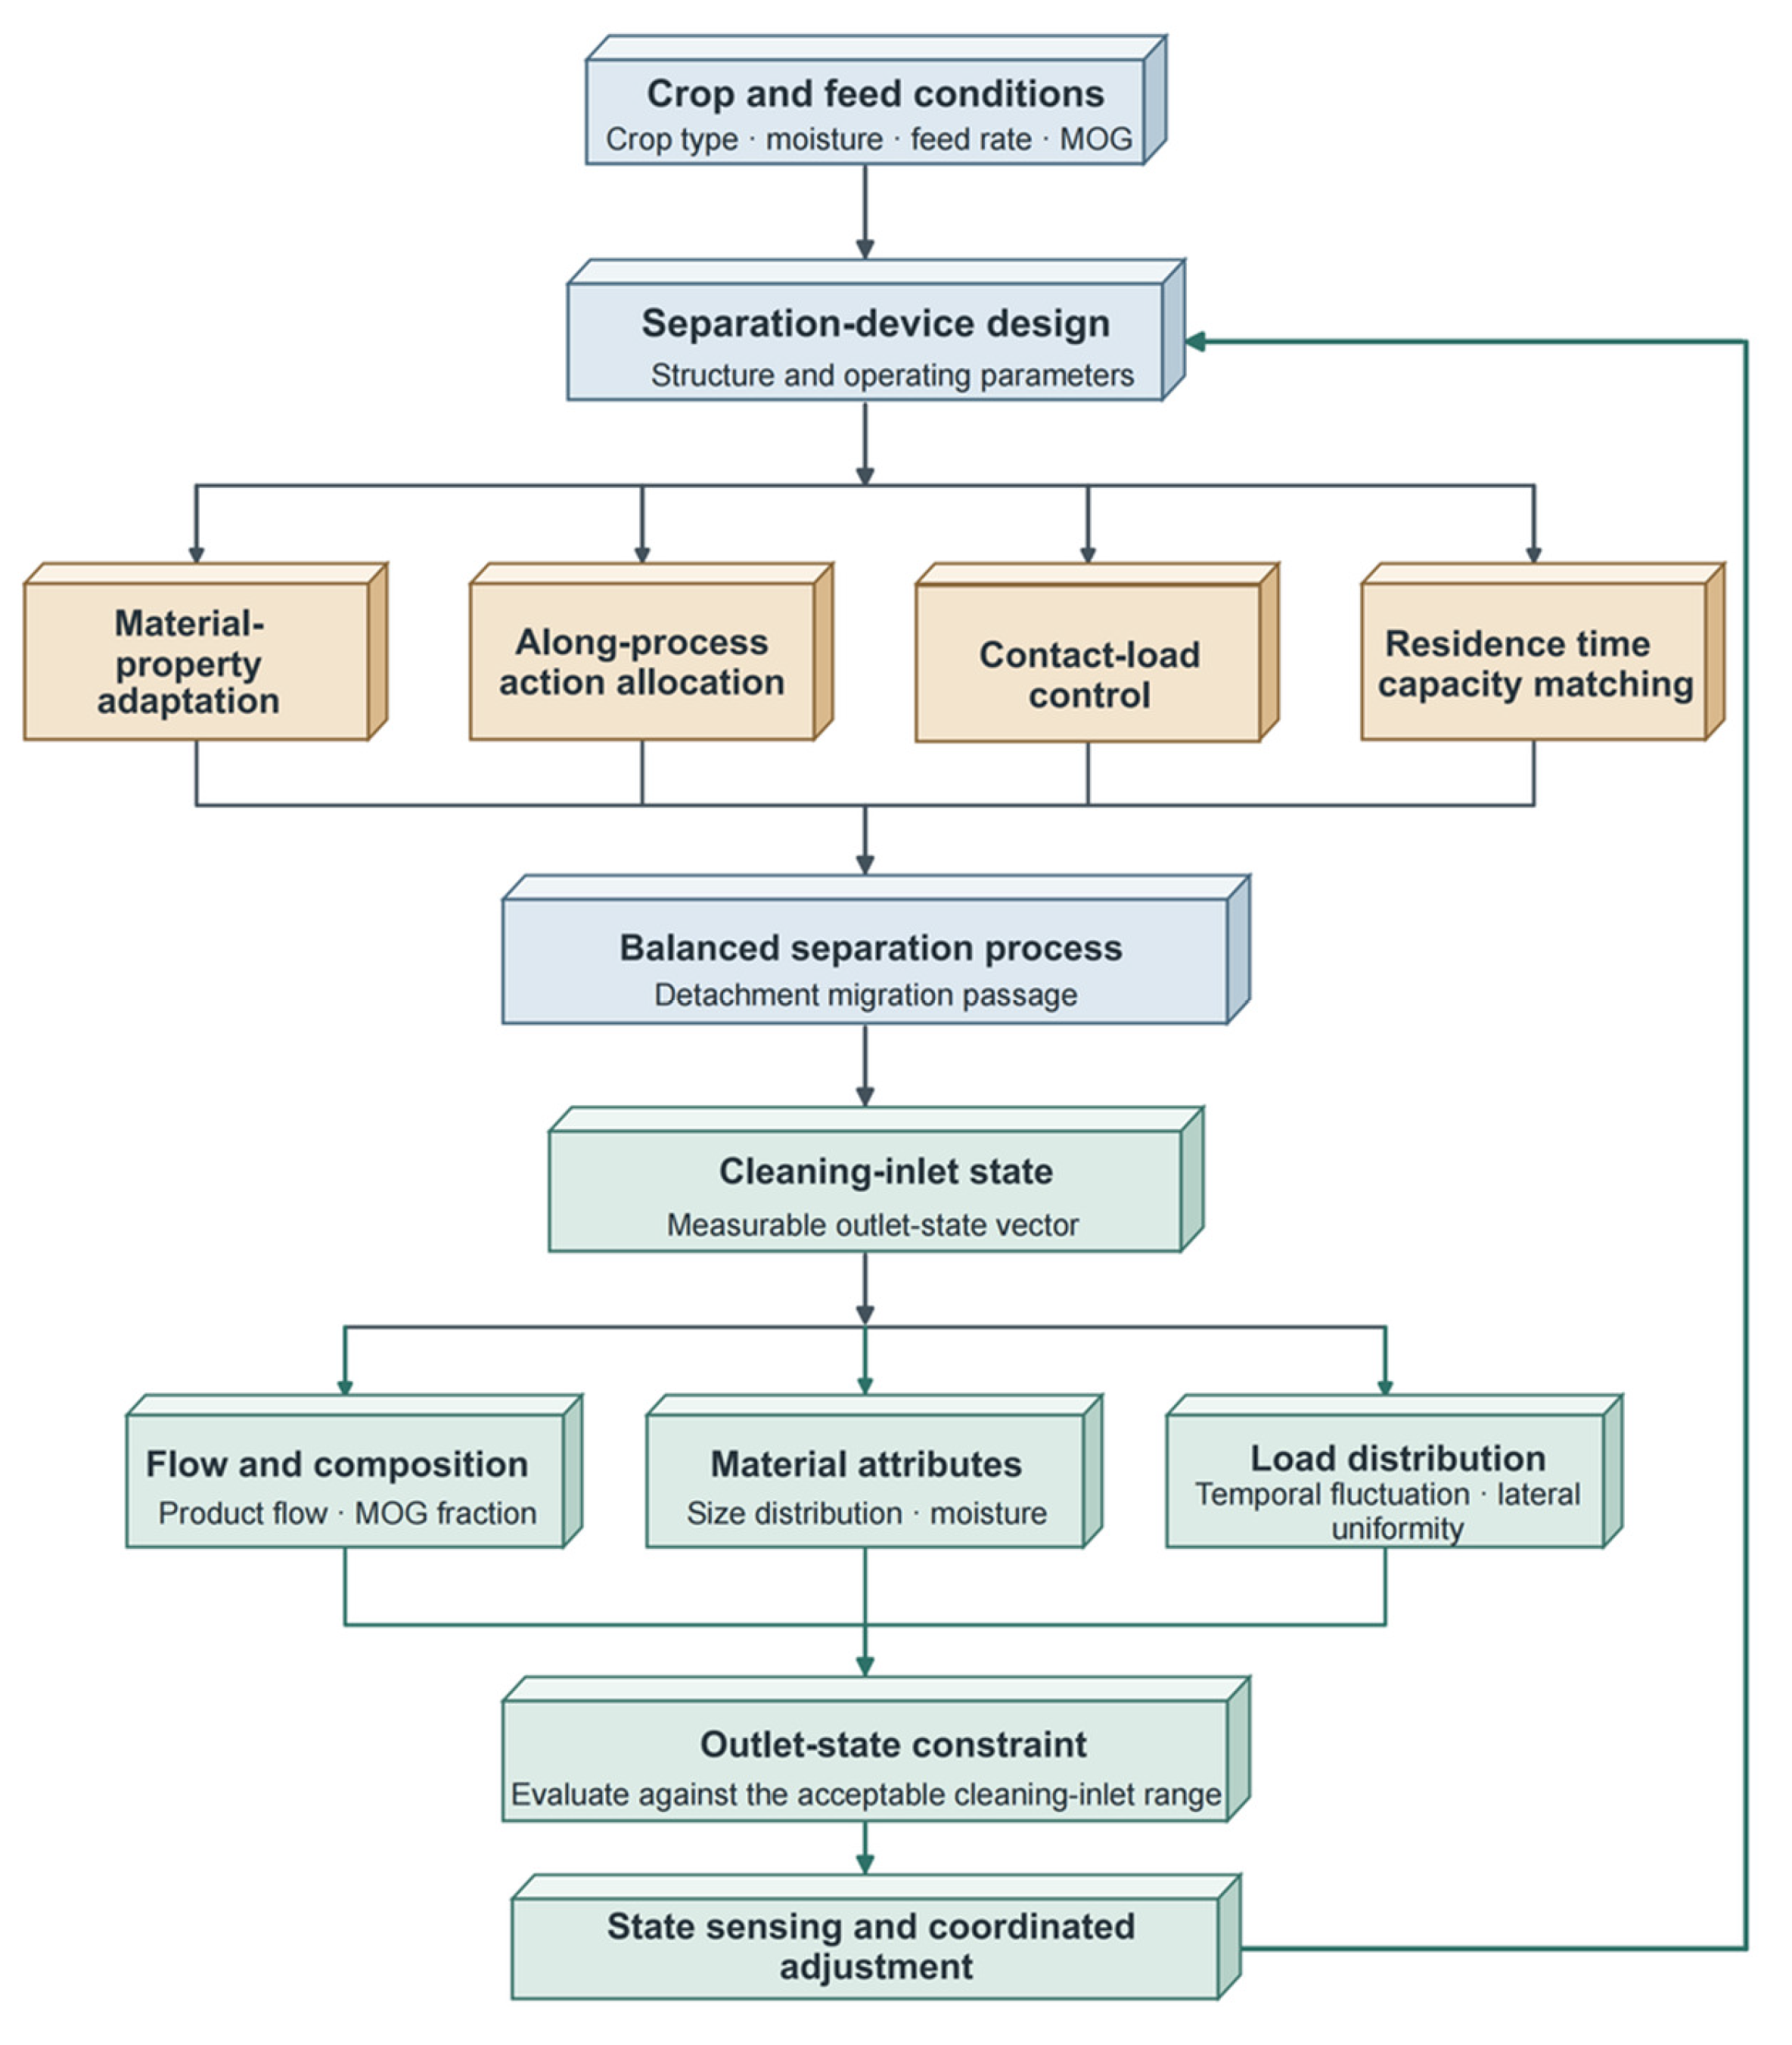
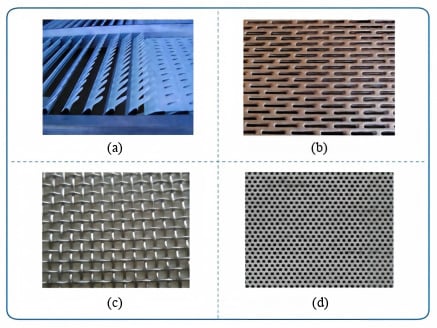
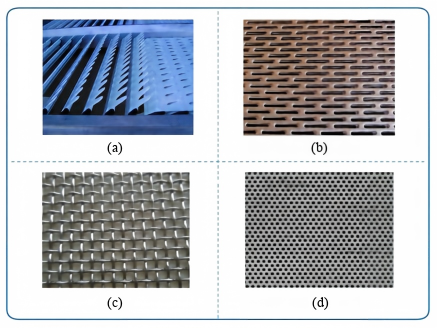
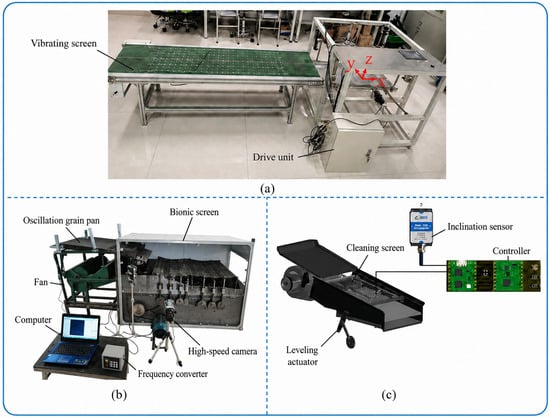
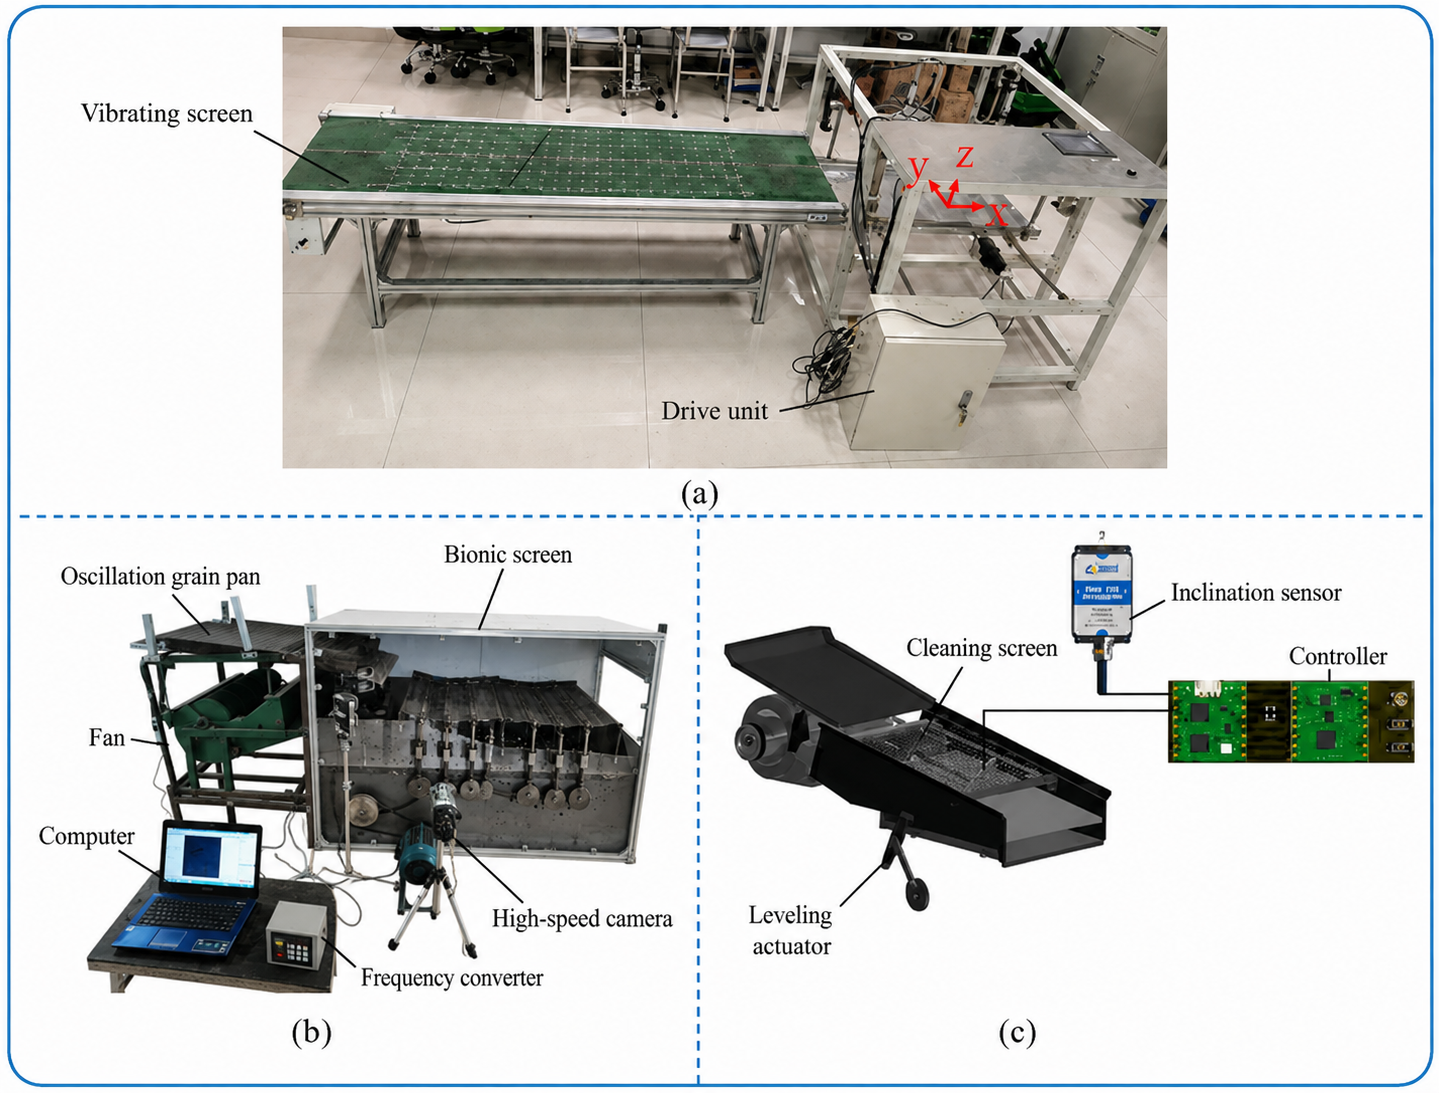
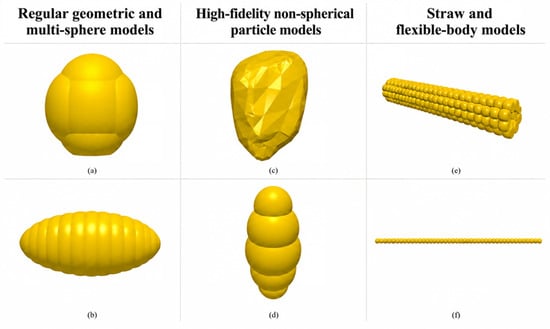
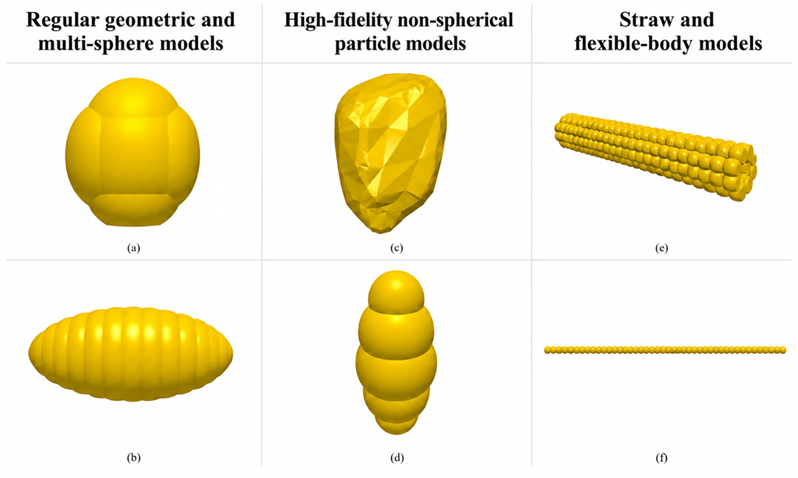
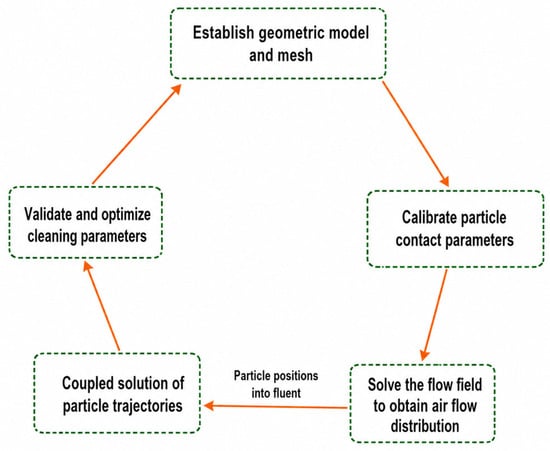
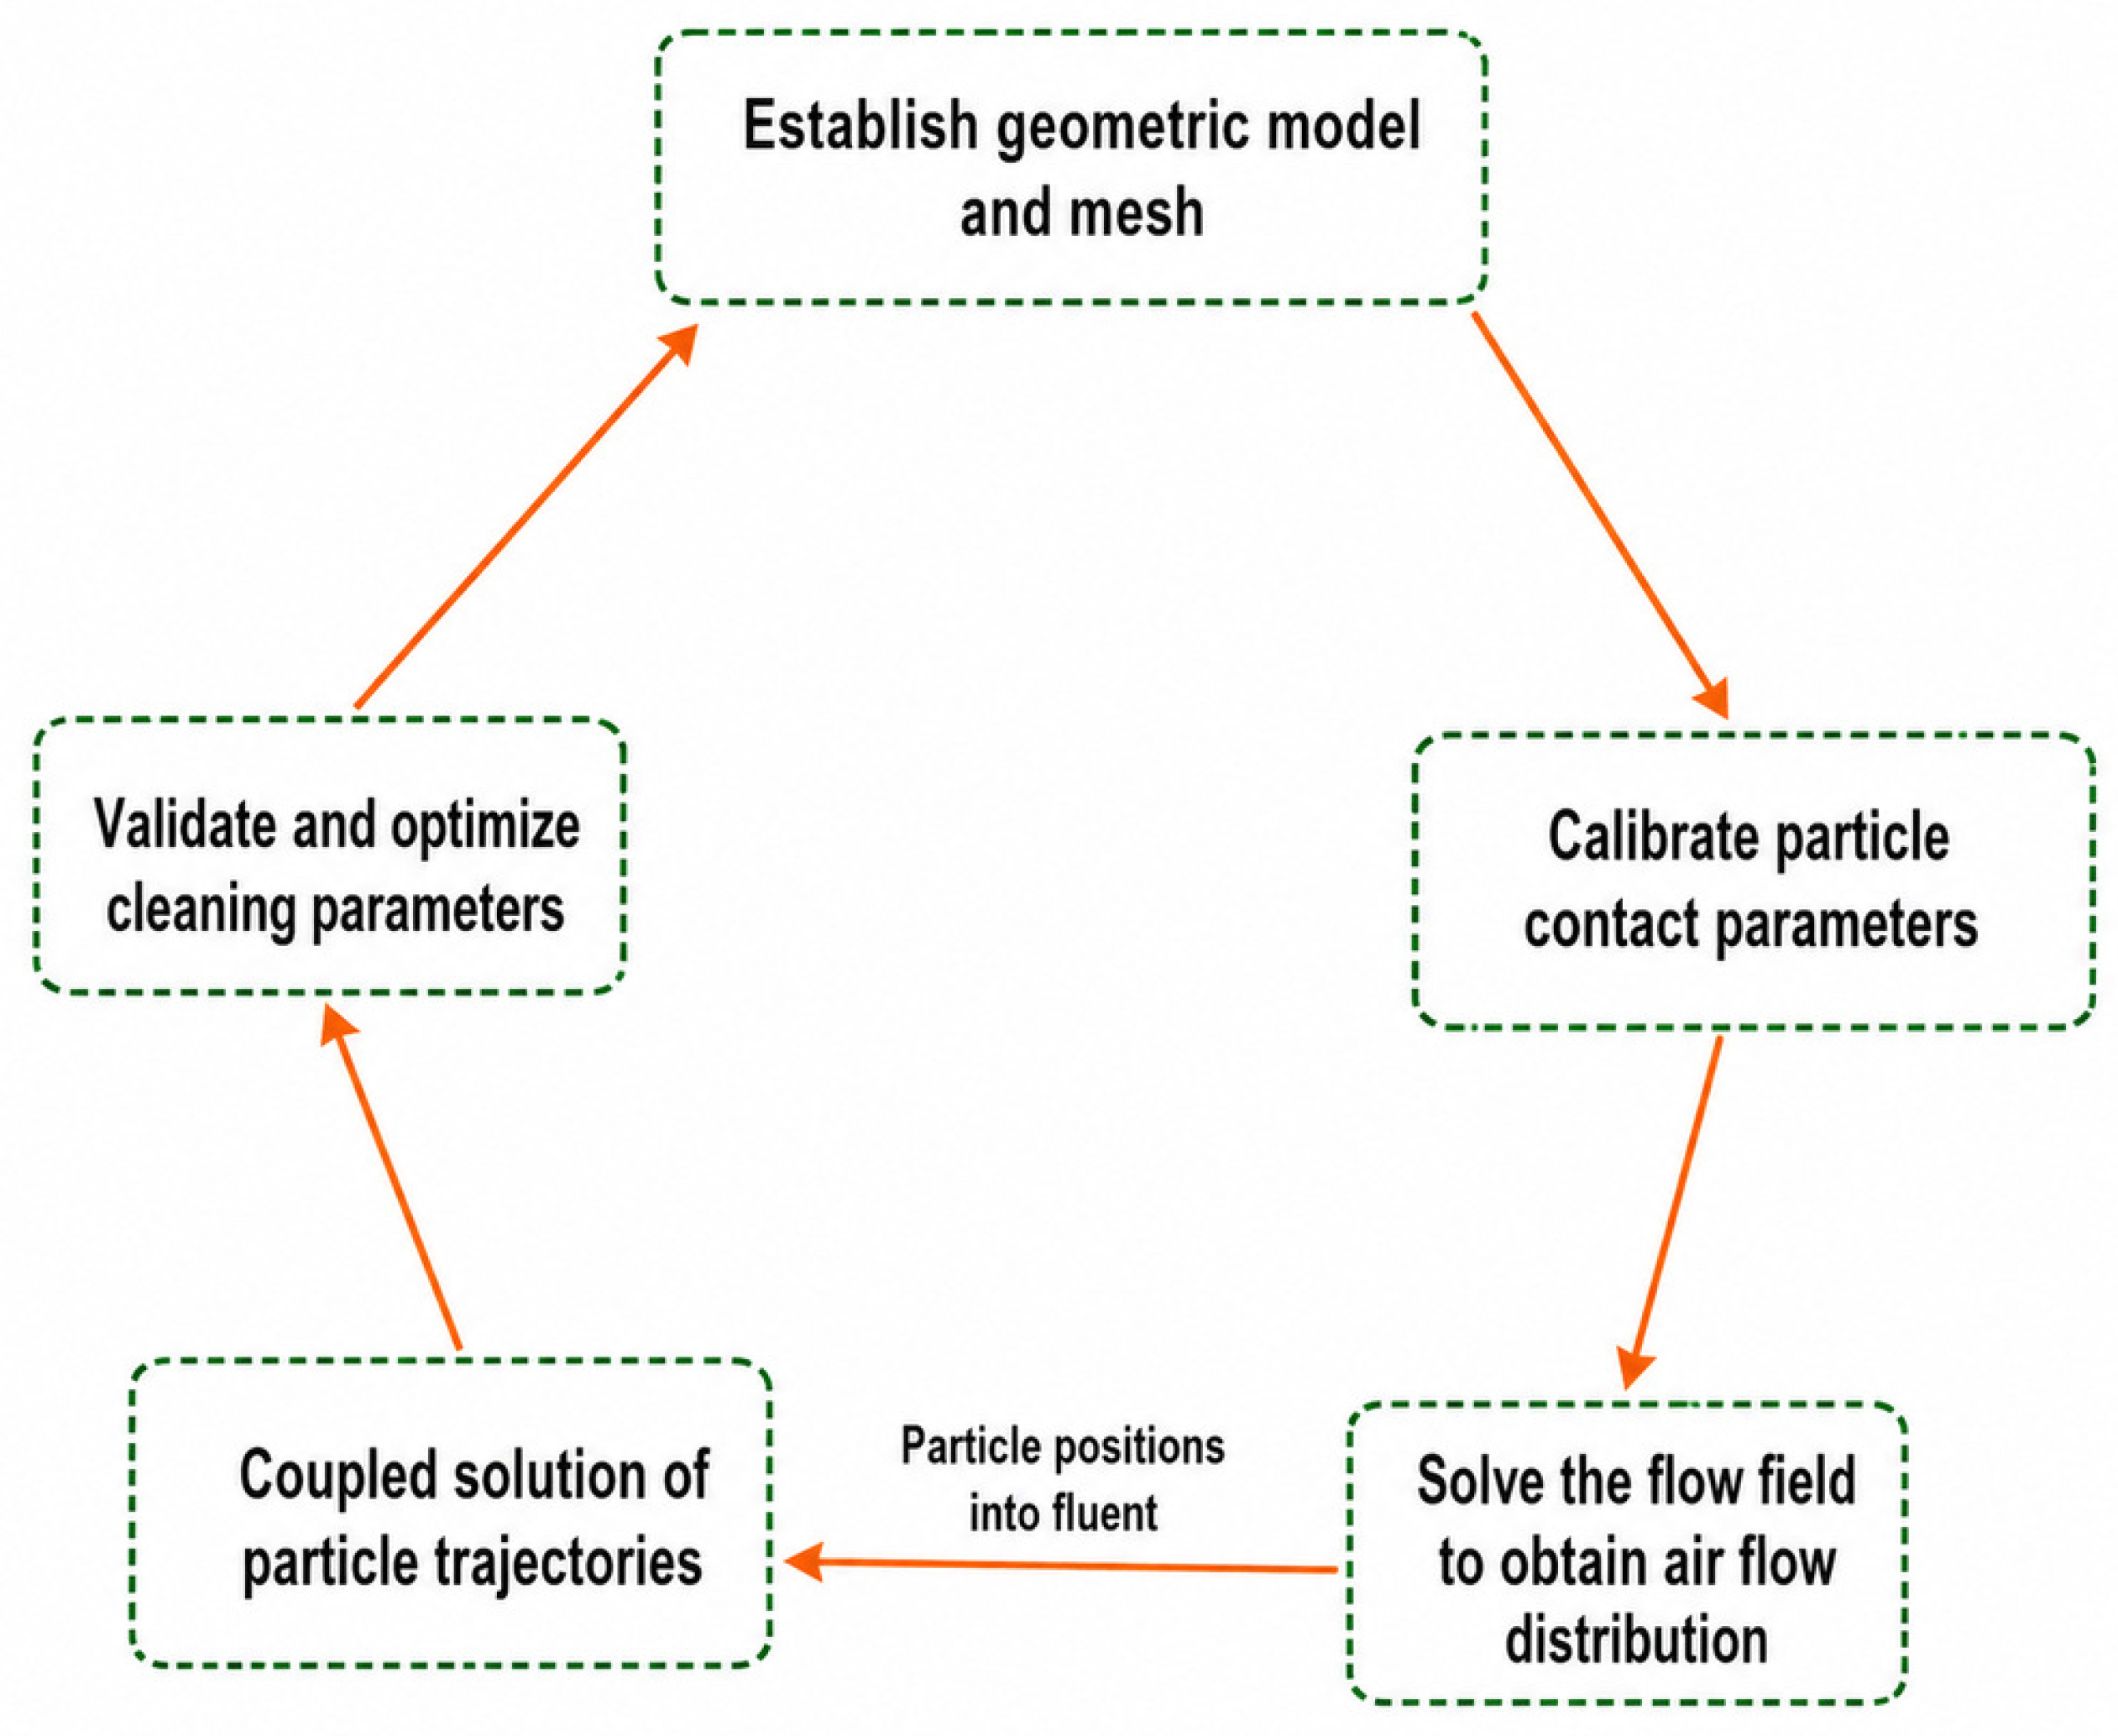
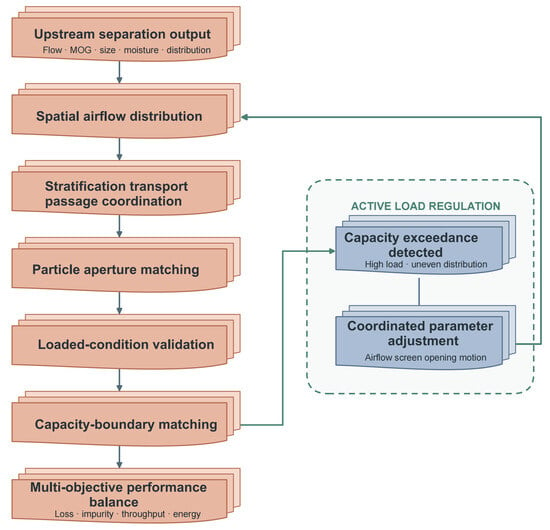
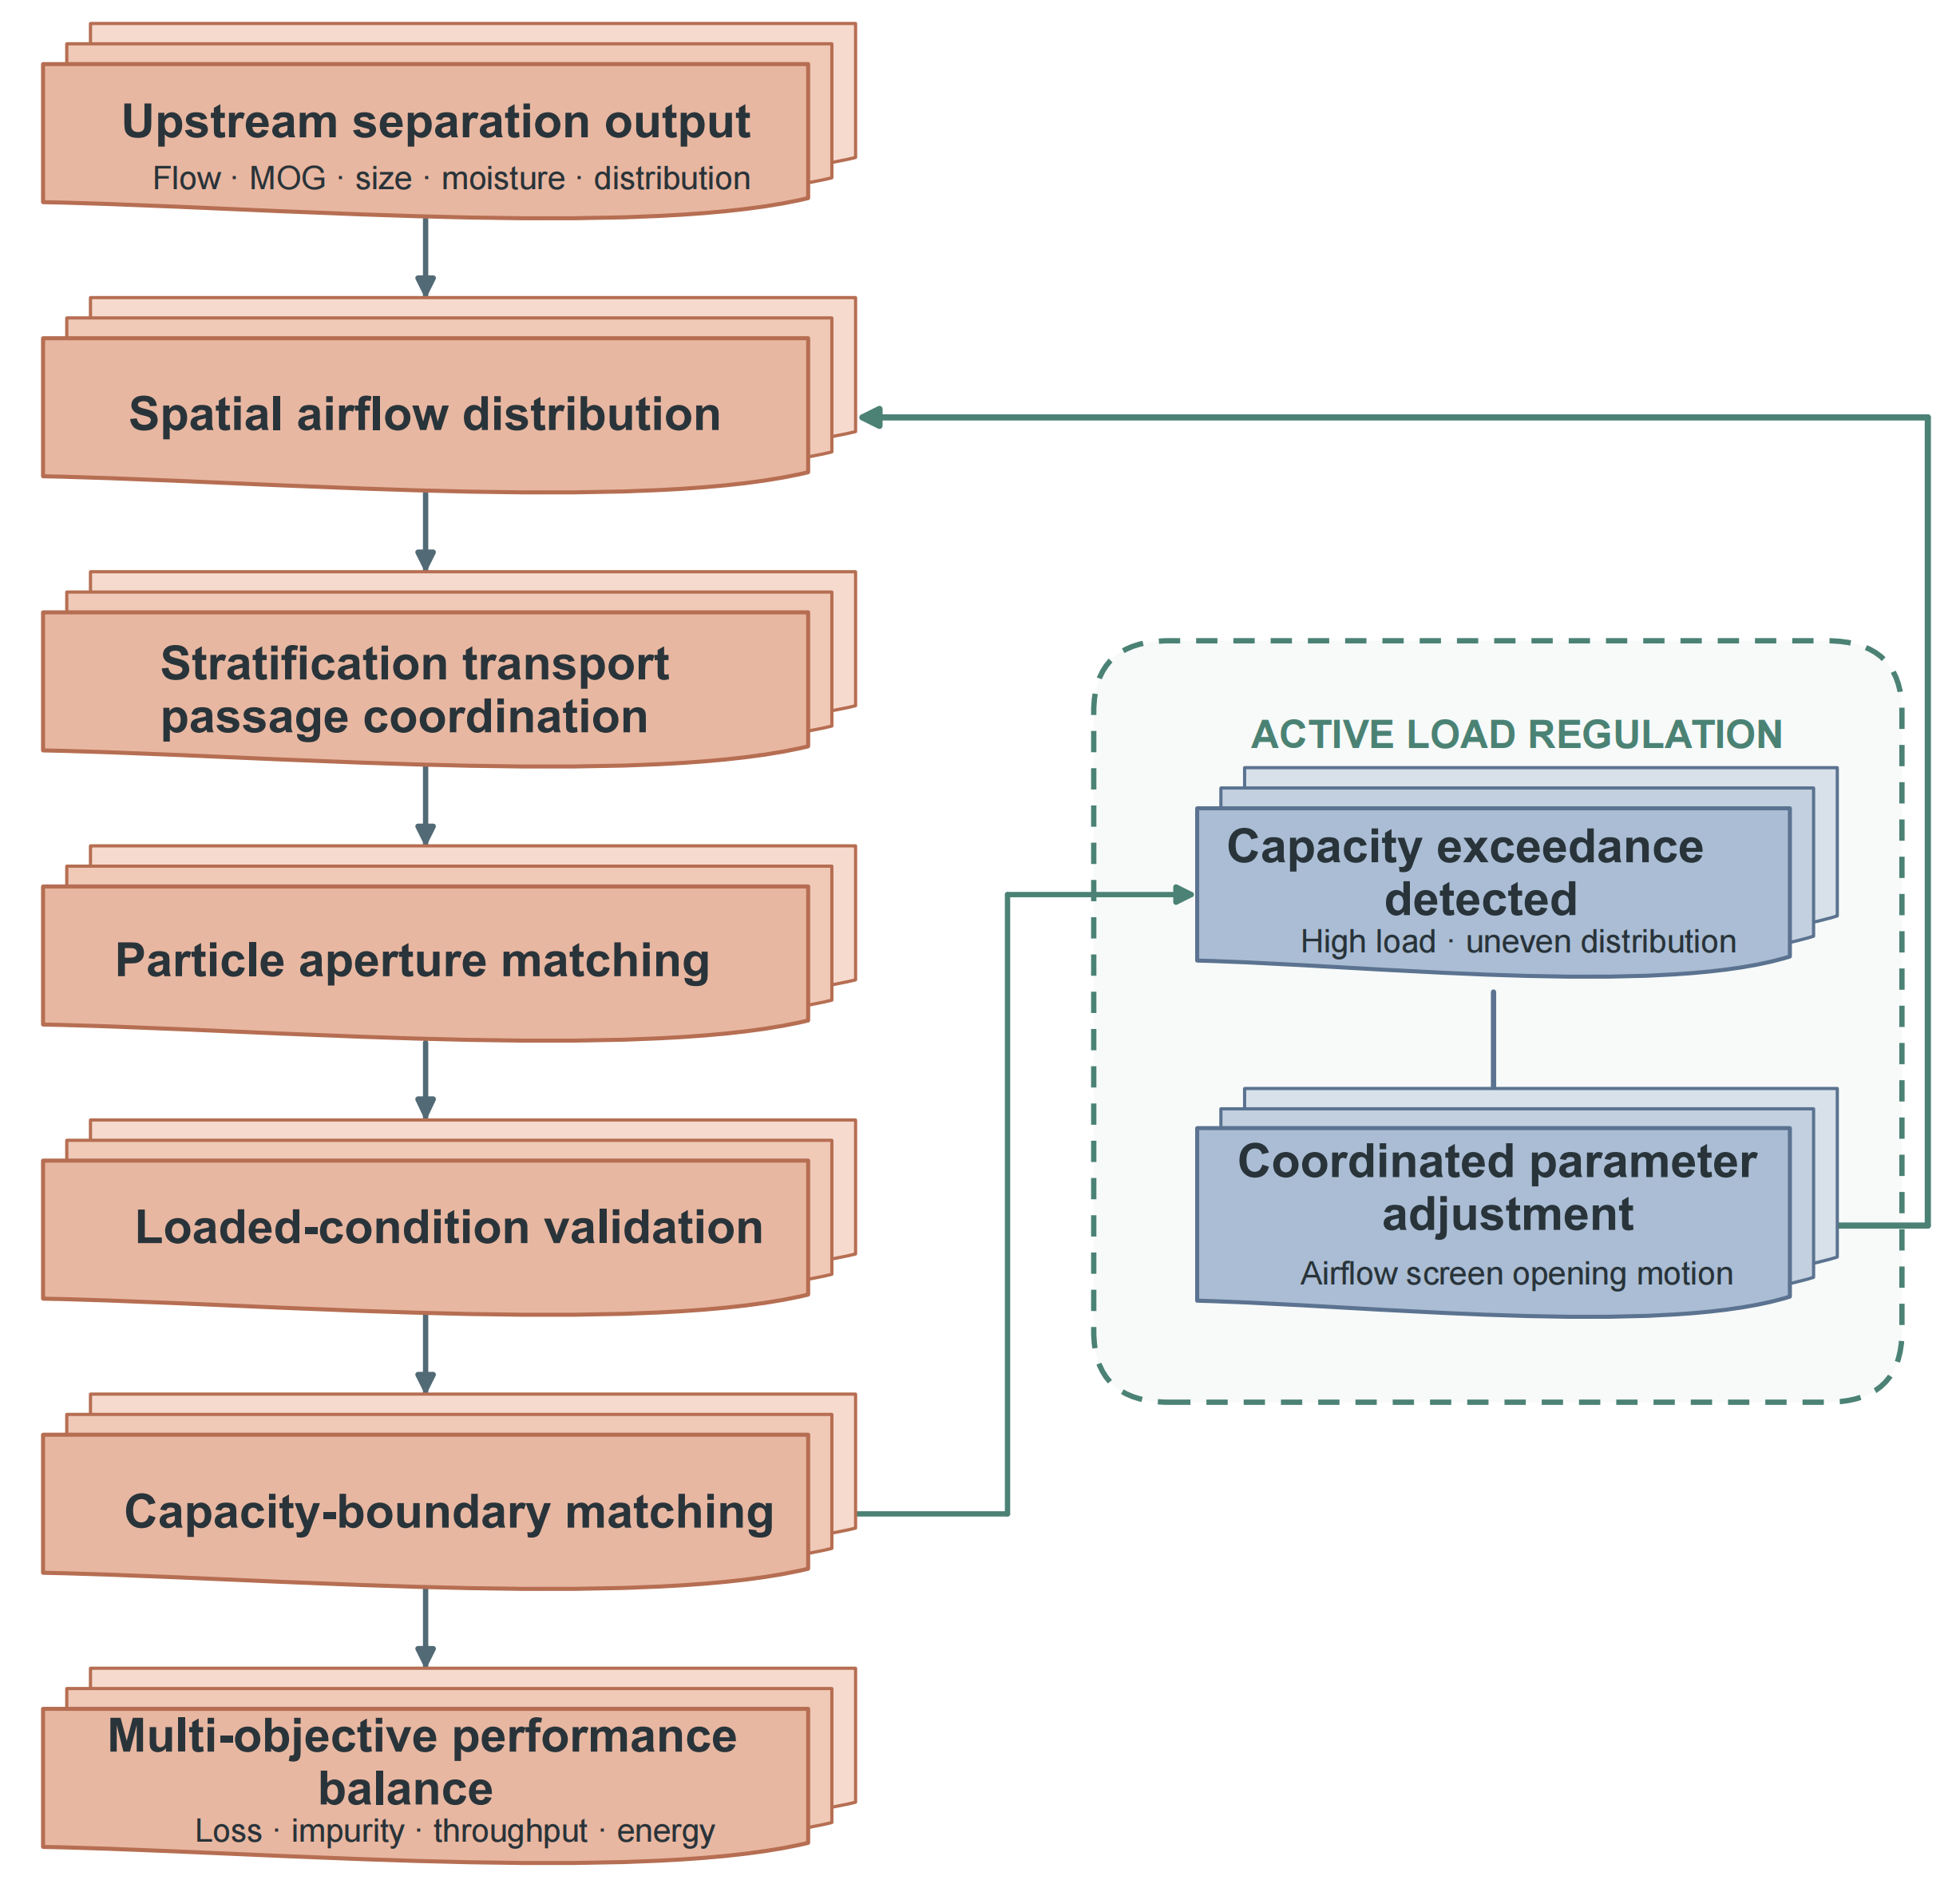
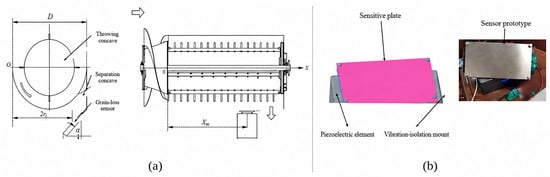
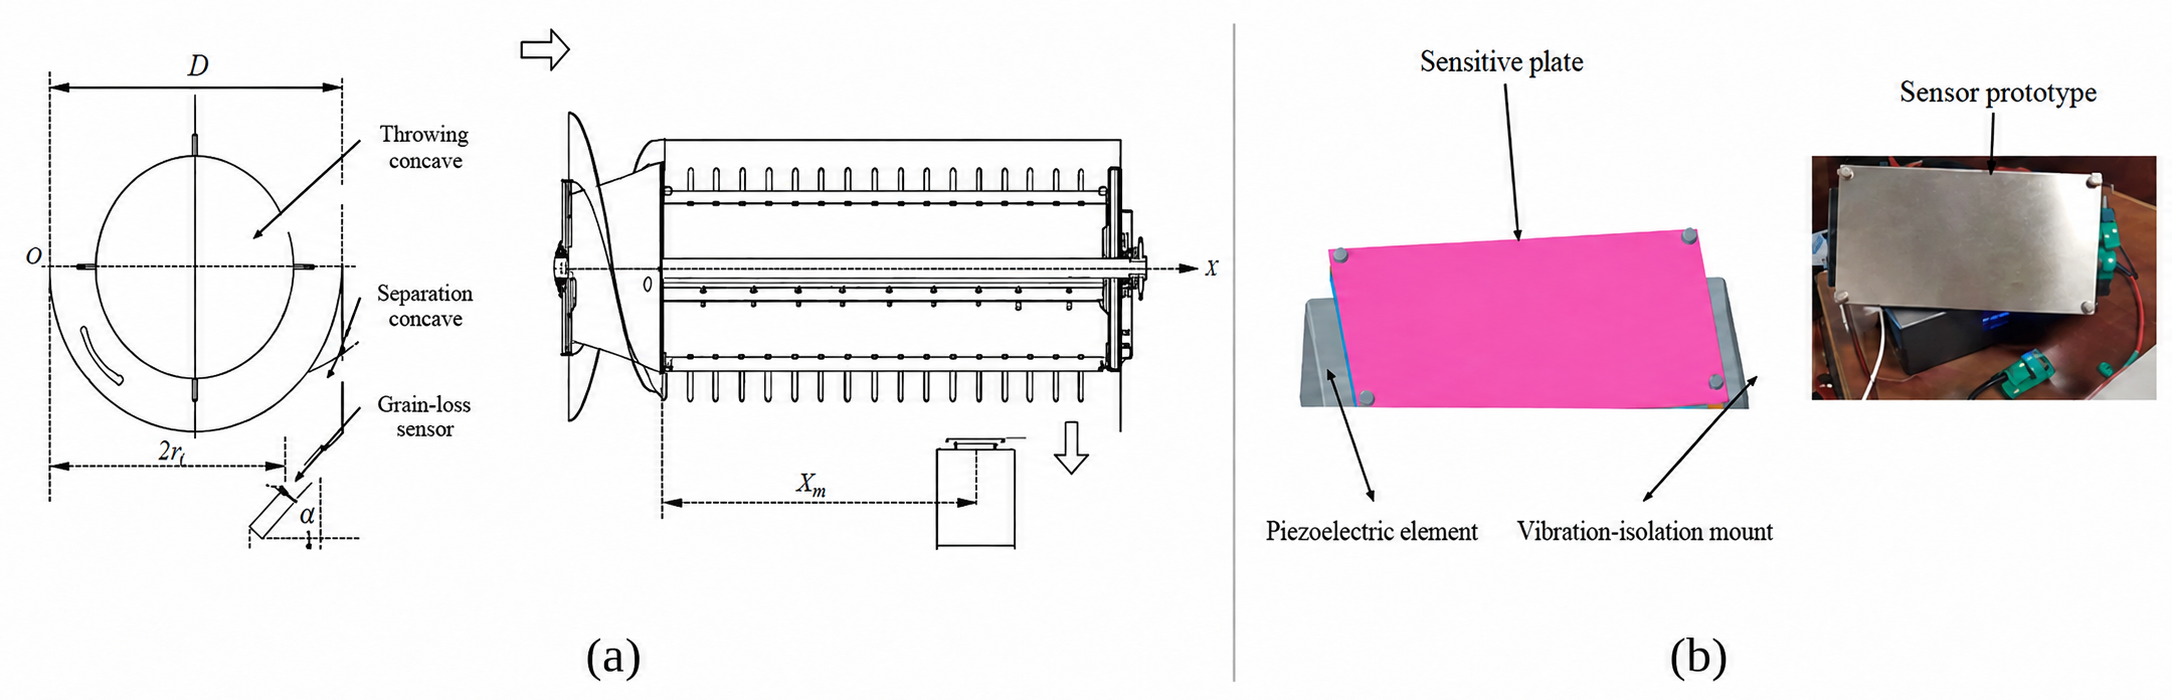
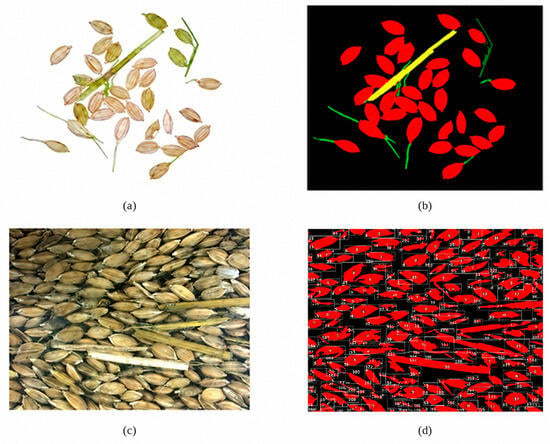
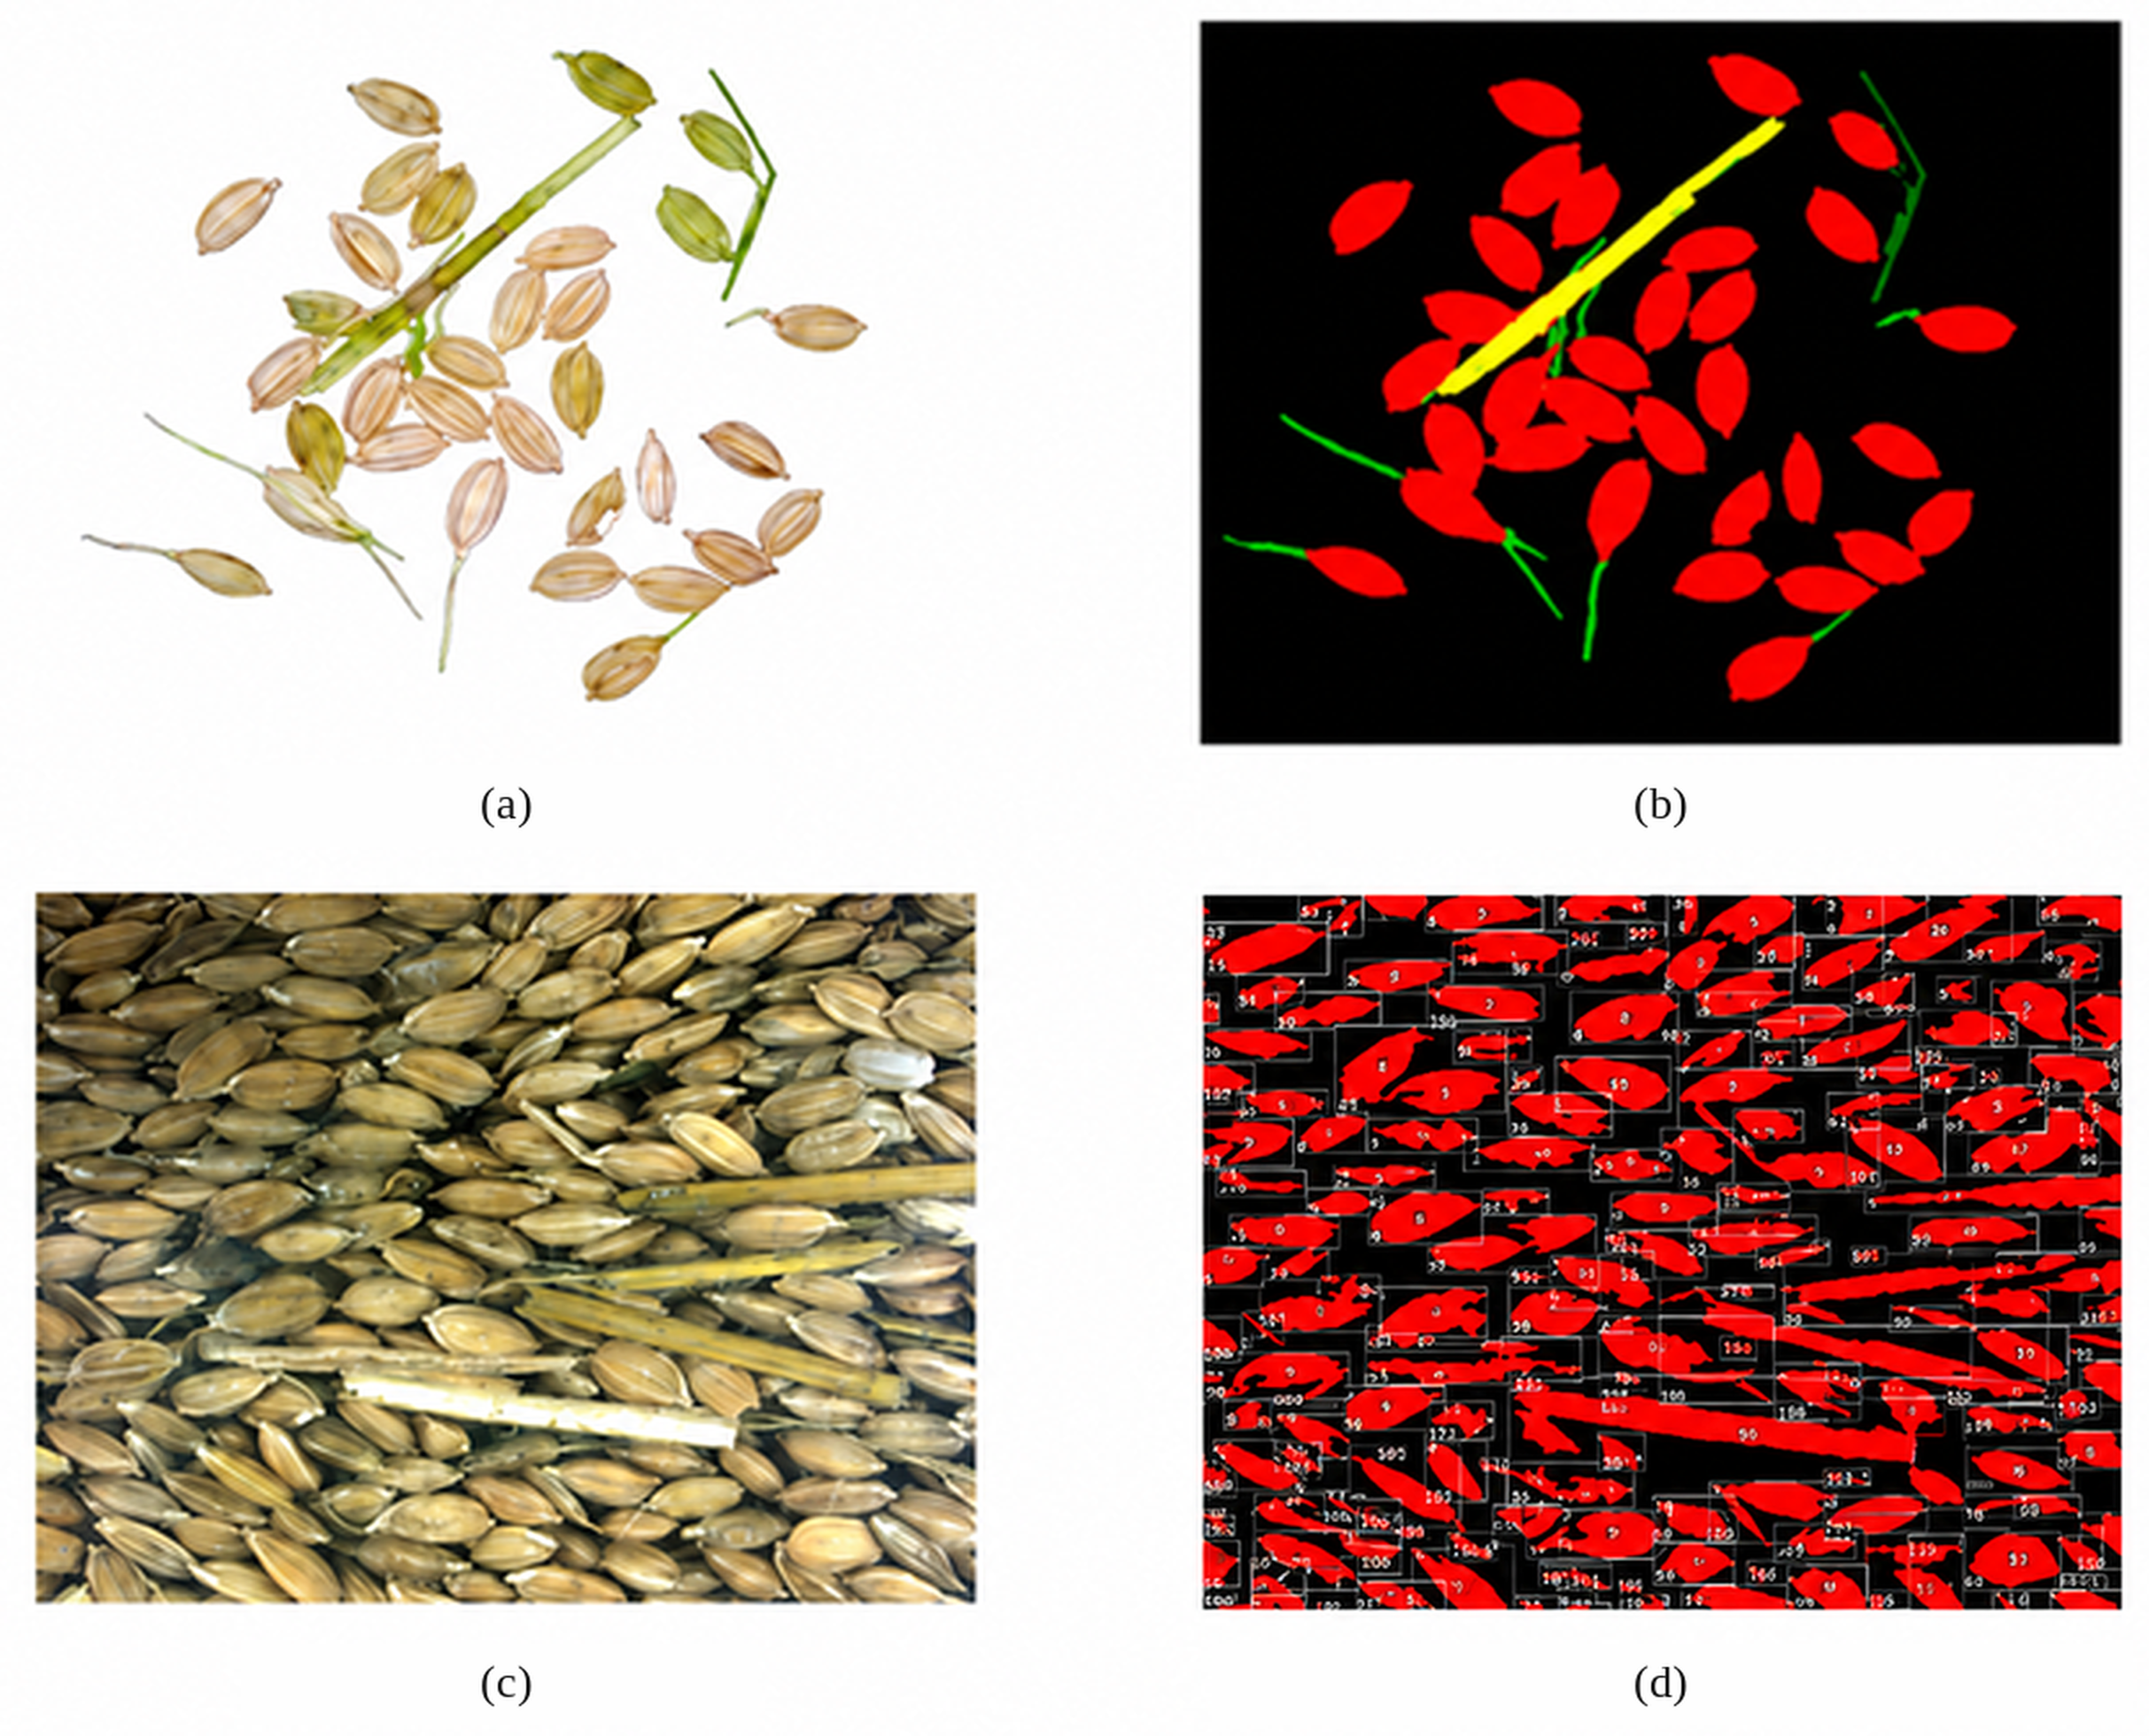
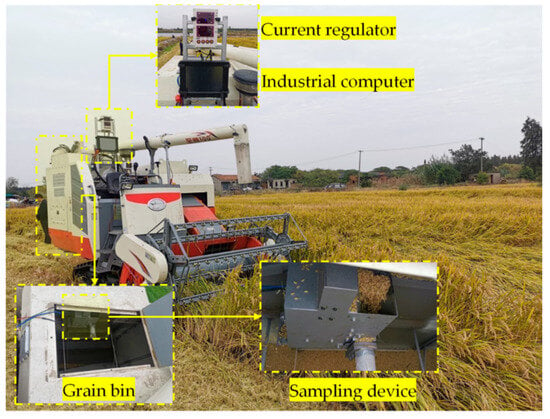
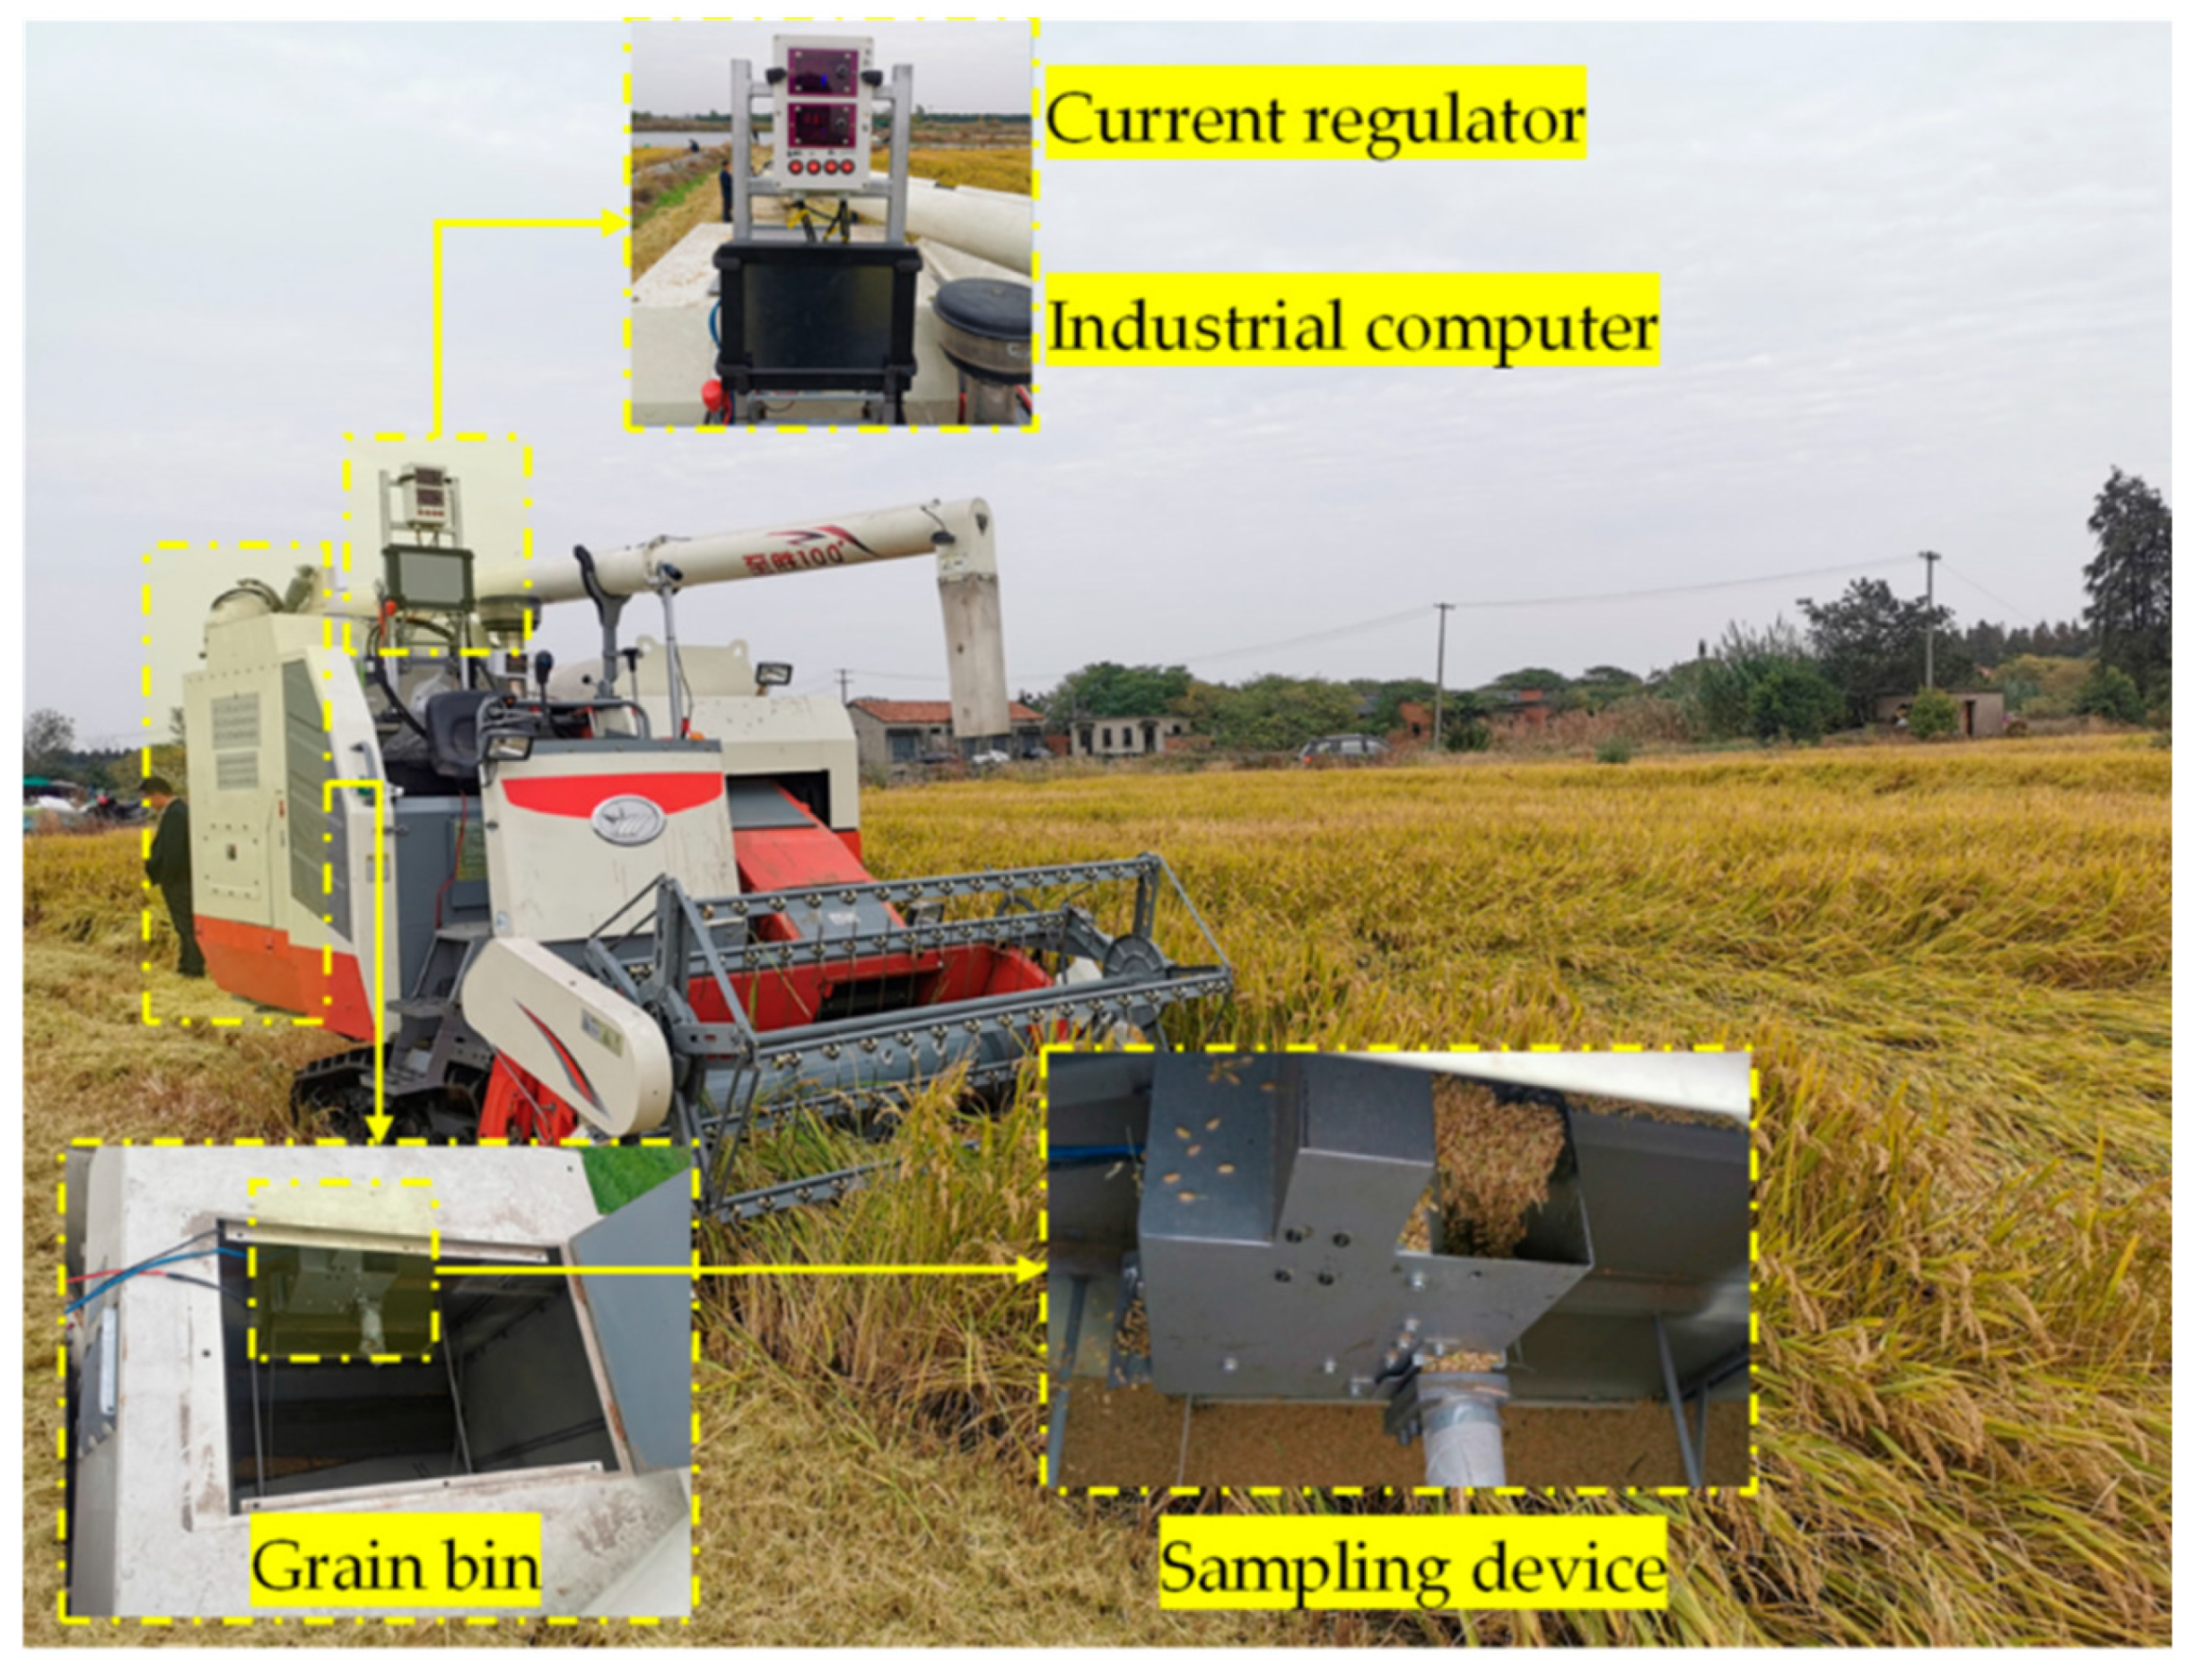
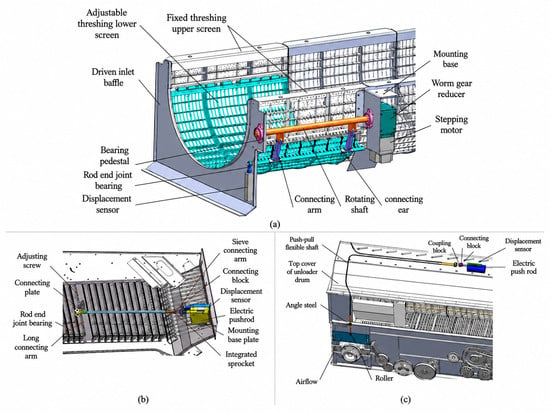
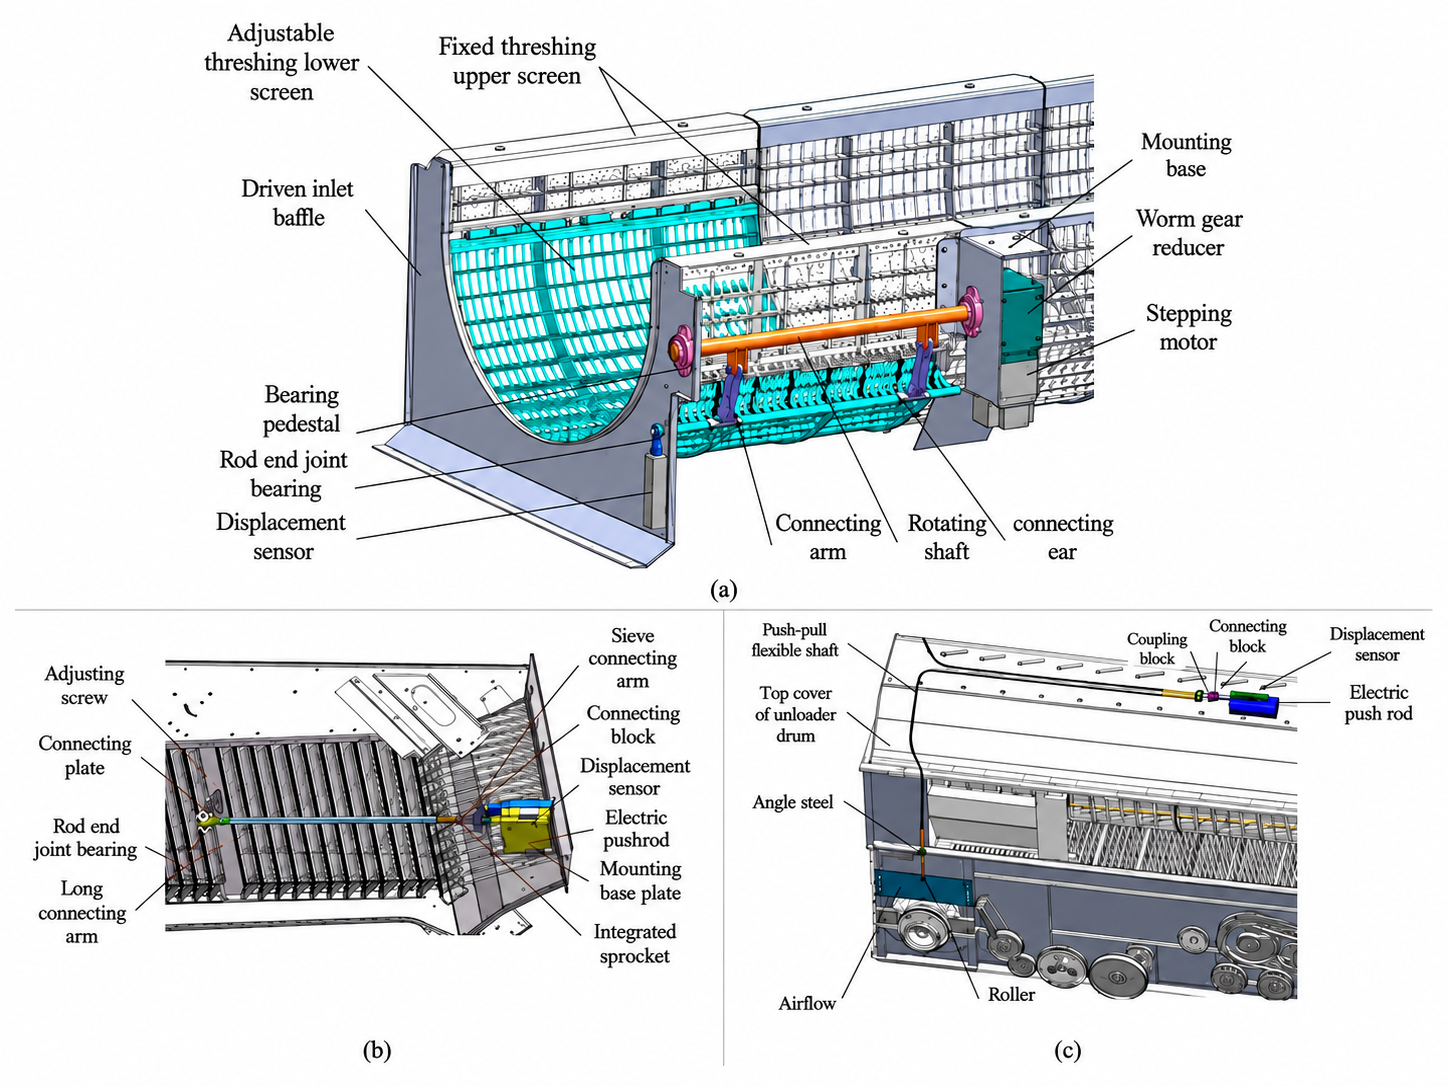

Disclaimer/Publisher’s Note: The statements, opinions and data contained in all publications are solely those of the individual author(s) and contributor(s) and not of MDPI and/or the editor(s). MDPI and/or the editor(s) disclaim responsibility for any injury to people or property resulting from any ideas, methods, instructions or products referred to in the content. |
© 2026 by the authors. Licensee MDPI, Basel, Switzerland. This article is an open access article distributed under the terms and conditions of the Creative Commons Attribution (CC BY) license.