


Abstract
Existing selective sweet pepper harvesting systems use industrial arms and high-performance computers, which limits adoption on small farms and replication by researchers. We developed a low-cost, open-source modular harvesting robot based on Raspberry Pi 5 and a 3D-printed manipulator. The system has three modules. First, an improved YOLOv13n detector combines GhostConv, ReLU6, and DIoU Loss. It reaches 96.9% mAP@0.5 for fruits and 95.1% for peduncles with 2.35 M parameters. Compared with the YOLOv13n baseline, parameters and GFLOPs drop by 4.1% and 3.2%, while overall mAP@0.5 falls by 1.8 percentage points. Second, an adaptive size measurement and multi-criteria decision strategy uses the correlation between median depth and tilt angle (R2 = 0.824), giving a mean absolute error of 5.0 mm and a 95.4% effective hit rate. Third, a ROS 2-based full-stack platform enables closed-loop perception–decision–execution. Laboratory tests give a selected-target harvesting success rate of 95.4% (103/108) and an overall success rate of 85.8% (103/120), with 1.9% fruit damage. Motion planning and execution consume 83% of cycle time. All hardware designs, ROS 2 packages, and model weights are released.
1. Introduction
Sweet pepper (Capsicum annuum L.) is a high-value vegetable crop cultivated worldwide [1,2]. Its continuous flowering and fruiting habit, coupled with concentrated maturation, requires multiple rounds of selective harvesting within a limited time window [3,4]. This process remains heavily reliant on skilled manual labor. Amid escalating global agricultural labor shortages and an aging population [5], labor costs as a proportion of total sweet pepper production costs continue to rise [6]. The development of automated selective harvesting robots has thus become an urgent priority for the sustainable development of the sweet pepper industry [7,8,9].
Substantial research has been dedicated to the key technologies underpinning automated harvesting. At the visual perception level, deep learning methods, particularly the YOLO family of detection models, have been widely deployed for fruit recognition, with detection accuracy steadily improved through the introduction of attention mechanisms and multi-scale feature fusion strategies [10,11,12,13]. At the harvesting decision level, maturity estimation methods based on fruit color, shape, and size, as well as harvesting strategies incorporating spatial reachability analysis, have been successively proposed [14,15,16]. At the system integration level, the modular design philosophy based on the Robot Operating System (ROS) has been preliminarily applied to agricultural robots, enabling coordinated control between mobile platforms and robotic arms [17,18,19]. However, the vast majority of these studies remain at the stage of algorithmic simulation or component-level verification. Visual models are evaluated solely on standard datasets, decision-making algorithms rely on idealized assumptions, and system integration schemes are mostly proof-of-concept demonstrations based on commercial hardware, without completing a full-chain, closed-loop test under realistic physical constraints [20].
A particularly significant practical barrier is that existing highly integrated harvesting systems predominantly employ industrial-grade robotic arms and high-performance industrial computers [21,22]. The hardware costs of such systems often range from tens of thousands to hundreds of thousands of RMB, creating a dual constraint: they are unaffordable for small and medium-sized growers, directly hindering the technology’s transfer from the laboratory to the field [23], and they are prohibitively expensive for most agricultural robotics research groups to replicate, preventing them from conducting algorithm iteration and performance comparison on such platforms [24]. High hardware cost has thus become a key obstacle in moving harvesting robots from laboratory research to practical application.
In recent years, the rapid development of lightweight deep learning models and embedded computing platforms has opened new technological possibilities for overcoming this cost barrier. Lightweight detection models, represented by YOLOv5 and YOLOv8, have been proven capable of real-time inference on edge devices like the Raspberry Pi, significantly reducing computational resource requirements while maintaining high detection accuracy [25,26,27]. In terms of low-cost hardware platforms, the open-source AgriCruiser robot demonstrated the feasibility of autonomous in-field navigation on a budget of approximately 400 USD, but its functionality is focused on navigation and weed management, not selective harvesting [28]. Although platforms like AgriCruiser demonstrate low-cost navigation, they lack the mechanical manipulation and fine-grained perception required for selective harvesting. The present work goes beyond navigation by implementing a complete closed-loop system—from fruit–peduncle detection and size-based maturity assessment to robotic arm execution—under a similar low-cost hardware budget. Dal et al. (2025) developed a low-cost ground robot for real-time ArUco marker localization based on a Raspberry Pi 4, validating the effectiveness of lightweight YOLO models for real-time visual localization on edge devices; however, its mechanical structure and software architecture were not designed for harvesting tasks [29]. Harvesting requires a system not only to perceive the environment, but also to manipulate a multi-degree-of-freedom robotic arm and end-effector to precisely grasp and detach flexibly growing fruits, which is significantly more complex and technically demanding than navigation and localization tasks.
Deploying lightweight models and low-cost hardware into a complete and stably operating harvesting system requires overcoming three tightly coupled technical difficulties. First, the computational power and memory of a Raspberry Pi are far inferior to those of a desktop-grade GPU. The model must maintain high-precision detection of both fruits and small peduncles under an extremely high compression ratio, posing a severe challenge to network architecture design and training strategies [30]. Second, sweet pepper fruits grow in various postures on the plant, and their two-dimensional projection size in the camera view changes significantly with the tilt angle. The error of a single diameter measurement strategy varies substantially under different orientations, directly affecting the reliability of maturity assessment and thus limiting the accuracy of selective harvesting. Third, an extremely low hardware budget imposes strict structural and co-control requirements on the design, fabrication, and system integration of the robotic arm, mobile chassis, and end-effector. How to maintain functional integrity while controlling the total cost to within a few hundred dollars, and how to achieve efficient software–hardware synergy among subsystems under the triple constraints of computation, precision, and cost, are engineering problems that need to be systematically addressed. Existing works mostly tackle only one of these problems in isolation, for example, optimizing a detection model or designing a mechanical structure alone. As noted in recent comprehensive reviews [31], very few have conducted a complete, synergistic validation on a real, low-cost physical platform that integrates perception, decision-making, and execution under genuine hardware constraints.
Despite these advances, a critical research gap remains. Existing high-performance harvesting systems (e.g., Arad et al., Lenz et al.) rely on expensive industrial hardware, making them inaccessible for replication. Conversely, existing low-cost platforms (e.g., AgriCruiser) primarily focus on navigation and lack the mechanical manipulation and fine-grained perception required for selective harvesting. There is a lack of validated, low-cost robotic platforms that integrate lightweight edge-computing perception, adaptive size assessment, and mechanical manipulation into a complete selective-harvesting closed loop. To address this specific gap and the aforementioned technical obstacles, this paper proposes and validates a low-cost, modular sweet pepper harvesting robot system based on a Raspberry Pi 5 and a 3D-printed robotic arm. The objective of this work is to achieve a high-success-rate, low-damage selective harvesting closed-loop within an extremely low hardware budget through the co-design of algorithms and hardware, and to release the complete design and code to lower the hardware threshold for harvesting robotics research. The total hardware cost of the developed system is approximately 700 USD. To fill this gap, the main contributions of this paper are threefold.
First, a lightweight detection model is developed for extremely low computational power. To meet the constraints of the Raspberry Pi 5, three synergistic improvements are made to YOLOv13n: GhostConv modules are introduced into the backbone network to reduce the computational burden, ReLU6 activation functions are adopted to enhance hardware compatibility and quantization readiness, and DIoU Loss is applied to strengthen the localization accuracy for the small-target peduncles. The final model achieves detection accuracies (mAP@0.5) of 96.9% for fruit and 95.1% for peduncles with only 2.35 M parameters. Compared with the YOLOv13n baseline (97.8% overall mAP@0.5, 2.45 M parameters, 6.2 GFLOPs), the final model reduces the parameter count by 4.1% and GFLOPs by 3.2%, with a 1.8 percentage-point decrease in overall mAP@0.5. As will be shown in Section 3.2.2, this represents an intentional accuracy–efficiency trade-off, yielding a 1.5% improvement in computational efficiency (mAP/GFLOPs) and more stable operation on the resource-constrained edge platform.
Second, an adaptive size measurement and multi-criteria decision-making method is designed for selective harvesting. To address the significant measurement errors caused by the variable postures of sweet pepper fruits, experiments reveal a strong statistical correlation between median depth and tilt angle (R2 = 0.824). Based on this, an adaptive method is proposed that dynamically selects the optimal measurement strategy according to fruit posture, achieving a mean absolute error of 5.0 mm—a 9.1% improvement over the best single strategy. On this basis, a multi-criteria decision model integrating fruit size, spatial reachability, and the spatial relationship between fruit and peduncle is constructed, achieving a 95.4% effective hit rate.
Third, a full-stack, self-developed hardware suite is integrated with ROS 2 for coordinated control. Under the hardware constraints of a Raspberry Pi 5 and a 3D-printed lightweight robotic arm, a mobile chassis, a lightweight arm, and a custom end-effector are designed and fabricated in-house. All subsystems are coordinated through the ROS 2 Jazzy framework (running on Ubuntu 24.04) to achieve software–hardware synergy and complete a closed-loop perception–decision–execution autonomous operation. End-to-end evaluations under controlled laboratory conditions achieve a selected-target harvesting success rate of 95.4% (103/108) and an overall success rate of 85.8% (103/120), with a 1.9% fruit damage rate. Motion planning and physical execution together account for 83% of the total cycle time and are identified as the key optimization bottleneck. The remainder of this paper is organized as follows. Section 2 details the system design and methods, covering the hardware architecture, visual perception model, and decision-making framework. Section 3 reports the experimental results and discussion for each module and the integrated system. Section 4 concludes the paper and outlines directions for future research.
2. Materials and Methods
2.1. Design and Implementation of the Integrated Robotic System
To achieve low-cost, full-chain autonomous harvesting, this study implements an integrated robotic architecture founded on a perception–decision–execution closed loop (Figure 1). The system adopts ROS 2 Jazzy as a unified software framework, within which we construct a loosely coupled, modular software architecture. On the hardware side, we have developed in-house a complete physical platform that integrates a mobile base, a six-degree-of-freedom robotic arm, a customized end-effector, and the requisite sensing units. As illustrated in Figure 2 and detailed in Table 1, all hardware modules communicate with the host computer (Raspberry Pi 5, 8 GB RAM) via standard communication protocols (e.g., I2C, UART) and are managed through ROS 2 nodes for coordinated communication and control. This design effectively abstracts underlying hardware heterogeneities, enabling algorithmic modules responsible for perception, decision-making, planning, and control to operate both synergistically and efficiently. Consequently, it provides a robust foundation for subsequent system-level performance validation. All hardware integration and closed-loop harvesting experiments were conducted in 2025.
Figure 1.
Hardware and software architecture of the sweet pepper selective harvesting robot.
Figure 2.
The proposed sweet pepper selective harvesting robot.
Table 1.
Hardware and software configuration of the sweet pepper selective harvesting robot.
2.1.1. Planning and Execution System
The six-degree-of-freedom robotic arm is modeled using the standard Denavit–Hartenberg (DH) convention. The forward kinematics are computed through sequential homogeneous transformations:
where Ai(qi) is the DH transformation matrix of the i-th joint, parameterized by its joint angle qi. The inverse kinematics are solved numerically within the MoveIt! 2 framework, which automatically constructs the kinematic chain from the URDF description and invokes the KDL (Kinematics and Dynamics Library) http://www.orocos.org/kdl (accessed on 3 November 2026) solver for real-time computation. A singularity-avoidance strategy is implemented by slightly perturbing the target pose when the wrist is near a singular configuration, ensuring continuous and stable trajectory generation.
The mobile platform adopts a differential drive configuration to enable agile in situ steering. Its two-layer frame design achieves spatial separation and integration of the robotic arm and perception system from the control and power systems, thereby promoting favorable weight distribution and overall system stability. The drive train consists of two rear driven wheels actuated by stepper motors and two front passive universal wheels. Control is organized in a hierarchical ROS 2 architecture, with a Raspberry Pi 5 serving as the host computer for perception, decision-making, and task scheduling, while an STM32 microcontroller performs low-level real-time servo control of the motors and actuators. This architecture cleanly decouples high-level algorithmic logic from low-level hardware drivers, thereby enhancing both system reliability and extensibility.
To strike an optimal balance among lightweight construction, structural stiffness, and cost, the robotic arm structure is fabricated via 3D printing using PETG carbon-fibre composite material. A hybrid actuation scheme is adopted: joints that require high torque and positional stability, including base rotation and main arm elevation, are driven by geared motors, whereas the remaining joints are actuated by high-torque servomotors (5.9 N·m) to meet the need for rapid response. This design effectively manages system complexity and cost while maintaining full operational capability within a safe working radius of 0.8 m. Because 3D-printed structures inevitably introduce joint backlash, we implemented software compensation in the STM32 low-level controller using a closed-loop PID strategy, alongside a pre-pick pose strategy in MoveIt! 2 to minimize the accumulation of tracking errors at the end-effector.
As the terminal directly interacting with the crop, the end-effector critically determines harvesting success and fruit quality. In consideration of the distinct physical attributes of sweet pepper, specifically the high toughness of the peduncle and the susceptibility of the fruit to mechanical damage, this study develops a low-damage, dual-finger gripping end-effector (Figure 3). The device employs a single-servo gear transmission to drive a pair of 80 mm gripping fingers featuring staggered anti-slip tooth profiles. Blades embedded on the inner surfaces of the fingers provide micro-pressure and an anti-retraction function during grasping. This configuration ensures secure clamping of the peduncle while increasing contact area and dispersing contact pressure, thereby enabling low-damage fruit manipulation.
Figure 3.
Customized two-finger gripping end-effector.
The end-effector is actuated by a 60 kg·cm high-torque servo motor (stall torque: 60 kg·cm ≈ 5.88 N·m), which drives a pair of 80 mm gripping fingers through a gear transmission. Based on the servo torque and the finger lever arm, the theoretical calculation of the maximum gripping force at the fingertip is approximately 73.5 N (5.88 N·m/0.08 m). In contrast, the empirical push–pull gauge measurement gave a force of 68.5 ± 4.2 N (n = 10 repetitions), which is consistent with the theoretical value.
The applicable peduncle diameter range is 3–8 mm, based on measurements from 150 samples (mean = 5.2 mm, standard deviation = 1.1 mm). Previous biomechanical studies on sweet peppers have established a safe grasping force threshold range of 0.72 N to 33.56 N [32], and dedicated cutting tests on sweet pepper peduncles have been conducted to inform end-effector design [33]. The end-effector’s measured gripping force (≈68.5 N) exceeds the maximum reported safe grasping threshold by a factor of approximately 2× and provides substantial margin for peduncle cutting. The high gripping force primarily acts on the peduncle, not the fruit body. The blades embedded in the fingers perform a shearing action on the tough peduncle, which bears the main load. The fingers provide stabilizing clamping rather than compressing the fruit, explaining why the high force does not translate into high fruit damage. This large safety margin is empirically validated by the system’s harvesting success rate of 95.4% (103 out of 108 attempts) and a fruit damage rate of only 1.9%, as reported in Section 3.4.2.
In grip-and-recovery validation experiments conducted under controlled laboratory conditions, the end-effector consistently and reliably grasped peduncles positioned at the centre of the detection bounding box, thereby providing critical execution assurance for the complete harvesting closed loop. The mechanical design further establishes a physical foundation for future investigation of more efficient peduncle separation mechanisms, such as shearing or tearing.
To achieve accurate spatial mapping between visual perception and robotic arm execution, this study conducts hand–eye calibration under the eye-in-hand configuration [34]. In this configuration, the camera is rigidly attached to the robot’s end-effector. The transformation from the camera to the robot base is not fixed; it varies with the robot’s joint configuration:
where is the forward kinematics transformation from the robot base to the end-effector, which depends on the joint angle vector q, and is the fixed transformation from the end-effector to the camera—the unknown to be solved through hand–eye calibration. The calibration follows the classic AX = XB formulation, where A represents the relative motion of the robot end-effector between two poses, B represents the corresponding relative motion of the calibration board in the camera views, and is the sought transformation.
The calibration procedure employs an AprilTag visual fiducial marker, which is selected for its high detection robustness and sub-pixel corner accuracy in complex environments. Specifically, a square AprilTag calibration board (ID 0) with a side length of 10 cm is fixed within the workspace. The robotic arm is commanded to move the camera through 15 distinct poses that collectively cover the primary workspace; at each pose, the image frame and the corresponding robotic arm end pose are recorded synchronously. The AprilTag corners are detected via visual algorithms, and the transformation from the calibration board to the camera, denoted as is computed. Based on the classical hand–eye calibration model AX = XB, the optimal transformation matrix is solved in batch using the collected pose pairs.
The calibration yields an average reprojection error of 0.85 pixels, corresponding to approximately 2.1 mm spatial error at the 0.8 m working distance, confirming high intrinsic consistency. The translational residual of the hand–eye calibration was 0.8 mm (mean) with a rotational residual of 0.5°. At the 0.8 m working distance, the rotational residual translates to a lateral positioning uncertainty of approximately 7.0 mm, computed as 0.8 m × tan(0.5°) ≈ 6.98 mm. Combined with the translational residual (0.8 mm), the total positioning uncertainty propagated from calibration is approximately 7.02 mm, obtained as . This is still substantially smaller than the end-effector’s grasping tolerance (approximately 15 mm gripping finger width), confirming that calibration error does not constitute a significant source of grasping failure.
The final transformation is published to the tf2 https://docs.ros.org/en/jazzy/Tutorials/Intermediate/Tf2/Tf2-Main.html (accessed on 3 November 2026) transform tree within ROS 2, thereby providing a unified and real-time spatial geometric foundation for the entire system.
Building upon this high-precision spatial mapping, we design and implement a hierarchical motion planning strategy based on a pre-pick pose. This strategy is intended to enhance the success rate of motion planning and overall operational efficiency during harvesting tasks, while also mitigating occlusion of the camera field of view caused by large-scale arm movements under the eye-in-hand configuration.
Within the MoveIt 2 framework, we configure the URDF model of the robotic arm, together with its joint limits and collision matrices. Motion planning is conducted using sampling-based optimal planning algorithms, specifically Batch Informed Trees (BIT*) from the Open Motion Planning Library (OMPL) https://ompl.kavrakilab.org (accessed on 3 November 2026), to explore the configuration space [35]. As an asymptotically optimal sampling-based planner, BIT* rests on a well-established theoretical foundation in robotics. Its practical utility has been further corroborated in recent engineering studies targeting unstructured agricultural environments, where it achieves a favorable balance between computational efficiency and solution quality on resource-constrained embedded platforms. The resulting collision-free, smooth joint trajectories are published over ROS 2 topics. A custom control node subscribes to these topics, parses the trajectory data, and converts it into discrete joint angle commands, which are then dispatched to the respective actuators. This sequence commands the robotic arm and end-effector to execute the sequential approach, grasp, and retract operation.
In summary, the proposed pre-pick pose strategy is not merely an engineering optimization tailored for the sweet pepper harvesting scenario; rather, it represents a systematic methodology for enhancing motion reliability in unstructured environments. By decoupling the actions of mobility, observation, and execution, this strategy improves the closed-loop stability spanning from perception to action through a structured workflow (Figure 4). It thus establishes a robust motion control foundation for subsequent deployment in complex field environments.
Figure 4.
Robotic arm pose at the pre-pick pose and decomposition of the harvesting motion.
2.1.2. Perception and Decision-Making System
The perception and decision-making system functions as the intelligent hub of the robot, transforming raw sensor data into executable task commands. It represents the critical enabling component for selective harvesting. This system ingests input from the front-end visual perception module and sequentially executes three core tasks within the ROS 2 framework: target detection and localization, fruit physical dimension measurement, and harvestability decision-making. The final output comprises a set of screened and viable three-dimensional picking point coordinates, which are subsequently transmitted to the planning and execution system to undertake the harvesting operation.
2.2. Sweet Pepper Fruit and Peduncle Detection
Visual perception acts as the visual foundation for selective harvesting and underpins the associated decision-making process. To address the environmental challenges faced by sweet pepper harvesting robots, including fruit clustering, foliage occlusion, variable illumination, and the small dimensions of the critical picking point (the peduncle), a dedicated image dataset was constructed. Based on this dataset, we propose and implement an improved lightweight detection model tailored for deployment on edge computing platforms. The model is specifically designed to concurrently meet the system requirements of high-precision recognition and real-time response.
2.2.1. Dataset Construction and Preprocessing
A high-quality, representative dataset is a prerequisite for training robust detection models. In this study, a total of 893 RGB images were acquired using an Intel RealSense D435 camera (Intel Corporation, Santa Clara, CA, USA). under diverse natural illumination conditions in a sweet pepper experimental field located in Jinzhong City, Shanxi Province, China, in 2025. Data collection spanned multiple plant growth stages, varying fruit densities, and representative occlusion scenarios to ensure both diversity and authenticity. All images were meticulously annotated with the LabelImg tool v1.8.6., defining two key object categories: “sweet pepper fruit” and “sweet pepper peduncle”. Precise bounding boxes were delineated for each target instance.
To improve the model’s generalization capability and robustness, a systematic data augmentation strategy was applied exclusively to the training set. The original 893 images were partitioned into training, validation, and test sets following an 8:1:1 ratio, yielding 714, 90, and 89 images, respectively. Crucially, each image in our dataset corresponds to a distinct, individual plant (893 images from 893 independent plants). Therefore, this image-level partition inherently serves as a strict plant-level grouped split. There is absolutely no physical overlap of plants across the training, validation, and test sets, completely preventing data leakage. Data augmentation, comprising random horizontal and vertical flipping, random rotation within ±15°, and color jittering with brightness, contrast, and saturation adjustment factors each constrained to ±20%, was then applied only to the 714 training images. As illustrated in Figure 5, this expanded the effective training samples to 1433 images. The validation and test sets remained strictly unmodified to ensure a complete separation between training and evaluation data [36].
Figure 5.
Representative examples of data augmentation results.
2.2.2. Improved YOLOv13n Model for Edge Deployment
Real-time object detection algorithms, particularly the YOLO series, are a core technology for visual perception in agricultural robotics. To achieve high-precision, real-time detection of sweet pepper fruits and peduncles on a resource-constrained embedded platform (Raspberry Pi 5), this study selects YOLOv13n as the baseline model. As one of the latest lightweight iterations in the YOLO family, YOLOv13n employs hypergraph modeling and an ultra-lightweight architecture to substantially reduce computational complexity while retaining excellent detection accuracy, making it well suited for edge deployment scenarios.
Nevertheless, deploying advanced detection models on field robots in complex and dynamic agricultural environments requires targeted optimization of the accuracy–efficiency trade-off to meet the demands of real-time operation, low power consumption, and high reliability. To this end, we introduce three synergistic improvements to YOLOv13n. The modified architecture is illustrated in Figure 6.
Figure 6.
Architecture of the improved detection model.
The original backbone network of YOLOv13n provides the fundamental feature extraction framework. To enable more efficient deployment on the Raspberry Pi 5, we replace a subset of the standard convolutional layers in the backbone with GhostConv modules. These modules generate a set of ghost feature maps through inexpensive linear operations, such as depthwise separable convolution, and then concatenate them with a small number of intrinsic feature maps produced by standard convolutions. This strategy yields equally rich feature representations with significantly fewer parameters and lower computational cost. It directly reduces the computational burden, a critical step toward achieving real-time inference on edge devices.
Concurrently, to improve the model’s compatibility with subsequent hardware deployment, particularly in preparation for potential fixed-point quantization (e.g., INT8 quantization), we uniformly replace the SiLU activation functions in the original model with ReLU6. The ReLU6 function is defined as f (x) = min(max(0, x), 6). This bounded output characteristic effectively constrains the dynamic range of activation values, substantially mitigating accuracy loss during quantization and thereby preserving inference performance on edge devices.
As a typical small object, the peduncle necessitates high precision in bounding box center localization to enable reliable robotic grasping. To mitigate the degradation in small-object regression accuracy that often accompanies model lightweighting, we replace the conventional bounding box regression loss with DIoU Loss, defined as Equation (1):
By explicitly minimizing the Euclidean distance between the center points of the predicted box and the ground truth box, DIoU delivers a more direct and effective improvement in localization precision for small objects such as peduncles.
The three architectural modifications are not arbitrary heuristic choices but are grounded in a coherent signal processing rationale that explains their individual effectiveness.
GhostConv exploits feature redundancy. In deep convolutional networks, feature maps often exhibit strong inter-channel correlations. By generating “ghost” feature maps through cheap linear transformations (e.g., depthwise separable convolution), GhostConv performs a low-rank approximation of the feature space—preserving the essential information manifold while reducing the dimensionality of the parameter space. This explains why GhostConv can reduce the parameter count without catastrophic accuracy degradation: it removes redundant components in the feature representation rather than simply pruning informative channels.
ReLU6 applies a soft-clipping operation. The bounded output range of ReLU6 is specifically motivated by quantization theory. During INT8 quantization, unbounded activation values require a wider dynamic range to represent, which spreads the available quantization bins sparsely and increases truncation error. By bounding the activation range to [0, 6], ReLU6 concentrates the representational power of the fixed-point format on the most informative value range, effectively acting as a pre-conditioner that reduces the quantization error before it occurs. This is why ReLU6-equipped models exhibit substantially less accuracy degradation post-quantization compared to those using unbounded activations like SiLU.
DIoU Loss provides geometric regularization on bounding box centers. Standard IoU loss only considers area overlap, which is insufficient for small, elongated targets like peduncles where center alignment is critical. The DIoU formulation LDIoU = 1 − IoU + ρ2/C2 explicitly penalizes the Euclidean distance ρ between predicted and ground-truth center points. This introduces a spatial prior into the loss landscape: the network is regularized to prioritize correct spatial localization over merely maximizing overlap. For peduncles, whose bounding boxes are small and have extreme aspect ratios, this center-point regularization is disproportionately beneficial compared to area-only overlap metrics.
In summary, the proposed enhancement follows a systematic design philosophy of “lightweight compression first, followed by targeted accuracy compensation.” GhostConv reduces computational complexity, ReLU6 improves hardware compatibility and quantization readiness, and DIoU specifically addresses regression accuracy for the critical small object (the peduncle). The synergy of these three components is deliberately orchestrated to strike an optimal balance between accuracy and inference speed on edge devices. The model is initialized with COCO pre-trained weights and fine-tuned end-to-end on our self-constructed sweet pepper dataset using the SGD optimizer. Specifically, the model was trained for 200 epochs with a batch size of 16, using an initial learning rate of 0.01, momentum of 0.937, and weight decay of 0.0005. Complete training hyperparameters, hardware setup specifications, and detailed test scripts are provided in the open-source repository to ensure reproducibility.
For deployment on the Raspberry Pi 5 (8 GB RAM, Ubuntu 24.04), the trained model is exported to PyTorch JIT format. Inference is performed with FP32 precision, batch size 1, and 4 CPU threads. Input images are resized to 640 × 640. To obtain stable timing statistics, a warm-up of 50 iterations was conducted before measuring the latency over 100 runs. This configuration prioritizes deployment stability over peak theoretical performance, and is consistent across all model variants. The complete end-to-end perception pipeline—including image acquisition, preprocessing, inference, post-processing, and adaptive size measurement—operates at 10.2 FPS on the Raspberry Pi 5, as detailed in Section 3.3.4. To provide direct physical benchmarking data, we measured the pure inference latency of the networks. The actual physical inference latency is 62.1 ms for the baseline YOLOv13n and 58.4 ms for our modified model, substantiating the real-world efficiency of our architectural edits. The complete training hyperparameters, dataset partitioning matrix, and automated test scripts are provided in the Supplementary Materials (Code_and_Config.zip) to ensure full reproducibility.
2.3. Real-Time Decision-Making Model for Selective Harvesting
The intelligence of a sweet pepper harvesting robot lies not only in its capability to recognize targets, but more fundamentally in its capacity to render efficient, human-inspired harvesting decisions that preclude invalid attempts and reduce the risk of fruit damage. Although substantial progress has been made in vision-based detection through deep learning, the real-time assessment of fruit maturity and harvestability with both accuracy and speed, while operating under the stringent computational constraints of embedded platforms, remains a significant challenge for robust field deployment. To address this challenge, we propose a lightweight selective harvesting decision model that leverages multi-dimensional visual information. Building upon the visual system’s detection of fruits and peduncles, the model sequentially conducts precise fruit size measurement and multi-criteria harvestability evaluation, thereby enabling rigorous online screening.
2.3.1. Adaptive Fruit Size Measurement Method Based on Depth Statistical Features
Fruit size constitutes a key indicator for evaluating both maturity and commercial grade. In robotic harvesting, conventional single-point depth measurement assumes a uniform depth distribution across the fruit surface, which introduces significant errors when the fruit is oriented obliquely. Conversely, high-precision approaches based on segmentation typically involve substantial computational overhead, making them difficult to reconcile with real-time operational constraints. To address this trade-off, this study formulates a core research question: can the measurement accuracy of tilted fruits be enhanced through an adaptive strategy, while retaining the computational efficiency inherent to detection-level processing?
The proposed method moves beyond the traditional one-size-fits-all paradigm and adopts a design philosophy centered on adaptive strategy selection. We present an adaptive measurement framework that integrates depth statistical features with bounding box geometric information. By constructing a quantitative model that captures the relationship between median depth and fruit tilt angle, the framework dynamically selects the most appropriate measurement strategy, thereby substantially reducing size estimation errors for tilted fruits.
Depth images acquired by the depth camera encode the distance from each scene point to the sensor. Sweet pepper fruits, which are approximately rotational ellipsoids in shape, exhibit systematic variations in surface depth values when tilted in three-dimensional space relative to the camera. We hypothesize that the fruit surface can be treated as a continuous curved manifold, and that its depth distribution can be characterized using statistical descriptors. Through both theoretical analysis and experimental validation, we demonstrate that the median depth serves as a robust statistic for representing the overall depth distribution of the fruit. It remains insensitive to local depth outliers and displays a strong correlation with the fruit tilt angle.
We denote the set of surface points of a sweet pepper fruit in the camera coordinate system as S = {(xi, yi, zi)}, where zi is the depth value. The median depth is defined as Equation (2):
where B represents the bounding box region of the fruit provided by the target detection algorithm. When the fruit rotates about the horizontal axis by an angle θ, the change in median depth is modeled as Equation (3):
where d0 denotes the depth when the fruit directly faces the camera (θ = 0°), k the depth variation rate, and ε the measurement noise.
dmed = median ({ zi | (xi,yi) ∈ B })
dmed (θ) = d0 + k ∙ θ + ε
Controlled experiments were conducted in 2025 to validate this hypothesis and to ensure the feasibility of subsequent harvesting trials. Analysis of the acquired data revealed a strong negative correlation between median depth and tilt angle. Linear regression produced the following relationship (Equation (4)):
dmed = −0.00140 · θ + 0.841
The model indicates that each 1° increase in tilt angle reduces the median depth by an average of 1.40 mm.
Exploiting this strong correlation, we constructed a four-state adaptive measurement framework. The tilt angle is first estimated from the median depth via the inverse function Equation (5):
θest = (0.841 − dmed)/0.0014
The fruit tilt state is then classified into four categories based on θest:
State A (near-frontal): 0.836 m < dmed.
State B (slightly tilted): 0.821 m < dmed ≤ 0.836 m.
State C (moderately tilted): 0.806 m < dmed ≤ 0.821 m.
State D (severely tilted): dmed ≤ 0.806 m.
These thresholds were determined from the statistical distribution of the median depth in the calibration set, rather than by directly substituting nominal angle boundaries into the regression equation. The corresponding estimated tilt-angle boundaries are approximately 3.6°, 14.3°, and 25.0°, respectively. This data-driven thresholding strategy ensures that each state contains a sufficient number of representative samples and provides a more conservative switching policy for the adaptive measurement framework.
Building on this theoretical foundation, we implemented a complete adaptive fruit size measurement algorithm. The algorithm integrates depth statistical features with bounding box geometry and employs an intelligent strategy selection mechanism to apply the appropriate measurement method for each tilt state. Figure 7 illustrates the overall workflow, from depth feature extraction to final size computation.
Figure 7.
Workflow of the adaptive fruit size measurement algorithm.
The algorithm receives as input an RGB image in which sweet pepper fruits have been detected by the YOLOv13n model with associated bounding boxes B = [x1, y1, x2, y2], together with the corresponding aligned depth image. All depth values within each bounding box are first extracted. Invalid measurements are filtered out by retaining only depths in the range of 0.1–2.0 m, producing a set of valid depth samples The median depth dmed is then computed and used for state classification.
Once the tilt state is identified, the optimal measurement method specific to that state is selected based on preliminary experimental results:
State A employs Method I (midline three-point sampling). The bounding box width w = x2 − x1 and the horizontal midline ymid = (y1 + y2)∕2 are computed. Three points are uniformly sampled along the midline. Equations (6)–(8):
dleft = D(ymid, x1 + 0.25 w)
dcentert = D(ymid, x1 + 0.50 w)
dright = D(ymid, x1 + 0.75 w)
The representative depth is taken as the median of these three values. Equation (9):
drep = median(dleft, dcentert, dright)
The fruit diameter is then calculated as Equation (10):
States B and C use Method II (single-point depth method). The bounding box center (xc, yc) = ((x1, x2)/2, (y1, y2)/2) is determined, and the depth at this center point dcentert = D(yc, xc) is obtained. The fruit diameter is computed as Equation (11):
State D applies Method III (simple perspective correction method). The bounding box width w = x2 − x1 and h = y2 − y1 are used to compute the average pixel diameter pixeld = (w + h)/2. The fruit diameter is then given by Equation (12):
where fx = 605.34 is the camera focal length along the x-axis.
To attenuate measurement noise and improve result stability, the algorithm applies an exponentially weighted moving average (EWMA) to smooth the fruit diameter estimates across consecutive frames Equation (13):
The smoothing coefficient α = 0.3 was selected because its effective time window (1/α ≈ 3.3) corresponds to approximately 0.32 s at a processing speed of 10.2 FPS. This window length effectively suppresses random noise without introducing appreciable response delay. Experimental validation confirmed that α = 0.3 provides the best overall stability. The algorithm outputs the smoothed fruit diameter Dsmooth for subsequent maturity assessment and harvesting decisions. On the Raspberry Pi 5 (8 GB RAM) platform, the algorithm achieves an average processing speed of 10.2 FPS, fully satisfying the real-time requirements of the sweet pepper harvesting robot.
2.3.2. Decision Model Design
The decision process begins with the raw detection outputs generated by the vision system. The complete decision model is depicted in Figure 8.
Figure 8.
Architecture of the decision model.
First, the pixel coordinates of the fruit centroid Pfruit(u, v) and the peduncle base keypoint Pstem(u, v)are extracted from the respective bounding boxes. Using the calibrated camera intrinsics and the aligned depth map, these two 2D pixel locations are transformed into 3D spatial points in the robot base coordinate system, denoted as Pfruit(x, y, z) and Pstem(x, y, z).
With the 3D spatial information obtained, the system sequentially applies a triple-criterion decision mechanism: (1) Spatial reachability: This criterion assesses whether the peduncle keypoint Pstem resides within the predefined workspace of the robotic arm, thereby confirming physical accessibility. (2) Fruit–peduncle association: The Euclidean distance between the fruit and peduncle points is computed as D = |Pfruit − Pstem| and compared against a preset threshold T_distance to verify their spatial correspondence. A distance exceeding the threshold indicates that the detected peduncle does not belong to the targeted fruit, thereby eliminating false-positive pairings. This threshold was determined through a data-driven procedure: morphological measurements were performed on 150 sample plants independent of the training set. The measured minimum distances between adjacent fruit–peduncle pairs had the following statistical distribution: mean = 6.8 cm, standard deviation = 1.4 cm, 5th percentile = 5.2 cm, 95th percentile = 9.2 cm. Considering the end-effector’s physical dimensions (gripper width: 3.5 cm) and a conservative safety margin (1.0 cm), the threshold was set to 5.7 cm. This value ensures that 95% of the measured sample configurations provide sufficient clearance for the gripper to operate without collision. This approach ensures that the threshold remains representative of real-world conditions while retaining adequate operational tolerance. (3) Maturity and confidence: Maturity evaluation is primarily based on the physical diameter of the fruit. Drawing on statistical measurements of sweet peppers collected in the sampling area and referring to agronomic studies on fruit dimensions at the green-ripe stage, reported that the commercial sweet pepper cultivar ‘Jinjiao 206’ exhibits a mature longitudinal diameter of approximately 9.2 cm and an equatorial diameter of approximately 8.4 cm), the diameter threshold for harvestable mature fruit was established at 8 cm. This threshold ensures that harvested fruits conform to basic commercial specifications while effectively excluding underdeveloped immature fruits. The adaptive fruit size measurement method verifies that the fruit diameter satisfies Dfruit ≥ 8 cm, and both the fruit and peduncle detection confidences exceed the empirical confidence threshold Tconf, thus discarding targets with high recognition uncertainty that are likely to result in failed attempts.
Only when a specific fruit–peduncle pair simultaneously fulfills all the above conditions does the system designate the 3D coordinates of that peduncle Pstem(x, y, z) as a valid picking point and transmit it to the motion planning module. Otherwise, the target is ignored and the system proceeds to evaluate the next candidate. By embedding this multi-criteria assessment, the decision model advances the harvesting task from a basic “perception–execution” loop to a comprehensive “perception–decision–execution” framework, which is essential for realizing selective harvesting.
3. Results
3.1. Evaluation Metrics
3.1.1. Performance Metrics for the Visual Perception Model
Mean Average Precision (mAP@0.5): This metric serves as the core accuracy indicator for object detection models. The average precision at an Intersection-over-Union (IoU) threshold of 0.5 is first computed for each category (sweet pepper fruit and sweet pepper peduncle). The arithmetic mean of these per-category average precisions is then taken, as expressed by Equation (14):
where N = 2 denotes the number of categories and APc is the average precision for category c. A higher mAP@50 value reflects superior overall detection performance.
Parameter Count and Computational Complexity: Parameter count, reported in millions (M), refers to the total number of trainable parameters in the model and directly influences memory occupancy on the edge device (Raspberry Pi 5). Computational complexity is quantified in giga floating-point operations (GFLOPs), which represents the computational burden per inference and is a critical determinant of real-time feasibility.
End-to-End Perception Speed (FPS): The end-to-end perception speed, measured in frames per second (FPS) on the deployment platform (Raspberry Pi 5), directly determines the real-time capability of the perception module. This metric covers the complete pipeline, including image acquisition, preprocessing, inference, post-processing, and adaptive size measurement.
3.1.2. Accuracy Metrics for Fruit Size Measurement
Mean Absolute Error and Root Mean Square Error: These metrics quantify the deviation between measured and ground truth size values. For Equations (15) and (16):
Both metrics are expressed in millimeters (mm). MAE reflects the average absolute deviation, whereas RMSE is more sensitive to large errors. Together, they provide a comprehensive evaluation of measurement accuracy and stability.
3.1.3. Overall System Harvesting Performance Metrics
Harvesting Success Rate: This is the primary metric for assessing the effectiveness of the robot’s closed-loop operation. It is defined as the number of successfully harvested fruits divided by the total number of harvesting attempts executed by the robotic arm. Successful harvesting refers to the robot autonomously completing the entire process of localization, grasping, and retrieval without causing any damage to the fruit.
Fruit Damage Rate: This key metric evaluates the crop-friendly performance of the system. It is defined as the number of fruits exhibiting visible damage after harvesting divided by the total number of successfully harvested fruits. Damage is identified by the presence of permanent indentations, skin breaks, or tissue ruptures that are visible to the naked eye within 24 h post-harvest.
Average Harvesting Time per Fruit: This metric quantifies the operational efficiency of the system. The timing interval begins when the vision system locks onto a valid harvesting target and issues a command, and it ends when the robotic arm places the fruit into the collection area and returns to its standby position. The interval thus encompasses the complete perception, decision, execution, and retrieval cycle.
Decision Effective Hit Rate: This metric evaluates the performance of the selective decision-making model. It is defined as the number of fruits that were classified as harvestable by the decision model and were subsequently harvested successfully, divided by the total number of fruits classified as harvestable. This indicator directly reflects the effectiveness of the decision model in avoiding invalid attempts.
3.2. Performance Evaluation of the Sweet Pepper Visual Perception Model for Edge Deployment
To comprehensively validate the proposed improved visual perception model in terms of accuracy, efficiency, and lightweight design, and to confirm that it meets the integrated system’s core requirements for real-time performance and reliability, systematic evaluations were conducted on our self-constructed sweet pepper test dataset. The evaluation comprised two phases. First, a horizontal comparative experiment was performed to identify the most suitable baseline architecture among current mainstream lightweight YOLO models for subsequent enhancement. Second, a longitudinal ablation study was carried out to progressively verify the necessity and synergistic effects of the three proposed improvements: GhostConv, ReLU6, and DIoU Loss.
3.2.1. Baseline Model Selection: Comprehensive Trade-Off Among Accuracy, Efficiency, and Lightweight Design
To determine the optimal starting point for improvement, four lightweight baseline models—YOLOv5n, YOLOv8n, YOLOv11n, and YOLOv13n—were compared on the same sweet pepper dataset under identical training conditions. As presented in Table 2 and Figure 9, YOLOv13n exhibited marked superiority in overall performance when mAP@50, parameter count, and GFLOPs were considered holistically. Relative to its predecessor YOLOv5n, YOLOv13n achieved a 0.3-percentage-point-higher mAP@0.5, while reducing the parameter count by 2.2% and computational complexity (GFLOPs) by 12.7%. Compared with its contemporaries YOLOv8n and YOLOv11n, YOLOv13n maintained the highest detection accuracy while possessing the smallest parameter count and computational load. Specifically, the parameter count of YOLOv13n (2.45 M) was 5.0% lower than that of YOLOv11n (2.58 M) and 8.6% lower than that of YOLOv8n (2.68 M). Owing to its optimal balance among accuracy, efficiency, and lightweight design, YOLOv13n was selected as the baseline model for subsequent improvements. All models were evaluated on the Raspberry Pi 5 hardware platform to ensure that the assessment results faithfully represented edge deployment scenarios.
Table 2.
Comparison results of baseline models.
Figure 9.
Comparison of mAP@0.5:0.95 and recall for baseline models.
3.2.2. Ablation Study: Analysis of Synergistic Effects of Improvement Strategies
To construct a perception system capable of real-time operation on resource-constrained mobile platforms, three targeted improvements were introduced to the baseline YOLOv13n model. The updated ablation study results, presented in Table 3, not only quantify the contribution of each individual enhancement but also reveal a key systemic insight: GhostConv, ReLU6, and DIoU Loss are not merely independent optimizations; rather, they form a deeply synergistic closed loop encompassing lightweighting, robustness, and precision. This synergistic effect constitutes the core enabler for achieving high-accuracy, high-efficiency edge perception.
Table 3.
Ablation study results based on YOLOv13n.
The ablation study first elucidates the individual contributions and inherent limitations of each improvement component. Introducing GhostConv alone achieved the lowest parameter count (2.37 M) but led to a decrease in overall mAP@0.5 (94.9%). This confirms that pure lightweighting inevitably compromises fundamental representational capacity when applied in isolation. In contrast, applying ReLU6 alone maintained the parameter count and GFLOPs unchanged while yielding a notable improvement in fruit detection accuracy (97.6%) and a slight increase in overall mAP@0.5 (95.3%). This substantiates its unique value as a deployment-enabling component that enhances the model’s native robustness by stabilizing the range of activation values, which is particularly beneficial for subsequent INT8 quantization. A pivotal observation is that the exclusive use of DIoU Loss, although attaining peak fruit detection accuracy (98.7%), simultaneously resulted in the lowest detection accuracy for the critical small target (peduncle) at 91.0%. This seemingly paradoxical outcome profoundly reveals that the strong constraint imposed by DIoU on bounding box center localization, when applied to a model with insufficient feature extraction capability, may prove counterproductive by over-optimizing an inherently inaccurate initial prediction. Physically, DIoU heavily penalizes center-point offset. When the baseline feature representations for tiny peduncle targets are weak, this strong geometric penalty can mislead gradient updates, causing the model to over-optimize on inaccurate initial predictions and thereby hurting small-object recall. It underscores the prerequisite role of a robust feature foundation for the effective functioning of specialized optimizers.
A genuine breakthrough emerged from the combination of GhostConv and DIoU, which achieved an overall mAP@0.5 of 96.4% while reducing the parameter count to 2.37 M. This demonstrates that DIoU can efficiently leverage its localization advantage on the refined feature maps provided by GhostConv, yielding simultaneous improvements in efficiency and accuracy relative to the GhostConv-only configuration. It is noteworthy that the final model’s mAP@0.5 (96.0%) is slightly lower than the baseline (97.8%). This is an intentional trade-off rather than a deficiency: the 4.1% parameter reduction (from 2.45 M to 2.35 M) and 3.2% GFLOPs reduction (from 6.2 to 6.0) are achieved with only a 1.8 percentage-point decrease in mAP@0.5. When measured by computational efficiency (mAP per GFLOPs), the baseline achieves 97.8/6.2 = 15.77, while the final model achieves 96.0/6.0 = 16.00, representing a 1.5% improvement. This efficiency gain directly translates to more stable frame rates and lower thermal throttling on the Raspberry Pi 5 during prolonged operation. Therefore, the reported 96.0% mAP@0.5 is not an isolated accuracy figure, but rather an accuracy–efficiency Pareto-optimal solution under a fixed hardware budget.
All experiments in this study were conducted with a fixed random seed (seed = 42) to ensure deterministic results and reproducibility, which is standard practice for embedded deployment-oriented research where the primary goal is a stable, deployable model rather than statistical significance testing across multiple training runs.
Nevertheless, the final configuration adopted in this work, GhostConv + ReLU6 + DIoU, represents an optimal trade-off tailored to system-level task requirements. Although the overall mAP@0.5 of the final model (96.0%) is slightly lower than that of GhostConv + DIoU (96.4%), the final model achieves a substantial improvement in peduncle detection accuracy (95.1% vs. 94.2%). In a robotic harvesting system, peduncle localization is the most critical metric, as it directly determines the execution point for the end-effector. Therefore, sacrificing a marginal overall mAP for a significant gain in peduncle precision is a deliberate system-level trade-off to ensure a higher harvesting success rate. Additionally, although the GhostConv + ReLU6 configuration achieved the lowest parameter count and GFLOPs, it did not improve overall accuracy, providing a valuable reference point for edge deployment. The final model therefore achieves a favorable balance among accuracy, lightweightness, and deployment readiness for practical harvesting tasks, thereby furnishing the complete robotic system with stable, precise, and real-time visual perception. These findings validate the effectiveness of the proposed synergistic design strategy.
3.2.3. Validation of the Synergistic Design Strategy
The ablation study elucidates that model lightweighting for agricultural robotics extends far beyond a simplistic process of pruning and fine-tuning. Rather, it constitutes a systems engineering endeavor that demands the synergistic consideration of deployment hardware characteristics (ReLU6), computational and memory budgets (GhostConv), and task-critical objectives (DIoU). The final model achieves a favorable balance among accuracy, lightweightness, and deployment readiness for practical harvesting tasks, thereby furnishing the complete robotic system with stable, precise, and real-time visual perception. These findings unequivocally validate the effectiveness of the proposed synergistic design strategy.
3.3. Evaluation of the Fruit Size Measurement Method
To ensure that the robot can accurately assess fruit maturity and execute reliable harvesting decisions, a systematic performance evaluation was conducted for the proposed adaptive fruit size measurement method based on depth statistical features. The experiments were designed to address two central questions: first, whether the core hypothesis of the method—that a strong correlation exists between the median depth of the fruit and its tilt angle—is valid; and second, whether the proposed adaptive approach can substantially improve measurement accuracy across diverse tilt orientations while preserving real-time performance, relative to conventional single-strategy methods.
3.3.1. Experimental Setup and Evaluation Metrics
The evaluation experiments were carried out under controlled laboratory conditions. An Intel RealSense D435 depth camera was used to acquire RGB-D images of 151 standard sweet pepper samples (diameter range: 7.0–8.7 cm) at four fixed tilt angles: 0°, 15°, 30°, and 45°. The 151 samples were divided into two independent subsets: a calibration set (n = 80, 20 samples per tilt angle) for establishing the regression model and determining the state classification thresholds, and a validation set (n = 71) for reporting the final performance of the adaptive method. This strict separation ensures that the reported accuracy (MAE = 5.0 mm) is not contaminated by overfitting to the same data used for parameter tuning. To decouple the influence of working distance, the camera-to-fruit distance was strictly maintained at 0.8 ± 0.05 m during the dataset collection, which lies within the optimal working range of the accompanying robotic arm. The proposed adaptive measurement method (denoted as ADM) was compared with three baseline approaches: the midline three-point sampling method (MTS), the single-point depth method (SPD), and the simple perspective correction method (SPC). The evaluation metrics included the mean absolute error (MAE) and the root mean square error (RMSE), both reported in millimetres. The processing speed of each method was also recorded to assess its suitability for real-time operation.
3.3.2. Correlation Between Median Depth and Tilt Angle
The theoretical foundation of the adaptive method rests on the relationship between the statistical distribution of fruit depth and its spatial orientation, as illustrated in Figure 10. The median depth dmed exhibited a pronounced negative correlation with the tilt angle θ. Statistical analysis confirmed this strong association: the Pearson correlation coefficient was r = −0.9076, the Spearman rank correlation coefficient was ρ = −0.9026, and the coefficient of determination R2 = 0.824 from linear regression indicated that tilt angle explained 82.4% of the variance in median depth. One-way ANOVA revealed highly significant differences in median depth distributions across the angle groups (F = 268.61, p < 1 × 10−50). The coefficient of variation for sample distance was 2.2%, effectively excluding distance fluctuation as a confounding factor. These results validate the hypothesis that median depth serves as a robust indicator of fruit tilt state, thereby providing a solid mathematical foundation for the classification scheme underpinning the adaptive strategy.
Figure 10.
Relationship between median depth and tilt angle.
To further validate the generalizability of the regression model, the coefficient of determination was computed on the independent validation set (n = 71 samples, reserved from the original 151 samples). The validation set yielded , closely matching the calibration set value ( 24). This consistency confirms that the depth–tilt correlation is stable across different samples and is not an artifact of overfitting to the calibration data.
Table 4 presents detailed statistical characteristics of the median depth at each tilt angle. As the tilt angle increased from 0° to 45°, the mean median depth progressively decreased from 0.8394 m to 0.7800 m, while the standard deviation remained within 0.0072–0.0134 m, indicating good data quality and high consistency.
Table 4.
Trend of median depth variation with tilt angle.
3.3.3. Performance Comparison of Adaptive and Baseline Methods
Following validation of the theoretical hypothesis, the performance limitations of the three baseline measurement methods were systematically evaluated across different tilt angles (Table 5). The results demonstrate that no single method consistently outperformed the others under all tilt conditions. For instance, the midline three-point sampling method achieved the smallest error when the fruit directly faced the camera (0°); the single-point depth method performed better at moderate tilt (30°); and the simple perspective correction method exhibited acceptable performance only at severe tilt (45°), producing substantial errors at other angles. This finding underscores the inadequacy of traditional fixed-strategy approaches and strongly substantiates the necessity of an adaptive method that dynamically selects measurement strategies based on fruit orientation.
Table 5.
Performance comparison of four measurement methods.
Building on the foregoing analysis, the proposed adaptive measurement method intelligently selects the optimal baseline method corresponding to the estimated tilt state, drawing on the comparative data in Table 5. As shown in the last row of Table 5, the adaptive method inherits the locally optimal performance of each baseline method under different tilt conditions, thereby achieving a global improvement in accuracy. Its mean MAE of 5.0 mm represents a 9.1% improvement over the best single-strategy baseline (single-point depth method, 5.5 mm), and improvements of 20.6% and 72.3% relative to the midline three-point sampling method and the simple perspective correction method, respectively. These results conclusively demonstrate the effectiveness of the strategy adaptation design philosophy.
The current experiments cover four discrete tilt angles (0°, 15°, 30°, and 45°), which span the typical tilt range of sweet pepper fruits observed in our field survey (5–50°). However, we acknowledge that the strategy switching boundaries were derived from the calibration set and do not coincide exactly with the nominal 10°, 20°, and 35° used in the experimental design. The method’s behavior at intermediate angles (e.g., 12°, 18°, 33°) has not been exhaustively characterized. In practice, the EWMA smoothing across consecutive frames (Section 3.3.4) mitigates the impact of threshold boundary discontinuities by interpolating measurements over time. Future work will include a finer-grained angular sweep (every 5°) to fully characterize the method’s behavior near the switching boundaries.
It should be noted that the adaptive measurement method (ADM) selects the measurement strategy based on the estimated tilt state derived from the median depth, rather than the ground-truth tilt angle. On the independent validation set (n = 71), the state classification accuracy was 94.4% (67/71), with misclassifications occurring mainly near the threshold boundaries. The breakdown of classification accuracy is as follows: State A (100%, 18/18), State B (88.9%, 16/18), State C (88.9%, 16/18), and State D (100%, 17/17). Misclassifications primarily occurred at the boundaries between States B and C. Thanks to the EWMA smoothing across consecutive frames, occasional boundary misclassifications had a limited impact on the final diameter estimate. The reported MAE of 5.0 mm therefore reflects the performance of ADM under estimated tilt states in continuous operation. Furthermore, a theoretical error propagation analysis was conducted to evaluate the impact of tilt-angle estimation errors on the final size measurement. Based on Equation (4), a ±2° error in the estimated tilt angle results in a depth error of approximately 2.8 mm. Substituting this into Equation (11) with a typical bounding box width of 100 pixels and fx = 605.34, the induced dimensional measurement error is calculated to be only 0.46 mm. This confirms that the adaptive strategy is highly robust against angle misclassifications, as the propagated error is significantly smaller than the reported overall MAE of 5.0 mm.
3.3.4. Algorithm Stability, Real-Time Performance, and Deployment Suitability
To ensure smooth and stable measurements during continuous operation, an exponentially weighted moving average (EWMA) filter was integrated into the algorithm. A systematic tradeoff between stability and real-time responsiveness was performed by analyzing the measurement fluctuation, response time, and steady-state error under different values of the smoothing coefficient α (Table 6). The coefficient was ultimately set to α = 0.3, which yields a response time of approximately three frames (around 0.3 s at a processing speed of 10.2 FPS). This configuration effectively suppresses noise without introducing appreciable latency, thereby satisfying the real-time control requirements of dynamic harvesting scenarios.
Table 6.
Stability comparison of the algorithm under different values of α.
The proposed adaptive measurement algorithm achieves an average processing speed of 10.2 FPS on the host computer (Raspberry Pi 5) of the harvesting robot. It thus satisfies the dual requirements of high accuracy and real-time performance on a resource-constrained edge device, ensuring that the perception module can be seamlessly embedded into the complete perception, decision, and execution closed-loop system.
3.3.5. Performance Evaluation and Deployment Suitability Conclusions of the Adaptive Measurement Method
By establishing a quantitative model that correlates median depth with tilt angle, the proposed depth statistical feature-based adaptive method enables dynamic switching of measurement strategies. Experimental results demonstrate that this method attains a mean absolute error of 5.0 mm across tilt angles from 0° to 45°, outperforming the best single-strategy baseline by 9.1%. With the smoothing coefficient configured as α = 0.3, the algorithm achieves an optimal balance between noise suppression and real-time responsiveness, operating at 10.2 FPS on the Raspberry Pi 5 platform. These findings substantiate the proposed method as an efficient and practical solution to the challenge of variable fruit orientation in unstructured environments, thereby establishing a foundation for reliable online maturity assessment.
3.4. Overall System Integration Performance and Decision Effectiveness Validation
The overarching goal of this study is to validate the closed-loop operational capability of the fully integrated perception–decision–execution system and to establish an initial performance benchmark for the proposed platform. To this end, a total of 120 consecutive harvesting attempts were conducted under controlled laboratory conditions to evaluate both the effectiveness of the harvestability decision model and the overall system performance.
3.4.1. Effective Hit Rate Analysis of the Decision Model
The fundamental value of the decision model lies in its capacity to replicate the selectivity of human harvesters by avoiding invalid or high-risk operations. The decision effective hit rate is defined as the proportion of fruits classified as harvestable by the decision model and subsequently successfully harvested, relative to the total number of targets selected by the decision model.
Among the 120 harvesting attempts, manual ground-truth inspection confirmed that 105 targets were truly harvestable and 15 were non-harvestable. The primary reason for non-harvestability was that the fruit diameter did not meet the 8 cm maturity threshold. The decision model selected 108 targets as harvestable and rejected 12. Among the rejected targets, 10 were correctly rejected (true negatives) and 2 were incorrectly rejected (false negatives). Among the 108 selected targets, 103 were truly harvestable and were successfully harvested (true positives), while 5 were truly non-harvestable but were incorrectly selected (false positives). The 5 failed attempts were therefore attributable to decision-model false positives rather than execution disturbances.
Based on these counts, the decision model achieved: Precision = 103/108 = 95.4%; Recall = 103/105 = 98.1%; Specificity = 10/15 = 66.7%. The effective hit rate is identical to precision by definition, i.e., 103/108 = 95.4%. The overall harvesting success rate over all 120 attempts is 103/120 = 85.8%. These results confirm that the decision model maintains a high recall for harvestable targets, while its specificity of 66.7% indicates that further improvement is needed in rejecting non-harvestable targets. The false positives (5 cases) were primarily caused by size-measurement bias near the 8 cm threshold. Depth-camera noise and partial occlusion of the fruit edge contributed to this bias. Furthermore, the identical numerical values (95.4%) for precision and target-harvesting success reflect different evaluation dimensions rather than a definitional overlap. Precision is an algorithmic metric (103 true positives out of 108 selected targets). Execution success is a mechanical metric (103 successful grips out of 108 attempts). The 5 false positives identified by the decision model were exactly the 5 targets that mechanically failed (slippage due to fruit size < 8 cm).
3.4.2. Overall System Performance Evaluation
Guided by the decision model, the integrated robotic system underwent end-to-end performance evaluation. A total of 120 independent harvesting attempts were conducted under controlled laboratory conditions, covering a range of fruit positions within the robotic arm workspace, tilt angles from 0° to 45°, and occlusion levels from no occlusion to heavy occlusion.
To clearly decouple algorithmic classification from mechanical execution, a step-by-step evaluation funnel is presented: From the 120 total attempts, 2 harvestable targets were incorrectly bypassed (false negatives) and 10 non-harvestable targets were correctly rejected (true negatives), leaving 108 targets selected by the algorithm. Among these 108 selected targets, 103 were successful mechanical grasps, while 5 resulted in mechanical failures (slips). The decision model selected 108 targets as harvestable, of which 103 were successfully harvested. This yields a selected-target harvesting success rate of 95.4% (103/108; 95% Wilson CI: [89.7%, 98.1%]). The overall success rate over all 120 attempts was 85.8% (103/120; 95% Wilson CI: [78.5%, 91.0%]). Among the 103 successfully harvested fruits, 2 exhibited visible surface damage (minor indentations), resulting in a fruit damage rate of 1.9% (2/103; 95% Wilson CI: [0.5%, 6.8%]).
The average harvesting cycle time per fruit was 23.8 s. As illustrated in Figure 11, the harvesting workflow consists of sequential perception, planning, execution, and retrieval phases. Decomposition of the cycle time reveals that robotic arm motion planning and physical execution together constitute the dominant contributor, accounting for 83% of the total time, whereas visual perception and decision-making account for approximately 17%. Further analysis indicates that physical execution time is primarily constrained by the low-cost servo actuator performance, while the planning phase is dominated by BIT* search computation. These results clearly indicate that improving the servo performance of the robotic arm joints and exploring more efficient planning algorithms represent the most critical directions for further reducing cycle time.
Figure 11.
Workflow of the actual harvesting process.
3.4.3. Discussion of System-Level Contributions
In summary, the integrated system developed in this study attains a selected-target harvesting success rate of 95.4% and a fruit damage rate of 1.9%, with an overall success rate of 85.8% over all 120 attempts. This level of performance does not arise from a disruptive breakthrough in any single technology; rather, it is the outcome of deep integration and system-level optimisation of synergistically co-optimised perception (lightweight YOLO), decision-making (adaptive rules), and execution (customised hardware) modules within a unified ROS 2 framework. In contrast to numerous studies in the literature that report only algorithmic simulation accuracy or the performance of isolated components, the core contribution of this work resides in the complete construction, empirical demonstration, and quantitative evaluation of a fully functional, autonomously operating robotic harvesting prototype. This provides the research community with a reproducible and comparable system performance baseline. It represents a substantive step forward from fragmented module innovation toward practice-oriented system construction.
4. Discussion
4.1. System Performance Positioning and Implications
The harvesting success rate of 95.4% and fruit damage rate of 1.9% achieved under controlled conditions establish a robust performance baseline for sweet pepper harvesting robotics, demonstrating reliability that is comparable to or marginally surpasses that of existing systems. This level of performance does not originate from a singular algorithmic breakthrough; rather, it is the result of deep synergy and system-level optimisation among perception, decision-making, and execution modules within a unified framework. This finding supports a key proposition: in agricultural robotics, a well-designed, tightly integrated system with moderate individual component performance can offer greater stability and practical deployment potential than a system composed of high-performance yet loosely coupled modules. The open-source platform delivered by this study enables such system-level optimisation insights to be shared, scrutinised, and further validated by the research community. To highlight the trade-offs of our low-cost approach, Table 7 benchmarks our system against previously reported platforms. While industrial systems achieve comparable success rates, our system delivers this at approximately one to two orders of magnitude lower cost (~700 USD) by leveraging edge computing and 3D-printed structures.
Table 7.
Comparison with existing sweet pepper harvesting systems.
4.2. In-Depth Attribution of Performance Bottlenecks and Optimisation Pathways
Decomposition of the average harvesting cycle time (23.8 s) reveals that robotic arm motion planning and execution account for 83% of the total duration. This finding directly reflects the performance ceiling imposed by the platform constraints adopted in this study, namely the computational capacity of the Raspberry Pi 5 and the dynamic characteristics of the low-cost, in-house developed robotic arm. Rather than representing a shortcoming, this result provides a valuable benchmark that identifies the most promising optimisation directions for future research on this platform: (1) integration of more efficient motion planners, such as learning-based planners, and (2) upgrading joint servo controllers to achieve higher motion speeds. The modular architecture of the platform is expressly designed to support such plug-and-play enhancements, enabling subsequent studies to readily substitute planning or control modules and quantify performance gains on an identical hardware baseline. This capability constitutes the core value of the platform as a research sandbox.
4.3. Decision Model Limitations and Platform Extensibility
Although the proposed decision model demonstrates strong effectiveness in the current scenario (hit rate of 95.4%), its generalisation capability is inherently limited. For example, the threshold Tdistence may not be directly transferable to cultivars or planting densities with differing morphological traits. This limitation, however, simultaneously highlights another important role of the platform: serving as a testbed for lightweight or learning-based decision algorithms. Future work can directly integrate learning-based harvestability assessment models onto this platform and, leveraging its stable hardware interfaces and standardised evaluation workflows, conduct fair comparisons between novel algorithms and the current rule-based approach.
4.4. Challenges in Transitioning from Laboratory Platform to Field Deployment
It is important to recognise that current end-to-end performance metrics—obtained with stationary plants under fixed laboratory illumination—cannot be directly extrapolated to greenhouse or open-field dynamic conditions. A substantial gap exists between controlled laboratory conditions and authentic field scenarios, where plant sway, complex shadows, and dust will introduce significant interference. Uncontrolled natural illumination can significantly alter the visual features extracted by the YOLO model, potentially reducing detection accuracy. Furthermore, different sweet pepper cultivars exhibit variations in fruit color, shape, and peduncle geometry, which may require recalibration of the 8 cm size threshold and the depth–tilt regression model. Before the system can be deployed in the field, it must address challenges including dynamic lighting, plant motion, and global navigation. Among these challenges, illumination robustness and plant vibration should be solved first. Perception is the first link in the control loop; dynamic lighting and plant sway directly disrupt the visual features and depth statistics, leading to failure before motion planning is even engaged. Additionally, we acknowledge that the detection models were trained only once with a fixed random seed. The marginal 1.8 percentage-point drop in mAP@0.5 may partially stem from stochastic training variations. However, the primary objective of this work is to provide a deployable edge model with a significantly reduced parameter footprint, rather than claiming a superior absolute accuracy. Future work will incorporate multiple independent training runs to provide rigorous statistical significance. These challenges delineate clear and actionable directions for subsequent research. The principal value of the present platform lies in providing a stable, well-characterised hardware and software foundation for such investigations, allowing researchers to focus on solving specific field adaptation problems, for instance developing illumination-robust perception models, rather than reconstructing an entire robotic system from the ground up.
5. Conclusions
This study successfully designed and validated a fully integrated, modular robotic system for selective sweet pepper harvesting. The main conclusions are summarized as follows: (1) A co-optimized vision model tailored for edge deployment was proposed, achieving detection accuracies of 96.9% mAP@0.5 for fruits and 95.1% for peduncles with a parameter count of only 2.35 M. Although the overall mAP@0.5 is 1.8 percentage points lower than that of the YOLOv13n baseline, the final model reduces the parameter count by 4.1% and GFLOPs by 3.2%, providing a more deployment-friendly accuracy–efficiency balance on the Raspberry Pi 5 platform. (2) An adaptive fruit size measurement method based on depth statistical features was devised, attaining a mean absolute error of 5.0 mm—surpassing single-strategy approaches—and enabling an efficient real-time decision model with an effective hit rate of 95.4%. (3) The central contribution lies in the complete construction and open-sourcing of a robotic research platform adhering to the principles of full-stack autonomy and module decoupling. In closed-loop tests under controlled environments, this platform achieved a selected-target harvesting success rate of 95.4% (103 out of 108 selected targets) and an overall success rate of 85.8% (103 out of 120 attempts), with a fruit damage rate of 1.9% (2 out of 103 successfully harvested fruits), establishing a quantifiable and reproducible system-level performance baseline for the selective sweet pepper harvesting task.
Building upon the achievements and limitations of this study, future work will be pursued along three primary directions. First, the evolution of the platform itself will be intensified. Leveraging the established benchmark, more advanced planning and decision-making algorithms will be integrated onto the platform to continuously elevate its performance ceiling, with the results systematically documented as a series of benchmark reports. Second, the versatility of the platform will be extended. Extending the platform to crops such as eggplant will require re-calibration of multiple decision thresholds, as differences in fruit morphology, heavier peduncle geometry, and larger gripper-opening ranges will demand fundamental algorithmic adjustments rather than direct transferability. The rapid reconfiguration of modular end-effectors will be explored, thereby evolving the platform into a multi-crop research testbed. Third, the transition of the platform toward field deployment will be advanced. Building on the current foundation, modules including SLAM navigation and multi-robot coordination will be integrated to facilitate autonomous operation research in greenhouses or ridge environments, thereby accelerating the translation from laboratory prototype to field-ready technology. This study takes a critical step from an integrated system toward an open research platform, and we posit that this work will provide valuable infrastructure to foster collaborative innovation in the field of fruit and vegetable harvesting robotics.
Supplementary Materials
The following supporting information can be downloaded at: https://www.mdpi.com/article/10.3390/agriculture16212443/s1.
Author Contributions
Conceptualization, J.L. and F.L.; methodology, J.L. and Z.Y.; software, J.L. and Z.Y.; validation, Z.Y., J.L., Y.L. and B.W.; formal analysis, Z.Y. and Y.L.; investigation, Z.Y., J.L., Y.L. and B.W.; resources, J.L. and B.W.; data curation, Z.Y. and Y.L.; writing—original draft preparation, Z.Y.; writing—review and editing, J.L., Z.Y., Y.L., B.W. and F.L.; visualization, Z.Y. and B.W.; supervision, J.L. and F.L.; project administration, J.L.; funding acquisition, J.L. and F.L. All authors have read and agreed to the published version of the manuscript.
Funding
This research was funded by the Science and Technology Innovation Enhancement Project of Shanxi Agricultural University (Grant No. CXGC2026077), the 2025 Graduate Education Innovation Program of Shanxi Province (Grant No. 2025AL05), and the Shanxi Province Key R&D Program (Grant Nos. 202202140601021 and 202402140601012). The authors appreciate the funding organizations for their financial support.
Data Availability Statement
The repository at https://github.com/yzzzh1007/Low-Cost-Co-Designed-Robotic-System (accessed on 3 November 2026) provides instructions for accessing the dataset, usage notes, ROS 2 packages, and hardware design files. The dataset itself is available from the corresponding author on reasonable request. The repository also includes calibration scripts and reproduction steps for the reported experiments.
Conflicts of Interest
The authors declare no conflicts of interest.
Abbreviations
The following abbreviations are used in this manuscript:
| ADM | Adaptive Measurement Method |
| BIT* | Batch Informed Trees |
| DH | Denavit–Hartenberg |
| DIoU | Distance Intersection over Union |
| EWMA | Exponentially Weighted Moving Average |
| FPS | Frames Per Second |
| GFLOPs | Giga Floating-Point Operations |
| IoU | Intersection over Union |
| KDL | Kinematics and Dynamics Library |
| MAE | Mean Absolute Error |
| mAP | Mean Average Precision |
| RMSE | Root Mean Square Error |
| YOLO | You Only Look Once |
| ROS | Robot Operating System |
| SPC | Simple Perspective Correction |
| SPD | Single-Point Depth |
References
- Chakrabarty, S.; Islam, A.K.M.A. Selection criteria for improving yield in chili (Capsicum annuum). Adv. Agric. 2017, 2017, 5437870. [Google Scholar] [CrossRef] [Scilit]
- Tai, S.; Tang, Z.; Li, B.; Wang, S.; Guo, X. Intelligent recognition and automated production of chili peppers: A review addressing varietal diversity and technological requirements. Agriculture 2025, 15, 1200. [Google Scholar] [CrossRef] [Scilit]
- Prasanth, R.S.; Surendrakumar, A.; Kavitha, R.; Nagarajan, K.; Venkatesan, K.; Ravikumar, R. Engineering properties of colored capsicum crop for innovative robotic harvesting solutions in protected agriculture. J. Appl. Hortic. 2024, 26, 73–77. [Google Scholar] [CrossRef] [Scilit]
- Qiao, N.; Jiao, Y.S.; Liang, Y.P.; Liu, J.; Zhang, X.; Wang, L. Breeding of a new sweet pepper cultivar ‘Jinjiao 206’. China Veg. 2025, 1, 193–196. [Google Scholar] [CrossRef]
- Ren, C.; Zhou, X.; Wang, C.; Guo, Y.; Diao, Y.; Shen, S.; Reis, S.; Li, W.; Xu, J.; Gu, B. Ageing threatens sustainability of smallholder farming in China. Nature 2023, 616, 96–103. [Google Scholar] [CrossRef] [Scilit]
- Lowenberg-DeBoer, J.; Huang, I.Y.; Grigoriadis, V.; Blackmore, S. Economics of robots and automation in field crop production. Precis. Agric. 2020, 21, 278–299. [Google Scholar] [CrossRef] [Scilit]
- Magistri, F. Robotics in Horticulture: From Sensor Data to Autonomous Harvesting. Ph.D. Thesis, Universitäts-und Landesbibliothek Bonn, Bonn, Germany, 2025. Available online: https://hdl.handle.net/20.500.11811/13004 (accessed on 3 November 2026).
- Mingyou, C.; Lufeng, L.; Wei, L.; Huiling, W.; Jinhai, W.; Qinghua, L.; Shaoming, L. Orchard-wide visual perception and autonomous operation of fruit picking robots: A review. Smart Agric. 2024, 6, 20–39. [Google Scholar] [CrossRef]
- Rajendran, V.; Debnath, B.; Mghames, S.; Mandil, W.; Parsa, S.; Parsons, S.; Ghalamzan-E, A. Towards autonomous selective harvesting: A review of robot perception, robot design, motion planning and control. J. Field Robot. 2024, 41, 2247–2279. [Google Scholar] [CrossRef] [Scilit]
- Badgujar, C.M.; Poulose, A.; Gan, H. Agricultural object detection with You Only Look Once (YOLO) algorithm: A bibliometric and systematic literature review. Comput. Electron. Agric. 2024, 223, 109090. [Google Scholar] [CrossRef] [Scilit]
- Gené-Mola, J.; Sanz-Cortiella, R.; Rosell-Polo, J.R.; Gregorio, E.; Cheein, F.A. Looking behind occlusions: A review of fruit localization and pose estimation for robotic harvesting. Comput. Electron. Agric. 2021, 180, 105879. [Google Scholar] [CrossRef] [Scilit]
- Si, M.; Dai, N.; Yuan, J.; Liu, X.; Xin, Z.; Meng, X. S2CPL: A novel method of the harvest evaluation and subsoil 3D cutting-point location for selective harvesting of green asparagus. Comput. Electron. Agric. 2024, 225, 109316. [Google Scholar] [CrossRef] [Scilit]
- Terven, J.; Córdova-Esparza, D.M.; Romero-González, J.A. A comprehensive review of YOLO architectures in computer vision: From YOLOv1 to YOLOv8 and YOLO-NAS. Mach. Learn. Knowl. Extr. 2023, 5, 1680–1716. [Google Scholar] [CrossRef] [Scilit]
- Gené-Mola, J.; Ferrer-Ferrer, M.; Hemming, J.; van Dalfsen, P.; de Hoog, D.; Sanz-Cortiella, R.; Rosell-Polo, J.R.; Morros, J.; Vilaplana, V.; Ruiz-Hidalgo, J.; et al. Looking behind occlusions: A study on amodal segmentation for robust on-tree apple fruit size estimation. Comput. Electron. Agric. 2023, 209, 107854. [Google Scholar] [CrossRef] [Scilit]
- Zhao, G.; Zhang, H.; Sun, J.; Yang, H.; Wang, S.; Liu, S.; Cao, X.; Fu, S.; Wang, Y.; Sun, L.; et al. Curvature sensing strategy for flexible gripper fingers during grasping deformation: Enabling in-orchard online apple size grading. Comput. Electron. Agric. 2025, 239, 111129. [Google Scholar] [CrossRef] [Scilit]
- Bac, C.W.; van Henten, E.J.; Hemming, J.; Edan, Y. Harvesting robots for high-value crops: State-of-the-art review and challenges ahead. J. Field Robot. 2014, 31, 888–911. [Google Scholar] [CrossRef] [Scilit]
- Kang, S.; Long, S.; Li, D.; Fan, J.; Du, D.; Wang, J. Design, integration, and field evaluation of a selective harvesting robot for broccoli. Comput. Electron. Agric. 2024, 227, 109654. [Google Scholar] [CrossRef] [Scilit]
- Lian, J.; Pan, Q.; Wang, D. A two-stage recognition and planning approach for grasping manipulators and design of end-effectors. J. Field Robot. 2026, 43, 230–256. [Google Scholar] [CrossRef] [Scilit]
- Riazati, E.; Hajizadeh, A.; Esmaeilzadeh, S.M. Design and implementation of a modular ROS-based mobile robot with hierarchical control. In Proceedings of the 2025 33rd International Conference on Electrical Engineering (ICEE); IEEE: Piscataway, NJ, USA, 2025; pp. 1038–1043. [Google Scholar]
- Arad, B.; Balendonck, J.; Barth, R.; Ben-Shahar, O.; Edan, Y.; Hellström, T.; Hemming, J.; Kurtser, P.; Ringdahl, O.; Tielen, T.; et al. Development of a sweet pepper harvesting robot. J. Field Robot. 2020, 37, 1027–1039. [Google Scholar] [CrossRef] [Scilit]
- Lenz, C.; Menon, R.; Schreiber, M.; Jacob, M.P.; Behnke, S.; Bennewitz, M. HortiBot: An adaptive multi-arm system for robotic horticulture of sweet peppers. In 2024 IEEE/RSJ International Conference on Intelligent Robots and Systems (IROS); IEEE: Piscataway, NJ, USA, 2024; pp. 31–38. [Google Scholar] [CrossRef] [Scilit]
- Roy, S.; Parmar, A.; Aggarwal, R.; Kalafatis, S.; Yadav, P.K. Harvest-Bot: Precision harvesting of pepper (Capsicum annuum L.) varieties in a greenhouse. SPIE 2025. [Google Scholar] [CrossRef] [Scilit]
- Bechar, A.; Vigneault, C. Agricultural robots for field operations. Part 2: Operations and systems. Biosyst. Eng. 2017, 153, 110–128. [Google Scholar] [CrossRef] [Scilit]
- Shamshiri, R.R.; Weltzien, C.; Hameed, I.A.; Yule, I.J.; Grift, T.E.; Balasundram, S.K.; Pitonakova, L.; Ahmad, D.; Chowdhary, G. Research and development in agricultural robotics: A perspective of digital farming. Int. J. Agric. Biol. Eng. 2018, 11, 1–14. [Google Scholar] [CrossRef]
- Wang, Z.; Jin, L.; Wang, S.; Xu, H. Apple stem/calyx real-time recognition using YOLOv5 algorithm for fruit picking robots. Comput. Electron. Agric. 2022, 198, 107087. [Google Scholar] [CrossRef] [Scilit]
- Li, Y.; Fan, Q.; Huang, H.; Zhou, Z.; Wu, J. A lightweight YOLOv8 model for apple leaf disease detection on mobile devices. Front. Plant Sci. 2023, 14, 1258786. [Google Scholar] [CrossRef] [Scilit]
- Pena, D.; Forembski, A.; Xu, X.; Moloney, D. Benchmarking of lightweight deep learning models on Raspberry Pi and Nvidia Jetson for real-time object detection. Sensors 2022, 22, 6676. [Google Scholar] [CrossRef] [Scilit]
- Cubero, S.; Aleixos, N.; Albert, F.; Torregrosa, A.; Ortiz, C.; Blasco, J. AgriCruiser: An open-source, low-cost field robot for precision agriculture. HardwareX 2025, 19, e00576. [Google Scholar] [CrossRef]
- Dal, S.; Özcan, M.O.; Beyaz, A. Development of a low-cost ground robot for real-time ArUco marker localization using lightweight deep learning models on edge devices. Smart Agric. Technol. 2025, 10, 100869. [Google Scholar] [CrossRef] [Scilit]
- Feng, X.; Jiang, Y.; Yang, X.; Du, M.; Li, X. Computer vision algorithms and hardware implementations: A survey. Integration 2019, 69, 309–320. [Google Scholar] [CrossRef] [Scilit]
- Rehman, A.; Popescu, M.; Ma, L. Vision-based robotic harvesting systems: A comprehensive review of perception, grasping, and system integration. Smart Agric. Technol. 2025, 10, 100935. [Google Scholar] [CrossRef] [Scilit]
- Hu, C.; Liu, D.; Ji, J.; Zheng, S.; Li, Y.; Li, J. Design and simulation of an underactuated end-effector for low-damage sweet pepper harvesting. INMATEH-Agric. Eng. 2025, 77, 502. [Google Scholar] [CrossRef] [Scilit]
- Hui, Y.; Liao, Y.; Wang, D.; Li, X.; Lu, Z.; You, Y.; Jia, H. Design and experiment of an end-effector for harvesting sweet pepper in compliant obstacle environment. INMATEH-Agric. Eng. 2023, 71, 271. [Google Scholar] [CrossRef] [Scilit]
- Chaumette, F.; Hutchinson, S.; Corke, P. Visual servoing. In Springer Handbook of Robotics; Siciliano, B., Khatib, O., Eds.; Springer International Publishing: Cham, Switzerland, 2016; pp. 841–866. [Google Scholar] [CrossRef] [Scilit]
- Gammell, J.D.; Barfoot, T.D.; Srinivasa, S.S. Batch Informed Trees (BIT*): Informed asymptotically optimal anytime search. Int. J. Robot. Res. 2020, 39, 543–567. [Google Scholar] [CrossRef] [Scilit]
- Shorten, C.; Khoshgoftaar, T.M. A survey on image data augmentation for deep learning. J. Big Data 2019, 6, 60. [Google Scholar] [CrossRef] [Scilit]
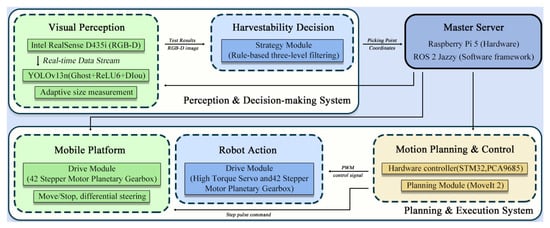
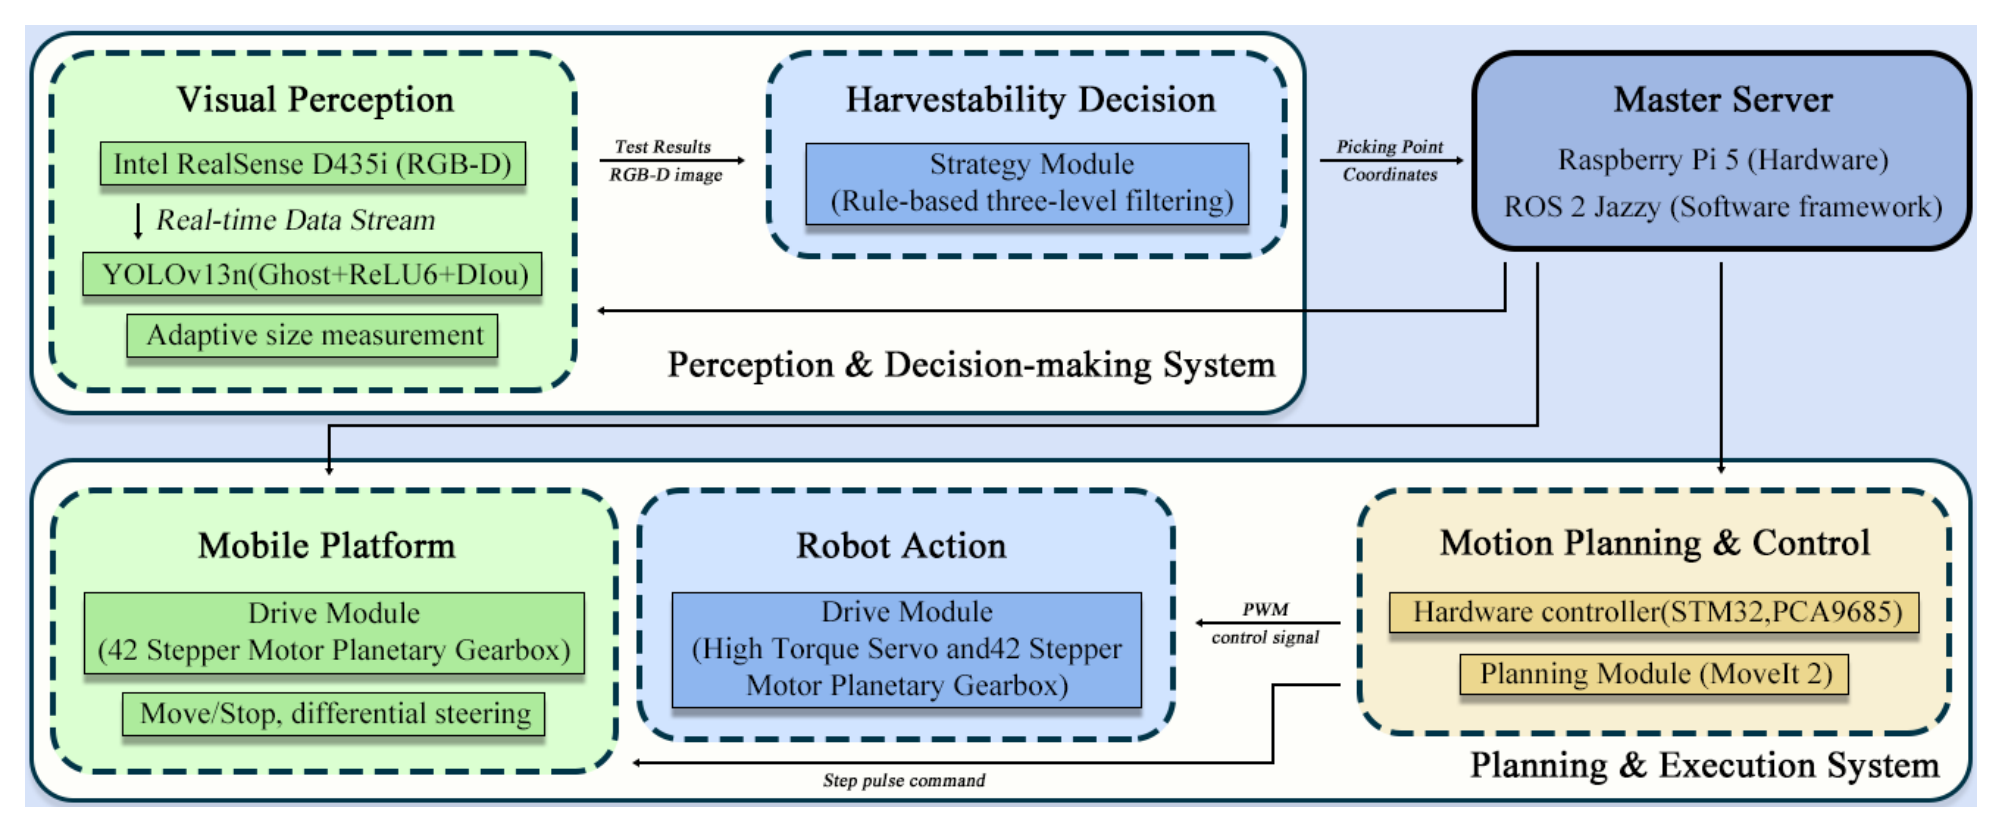
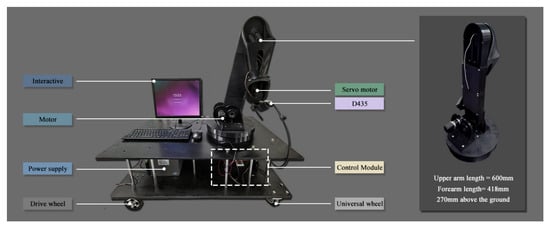
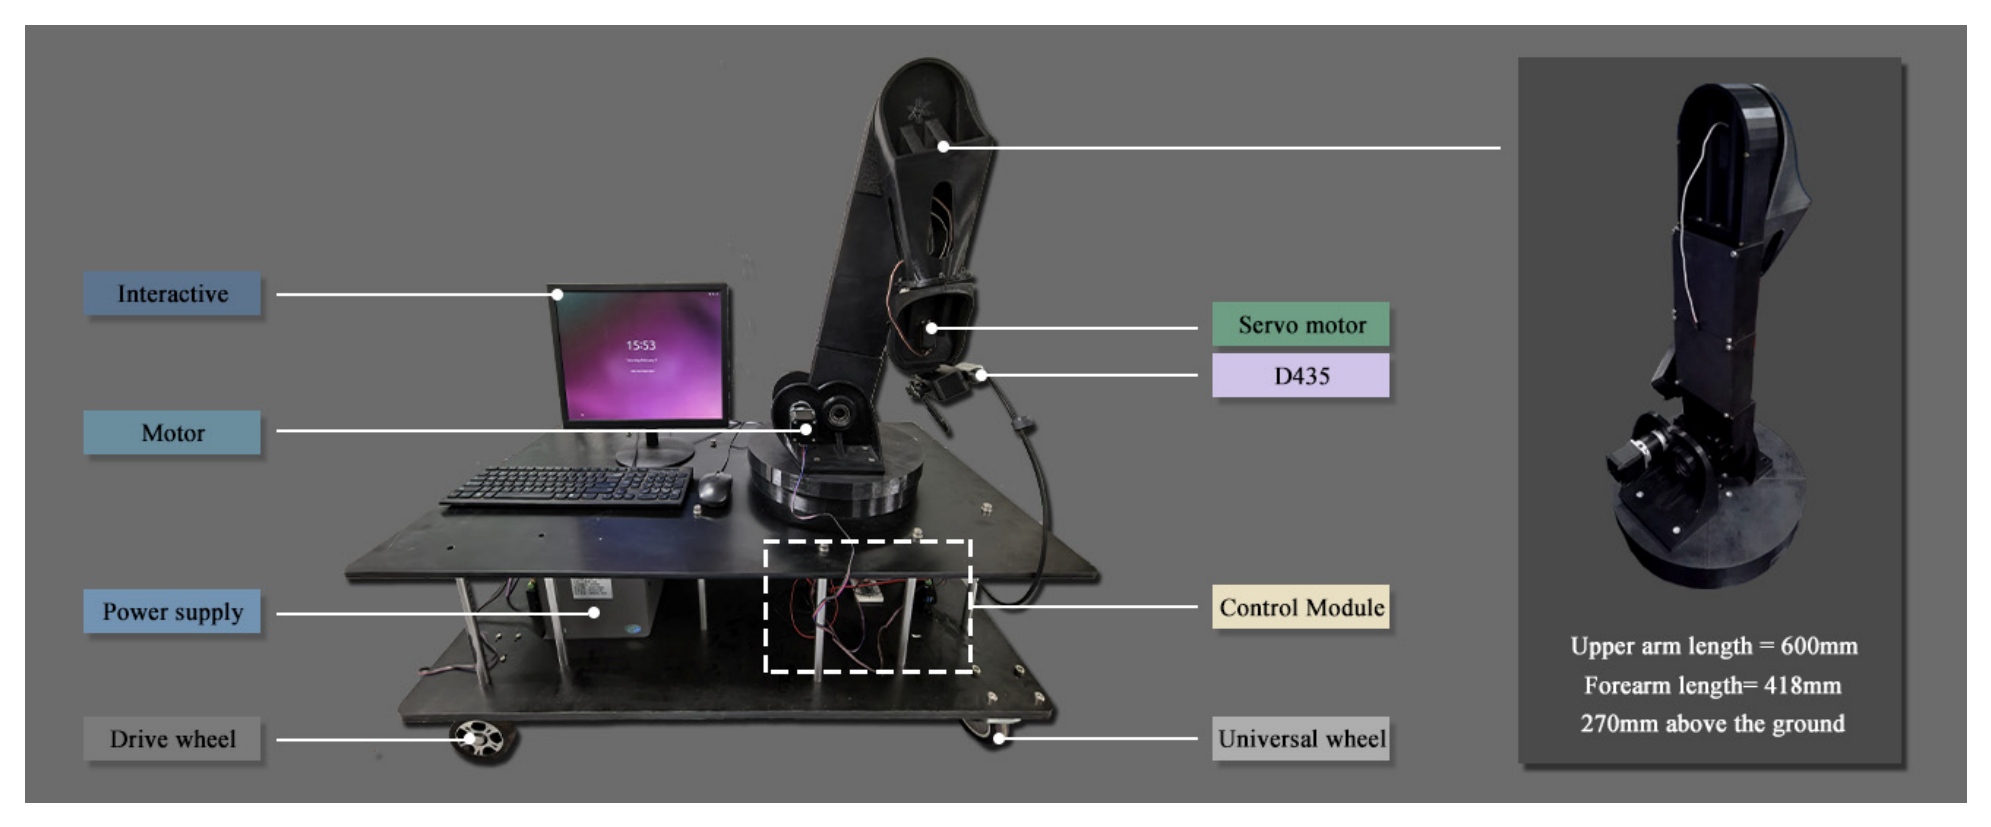
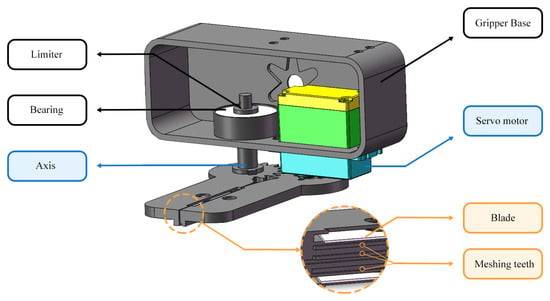
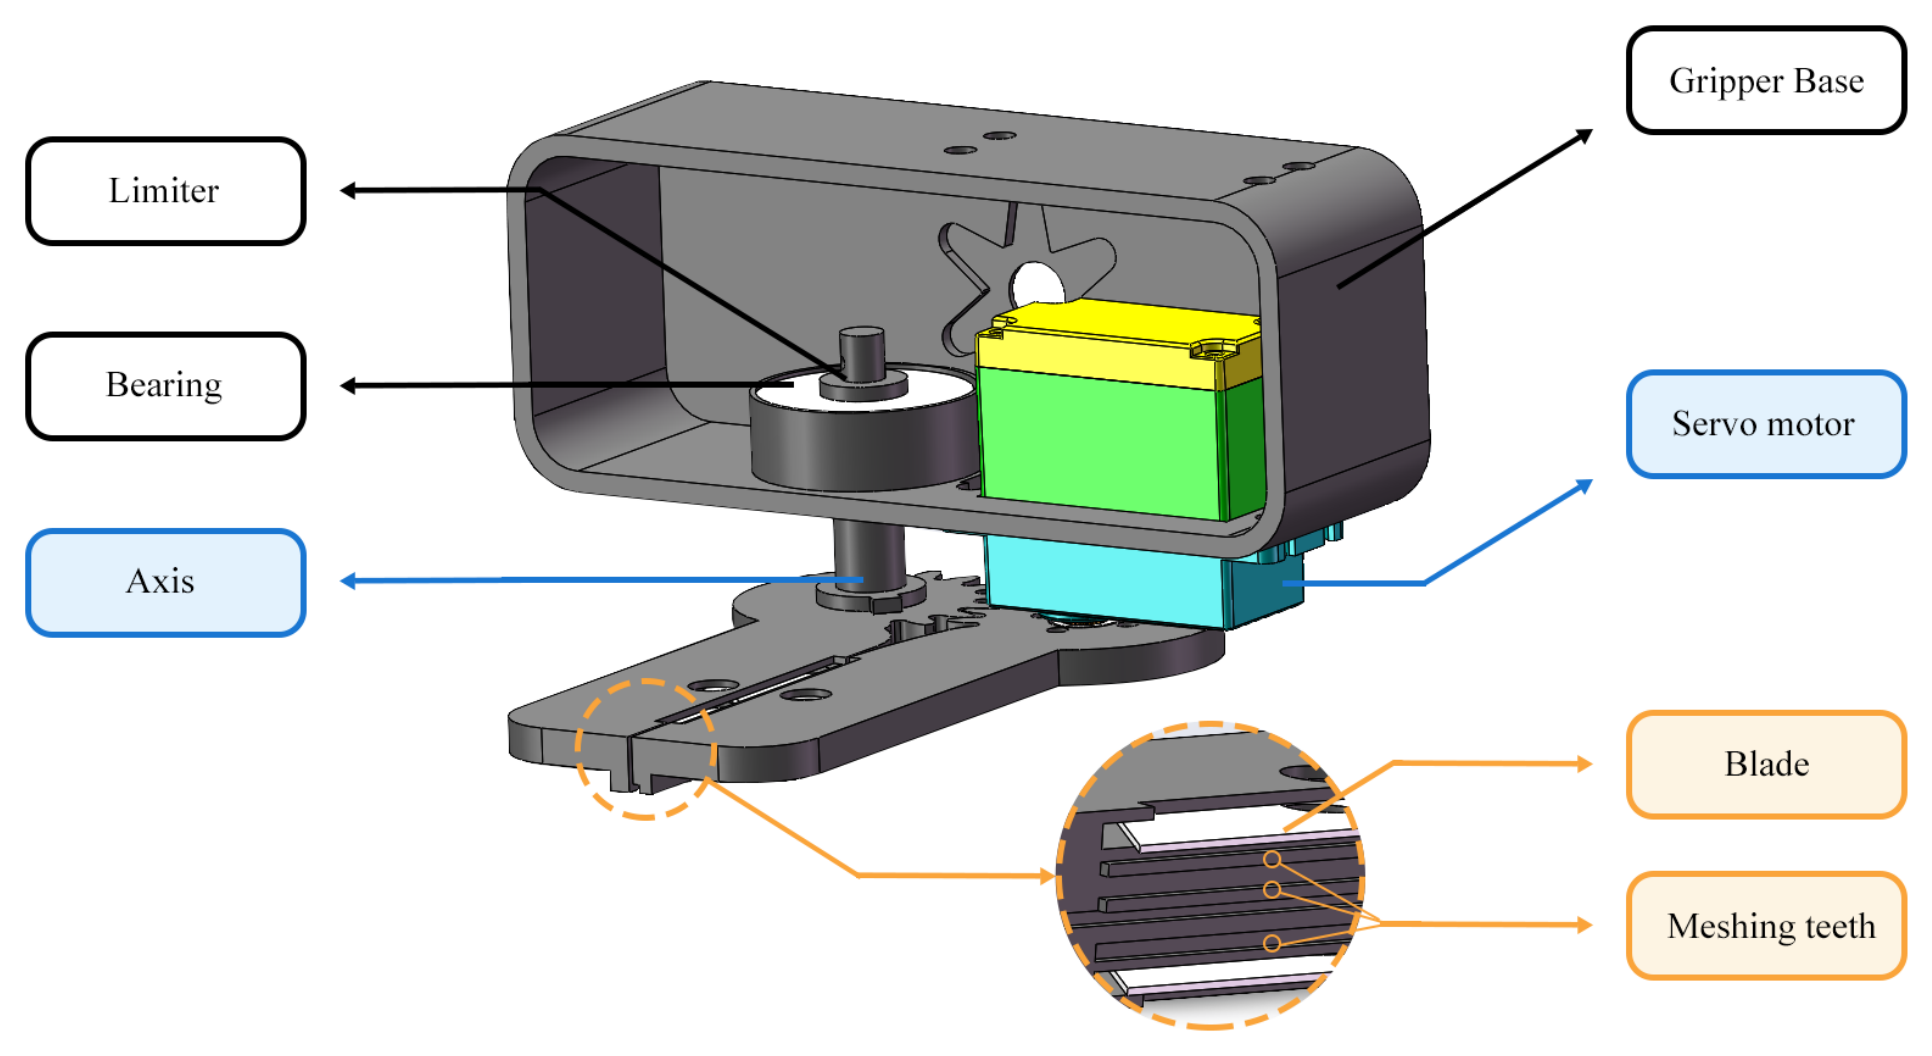
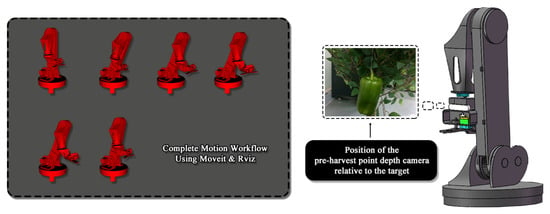
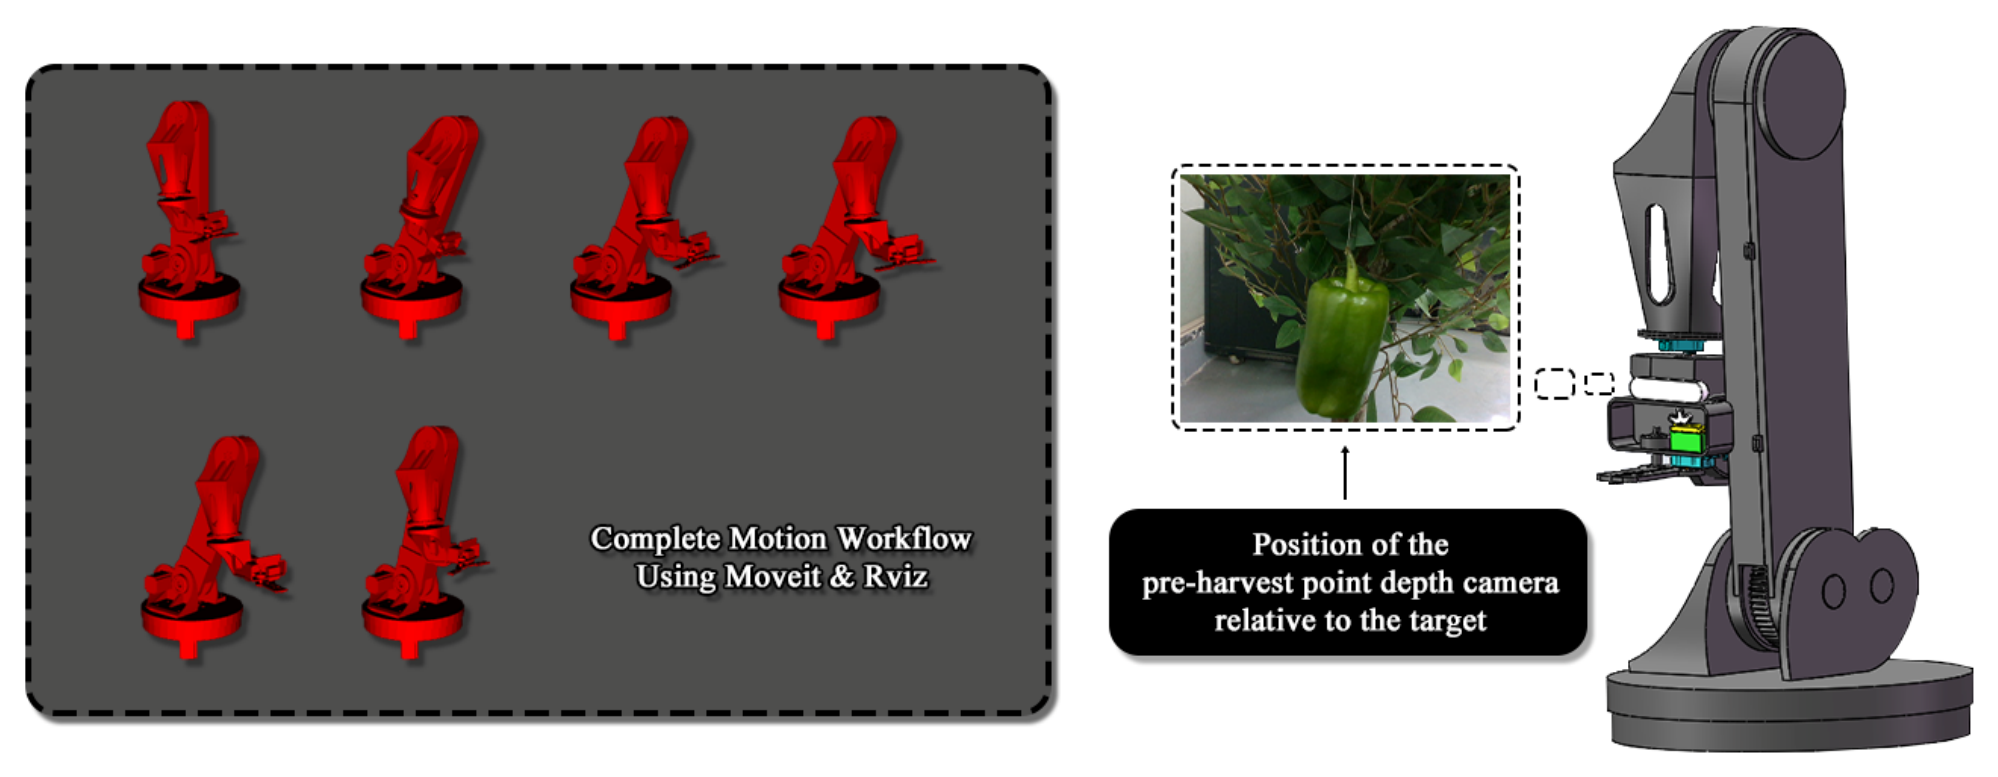
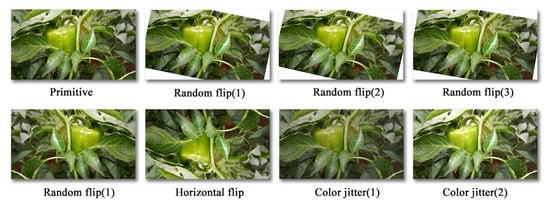
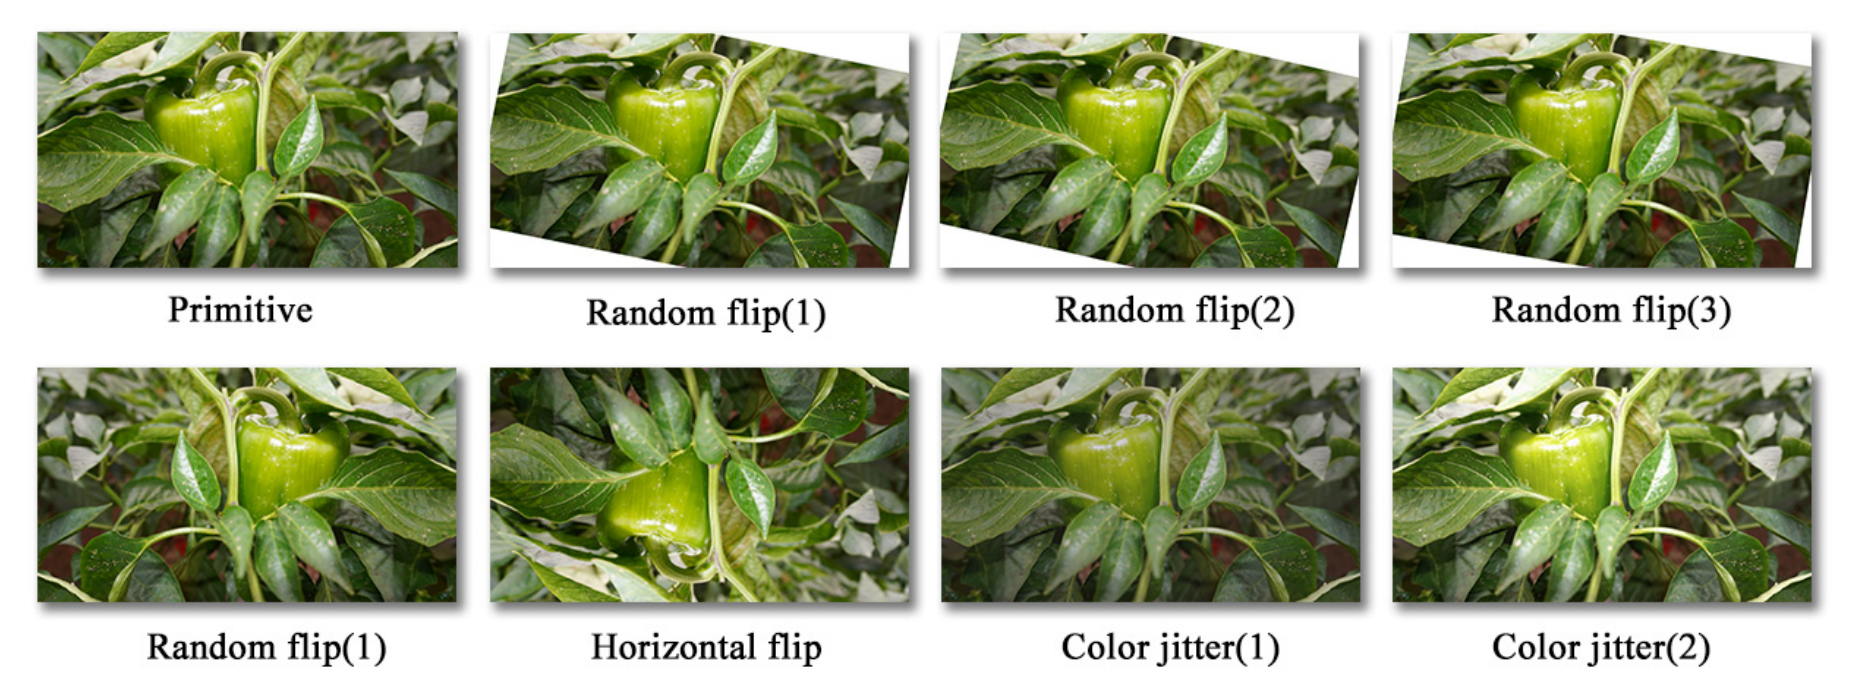
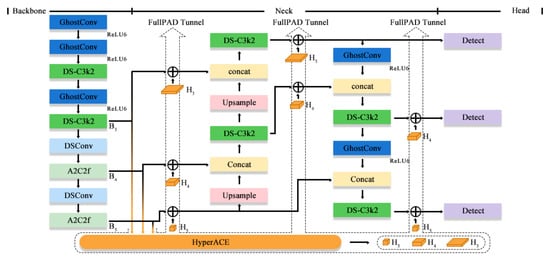
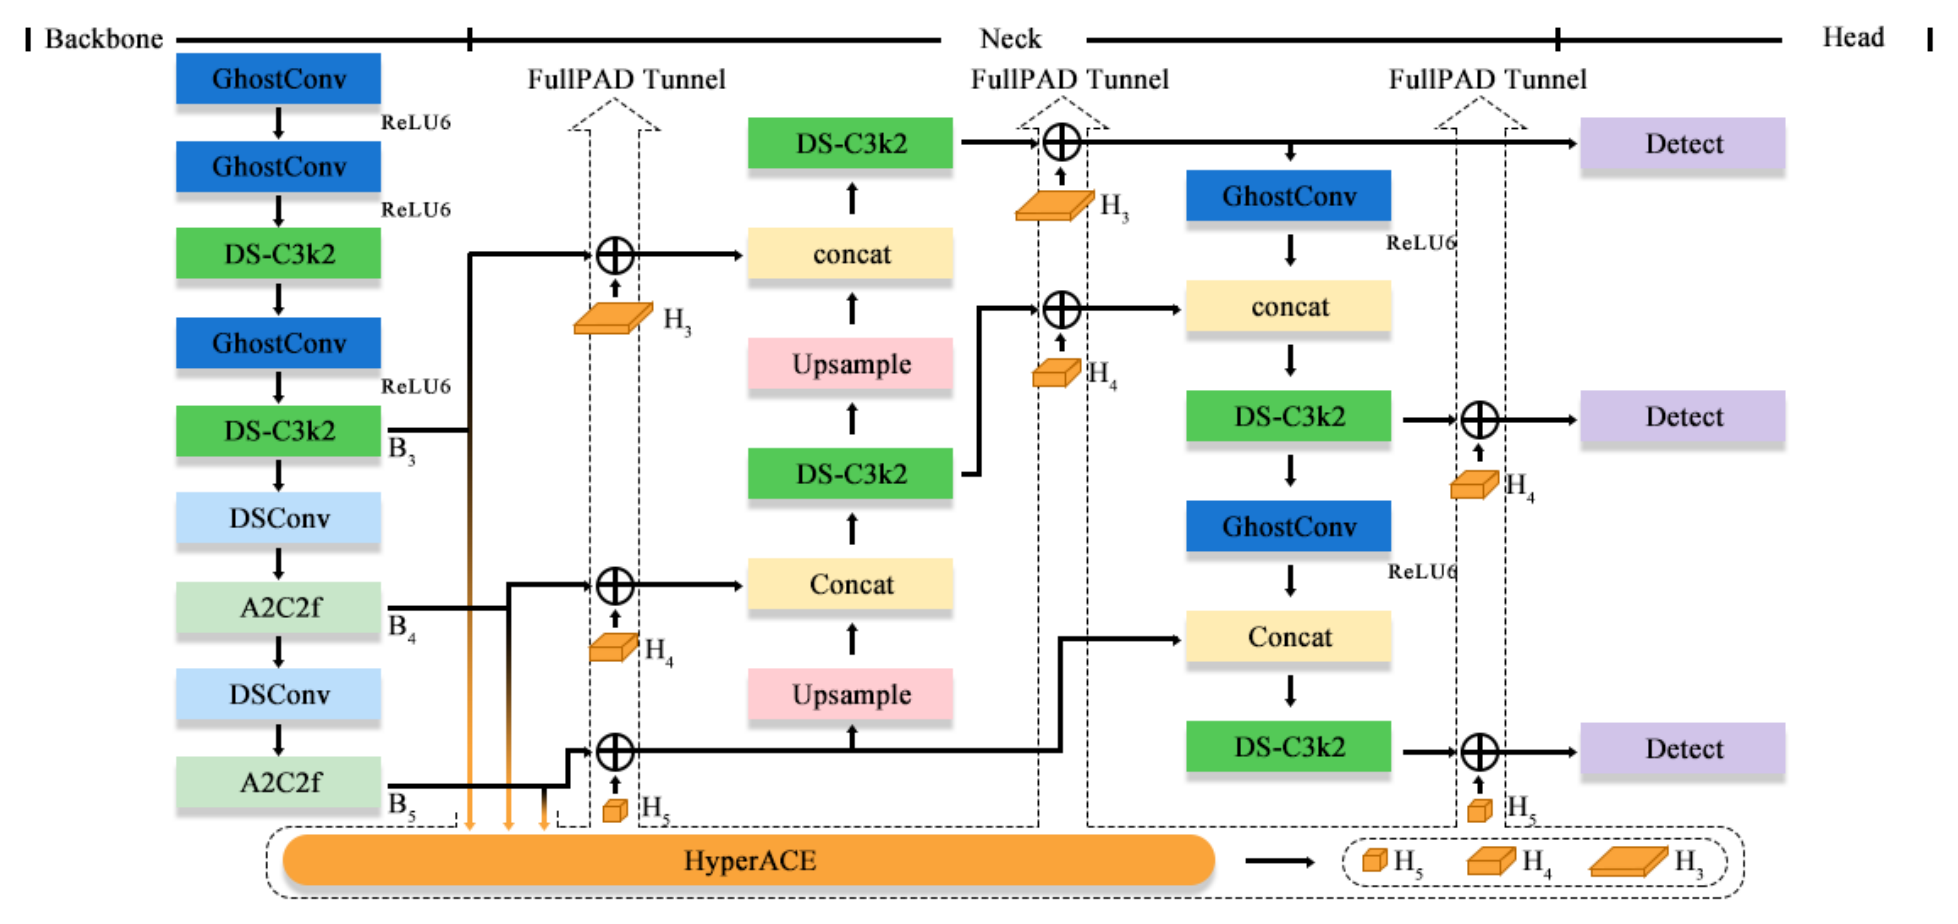
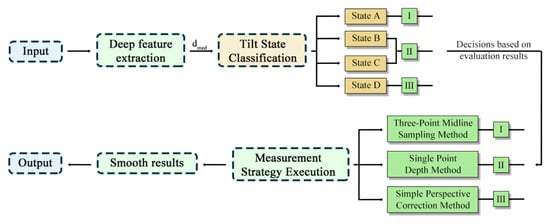
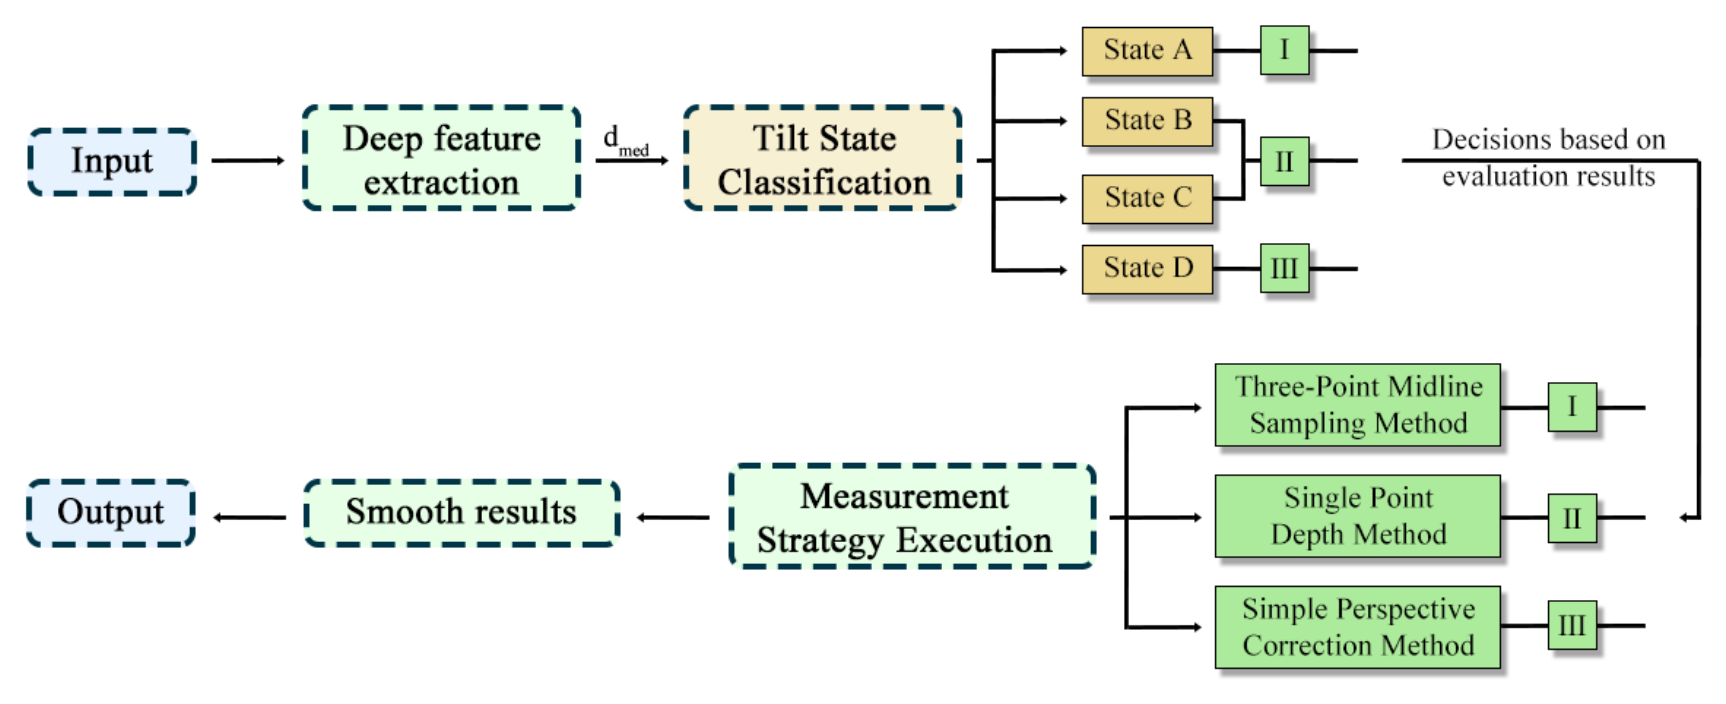
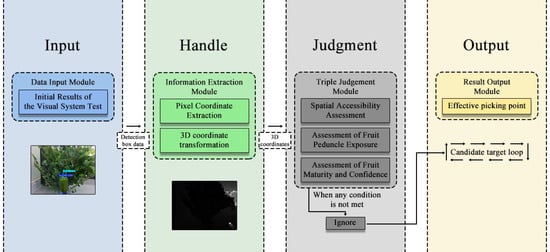
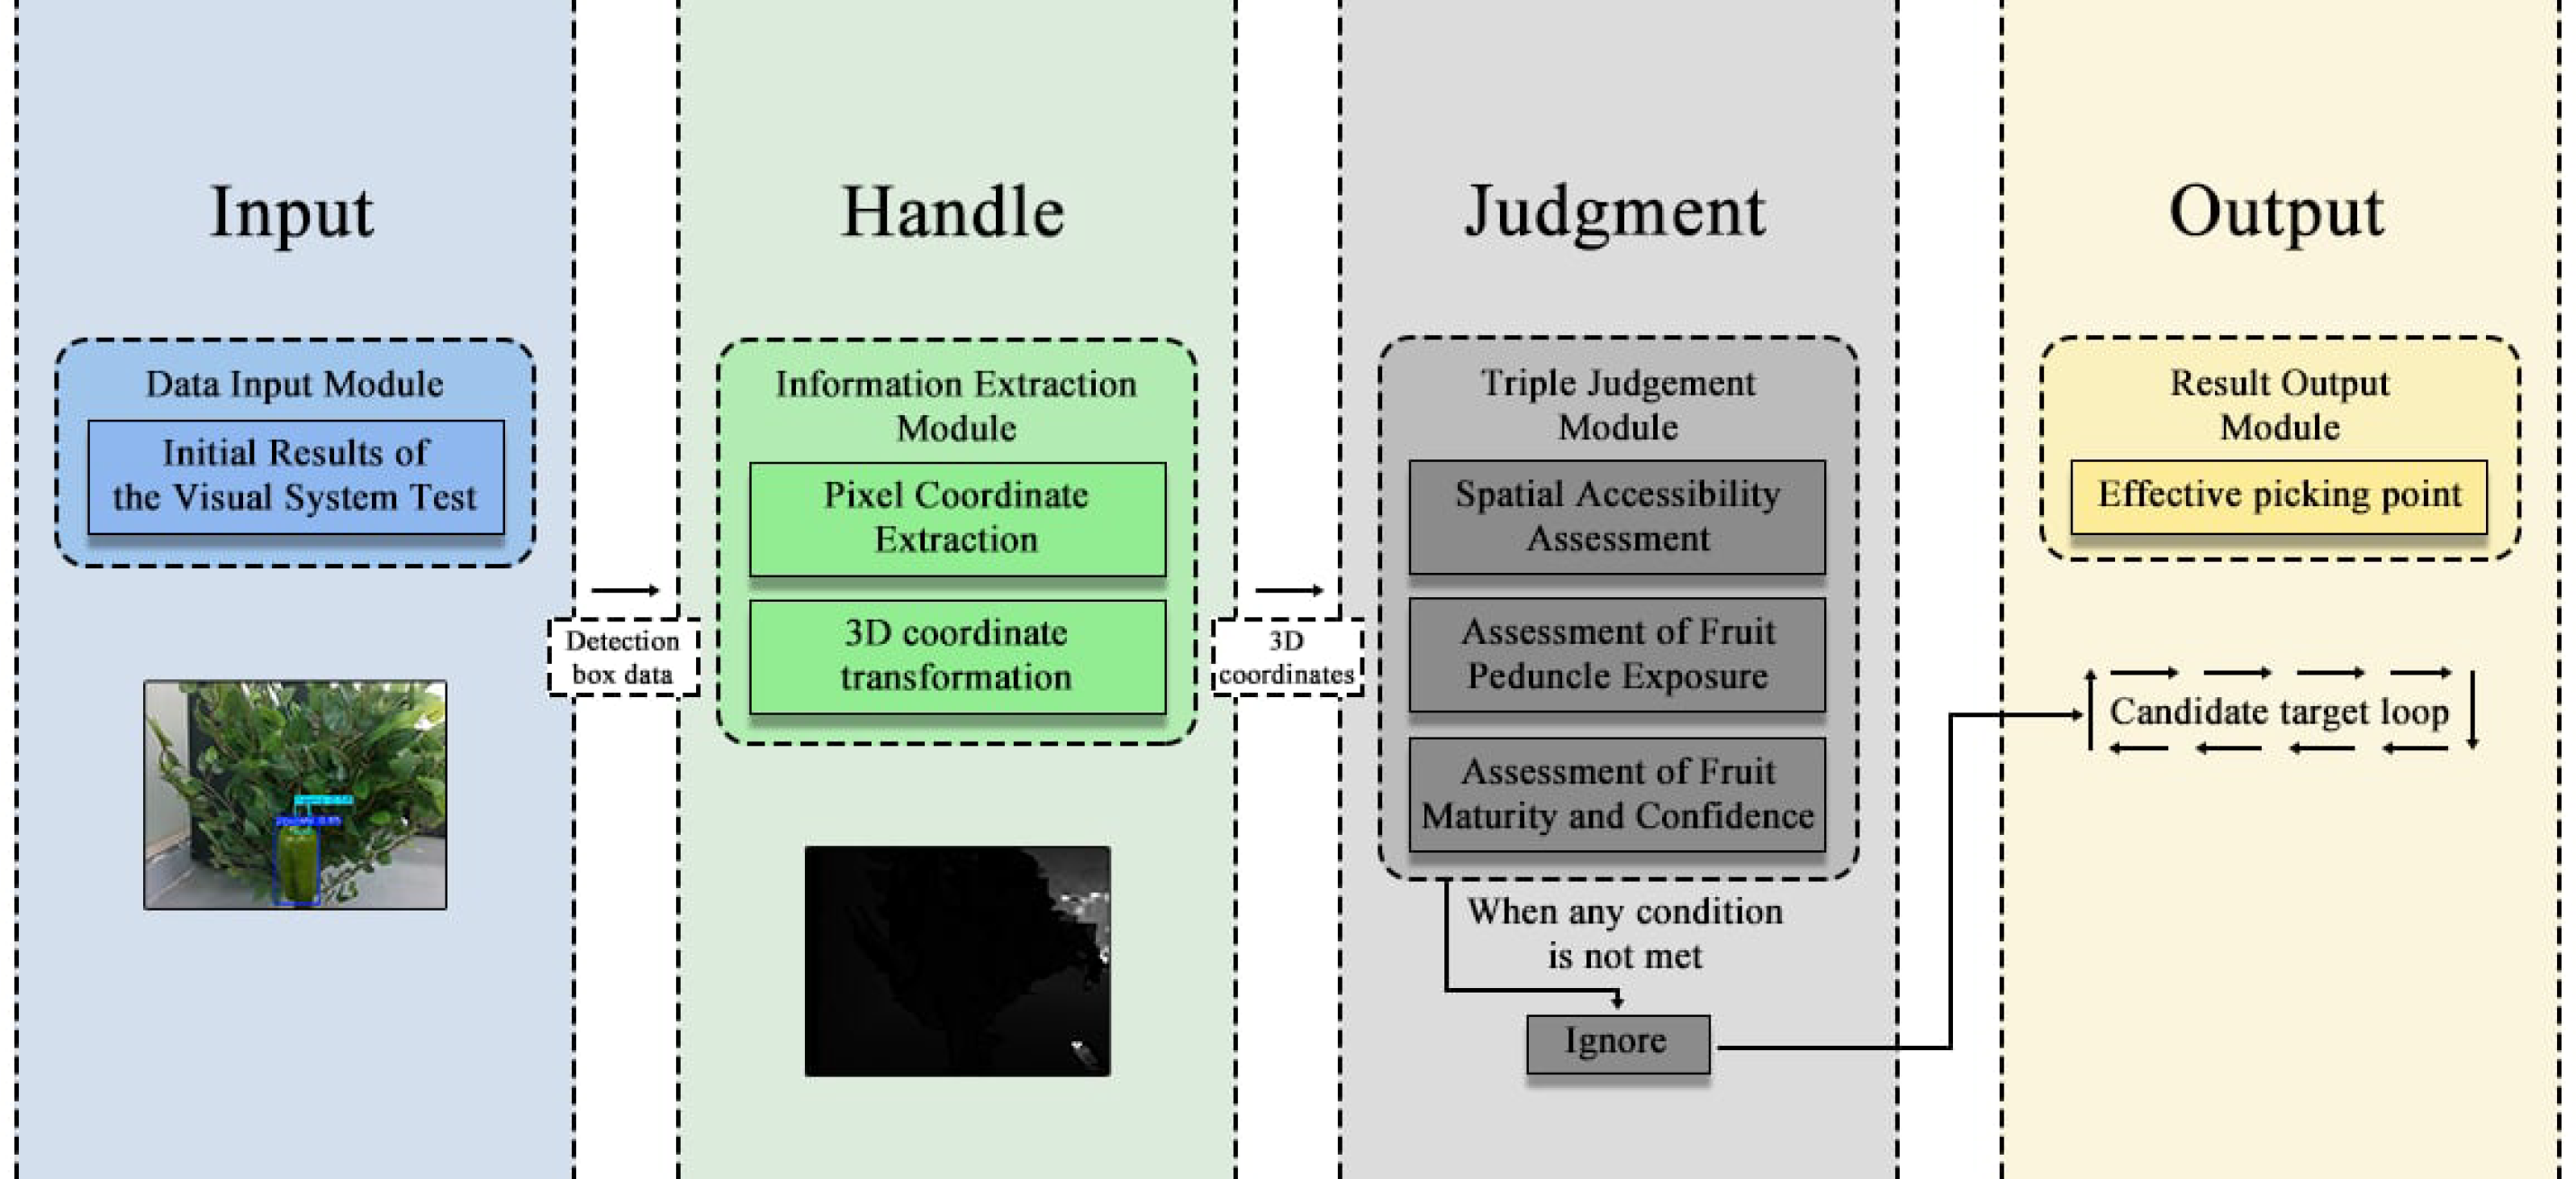
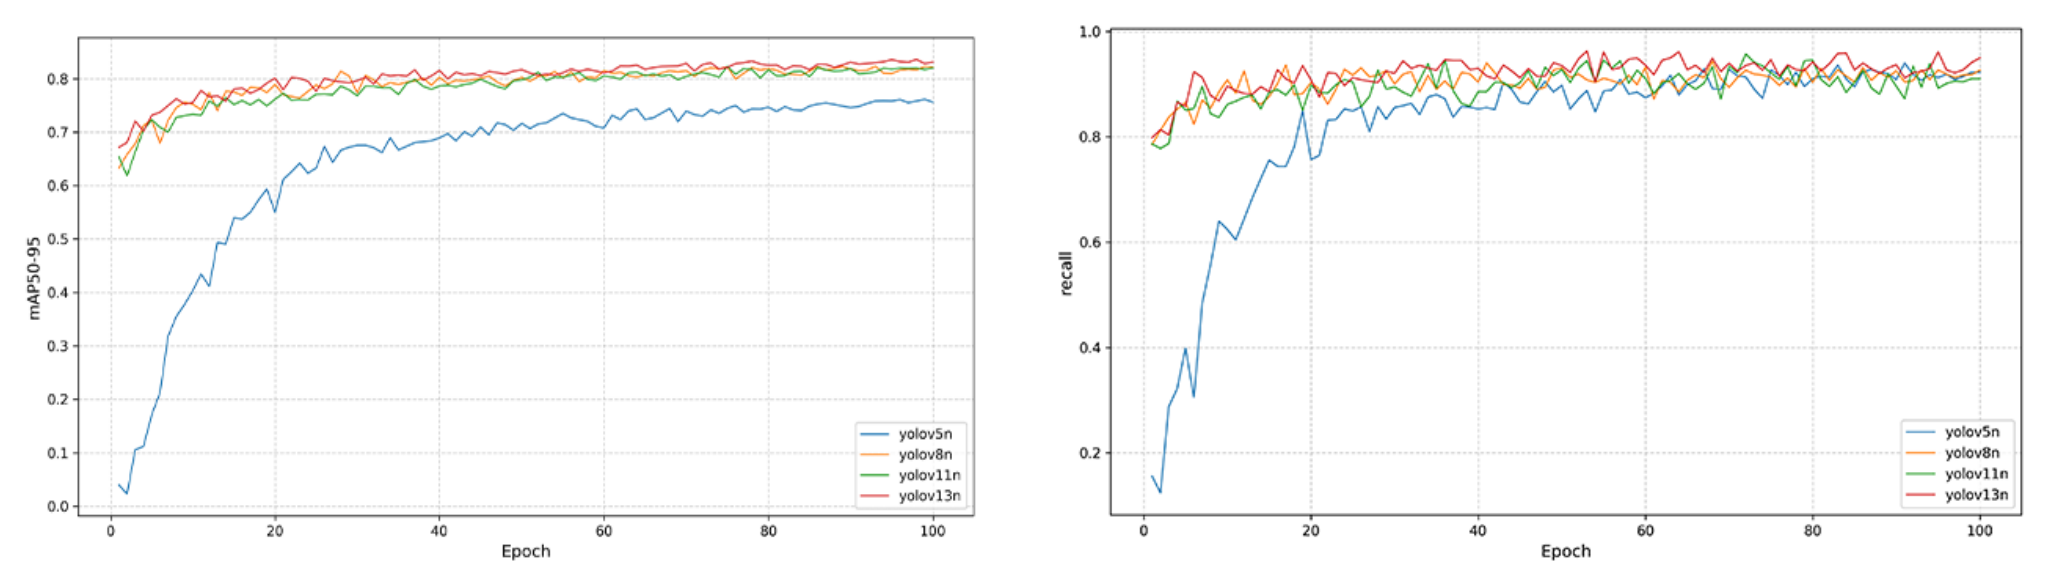
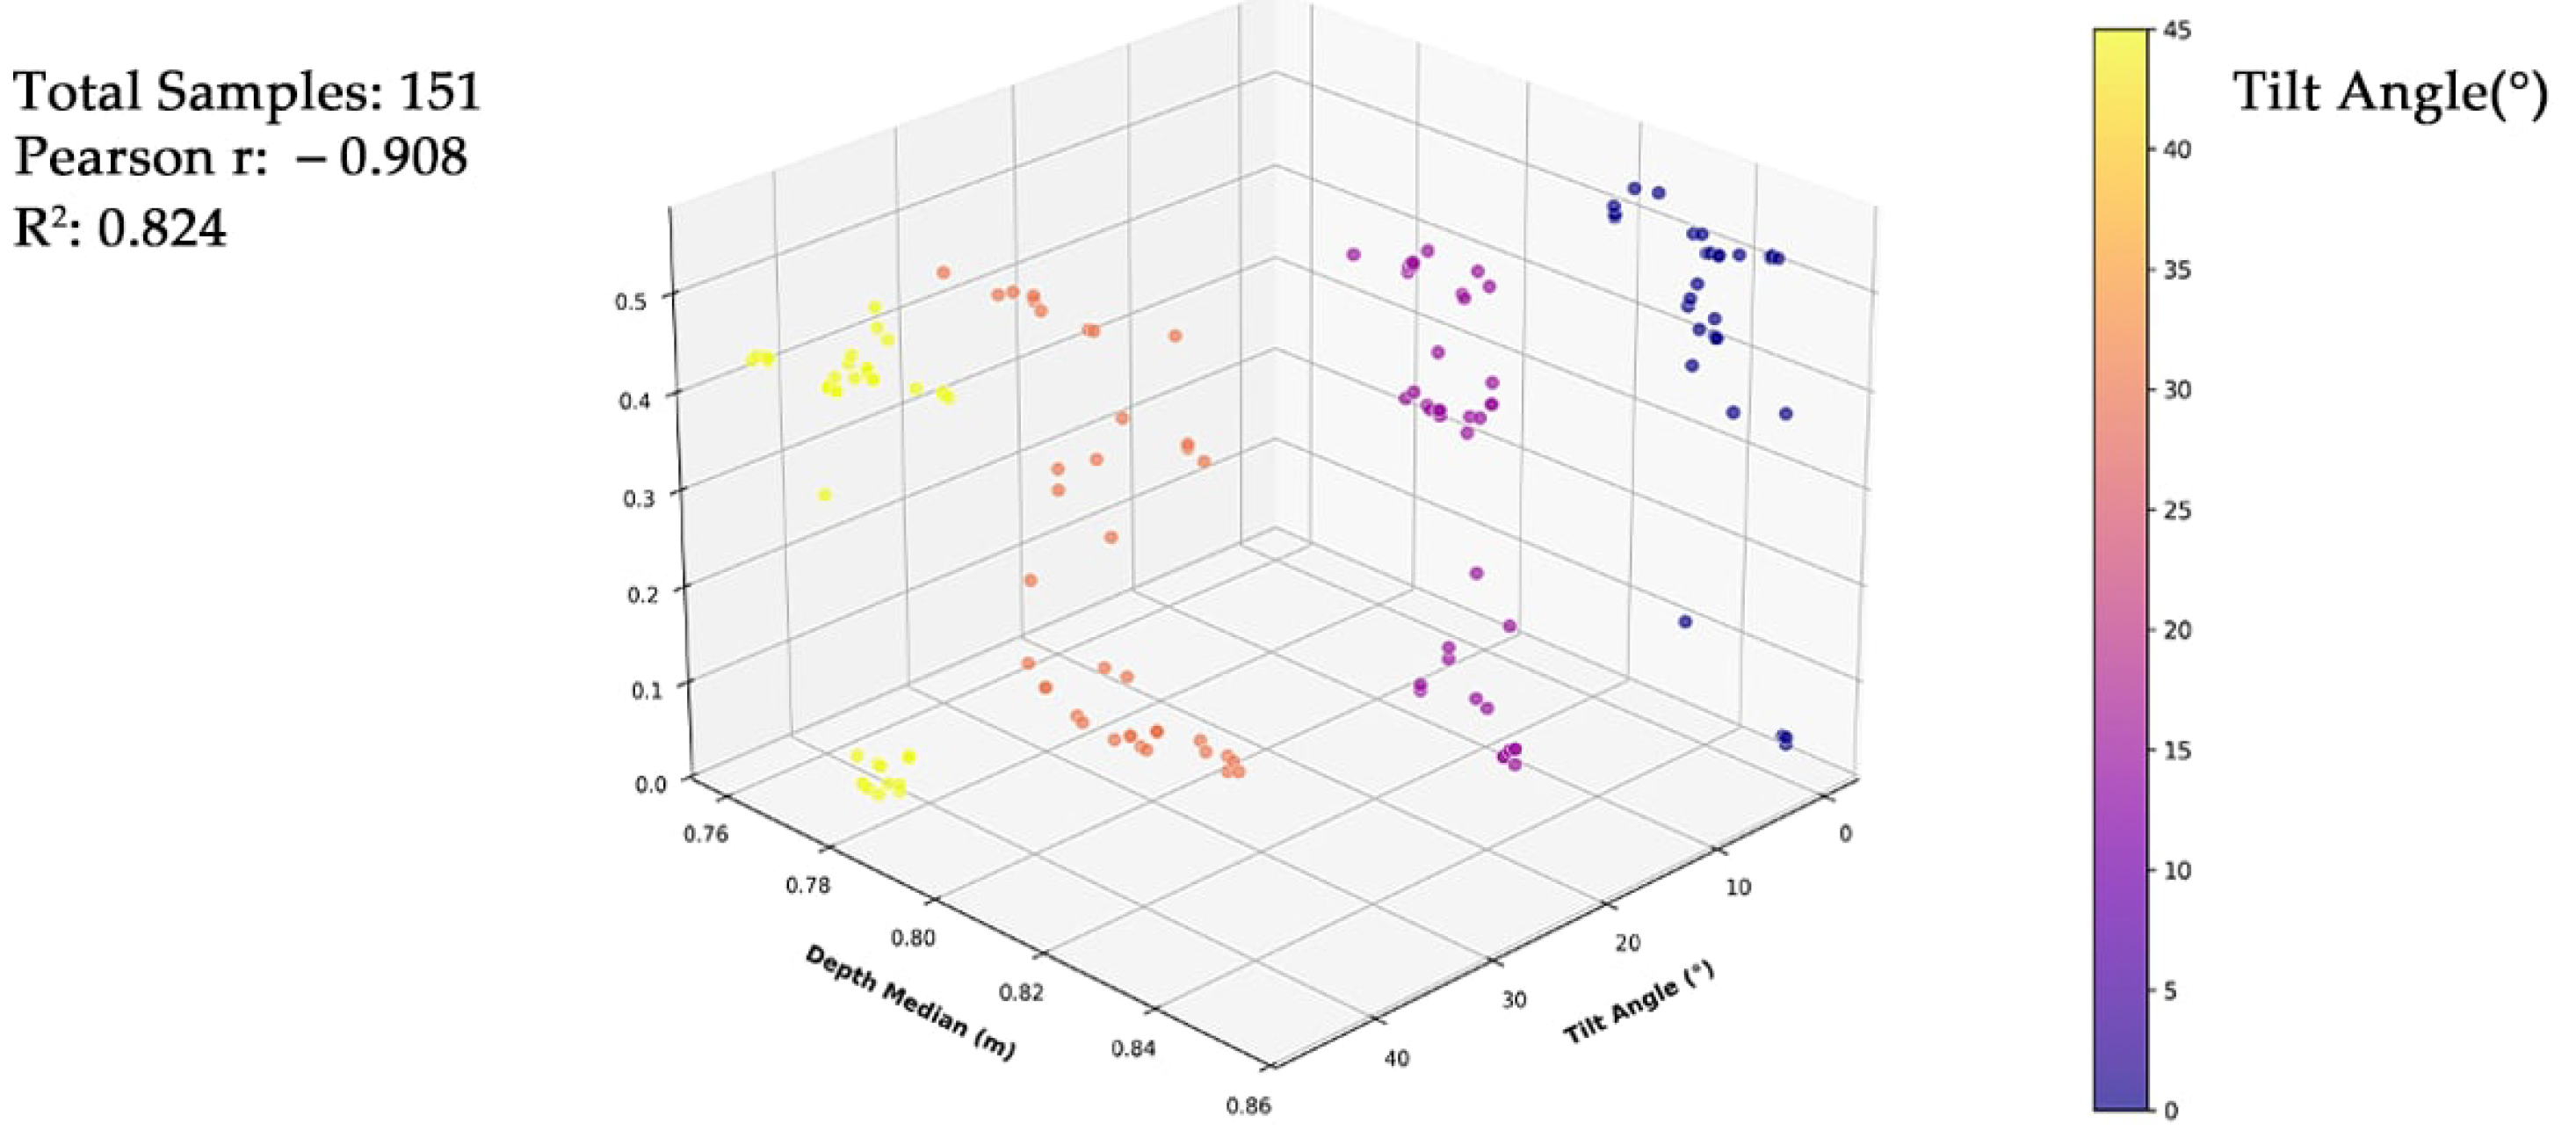
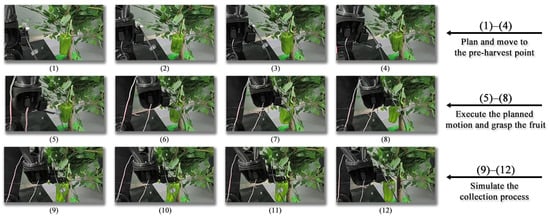
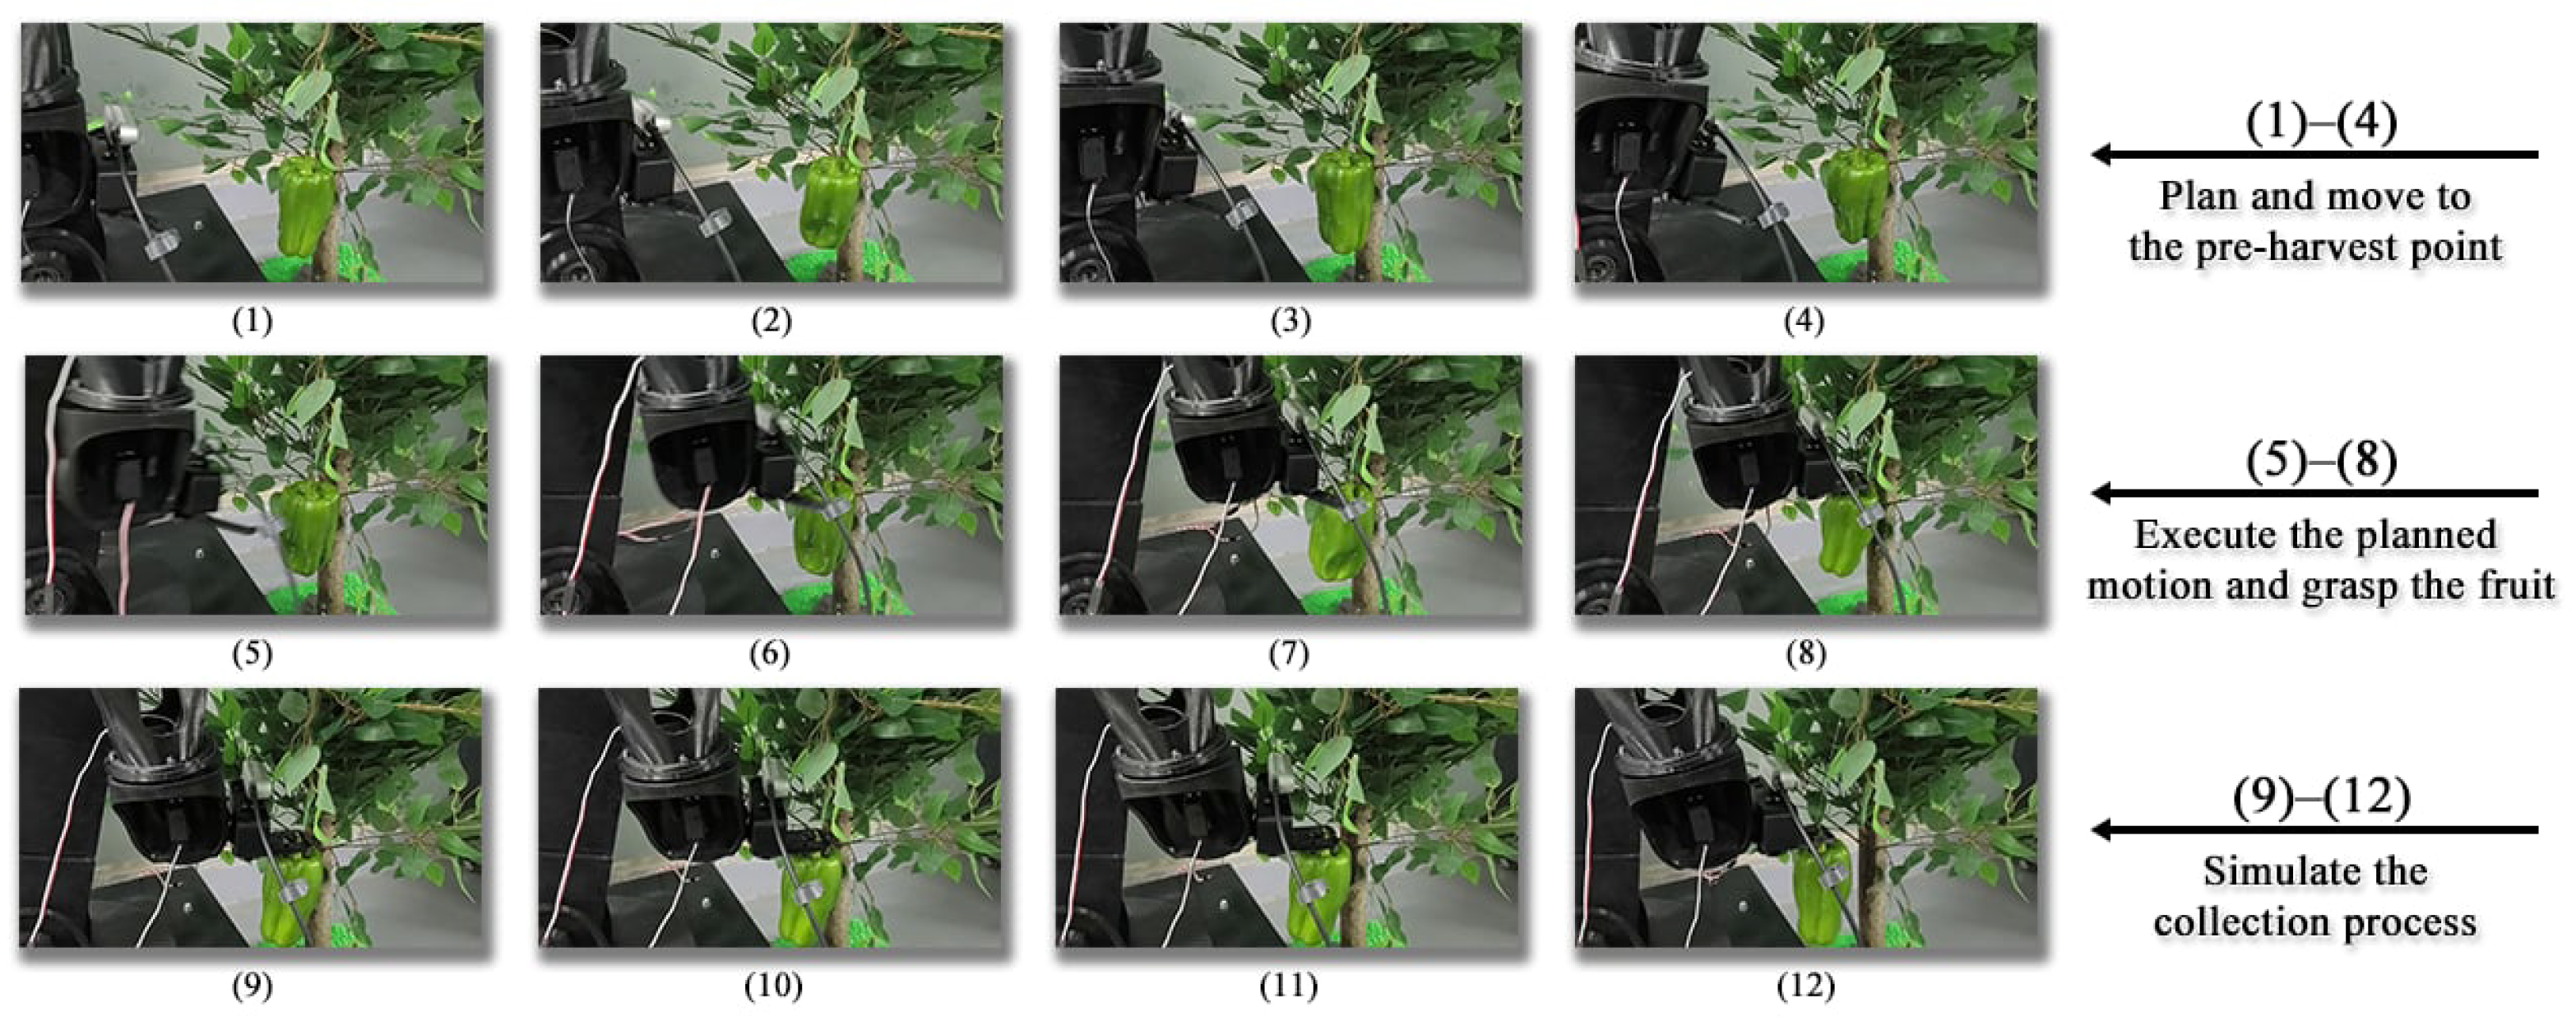

Disclaimer/Publisher’s Note: The statements, opinions and data contained in all publications are solely those of the individual author(s) and contributor(s) and not of MDPI and/or the editor(s). MDPI and/or the editor(s) disclaim responsibility for any injury to people or property resulting from any ideas, methods, instructions or products referred to in the content. |
© 2026 by the authors. Licensee MDPI, Basel, Switzerland. This article is an open access article distributed under the terms and conditions of the Creative Commons Attribution (CC BY) license.