


Abstract
Fine-grained cotton detection is challenging because targets at different developmental stages exhibit substantial variations in scale and morphology, while visually similar categories, partial occlusion, and complex field backgrounds further increase recognition difficulty. To address these issues, this study proposes WINGS-Det, a lightweight object detector that coordinates spatial, scale, and frequency-aware feature modeling within a unified architecture. Built on YOLO26n, WINGS-Det incorporates three complementary components. C3k2LGL combines large-kernel local aggregation with sparse global self-attention to capture local structures and long-range spatial dependencies. SCMIFF performs selective cross-scale interaction between hierarchical features to strengthen the fusion of spatial details and semantic information. C2WSA introduces wave-aware frequency modeling to preserve global structural information while enhancing high-frequency boundary and texture cues. A four-category cotton dataset containing 13,771 images and 27,352 annotated instances was constructed for evaluation. WINGS-Det achieves 98.6% Precision, 98.2% Recall, 98.9% mAP50, and 75.7% mAP50:95 with only 2.38 M parameters and 5.3 GFLOPs, while achieving 163 FPS on an RTX 4090 with native PyTorch FP32 inference. On the newly constructed four-category cotton dataset, WINGS-Det improves mAP50 and mAP50:95 over the YOLO26n baseline by 4.7 and 3.8 percentage points, respectively. Extensive evaluations across target scales, object densities, image perturbations, network architectures, hardware platforms, and external datasets further demonstrate the robustness, transferability, and generalization capability of WINGS-Det. The results indicate that the proposed framework achieves an effective balance between fine-grained detection accuracy, computational efficiency, and practical deployment.
1. Introduction
1.1. Background and Agricultural Significance
Cotton is an important economic crop and a major source of natural fiber. Its reproductive growth status is closely associated with yield assessment, field management, and harvest decision-making [1]. Accurate localization and recognition of flowers and bolls at different developmental stages provide valuable information for monitoring flowering progress, evaluating boll maturity, estimating yield, and determining appropriate harvesting periods.
Conventional assessment of cotton growth status largely relies on manual field inspection, which is labor-intensive and difficult to scale across large production areas [2]. Its efficiency and consistency are also affected by plant density, field coverage, and subjective observation. With the increasing use of unmanned aerial vehicles, agricultural robots, and field-based imaging platforms, image-based object detection provides an effective approach for automated and large-scale acquisition of cotton growth information [3,4,5]. Lightweight attention-based detection has also been investigated for cotton leaf diseases, extending the application of deep visual monitoring in cotton cultivation [6]. Residual learning with squeeze-and-excitation and region-focused convolution has also been applied to plant disease classification, emphasizing disease-relevant visual features [7]. Recent multi-source UAV studies in greenhouse phenotyping further show that lightweight detectors can support automated crop-stage monitoring under small-target, partial-occlusion, and background-clutter conditions [8,9].
Cotton flowers and bolls undergo substantial changes in scale, morphology, and appearance throughout their developmental stages [10]. Complex vegetation backgrounds further increase visual ambiguity among different boll states in field environments [11]. Cotton detection therefore requires both accurate localization and discriminative representation of development-related characteristics. Accurate, robust, and computationally efficient detection is essential for large-scale crop monitoring and intelligent agricultural systems.
1.2. Challenges in Fine-Grained Cotton Detection
Fine-grained cotton detection involves three closely related representation challenges. First, fine-grained visual ambiguity exists among cotton categories. Flowers, partially opened bolls, fully opened bolls, and defective bolls exhibit considerable morphological variation across developmental stages, while partially opened and defective bolls often share similar colors, contours, and local textures [12,13,14,15]. The resulting combination of large intra-class variation and small inter-class differences complicates the learning of stable and discriminative category representations [16,17].
Second, cotton-field images exhibit pronounced scale variation and background interference. Cotton targets at different developmental stages occupy substantially different spatial extents, while leaves, branches, and surrounding vegetation introduce strong visual interference [18]. Small and partially occluded targets provide even less local visual evidence, increasing the importance of complementary spatial and semantic information across feature hierarchies [19].
Third, cotton-state recognition depends on the joint representation of global morphology and local details. Overall shape and spatial structure provide low-frequency semantic information, whereas boll boundaries, opening regions, and surface textures contain high-frequency cues that distinguish visually similar states [20]. Repeated downsampling and high-level semantic abstraction can weaken these fine-grained cues and reduce category discrimination. Related maturity-aware orchard studies indicate that super-resolution enhancement can recover fine-grained spatial information and improve recognition of visually similar developmental states [21,22]. Frequency decomposition combined with attention is also studied in wavelet-based wind-power forecasting [23].
Fine-grained cotton detection therefore requires effective preservation of local discriminative details, long-range spatial modeling, and multi-scale feature interaction.
1.3. Existing Methods and Research Gap
Deep learning-based object detectors have been widely adopted for automated visual perception [24]. Transfer-learning CNNs combining spatial and temporal features have also been studied for abnormal-activity recognition in video surveillance [25]. Two-stage detectors provide strong feature representations, whereas one-stage detectors offer a favorable balance between detection accuracy and inference efficiency, making them well suited to real-time field monitoring [26,27]. In cotton-specific detection, lightweight dual-backbone architectures combined with focused self-attention have been explored to enhance fine-grained feature extraction and recognition across different maturity stages [28]. More broadly, advances in object detection have focused on enlarging receptive fields, strengthening multi-scale feature fusion, and introducing attention mechanisms to improve object representation in complex scenes [29,30,31]. Related studies have demonstrated that adaptive cross-attention, multivariate feature learning, and spatial-information enhancement can improve feature interaction and robust object perception under complex or degraded visual conditions [32,33,34]. In UAV-based detection, multi-scale mutual aggregation and fine-grained feature modulation have been employed to enhance small-object representations under scale variation and background clutter [35]. Complementary developments in ecological detection have further shown that combining state-space modeling, super-resolution, and semi-supervised learning can improve target representation in degraded sensing data [36,37].
Attention and residual learning also support detail-sensitive image processing. In image steganography, attentional residual GANs combine learned feature selection with image-detail preservation [38].
Complementary information can also strengthen object representations: camera–radar interaction uses sparse queries to exchange features across sensing modalities [39]. In monocular 3D detection, MonoAux uses auxiliary supervision and uncertainty-aware depth estimation to learn spatial information from images [40].
Cardellicchio et al. [41] developed a YOLOv11-based incremental-learning approach for tomato plant phenotyping and examined domain adaptation through fine-tuning. Their joint consideration of trait detection, adaptation, and inference efficiency complements the feature-representation strategies studied here.
Existing approaches mainly enhance object representations within individual spatial ranges or feature levels, whereas fine-grained cotton detection requires coordinated modeling across spatial, scale, and frequency domains. Convolution-dominated feature extraction effectively captures local patterns but provides limited modeling of long-range spatial dependencies [42,43]. Conventional multi-scale fusion based on concatenation and convolution aggregates hierarchical features but provides limited selective interaction across feature levels [44]. Standard attention mechanisms emphasize semantic correlations, while high-frequency discriminative cues such as boundaries and textures receive less explicit modeling [45].
YOLO26n was selected for its compact computational profile (2.37 M parameters and 5.2 GFLOPs) and compatible module interfaces. C3k2LGL preserves the C3k2 input–output dimensions, C2WSA retains the C2PSA split-and-fusion structure, and SCMIFF operates at the P3/P4 neck-fusion stages. These insertion points support coordinated spatial, scale, and frequency modeling while retaining the original three-scale detection structure [46].
1.4. Proposed Framework and Contributions
To address these challenges, this study develops a lightweight YOLO26n-based framework for fine-grained cotton detection. The framework enhances discriminative cotton representations through local–global spatial modeling, cross-scale feature interaction, and frequency-aware feature enhancement.
First, C3k2LGL adapts the local–global strategy of Mobile U-ViT [47] to the C3k2 CSP branch, preserving its input–output dimensions while combining large-kernel local aggregation with sparse global self-attention. This integrates cotton morphology and long-range context at four backbone stages [48,49,50]. Second, SCMIFF extends cross-scale aggregation through sparse interaction encoding and selective cross-attention [51]. Projected paired features provide the query, while the sparse interaction representation supplies the keys and values, guiding spatial–semantic fusion at P3/P4 [52]. Third, C2WSA replaces self-attention in the C2PSA semantic branch with the Wave Propagation Operator of WaveFormer [53]. At Layer 10, one WPOBlock and feed-forward processing transform the semantic features, while the parallel branch preserves the input. Concatenation and fusion combine propagated global structure with the bypassed features before neck fusion.
Together, these components form a coordinated spatial–scale–frequency feature enhancement mechanism, strengthening cotton representations across spatial relationships, feature hierarchies, and frequency characteristics. As illustrated in Figure 1, the overall workflow covers cotton-field image and dataset construction, annotation and data partitioning, WINGS-Det detection, challenging-scene and performance analysis, comprehensive evaluation, cross-hardware deployment, and prospective cotton-field applications.
Figure 1.
Workflow of WINGS-Det: ground-level image collection and group-based partitioning; local–global, wave-aware, and cross-scale feature processing; detection evaluation; and cross-hardware deployment. Panel (I) illustrates prospective cotton-field applications.
The main contributions of this study are summarized as follows:
- A lightweight YOLO26n-based framework is proposed for fine-grained cotton detection, targeting morphological variation, scale differences, and visual similarity across different developmental states.
- A coordinated spatial–scale–frequency feature enhancement mechanism is developed by integrating local–global spatial modeling, cross-scale feature interaction, and frequency-aware learning to strengthen multi-scale representation and fine-grained discrimination.
- A fine-grained cotton detection dataset is constructed by integrating a publicly available dataset with 2000 self-collected images, resulting in 13,771 images and 27,352 annotated instances across four developmental categories. Comprehensive experiments, including ablation, scale- and density-conditioned analysis, robustness evaluation, cross-hardware deployment, and cross-dataset generalization, are conducted to systematically assess the effectiveness and practical applicability of the proposed method.
2. Materials and Methods
2.1. Cotton Dataset Preparation and Annotation
The cotton detection dataset used in this study was constructed by combining images from the publicly available Cotton Boll Detection dataset [54] with 2000 images collected by the authors. The self-collected images were annotated according to the same category definitions as the public dataset to ensure consistency between the two data sources. The resulting dataset contains a total of 13,771 images and 27,352 annotated instances across four developmental categories: Partially opened boll, Fully opened boll, Defective boll, and Flower.
The 2000 self-collected images were acquired using Apple iPhone 14 Pro and HUAWEI Mate 50 Pro smartphones in cotton fields in Korla, Bayingolin Mongol Autonomous Prefecture, Xinjiang, China, from August to October 2025, covering flowering and boll opening. Images were captured at ground level from oblique viewpoints at approximately 0.3–1.5 m under sunny and overcast natural daylight. The recorded image resolution was pixels. A second annotator checked the four-category annotations for missing instances, inaccurate boxes, and inconsistent labels.
The public dataset export includes provider-generated variants, such as rotated images. These existing files were distinguished from the online augmentation applied during model training.
The bounding-box annotations from both data sources were standardized and converted into a unified YOLO format. The integrated dataset was then partitioned into training, validation, and test subsets at an approximate ratio of 8:1:1.
Before dataset partitioning, duplicate and near-duplicate images were screened to reduce overlap among the training, validation, and test subsets. Source and acquisition groups were defined using image provenance, shooting sequences, and visually confirmed near-duplicate links, as detailed below. Dataset partitioning was completed before any training-time augmentation, and augmentation was applied only to the training subset. All model and checkpoint selection was performed using the training and validation subsets, while the test subset remained excluded from model optimization.
Public-source images and their provider-generated rotations and crops were mapped to canonical source-image identifiers by removing the .rf. hash suffix from export filenames. The 11,771 public images comprise 3924 base images and 7847 geometric variants, forming 3924 source groups. The 2000 self-collected images form 800 acquisition groups of consecutive views of the same plant or row segment. EXIF time gaps greater than 60 s and field-plot records delimit acquisition sequences; visually confirmed near-duplicate links merge related sequences.
Partitioning assigned each of the 4724 groups to one subset. Table S7 reports the group and image counts by source and subset, totaling 11,018 training, 1376 validation, and 1377 test images. The source/acquisition-group intersections are empty for all three subset pairs: training–validation, training–test, and validation–test each share zero groups. All mapped variants and multi-view frames within a group therefore remain in the same subset.
All 13,771 images, including base images and provider variants, were screened using MD5 and 64-bit dHash/pHash codes. The perceptual-hash scan included 90°, 180°, and 270° rotation checks and used a Hamming-distance threshold of 6. No byte-identical files occurred across subsets. Hash screening returned 38 within-subset candidate pairs and 14 cross-subset candidate pairs: five training–validation, six training–test, and three validation–test. DINOv2 ViT-B/14 similarities for the 14 cross-subset candidates were 0.76–0.83, below the 0.90 screening threshold. Visual inspection and acquisition records identified them as distinct plants with similar backgrounds.
We assigned all images from each source or acquisition group to the same subset.The training, validation, and test subsets contain 11,018, 1376, and 1377 images, respectively, with corresponding annotated instance counts of 21,861, 2752, and 2739. Fully opened bolls account for 79.7%, 78.2%, and 78.6% of the annotations in the training, validation, and test subsets, respectively, and 79.4% overall.
As shown in Figure 2, the integrated dataset exhibits considerable variation in class composition, target density, and object scale. Fully opened bolls constitute the largest category, while the remaining categories include visually similar fine-grained targets. The images cover single-target, low-density, and crowded scenes, with object scales ranging from small to very large. These characteristics provide a basis for subsequent class-wise, scale-conditioned, and density-conditioned detection evaluations.
Figure 2.
Statistical characteristics of the cotton detection dataset: (a) dataset split, (b) class distribution, (c) target density distribution, (d) scale-group distribution, and (e) bounding-box area-ratio distribution.
2.2. Overall Architecture of WINGS-Det
We propose WINGS-Det (Wave-aware Interactive Network with Global–local modeling and Sparse feature fusion), a lightweight cotton detection framework developed from YOLO26n. WINGS-Det retains the backbone–neck–head architecture of YOLO26n and the three detection branches operating at the P3, P4, and P5 feature levels [55]. To improve the detection of cotton targets with large-scale variations, ambiguous boundaries, and subtle inter-class differences, WINGS-Det integrates three complementary mechanisms: global–local representation learning, wave-aware frequency modeling, and sparse cross-level interactive feature fusion. As shown in Figure 3, these mechanisms are implemented by C3k2LGL, C2WSA, and SCMIFF, respectively, and are embedded into different stages of the backbone and neck to form a coordinated feature-enhancement pathway.
Figure 3.
Overall architecture of WINGS-Det for fine-grained cotton detection. C3k2LGL performs global–local representation learning, C2WSA provides wave-aware frequency modeling, and SCMIFF enables sparse cross-level interactive feature fusion. Conv and Concat denote convolution and concatenation; s and k indicate stride and kernel size. The C2WSA inset shows the nano setting .
First, C3k2LGL replaces the C3k2 blocks at Layers 2, 4, 6, and 8 of the backbone. It combines large-kernel local aggregation with sparse global self-attention to enlarge the effective receptive field while establishing long-range spatial dependencies. This design strengthens the joint representation of local structures and global contextual information, providing more discriminative features for cotton targets with substantial variations in scale and appearance.
Second, the original C2PSA at Layer 10 is replaced by C2WSA. Positioned at the deepest semantic stage of the backbone, C2WSA introduces wave-aware frequency modeling into deep feature representation. By enabling information propagation across different spatial frequencies, it preserves global structural information while maintaining high-frequency boundary and texture details, thereby improving the representation of visually similar cotton categories with subtle appearance differences.
Third, SCMIFF is introduced at the P3 and P4 feature-fusion stages of the neck. It combines sparse self-attention with cross-attention to establish selective interaction between hierarchical features. This mechanism enables high-resolution spatial details and deep semantic information to complement each other during multi-scale aggregation, while avoiding the excessive computational cost associated with dense global attention.
Overall, the three components form a progressive feature-enhancement pathway within WINGS-Det. C3k2LGL first establishes global–local spatial representations in the backbone, C2WSA subsequently enhances deep semantic features through wave-aware frequency modeling, and SCMIFF further performs sparse cross-level interaction during multi-scale feature fusion. The resulting P3, P4, and P5 representations are finally forwarded to the detection heads for localization and classification of the four cotton categories.
2.3. Key Modules of the Proposed Model
2.3.1. Large-Kernel Local–Global C3k2LGL Module
Cotton flowers and bolls exhibit substantial scale and morphological variations across developmental stages, while partially opened and defective bolls often share similar local appearances. To jointly model local structures and long-range spatial relationships, we incorporate large-kernel local aggregation and sparse global modeling into the C3k2 structure of YOLO26n, following the large-kernel local–global interaction strategy of Mobile U-ViT [47]. The resulting C3k2LGL module retains the original CSP topology of C3k2 and replaces its Bottleneck units with Large-Kernel Local–Global Blocks (LGLBs), enabling coordinated representation of local details and global spatial information.
Given an input feature , each LGLB sequentially performs local feature aggregation and sparse global modeling:
where denotes the locally aggregated feature and represents the LGLB output.
During local aggregation, a depthwise convolution first enlarges the local receptive field and generates a position-aware response:
where denotes the sigmoid function and ⊙ represents element-wise multiplication. The resulting feature is further processed by convolutions, large-kernel depthwise convolution, and a channel MLP to strengthen spatial and channel interactions, enhancing local morphology, boundaries, and texture cues of cotton targets.
Sparse global self-attention is then applied to capture cross-region spatial dependencies. A depthwise convolution first injects positional information, after which the two-dimensional feature map is flattened into tokens and spatially sparsified by average pooling. Query, key, and value matrices are generated from the sparse tokens, and the attention operation is defined as
where d denotes the feature dimension of each attention head. ConvTranspose2d restores the spatial resolution before residual addition. The fused feature then passes through parallel LN–Attn–DropPath and LN–MLP–DropPath branches. Their outputs are combined with the residual feature and reshaped to obtain , as shown in Figure 4.
Figure 4.
Structure of the proposed C3k2LGL module. The module integrates large-kernel local feature aggregation with sparse global self-attention to jointly model local details and long-range spatial information. DWConv denotes depthwise convolution; BN and LN denote batch and layer normalization; Attn denotes attention; MLP denotes a multilayer perceptron. Each local gate subtracts 0.5 from the sigmoid response before input multiplication and residual addition. Transpose Conv denotes ConvTranspose2d; the sparse-attention path includes parallel LN–Attn–DropPath and LN–MLP–DropPath branches.
At an input resolution of , the feature maps at Layers 2, 4, 6, and 8 have spatial sizes , , , and . Their pooling ratios are , giving tokens on a grid at each stage. The respective attention-head counts are .
Spatial sparsification in C3k2LGL uses non-overlapping 2D average pooling with kernel size and stride equal to r, implemented as AvgPool2d(kernel_size=r, stride=r).
Finally, LGLB is embedded into the CSP branch of C3k2 to form C3k2LGL while preserving the original input–output dimensions. C3k2LGL replaces the C3k2 blocks at Layers 2, 4, 6, and 8 of the YOLO26n backbone, allowing hierarchical features to encode both enhanced local structures and long-range spatial context before subsequent multi-scale feature fusion.
2.3.2. Sparse Cross-Level Multi-Scale Interactive Feature Fusion (SCMIFF)
Cotton flowers and bolls exhibit substantial scale and morphological variation across developmental stages, while partially opened and defective bolls often share similar local textures and contours. SCMIFF performs sparse cross-level interactive feature fusion between hierarchical representations from the same RGB input. As shown in Figure 5, SCMIFF consists of three stages: fused-feature generation, sparse interaction encoding, and cross-attention fusion.
Figure 5.
Structure of the proposed SCMIFF module. The module performs fused-feature generation, sparse interaction encoding, and cross-attention fusion to enable selective interaction and complementary information exchange between hierarchical features. SSA, CA, and FC denote sparse self-attention, cross-attention, and linear projection, respectively; C denotes concatenation. The interaction branch applies FC before SSA, as in Equation (5).
Let the two input features from different network levels be . They are first flattened into token sequences and , concatenated at corresponding spatial positions, and linearly projected to generate the initial fused feature:
Learnable two-dimensional positional embeddings are then added to the two feature sequences to construct the interaction feature . After remapping to the spatial domain, sparse self-attention is applied:
SSA models feature relationships within sparse spatial regions, preserving local spatial information while enabling efficient interaction on high-resolution features.
Cross-attention is subsequently used for selective information fusion. serves as the query, while provides the key and value:
The cross-attention output is linearly projected and restored to a spatial feature map, completing selective interaction and fusion across feature levels.
SCMIFF is deployed at P3 (, ) and P4 (, ). Both stages use a local semantic sampling grid of , providing representative tokens per local region, and four attention heads; the head dimensions are 32 and 64, respectively. Selected adjacent C3k2 blocks are replaced by standard convolutions.
2.3.3. Frequency-Aware Wave-Propagation C2WSA Module
Discriminative information of cotton flowers and bolls is distributed across different spatial frequencies. Global shape and spatial layout are mainly represented by low-frequency components, whereas boundaries, opening regions, and surface textures contain important high-frequency details. Related UAV detection research has explored frequency–spatial feature recalibration and wavelet-based processing to preserve structural and local edge information under degraded imaging conditions [56]. Related frequency-aware detection methods include wavelet-based feature processing in WSADet and DAWDet and frequency-aware feature aggregation for RGB-T salient objects [57,58,59]. To jointly model these frequency characteristics in deep features, C2WSA integrates the Wave Propagation Operator (WPO) from WaveFormer [53] into the semantic branch of C2PSA, replacing its attention module while retaining the split-and-fusion structure. As shown in Figure 6, C2WSA preserves the CSP-style split structure of C2PSA and performs frequency-aware feature modeling through WPOBlocks and FFNs in the semantic branch.
Figure 6.
Structure of the proposed C2WSA module. The module combines wave-propagation operators with feed-forward transformations for frequency-aware feature modeling, enhancing both global structural information and local high-frequency details. The nano configuration uses one PSABlock_WPO. CBS denotes convolution, batch normalization, and SiLU, with the tuple specifying kernel size, stride, and padding; WPO denotes the wave-propagation operator.
The damped wave equation, closed-form propagation rule, and damped frequency in Equations (7)–(9) follow the WPO formulation of WaveFormer [53]. C2WSA evaluates the modal response using the DCT basis specified below. For a feature field U, the propagation equation is
where t denotes propagation time, is the damping coefficient, and is the wave speed. Applying a two-dimensional frequency transform yields the frequency–time decoupled solution
Here, and denote the two-dimensional Discrete Cosine Transform and its inverse, respectively. The damped frequency is defined as follows.
In Equations (7)–(9), denotes the propagated feature field, where x and y are feature-map coordinates and t is the propagation parameter. The initial conditions are and , representing the initial semantic field and its initial rate of change, respectively. For each two-dimensional cosine mode, and are the spatial angular frequencies along the two feature-map axes, and is the corresponding damped propagation frequency.
For the continuous wave model, each spatial mode with satisfies . With and , its characteristic roots have non-positive real parts, yielding bounded forward propagation for . Equation (8) evaluates the modal response directly at the selected propagation time.
The damping coefficient , wave speed , and propagation time t are channel-wise learnable parameters. Each is parameterized as , with . The initial physical values are ; the corresponding unconstrained initial values follow . The nano configuration applies one WPOBlock in C2WSA.
For real-valued evaluation of Equation (8), define and . For , let and . For , let , , and . At , the continuous limits are and . Each spectral mode then evolves as .
Near critical damping, the series in are and . Combining these kernels gives the initial-displacement coefficient for fixed and t. Equation (8) evaluates the selected propagation time directly, with no finite-difference time-step parameter.
Within each feature channel, the learned damping coefficient is shared across spatial-frequency modes. Their frequency-dependent responses jointly represent coarse structure and fine boundary and texture cues.
In implementation, the input feature is first locally mixed by depthwise convolution and then decomposed into a semantic field and a velocity field through gated linear transformations. Both fields are mapped to the frequency domain using a two-dimensional DCT, modulated according to the wave-propagation process, and transformed back to the spatial domain by inverse DCT. The resulting response is further gated before output. The fast-transform path has per-channel complexity , where ; the fixed-matrix export path is described in Section 3.8.
C2WSA retains the split-and-fusion organization of C2PSA. One branch preserves the input feature, while the semantic branch uses one WPOBlock with feed-forward processing in the nano configuration; the two branches are subsequently concatenated and fused by a convolution. C2WSA is placed at Layer 10 of the YOLO26n backbone, corresponding to the highest semantic stage. This placement enhances structural, boundary, and texture information in deep features and strengthens fine-grained discrimination among visually similar cotton states.
2.4. Experimental Setup and Evaluation Metrics
The training environment is summarized in Table 1. The platform ran Windows 11 with an Intel Core Ultra 9 285K CPU. The training platform used a standard desktop NVIDIA GeForce RTX 4090 with 24 GB of GPU memory and 64 GB of system RAM. The models were implemented in PyTorch 2.1.0 with CUDA 11.8 and Python 3.10.20.
Table 1.
Experimental environment.
The training configuration is summarized in Table 2. The input resolution was set to pixels, and each model was trained for 200 epochs with a batch size of 16. Stochastic Gradient Descent (SGD) was adopted with an initial learning rate of 0.001, a momentum of 0.937, and a weight decay of 0.0005. Eight data-loading workers were used.
Table 2.
Training settings.
All YOLO-based and RT-DETR-based detectors used an Ultralytics-based framework (8.4.x). SSDLite and Faster R-CNN used MMDetection 3.2.0 with MMCV 2.1.0. All detectors used the same data partition, 200 training epochs, batch size 16, and the SGD settings in Table 2, including an initial learning rate of 0.001. Augmentation and label assignment are specified by the model below.
The YOLOv5n baseline used the yolov5n.yaml architecture definition with depth_multiple and width_multiple . It retained the YOLOv5n C3 backbone and neck topology and used the Ultralytics anchor-free decoupled detection head with task-aligned label assignment. YOLOv5n in the comparison tables refers to this implementation.
For the Ultralytics-based detectors, including RT-DETR-n and RT-DETR-Cotton, augmentation was applied online to training batches: Mosaic with probability 1.0, disabled for the final 10 epochs; HSV jitter with hue, saturation, and value settings of 0.015, 0.7, and 0.4; translation up to 10% of image width/height; scaling with factor 0.5–1.5; and horizontal flipping with probability 0.5. MixUp, CutMix, copy-paste, random erasing, rotation, shear, perspective transformation, and vertical flipping were disabled. Validation and test preprocessing used deterministic resizing and normalization: YOLO-based detectors used letterboxing and RT-DETR-based detectors used stretch resizing to .
YOLOv5n, YOLOv8n, YOLOv9t, YOLOv11n, YOLOv12n, YOLOv13n, YOLO-Worldv2-n, Mamba-YOLO-tiny, GhostNet-n, YOLOv8n-DSDL, and Cott-ADNet used task-aligned assignment with top-, , and . YOLOv10n, YOLO26n, YOLO26s, and WINGS-Det used dual assignment, with top- for one-to-many supervision and top- for the one-to-one branch used in NMS-free inference. YOLO26n, YOLO26s, and WINGS-Det enlarged ground-truth boxes smaller than the stride during candidate selection.
RT-DETR-n and RT-DETR-Cotton used Hungarian matching with classification, L1, and GIoU cost weights of 2, 5, and 2. SSDLite used IoU-based matching with positive and negative thresholds of 0.5 and 0.4, respectively, and hard-negative mining with a negative-to-positive ratio of 3:1. Faster R-CNN used RPN thresholds of 0.7/0.3 and sampled 256 anchors per image with up to 50% positives; its RoI head used a 0.5 threshold and sampled 512 proposals with up to 25% positives. WINGS-Det and all ablation variants retained the YOLO26n assignment scheme.
For Faster R-CNN, images were resized while preserving aspect ratio and padded to ; training transforms included horizontal flipping with probability 0.5 and PhotoMetricDistortion. The SSDLite (MobileNetV2) baseline (3.68 M parameters and 1.40 GFLOPs) used depthwise-separable detection heads and a stride-2 input stem adapted to inputs [60]. Training used MinIoURandomCrop, Expand, PhotoMetricDistortion, and horizontal flipping with probability 0.5. YOLOv5n used the same augmentation probabilities as the other YOLO baselines. Validation and test transforms were deterministic.
The observed dataset class distribution was retained under a common training protocol. No class-frequency-based resampling, additional category-specific loss weights, or class-specific augmentation was applied. Each detector retained its architecture-specific classification loss. We evaluated detection performance separately for each of the four categories using average precision (AP).
Detection performance was evaluated using Precision (P), Recall (R), mAP50, and mAP50:95. Precision and Recall are defined as
where , , and denote true positives, false positives, and false negatives, respectively.
For the YOLO-based models in the main performance tables, P and R are averaged across the four classes at the confidence threshold maximizing the smoothed mean F1 curve, with prediction–ground-truth matching at IoU 0.50. The supplementary confusion matrices use the representative Run #3 checkpoints at confidence 0.25 and matching IoU 0.45. YOLO26n and WINGS-Det retain their native one-to-one inference outputs. Each matrix cell reports an integer count and its column-normalized proportion; micro P/R pools the counts across classes at this fixed operating point.
Table S6 reports group-wise P and R as means across five independent training runs. Within each run and group, P and R are macro-averaged over the four classes at the confidence threshold maximizing that group’s smoothed mean F1 curve, with matching IoU 0.50. The overall row uses the corresponding whole-test-set operating point. Group-wise AP is computed from confidence-ranked predictions using the scale groups defined in Section 3.5 and the density groups defined in Section 3.6.
The Average Precision (AP) of the i-th category is calculated from the precision–recall curve as
and the mean Average Precision is defined as
where N denotes the number of categories. mAP50 represents the mean AP at an IoU threshold of 0.50, whereas mAP50:95 denotes the mean AP averaged over IoU thresholds from 0.50 to 0.95 with an interval of 0.05.
Model efficiency was further evaluated using the number of parameters (Params), floating-point operations (FLOPs), model size, and frames per second (FPS), which characterize model complexity, computational cost, storage requirement, and inference speed, respectively.
FLOPs were evaluated at batch size 1 and input resolution using a common operator-counting convention for all compared detectors, ablation configurations, and sensitivity variants. A multiplication and an addition count as two FLOPs. Counts include convolutional and linear operations, and attention–value matrix products, and the DCT/IDCT and spectral products in C2WSA. Each complete forward graph is profiled with the applicable counting hooks. DCT/IDCT costs use a fixed-matrix reference representation for the theoretical comparison. Latency is measured separately using the actual execution backend, including the native fast-DCT path and the matrix-based export path described in Section 3.8.
3. Results
3.1. Ablation Study
Table S1 evaluates pooling reduction, semantic sampling grids, and attention-head counts with five independent training runs per setting. The default and achieve mAP50 and mAP50:95 at 163.1 FPS on the RTX 4090. Denser pooling increases mAP50:95 by 0.2 percentage points and reduces throughput to 131.5 FPS; sparser pooling gives 75.1% at 172.4 FPS. Increasing the SCMIFF grid to gives 75.8% at 156.2 FPS. The default balances localization accuracy and inference throughput.
Table S1b reports total GFLOPs under the common counting convention in Section 2.4. The and attention–value products contribute FLOPs per attention operation; for self-attention with , this becomes . Table S8 gives the complete-forward-graph totals for the eight module configurations. YOLO26n and WINGS-Det require 5.18 and 5.34 GFLOPs, respectively, reported as 5.2 and 5.3 GFLOPs in Table 3a.
Table 3.
Ablation results of the proposed modules and wave parameters. Panel (a) reports P, R, mAP50, and mAP50:95 as mean ± SD over five independent runs. Panel (b) reports wave-parameter sensitivity. FLOPs in panel (a) use the theoretical counting convention in Section 2.4; Table S8 provides the corresponding two-decimal totals.
To systematically evaluate the individual contributions and complementary effects of the three proposed modules, a comprehensive factorial ablation study was conducted using YOLO26n as the baseline. M1, M2, and M3 denote C3k2LGL, SCMIFF, and C2WSA, respectively. All eight possible module configurations were evaluated under the same experimental protocol.
Each module-ablation configuration in Table 3a was independently trained five times under the same fixed data partition, and the reported test-set detection metrics are presented as the mean ± standard deviation (SD) across the five runs. The corresponding model complexity and inference efficiency are also reported for comparison. The results are summarized in Table 3.
The single-module experiments first demonstrate that each proposed component contributes positively to the baseline detector. Introducing C3k2LGL (M1) increases mAP50 from 94.2% to 96.2% and mAP50:95 from 71.9% to 73.5%, corresponding to improvements of 2.0 and 1.6 percentage points, respectively. Recall also increases from 88.6% to 92.3%. These results indicate that combining large-kernel local aggregation with sparse global self-attention provides a more effective representation of both local cotton structures and long-range spatial context.
SCMIFF (M2) independently improves mAP50 and mAP50:95 by 1.5 and 1.2 percentage points, respectively, while increasing Recall from 88.6% to 91.8%. This improvement supports the effectiveness of selective cross-level feature interaction in exchanging complementary spatial and semantic information between different feature scales. Similarly, C2WSA (M3) increases mAP50 to 95.5% and mAP50:95 to 73.3%. Notably, the improvement in the stricter mAP50:95 metric is comparable to that in mAP50, suggesting that wave-aware frequency modeling is particularly beneficial for preserving structural, boundary, and texture information required for fine-grained localization.
The two-module experiments further reveal the complementary behavior of the proposed components. Among the three dual-module configurations, M1+M3 achieves the strongest overall performance, reaching % Precision, % Recall, % mAP50, and % mAP50:95. It also requires only 2.34 M parameters and 5.1 G FLOPs. This result suggests a strong complementarity between global–local spatial representation and wave-aware frequency modeling. The M2+M3 configuration achieves an mAP50:95 of %, while M1+M2 reaches %, confirming that different combinations improve feature representation from distinct but complementary perspectives.
When all three modules are integrated, the resulting WINGS-Det achieves the best performance across all detection metrics. Specifically, WINGS-Det obtains % Precision, % Recall, % mAP50, and % mAP50:95. Compared with the YOLO26n baseline, these results correspond to gains of 4.2 percentage points in Precision, 9.6 percentage points in Recall, 4.7 percentage points in mAP50, and 3.8 percentage points in mAP50:95. The recall gain is consistent with complementary feature processing: C3k2LGL strengthens local structures and spatial context, C2WSA enriches semantic features with structural and texture cues, and SCMIFF selectively transfers these representations across prediction scales. Adding SCMIFF to M1+M3 raises Recall from 94.9% to 98.2% and Precision from 97.2% to 98.6%, supporting more effective target recovery with accurate predictions.
Despite these accuracy improvements, WINGS-Det maintains a lightweight computational profile. The number of parameters increases only from 2.37 M to 2.38 M, while FLOPs increase from 5.2 G to 5.3 G and the model size from 5.1 MB to 5.2 MB. The model still achieves an inference speed of 163 FPS. Moreover, the relatively small standard deviations across the five independent runs, particularly the SDs of 0.10 for mAP50 and 0.16 for mAP50:95, indicate low run-to-run variability under the tested experimental settings. Overall, the ablation results demonstrate that C3k2LGL, SCMIFF, and C2WSA provide distinct yet complementary improvements, enabling WINGS-Det to achieve higher detection accuracy while retaining comparable model complexity and real-time inference on the RTX 4090.
Table 3b evaluates wave-parameter sensitivity using the same data partition and training protocol as the module ablation. The tested learnable initializations yield 98.8–98.9% mAP50 and 75.4–75.7% mAP50:95. Fixing at gives 98.4% and 75.0%, respectively; fixing them at gives 97.8% and 74.5%. No NaN or Inf gradients were observed in these runs. These results support the selected learnable parameterization across the tested initializations.
Figure 7 uses Grad-CAM [61], implemented with pytorch-grad-cam, on the neck outputs feeding the P3, P4, and P5 detection branches. Predicted-box confidence scores above 0.25 supplied the backpropagation targets. Gradients were spatially averaged to obtain channel weights; weighted feature maps were summed, passed through ReLU, and upsampled to the input size. The displayed maps were min–max normalized within predicted boxes and masked outside them, using a jet color scale from 0 to 1. Colors therefore indicate relative responses within the displayed regions. In the Grad-CAM rows (b) and (d), the Labels column shows the WINGS-Det map within ground-truth boxes as a reference overlay. AC Score is the mean confidence of the displayed model’s predicted boxes and serves as a visualization annotation.
Figure 7.
Qualitativedetection results and feature-response visualization of different ablation variants. Detection examples are shown in (a,c), and Grad-CAM examples are shown in (b,d). Each row uses a different image, shared across the model columns. M0 is YOLO26n; M1 adds C3k2LGL; M12 adds C3k2LGL and SCMIFF; M123 is WINGS-Det with all three modules. Grad-CAM maps are normalized within boxes on a 0–1 scale. In (b,d), the Labels column displays the WINGS-Det map within ground-truth boxes. AC Score denotes mean predicted-box confidence. Computation settings are given in Section 3.1.
The detection panels in Figure 7a,c illustrate localization, missed detections, and category predictions across the ablation variants. The box-normalized Grad-CAM maps in Figure 7b,d provide a qualitative view of relative feature attribution within the displayed regions, complementing the quantitative results in Table 3.
3.2. Cross-Architecture Transferability
Building on the overall ablation results, the class-wise response to the proposed modules was further examined. As shown in Figure 8, different module combinations improve category-level detection to varying degrees. WINGS-Det achieves gains across all four cotton categories, with the largest AP50 improvements observed for partially opened and defective bolls, reaching 7.8 and 7.5 percentage points over the baseline, respectively. These results indicate that the coordinated spatial–scale–frequency enhancement is particularly effective for visually similar fine-grained categories.
Figure 8.
Per-class AP50 ablation results: (a) absolute AP50 values and (b) gains relative to the YOLO26n baseline. M1, M2, and M3 denote C3k2LGL, SCMIFF, and C2WSA, respectively.
C3k2LGL, SCMIFF, and C2WSA were further transferred to functionally corresponding stages of YOLOv10n, YOLOv12n, and YOLOv13n. As shown in Figure 9, the individual modules exhibit architecture-dependent gains, whereas the complete WINGS-Det module configuration consistently improves all three architectures. The corresponding mAP50 gains are 3.5, 3.0, and 3.7 percentage points, with only minor changes in parameter count. These results demonstrate that the WINGS-Det feature-enhancement strategy transfers effectively across lightweight YOLO architectures while maintaining a favorable accuracy–complexity balance.
Figure 9.
Cross-architecture transferability of the proposed modules on YOLOv10n, YOLOv12n, and YOLOv13n: (a) mAP50 and (b) parameter count.
3.3. Comparison with Representative Object Detectors
Table 4 compares WINGS-Det with representative general-purpose and cotton-specific detectors.
Table 4.
Comparison of detection performance. Panel (a) compares representative general-purpose and cotton-specific detectors; panel (b) adds YOLOv5n, YOLOv8n, and YOLO26s, with YOLO26n and WINGS-Det as references.
WINGS-Det achieves the highest precision (98.6%), recall (98.2%), (98.9%), and (75.7%). Relative to YOLO26n, the two mAP metrics improve by 4.7 and 3.8 percentage points, respectively. Compared with RT-DETR-Cotton, the strongest cotton-specific comparator, the four metrics improve by 2.8, 5.6, 1.4, and 1.0 percentage points, respectively.
The official Ultralytics COCO validation results at report 40.9% mAP50:95 for YOLO26n and 39.5% for YOLO11n [70,75]. On the cotton dataset in Table 4, YOLO26n reaches 94.2% mAP50 versus 92.7% for YOLOv11n, while their mAP50:95 values are 71.9% and 72.1%. Model ordering therefore depends on the dataset and localization criterion.
Table 4b adds YOLOv5n, YOLOv8n, and the larger YOLO26s, trained with the same data partition and training protocol. Compared with YOLO26n, YOLO26s uses 3.85 times as many parameters and 3.92 times the reported FLOPs, with gains of 1.2 and 1.9 percentage points in mAP50 and mAP50:95. WINGS-Det exceeds YOLO26s by 3.5 and 1.9 points, respectively, using 26.0% of its reported FLOPs. These results support the accuracy–complexity trade-off of WINGS-Det.
Table 5 compares model complexity and inference efficiency.
Table 5.
Comparison of model complexity and inference efficiency with representative object detectors. Panel (a) reports complexity and RTX 4090 throughput; panel (b) reports Jetson throughput alongside detection accuracy.
WINGS-Det has 2.38 M parameters, 5.3 GFLOPs, a model size of 5.2 MB, and a throughput of 163 FPS. Among the cotton-specific detectors, it has the lowest parameter count, FLOPs, and model size, as well as the highest FPS. Relative to YOLO26n, WINGS-Det increases parameters by 0.01 M and FLOPs by 0.1 G, while throughput changes from 175 to 163 FPS. It retains 93.1% of the baseline throughput, with gains of 4.7 and 3.8 percentage points in mAP50 and mAP50:95, respectively.
3.4. Class-Wise Detection Performance
To further evaluate the category-level detection performance of WINGS-Det, Table 6 compares the class-wise AP50 and AP50:95 of YOLO26n and WINGS-Det across the four cotton categories.
Table 6.
Class-wise detection performance of YOLO26n and WINGS-Det.
As shown in Table 6, WINGS-Det improves detection performance across all four cotton categories. The largest AP50 gains are observed for partially opened and defective bolls, reaching 7.8 and 7.5 percentage points, respectively. These improvements indicate that the coordinated spatial–scale–frequency enhancement strengthens discrimination between visually similar cotton states. For fully opened bolls, WINGS-Det further increases AP50 from an already high baseline of 98.5% to 99.6%.
Under the stricter AP50:95 criterion, defective bolls and flowers achieve gains of 4.4 and 4.2 percentage points, respectively, indicating improved bounding-box localization. The baseline mAP50 of 94.2% leaves only 5.8 percentage points to the metric’s upper bound, creating a ceiling effect. The further 4.7-point increase to 98.9% is substantial within this available range. The accompanying increase in mAP50:95 from 71.9% to 75.7% also supports improved localization under stricter criteria.
Table S5 reports integer and column-normalized confusion matrices for the 2739 test instances. Compared with YOLO26n, WINGS-Det increases correctly classified detections from 2580 to 2707, reduces cross-category errors from 28 to 6, background misses from 131 to 26, and unmatched background predictions from 67 to 24. Confusion between partially opened and defective bolls decreases from seven instances to two, supporting improved fine-grained discrimination.
At this fixed operating point, WINGS-Det achieves macro P of 98.33% and macro R of 98.22%, with micro P of and micro R of . YOLO26n achieves macro P of 93.78% and macro R of 88.67%, with micro P of and micro R of . A cross-category error contributes one false positive to the predicted class and one false negative to the true class. The 32 unrecalled WINGS-Det instances therefore comprise 6 cross-category errors and 26 background misses.
3.5. Scale-Conditioned Detection Analysis
Scale-conditioned AP uses relative ground-truth box area with boundaries of 2.0%, 4.5%, and 11.0%. Density-conditioned AP uses Single (1), Low (2), Medium (3–4), and Dense () ground-truth instances per image. AP is calculated from confidence-ranked predictions over the precision–recall curve.
Target scale was measured by the relative bounding-box area of the i-th ground-truth instance:
where and are the bounding-box dimensions, and W and H are the image dimensions. Instances were divided into Small, Medium, Large, and Very Large groups using the thresholds in Table 7.
Table 7.
Definition and instance statistics of the scale-conditioned subsets. Panel (b) reports class composition by split; percentages use each row’s instance total.
Scale Gap measures the performance difference between Very Large and Small targets:
Small Gain denotes the improvement over YOLO26n in the Small group. A smaller Scale Gap indicates less variation across target scales. Table 8 compares the detectors’ across the four target-scale groups.
Table 8.
Instance-level scale-conditioned (%) of representative cotton detectors. Scale Gap and Small Gain are defined in the text. Best and second-best results are highlighted in bold and underlined, respectively. A lower Scale Gap is preferred.
As shown in Table 8, increases with target scale for all detectors. WINGS-Det achieves the highest scores in all four groups, reaching 95.8%, 97.9%, 98.7%, and 99.4%, respectively. Its Small-group score exceeds those of YOLO26n and Cott-ADNet by 6.5 and 4.1 percentage points. The Scale Gap is 3.6 points, compared with 8.5 and 6.6 points for the two models, indicating more consistent accuracy across target scales.
3.6. Density-Conditioned Detection Analysis
Target density was measured by the number of annotated instances in image j:
where is the set of ground-truth instances in that image. Images were divided into Single, Low, Medium, and Dense groups according to Table 9.
Table 9.
Definition and image statistics of the density-conditioned subsets.
Density Drop measures the performance difference between the Single and Dense groups:
Dense Gain denotes the improvement over YOLO26n in the Dense group. A smaller Density Drop indicates less degradation as target density increases. Table 10 compares the detectors’ across the four image-density groups.
Table 10.
Image-level density-conditioned (%) of representative cotton detectors. Density Drop and Dense Gain are defined in the text. Best and second-best results are highlighted in bold and underlined, respectively. A lower Density Drop is preferred.
As shown in Table 10, decreases with increasing target density for all detectors. WINGS-Det achieves the highest scores across the four groups, reaching 99.3%, 98.6%, 97.4%, and 95.8%, respectively. In the Dense group, it exceeds YOLO26n and Cott-ADNet by 7.1 and 5.3 percentage points. Its Density Drop is 3.5 points, compared with 8.8 and 7.2 points for the two models, indicating more consistent detection in crowded scenes.
3.7. Accuracy–Efficiency Trade-Off
Figure 10 compares detection accuracy, inference speed, and parameter count. WINGS-Det achieves 98.9% mAP50 and 163 FPS with 2.38 M parameters. Compared with RT-DETR-Cotton, it improves mAP50 by 1.4 percentage points, increases throughput from 49 to 163 FPS, and reduces the parameter count from 66.84 to 2.38 M. It also exceeds Cott-ADNet in accuracy and speed with fewer parameters. Relative to YOLO26n, WINGS-Det gains 4.7 percentage points in mAP50 with 0.01 M additional parameters and a 6.9% decrease in throughput, providing an accuracy–efficiency trade-off at closely matched model complexity.
Figure 10.
Accuracy–efficiency comparison of representative object detectors. Bubble size represents the number of model parameters.
The accuracy–efficiency assessment also considers stricter localization and challenging subsets. YOLO26n achieves 71.9% mAP50:95, 89.3% Small-group mAP50, and 88.7% Dense-group mAP50; WINGS-Det improves these values to 75.7%, 95.8%, and 95.8%, respectively. The external zero-shot evaluation further examines localization across three image domains. These complementary criteria assess fine-grained detection gains alongside the compact computational profile.
3.8. Cross-Hardware Deployment Analysis
Recent lightweight UAV detection research has combined efficient feature extraction with channel pruning to reduce computational demands on resource-constrained devices [76]. To evaluate the inference efficiency of WINGS-Det across heterogeneous computing platforms, experiments were conducted on an RTX 4090, RTX 3060, Intel Core Ultra 9 285K CPU, and Jetson Orin Nano. The input resolution was fixed at with a batch size of 1.
The test-set hardware benchmark used native PyTorch models in FP32, with batch size 1 and inputs, without ONNX/TensorRT export or reduced-precision inference. Timing included model-specific resizing and normalization, network inference, and postprocessing (box decoding and NMS where required); disk reading and visualization were excluded. GPU timers were synchronized with CUDA. After 50 warm-up iterations, mean per-image time was calculated over the 1377-image test subset, and FPS was obtained as 1000 divided by mean time in milliseconds. Jetson Orin Nano (8 GB) operated in 15 W power mode with JetPack 6.0 (L4T R36.3.0, CUDA 12.2, and cuDNN 8.9.4) and PyTorch 2.3.0.
As shown in Figure 11, WINGS-Det achieves 163.0, 75.4, 11.8, and 16.2 FPS on the four platforms, respectively. On the RTX 4090, its throughput exceeds that of Cott-ADNet by 22.0 FPS and reaches 93.1% of YOLO26n’s 175 FPS on the same device. Combined with its 98.9% , these results demonstrate a favorable balance between detection accuracy and inference efficiency across desktop GPU, CPU, and embedded computing platforms.
Figure 11.
Cross-hardware inference-speed comparison of representative detectors on (a) RTX 4090, (b) RTX 3060, (c) Intel Core Ultra 9 285K CPU-only, and (d) Jetson Orin Nano.
Table 5b jointly reports accuracy and Jetson Orin Nano throughput for the eight evaluated detectors. WINGS-Det and YOLO26n are the non-dominated models under either mAP criterion and inference time. WINGS-Det achieves 16.2 FPS, compared with 18.9 FPS for YOLO26n, with gains of 4.7 and 3.8 percentage points in mAP50 and mAP50:95. The other six models are slower and less accurate than WINGS-Det. This comparison quantifies the accuracy–latency trade-off for edge processing.
For fixed-shape export, the orthonormal DCT-II matrices and are stored as buffers. The transforms are evaluated as and , using matrix-multiplication operators. This path was exported with ONNX opset 17 for TensorRT 8.6.2 FP16 and INT8 execution. CPU ONNX Runtime FP32 evaluations used version 1.18.0. INT8 entropy calibration used 500 training images. The matrix-based transform has cost for a feature tensor with C channels.
The backend benchmark used 100 warm-up iterations and 1000 timed iterations at batch size 1 and input resolution. It measured mean and P95 latency, runtime memory, and exported-engine performance (Tables S2 and S3). Timing covered preprocessing, inference, and model-specific postprocessing and excluded disk I/O. WINGS-Det uses NMS-free one-to-one postprocessing. Table S2c reports native FP32 timing for the test-set and backend benchmarks.
Table S3 distinguishes memory measurements by scope. PyTorch tensor peaks were measured using reset_peak_memory_stats and max_memory_allocated. Desktop GPU process memory was sampled using nvidia-smi; CPU resident memory was measured using process RSS. Jetson RAM values are total system RAM in use reported by tegrastats during the benchmark. The 5.2 MB checkpoint is a serialized FP16 file; this storage size is reported separately from runtime memory.
On Jetson, WINGS-Det achieved 72.5 FPS with TensorRT FP16 and 102.0 FPS with INT8. Corresponding mAP50/mAP50:95 values were 98.9/75.6% and 98.5/74.6%. CPU ONNX Runtime FP32 achieved 19.3 FPS with 98.9/75.7% accuracy. The backend benchmark gave WINGS-Det 16.2 FPS in native Jetson FP32, compared with 9.2 FPS for YOLO26s; their TensorRT FP16 throughputs were 72.5 and 38.0 FPS. WINGS-Det also exceeded YOLO26s by 1.9 percentage points in source-test mAP50:95.
3.9. Robustness Analysis
To evaluate the robustness of WINGS-Det under image degradation, five perturbations were considered: brightness variation, Gaussian noise, Gaussian blur, target occlusion, and resolution degradation [77,78]. Each perturbation was evaluated at five levels, as detailed in Table 11. Detection performance was measured using .
Table 11.
Perturbation settings used for robustness evaluation.
As shown in Figure 12, WINGS-Det consistently maintains higher detection accuracy across all perturbation settings. Under brightness variation, the highest accuracy is achieved at the original brightness level, with performance decreasing under both brighter and darker conditions. Increasing noise, blur, occlusion, and resolution loss progressively reduce detection accuracy across all models. Nevertheless, WINGS-Det retains a clear advantage, particularly under severe blur, target occlusion, and resolution degradation. These results demonstrate its robustness to image-quality variations and incomplete target information.
Figure 12.
Robustness comparison of representative cotton detectors under five image perturbations: (a) brightness variation, (b) Gaussian noise, (c) Gaussian blur, (d) target occlusion, and (e) resolution degradation.
Degradation-aware distillation provides a complementary training approach: Gu and Chen [79] use degradation-conditioned guidance to improve indoor detection while retaining the deployed detector architecture.
3.10. Cross-Dataset Generalization Evaluation
To evaluate the cross-dataset generalization of WINGS-Det, three external cotton datasets were used: 2025 Cotton Boll Dataset, Cotton 5-Class Dataset, and Maturity Analysis. The datasets differ in image domain and category definitions.
For the 100-image test protocol, 1000 images were randomly selected from each external dataset using a fixed sampling seed, as summarized in Table 12. Full-dataset evaluation uses the complete external datasets or their held-out complements.
Table 12.
External cotton datasets used for cross-dataset generalization evaluation.
The three external datasets contain one, five, and five native categories, respectively, which are not fully aligned with the four-category taxonomy of the source dataset. For zero-shot evaluation, all cotton-related categories were therefore mapped to a single cotton target class while retaining the original bounding boxes. Thus, zero-shot measures cross-domain localization in the unified cotton-target class, rather than fine-grained developmental-stage classification.
Each selected 1000-image subset was divided into 800 training, 100 validation, and 100 test images. For the 100-image protocol, the same 100-image test subset was used for zero-shot transfer and dataset-specific retraining. Zero-shot evaluation directly used the source-trained models without parameter updates. For retraining, the native one-, five-, and five-category taxonomies of the three external datasets were retained, and the class-dependent output layers were reinitialized. Other training settings followed Section 2.4.
Full-dataset evaluation uses all 1974, 1458, and 2327 images from datasets I, II, and III, respectively, for zero-shot transfer. For dataset-specific retraining, the complete held-out test sets contain the 1074, 558, and 1427 images outside the respective 800-image training and 100-image validation subsets. For each dataset, full-dataset evaluation uses the same checkpoints as the 100-image comparison. For each fixed checkpoint, individual-model and paired-difference 95% confidence intervals were estimated from 1000 image-level bootstrap resamples; each paired resample uses the same image indices for both models. Table 13b and Table 14b report the full-dataset results; panel (a) in each table reports the 100-image comparisons.
Table 13.
Zero-shot cross-dataset performance on three external cotton datasets (mAP50, %). Panel (a) uses the 100-image subsets and gains over the best baseline. Panel (b) uses the full external datasets and paired gains over YOLO26n; confidence intervals are in brackets.
Table 14.
Dataset-specific retraining performance on three external cotton datasets (mAP50, %). Panel (a) uses the 100-image subsets and gains over the best baseline. Panel (b) uses the complete held-out sets and paired gains over YOLO26n; confidence intervals are in brackets.
3.10.1. Zero-Shot Cross-Dataset Evaluation
In the 100-image zero-shot comparison in Table 13a, WINGS-Det achieves the highest among the evaluated models on each 100-image subset. Panel (b) compares WINGS-Det with YOLO26n on the complete external datasets.
On the 100-image subsets in Table 13a, WINGS-Det obtains a mean of 76.3%, with an average gain of 4.0 percentage points over the best baseline. The improvements range from 2.4 to 5.2 percentage points, indicating consistent transfer across different cotton-image domains.
On the full zero-shot datasets in Table 13b, WINGS-Det achieves 82.5%, 72.6%, and 71.9% mAP50, compared with 83.6%, 73.7%, and 71.5% on the 100-image subsets. The paired gains over YOLO26n are 3.6, 6.3, and 6.7 percentage points, with paired 95% confidence intervals of [2.8, 4.4], [5.3, 7.3], and [5.9, 7.5], respectively.
3.10.2. Dataset-Specific Retraining Evaluation
For dataset-specific retraining, each model was trained on 800 images and its checkpoint was selected using 100 validation images. Evaluation used both the 100-image test subset in Table 14a and the complete held-out set in panel (b). Unlike the class-agnostic zero-shot protocol, retraining preserves the native one-, five-, and five-category taxonomies of the three external datasets.
On the 100-image subsets in Table 14a, WINGS-Det achieves the highest on all three datasets, with a mean of 92.4% and an average gain of 1.9 percentage points over the best baseline.
On these 100-image subsets, the gains over the best baseline range from 0.9 to 2.8 percentage points. Together, these experiments characterize cross-domain localization without weight updates and target-domain detection after retraining with each dataset’s native categories.
On the 100-image subsets in Table 14a, WINGS-Det exceeds YOLO26n by 1.7, 4.5, and 4.3 percentage points. On the complete held-out retraining sets in panel (b), WINGS-Det achieves 96.1%, 91.0%, and 89.9% mAP50, compared with 96.8%, 90.7%, and 89.6% on the 100-image subsets. The paired gains over YOLO26n are 2.9, 6.8, and 4.1 percentage points, with paired 95% confidence intervals of [2.2, 3.6], [5.7, 7.9], and [3.3, 4.9], respectively.
Table S4 evaluates dataset-specific retraining across partition seeds 42, 1024, and 3407. Each partition contains 800 training images, 100 validation images, and all remaining images for testing; YOLO26n and WINGS-Det share the partition for each seed. The three-run means ± sample SD for WINGS-Det are , , and mAP50 on datasets I, II, and III. Paired gains over YOLO26n are , , and percentage points. These statistics summarize retraining across different partitions; the image-level bootstrap intervals in Table 14b summarize uncertainty for a fixed checkpoint and test set.
4. Discussion
Beyond the quantitative evaluation, WINGS-Det is further examined under challenging cotton-field conditions and representative failure cases to characterize its behavior in practical scenes and identify the remaining error patterns.
4.1. Detection Under Challenging Cotton-Field Conditions
As shown in Figure 13, WINGS-Det maintains stable detection across four representative challenging conditions: complex field backgrounds, small and multi-scale targets, dense and overlapping targets, and partial occlusion.
Figure 13.
Detection results of WINGS-Det under challenging cotton-field conditions, including complex backgrounds, small and multi-scale targets, dense and overlapping targets, and partial occlusion.
Under cluttered vegetation backgrounds, cotton targets remain distinguishable from leaves, branches, and soil interference. For scenes with substantial scale variation, WINGS-Det detects both distant small instances and larger nearby targets. In dense and overlapping regions, most adjacent instances are separately localized, while partially occluded targets can still be identified from visible regions and surrounding context. Overall, these results demonstrate consistent detection behavior under background clutter, scale variation, target crowding, and occlusion.
4.2. Failure Cases and Error Pattern Analysis
The remaining errors are mainly concentrated in four conditions: very small targets, severe occlusion, boundary-truncated targets, and fine-grained category confusion, as illustrated in Figure 14.
Figure 14.
Representative failure cases of WINGS-Det, including missed small targets, occlusion-induced missed detections, missed boundary-truncated targets, and fine-grained category confusion.
Very small targets contain limited spatial and texture information and may therefore be missed. For small targets with insufficient spatial detail, super-resolution-assisted detection provides a potential route for recovering discriminative spatial cues [83,84,85]. Severe occlusion suppresses contour and local structural cues, making reliable recognition dependent on the effective exploitation of visible local structures and surrounding contextual information. Related agricultural vision studies have similarly emphasized hierarchical locality refinement for improving perception under occlusion [86]. Objects truncated by image boundaries further provide incomplete spatial evidence. Fine-grained confusion occurs when different developmental states exhibit highly similar colors, contours, and local textures, occasionally leading to incorrect classification or false detections. These error patterns identify small-target detail preservation, occlusion-aware contextual modeling, and stronger fine-grained feature separation as the main directions for further improvement.
4.3. Agricultural Implications and Deployment
Cotton opening changes both broad morphology and fine texture: the boll outline and opening extent provide coarse structure, while exposed fibers and opening boundaries generate finer spatial variations. Leaf contours and veins also contain high-frequency edges, making their association with overall morphology important for discrimination. C2WSA combines these cues through DCT-domain propagation of semantic and velocity fields, inverse DCT, and gating, integrating structural context with boundary and texture information.
WINGS-Det provides a lightweight visual solution for automated monitoring of cotton developmental states. By localizing and recognizing flowers, partially opened bolls, fully opened bolls, and defective bolls, the detector can provide object-level information for flowering monitoring, boll-maturity assessment, yield-related observation, and harvest decision support. Its compact architecture supports integration with field robots and edge-computing platforms; UAV deployment is considered below as a prospective application. The cross-hardware experiments further show that WINGS-Det can operate across desktop GPUs, CPU-only systems, and Jetson devices, supporting agricultural applications under different computational constraints. Cost-effective AUAV-based vision systems further demonstrate the feasibility of deploying deep-learning monitoring pipelines across spatially extensive ecological environments [87].
The self-collected dataset represents proximal ground-level imaging. UAV-based monitoring remains a prospective application and has not been validated using real aerial imagery in this study. Validation using aerial images acquired at the intended flight altitude and ground sampling distance is a direction for future work.
For field-scale deployment, high-resolution UAV imagery could be processed through overlapping tiles. Sensor resolution, focal length, and flight altitude would be selected jointly to preserve sufficient pixels per boll at the intended working distance. Tiling would retain the recorded detail at the detector input, while planned flight routes would extend geographic coverage. Detections could then be merged across tiles and associated across overlapping observations to produce spatial field summaries.
Visual localization and cooperative planning offer complementary components for such monitoring systems. VinsFusion-Line combines line features, stereo vision, and inertial measurements for camera localization [88]; dual-centralized Q-network reinforcement learning addresses cooperative UAV path planning [89]. For multi-platform perception, QCTF combines quantized communication with transferable feature fusion [90].
Future work will extend evaluation across regions and growth periods and incorporate temporal and multi-view observations for field monitoring [91]. For temporal association, Mobile-Le Harmonic Fusion with SiamMoT provides an example of combining recognition and tracking in video [92]. Multi-view GPR detection further illustrates how complementary views can support spatial association and localization [93]. The error patterns in Section 4.2 motivate improved detail preservation for small targets and contextual modeling under occlusion.
5. Conclusions
This study proposed WINGS-Det, a lightweight detector for fine-grained cotton recognition in complex field environments. C3k2LGL, SCMIFF, and C2WSA enhance local–global spatial modeling, cross-scale feature interaction, and frequency-aware representation, respectively. WINGS-Det achieves 98.9% mAP50 and 75.7% mAP50:95 with only 2.38 M parameters and 5.3 GFLOPs, with 163 FPS on an RTX 4090 using native PyTorch FP32 inference.
Further experiments show consistent advantages for fine-grained categories, small targets, and dense scenes, together with effective cross-architecture transfer, robustness to image degradation, cross-hardware deployment, and cross-dataset generalization. Overall, WINGS-Det provides a favorable balance between detection accuracy, computational efficiency, and deployment capability for cotton-field visual monitoring. Future work will extend the framework to broader field conditions, temporal and multi-view perception, and more severe occlusion scenarios.
Supplementary Materials
The following supporting information can be downloaded at: https://www.mdpi.com/article/10.3390/agriculture16212441/s1. Table S1. Effects of sparsification settings on detection accuracy, computational cost, and throughput. Table S2. Inference latency, throughput, and detection accuracy across hardware platforms and inference backends. Table S3. GPU, CPU, and Jetson memory usage during inference benchmarking. Table S4. Detection performance after dataset-specific retraining on three random partitions of each external dataset. Table S5. Confusion matrices for YOLO26n and WINGS-Det on the cotton test set. Table S6. Precision, recall, and average precision at an IoU threshold of 0.50 across target-scale and image-density groups. Table S7. Image and acquisition-group counts by data source and dataset split, including checks for shared groups across splits. Table S8. Theoretical FLOPs for each module-ablation configuration at batch size 1 and an input resolution of pixels.
Author Contributions
Conceptualization, Y.C. (Yushu Chen) and S.S.; methodology, Y.C. (Yushu Chen), Z.C. and Y.C. (Yulun Chen); software, Y.C. (Yushu Chen), K.Y. and F.X.; validation, Z.C., Y.W. and S.W.; formal analysis, Y.C. (Yushu Chen) and Y.C. (Yulun Chen); investigation, Y.W. and S.W.; resources, S.S. and H.Z.; data curation, Y.C. (Yushu Chen), Y.W. and S.W.; writing—original draft preparation, Y.C. (Yushu Chen); writing—review and editing, S.S., Z.C., Y.C. (Yulun Chen), K.Y., F.X., W.W. and H.Z.; visualization, Y.C. (Yushu Chen) and K.Y.; supervision, S.S. and H.Z.; project administration, S.S. and H.Z.; funding acquisition, S.S. and H.Z. All authors have read and agreed to the published version of the manuscript.
Funding
This work was supported by the Key Project of Xinjiang College of Science and Technology (Grant No. 2026-KYZD02), the Minjiang Young Scholar Program (Grant No. 2025-27), the Youth Fund of the Natural Science Foundation of Xinjiang Uygur Autonomous Region (Grant No. 2026D01C579), and the National Natural Science Foundation of China (Grant No. 62071123).
Data Availability Statement
The publicly available datasets used in this study can be accessed through the sources cited in Section 2.1, and the author-generated annotations are available from the corresponding authors upon reasonable request.
Acknowledgments
The authors would like to thank the local supporters for their assistance with data collection and the annotators for their efforts in dataset annotation. The authors also thank the anonymous reviewers for their constructive comments and suggestions, which substantially improved the quality of the manuscript.
Conflicts of Interest
The authors declare no conflicts of interest.
References
- Jiang, Y.; Li, C.; Xu, R.; Sun, S.; Robertson, J.S.; Paterson, A.H. DeepFlower: A deep learning-based approach to characterize flowering patterns of cotton plants in the field. Plant Methods 2020, 16, 156. [Google Scholar] [CrossRef] [Scilit] [PubMed]
- Petti, D.; Li, C. Weakly-supervised learning to automatically count cotton flowers from aerial imagery. Comput. Electron. Agric. 2022, 194, 106734. [Google Scholar] [CrossRef] [Scilit]
- Ashapure, A.; Jung, J.; Chang, A.; Oh, S.; Yeom, J.; Maeda, M.; Maeda, A.; Dube, N.; Landivar, J.; Hague, S.; et al. Developing a machine learning based cotton yield estimation framework using multi-temporal UAS data. ISPRS J. Photogramm. Remote Sens. 2020, 169, 180–194. [Google Scholar] [CrossRef] [Scilit]
- Xia, M.; Chen, X.; Tian, X.; Wen, H.; Zhao, Y.; Liu, H.; Liu, W.; Zheng, Y. Lightweight deep learning for real-time cotton monitoring: UAV-based defoliation and boll-opening rate assessment. Agriculture 2025, 15, 2095. [Google Scholar] [CrossRef] [Scilit]
- Xu, F.; Zhou, H.; Pan, Y.; Lu, Y.; Dong, L. DDF-DETR: A multi-scale spatial context method for field cotton seedling detection. Agriculture 2026, 16, 615. [Google Scholar] [CrossRef] [Scilit]
- Mo, H.; Wei, L. Lightweight detection of cotton leaf diseases using StyleGAN2-ADA and decoupled focused self-attention. J. King Saud Univ. Comput. Inf. Sci. 2025, 37, 41. [Google Scholar] [CrossRef] [Scilit]
- Thanammal Indu, V.; Suja Priyadharsini, S. Deep residual squeeze excited region convolutional network: A robust deep learning framework for precision agriculture and plant disease diagnosis. Cybern. Syst. 2026, 57, 1356–1385. [Google Scholar] [CrossRef] [Scilit]
- Wang, W.; Lu, B.; Wu, C.H. Cost-effective drone monitoring and evaluating toolkits for stream habitat health: Development and application. Environ. Monit. Assess. 2025, 198, 10. [Google Scholar] [CrossRef] [Scilit] [PubMed]
- Zhao, F.; Ren, Z.; Wang, J.; Wu, Q.; Xi, D.; Shao, X.; Liu, Y.; Chen, Y.; Mizuno, K. Smart UAV-assisted rose growth monitoring with improved YOLOv10 and Mamba restoration techniques. Smart Agric. Technol. 2025, 10, 100730. [Google Scholar] [CrossRef] [Scilit]
- Liu, Q.; Zhang, Y.; Yang, G. Small unopened cotton boll counting by detection with MRF-YOLO in the wild. Comput. Electron. Agric. 2023, 204, 107576. [Google Scholar] [CrossRef] [Scilit]
- Li, Y.; Cao, Z.; Lu, H.; Xiao, Y.; Zhu, Y.; Cremers, A.B. In-field cotton detection via region-based semantic image segmentation. Comput. Electron. Agric. 2016, 127, 475–486. [Google Scholar] [CrossRef] [Scilit]
- Li, Y.; Cao, Z.; Lu, H.; Xu, W. Unsupervised domain adaptation for in-field cotton boll status identification. Comput. Electron. Agric. 2020, 178, 105745. [Google Scholar] [CrossRef] [Scilit]
- Sun, S.; Li, C.; Paterson, A.H.; Chee, P.W.; Robertson, J.S. Image processing algorithms for infield single cotton boll counting and yield prediction. Comput. Electron. Agric. 2019, 166, 104976. [Google Scholar] [CrossRef] [Scilit]
- Li, A.; Bai, C.; Zhang, L.; Gao, L.; Fu, Z.; Yang, L. Lightweight detection of blueberries at different maturity stages in complex orchard environments. Agriculture 2026, 16, 1949. [Google Scholar] [CrossRef] [Scilit]
- Xu, X.; Wu, A.; Zhao, Y.; Wu, N.; Yang, D.; Mi, Y.; Skobelev, P. LGD-YOLO: An asymmetric lightweight network with dynamic feature alignment for greenhouse tomato maturity detection. Agriculture 2026, 16, 1517. [Google Scholar] [CrossRef] [Scilit]
- Wei, X.-S.; Song, Y.-Z.; Mac Aodha, O.; Wu, J.; Peng, Y.; Tang, J.; Yang, J.; Belongie, S. Fine-grained image analysis with deep learning: A survey. IEEE Trans. Pattern Anal. Mach. Intell. 2022, 44, 8927–8948. [Google Scholar] [CrossRef] [Scilit] [PubMed]
- Zhang, Z.-C.; Chen, Z.-D.; Wang, Y.; Luo, X.; Xu, X.-S. A vision transformer for fine-grained classification by reducing noise and enhancing discriminative information. Pattern Recognit. 2024, 145, 109979. [Google Scholar] [CrossRef] [Scilit]
- Chen, T.; Wang, L.; Liu, Y.; Yu, H. DACBN: Dual attention convolutional broad network for fine-grained visual recognition. Pattern Recognit. 2024, 156, 110749. [Google Scholar] [CrossRef] [Scilit]
- Wang, S.-Y.; Qu, Z.; Li, C.-J. A dense-aware Cross-splitNet for object detection and recognition. IEEE Trans. Circuits Syst. Video Technol. 2023, 33, 2290–2301. [Google Scholar] [CrossRef] [Scilit]
- Xu, X.; Chen, Z.; Hu, Y.; Wang, G. More signals matter to detection: Integrating language knowledge and frequency representations for boosting fine-grained aircraft recognition. Neural Netw. 2025, 187, 107402. [Google Scholar] [CrossRef] [Scilit] [PubMed]
- Sun, S.; Chen, Y.; Wu, H.; Qiao, Q.; Yang, M.; Qin, Z.; Wang, D.; Chu, X.; Xu, N.; Zhao, F. Maturity-aware fruit detection in real orchard scenes using super-resolution enhanced YOLOv13n. Adv. Eng. Inform. 2026, 76, 105145. [Google Scholar] [CrossRef] [Scilit]
- Zhao, F.; He, Y.; Song, J.; Wang, J.; Xi, D.; Shao, X.; Wu, Q.; Liu, Y.; Chen, Y.; Zhang, G.; et al. Smart UAV-assisted blueberry maturity monitoring with Mamba-based computer vision. Precis. Agric. 2025, 26, 56. [Google Scholar] [CrossRef] [Scilit]
- Karaca, B.; Ünlü, K.D.; Türkan, S. Wavelet-enhanced sequence-to-sequence modeling with attention mechanism for short-term wind power forecasting. Cybern. Syst. 2026, 57, 485–533. [Google Scholar] [CrossRef] [Scilit]
- Liu, L.; Ouyang, W.; Wang, X.; Fieguth, P.; Chen, J.; Liu, X.; Pietikäinen, M. Deep learning for generic object detection: A survey. Int. J. Comput. Vis. 2020, 128, 261–318. [Google Scholar] [CrossRef] [Scilit]
- Divya, U.H.; Kumar, J.P. Enhanced transfer learning-based CNN for abnormal human activity detection in video surveillance using spatial-temporal features. Cybern. Syst. 2026, 57, 1996–2025. [Google Scholar] [CrossRef] [Scilit]
- Ariza-Sentís, M.; Vélez, S.; Martínez-Peña, R.; Baja, H.; Valente, J. Object detection and tracking in precision farming: A systematic review. Comput. Electron. Agric. 2024, 219, 108757. [Google Scholar] [CrossRef] [Scilit]
- Lu, Z.; Chengao, Z.; Lu, L.; Yan, Y.; Jun, W.; Wei, X.; Ke, X.; Jun, T. Star-YOLO: A lightweight and efficient model for weed detection in cotton fields using advanced YOLOv8 improvements. Comput. Electron. Agric. 2025, 235, 110306. [Google Scholar] [CrossRef] [Scilit]
- Zhong, M.; Wei, L.; Mo, H. YOLOv8n-DSDL: A lightweight dual-backbone network with decoupled self-attention for cotton maturity detection. J. King Saud Univ. Comput. Inf. Sci. 2025, 37, 88. [Google Scholar] [CrossRef] [Scilit]
- Gao, S.-H.; Cheng, M.-M.; Zhao, K.; Zhang, X.-Y.; Yang, M.-H.; Torr, P. Res2Net: A new multi-scale backbone architecture. IEEE Trans. Pattern Anal. Mach. Intell. 2021, 43, 652–662. [Google Scholar] [CrossRef] [Scilit] [PubMed]
- Zhu, C.; Wu, S.; Chao, X.; Lao, M.; Yang, L.; Cai, L. D2FNet: A lightweight dual-driven texture–semantic fusion network for fine-grained real-time UAV weed–crop detection. Agriculture 2026, 16, 1067. [Google Scholar] [CrossRef] [Scilit]
- Liu, C.; Zhao, D.; Gao, J.; Shi, H.; Sun, H.; Wu, W.; Hu, J.; Li, Q. YOLO-PINE: A lightweight pineapple object detection method based on an improved YOLO11n. Agriculture 2026, 16, 1546. [Google Scholar] [CrossRef] [Scilit]
- Zhang, J.; Song, X.; Li, Y.; Liang, D.; Zhang, Z.; Cai, J. Adaptive dual cross-attention network for multispectral object detection in autonomous driving. Expert Syst. Appl. 2026, 318, 132012. [Google Scholar] [CrossRef] [Scilit]
- Zhang, J.; Xiang, M.; Hu, Y.; Hao, W.; Lei, L.; Yi, K. Multivariate feature learning and associative spatial information enhancement for snow object detection in autonomous driving. Eng. Appl. Artif. Intell. 2026, 175, 114672. [Google Scholar] [CrossRef] [Scilit]
- Zhao, F.; Huang, J.; Liu, Y.; Wang, J.; Chen, Y.; Shao, X.; Ma, B.; Xi, D.; Zhang, M.; Tu, Z.; et al. A Deep Learning Approach Combining Super-Resolution and Segmentation to Identify Weed and Tobacco in UAV Imagery. In Proceedings of the 2024 9th International Conference on Electronic Technology and Information Science (ICETIS), Hangzhou, China, 17–19 May 2024; pp. 594–597. [Google Scholar] [CrossRef] [Scilit]
- Yang, L.; Wu, X.; Wang, X.; Zhang, L. MMAF-YOLO: A UAV object detection network based on multi-scale mutual aggregation and fine-grained feature modulation. J. King Saud Univ. Comput. Inf. Sci. 2026, 38, 354. [Google Scholar] [CrossRef] [Scilit]
- Zhao, F.; Xu, D.; Ren, Z.; Shao, X.; Wu, Q.; Liu, Y.; Wang, J.; Song, J.; Chen, Y.; Zhang, G.; et al. Mamba-based super-resolution and semi-supervised YOLOv10 for freshwater mussel detection using acoustic video camera: A case study at Lake Izunuma, Japan. Ecol. Inform. 2025, 90, 103324. [Google Scholar] [CrossRef] [Scilit]
- Zhao, F.; Huang, B.; Wang, J.; Shao, X.; Wu, Q.; Xi, D.; Liu, Y.; Chen, Y.; Zhang, G.; Ren, Z.; et al. Seafloor debris detection using underwater images and deep learning-driven image restoration: A case study from Koh Tao, Thailand. Mar. Pollut. Bull. 2025, 214, 117710. [Google Scholar] [CrossRef] [Scilit] [PubMed]
- Belmer Gladson, V.; Deepa, G.; Febeena Ezhil Jothi, S.; Mahalakshmi, L. Image steganography with security using massive threefold attentional residual GAN optimized by chaotic PSO algorithm. Cybern. Syst. 2026, 57, 1277–1308. [Google Scholar] [CrossRef] [Scilit]
- Liu, X.; Li, Z.; Zhou, Y.; Peng, Y.; Luo, J. Camera–radar fusion with modality interaction and radar Gaussian expansion for 3D object detection. Cyborg Bionic Syst. 2024, 5, 0079. [Google Scholar] [CrossRef] [Scilit] [PubMed]
- Li, Z.; Zheng, W.; Yang, L.; Ma, L.; Zhou, Y.; Peng, Y. MonoAux: Fully exploiting auxiliary information and uncertainty for monocular 3D object detection. Cyborg Bionic Syst. 2024, 5, 0097. [Google Scholar] [CrossRef] [Scilit] [PubMed]
- Cardellicchio, A.; Renò, V.; Cellini, F.; Summerer, S.; Petrozza, A.; Milella, A. Incremental learning with domain adaption for tomato plant phenotyping. Smart Agric. Technol. 2025, 12, 101324. [Google Scholar] [CrossRef] [Scilit]
- Han, K.; Wang, Y.; Chen, H.; Chen, X.; Guo, J.; Liu, Z.; Tang, Y.; Xiao, A.; Xu, C.; Xu, Y.; et al. A survey on vision transformer. IEEE Trans. Pattern Anal. Mach. Intell. 2023, 45, 87–110. [Google Scholar] [CrossRef] [Scilit] [PubMed]
- Jiao, R.; Zhang, J.; Li, C.; Hu, L. Large-kernel spatially parallel feature fusion for monocular 3D perception in autonomous driving. Knowl.-Based Syst. 2026, 343, 115998. [Google Scholar] [CrossRef] [Scilit]
- Zhang, Z.; Zhu, M.; Yang, X.; Li, T. EJRSNet: A joint mechanism network for object detection with efficient receiving and sending of hierarchical feature information. Expert Syst. Appl. 2025, 268, 126375. [Google Scholar] [CrossRef] [Scilit]
- Chen, L.; Fu, Y.; Gu, L.; Yan, C.; Harada, T.; Huang, G. Frequency-aware feature fusion for dense image prediction. IEEE Trans. Pattern Anal. Mach. Intell. 2024, 46, 10763–10780. [Google Scholar] [CrossRef] [Scilit] [PubMed]
- Zhang, Y.; Li, L.; Chun, C.; Wen, Y.; Xu, G. Multi-scale feature adaptive fusion model for real-time detection in complex citrus orchard environments. Comput. Electron. Agric. 2024, 219, 108836. [Google Scholar] [CrossRef] [Scilit]
- Tang, F.; Nian, B.; Ding, J.; Ma, W.; Quan, Q.; Dong, C.; Yang, J.; Liu, W.; Zhou, S.K. Mobile U-ViT: Revisiting large kernel and U-shaped ViT for efficient medical image segmentation. In Proceedings of the 33rd ACM International Conference on Multimedia; ACM: New York, NY, USA, 2025; pp. 3408–3417. [Google Scholar] [CrossRef] [Scilit]
- Zhang, Y.; Ding, X.; Yue, X. Scaling up your kernels: Large kernel design in ConvNets toward universal representations. IEEE Trans. Pattern Anal. Mach. Intell. 2025, 47, 11692–11707. [Google Scholar] [CrossRef] [Scilit] [PubMed]
- Cao, Y.; Xu, J.; Lin, S.; Wei, F.; Hu, H. Global context networks. IEEE Trans. Pattern Anal. Mach. Intell. 2023, 45, 6881–6895. [Google Scholar] [CrossRef] [Scilit] [PubMed]
- Zhao, F.; Xue, F.; Si, Y.; Qin, Z.; Guo, X.; Zhang, X.; Sun, Y.; Chen, Y.; Sun, S.; Wu, H.; et al. GLoDA-Net: A lightweight global–local directional aggregation network for floating waste detection in inland waters using unmanned surface vehicles (USVs). Mar. Pollut. Bull. 2026, 233, 120336. [Google Scholar] [CrossRef] [Scilit] [PubMed]
- Zhang, W.; Liao, M. Cross-scale adaptive transformer with hierarchical feature synergy for aerial small object detection. Pattern Recognit. 2026, 173, 112822. [Google Scholar] [CrossRef] [Scilit]
- Cheng, D.; Li, H.; Zhou, Z.; Yang, Y. MA-Neck: Mutual attention-based feature enhancement for lightweight object detection. Pattern Recognit. 2026, 171, 112254. [Google Scholar] [CrossRef] [Scilit]
- Shu, Z.; Wu, J.; Yan, W.; Liu, X.; Zhang, H.; Liu, C.; Mao, Y.; Chen, J. WaveFormer: Frequency-time decoupled vision modeling with wave equation. Proc. AAAI Conf. Artif. Intell. 2026, 40, 25428–25436. [Google Scholar] [CrossRef] [Scilit]
- Suwathi, M. Cotton Boll Detection Dataset. 2024. Roboflow Universe. Version 1, Released 24 February 2024. Available online: https://universe.roboflow.com/suwathi-m/cotton-boll-detection/dataset/1 (accessed on 23 September 2026).
- Jocher, G.; Qiu, J.; Liu, M.; Lyu, S.; Akyon, F.C.; Kalfaoglu, M.E. Ultralytics YOLO26: Unified real-time end-to-end vision models. arXiv 2026. [Google Scholar] [CrossRef] [Scilit]
- Yi, W.; Liu, G.; Zheng, W. A detection-oriented cross-scale fusion YOLOv11 for UAV object detection in hazy environments. J. King Saud Univ. Comput. Inf. Sci. 2026, 38, 536. [Google Scholar] [CrossRef] [Scilit]
- Shang, L.; Qiao, Y.; Lei, H.; Wu, Z.; Yang, W. WSADet: A wavelet scale-aware UAV object detector for complex conditions. Pattern Recognit. 2026, 174, 112965. [Google Scholar] [CrossRef] [Scilit]
- Wu, Y.; Liu, S.; Zhu, D.; Wang, L.; Li, J. DAWDet: A dynamic content-aware multi-branch framework with adaptive wavelet boosting for small object detection. Pattern Recognit. 2026, 174, 112979. [Google Scholar] [CrossRef] [Scilit]
- Zhou, H.; Tian, C.; Zhang, Z.; Li, C.; Xie, Y.; Li, Z. Frequency-aware feature aggregation network with dual-task consistency for RGB-T salient object detection. Pattern Recognit. 2024, 146, 110043. [Google Scholar] [CrossRef] [Scilit]
- Sandler, M.; Howard, A.; Zhu, M.; Zhmoginov, A.; Chen, L.-C. MobileNetV2: Inverted residuals and linear bottlenecks. In Proceedings of the IEEE Conference on Computer Vision and Pattern Recognition (CVPR); IEEE Computer Society: Los Alamitos, CA, USA, 2018; pp. 4510–4520. [Google Scholar] [CrossRef] [Scilit]
- Selvaraju, R.R.; Cogswell, M.; Das, A.; Vedantam, R.; Parikh, D.; Batra, D. Grad-CAM: Visual explanations from deep networks via gradient-based localization. In Proceedings of the IEEE International Conference on Computer Vision (ICCV); IEEE Computer Society: Los Alamitos, CA, USA, 2017; pp. 618–626. [Google Scholar] [CrossRef] [Scilit]
- Zhao, Y.; Lv, W.; Xu, S.; Wei, J.; Wang, G.; Dang, Q.; Liu, Y.; Chen, J. DETRs beat YOLOs on real-time object detection. In Proceedings of the IEEE/CVF Conference on Computer Vision and Pattern Recognition (CVPR); IEEE: Piscataway, NJ, USA, 2024; pp. 16965–16974. [Google Scholar] [CrossRef] [Scilit]
- Han, K.; Wang, Y.; Tian, Q.; Guo, J.; Xu, C.; Xu, C. GhostNet: More features from cheap operations. In Proceedings of the IEEE/CVF Conference on Computer Vision and Pattern Recognition (CVPR); IEEE: Piscataway, NJ, USA, 2020; pp. 1577–1586. [Google Scholar] [CrossRef] [Scilit]
- Wang, Z.; Li, C.; Xu, H.; Zhu, X.; Li, H. Mamba YOLO: A simple baseline for object detection with state space model. Proc. AAAI Conf. Artif. Intell. 2025, 39, 8205–8213. [Google Scholar] [CrossRef] [Scilit]
- Liu, W.; Anguelov, D.; Erhan, D.; Szegedy, C.; Reed, S.; Fu, C.-Y.; Berg, A.C. SSD: Single shot MultiBox detector. In Computer Vision–ECCV 2016; Springer: Cham, Switzerland, 2016; Volume 9905, pp. 21–37. [Google Scholar] [CrossRef] [Scilit]
- Ren, S.; He, K.; Girshick, R.; Sun, J. Faster R-CNN: Towards real-time object detection with region proposal networks. In Advances in Neural Information Processing Systems; Curran Associates, Inc.: Red Hook, NY, USA, 2015; Volume 28, pp. 91–99. Available online: https://proceedings.neurips.cc/paper_files/paper/2015/file/14bfa6bb14875e45bba028a21ed38046-Paper.pdf (accessed on 31 October 2026).
- Cheng, T.; Song, L.; Ge, Y.; Liu, W.; Wang, X.; Shan, Y. YOLO-World: Real-time open-vocabulary object detection. In Proceedings of the IEEE/CVF Conference on Computer Vision and Pattern Recognition (CVPR); IEEE: Piscataway, NJ, USA, 2024; pp. 16901–16911. [Google Scholar] [CrossRef] [Scilit]
- Wang, C.-Y.; Yeh, I.-H.; Liao, H.-Y.M. YOLOv9: Learning what you want to learn using programmable gradient information. In Computer Vision–ECCV 2024; Springer: Cham, Switzerland, 2025; Volume 15089, pp. 1–21. [Google Scholar] [CrossRef] [Scilit]
- Wang, A.; Chen, H.; Liu, L.; Chen, K.; Lin, Z.; Han, J.; Ding, G. YOLOv10: Real-time end-to-end object detection. In Advances in Neural Information Processing Systems; Morgan Kaufmann Publishers: San Mateo, CA, USA, 2024; Volume 37, pp. 107984–108011. [Google Scholar] [CrossRef] [Scilit]
- Jocher, G.; Qiu, J. Ultralytics YOLO11. 2024. Available online: https://docs.ultralytics.com/models/yolo11/ (accessed on 31 October 2026).
- Tian, Y.; Ye, Q.; Doermann, D. YOLOv12: Attention-centric real-time object detectors. arXiv 2025. [Google Scholar] [CrossRef] [Scilit]
- Lei, M.; Li, S.; Wu, Y.; Hu, H.; Zhou, Y.; Zheng, X.; Ding, G.; Du, S.; Wu, Z.; Gao, Y. YOLOv13: Real-time object detection with hypergraph-enhanced adaptive visual perception. arXiv 2025. [Google Scholar] [CrossRef] [Scilit]
- Wang, R.-F.; Xu, M.; Bauer, M.; Schardong, I.; Ma, X.; Chee, P.; Cui, K. Cott-ADNet: Lightweight real-time cotton boll and flower detection under field conditions. In Proceedings of the IEEE/CVF Winter Conference on Applications of Computer Vision Workshops (WACVW); IEEE: Piscataway, NJ, USA, 2026; pp. 500–509. [Google Scholar] [CrossRef] [Scilit]
- Tan, C.; Li, C.; Sun, J. Dense cotton boll counting with transformer-based video tracking and a customized phenotyping robot for data collection. Comput. Electron. Agric. 2026, 240, 111214. [Google Scholar] [CrossRef] [Scilit]
- Ultralytics. Ultralytics YOLO26 Documentation. 2026. Available online: https://docs.ultralytics.com/models/yolo26/ (accessed on 31 October 2026).
- Wang, W.; Wang, C.; Wei, W.; Tang, Y.; Zeng, B. A lightweight object detection algorithm for resource-constrained UAVs via multi-module optimization and channel pruning. J. King Saud Univ. Comput. Inf. Sci. 2025, 37, 339. [Google Scholar] [CrossRef] [Scilit]
- Liu, Z.; Wang, J.; Wu, H.; Xue, F.; Qin, Z.; Sun, S.; Guo, X.; Zhao, F. Water-aware real-time detection of floating plastic debris via an enhanced YOLOv13 framework for aquatic pollution monitoring. Expert Syst. Appl. 2026, 313, 131552. [Google Scholar] [CrossRef] [Scilit]
- Zhao, F.; Xue, F.; Wang, J.; Yi, J.; Zhang, D.; Liu, Y.; Shao, X.; Chen, Y.; Song, J.; Li, N.; et al. CoralSMIA: Physically grounded scattering modeling and illumination adaptation for generalized underwater coral segmentation. IEEE Trans. Geosci. Remote Sens. 2026, 64, 4210116. [Google Scholar] [CrossRef] [Scilit]
- Gu, X.; Chen, J. Progressive degradation-aware distillation for robust indoor object detection. Sci. Rep. 2026, 16, 35431. [Google Scholar] [CrossRef] [Scilit]
- TXLJ. 2025 Cotton Boll Dataset. 2026. Roboflow Universe. CC BY 4.0. Available online: https://universe.roboflow.com/txlj/2025-qfdzm (accessed on 20 September 2026).
- Kanase, A. Cotton 5-Class Dataset. 2024. Roboflow Universe. CC BY 4.0. Available online: https://universe.roboflow.com/abhimanyu-kanase-wppwk/cotton_5_class (accessed on 20 September 2026).
- PV Research. Maturity Analysis Dataset. 2025. Roboflow Universe. CC BY 4.0. Available online: https://universe.roboflow.com/pv-research/maturity-analysis (accessed on 20 September 2026).
- Zhao, F.; Ma, B.; Xi, D.; Wang, J.; Chen, Y.; Liu, Y.; Shao, X.; Zhang, M.; Zhang, G.; Chen, J.; et al. Deep learning-based super-resolution reconstruction and improved YOLOv9 for efficient benthos detection: A case study at Lake Hamana, Japan. Remote Sens. Ecol. Conserv. 2026, 12, 712–726. [Google Scholar] [CrossRef] [Scilit]
- Zhao, F.; Liu, Y.; Wang, J.; Xue, F.; Yang, K.; Shao, X.; Chen, J.; Yin, Z.; Wu, H.; Chen, Y.; et al. UAV-based super-resolution instance segmentation enables ecological monitoring of sea cucumbers in shallow coral reef habitats. Mar. Pollut. Bull. 2026, 233, 120417. [Google Scholar] [CrossRef] [Scilit] [PubMed]
- Zhao, F.; Chen, Y.; Xi, D.; Liu, Y.; Wang, J.; Tabeta, S.; Mizuno, K. Enhanced hermit crabs detection using super-resolution reconstruction and improved YOLOv8 on UAV-captured imagery. Mar. Environ. Res. 2025, 210, 107313. [Google Scholar] [CrossRef] [Scilit] [PubMed]
- Wang, Y.; Li, N.; He, D.; Sun, S.; Chu, X.; Qin, Z.; Xue, F.; Yi, J.; Wu, H.; Zhang, H.-S.; et al. Occlusion-robust cattle pose estimation for precision livestock monitoring using hierarchical locality refinement. Animals 2026, 16, 2575. [Google Scholar] [CrossRef] [Scilit] [PubMed]
- Zhao, F.; Wang, J.; Chen, Y.; Shao, X.; Liu, Y.; Chen, Y.; Xue, F.; Sasaki, J.; Mizuno, K. Cost-effective ecological monitoring in shallow waters using amphibious unmanned aerial vehicles (AUAV) and deep learning-based computer vision. Mar. Environ. Res. 2026, 216, 107911. [Google Scholar] [CrossRef] [Scilit] [PubMed]
- Yang, G.; Jiang, Y.; Wang, S.; Chen, K. VinsFusion-Line: Binocular vision inertial navigation real-time SLAM system based on line features. Cybern. Syst. 2026, 57, 350–375. [Google Scholar] [CrossRef] [Scilit]
- Chen, J.; Ren, C.; Hu, Y.; Zhang, Y.; Lu, Y.; Li, Q.; You, T.; Rodrigues, J.J.P.C. Dual-centralized Q-network-based reinforcement learning for cooperative path planning of multiple UAVs. IEEE Trans. Intell. Transp. Syst. 2025, 26, 13232–13246. [Google Scholar] [CrossRef] [Scilit]
- Chen, J.; Shu, Q.; Lu, Y.; Zhang, Y.; Wang, Y. QCTF: A quantized communication and transferable fusion framework for multi-agent collaborative perception. IEEE Trans. Intell. Transp. Syst. 2025, 26, 15013–15027. [Google Scholar] [CrossRef] [Scilit]
- Chen, J.; Li, P.; Lee, J.; Shao, X.; Zhao, F.; Sasaki, J. Optimization of oblique drone photogrammetry for avoiding sun glint in submerged seagrass mapping. Estuar. Coast. Shelf Sci. 2025, 322, 109356. [Google Scholar] [CrossRef] [Scilit]
- Shajeena, J.; Govindasamy, B.; Gnanasundaram, M.; Robinson Joel, M. Mobile-Le harmonic fusion network for object recognition and SiamMoT based multi-object tracking using video surveillance. Cybern. Syst. 2026, 57, 866–896. [Google Scholar] [CrossRef] [Scilit]
- Lv, H.; Li, C.; Dai, J.; Zhang, Y.; Fan, Z.; Tan, Y.; Wang, D.; Xie, B. Lightweight framework for underground pipeline recognition and spatial localization based on multiview 2-D GPR images. IEEE Trans. Geosci. Remote Sens. 2025, 63, 1–15. [Google Scholar] [CrossRef] [Scilit]
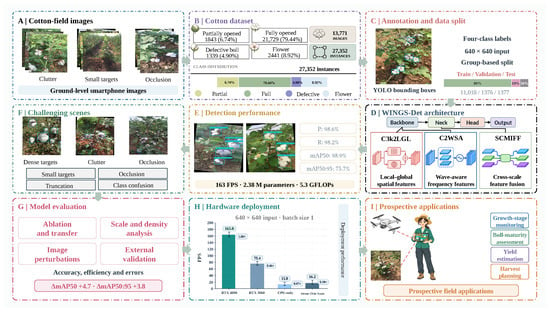
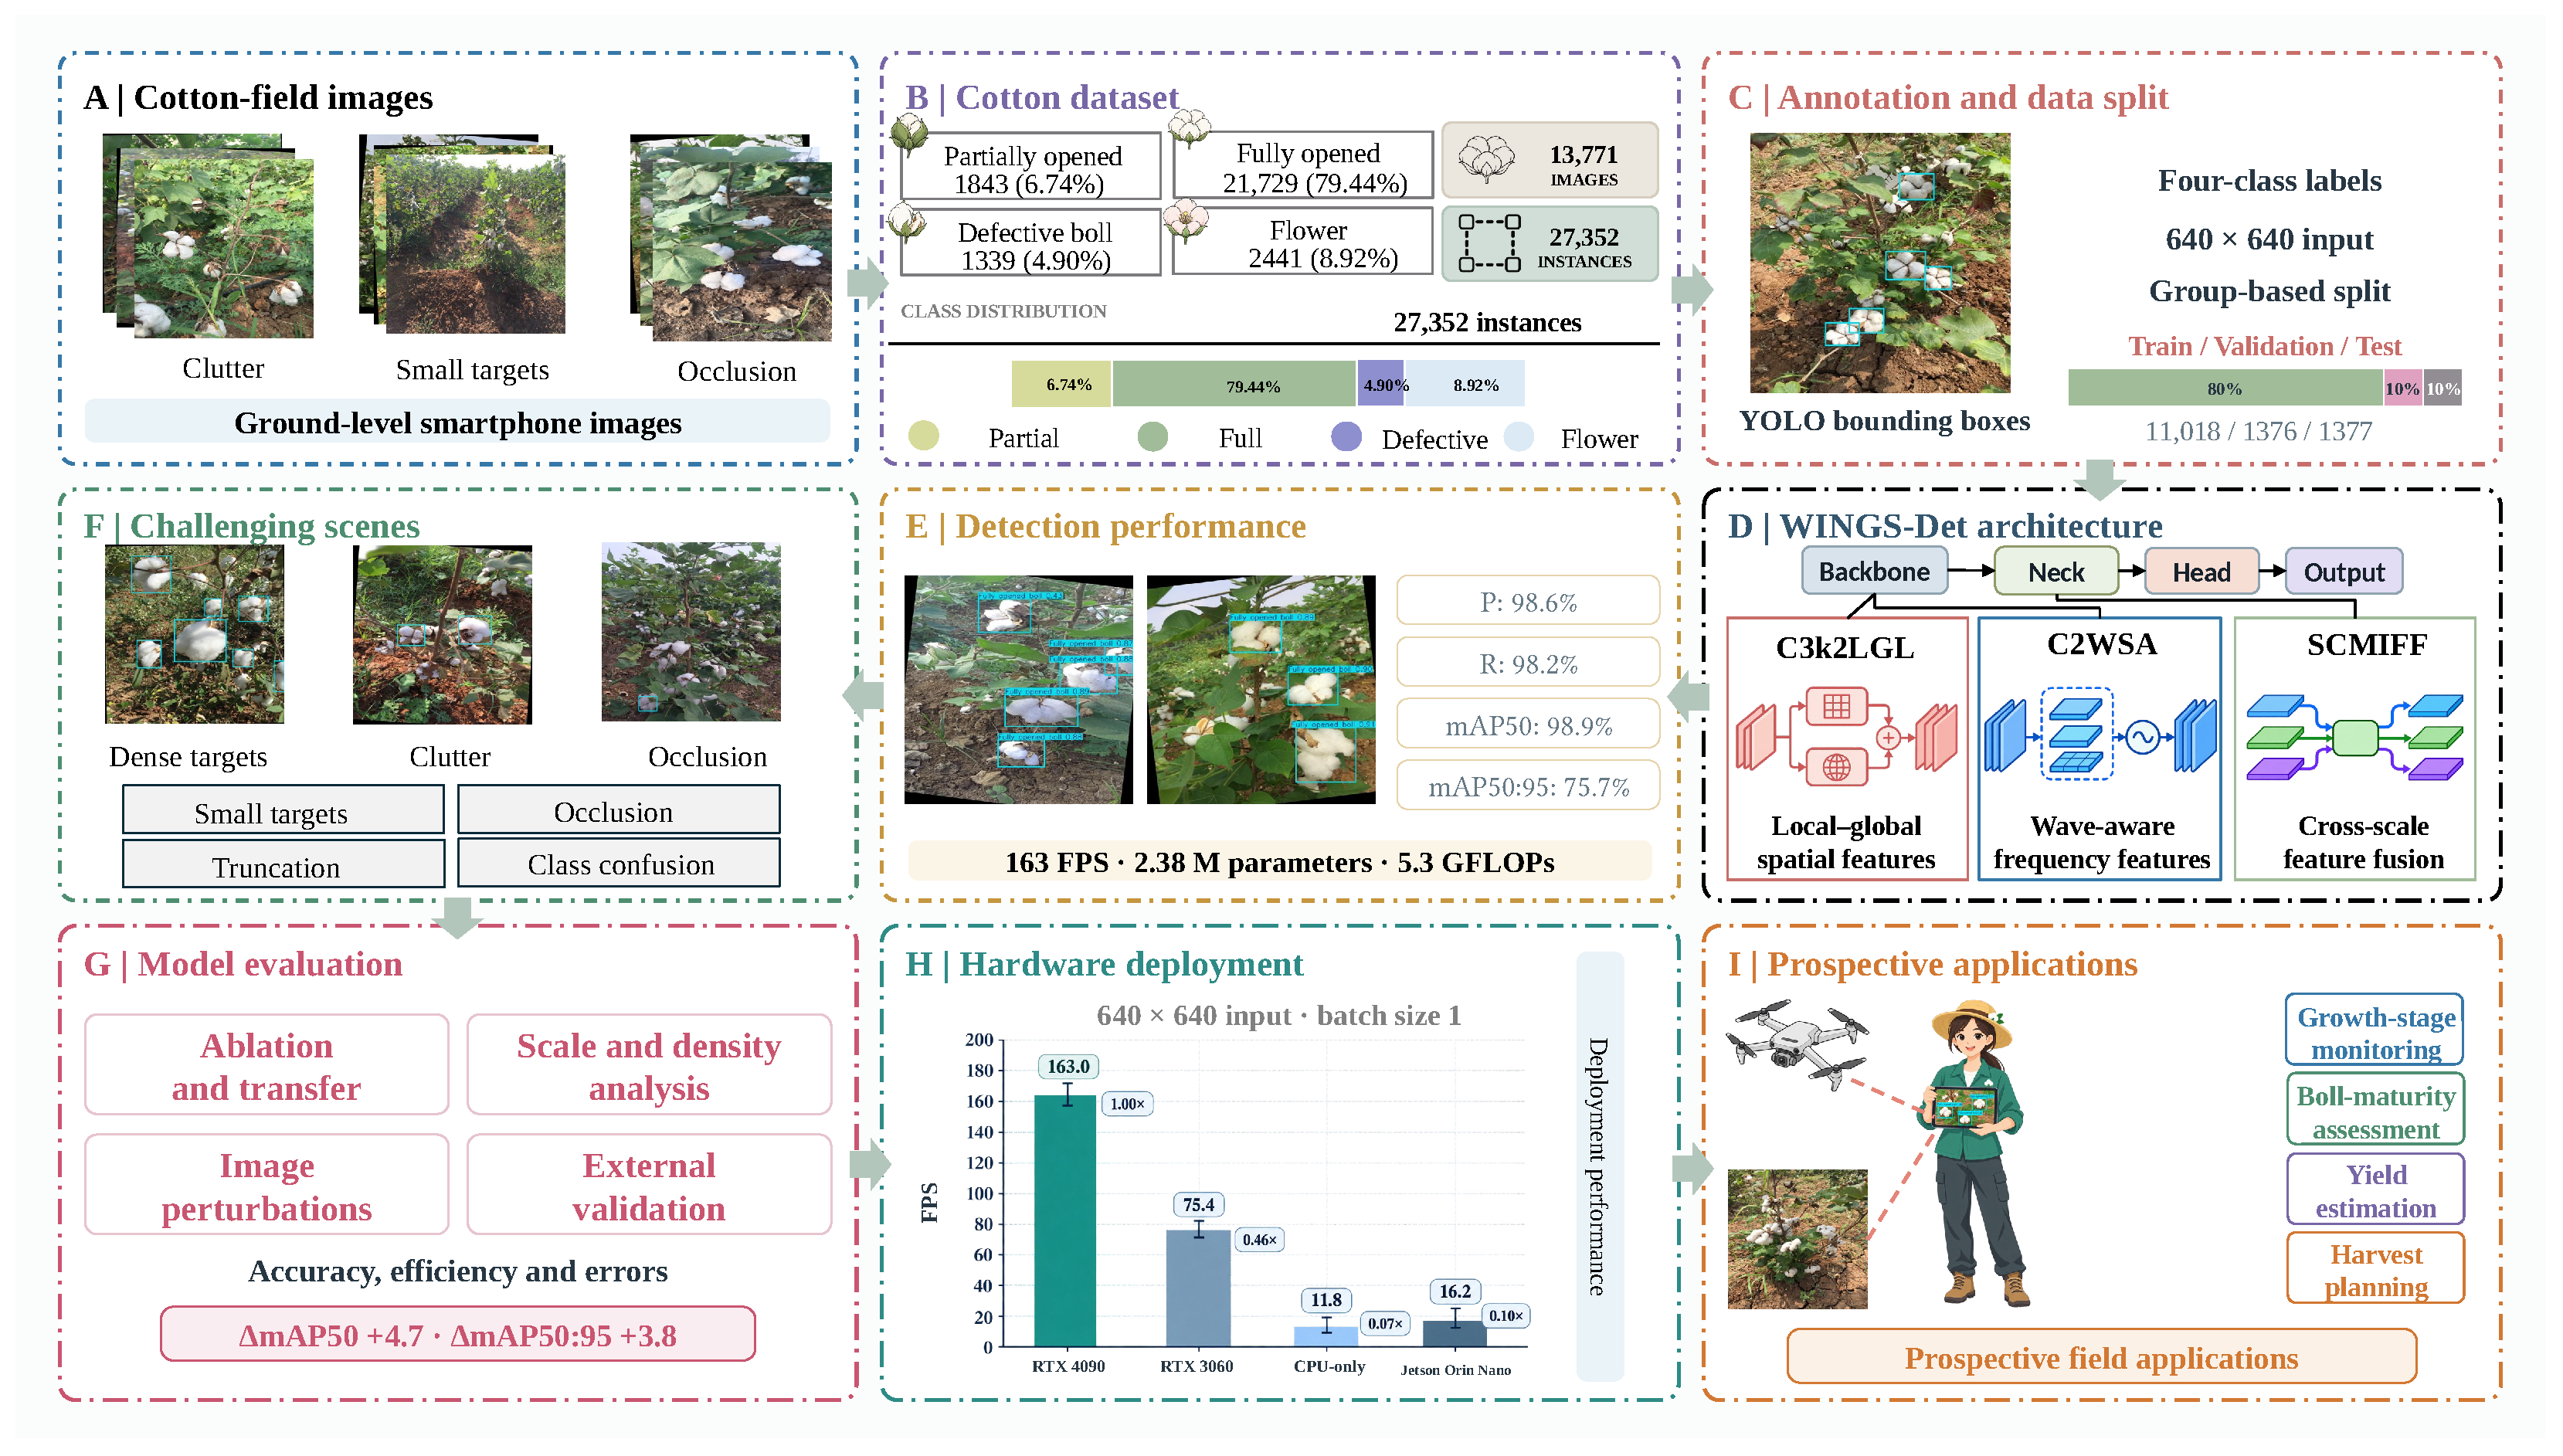
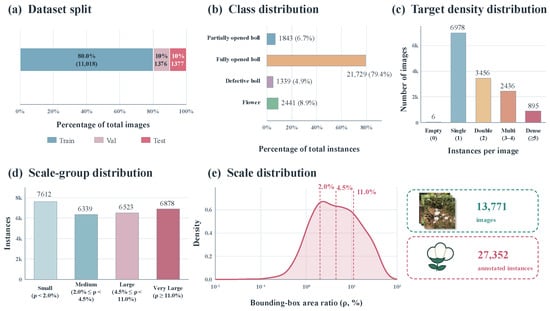
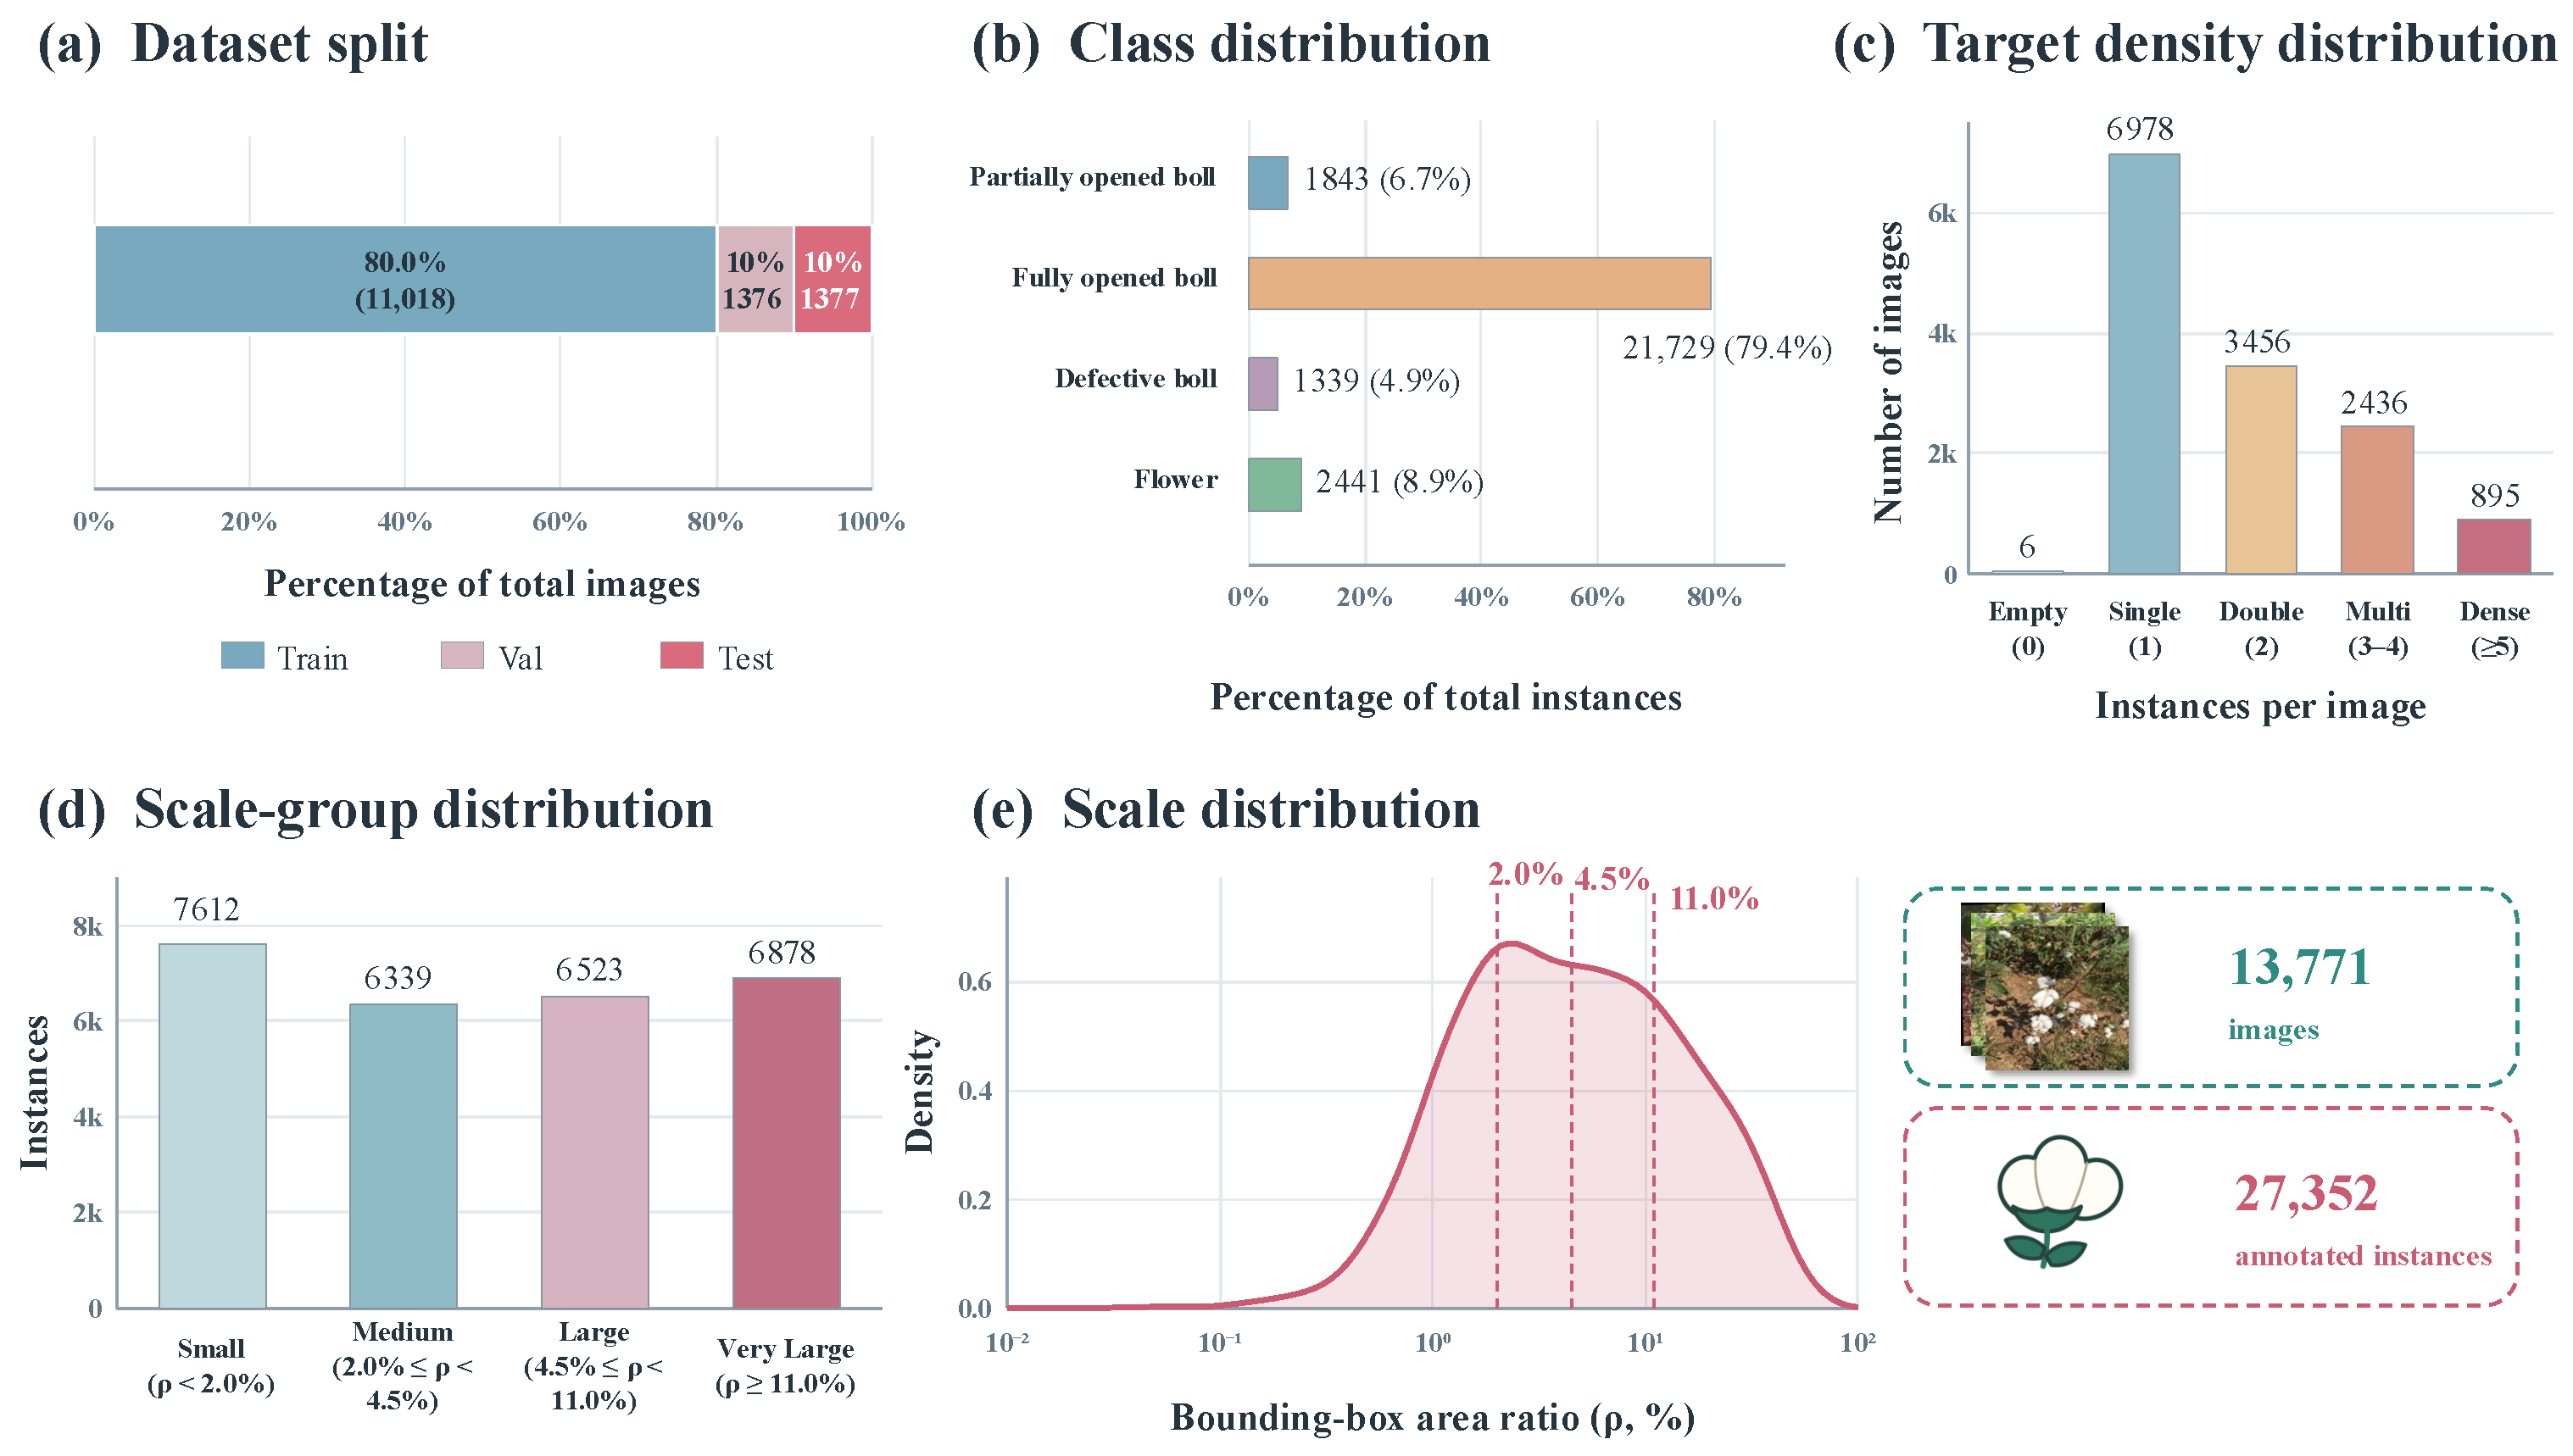
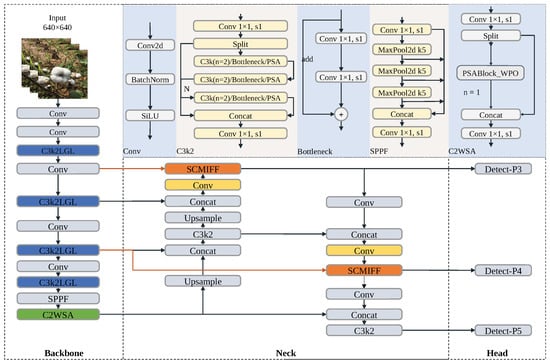
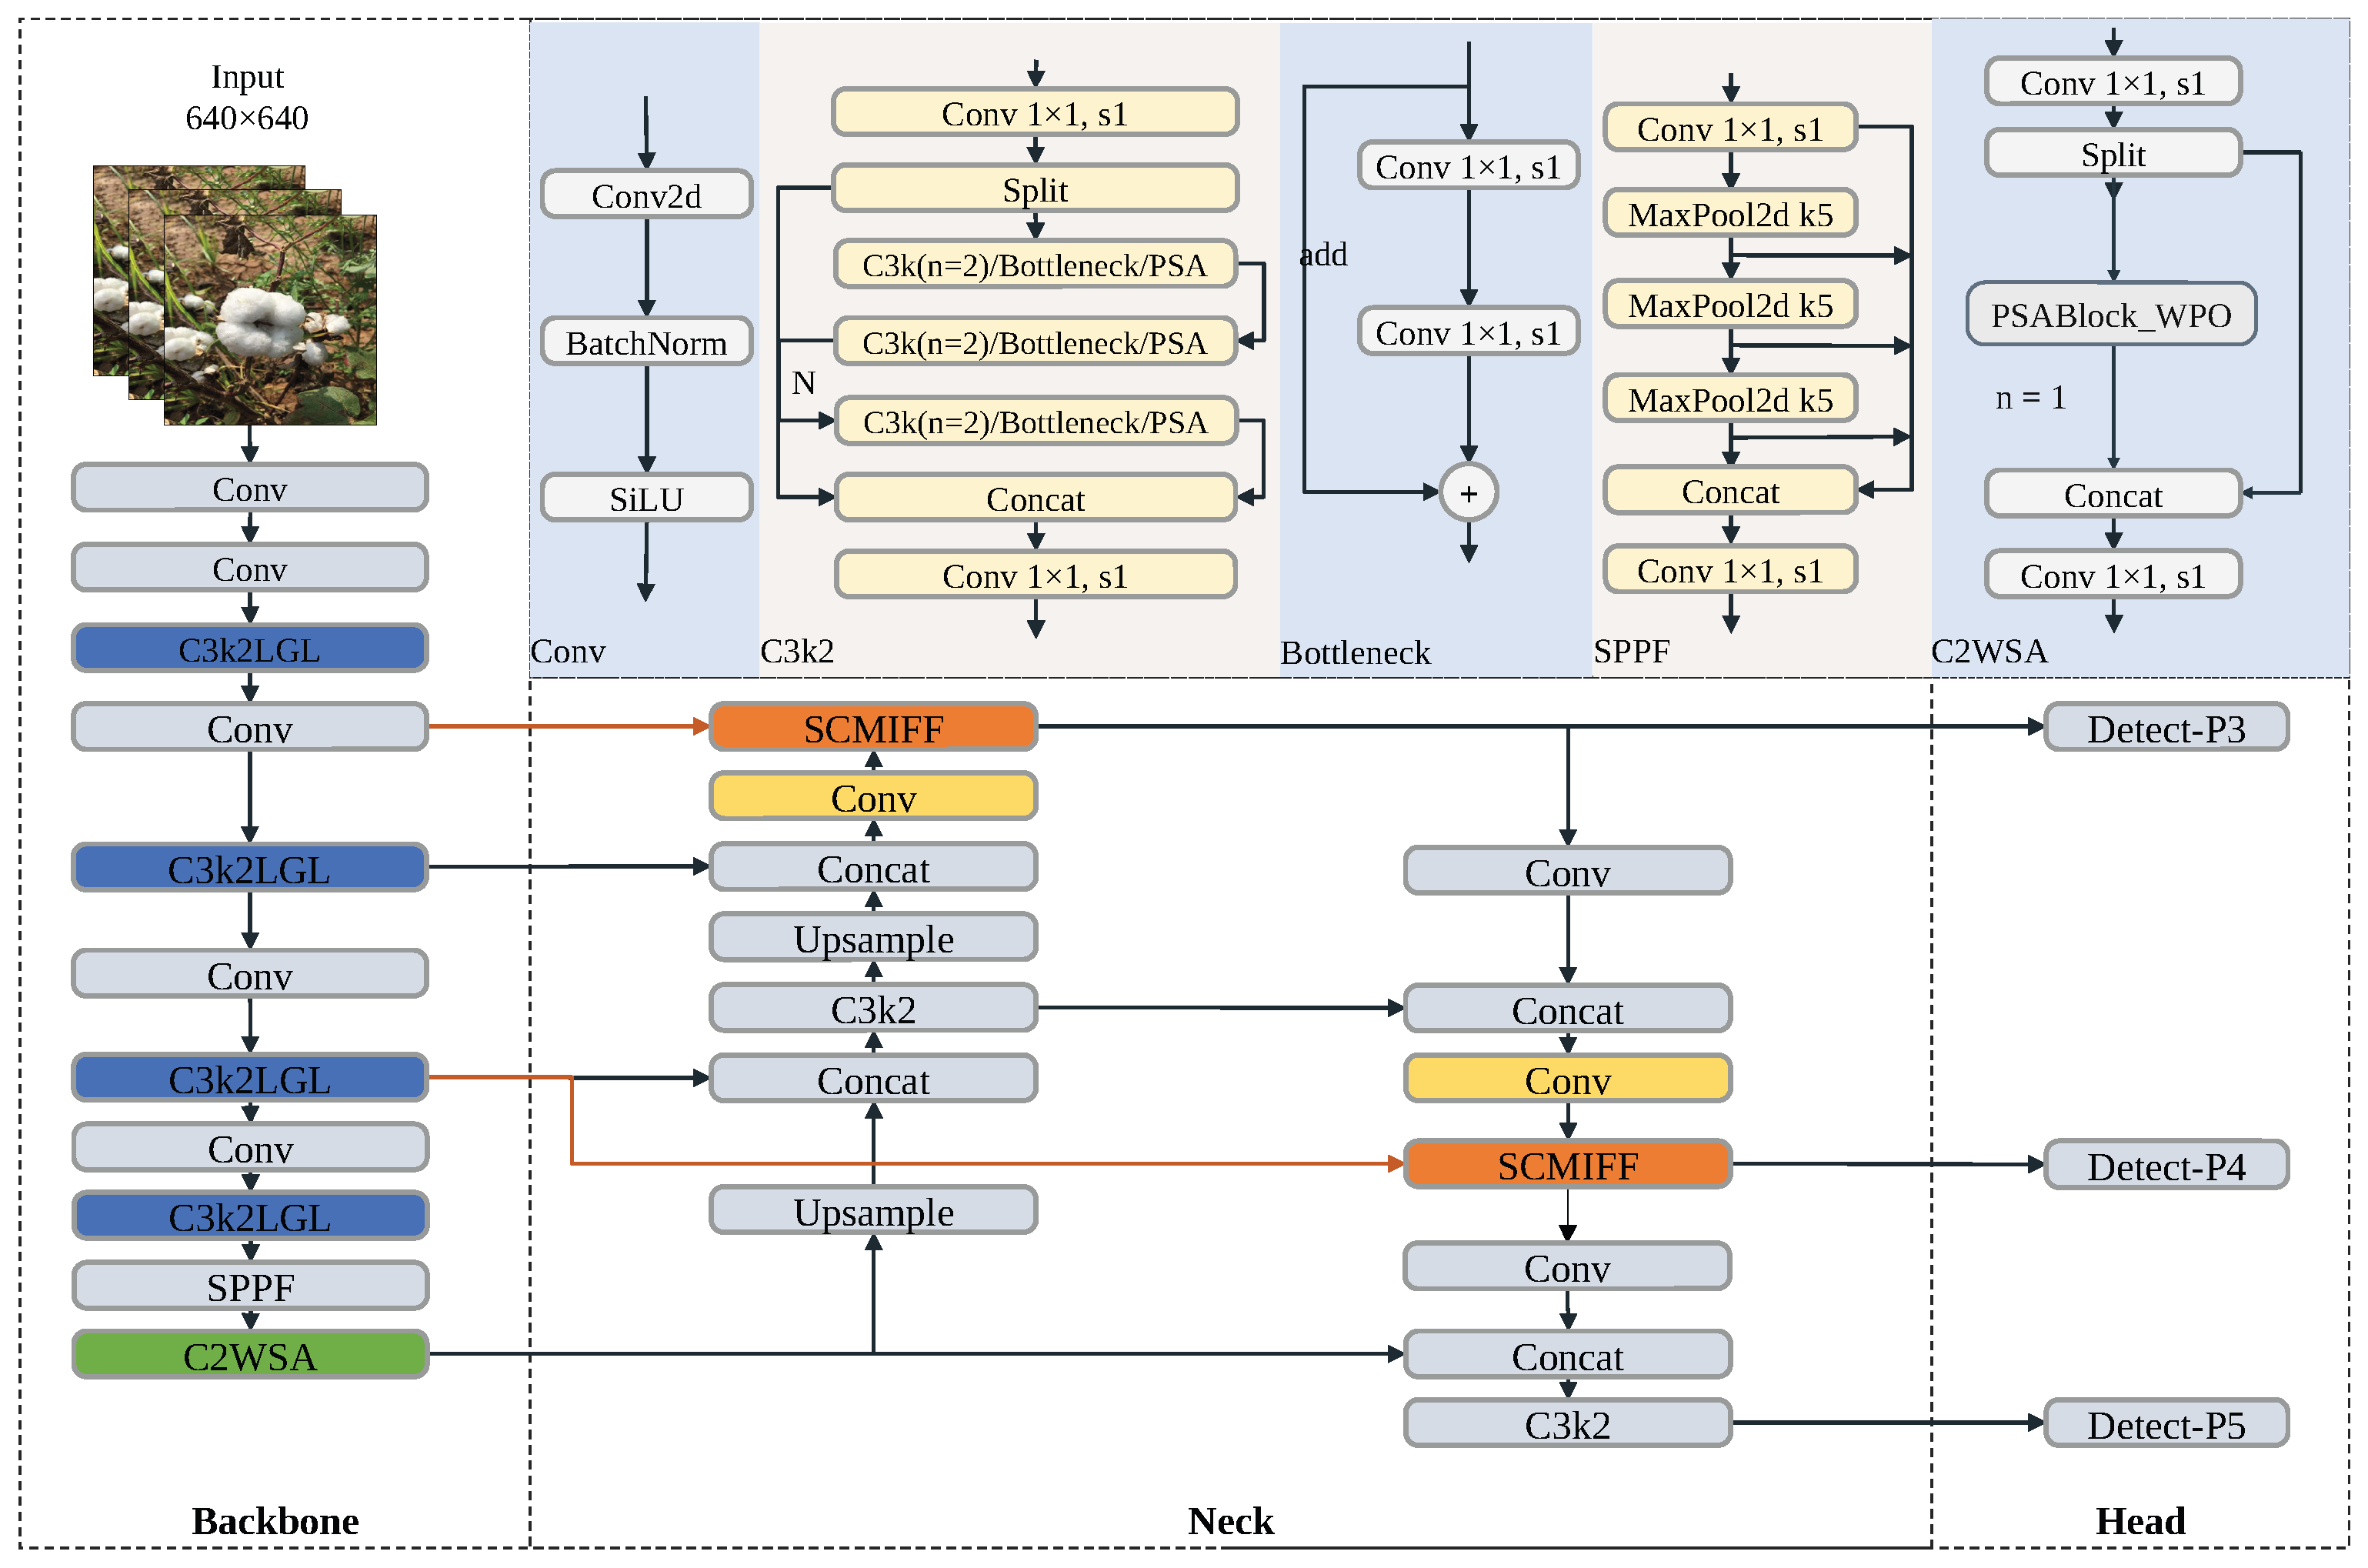
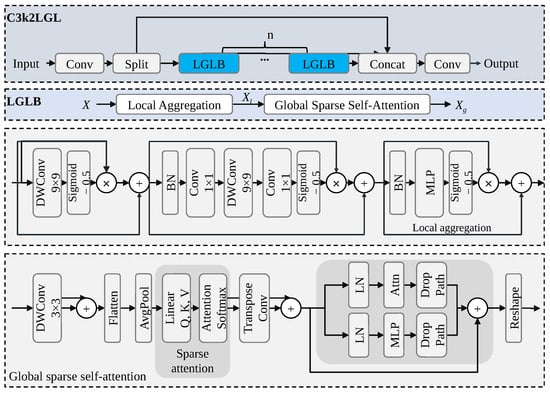
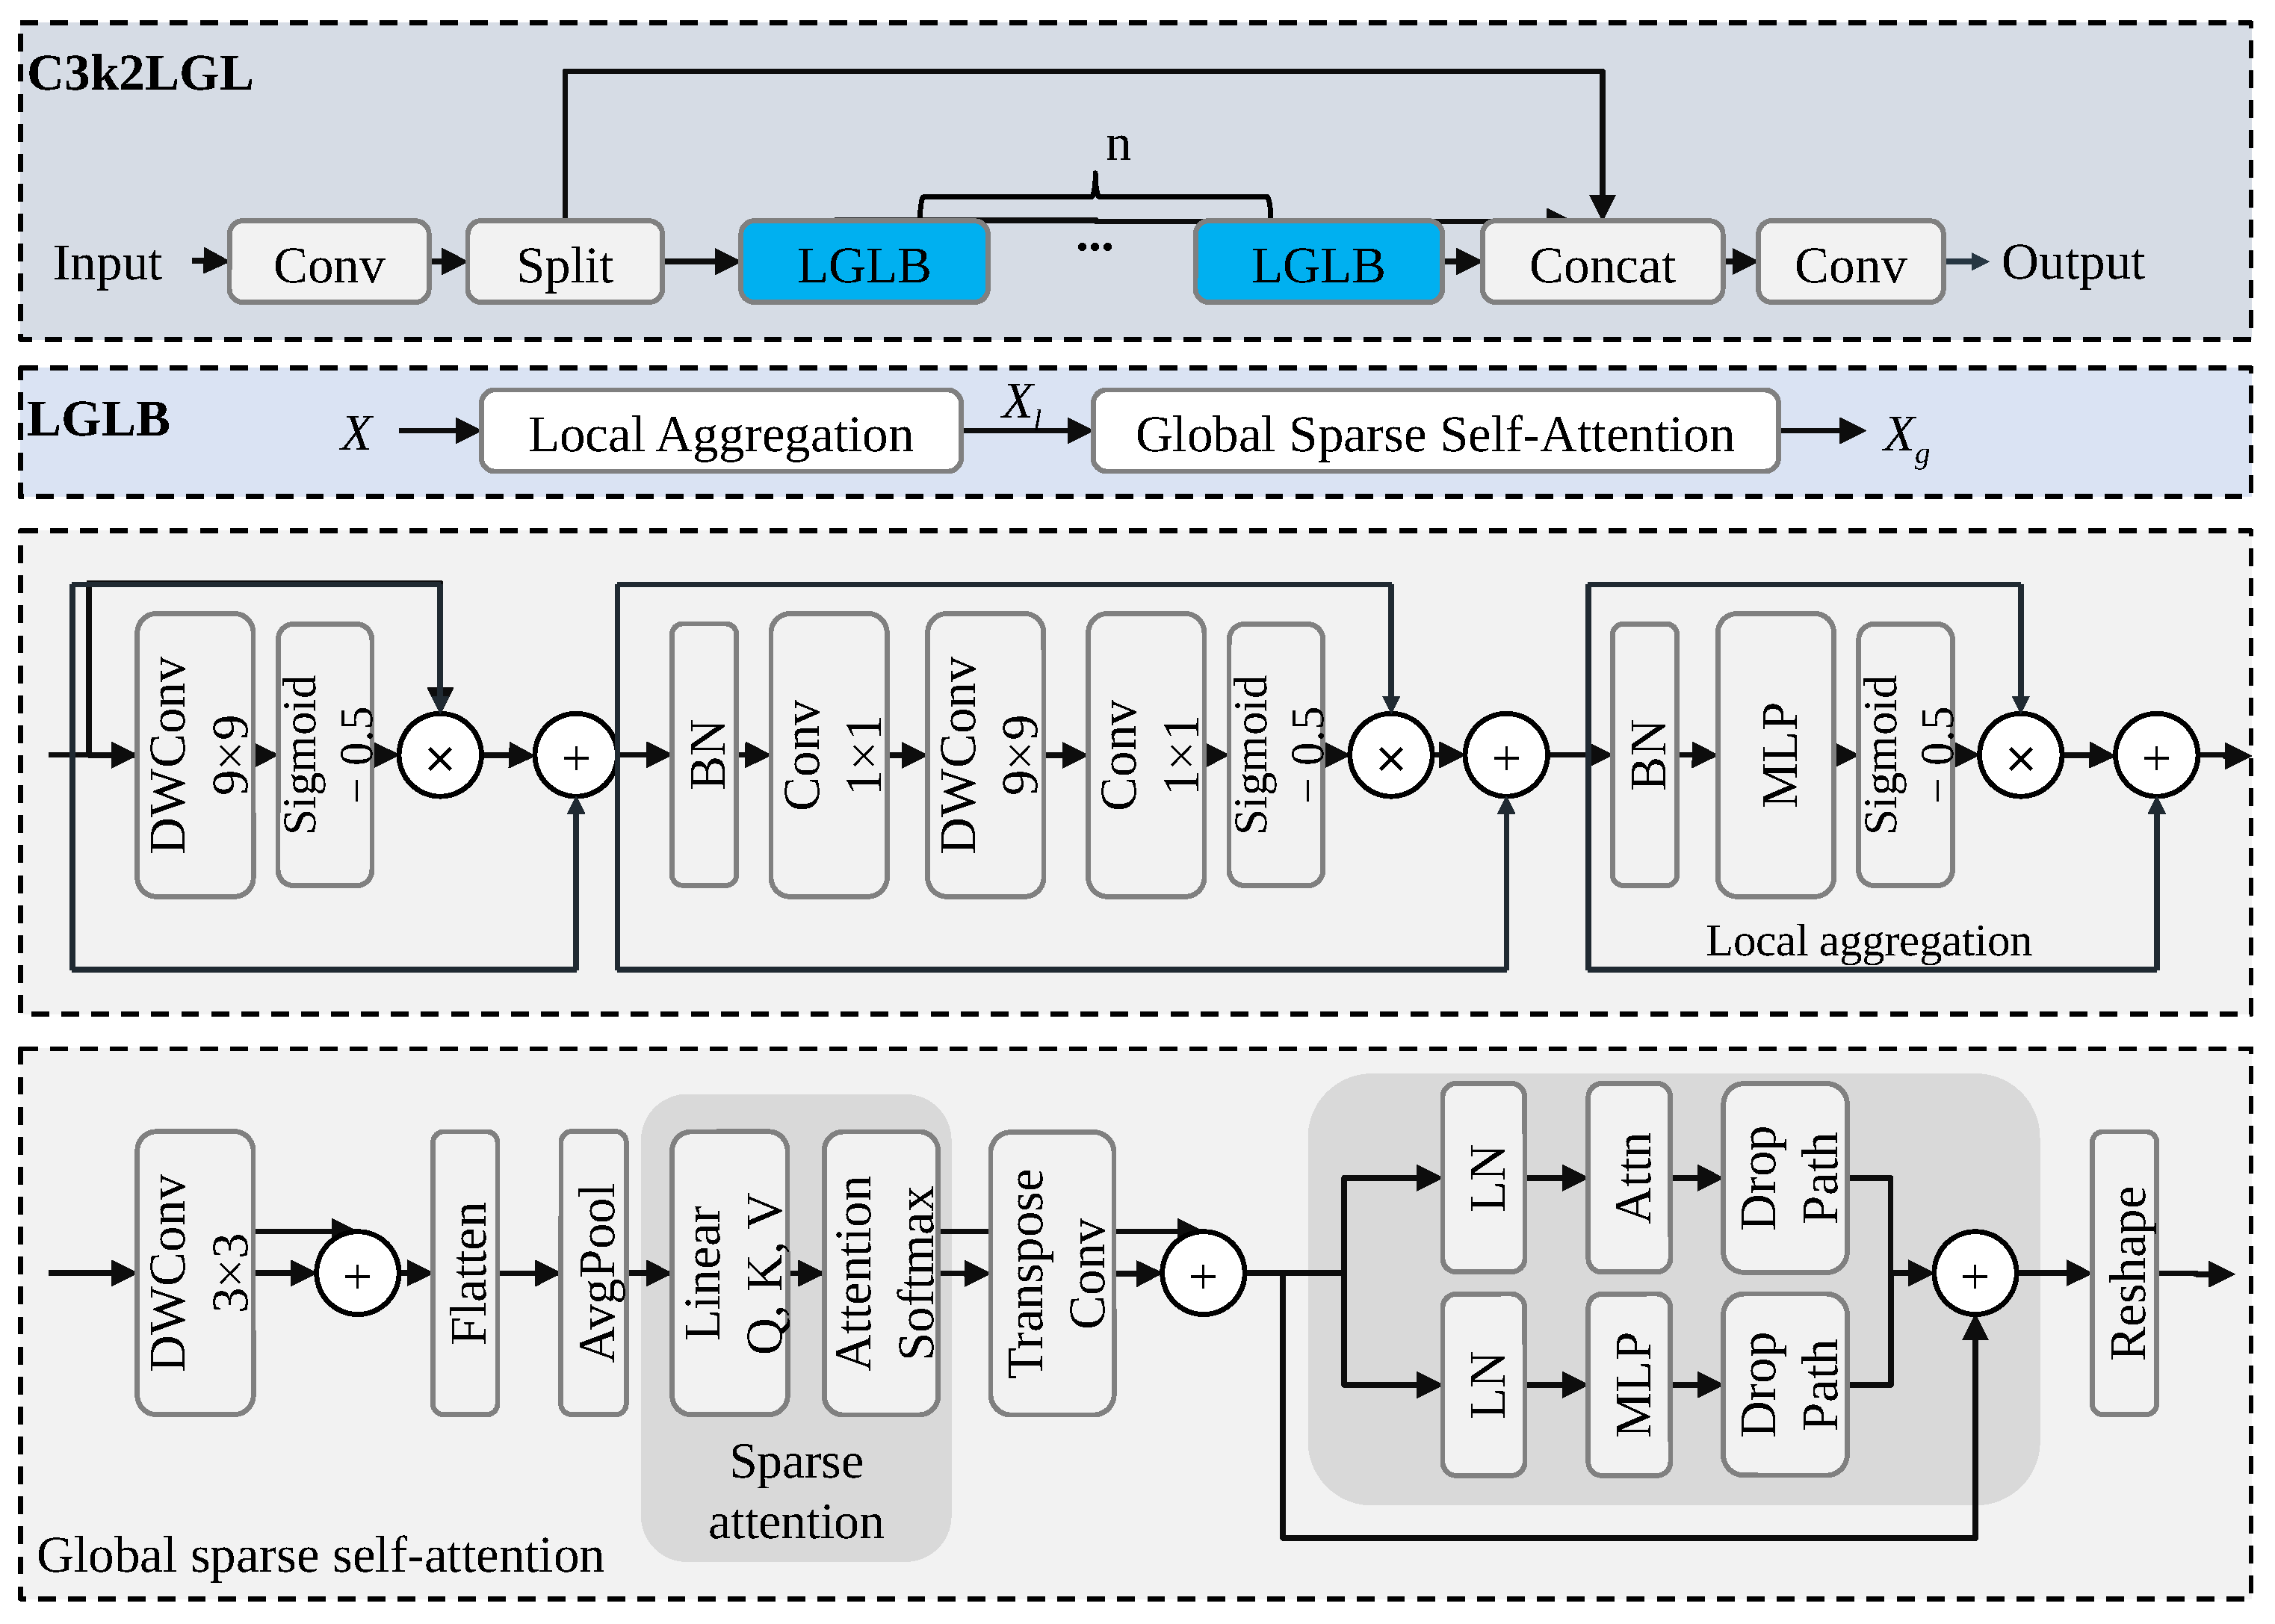
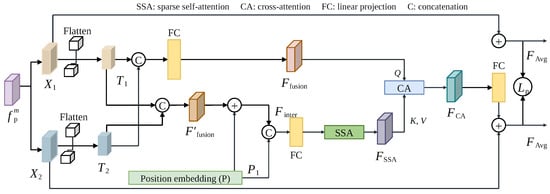
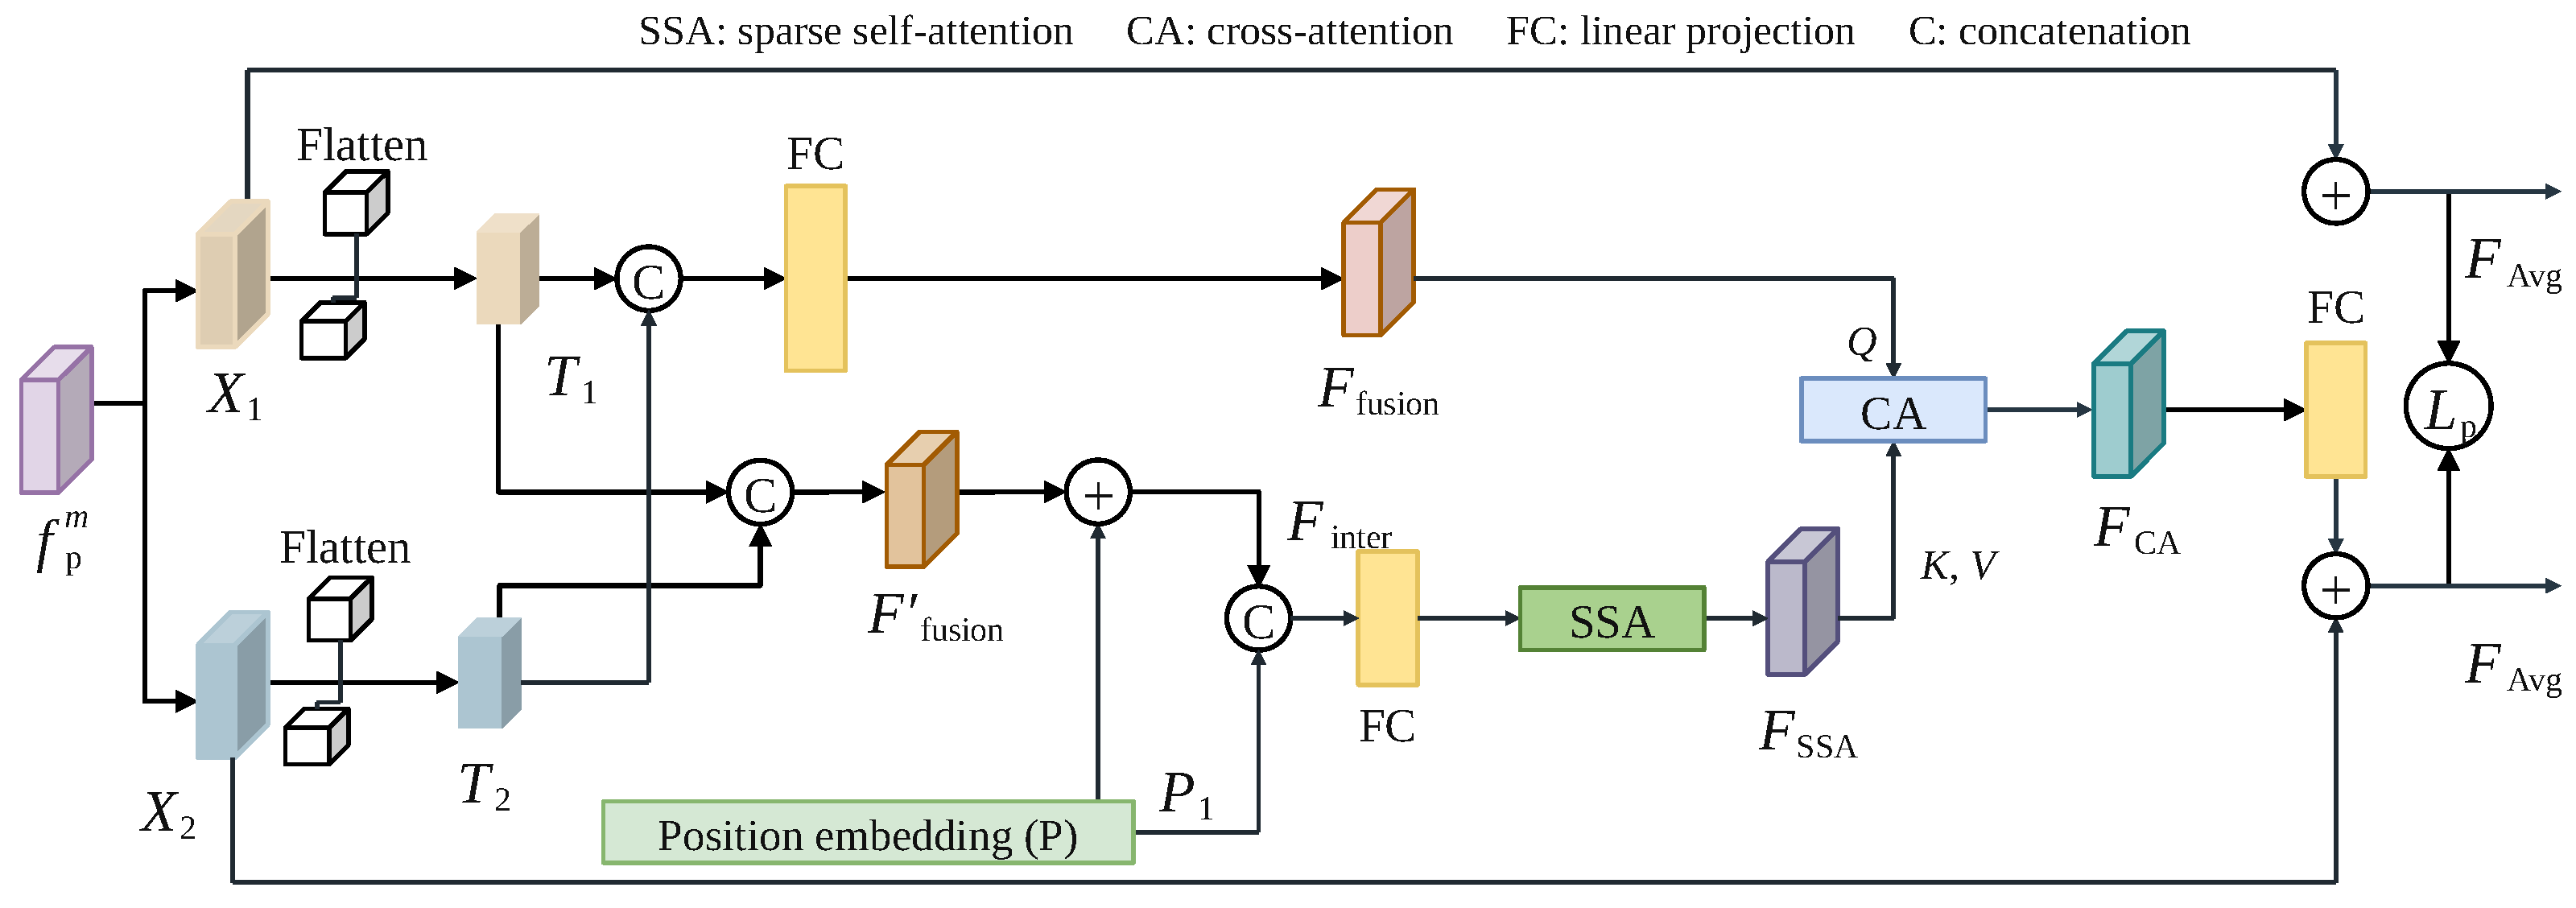
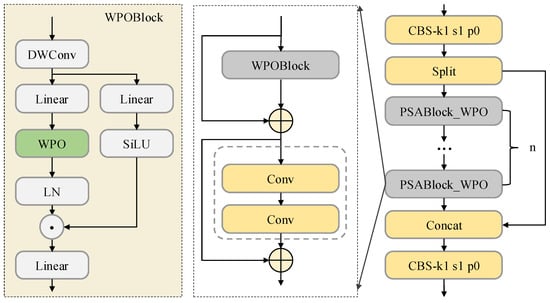
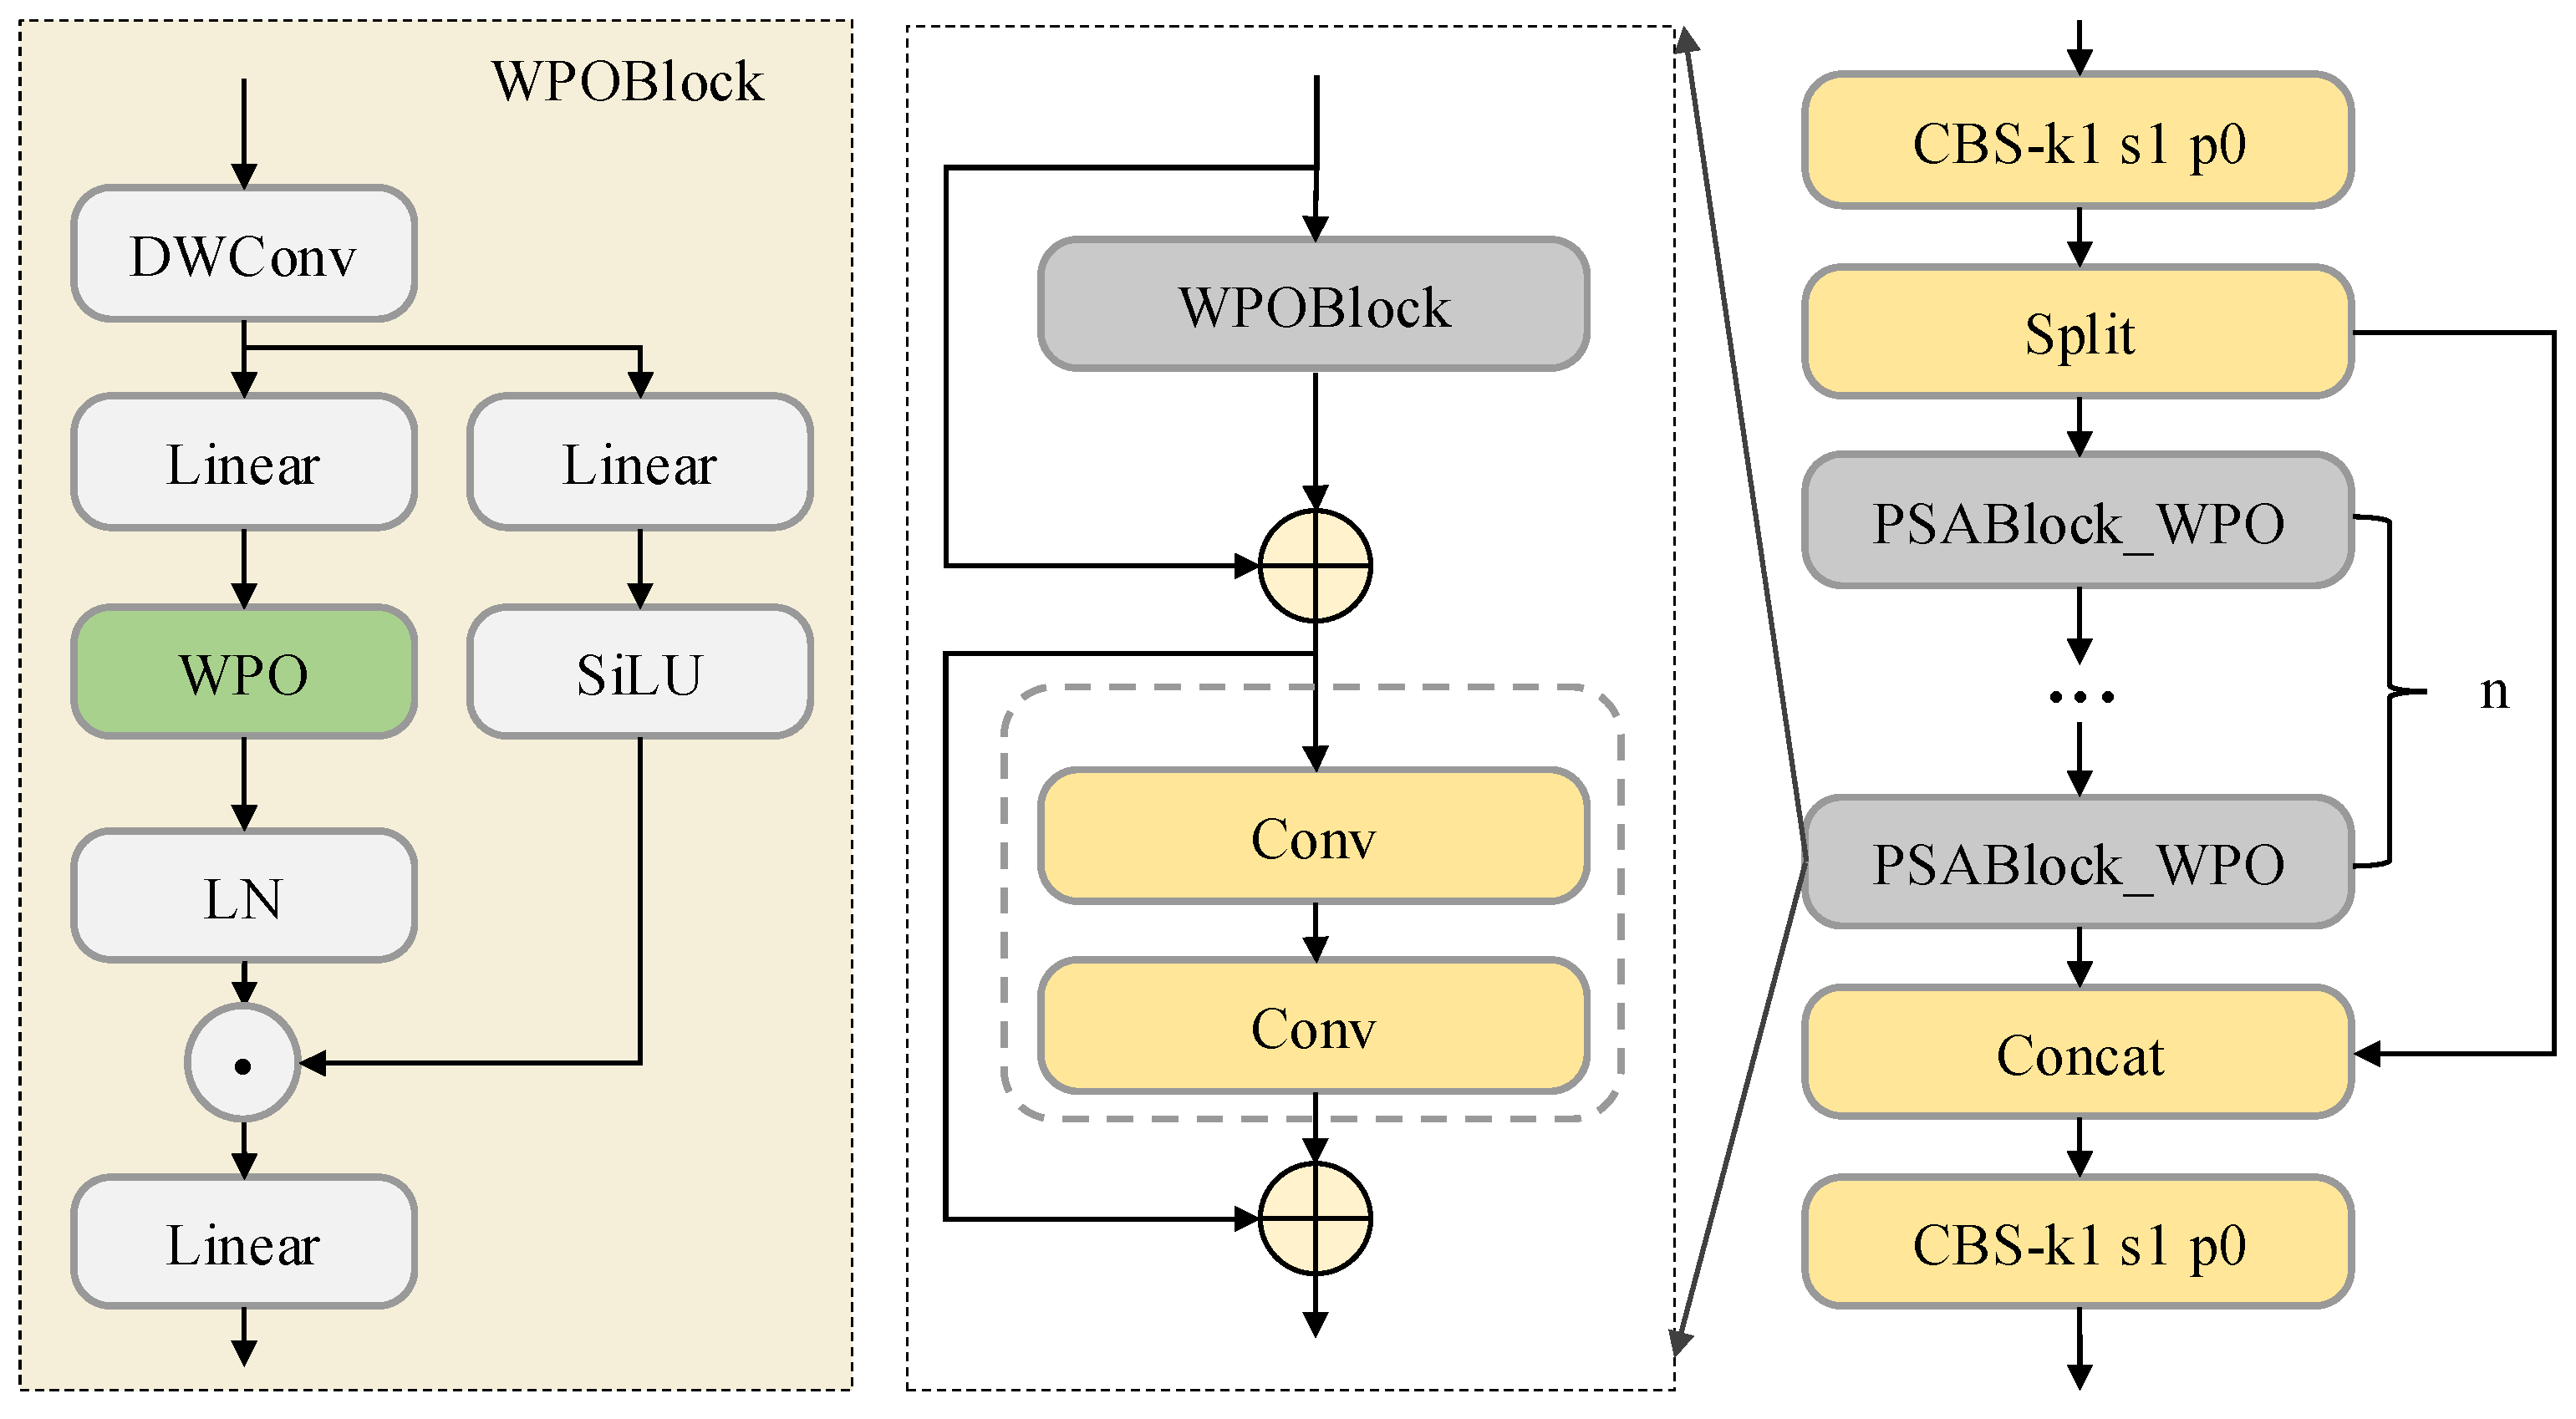
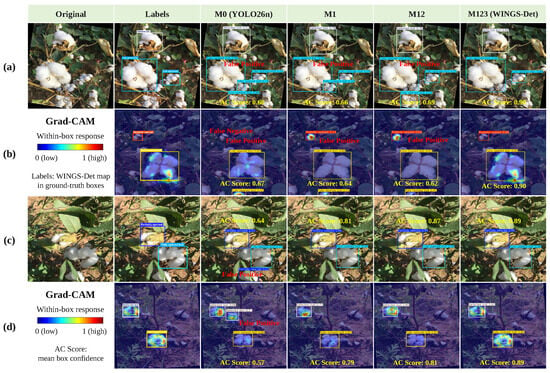
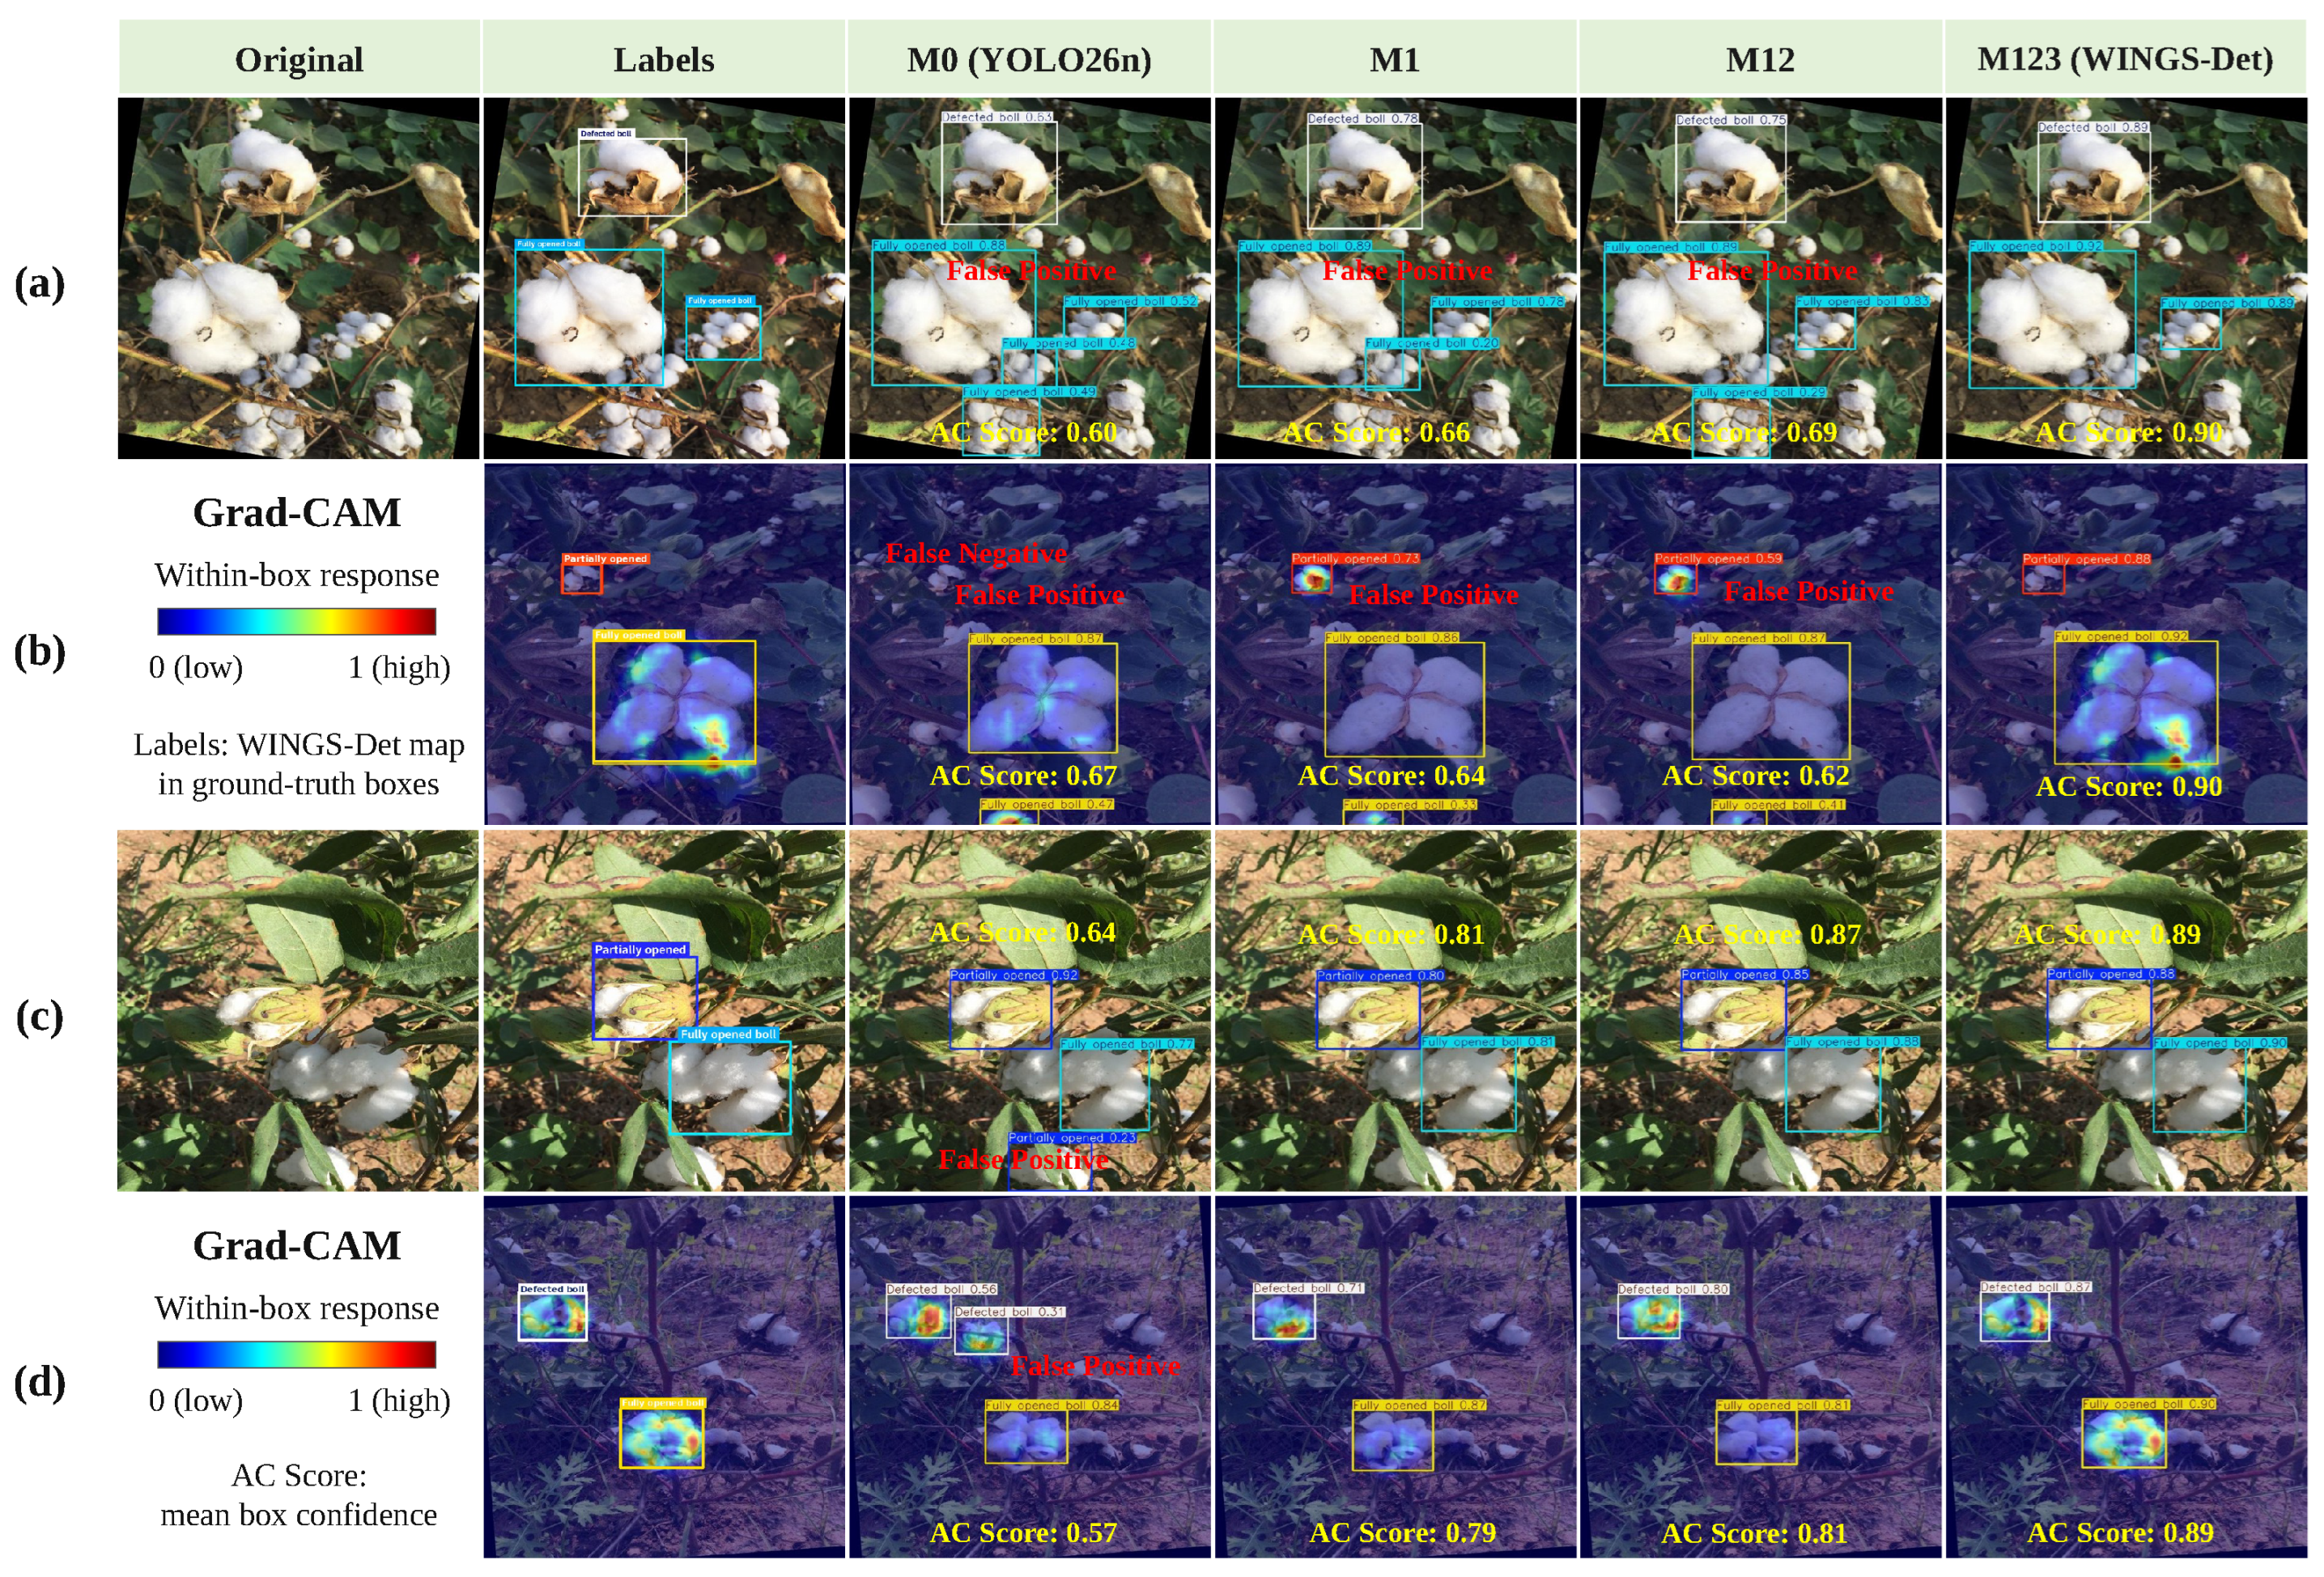
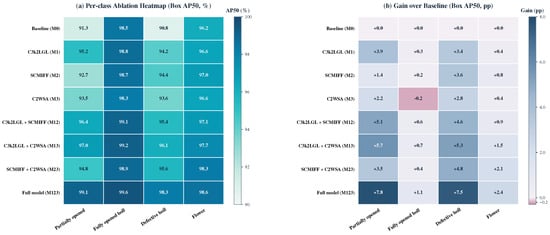
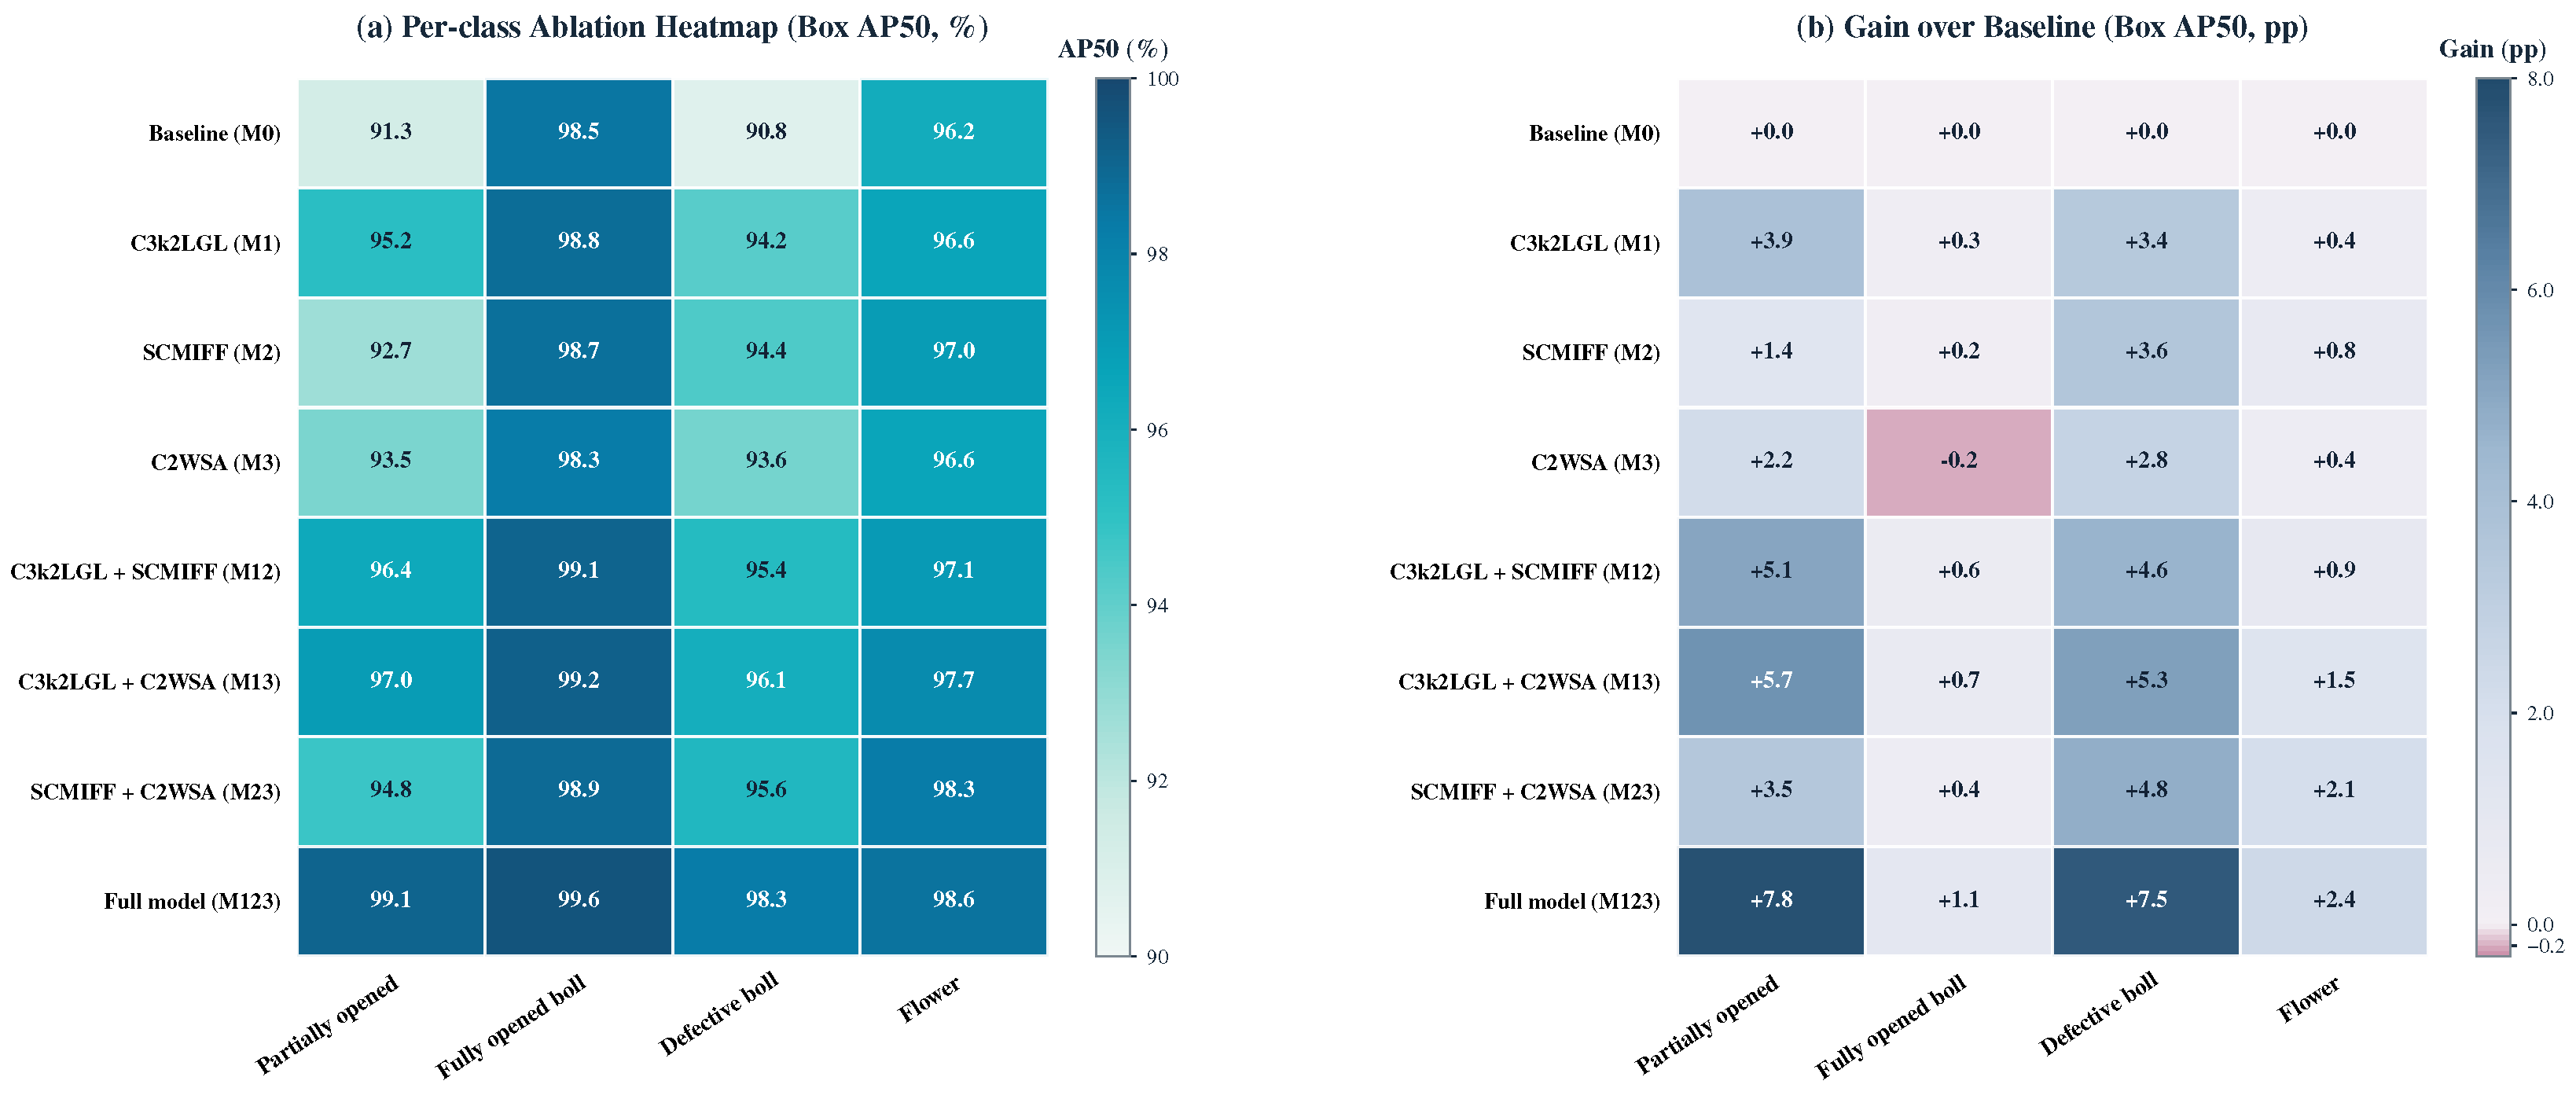
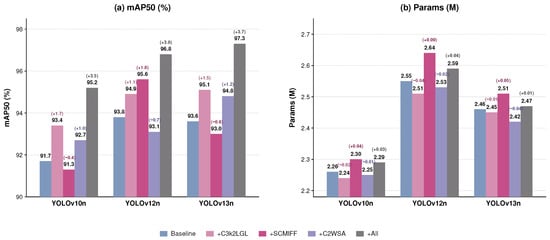
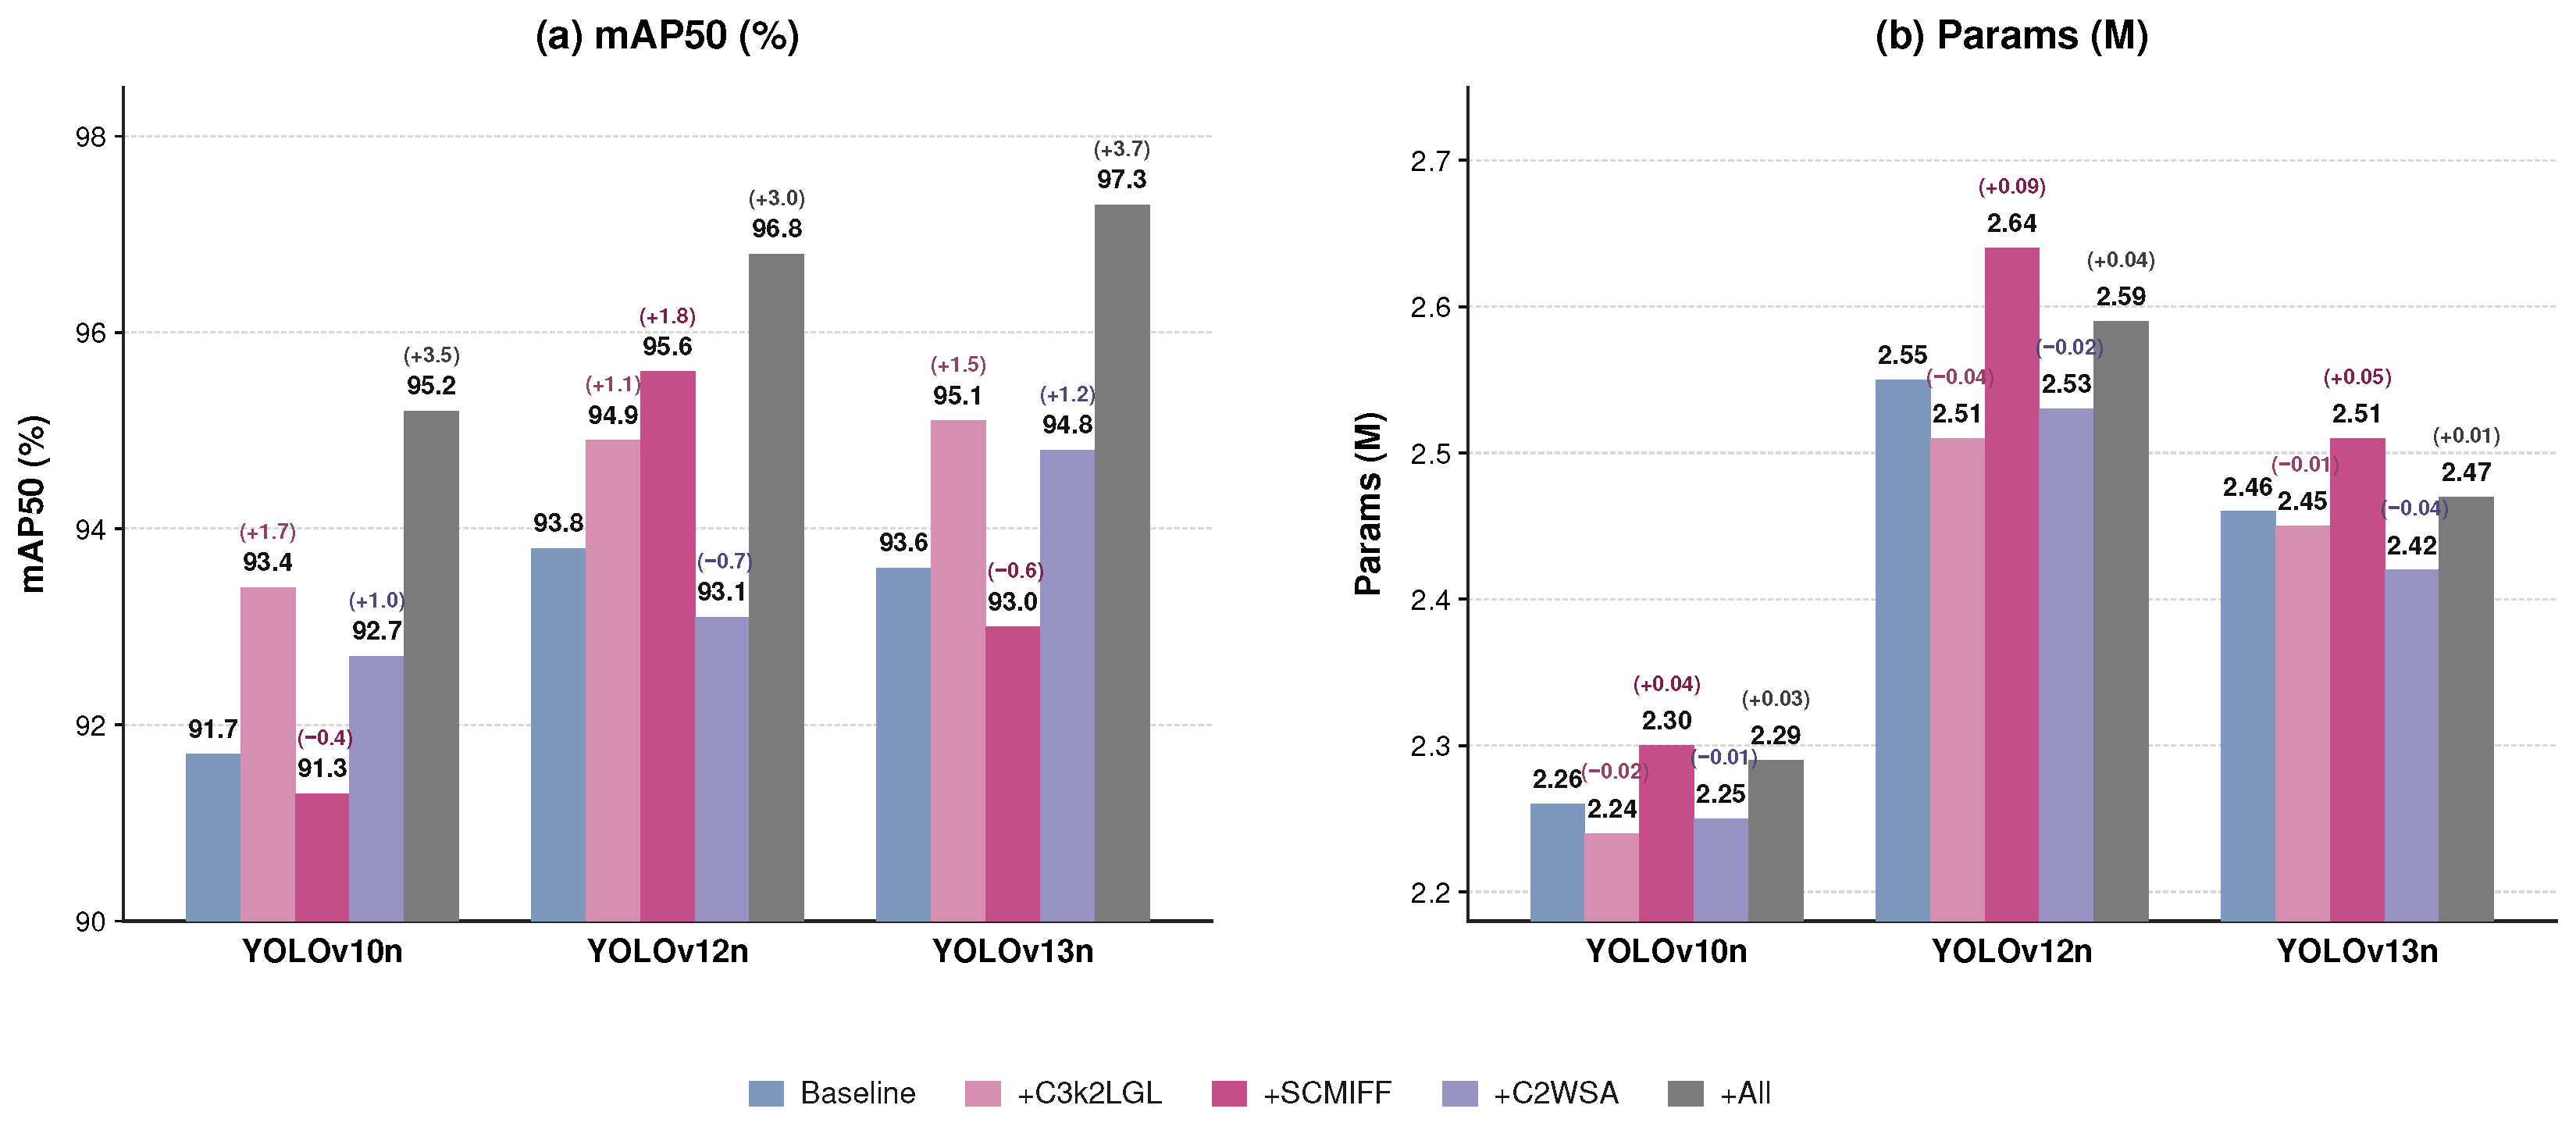
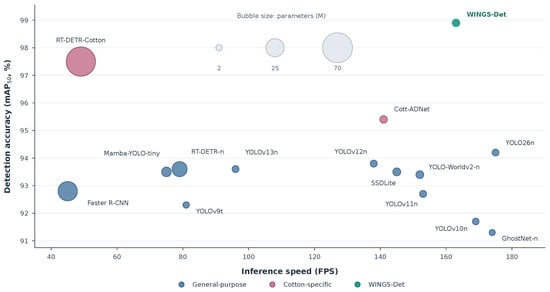
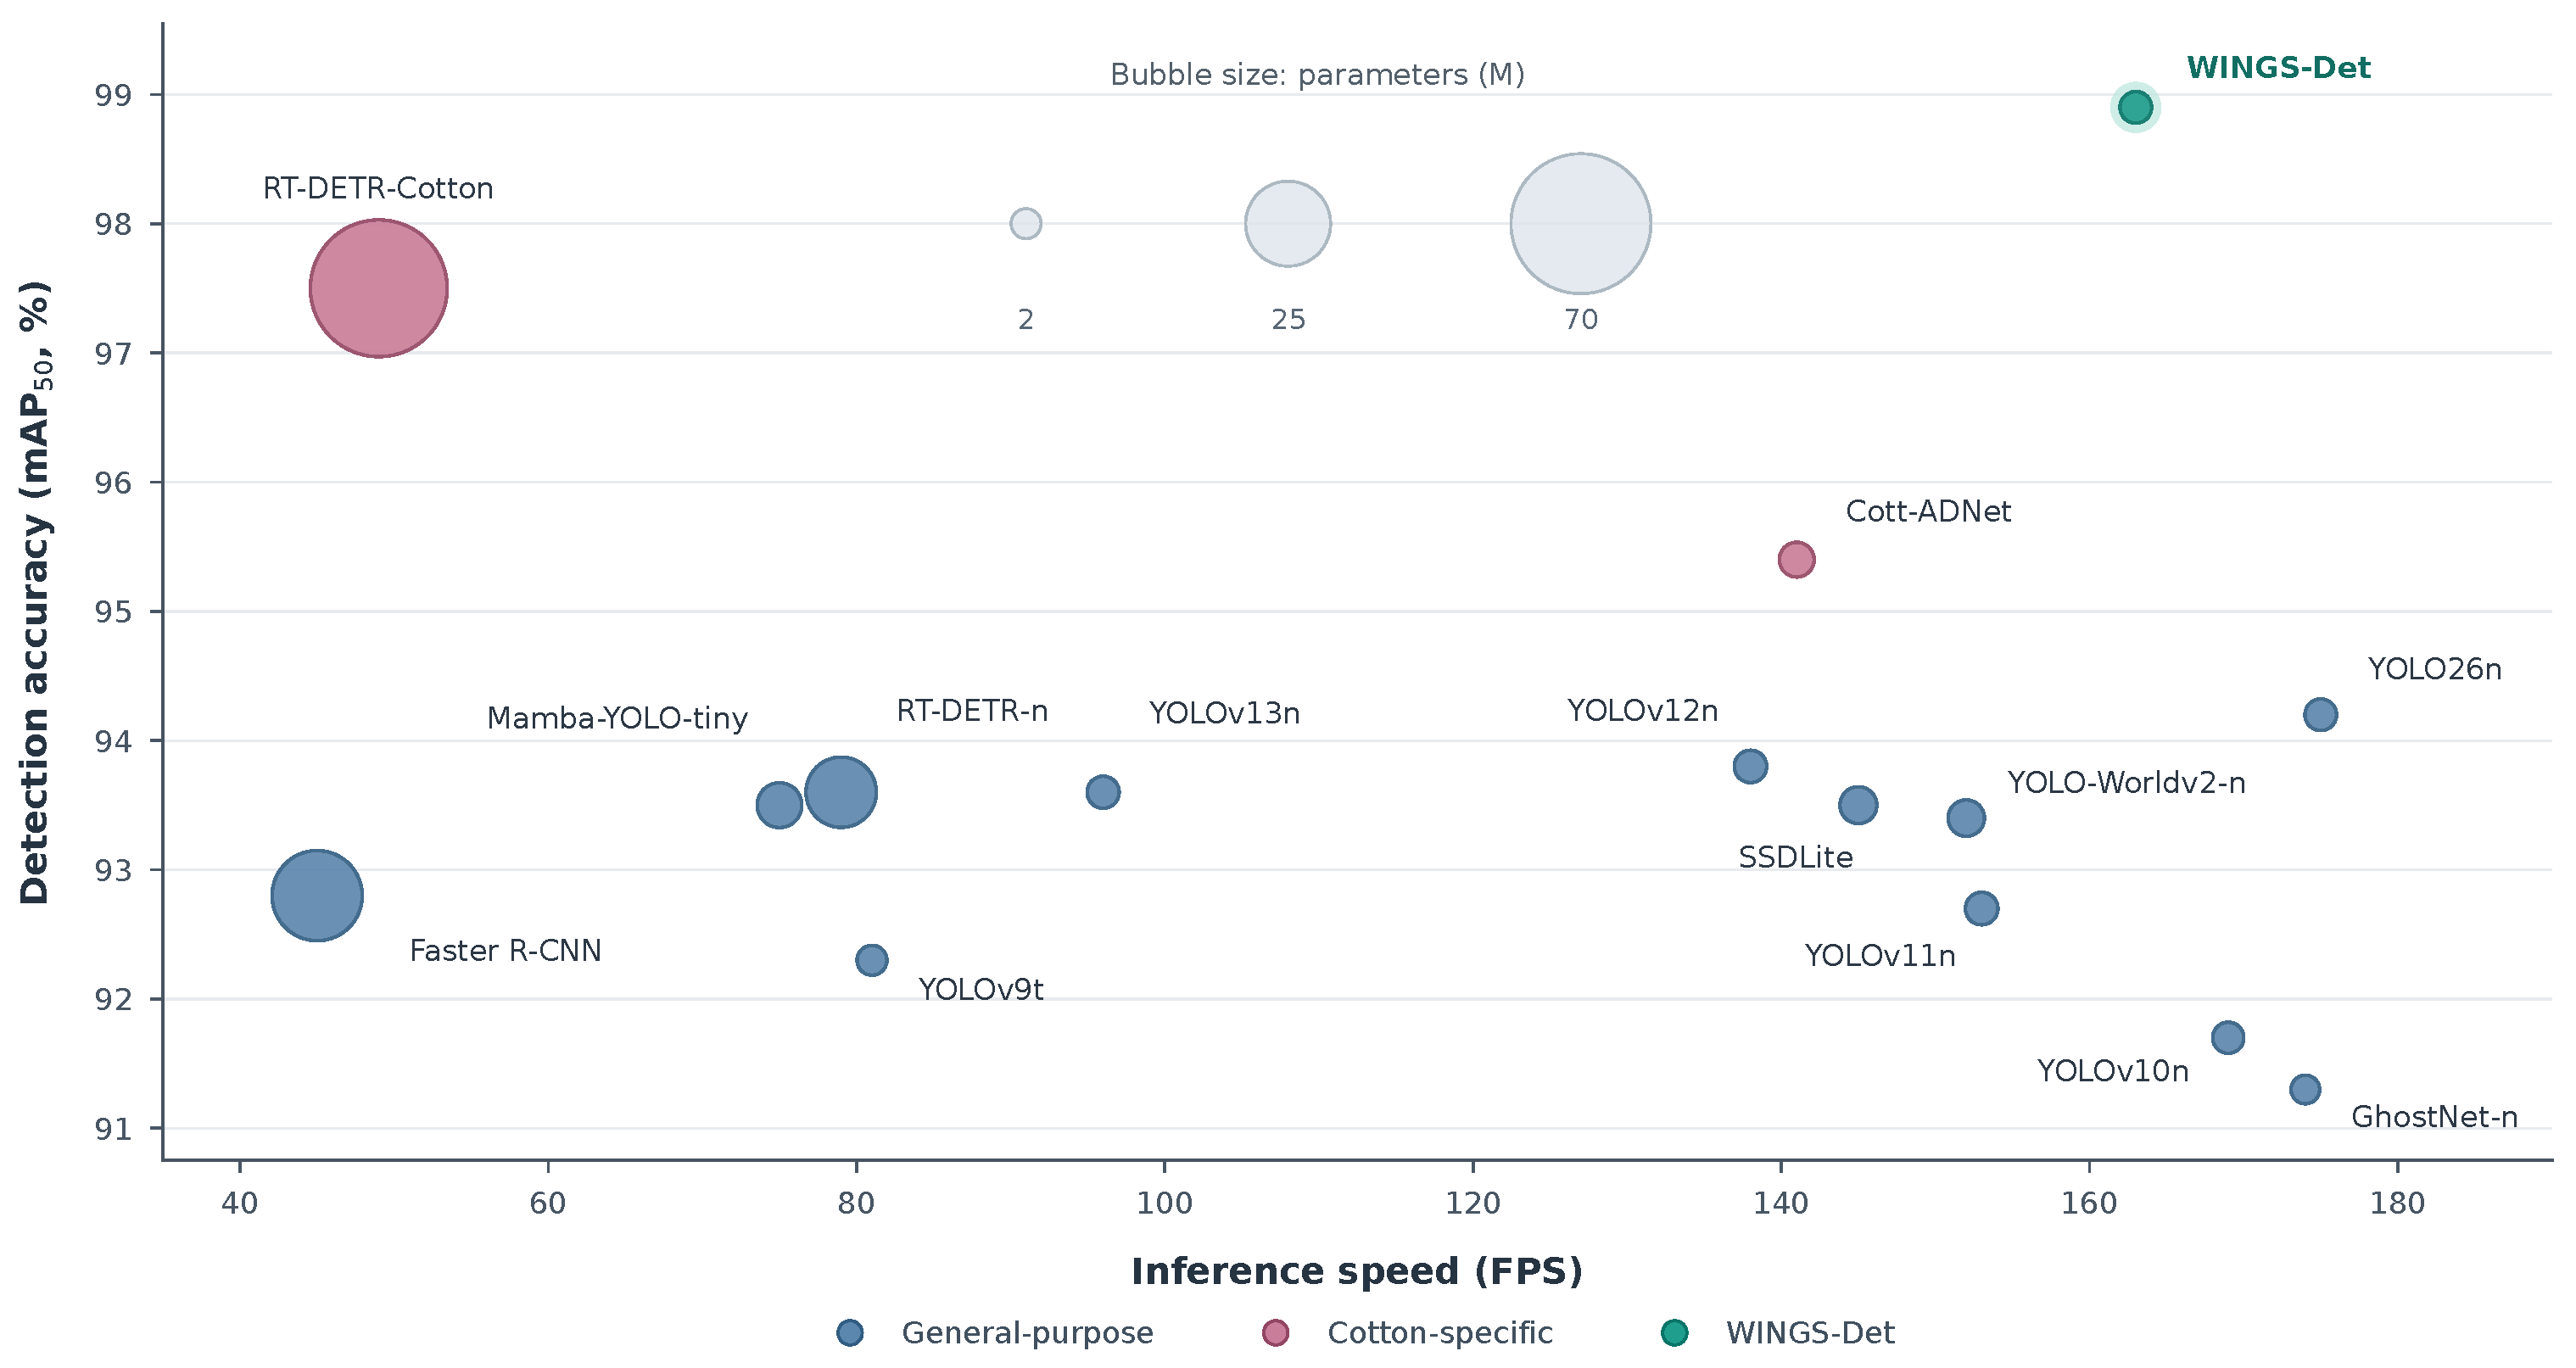
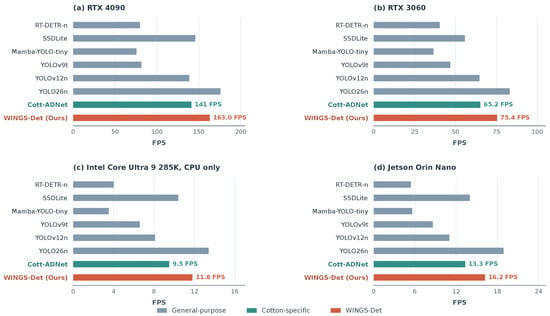
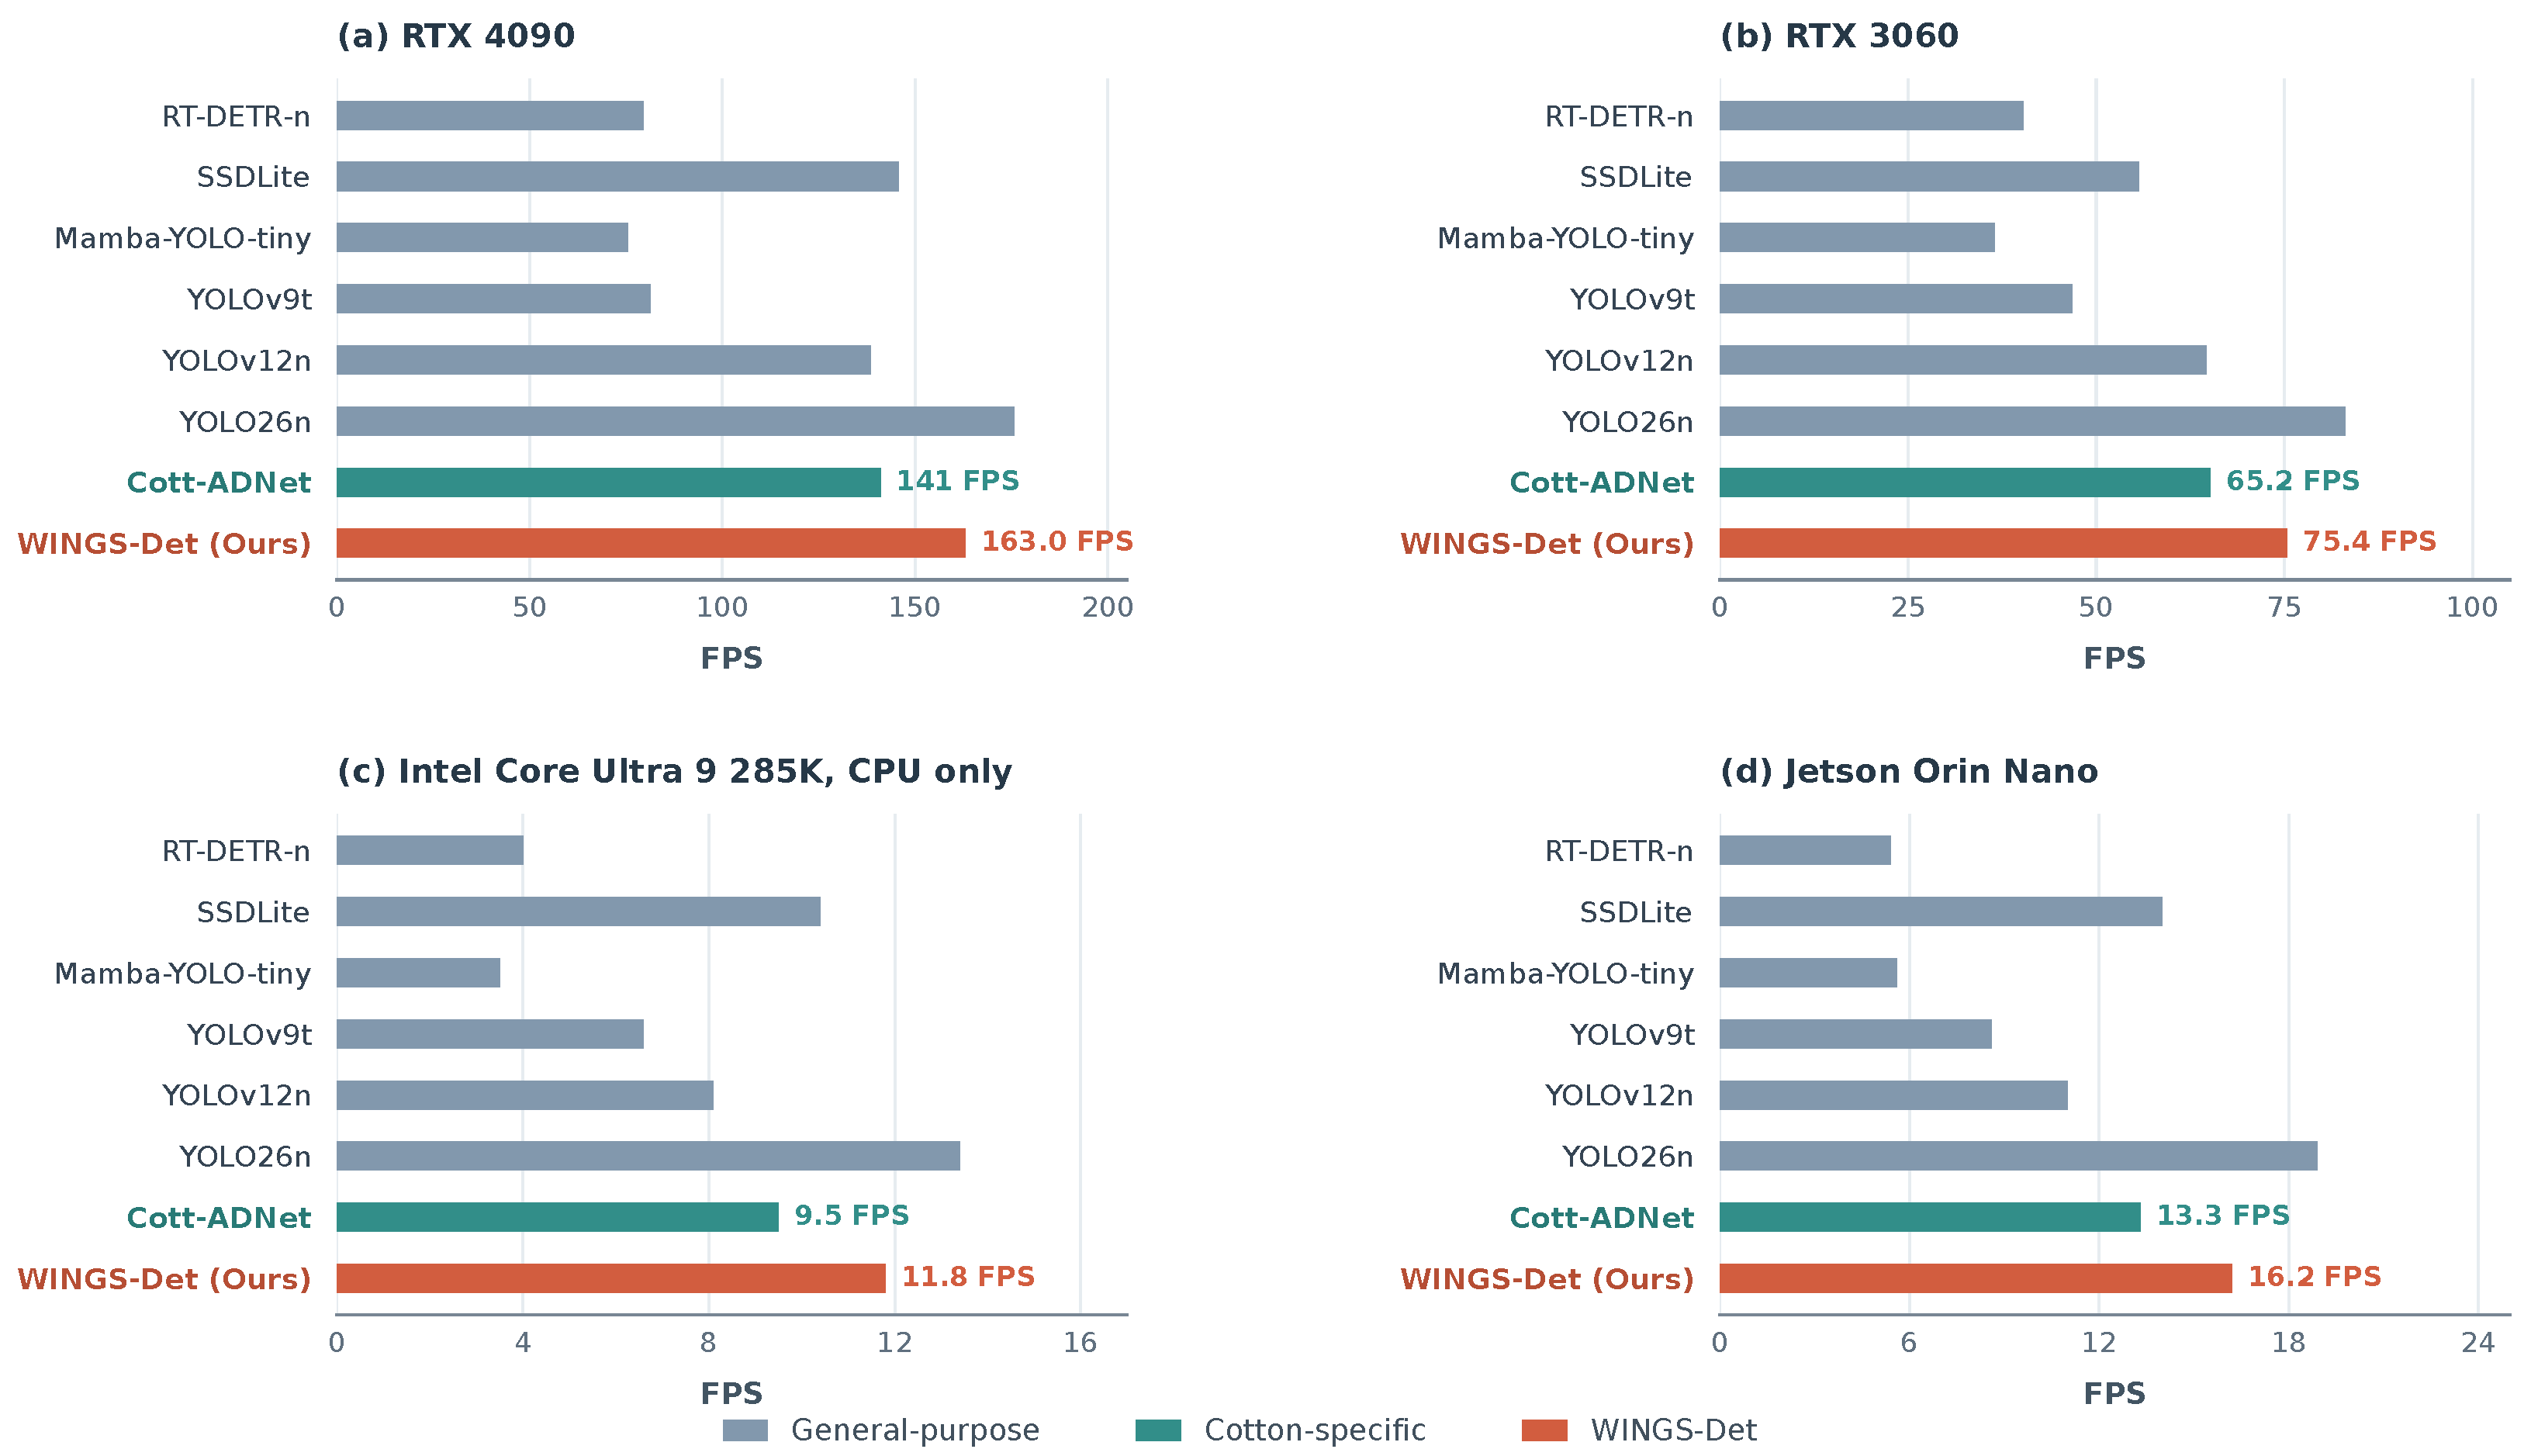
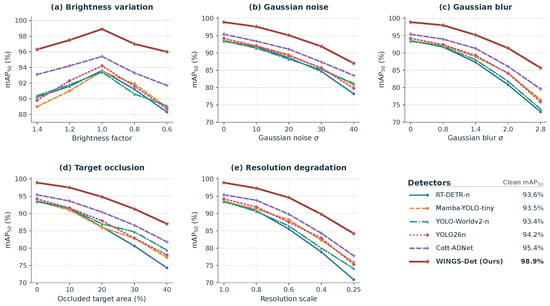
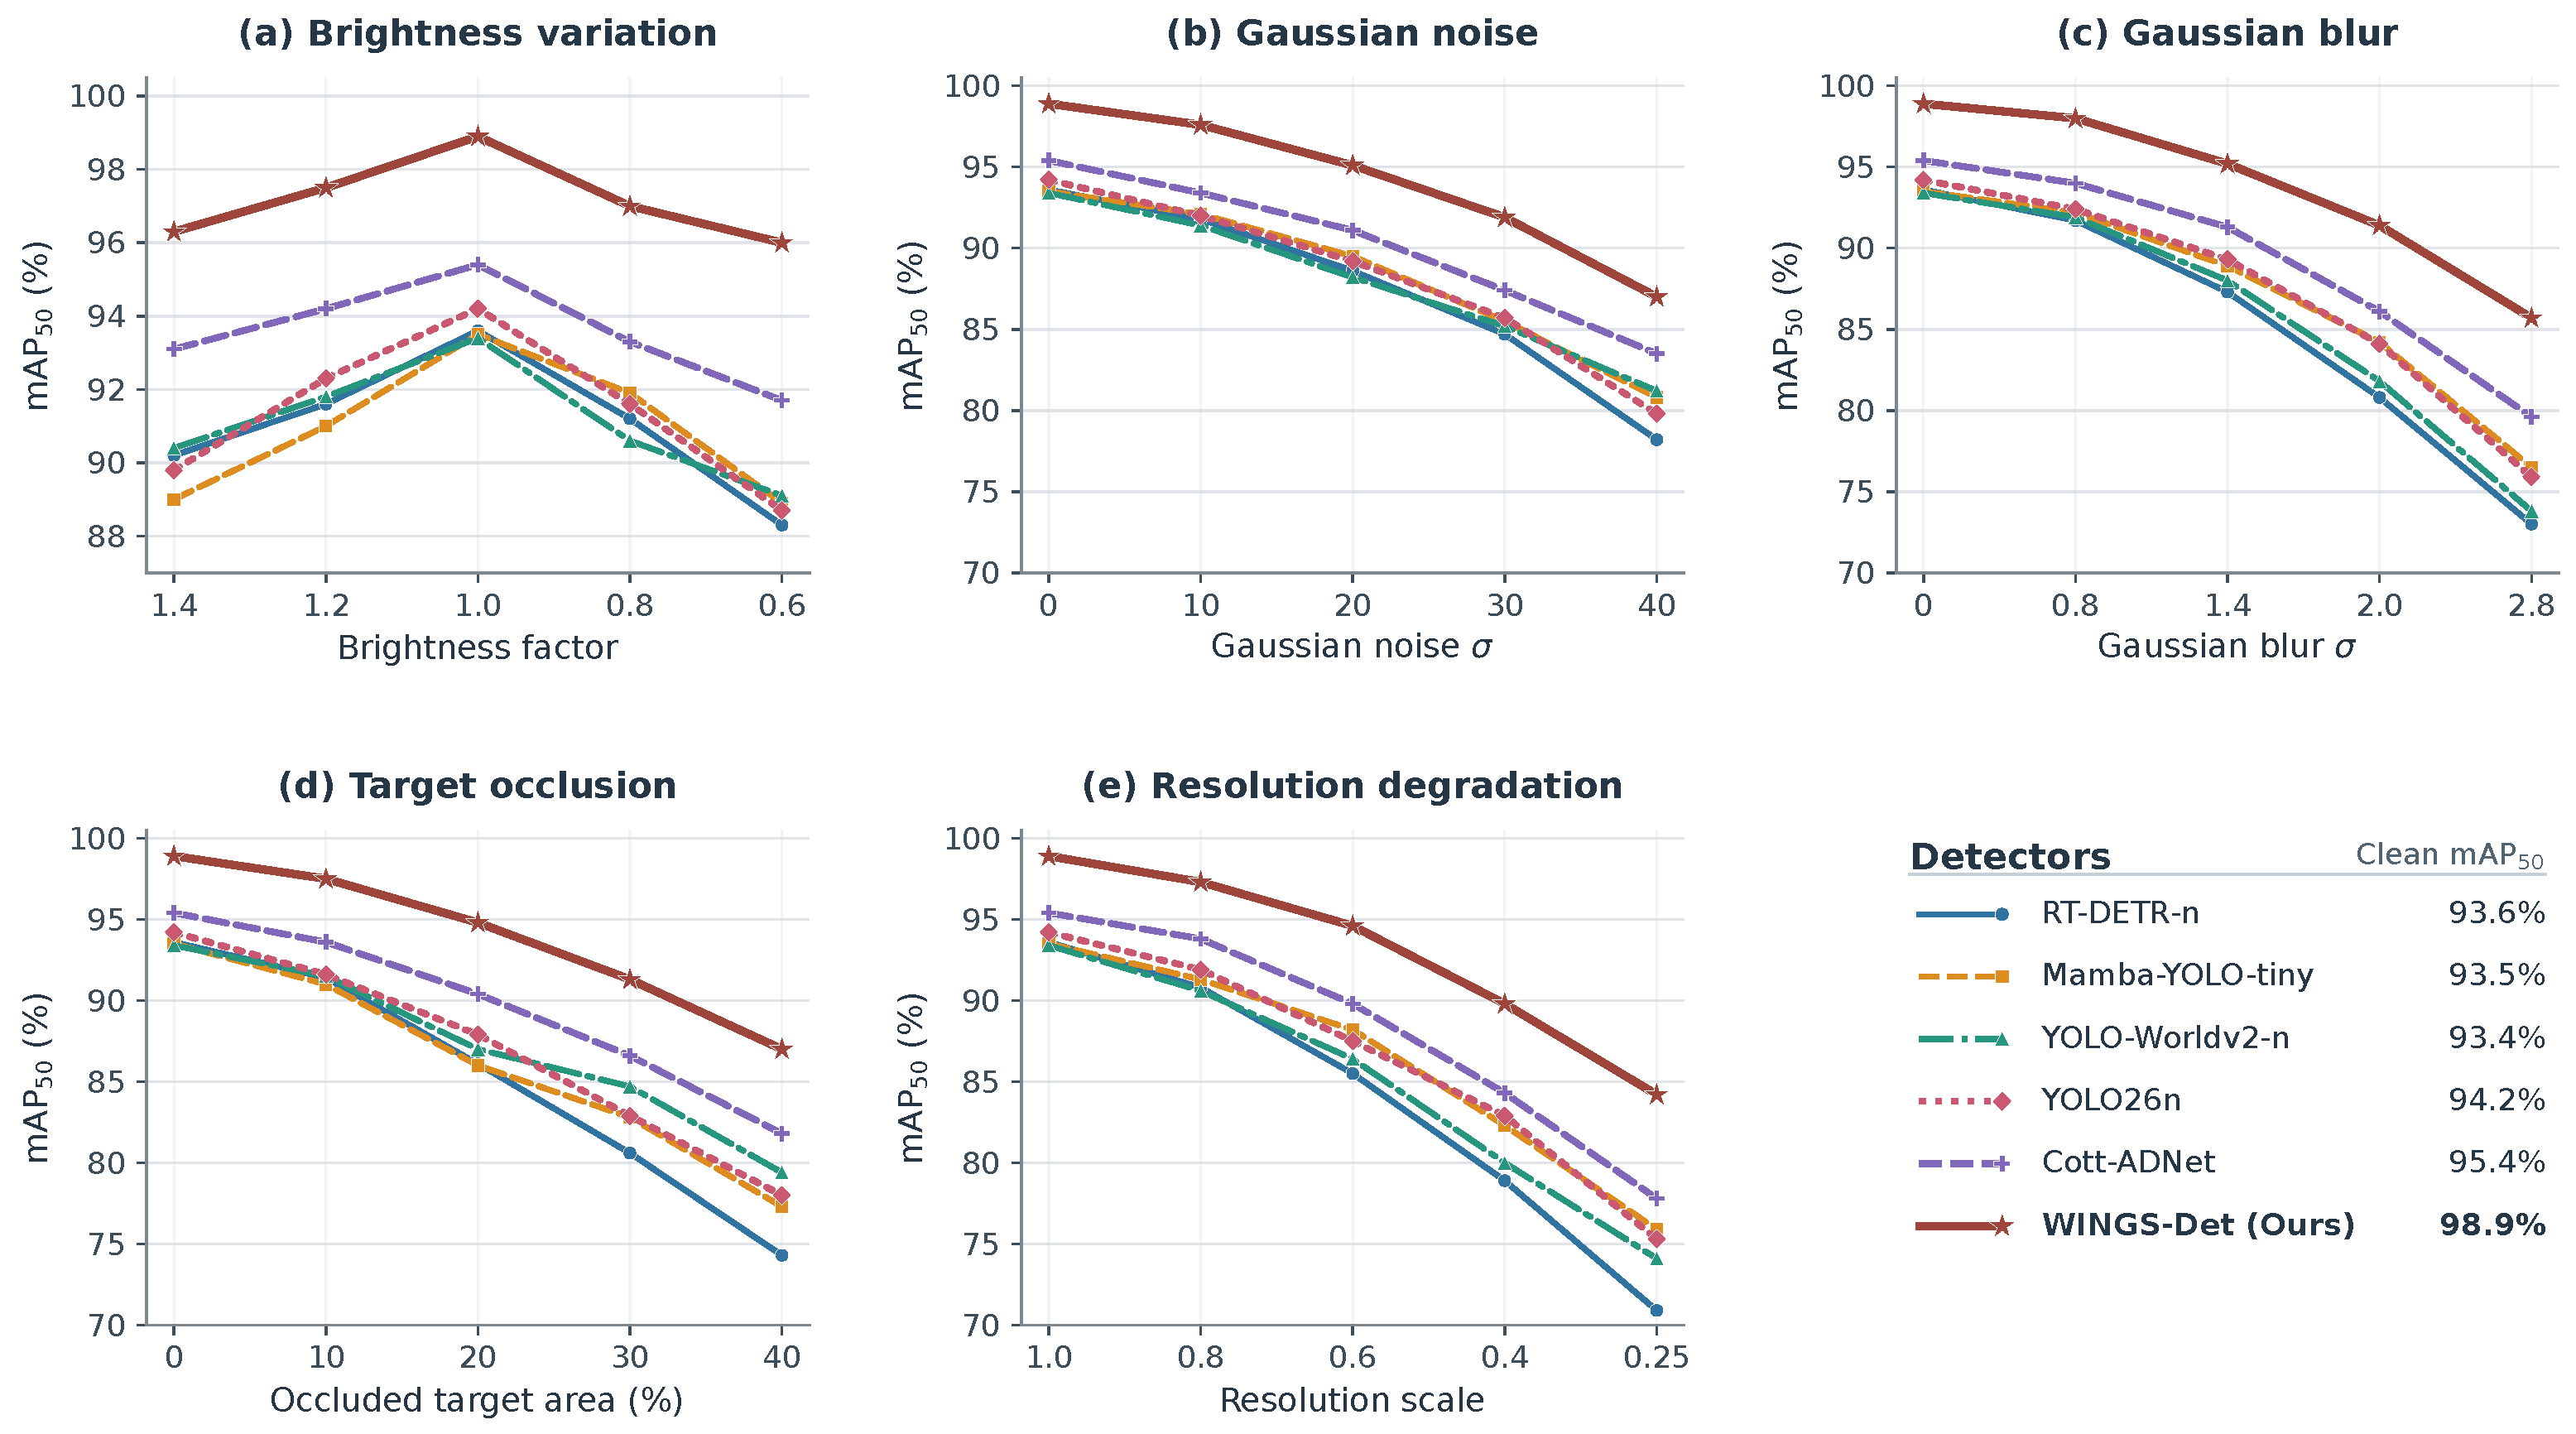
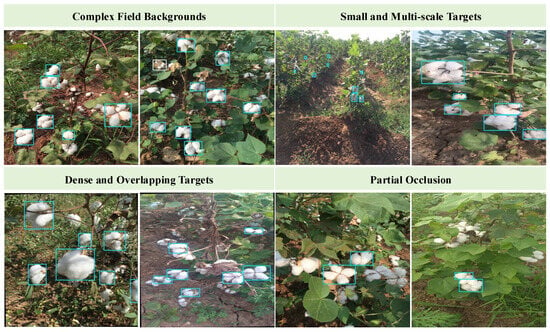
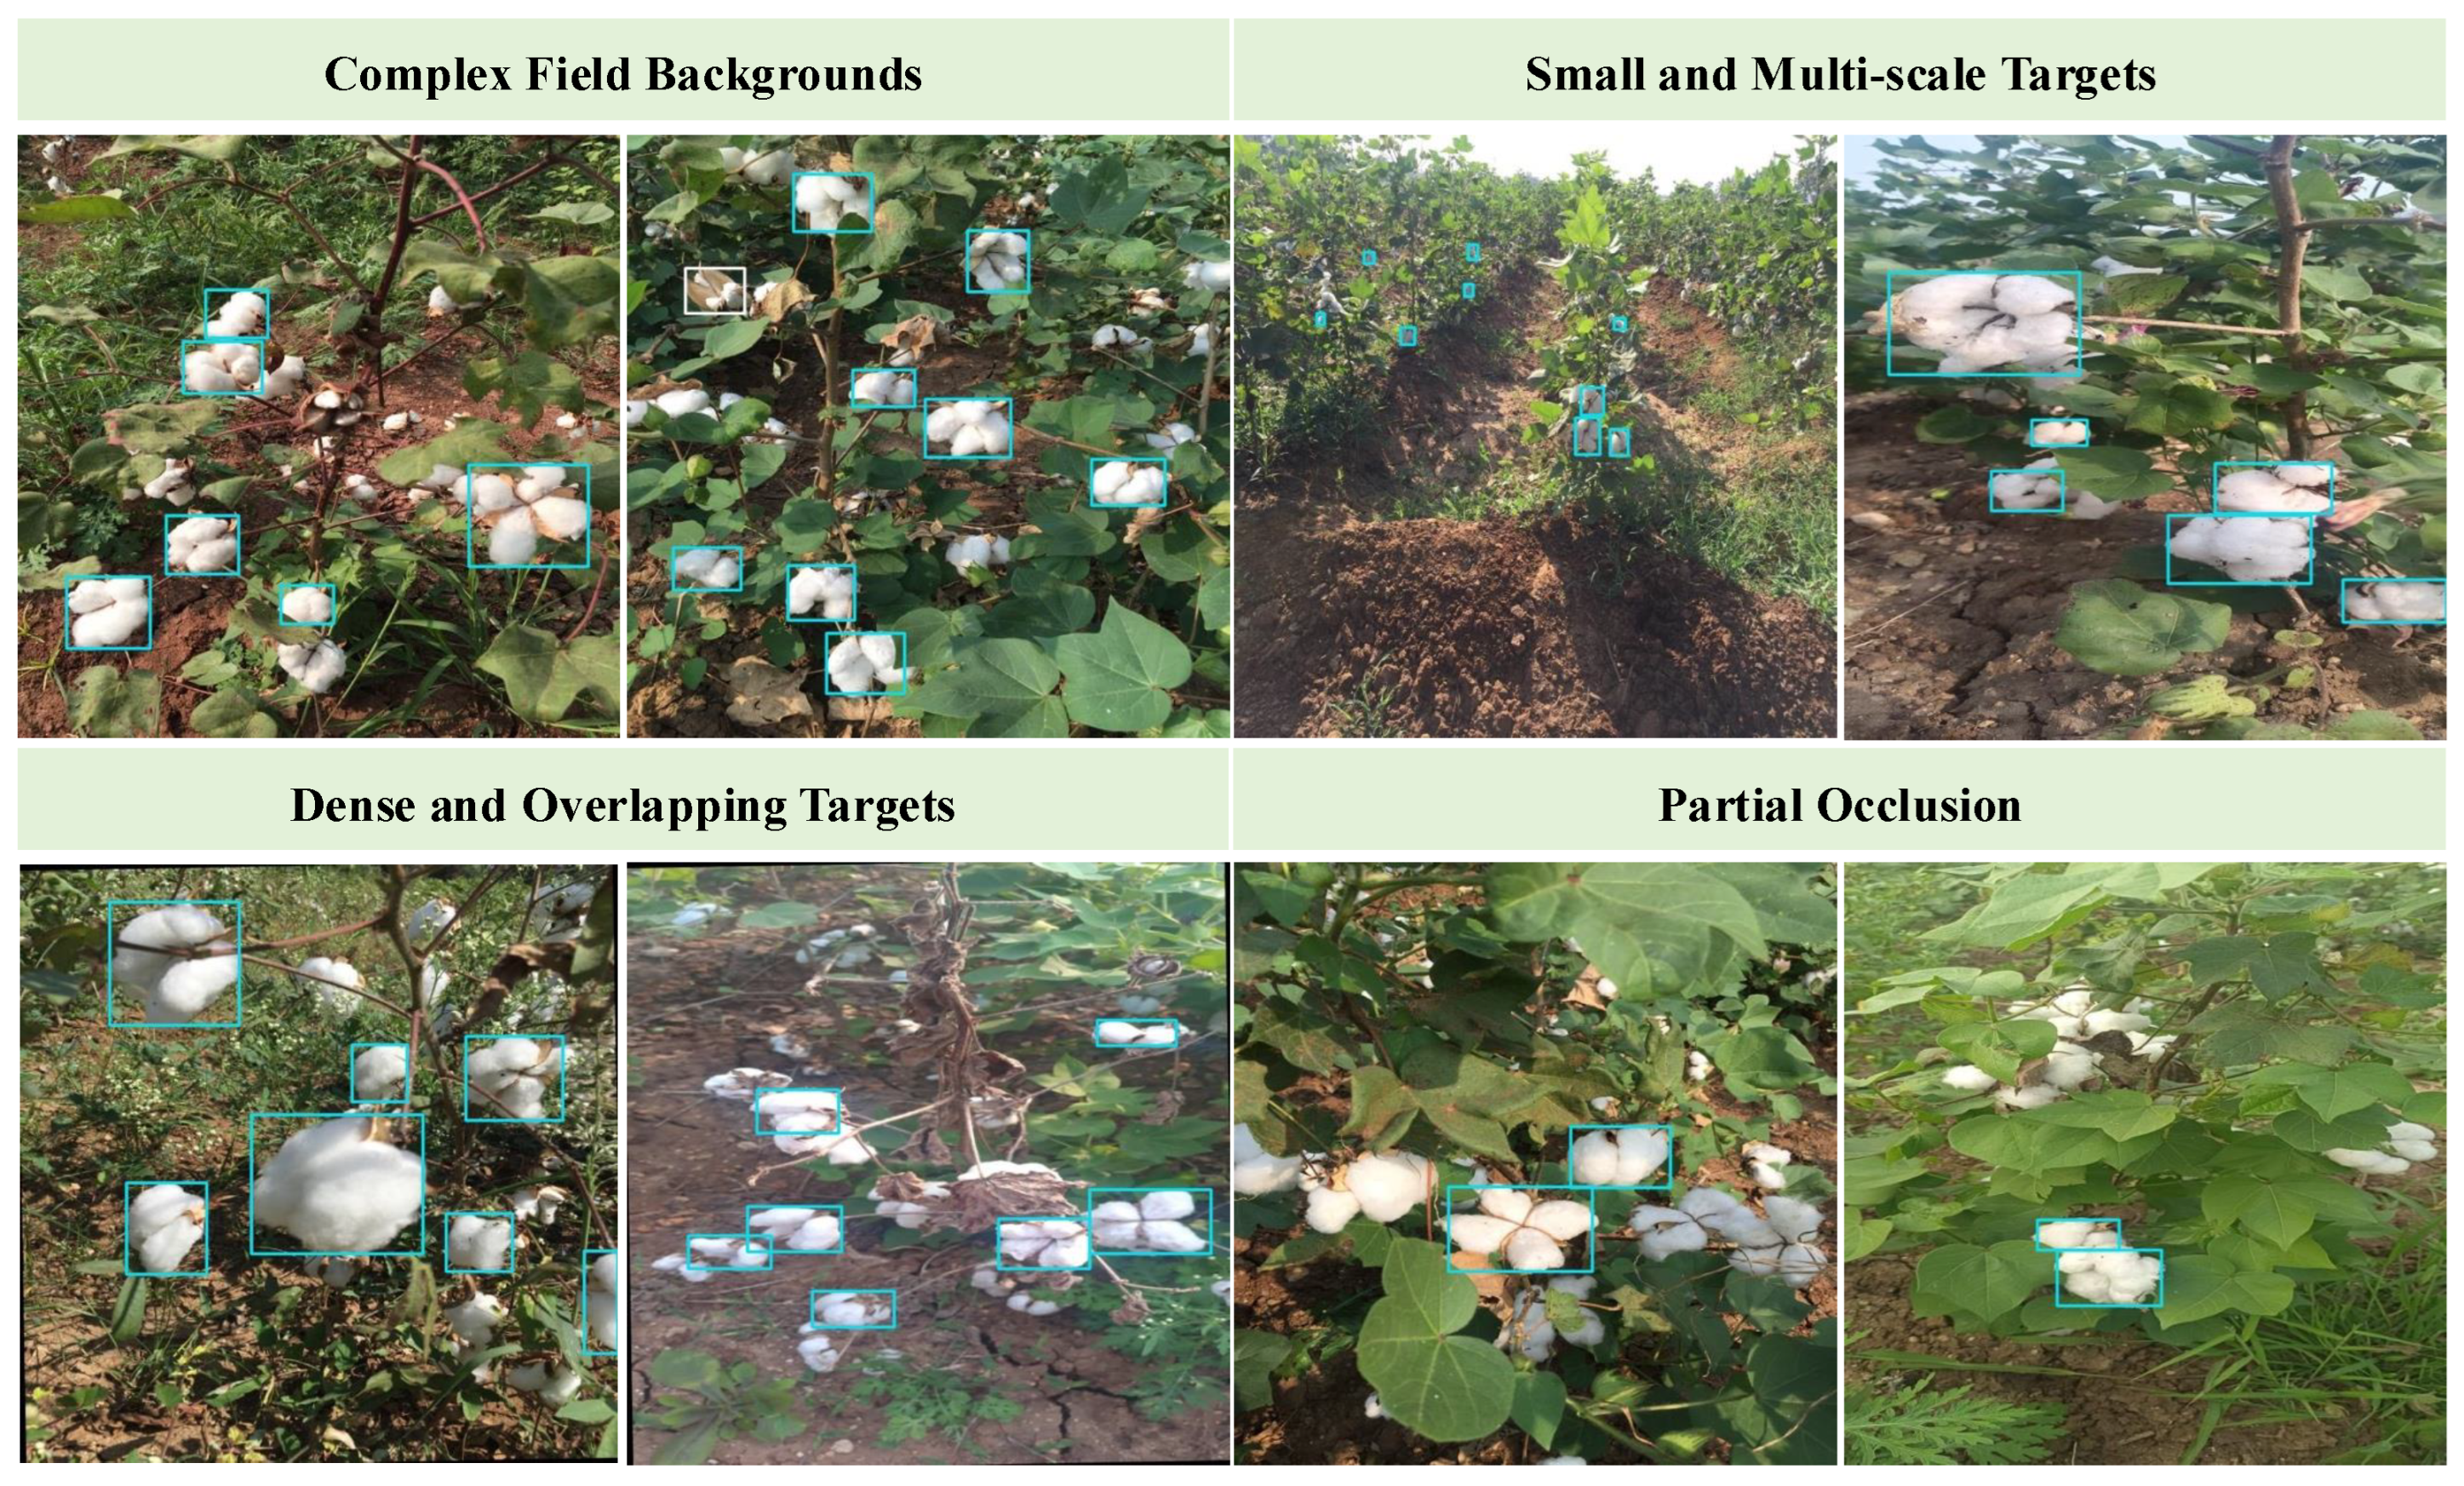
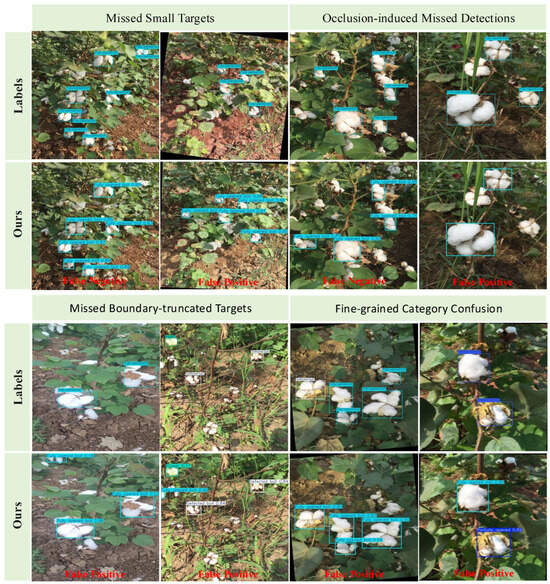
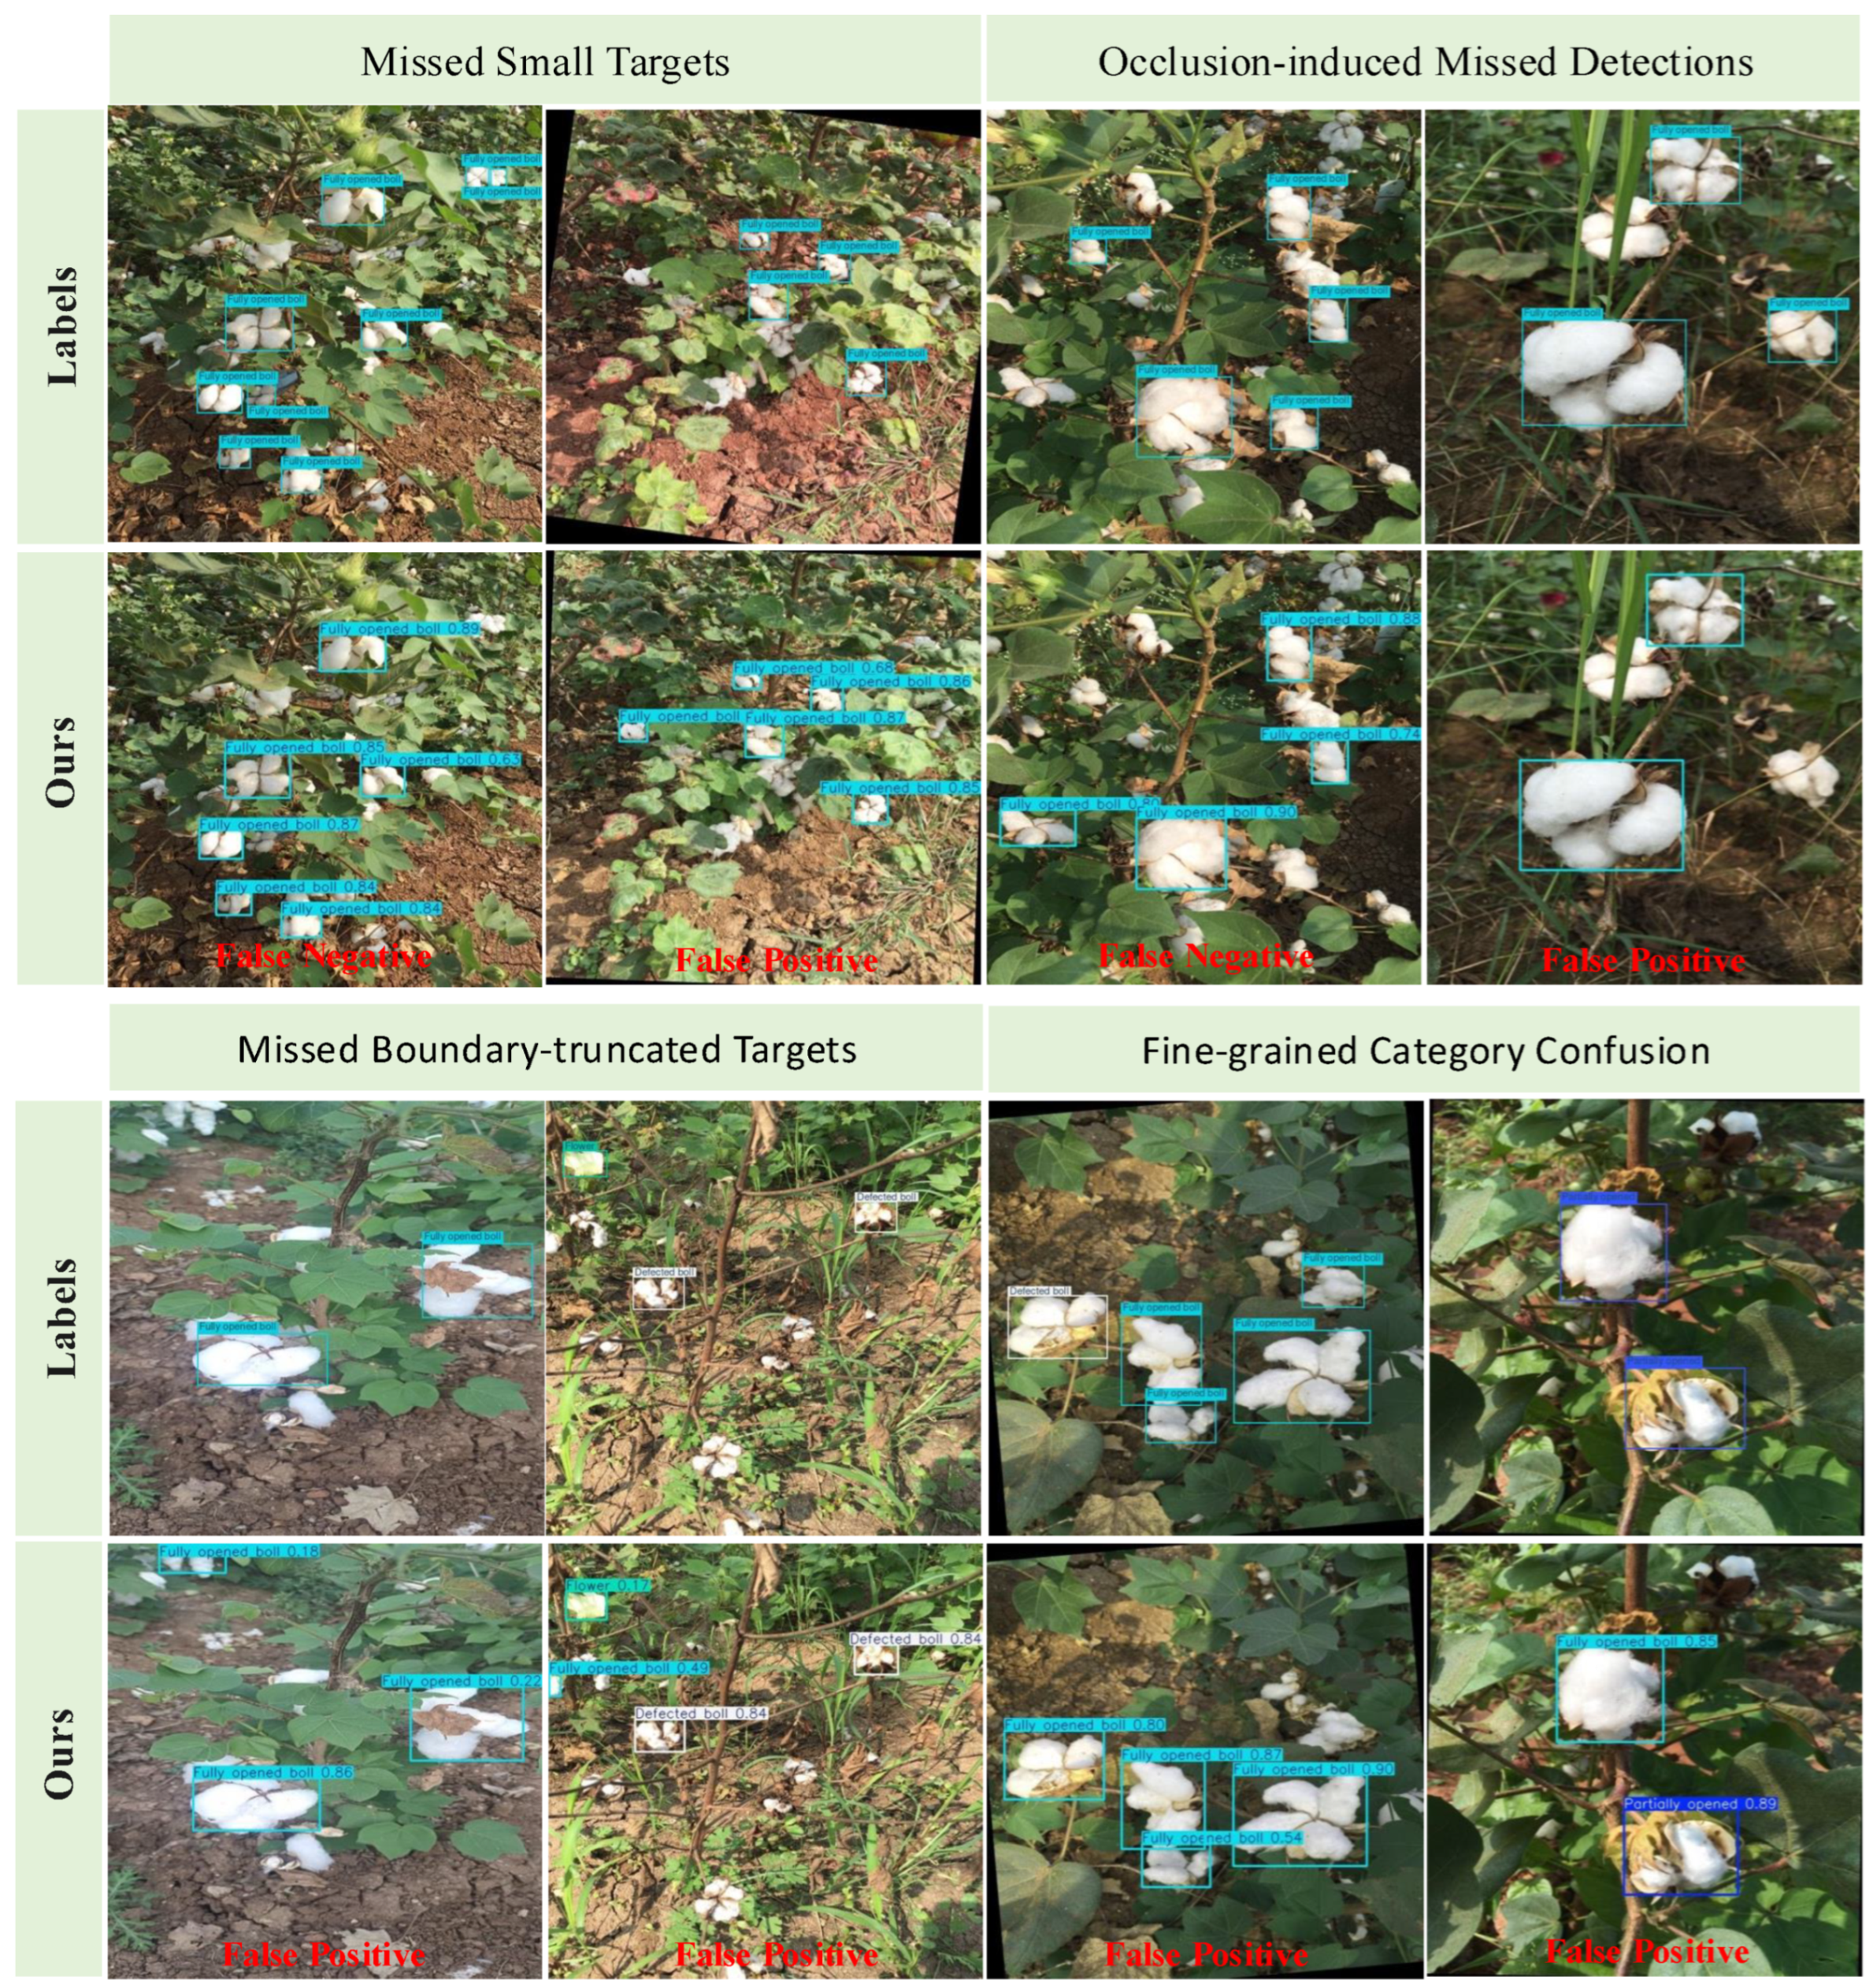

Disclaimer/Publisher’s Note: The statements, opinions and data contained in all publications are solely those of the individual author(s) and contributor(s) and not of MDPI and/or the editor(s). MDPI and/or the editor(s) disclaim responsibility for any injury to people or property resulting from any ideas, methods, instructions or products referred to in the content. |
© 2026 by the authors. Licensee MDPI, Basel, Switzerland. This article is an open access article distributed under the terms and conditions of the Creative Commons Attribution (CC BY) license.