


Abstract
National greenhouse gas inventories commonly apply a single enteric methane emission factor to an entire dairy population, which can obscure meaningful differences between production systems and between feeding seasons. An IPCC Tier 2 assessment was performed for the Romanian dairy herd in the reference year 2024 (1,051,894 cows), stratified into extensive (72.77%), semi-intensive (23.10%), and intensive (4.12%) systems and, for the two grazing-based systems, into a winter indoor and a summer grazing period. Gross energy intake (GE), digestible energy (DE), and the methane conversion factor (Ym) were derived from national feed composition references, with Ym estimated from DE using a regression equation. Season-specific emission factors were combined into day-weighted annual values. GE ranged from 153.60 MJ head−1 day−1 to 387.78 MJ head−1 day−1 and Ym from 5.48% (semi-intensive, grazing) to 6.44% (extensive, indoor). Day-weighted annual emission factors were 144.37 kg CH4 head−1 year−1, 108.17 kg CH4 head−1 year−1 and 81.92 kg CH4 head−1 year−1 for the intensive, semi-intensive, and extensive systems, whereas methane intensity declined in the opposite direction, from 25.32 g CH4 kg−1 FPCM to 19.98 g CH4 kg−1 FPCM. National enteric emissions were estimated at 95,260 t CH4 (2,572,014 t CO2-eq), 65.8% of which originated from the extensive system. Sensitivity analysis showed that national emissions were more sensitive to gross energy intake (±10% change in emissions for a ±10% change in GE intake) than to digestible energy (±4.3–4.8% change for a ±2 percentage-point change in DE). These results suggest that the methane-related environmental ranking of Romanian dairy systems depends strongly on the functional unit considered and that seasonal variation in Ym is comparable in magnitude to differences between production systems.
1. Introduction
The livestock sector plays an essential role in global food security, rural livelihoods, and agricultural economies, yet it remains a major contributor to anthropogenic greenhouse gas (GHG) emissions. Earlier Food and Agriculture Organization (FAO) assessments attributed about 14.5% of global anthropogenic GHG emissions to livestock supply chains, mainly through enteric methane, manure management, and feed production, while more recent FAO updates revised this share to approximately 12% [1,2,3]. Enteric methane (CH4), produced continuously through ruminal microbial fermentation and released predominantly via eructation, represents both a potent GHG and a loss of dietary energy that could otherwise support maintenance, growth, reproduction, and milk production [4,5]. Consequently, improving dietary energy efficiency while sustaining or increasing animal productivity has become a central objective of mitigation strategies in ruminant systems [6,7].
Enteric CH4 can be expressed as production (g day−1), yield (g CH4 kg−1 dry matter intake), or intensity (g CH4 kg−1 of milk or fat- and protein-corrected milk, FPCM). These metrics vary substantially with dry matter intake, diet digestibility, parity, lactation stage, and feeding strategy [4,8]. Higher-producing cows often exhibit lower methane intensity due to the dilution of maintenance requirements, even when their absolute emissions are greater [9]. However, this relationship is strongly influenced by production system characteristics: a comparative study showed marked differences in CH4 emissions per animal and per unit of product across extensive, semi-intensive, and intensive systems, driven primarily by feeding strategy and intake [10].
Seasonality further modifies methane emissions in temperate dairy systems. Winter diets rely on conserved forages such as hay and silage, whereas summer diets incorporate fresh forage and pasture, altering intake, digestibility, fermentation patterns, and methane output [11,12]. Applying a single annual emission factor may therefore fail to capture biologically meaningful within-year variation.
The Intergovernmental Panel on Climate Change (IPCC) Guidelines for National Greenhouse Gas Inventories provide a consistent methodological basis for estimating enteric methane emissions and are particularly suitable for heterogeneous livestock populations, as they account for key animal- and diet-related variables, including gross energy (GE) and digestible energy (DE) intake as well as the methane conversion factor (Ym) [13,14]. Recent reviews highlight advances in nutritional mitigation strategies and prediction models, underscoring the need for regionally calibrated emission estimates [6,15].
The European dairy sector is both large and structurally heterogeneous. Eurostat reported approximately 71.9 million bovine animals in the EU-27 in December 2024, decreasing further to 71.6 million in 2025 [16]. In 2024, EU farms produced around 161.8 million tons of raw milk, of which 156.1 million tons were cow’s milk [17]. These figures underline the importance of cattle production within the European agricultural sector, while the continuing reduction in the bovine population illustrates the structural changes occurring in European livestock production.
Romania constitutes a distinct component of this wider European context. The national dairy population assessed in this study comprised 1,051,894 cows in 2024, distributed across extensive, semi-intensive, and intensive production systems. Extensive farms accounted for the majority of dairy cows, whereas intensive farms represented only a small share of the national herd. This distribution is critical for national CH4 assessments because a system’s contribution to total emissions depends on both its per-animal emission factor and its population size. Despite this substantial herd, Romania’s average milk yield (3773 kg cow−1 year−1) remains among the lowest in the EU [18], reflecting a structurally diverse dairy sector dominated by small, low-input holdings complemented by a minority of highly productive intensive farms.
European climate and agricultural policy increasingly recognizes the need to differentiate production systems. The European Green Deal and the Farm to Fork Strategy emphasize reducing environmental impacts while maintaining food security, farm viability, and ecosystem functions [19]. Recent assessments further underline that livestock mitigation strategies must account for differences in productivity, resource use, and environmental performance across structurally diverse systems [20,21].
This perspective is particularly relevant for Romania, where dairy production spans a wide range of herd sizes, feeding regimes, grazing practices, and forage–concentrate ratios. Such heterogeneity introduces uncertainty when national-level emission estimates are interpreted without reference to underlying production structures. Differences among extensive, semi-intensive, and intensive systems may influence both the magnitude of enteric CH4 emissions and the relationship between emissions and milk output, underscoring the importance of system-specific and season-specific assessments. Previous Romanian assessments have primarily quantified temporal trends in enteric CH4 emissions at the national or livestock category level, while farm-level studies have examined the influence of feeding strategies and ration composition on GHG emissions [22,23,24,25]. However, these two dimensions have not been integrated into a national assessment that simultaneously differentiates dairy production systems, seasonal feeding regimes, diet-related parameters, and emissions per unit of milk output. Consequently, the extent to which Romania’s heterogeneous dairy production structure and seasonal feeding conditions affect system-specific emission factors, national CH4 emissions, and emission intensity per unit of milk remains insufficiently characterized. Accordingly, the present study aimed to provide a production system- and season-specific assessment of enteric CH4 emissions from Romanian dairy cattle for the reference year 2024, using an IPCC Tier 2-based approach applied separately to extensive, semi-intensive, and intensive systems and to their respective winter (indoor housing) and summer (grazing) feeding periods.
The specific objectives were to: (i) estimate GE intake, DE, and Ym for each production system and season; (ii) calculate seasonal and annual enteric CH4 emission factors for each system; (iii) estimate total annual enteric CH4 emissions from the Romanian dairy cattle population in 2024; (iv) quantify CH4 emission intensity per kilogram of actual milk and of fat- and protein-corrected milk; (v) express enteric CH4 emissions as CO2-equivalents; and (vi) evaluate the implications of production system, season, and productivity for the environmental assessment of Romanian dairy production.
We hypothesized that increasing production intensity is associated with lower CH4 emissions per unit of milk, despite potentially higher absolute emissions per animal, and that seasonal differences in dietary energy availability modify CH4 emission factors within each production system. By integrating production-system structure with seasonal nutritional parameters, the study provides a more differentiated assessment of Romanian dairy methane emissions than a single national emission factor and establishes a basis for identifying production-specific priorities for emission mitigation and improving the environmental efficiency of milk production.
2. Materials and Methods
2.1. Study Area, Data Sources and Study Period
The analysis covered Romania’s dairy cattle sector for the reference year 2024. Structural and productivity data were obtained from the 2024 performance-recording database of the General Association of Cattle Breeders in Romania (AGCTR) [26,27], which included 9361 dairy farms, complemented by national livestock and milk production statistics from the National Institute of Statistics (NIS) [18] and Eurostat [16,17]. No comparable system-level classification of the national dairy herd had been produced since 2016. This database therefore represents the most recent available basis for differentiating extensive, semi-intensive, and intensive dairy production systems in Romania and was used as the structural reference for this study. Although AGCTR is a performance-recording database rather than a probability sample of all Romanian dairy farms, it currently represents the most comprehensive source of farm-level structural information available for the Romanian dairy sector. Farms participating in performance recording may differ from non-participating farms in herd size, productivity, management practices, and access to recording services. Consequently, AGCTR was used as the structural reference for differentiating production systems, while acknowledging that extrapolation of its herd-size proportions to the national dairy population assumes a degree of representativeness that cannot be fully verified using the available data. National estimates should therefore be interpreted as indicative values subject to potential selection bias.
2.2. Classification of Dairy Cattle Production Systems
Farms were classified by herd size into three production-system categories following the AGCTR (2024) structural analysis: extensive (≤20 heads), semi-intensive (21–100 heads), and intensive (≥101 heads) [26,27]. Herd size was selected because it was the only variable consistently available across all farms included in the AGCTR database and therefore allowed a reproducible classification at the national level. Although herd size does not fully capture feeding practices, grazing management, animal genetics, milk productivity, or other management characteristics, it was used as a practical proxy for production-system typology. At the national scale, Romania recorded 1,051,894 dairy cows in 2024, generating a total milk production of 3,969,196,000 kg (national average yield: 3773 kg cow−1 year−1) [18,26]. Applying the structural proportions observed in the AGCTR sample to the national herd, the extensive system comprised approximately 765,540 head (72.77% of the national dairy herd), the semi-intensive system 243,012 head (23.10%), and the intensive system 43,342 head (4.12%). Mean daily milk yields attributed to each system (10.4 kg cow−1 day−1, 16.0 kg cow−1 day−1 and 25.0 kg cow−1 day−1 for extensive, semi-intensive, and intensive systems, respectively) correspond to a standard 305-day lactation yield of approximately 3200 kg cow−1 lactation−1, 4897 kg cow−1 lactation−1 and 7600 kg cow−1 lactation−1. The assumed feeding regimes and milk production levels were derived from Romanian feeding standards and sector-specific reference information and were intended to represent typical system-level scenarios rather than the characteristics of every individual farm within each category.
2.3. Animal Characteristics and Feeding Systems
The chemical composition and nutritive values of the feeds were obtained from the Romanian national reference tables, which compile standardized values widely used in dairy cattle nutrition research and are based on the INRA feed evaluation system [28]. Diets were formulated according to the energy and protein requirements of lactating cows, taking into account body weight and milk production level. The adequacy of the proposed rations was evaluated against the nutrient requirements corresponding to the reported body weights and milk production levels using Romanian feeding standards based on the INRA feeding system [28]. The feeding regimes were developed as representative system-level scenarios based on Romanian feeding standards and reference values commonly used in dairy cattle nutrition [28,29]. These scenarios were intended to reflect typical feeding practices associated with each production system rather than the management of individual farms. Intensive-system cows (550–600 kg live weight) produced approximately 25 kg milk cow−1 day−1 (3.7% fat, 3.2% protein) on an all-season (12-month), exclusively indoor ration for 365 days year−1. Semi-intensive cows (550–600 kg) were estimated to produce approximately 16 kg milk cow−1 day−1 (3.8% fat, 3.3% protein), fed an indoor winter ration for 6 months and a grazing-based summer ration for 6 months. Extensive-system-reared cows (500 kg) produced, according to our extrapolations, approximately 10.4 kg milk cow−1 day−1 (4.0% fat, 3.5% protein), likewise fed a 6-month indoor winter ration and a 6-month grazing summer ration, without concentrate supplementation. The daily ration composition, dry matter (DM) content, and the resulting nutrient supply relative to requirement are summarized in Table 1.
Table 1.
Daily ration composition by production system and season *.
2.4. Gross Energy Intake
Gross energy intake was calculated from the chemical composition of each diet using the equation [28]:
where
GE (kcal kg−1 DM) = 5.72 × PB + 9.5 × GB + 4.79 × CelB + 4.17 × SEN
GE = gross energy, kcal kg−1 DM;
PB = crude protein, g kg−1 DM;
GB = crude fat, g kg−1 DM;
CelB = crude fiber, g kg−1 DM;
SEN = nitrogen-free extract, g kg−1 DM.
The calculation is based on the caloric value of the main nutrient fractions, assuming that 1 g of crude protein (CP) provides 5.72 kcal, 1 g of crude fat (GB) provides 9.5 kcal, 1 g of crude fiber (CelB) provides 4.79 kcal, and 1 g of nitrogen-free extract (SEN) provides 4.17 kcal.
Daily GE intake per cow (MJ head−1 day−1) was obtained by multiplying the GE content of the ration by the daily dry matter intake (DMI) for each production system and season. Annual GE intake (MJ head−1 year−1) was then calculated by multiplying daily intake by the number of days in each feeding period (365 days for the intensive system; 183 winter days and 182 summer days for the semi-intensive and extensive systems).
Conversion from kcal to MJ was performed using:
considering that 1 MJ = 239 kcal.
GE (MJ kg−1 DM) = GE (kcal kg−1 DM)/239
2.5. Digestible Energy
The percentage of gross energy that is digestible was calculated using the equation:
where
DE % = (DE/GE) × 100
DE = digestible energy content of the diet (MJ kg−1 DM). Digestible energy values were obtained from the Romanian national feed evaluation tables [28].
GE = gross energy (MJ kg−1 DM).
2.6. Methane Conversion Factor
The methane conversion factor (Ym, percentage of gross energy intake converted to CH4) was estimated from dietary DE% using the equation of Cambra-López et al. (2008) [30]:
Ym = –0.0038 × (DE %)2 + 0.3501 × DE % − 0.811
The proposed equation was developed for ruminant diets and was applied here to the representative dairy cow rations used in the three production systems.
2.7. Enteric Methane Emission Factor
Enteric methane emission factors were calculated using the IPCC Tier 2 method [13,14] for each production system and season:
where
EF = [GE × (Ym/100) × 365]/55.65
EF = emission factor for enteric fermentation (kg CH4 head−1 year−1);
GE = gross energy intake (MJ head−1 day−1);
Ym = methane conversion factor, percent of gross energy in feed converted to methane. The factor 55.65 (MJ kg−1 CH4) is the energy content of methane.
This equation, applied at the seasonal daily GE and Ym values, yields a season-specific, annualized-equivalent emission factor. For the semi-intensive and extensive systems, in which winter and summer rations differ, a day-weighted annual emission factor was subsequently obtained by summing the seasonal CH4 energy output over the actual duration of each period (183 winter days and 182 summer days) before dividing by 55.65.
2.8. Conversion of Enteric Methane to CO2-Equivalents
Enteric methane emissions were converted to CO2-equivalents using the 100-year global warming potential (GWP100) of 27 kg CO2-eq kg−1 CH4 for biogenic methane [31]:
where
Emissions (t CO2-eq) = N(T) × (EF(T)/1000) × GWP100,CH4
Emissions = methane emissions from enteric fermentation of dairy cattle, t CO2-eq;
N(T) = the number of heads of livestock species/category T in the country;
EF(T) = emission factor for the defined livestock population, kg CH4 head−1 year−1;
GWP100 CH4 = the global warming potential of CH4 in 100 years;
1 kg CH4= 27 kg CO2-eq.
2.9. Milk Yield, Fat and Protein Corrected Milk, and Carbon Intensity
To enable standardized comparison of methane output between systems on a product basis, both actual milk yield and fat- and protein-corrected milk (FPCM) were calculated. Annual milk yield per cow (kg year−1) was taken as the yield per 305-day lactation. Consequently, methane intensity values should be interpreted primarily as comparative indicators among production systems. Because detailed information on dry-period duration, feed intake, and ration composition was not available for each production system, the potential effect of the dry period on emission estimates was evaluated separately through a sensitivity analysis described in Section 2.10.
FPCM, standardized to 4.0% fat and 3.3% protein, was calculated using the equation [32]:
FPCM (kg) = milk yield (kg) × (0.1226 × fat% + 0.0776 × protein% + 0.249)
Methane intensity was expressed as grams of CH4 per kilogram of actual milk and of FPCM:
CH4 intensity (g kg−1 product) = [EFannual (kg CH4 year−1) × 1000]/product yield (kg year−1)
The enteric methane-related carbon intensity of milk production was then calculated by applying the following formula:
Enteric-CH4 carbon intensity (kg CO2-eq kg−1 FPCM) = [CH4 intensity (g kg−1 FPCM) × 27]/1000
The indicator refers exclusively to enteric CH4 emissions from lactating cows and therefore represents a single-source emission intensity rather than a carbon footprint of milk. Emissions from manure management (CH4 and N2O), feed production and fertiliser use (including direct and indirect soil N2O), purchased inputs, on-farm energy use, land use and land-use change, as well as enteric CH4 from replacement heifers, calves and other non-lactating animals, were outside the system boundary. No allocation between milk and meat (culled cows and surplus calves) was applied, so the entire enteric CH4 emission of the lactating cow was attributed to milk.
2.10. Deterministic Sensitivity Analysis
A deterministic one-at-a-time (OAT) sensitivity analysis was performed to evaluate the influence of key dietary inputs on system-specific emission factors and national enteric methane estimates. The baseline inputs were the GE intake and DE (%) values reported in Table 2. In separate scenarios, GE intake was decreased or increased by 10% relative to baseline, whereas DE was decreased or increased by 2 percentage points for each system-season combination. These ranges were selected to explore the sensitivity of the results to plausible variation in key dietary parameters and do not represent statistically derived confidence intervals. For each scenario, Ym was recalculated using Equation (4), and seasonal emission factors were recalculated using Equation (5). For the semi-intensive and extensive systems, seasonal outputs were weighted according to the duration of the winter (183 days) and summer (182 days) feeding periods. System-specific annual emission factors were multiplied by the corresponding national cow numbers reported in Table 3, and national emissions were obtained by summing values across production systems. Only one parameter was modified in each scenario, while all other inputs were held constant. The relative change from the baseline estimate was calculated as follows:
Relative change (%) = 100 × (scenario estimate − baseline estimate)/baseline estimate.
Table 2.
Gross energy intake, digestible energy, methane conversion factor and season-specific emission factors by production system and season.
Table 3.
Annual (day-weighted) enteric methane emission factors and total national enteric methane emissions from Romanian dairy cattle production systems, 2024.
An additional scenario was used to assess the potential effect of the dry period. This scenario assumed 305 lactating days and 60 dry days, with a dry-cow DMI equivalent to 2.0% of body weight, a GE content of 18.45 MJ kg−1 DM [14], and a DE value of 60%, while Ym was derived using Equation (4). The analysis was intended to evaluate the sensitivity of the results to selected assumptions and should not be interpreted as a probabilistic uncertainty assessment or independent validation of the emission estimates.
2.11. Data Presentation and Aggregation
Emission factors refer to a full calendar year of feeding, whereas milk output refers to a 305-day lactation. Figures were produced in R software, version 4.3.3. National weighted averages presented in the figures and tables were computed as production-weighted means, each system-specific value being weighted by that system’s contribution to national FPCM output rather than by head count.
3. Results
3.1. Gross Energy Intake, Digestibility, and Methane Conversion Factor by Production System and Season
Gross energy intake (GE) varied across production systems and seasons, ranging from 153.60 MJ head−1 day−1 in the extensive system during summer grazing to 387.78 MJ head−1 day−1 in the intensive, year-round Total Mixed Ration (TMR) feeding system (Table 2). These differences reflect the variation in dry matter intake and ration energy density among systems.
Within both semi-intensive and extensive systems, GE was consistently higher in winter (indoor housing) than in summer (grazing): 302.43 MJ head−1 day−1 vs. 270.67 MJ head−1 day−1 for the semi-intensive system (−10.5%) and 253.59 MJ head−1 day−1 vs. 153.60 MJ head−1 day−1 for the extensive system (−39.4%). These reductions correspond to the shift from conserved-forage winter diets to lower-energy pasture-based summer diets.
Digestible energy (DE, %) showed the opposite seasonal trend. In both semi-intensive and extensive systems, DE was higher during grazing than during indoor feeding, consistent with the superior nutritional quality and rumen degradability of young pasture herbage. Digestibility increased from 64.20% to 67.69% in the semi-intensive system (+3.49 percentage points) and from 60.65% to 66.86% in the extensive system (+6.21 percentage points). The intensive system showed an intermediate digestibility of 66.43%, reflecting its balanced combination of maize silage, alfalfa hay, and concentrate.
Ym followed an inverse relationship with digestibility and was consistently higher in winter than in summer. In the semi-intensive system, Ym decreased from 6.00% (winter) to 5.48% (summer), while in the extensive system it declined from 6.44% to 5.61%. Across all system–season combinations, Ym ranged from 5.48% (semi-intensive, summer) to 6.44% (extensive, winter). The intensive system, with the most balanced and highly digestible ration overall, showed an intermediate Ym (5.68%), which was slightly lower than that observed in the semi-intensive system during winter.
Seasonal and system-production differences in gross energy intake (GE), digestible energy (DE, %), and the proportion of gross energy lost as methane (Ym) translated into considerable variation in emission factors (EF). Annual EF values ranged from 56.52 kg CH4 head−1 year−1 in the extensive summer grazing system to 144.37 kg CH4 head−1 year−1 in the intensive system (Table 2). Semi-intensive cows produced 119.07 kg CH4 head−1 year−1 during winter and 97.22 kg CH4 head−1 year−1 during summer, reflecting the combined effect of lower GE intake and higher digestibility during grazing. In the extensive system, EF decreased sharply from 107.18 kg CH4 head−1 year−1 in winter to 56.52 kg CH4 head−1 year−1 in summer, driven primarily by the large seasonal reduction in GE intake.
3.2. Annual Enteric Methane Emission Factors and National Enteric Methane Emissions
The day-weighted annual EFs derived for each production system were 144.37 kg CH4 head−1 year−1 for the intensive system, 108.17 kg CH4 head−1 year−1 for the semi-intensive system, and 81.92 kg CH4 head−1 year−1 for the extensive system. These values integrate the seasonal differences in gross energy intake and methane conversion factor for systems operating with distinct winter and summer feeding regimes.
Applying these annual EFs to the national distribution of dairy cows across production systems (Table 3), total enteric CH4 emissions from Romanian dairy cattle in 2024 were estimated at 95,260 t CH4 year−1. Although the extensive system exhibits the lowest per-animal EF, it accounted for the largest share of national emissions, 62,715 t CH4 year−1 (65.8%). The semi-intensive system contributed 26,288 t CH4 year−1 (27.6%), while the intensive system, despite having the highest per-animal EF, contributed only 6257 t CH4 year−1 (6.6%).
Converted to CO2-equivalents, total national enteric methane emissions from dairy cattle were estimated at approximately 2,572,014 t CO2-eq year−1. Of this total, the extensive system contributed 1,693,298 t CO2-eq year−1, the semi-intensive system 709,770 t CO2-eq year−1, and the intensive system 168,946 t CO2-eq year−1.
3.3. Milk Yield, Fat- and Protein-Corrected Milk, and Methane Emission Intensity
Fat- and protein-corrected milk (FPCM) differed slightly from the non-corrected milk yield, reflecting the variation across production systems (Table 4). In the semi-intensive and intensive systems, FPCM was lower than non-corrected milk yield (4755 kg head−1 year−1 vs. 4897 kg head−1 year−1 and 7227 kg head−1 year−1 vs. 7600 kg head−1 year−1, respectively), consistent with their lower milk fat and protein contents. In contrast, the extensive system produced slightly more FPCM than non-corrected milk yield (3235 kg head−1 year−1 vs. 3200 kg head−1 year−1).
Table 4.
Milk yield, fat- and protein-corrected milk and enteric methane emission intensity by production system.
Methane emission intensity per kilogram of non-corrected milk declined clearly with increasing production intensity. Extensive-system cows emitted 25.60 g CH4 kg−1 milk, compared with 22.09 g CH4 kg−1 milk in the semi-intensive system and 19.00 g CH4 kg−1 milk in the intensive system, representing a 25.8% reduction between the extensive and intensive systems. A similar difference was observed when emissions were expressed per kilogram of FPCM: 25.32 g CH4 kg−1 FPCM in the extensive system, 22.75 g CH4 kg−1 FPCM in the semi-intensive system, and 19.98 g CH4 kg−1 FPCM in the intensive system, corresponding to a 21.1% reduction from the extensive system to the intensive system.
3.4. Enteric Methane-Related Carbon Intensity of Milk Production
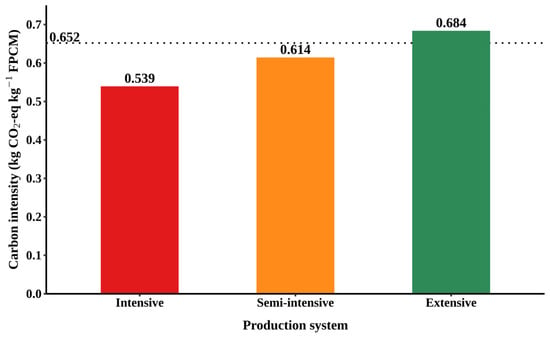
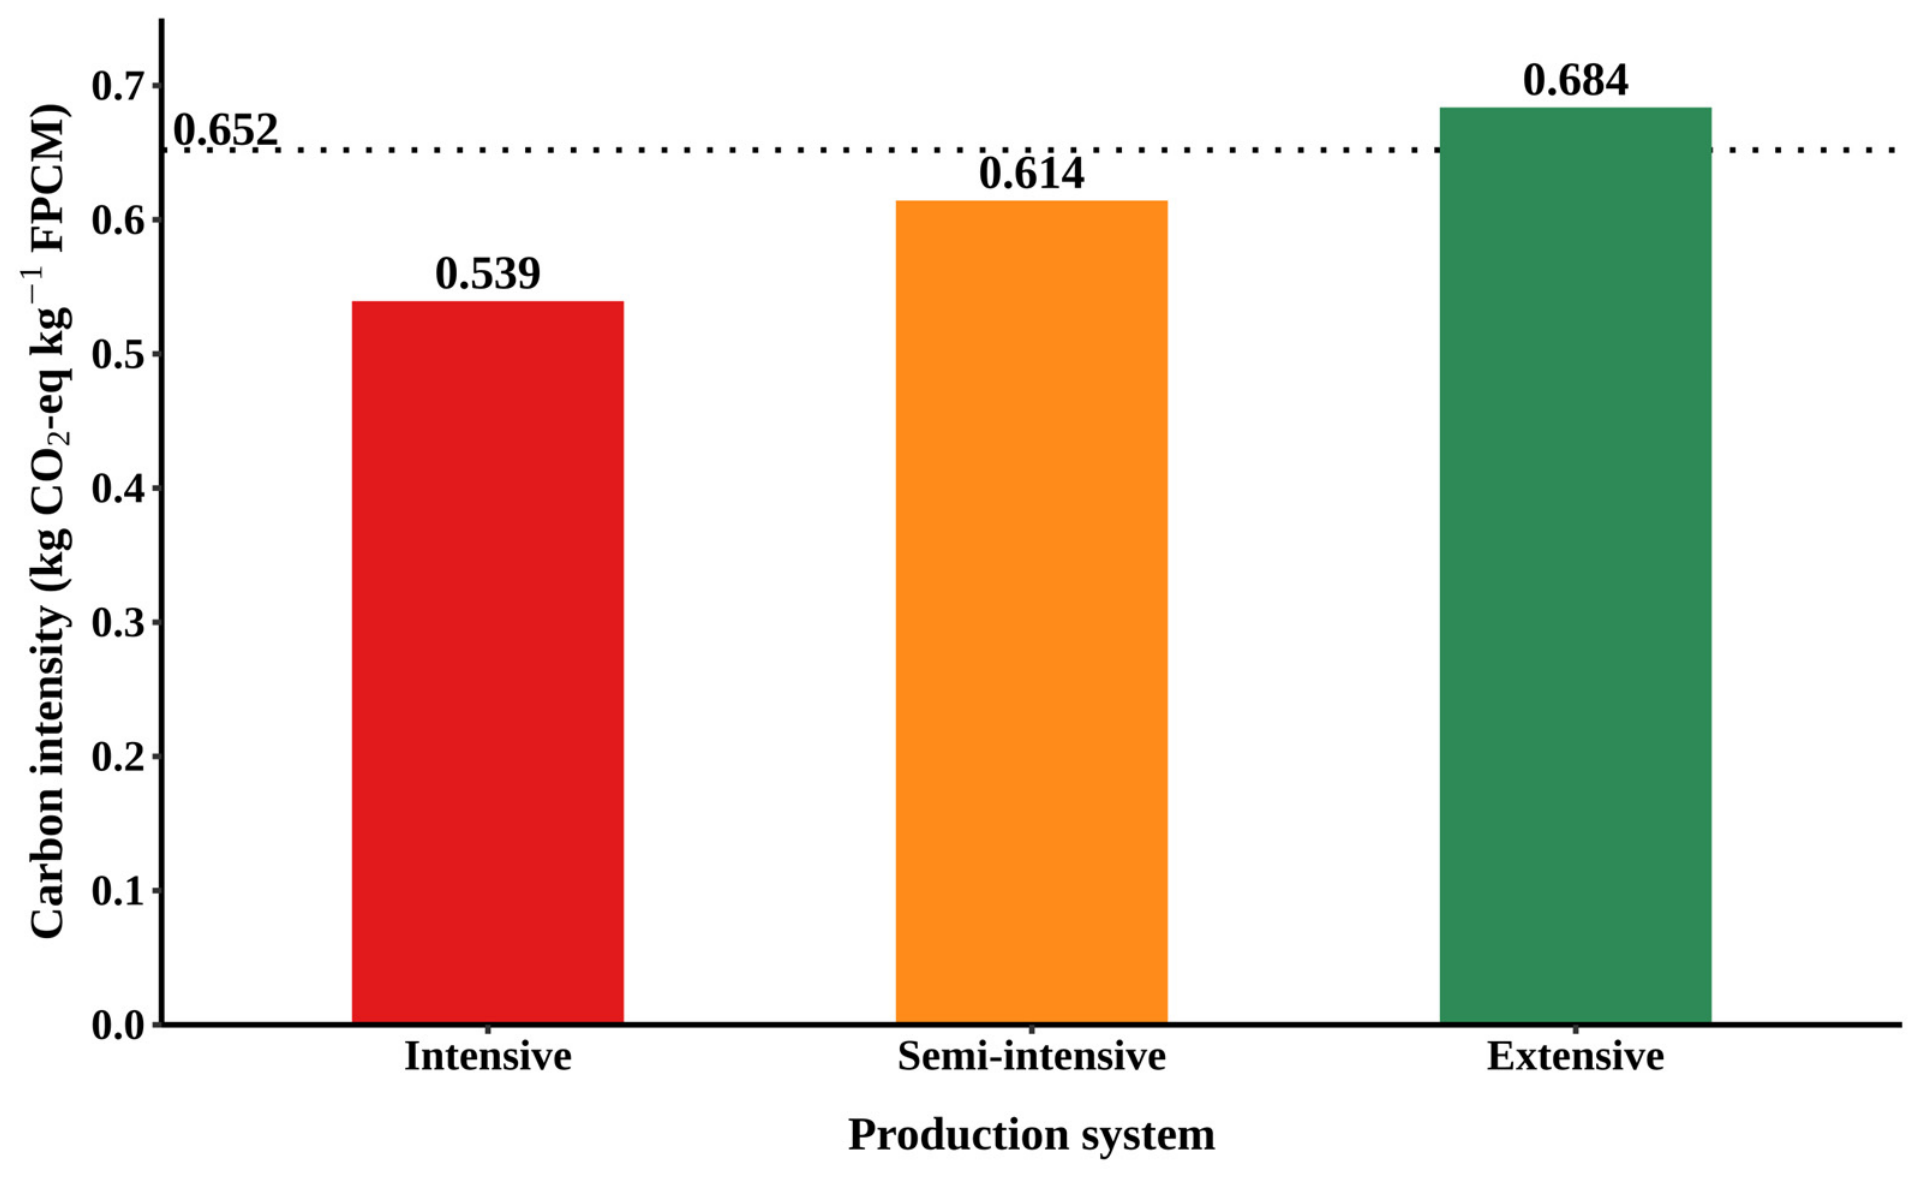
The enteric methane-related carbon intensity of milk production decreased consistently with increasing production intensity. Carbon intensity values ranged from 0.684 kg CO2-eq kg−1 FPCM in the extensive system to 0.614 kg CO2-eq kg−1 FPCM in the semi- intensive system and 0.539 kg CO2-eq kg−1 FPCM in the intensive system, representing a 21.1% reduction between the extensive and the intensive systems (Figure 1). To estimate the national enteric methane-related carbon intensity of milk production, these system-specific values were weighted by their respective contributions to national FPCM output. In 2024, extensive farms produced approximately 2,477,000 t, semi-intensive farms 1,155,000 t, and intensive farms 313,000 t of total national FPCM, reflecting the structural dominance of extensive systems in Romania’s dairy sector. The resulting national FPCM-weighted mean was 0.652 kg CO2-eq kg−1 FPCM, equivalent to 24.14 g CH4 kg−1 FPCM. These values represent enteric methane emissions from lactating cows only and should not be interpreted as the total carbon footprint of milk production. Emissions associated with manure management, feed production, on-farm energy use, and other sources typically included in cradle-to-farm-gate assessments were not considered.
Figure 1.
Enteric methane-related carbon intensity of milk production (kg CO2-eq kg−1 FPCM) by production system. Dotted line = national FPCM output weighted average (0.652 kg CO2-eq kg−1 FPCM). Values refer to enteric CH4 from lactating cows only, converted to CO2-equivalents with GWP100 = 27 kg CO2-eq kg−1 CH4, and are not full carbon footprints of milk.
3.5. Overall Ranking of Production Systems Across Methane Indicators
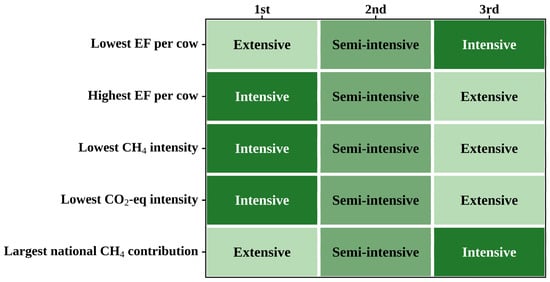
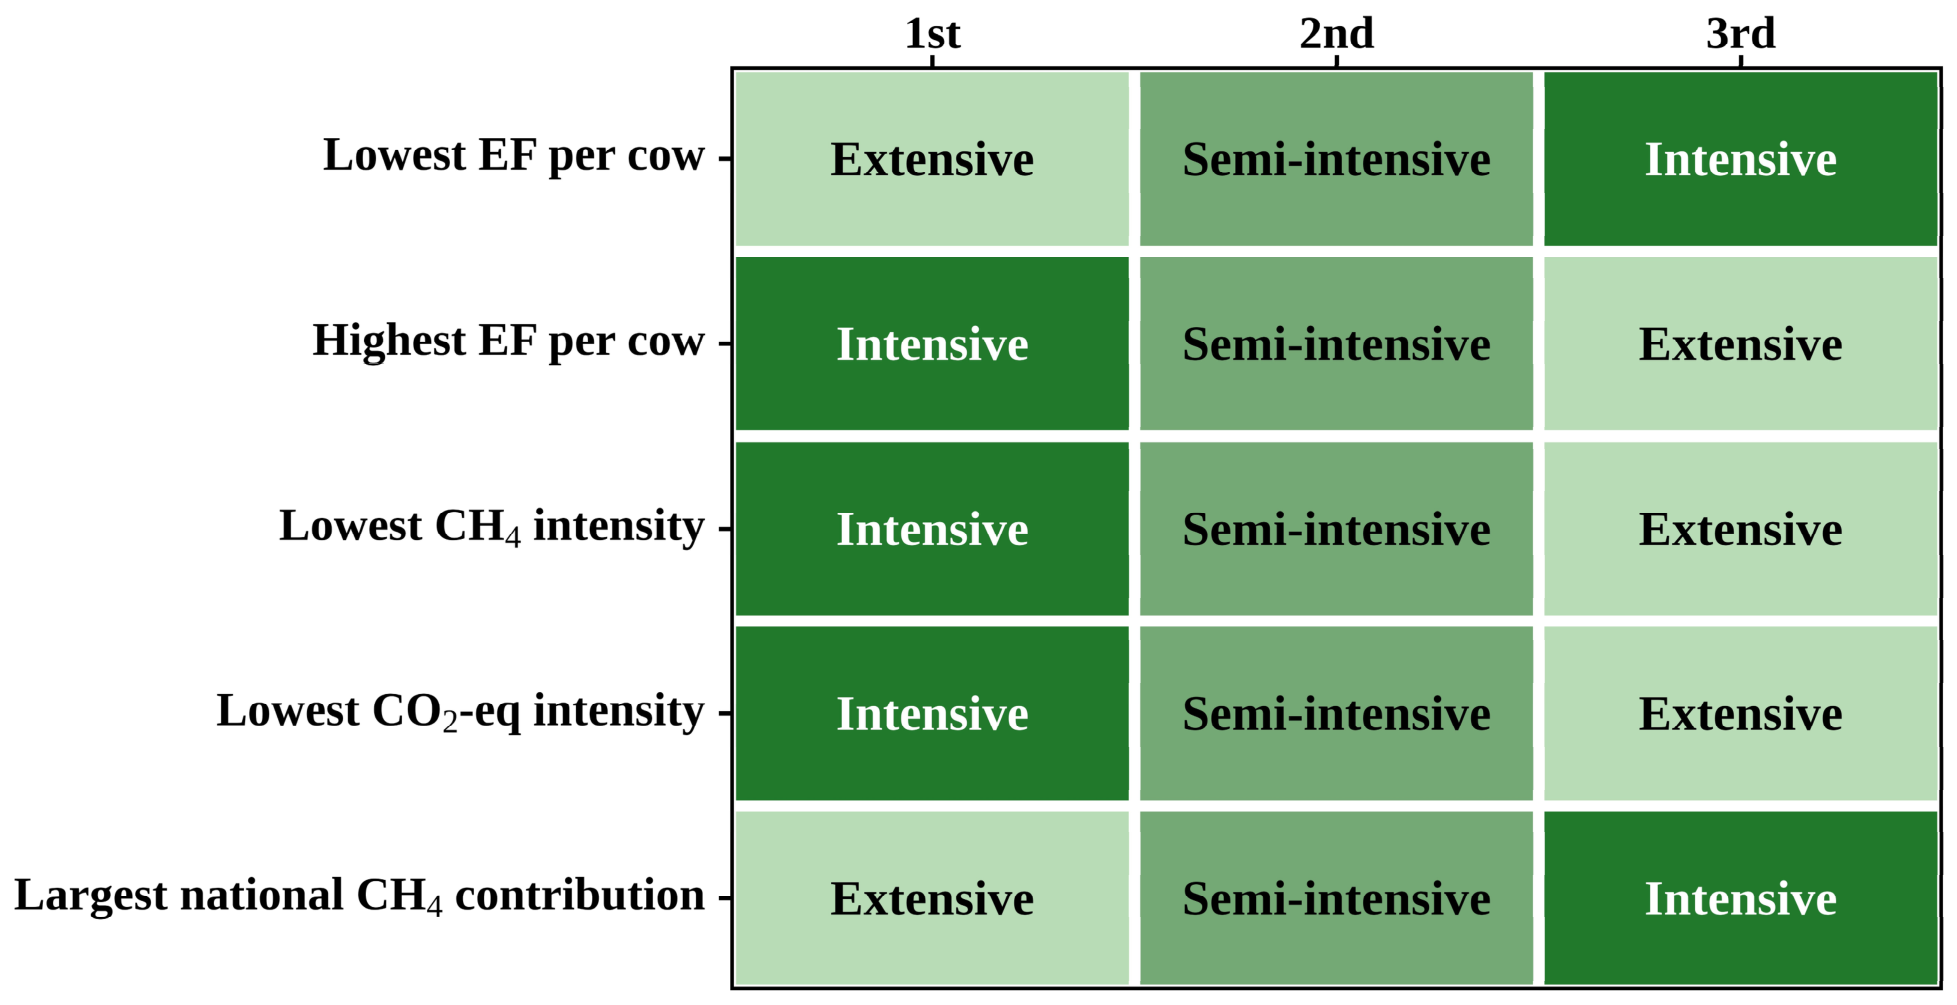
The ranking of the three production systems across the five CH4-related indicators is presented in Figure 2. The extensive system ranks most favourably (1st) only for the lowest per-cow emission factor but least favourably (3rd) for every product-based indicator (CH4 intensity and CO2-eq intensity) as well as for its contribution to national enteric CH4 output, where it ranks 1st (largest contributor) as a direct consequence of its numerical dominance in the national herd (72.77% of dairy cows) rather than of any inefficiency at the level of the individual animal. The intensive system shows the opposite pattern, ranking least favourably (3rd) for absolute per-cow emissions but most favourably (1st) for both CH4 intensity and carbon intensity, and contributing the smallest share of national emissions despite having the highest per-animal footprint. The semi-intensive system occupies an intermediate position on every indicator, consistent with its intermediate productivity and dietary energy supply.
Figure 2.
Ranking of dairy production systems according to methane-related indicators. Note: 1st = most favourable rank; 2nd = intermediate rank; 3rd = least favourable rank, by indicator. EF = emission factor; CH4 = methane; CO2-eq = carbon dioxide equivalent.
3.6. Sensitivity of Emission Factors and National Emissions
A ±10% change in GE intake changed annual emission factors and national emissions proportionally (±10%), because Ym was held constant in these scenarios. A change of ±2 percentage points in DE % altered Ym non-linearly through Equation (4): national emissions increased by 4.3% (to 99,364 t CH4 year−1) when DE % was decreased and decreased by 4.8% (to 90,673 t CH4 year−1) when DE % was increased (Table 5). Within the tested ranges, the national estimate was therefore more sensitive to GE intake than to DE %. Including an assumed 60-day dry period reduced the annual EF by 6.1% in the intensive system, 2.7% in the semi-intensive system and 0.6% in the extensive system, and national emissions by 1.5% (to 93,787 t CH4 year−1). CH4 intensity decreased to 18.8 g CH4 kg−1 FPCM, 22.1 g CH4 kg−1 FPCM and 25.2 g CH4 kg−1 FPCM, respectively, so the ranking of systems was unchanged for all indicators. The effect was largest in the intensive system, where the difference between lactating and dry cow intake is greatest.
Table 5.
Deterministic sensitivity analysis of annual enteric CH4 emission factors (EF, kg CH4 head−1 year−1) and national enteric CH4 emissions.
At the ration level, the assumed DMI and GE intake of four of the five rations were within −8% to +9% of the corresponding reference values [14,29], whereas those of the extensive summer ration were 30% and 36% lower. The summer EF of the extensive system may be underestimated.
These results should be interpreted as deterministic sensitivity analyses rather than probability-based uncertainty estimates.
4. Discussion
4.1. Interpretation of Results in Relation to the Study Hypotheses
The obtained results align with both working hypotheses stated in this study. First, absolute enteric CH4 emissions increased consistently with production intensity, from 81.92 kg CH4 head−1 year−1 in the extensive system to 108.17 kg CH4 head−1 year−1 and 144.37 kg CH4 head−1 year−1 in the semi-intensive and intensive systems, respectively. In contrast, methane intensity and enteric CH4-related carbon intensity per unit of product declined along the same gradient, from 25.32 g CH4 kg−1 FPCM to 19.98 g CH4 kg−1 FPCM and from 0.684 kg CO2-eq kg−1 FPCM to 0.539 kg CO2-eq kg−1 FPCM, reflecting the well-established dilution-of-maintenance effect. As maintenance requirements represent a fixed energetic cost, dairy cows with higher milk yields allocate a larger proportion of their intake toward production, resulting in lower methane emissions per kilogram of milk even as total feed intake and absolute emissions increase [33,34]. The 21–26% reduction in methane intensity observed between extensive and intensive systems is consistent with differences reported across contrasting dairy systems, where feeding strategy and intake level strongly influence both per-animal and per-product CH4 emissions. In line with our findings, multi-system evaluations show that low-intensity systems consistently exhibit the least favourable product-based emissions despite having the lowest absolute CH4 output [10,34].
Recent European evidence reinforces this interpretation. Starsmore et al. [35] reported that daily CH4 production in grazing Irish dairy cows (mean 352 g CH4 day−1) was positively associated with energy-corrected milk yield, metabolic live weight, and milk urea concentration, with animal and production variables explaining 47% of the variation in daily CH4 output. Similar findings have been reported across diverse European dairy systems, where feeding strategy, intake level, and system typology strongly influence both per-animal and per-product emissions [20,21,36]. Studies evaluating genetically divergent grazing cows also show that higher-producing animals tend to emit more CH4 in absolute terms, but not necessarily per unit of product, due to differences in feed efficiency and metabolic traits [37,38]. Furthermore, recent advances in milk-spectral prediction of methane emissions demonstrate that animal-level variation is substantial and closely tied to both diet and physiology [39]. Genetic studies also demonstrate that methane emissions are heritable and associated with milk yield and composition traits, reinforcing the role of animal-level variation [8]. Collectively, these studies support the present results by showing that CH4 emissions are shaped by a combination of milk yield, intake level, animal size, feed efficiency, metabolic traits, and feeding conditions, rather than production intensity alone.
Second, seasonal differences in CH4 conversion factors were evident across both Romanian production systems. In the semi-intensive system, Ym increased from 5.48% in summer to 6.00% in winter, while in the extensive system it rose from 5.61% to 6.44%. These differences reflect the lower digestibility of conserved forages, maize silage, and hay relative to fresh pasture. The magnitude of variation (0.97 percentage points across system–season combinations) is consistent with European evidence showing that diet digestibility and seasonal forage quality substantially influence CH4 formation and Tier 2 parameters. Colombini et al. [11] specifically showed that DE is an important determinant of the accuracy of IPCC Tier 2 CH4 estimates and that diets based on hay may have substantially lower energy digestibility than silage-based diets. Similarly, Nunes et al. [12] demonstrated significant seasonal differences in forage nutritional characteristics and digestibility in a pasture-based cattle system, while Lahart et al. [37] observed clear seasonal variation in both CH4 production and Ym in grazing dairy cows. Hansen et al. [40] further showed that forage type and maturity stage can alter nutrient digestibility and CH4 emissions in dairy cows. Together, these findings support the use of season-specific dietary inputs when applying Tier 2 methodology, particularly in production systems where the relative contribution and nutritional quality of pasture, hay, and conserved forages change throughout the year.
Within Romania, the results show that higher production intensity increases absolute enteric CH4 emissions per animal, whereas CH4 and carbon intensity per unit of FPCM decline. Seasonal variation in Ym, driven by differences in forage digestibility, is comparable to or greater than variation between production systems. The national CH4 footprint is strongly shaped by the extensive system because of its numerical dominance, a pattern consistent with recent national assessments showing that reductions in total enteric CH4 emissions between 2015 and 2024 were driven primarily by herd contraction rather than efficiency gains [22]. The sensitivity analysis further showed that national emission estimates were more sensitive to GE intake than to DE within the tested ranges, highlighting the importance of reliable dietary input data for improving the robustness of national enteric methane estimates. Earlier national analyses [23] similarly documented long-term declines in enteric CH4 emissions associated with changes in cattle numbers, technological progress, and genetic improvement. Farm-level Romanian studies further demonstrate that feeding strategy, ration composition, feed ingredients, and seasonal feeding conditions influence GHG emissions from dairy cattle. Marin et al. [24] showed that the proportion and type of feed ingredients affect CH4 emissions relative to intake and milk yield, while Popa et al. [25] reported differences in CH4 and CO2 emissions under contrasting feeding strategies and seasonal conditions. These findings are directly relevant to the seasonal differences in Ym observed in the present study, where higher winter Ym values coincided with lower DE values, indicating that seasonal changes in dietary characteristics and energy digestibility influence the resulting EFs.
A key implication is the distinction between absolute emissions and emissions intensity. When expressed per animal, the extensive system appears environmentally favourable because its cows emit less CH4 annually. When expressed per kilogram of FPCM, the ranking reverses, with the intensive system showing the lowest intensity. This pattern is consistent with findings commonly reported in the literature, which show that higher milk yield and improved feed efficiency reduce emissions per unit of product even when absolute emissions per animal remain higher [35,37]. Seasonal changes further reinforce this distinction, as differences in Ym between winter and summer were large enough to affect EFs within the same system.
Overall, the obtained results suggest that higher production intensity increases absolute CH4 emissions per animal but reduces CH4 and carbon intensity per unit of FPCM. Also, Ym varied systematically between winter and summer, with higher values under less digestible conserved forage diets, indicating that seasonal changes in diet quality directly affect EFs.
4.2. Enteric CH4-Related Carbon Intensity in Relation to System Boundaries and Published Values
The enteric CH4-related carbon intensities obtained in this study (0.539–0.684 kg CO2-eq kg−1 FPCM; national FPCM-weighted mean 0.652 kg CO2-eq kg−1 FPCM) are lower than most carbon footprints of milk reported in the literature. This difference arises mainly from the system boundary rather than from an underestimation of emissions. Carbon footprints of milk are usually derived from cradle-to-farm-gate life cycle assessments (LCA), which, in addition to enteric CH4, include manure CH4 and N2O, soil and fertiliser N2O, emissions from feed production and transport, energy use, and, in some cases, land-use change, and which also attribute the emissions of replacement young stock to milk [32,41,42]. Using such a boundary, FAO estimated a global average of 2.4 kg CO2-eq kg−1 FPCM, with values between 1 and 2 kg CO2-eq kg−1 FPCM at the farm gate in industrialised regions, CH4 (enteric and manure) accounting for about 52% of total emissions [32]. A systematic review that recalculated published carbon footprints on a harmonised basis reported values between 0.90 and 1.53 kg CO2-eq kg−1 FPCM for European countries, with enteric CH4 contributing more than 50% of the total in half of the studies reviewed [41], while a cradle-to-farm-gate assessment of US dairy farms reported 1.23 kg CO2-eq kg−1 FPCM [43]. Assuming that enteric CH4 represents approximately 40–55% of a cradle-to-farm-gate footprint [32,41,42], the present values would correspond to an indicative total footprint of approximately 1.0–1.7 kg CO2-eq kg−1 FPCM, which lies within the range reported for European dairy systems. However, no total carbon footprint was calculated in the present study, and this comparison is provided solely for contextual interpretation. When comparisons are restricted to enteric CH4 emissions per unit of milk, the values estimated for the Romanian production systems fall within the upper range of those reported in the literature. In an intercontinental database of in vivo measurements, Niu et al. [44] reported a mean CH4 intensity of 13.6 g CH4 kg−1 energy-corrected milk (range 5.1–22.3 g CH4 kg−1) for 1423 European observations, which corresponds to approximately 0.37 kg CO2-eq kg−1 milk with a GWP100 of 27. The values estimated for the Romanian systems (19.98–25.32 g CH4 kg−1 FPCM) are comparable to, and in some cases exceed, the upper end of this measured range, which is consistent with the comparatively low milk yields of Romanian cows (3200–7600 kg cow−1 lactation−1) and with the inverse relationship between productivity and emission intensity [45,46]. Gerber et al. [45] showed that GHG emissions per kilogram of FPCM decrease substantially as milk yield per cow increases, from about 3 kg CO2-eq kg−1 FPCM at 2000 kg FPCM cow−1 year−1 to 1.6–1.8 kg CO2-eq kg−1 FPCM at about 6000 kg FPCM cow−1 year−1, with CH4 accounting for 38–50% of total emissions across yield classes, and the meta-analysis of Lorenz et al. [46] showed that milk yield must be accounted for when the carbon footprints of pasture-based, mixed, and confinement dairy systems are compared. The accounting framework itself also matters: O’Brien et al. [47] showed that an IPCC inventory-based approach, which excludes off-farm emissions, and an LCA approach can even rank grass-based and confinement dairy systems differently.
Several further methodological choices affect the absolute values. First, a GWP100 of 27 for biogenic CH4 from the IPCC Sixth Assessment Report [31] was used. Earlier studies frequently applied GWP100 values of 25 (Fourth Assessment Report) or 28 (Fifth Assessment Report), which would give 0.499–0.633 and 0.559–0.709 kg CO2-eq kg−1 FPCM, respectively, for the same CH4 intensities, whereas the Fifth Assessment Report value including climate-carbon feedbacks (GWP100 = 34) would give 0.679–0.861 kg CO2-eq kg−1 FPCM. Second, no economic or biophysical allocation to meat was applied, so all enteric CH4 of the lactating cow was attributed to milk; allocation would further lower the values attributed to milk. Third, the emission factor was calculated over 365 days at lactating-ration intake, whereas milk output refers to a 305-day lactation, which tends to increase the intensity estimate; including a 60-day dry period reduced CH4 intensity by only 0.1–1.2 g CH4 kg−1 FPCM. The reported carbon intensities should therefore be interpreted as an enteric-only indicator, restricted to lactating cows, that is suitable for comparing production systems within the national inventory framework, but not as the total carbon footprint of Romanian milk, which would be substantially higher once manure, feed-related, energy-related and young-stock emissions are included.
4.3. Implications for Mitigation and Sustainable Dairy Production
The ranking of production systems obtained has direct implications for the way in which mitigation priorities should be framed. Because the extensive system contributes most to national enteric CH4 emissions, 65.8% of the total, primarily due to its numerical dominance (72.8% of dairy cows), national-scale mitigation must focus on this system even though its per-unit-of-product footprint is the least favourable. Feasible near-term options for low-input extensive farms include improving winter forage quality and applying modest, targeted concentrate supplementation, as rumen-modifying additives remain difficult to implement in grazing-based diets [37], and genetic or genomic mitigation strategies are still rarely adopted due to lacking economic incentives [38]. Conversely, the favourable CH4 and carbon intensity of intensive systems does not justify wholesale intensification, as their higher per-animal EF (144.37 kg CH4 head−1 year−1 vs. 81.92 kg CH4 head−1 year−1) could increase national emissions without parallel gains in feed efficiency or adoption of nutritional and additive-based mitigation strategies. Semi-intensive systems, which occupy an intermediate position across all indicators, represent a realistic transition pathway for combining improved diet digestibility, targeted additives, and selection for feed efficiency.
4.4. Methodological Uncertainty and Limitations
Several limitations should be considered when interpreting these results. The Tier 2 parameters (GE, DE, Ym) were derived from system-level averages rather than replicated farm or animal-level measurements, limiting the ability to quantify within-system variability. The analysis covers only enteric CH4 and excludes manure-management emissions, feed production and transport, energy use, and land-use effects, which would be required for a full life-cycle assessment. Accordingly, the carbon intensity values refer to enteric CH4 only and should not be interpreted as carbon footprints of milk. Finally, the study reflects a single reference year (2024), and year-to-year variation in forage quality, weather, herd structure, and the extrapolation of AGCTR system proportions to the national herd introduce additional uncertainty, particularly for farms outside the milk performance recording scheme.
The sensitivity analysis was limited to selected GE and DE scenarios and does not account for the combined effects of multiple sources of uncertainty, including herd allocation, assumed diets, and the representativeness of the farm database. The selected scenario ranges were intended to evaluate the robustness of the results and should not be interpreted as statistically derived confidence intervals. In addition, herd size was used as a proxy for production-system typology, and farms within a category may differ in feeding practices and productivity. The Ym regression equation was developed from ruminant feeding data, and its application to Romanian dairy production systems introduces an additional source of model uncertainty. The dry period was evaluated through an assumption-based scenario. The inclusion of a 60-day dry period reduced national enteric CH4 emissions by 1.5%. Herbage intake on pasture, particularly in the extensive summer ration, may be underestimated. Finally, the estimated emission factors could not be validated against direct CH4 measurements because no in vivo measurements are currently available for Romanian dairy cows under the production systems considered. Agreement with the IPCC Tier 1 default factor and with a previous national Tier 2 estimate indicates consistency but should not be interpreted as evidence of predictive accuracy.
4.5. Future Research Directions
Future research should prioritise in vivo validation of system- and season-specific Ym, using GreenFeed, SF6 tracer, respiration chambers or portable CH4 detectors, to ensure locally accurate DE–Ym and GE estimates. Farm-level studies are also needed to capture real within-system variability and to extend the system boundary to include manure-management and feed-related emissions for complete farm gate carbon footprint assessments. Practical mitigation options should be further explored through targeted trials on winter forage quality and dietary optimisation in extensive and semi-intensive systems. In the longer term, incorporating genetic selection for feed efficiency and CH4-related traits could help align productivity gains with rural livelihoods and European climate mitigation goals.
5. Conclusions
This study provides a production system- and season-specific assessment of enteric CH4 emissions from Romanian dairy cattle. Absolute CH4 emissions per animal increased with production intensity, whereas CH4 and enteric CH4-related carbon intensity per kilogram of FPCM decreased, suggesting the dilution-of-maintenance effect across systems. Seasonal differences in dietary digestibility produced substantial variation in Ym and EFs, underscoring the need to account for seasonal feeding conditions. Although the extensive system had the lowest per-animal EF, its numerical predominance resulted in the largest share of national enteric CH4 emissions in 2024. Overall, environmental performance varied depending on the indicator considered: extensive systems showed lower emissions per animal, whereas intensive systems achieved lower CH4 and carbon intensity per unit of milk. Effective national mitigation strategies should therefore combine productivity and feed-efficiency improvements with targeted measures in the extensive sector. Given methodological uncertainties and the restricted system boundary, these results should be considered an initial benchmark for the Romanian dairy sector, to be refined through in vivo validation, farm-level data collection, and expanded system-boundary assessments.
Sensitivity screening showed that the national estimate is most sensitive to GE intake, which should therefore be the priority for improved activity data.
This study makes an important contribution to the field, as the Romanian dairy sector is characterized by one of the most polarized production structures in the EU-27. Highly intensive and technologically advanced farms, including fully automated and robotic milking systems, coexist with extensive, pasture-based systems in which cows rely predominantly on grazing and receive limited concentrate supplementation. This pronounced heterogeneity in production systems is particularly relevant given that Romania has one of the lowest average milk yields per cow in the EU.
Author Contributions
Conceptualization M.E. and D.G.; methodology M.E. and M.M.-I.; formal analysis M.E. and A.R.; investigation M.M.-I. and D.G.; data curation M.C. and A.R.; writing—original draft preparation M.E.; writing—review and editing D.G., M.M.-I. and M.C.; visualization M.E.; supervision D.G. and M.C.; project administration M.E. and A.R. All authors have read and agreed to the published version of the manuscript.
Funding
This research was funded by the Romanian Environment Fund Administration (Administrația Fondului pentru Mediu—AFM), under Contract No. 800/M/30.12.2024 concluded with the National Research and Development Institute for Cryogenic and Isotopic Technologies—ICSI Râmnicu Vâlcea, for the implementation of the responsibilities related to the Agriculture and Land Use, Land-Use Change and Forestry (LULUCF) subsectors, as established by Romanian Government Decision No. 1415/2024.
Institutional Review Board Statement
Not applicable.
Data Availability Statement
The data presented in this study are available on request from the corresponding author.
Acknowledgments
This study was supported by the research services contract no. 43/17.09.2025: “Development of technical parameters for estimating nitrogen excretion and methane conversion rates in the cattle sector, for the purpose of compiling the national greenhouse gas (GHG) emissions inventory”, funded by the Research and Development Institute for Cryogenic and Isotopic Technologies, Romania. During the preparation of this manuscript, the authors used Microsoft Copilot (https://copilot.com/) for English language editing and proofreading of the revised text. The authors have reviewed and edited the output and take full responsibility for the content of this publication.
Conflicts of Interest
The authors declare no conflicts of interest.
References
- Gerber, P.J.; Steinfeld, H.; Henderson, B.; Mottet, A.; Opio, C.; Dijkman, J.; Falcucci, A.; Tempio, G. Tackling Climate Change Through Livestock: A Global Assessment of Emissions and Mitigation Opportunities; Food and Agriculture Organization of the United Nations: Rome, Italy, 2013; ISBN 978-92-5-107920-1. Available online: https://www.fao.org/4/i3437e/i3437e.pdf (accessed on 3 September 2026).
- FAO. Pathways Towards Lower Emissions—A Global Assessment of the Greenhouse Gas Emissions and Mitigation Options from Livestock Agrifood Systems; Food and Agriculture Organization of the United Nations: Rome, Italy, 2023. [Google Scholar] [CrossRef] [Scilit]
- Bilotto, F.; Harrison, M.T.; Vibart, R.; Mackay, A.; Christie-Whitehead, K.M.; Ferreira, C.S.S.; Cottrell, R.S.; Forster, D.; Chang, J. Towards resilient, inclusive, sustainable livestock farming systems. Trends Food Sci. Technol. 2024, 152, 104668. [Google Scholar] [CrossRef] [Scilit]
- Hristov, A.N. Invited review: Advances in nutrition and feed additives to mitigate enteric methane emissions. J. Dairy Sci. 2024, 107, 4129–4146. [Google Scholar] [CrossRef] [Scilit]
- Fresco, S.; Boichard, D.; Lefebvre, R.; Barbey, S.; Gaborit, M.; Fritz, S.; Martin, P. Comparison of methane production, intensity, and yield throughout lactation in Holstein cows. J. Dairy Sci. 2023, 106, 4147–4157. [Google Scholar] [CrossRef] [Scilit]
- Min, B.-R.; Lee, S.; Jung, H.; Miller, D.N.; Chen, R. Enteric Methane Emissions and Animal Performance in Dairy and Beef Cattle Production: Strategies, Opportunities, and Impact of Reducing Emissions. Animals 2022, 12, 948. [Google Scholar] [CrossRef] [Scilit]
- Roques, S.; Martinez-Fernandez, G.; Ramayo-Caldas, Y.; Popova, M.; Denman, S.; Meale, S.J.; Morgavi, D.P. Recent Advances in Enteric Methane Mitigation and the Long Road to Sustainable Ruminant Production. Annu. Rev. Anim. Biosci. 2024, 12, 321–343. [Google Scholar] [CrossRef] [Scilit]
- Ghiasi, H.; Sitkowska, B.; Piwczyński, D.; Kolenda, M. Genetic Parameters for Methane Emissions Using Indirect Prediction of Methane and Its Association with Milk and Milk Composition Traits. Animals 2022, 12, 2073. [Google Scholar] [CrossRef] [Scilit]
- Capper, J.L.; Cady, R.A.; Bauman, D.E. The environmental impact of dairy production: 1944 compared with 2007. J. Anim. Sci. 2009, 87, 2160–2167. [Google Scholar] [CrossRef] [Scilit]
- Reichenbach, M.; Mech, A.; Pinto, A.; Malik, P.K.; Bhatta, R.; König, S.; Schlecht, E. Differences in enteric methane emissions across four dairy production systems in the urbanizing environment of an Indian megacity. Front. Sustain. Food Syst. 2023, 7, 1204218. [Google Scholar] [CrossRef] [Scilit]
- Colombini, S.; Rota Graziosi, A.; Galassi, G.; Gislon, G.; Crovetto, G.M.; Enriquez-Hidalgo, D.; Rapetti, L. Evaluation of Intergovernmental Panel on Climate Change (IPCC) equations to predict enteric methane emission from lactating cows fed Mediterranean diets. JDS Commun. 2023, 4, 181–185. [Google Scholar] [CrossRef] [Scilit]
- Nunes, H.P.B.; Maduro Dias, C.S.A.M.; Vouzela, C.M.; Borba, A.E.S. Seasonal Effect of Grass Nutritional Value on Enteric Methane Emission in Islands Pasture Systems. Animals 2023, 13, 2766. [Google Scholar] [CrossRef] [Scilit]
- IPCC. 2006 IPCC Guidelines for National Greenhouse Gas Inventories. Volume 4: Agriculture, Forestry and Other Land Use; Eggleston, S., Buendia, L., Miwa, K., Ngara, T., Tanabe, K., Eds.; Institute for Global Environmental Strategies: Hayama, Japan, 2006. [Google Scholar]
- IPCC. 2019 Refinement to the 2006 IPCC Guidelines for National Greenhouse Gas Inventories. Volume 4: Agriculture, Forestry and Other Land Use; Calvo Buendia, E., Tanabe, K., Kranjc, A., Baasansuren, J., Fukuda, M., Ngarize, S., Osako, A., Pyrozhenko, Y., Shermanau, P., Federici, S., Eds.; IPCC: Geneva, Switzerland, 2019. [Google Scholar]
- Song, M.; Ren, Y.; Li, Z.; Dong, R. Performance Comparison of the Prediction Models for Enteric Methane Emissions from Dairy Cattle. Vet. Sci. 2025, 12, 1036. [Google Scholar] [CrossRef] [Scilit]
- Eurostat. Livestock Populations and Meat Production. In Statistics Explained; European Commission: Luxembourg, 2026; Available online: https://ec.europa.eu/eurostat/statistics-explained/index.php?title=Livestock_populations_and_meat_production (accessed on 4 November 2026).
- Eurostat. Milk and Milk Product Statistics. In Statistics Explained; European Commission: Luxembourg, 2025; Available online: https://ec.europa.eu/eurostat/statistics-explained/index.php?title=Milk_and_milk_product_statistics (accessed on 25 August 2026).
- INS (National Institute of Statistics, Romania). Livestock Numbers and Animal Production in 2024; National Statistical Bulletin: Bucharest, Romania, 2025. Available online: https://insse.ro (accessed on 25 August 2026).
- European Commission. Farm to Fork Strategy—For a Fair, Healthy and Environmentally-Friendly Food System; European Commission: Brussels, Belgium, 2020; Available online: https://food.ec.europa.eu/system/files/2020-05/f2f_action-plan_2020_strategy-info_en.pdf (accessed on 25 August 2026).
- Díaz de Otálora, X.; del Prado, A.; Dragoni, F.; Balaine, L.; Pardo, G.; Winiwarter, W.; Sandrucci, A.; Ragaglini, G.; Kabelitz, T.; Kieronczyk, M.; et al. Modelling the effect of context-specific greenhouse gas and nitrogen emission mitigation options in key European dairy farming systems. Agron. Sustain. Dev. 2024, 44, 4. [Google Scholar] [CrossRef] [Scilit]
- Díaz de Otálora, X.; Amon, B.; Balaine, L.; Dragoni, F.; Estellés, F.; Ragaglini, G.; Kieronczyk, M.; Jørgensen, G.H.M.; del Prado, A. Influence of farm diversity on nitrogen and greenhouse gas emission sources from key European dairy cattle systems: A step towards emission mitigation and nutrient circularity. Agric. Syst. 2024, 216, 103902. [Google Scholar] [CrossRef] [Scilit]
- Enculescu, M.; Nicolae, I.; Gavojdian, D. Estimates of methane enteric emissions from the Romanian dairy cattle sector between 2015–2024. Sci. Pap. Ser. D Anim. Sci. 2025, 68, 80–85. [Google Scholar]
- Popa, D.; Popa, R.; Vidu, L.; Nicolae, C. Emission of Methane from Enteric Fermentation of Cattle and Buffaloes in Romania between 1989–2014. Agric. Agric. Sci. Procedia 2016, 10, 289–298. [Google Scholar] [CrossRef] [Scilit]
- Marin, M.; Vidu, L.; Diniță, G.; Pogurschi, E.; Popa, D.; Tudorache, M.; Custură, I. Researches Concerning the Use of Feed Ingredients to Reduce Greenhouse Gas Emissions in Dairy Cows Farms. Sci. Pap. Ser. D Anim. Sci. 2020, 63, 257–263. [Google Scholar]
- Popa, D.; Marin, M.; Pogurschi, E.; Vidu, L.; Popa, R.; Bălănescu, M. The Influence of the Addition of Oil Seeds in the Dairy Cow Ration on CO2 Emissions. Sci. Pap. Ser. D Anim. Sci. 2022, 65, 416–421. [Google Scholar]
- AGCTR (General Association of Cattle Breeders in Romania). Official Performance Recording (COP) and Herd Book Database: 2024 Structural Annual Report; AGCTR: Bucharest, Romania, 2025; Available online: https://www.agctr.eu (accessed on 25 August 2026).
- Mincu-Iorga, M.; Enculescu, M.; Nicolae, I.; Gavojdian, D. Status quo of the Romanian bovine sector: Census-based structural and morpho-productive characterization. Acta Agricol. Roman. (Anim. Sci. Vet. Med.), 2026; in press.
- Stoica, I.; Stoica, L. Fundamentals of Animal Nutrition and Feeding; Coral Sanivet Publishing House: Bucharest, Romania, 2001; pp. 26–29, 149, 151–161, 177–183. [Google Scholar]
- National Research Council (NRC). Nutrient Requirements of Dairy Cattle, 7th ed.; National Academies Press: Washington, DC, USA, 2001. [Google Scholar]
- Cambra-López, M.; García-Rebollar, P.; Estellés, F.; Torres, A. Estimación de las emisiones de los rumiantes en España: El factor de conversión de metano. Arch. Zootec. 2008, 57, 89–101. [Google Scholar]
- Forster, P.; Storelvmo, T.; Armour, K.; Collins, W.; Dufresne, J.-L.; Frame, D.; Lunt, D.J.; Mauritsen, T.; Palmer, M.D.; Watanabe, M.; et al. The Earth’s Energy Budget, Climate Feedbacks, and Climate Sensitivity. In Climate Change 2021: The Physical Science Basis. Contribution of Working Group I to the Sixth Assessment Report of the Intergovernmental Panel on Climate Change; Masson-Delmotte, V., Zhai, P., Pirani, A., Eds.; Cambridge University Press: Cambridge, UK, 2021; pp. 923–1054. [Google Scholar] [CrossRef] [Scilit]
- FAO. Greenhouse Gas Emissions from the Dairy Sector: A Life Cycle Assessment; Food and Agriculture Organization of the United Nations: Rome, Italy, 2010. [Google Scholar]
- Yan, T.; Mayne, C.S.; Gordon, F.J. Mitigation of enteric methane emissions through improving efficiency of energy utilization and productivity in lactating dairy cows. J. Dairy Sci. 2010, 93, 2630–2638. [Google Scholar] [CrossRef] [Scilit]
- Fresco, S.; Boichard, D.; Lefebvre, R.; Barbey, S.; Gaborit, M.; Fritz, S.; Martin, P. Correlation of methane production, intensity, and yield with residual feed intake throughout lactation in Holstein cows. Animal 2024, 18, 101110. [Google Scholar] [CrossRef] [Scilit]
- Starsmore, K.; Lopez-Villalobos, N.; Shalloo, L.; Egan, M.; Burke, J.; Lahart, B. Animal factors that affect enteric methane production measured using the GreenFeed monitoring system in grazing dairy cows. J. Dairy Sci. 2024, 107, 2930–2940. [Google Scholar] [CrossRef] [Scilit]
- Díaz de Otálora, X.; Dragoni, F.; del Prado, A.; Estellés, F.; Wilfart, A.; Krol, D.; Balaine, L.; Anestis, V.; Amon, B. Identification of representative dairy cattle and fodder crop production typologies at regional scale in Europe. Agron. Sustain. Dev. 2022, 42, 94. [Google Scholar] [CrossRef] [Scilit]
- Lahart, B.; Buckley, F.; Herron, J.; Fitzgerald, R.; Fitzpatrick, E.; Galvin, N.; Shalloo, L. Evaluating enteric methane emissions within a herd of genetically divergent grazing dairy cows. J. Dairy Sci. 2024, 107, 383–397. [Google Scholar] [CrossRef] [Scilit]
- Starsmore, K.; Lahart, B.; Lopez-Villalobos, N.; Egan, M.; Herron, J.; Burke, J.; Shalloo, L. Residual methane emissions in grazing lactating dairy cows. N. Z. J. Agric. Res. 2024, 67, 285–295. [Google Scholar] [CrossRef] [Scilit]
- McParland, S.; Frizzarin, M.; Lahart, B.; Kennedy, M.; Shalloo, L.; Egan, M.; Starsmore, K.; Berry, D.P. Predicting methane emissions of individual grazing dairy cows from spectral analyses of their milk samples. J. Dairy Sci. 2024, 107, 978–991. [Google Scholar] [CrossRef] [Scilit] [PubMed]
- Hansen, N.P.; Kristensen, T.; Johansen, M.; Wiking, L.; Poulsen, N.A.; Hellwing, A.L.F.; Foldager, L.; Jensen, S.K.; Larsen, L.B.; Weisbjerg, M.R. Effects on feed intake, milk production, and methane emission in dairy cows fed silage or fresh grass with concentrate, or fresh grass harvested at early or late maturity stage without concentrate. J. Dairy Sci. 2022, 105, 8036–8053. [Google Scholar] [CrossRef] [Scilit]
- Mazzetto, A.M.; Falconer, S.; Ledgard, S. Mapping the carbon footprint of milk production from cattle: A systematic review. J. Dairy Sci. 2022, 105, 9713–9725. [Google Scholar] [CrossRef] [Scilit] [PubMed]
- Knapp, J.R.; Laur, G.L.; Vadas, P.A.; Weiss, W.P.; Tricarico, J.M. Invited review: Enteric methane in dairy cattle production: Quantifying the opportunities and impact of reducing emissions. J. Dairy Sci. 2014, 97, 3231–3261. [Google Scholar] [CrossRef] [Scilit] [PubMed]
- Thoma, G.; Popp, J.; Shonnard, D.; Nutter, D.; Matlock, M.; Ulrich, R.; Kellogg, W.; Kim, D.S.; Neiderman, Z.; Kemper, N.; et al. Regional analysis of greenhouse gas emissions from USA dairy farms: A cradle to farm-gate assessment of the American dairy industry circa 2008. Int. Dairy J. 2013, 31, S29–S40. [Google Scholar] [CrossRef] [Scilit]
- Niu, M.; Kebreab, E.; Hristov, A.N.; Oh, J.; Arndt, C.; Bannink, A.; Bayat, A.R.; Brito, A.F.; Boland, T.; Casper, D.; et al. Prediction of enteric methane production, yield, and intensity in dairy cattle using an intercontinental database. Glob. Change Biol. 2018, 24, 3368–3389. [Google Scholar] [CrossRef] [Scilit]
- Gerber, P.; Vellinga, T.; Opio, C.; Steinfeld, H. Productivity gains and greenhouse gas emissions intensity in dairy systems. Livest. Sci. 2011, 139, 100–108. [Google Scholar] [CrossRef] [Scilit]
- Lorenz, H.; Reinsch, T.; Hess, S.; Taube, F. Is low-input dairy farming more climate friendly? A meta-analysis of the carbon footprints of different production systems. J. Clean. Prod. 2019, 211, 161–170. [Google Scholar] [CrossRef] [Scilit]
- O’Brien, D.; Shalloo, L.; Patton, J.; Buckley, F.; Grainger, C.; Wallace, M. Evaluation of the effect of accounting method, IPCC v. LCA, on grass-based and confinement dairy systems’ greenhouse gas emissions. Animal 2012, 6, 1512–1527. [Google Scholar] [CrossRef] [Scilit]

Disclaimer/Publisher’s Note: The statements, opinions and data contained in all publications are solely those of the individual author(s) and contributor(s) and not of MDPI and/or the editor(s). MDPI and/or the editor(s) disclaim responsibility for any injury to people or property resulting from any ideas, methods, instructions or products referred to in the content. |
© 2026 by the authors. Licensee MDPI, Basel, Switzerland. This article is an open access article distributed under the terms and conditions of the Creative Commons Attribution (CC BY) license.