


Abstract
Wild bees are important pollinators in agricultural systems, yet patterns of wild bee abundance and diversity in commercial lavender (Lavandula angustifolia) fields remain poorly characterized. We conducted a preliminary, observational assessment of wild bee abundance and species richness across organically managed lavender fields, including both certified organic and non-certified fields following organic practices, in Provence, France, between 2022 and 2024. Standardized 15-min collections were used to compare wild bee and managed honey bee activity during 66 sampling events, while additional non-standardized collections were used to characterize and qualitatively compare the taxa present in the different field settings. Wild bees represented only 2.8% of bees captured during timed collections and their abundance varied substantially among fields. Because only seven fields were studied and many field characteristics covaried, comparisons involving field size, lavender type, cover crops, tillage, landscape setting, apiary proximity, and management appearance are treated as exploratory patterns rather than independent management effects. At the scale of individual sampling events, wild bee abundance was negatively associated with honey bee abundance and positively associated with temperature, whereas floral abundance along sampling transects was not a strong predictor. Species richness also varied among fields: observed richness ranged from 17 to 88 species among the six sites included in the richness analysis, while Chao1-estimated richness ranged from 30.2 to 132.6 species. These results document substantial variation in both abundance and richness among lavender fields and identify patterns that warrant testing with larger, independently replicated studies.
1. Introduction
Wild bees are essential contributors to pollination in both natural ecosystems and agriculture, often complementing or exceeding the pollination provided by managed honey bees [1,2,3,4]. While much of the work on wild bee pollination in agriculture has been focused on food crops, wild bees also play key roles as pollinators of non-food crops like cotton [5], forage crops like alfalfa and clover [6,7], and seed oils [8,9]. Lavender (Lavandula angustifolia) is a bee-pollinated crop whose essential oils are widely used in pharmacy, perfumery, and the food industry [10,11,12,13,14]. Lavender’s extended flowering period and aromatic floral displays have made it a popular plant recommended in some cases by conservationists to “save the bees.” Indeed, lavender has been shown to support a diverse community of wild bees [15], and bee pollination is critical for lavender seed production [13,16]. Understanding how to support wild bees within lavender production is therefore both an ecological and a practical priority.
Throughout this paper, we use the term wild bees to refer to all naturally occurring bee species other than managed honey bees (Apis mellifera). In France, these include hundreds of species spanning diverse taxonomic groups, most of which are solitary and have nesting and foraging requirements that differ substantially from honey bees. Consequently, wild bees often respond differently than managed honey bees to agricultural management and landscape characteristics [17,18].
Organic agriculture is widely expected to benefit biodiversity, including bees, through greater floral resources, reduced synthetic inputs, and more structurally diverse vegetation [19,20,21]. Yet reported effects on bee abundance and richness vary across regions, crops, and landscapes [17,22,23]. In other words, “organic” is not a single treatment; it is a bundle of practices whose components can differentially help, or inadvertently harm, wild bees.
Within organic agricultural settings, practice-level decisions likely matter as much as the certification label [22,24]. For example, vegetation management (e.g., mid-row cover and margin mowing regimes) affects floral quantity, continuity, and nesting microclimates [25,26,27]. Semi-natural elements such as hedgerows, field margins, and uncultivated patches provide season-long resources and refuge, but their value depends on details of composition and maintenance [28,29]. Furthermore, soil disturbance influences ground-nesting bees directly through nest destruction and indirectly via compaction and temperature/moisture dynamics [30,31]. Even where bee-friendly practices are approved for organic production, the timing and method of applications relative to bloom and bee activity can affect exposure risk [32,33]. Finally, surrounding land use can amplify or dampen in-field management effects by altering background resource availability and bee dispersal [17,22].
Despite the substantial economic and cultural importance of lavender across France, very little research has investigated both the role wild bees play in lavender fields and the role lavender fields can play in supporting wild bee communities. There is a growing body of literature suggesting wild bees might be more important pollinators of lavender than managed honey bees (e.g., [13,34]). Also, several recent studies suggest commercial lavender fields can support diverse wild bee communities [15,16,35]. There remains a gap, however, in practice-oriented guidance for conserving wild bee communities in this important crop.
Here, we present data collected across organically managed lavender fields in southern France over multiple years. Our objective was to provide a preliminary assessment of variation in wild bee abundance and species richness and to identify patterns that could motivate more highly replicated studies. We asked three related questions: (1) How did wild bee abundance vary among fields that differed in management and landscape characteristics? (2) Which measured sampling-event conditions were associated with short-term variation in wild bee abundance within and among fields? (3) How did observed and estimated species richness vary among fields? Because the number of fields was small and many field-level characteristics covaried, we treat comparisons among farming practices and landscape categories as descriptive and hypothesis-generating rather than as estimates of independent causal effects.
2. Materials and Methods
2.1. Study Sites
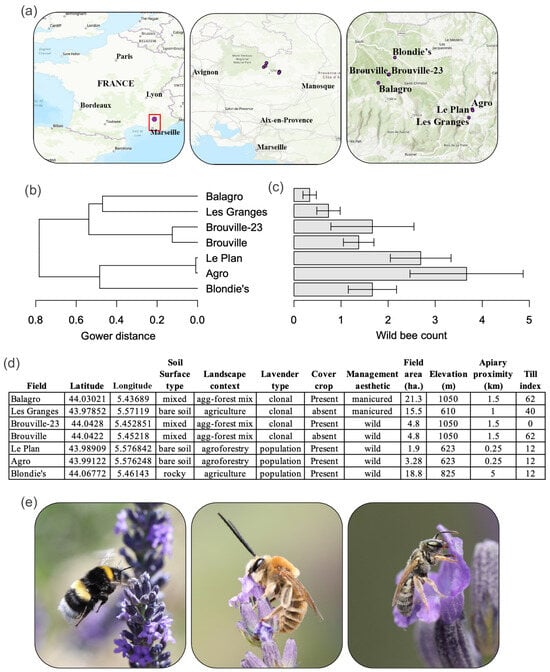
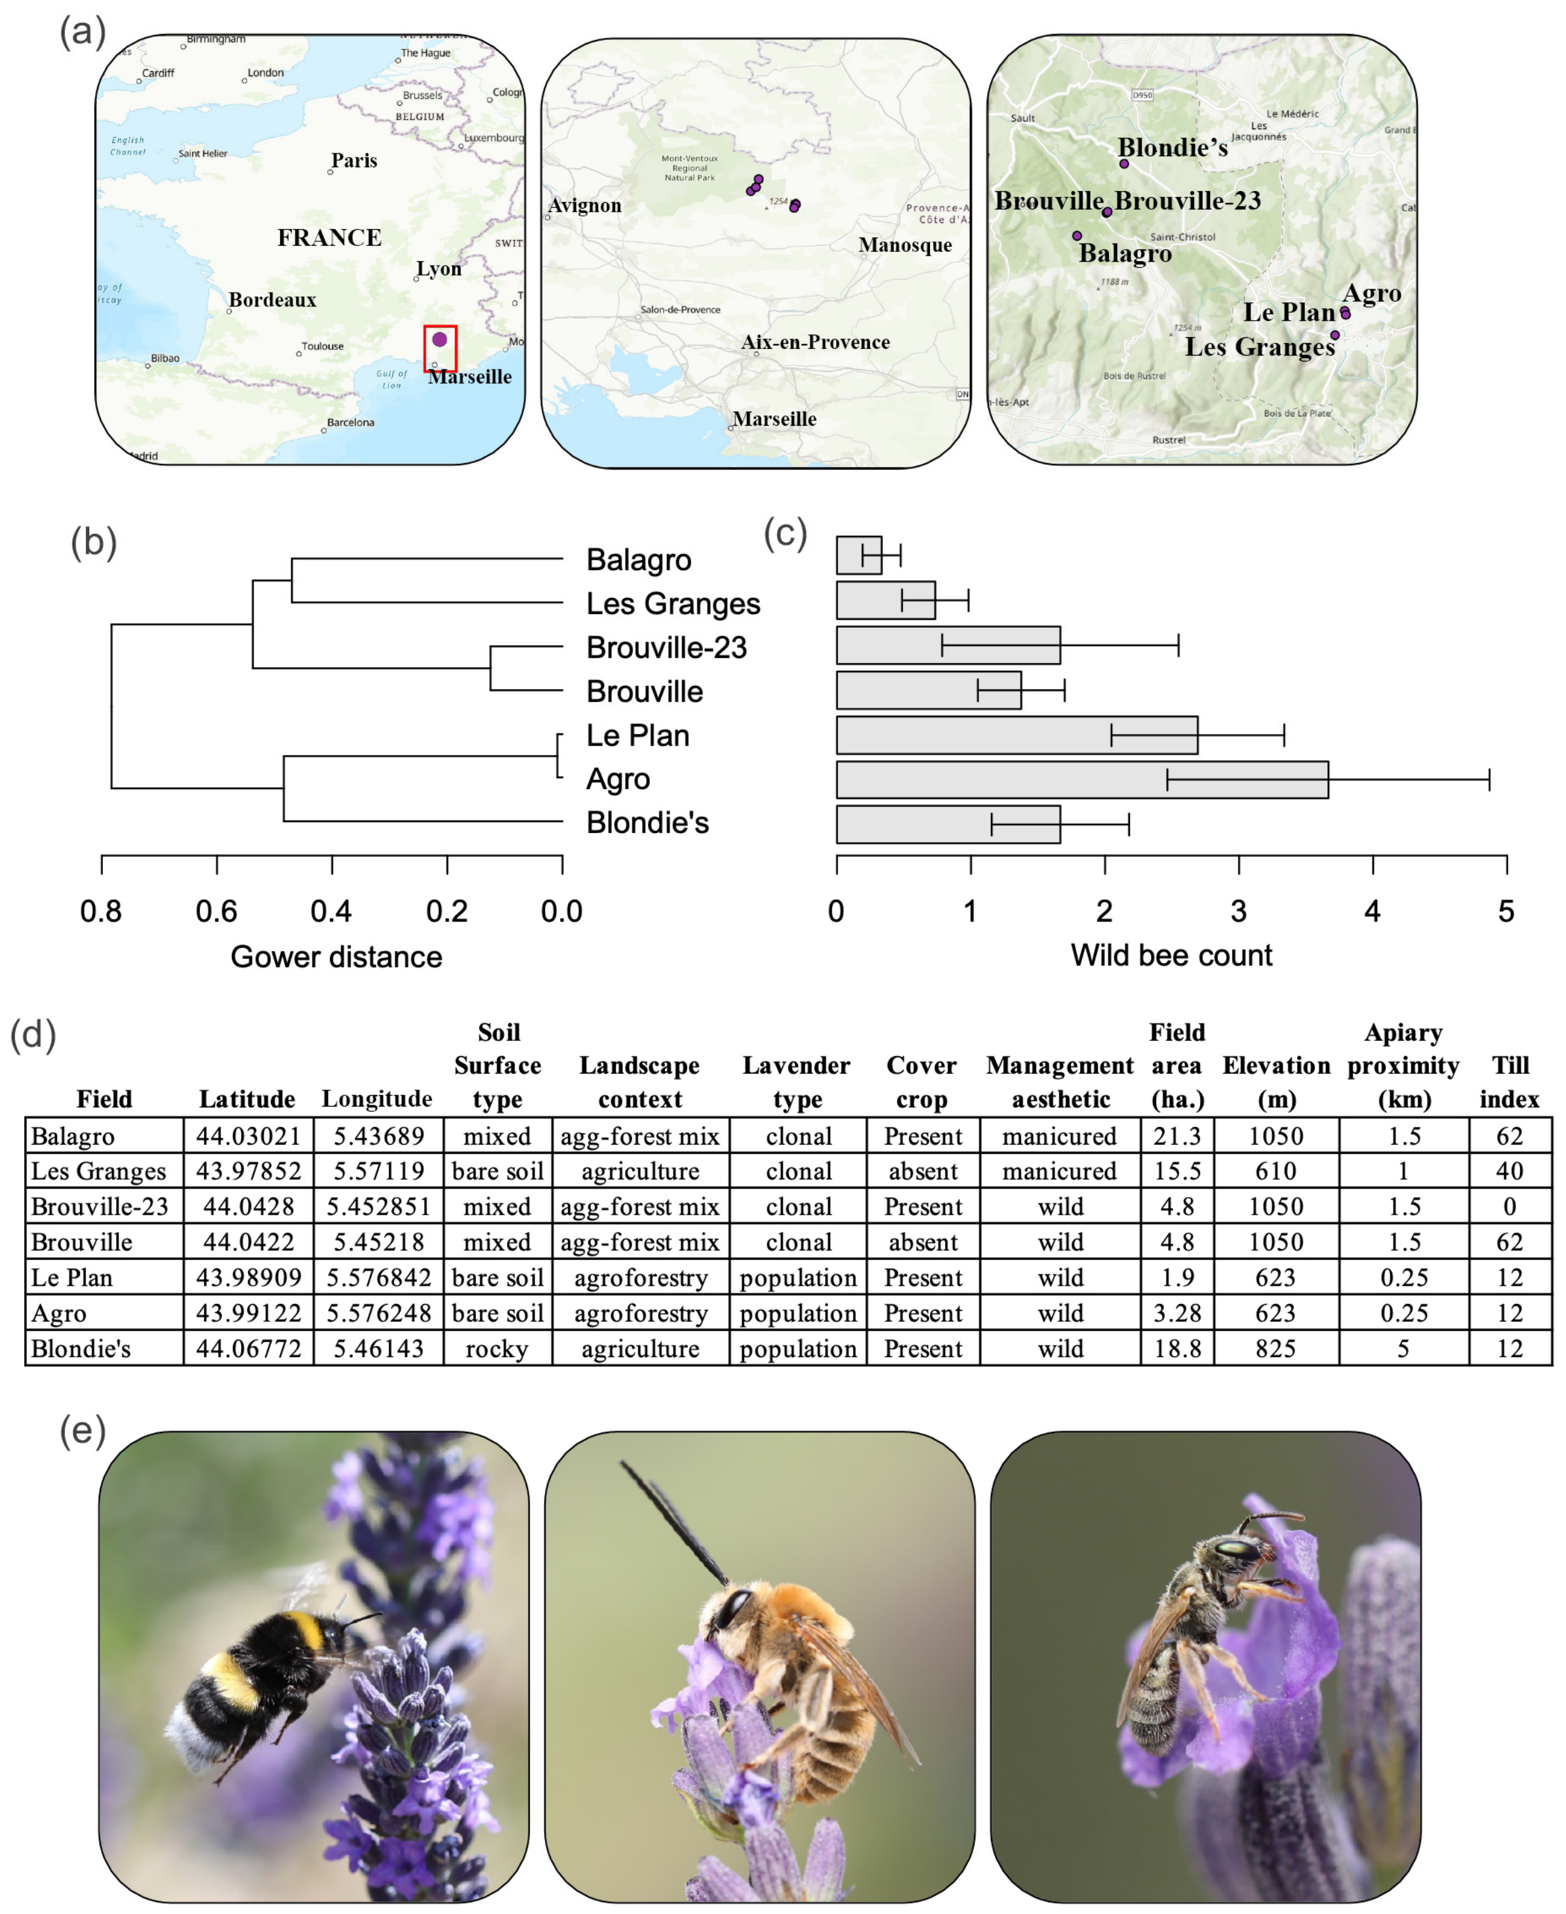
Lavender farms were located in Provence, France, in the Alpes-de-Haute-Provence department (Figure 1a,d). All study fields were managed using organic farming practices, although some were certified organic while others followed organic practices without formal certification.
Figure 1.
Study locations, differences among fields and example bees. (a) Maps showing the location of the study region in southeastern France and the seven sampled lavender fields in the Alpes-de-Haute-Provence department. (b) Dendrogram of site dissimilarity, with sites in the same order (from top to bottom) as in (c), where average rates (with standard errors) of wild bee counts per 15-min collection event are shown. (d) Field-level characteristics, a subset of which were used in the dissimilarity calculations (see main text for details). The abbreviation “agg-” refers to agriculture. (e) Three bees photographed at study sites, as follows: Bombus terrestris group, Eucera chrysopyga, and Seladonia smaragula (photos by J.S.W.).
In total, collections were made at seven different fields (see below for collection methods). Collections were made with the consent of each field’s owner.
2.2. Collection Methods
Bee collections were made during peak lavender bloom in late June through mid-July in 2022–2024 using aerial nets. In each field, timed collections were conducted on lavender to evaluate the relative abundance of managed honey bees and wild bees visiting lavender flowers. Timed collections took place in each field over a two-week period spanning from the initial bloom phase to harvest. Each field was subject to a minimum of three rounds of sampling each year, conducted by trained collectors. During each timed collection, the assigned collector chose a specific row of lavender as a transect and systematically captured every bee encountered during a 15-min period while walking along the row. Managed honey bees (Apis mellifera) were distinguished from other bees using external morphology after capture; honey bees were counted and recorded and were either discarded or frozen for future pollen analyses. All non-Apis bee specimens were counted, pinned, labeled, and retained for taxonomic study. Taxonomic identifications were conducted by J. S. Wilson, Skylar Burrows, Django Maurel, and collaborating taxonomists, including specialists affiliated with the USDA Pollinating Insects Research Unit and the Université Libre de Bruxelles. Identifications were based on published taxonomic keys, comparisons with reference specimens in established insect collections, and the expertise of the participating taxonomists. Specimens were identified to the lowest practical taxonomic level. Specimens that could not be confidently assigned to species were retained at the genus level or assigned to distinct morphospecies when appropriate. For richness analyses, ambiguous genus-level records that could not be distinguished from identified species within the same genus were excluded to avoid artificially inflating richness estimates. Taxonomic names generally follow current nomenclature as reflected in the identification literature and reference collections consulted, recognizing that some genus- and subgenus-level classifications differ among taxonomic authorities. Voucher specimens are housed at Utah State University, Logan, Utah, USA, where they are available for independent taxonomic verification.
In addition to the standardized timed collections, opportunistic collections were made within the lavender fields to document the wild bee taxa present. Although collection effort was not formally standardized or recorded, we attempted to sample fields with roughly comparable effort. Because collection time, collector effort, and number of visits were not explicitly controlled, these collections were not combined with the timed data for analyses of bee abundance. Instead, taxonomic records from these collections were used here to characterize field-level species richness. Richness estimates are interpreted as exploratory estimates rather than as complete inventories of the bee fauna at each field. A complete list of bee taxa recorded during the study, along with the fields in which each taxon was collected, is provided in Table S1. More detailed analyses of bee community composition form part of a broader ongoing analysis of bee communities associated with lavender and will be reported separately.
During opportunistic collections, we attempted to maintain approximately equal collecting time among fields, although collection duration was not formally timed or recorded. Each field was visited no more than once per day, allowing the number of distinct collection dates to represent the number of collecting visits. However, the number of visits differed among fields, and total collecting effort could not be quantified precisely. Consequently, observed richness and Chao1 estimates are presented as exploratory descriptions of the sampled bee communities rather than standardized comparisons of species richness among fields.
To account for varying floral densities across the various lavender fields, and the potential influence of floral abundance on bee populations, we estimated floral density within each field. To estimate floral density, we first measured the area of blooming lavender along each transect. Next, we determined the average number of flower heads within each square meter along that transect. Finally, we randomly selected 10 flower heads and calculated the average number of open flowers per flower head (open flowers meaning the corolla has emerged from the calyx). These measurements allowed us to estimate the total number of flowers present along each transect (open flowers per flower head × flower heads per m2 × total m2 collected).
2.3. Farming Practice Metrics
We interviewed farm managers to document field-specific management and environmental conditions for every sampled field. Responses were recorded and cross-checked with field observations. Variables were grouped into measures describing floral resource structure, nesting habitat conditions, landscape context, and sampling-event conditions.
To characterize floral resource structure, we recorded lavender type (clonal lavender propagated vegetatively in greenhouses versus population lavender derived from open-pollinated seed), cover crop presence (intentional non-crop vegetation planted between rows, often consisting of various Fabaceae, Brassicaceae, and Poaceae plants; present or absent), and field area (ha).
To characterize nesting habitat conditions, we visually classified soil surface properties (rocky, mixed, or bare soil) and calculated a tillage index (frequency of row cultivator use multiplied by cultivation depth, plus the frequency of harrow cultivator use; higher values indicate more intensive disturbance).
To characterize landscape and management context, we recorded landscape setting (agriculture, agriculture–forest mix, or agroforestry, defined here as an intentional land management system that combines trees or shrubs with agricultural crops), apiary proximity (linear distance in km from the field center to the nearest known apiary containing ≥20 managed honey bee colonies, based on apiaries directly observed and located by participating farmers), and field appearance (manicured versus wild, based on growers’ stated management style and field observations). Apiary proximity was used as a descriptive measure of distance to managed apiaries rather than as a direct measure of honey bee foraging pressure within individual fields.
For analyses of variation among individual sampling events, we also included total flowers sampled (estimated as open flowers per flower head × flower heads per m2 × total m2 sampled), honey bee abundance (number of honey bees collected during the 15-min sampling event), and temperature (ambient air temperature measured at the time of collection). Collector identity was included as a fixed effect (with two levels) and field identity was included as a random factor in the mixed-model analyses.
2.4. Statistical Methods
We separated the analyses into two complementary components. First, we summarized spatial variation among fields using field-level characteristics and bee abundance. These analyses were explicitly exploratory because only seven fields were available and many field characteristics were correlated. Second, we examined short-term variation among standardized sampling events using variables that changed among collection events while accounting for repeated observations within fields.
For field-level comparisons, we used the Gower dissimilarity index to summarize differences among fields in variables measured on different scales and visualized those differences with a dendrogram. We also fit a series of single-predictor, Gaussian linear models to describe how daily wild bee counts varied across individual field characteristics. Because repeated observations within a field do not constitute independent replication of field-level variables, values were averaged at the field level for these simple models. Because of the small sample sizes (seven fields), we do not use these models to test management effects or report statistical significance. Instead, adjusted R2 values are presented as descriptive summaries of patterns among fields. The adjusted values are penalized for the number of model parameters relative to sample size and are negative when a model performs worse than an intercept-only model. For simplicity in Figure 2, negative adjusted R2 values are displayed as zero and identified with an asterisk (*).
Figure 2.
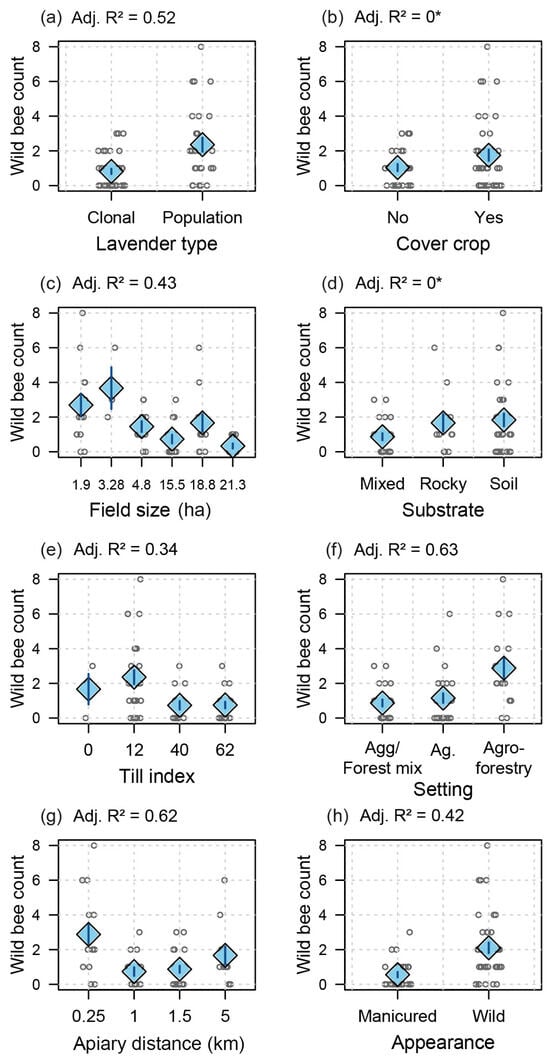
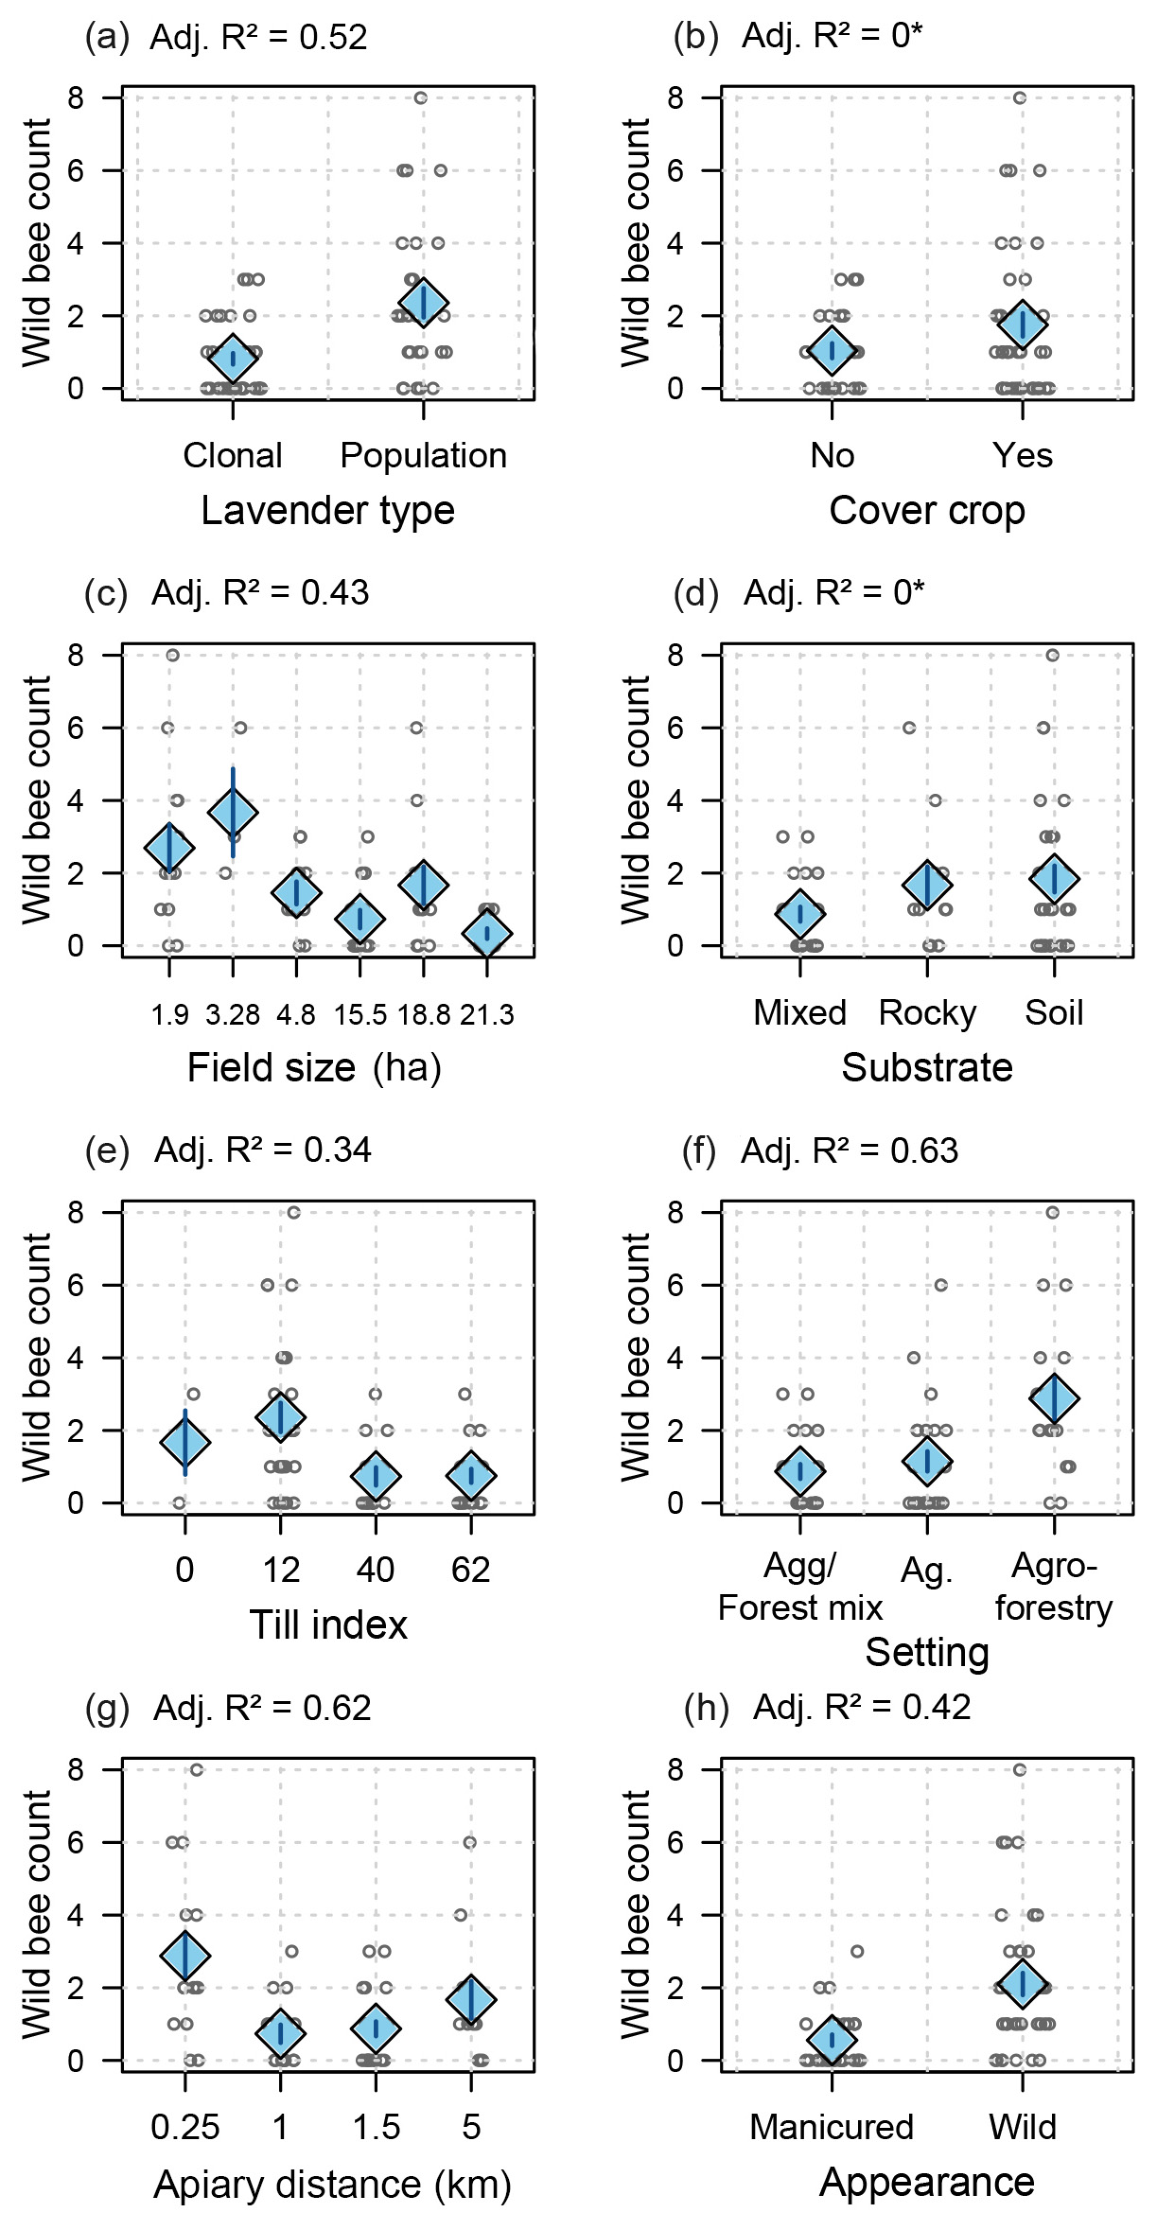
Wild bee abundance as a function of various site-level properties. For panels (a–h), blue diamonds represent mean wild bee counts for each field, with bars indicating standard errors; gray points show individual sampling events jittered horizontally. Values next to panel labels indicate the variance explained (adjusted R2) by single-predictor models fitted to field-level mean wild bee counts (n = 7 fields) as a function of each panel-specific variable. Asterisks (*) indicate models with negative adjusted R2 values, displayed as zero for simplicity of interpretation.
For analyses of short-term variation among standardized sampling events, wild bee counts were modeled using Poisson generalized linear mixed models that included total flowers sampled, ambient temperature at the time of sampling, honey bee abundance, and collector identity as fixed effects, and field identity as a random intercept term to account for repeated observations within fields. A reciprocal model examined variation in honey bee counts using the same predictors while including wild bee counts instead of honey bee counts as a covariate, with the same fixed- and random-effect structure. Continuous predictor variables were z-transformed (centered and scaled to unit standard deviation) for comparison of coefficients on otherwise different scales. Model assumptions were evaluated using variance inflation factors and simulated residual diagnostics in DHARMa version 0.4.7 [36]. Tests for dispersion indicated no evidence of overdispersion for either the wild bee model (dispersion = 1.24, p = 0.42) or the honey bee model (dispersion = 1.32, p = 0.42). The observed number of zeros was also consistent with expectations under the fitted wild bee model (ratio = 1.10, p = 0.77); no zero counts occurred in the honey bee data. All analyses and graphs were generated in R version 4.6.1.
Given the limited number of sampling events and relatively low wild bee counts, the models focused on a small set of biologically motivated predictors selected a priori: floral abundance, ambient temperature, and the abundance of honey bees or wild bees during the same sampling event. Field identity was included as a random intercept to account for repeated sampling within fields. We also evaluated the inclusion of sampling year as an additional random effect. Although this increased uncertainty around the estimation of some effects, the coefficients themselves remained similar. We therefore retained the simpler model structure in the presentation here, while recognizing that temporal variation may contribute to patterns in bee abundance.
Bee species richness was compared among sites using observed richness, Chao1-estimated richness, and individual-based rarefaction and extrapolation, calculated using iNEXT version 3.0.2 [37]. This approach allowed us to simultaneously compare simple observed species richness, variation in sampling effort, and estimated species richness which takes into account the structure of the samples (for example, in terms of the numbers of singletons and doubletons) while asking how many species might be observed if sampling effort continued. Expected richness was plotted for each site as a function of the number of individuals sampled, with 95% confidence intervals based on 1000 bootstrap replicates.
Richness analyses were restricted to six lavender fields that were each visited on at least three separate collecting dates. Locations with only a single collecting visit, as well as incidental roadside collections and collections from other locations outside the regularly sampled fields, were excluded. This restriction was intended to avoid including incidental records from locations without repeated sampling, although collecting effort still varied among the six included fields (Supplementary Table S2). Brouville records were combined across years for the richness analysis. Sampling effort varied among fields, as reflected by differences in the number of collecting visits and specimens obtained. The number of visits by year, specimen counts from standardized and opportunistic collections, observed taxa, and numbers of singleton and doubleton taxa are summarized for each field in Supplementary Table S2. Because the taxonomic collections included non-standardized opportunistic sampling and collecting effort varied among fields, Chao1 estimates are presented as exploratory estimates of potentially unobserved richness within each sampled field. They should not be interpreted as standardized comparisons of species richness among fields or as complete estimates of local bee diversity.
3. Results
3.1. Variation in Wild Bee Abundance Among Lavender Fields
Wild bee abundance varied substantially among the seven sampled lavender fields that differed in a range of site-level characteristics (Figure 1b–d). Across all sampling events we recorded 97 wild bees during 66 timed collections conducted between 2022 and 2024. Wild bee counts during 15-min collections ranged from 0 to 8 individuals, with a mean of 1.47 bees per collection (Figure 1c). In contrast, honey bees were highly abundant across all sampled fields, with 3320 honey bees collected during the same sampling events. Honey bee counts ranged from 16 to 97 individuals per 15-min collection (mean = 50.3 honey bees per collection). Wild bees therefore represented only 2.8% of all bees captured during timed collections.
Mean wild bee counts per collection differed among fields. The highest wild bee abundances were recorded at Agro (mean = 3.67 bees per collection) and Le Plan (mean = 2.69), whereas fields such as Balagro (mean = 0.33) and Les Granges (mean = 0.73) consistently yielded fewer wild bees (Figure 1c). Patterns in wild bee abundance broadly aligned with similarities among fields in their farming practices and surrounding landscape context (Figure 1b,c). Fields that were most similar in overall site characteristics also tended to have similar wild bee abundances (e.g., Le Plan and Agro with high wild bee counts, and Balagro and Les Granges with low counts).
3.2. Descriptive Field-Level Patterns in Wild Bee Abundance
Wild bee abundance differed among fields that also differed in multiple site-level characteristics (Figure 2). Because only seven fields were available and many of these characteristics covaried, the following comparisons are presented as descriptive patterns within the sampled fields rather than as independent effects of particular farming practices.
3.3. Floral Resource Structure
Mean wild bee abundance differed among fields with different lavender types and field sizes (Figure 2). In this set of fields, those planted with population-derived lavender had higher mean wild bee counts than fields planted with clonal lavender (Figure 2a). However, lavender type corresponded closely with other field characteristics, so this contrast cannot be attributed specifically to lavender type. Among the seven sampled fields, larger fields generally had lower mean wild bee counts (Figure 2c), although field size covaried with other site characteristics and its independent contribution could not be determined. Field sizes were unevenly distributed, with a substantial gap between the smaller fields (≤6 ha) and larger fields (≥15 ha), further limiting interpretation of this apparent relationship. In contrast, the single-predictor model for cover-crop was not successful. These patterns identify variables of interest for future studies but do not separate their independent contributions.
3.4. Nesting Habitat Conditions
The single-predictor model for substrate type did not explain any of the observed variation in wild bee counts (Figure 2d). In contrast, mean counts showed some variation among tillage indices, with the highest mean counts occurring at an intermediate tillage index (Figure 2e). However, tillage was not independently replicated across fields and covaried with other site characteristics; therefore, this pattern should not be interpreted as evidence for an optimal disturbance level.
3.5. Landscape and Management Context
Wild bee counts differed among fields classified by landscape setting, apiary proximity, and management appearance (Figure 2f–h). Sampled fields classified as agroforestry had higher mean wild bee counts than most fields classified as agriculture or agriculture–forest mix, and fields characterized as less manicured also had higher mean counts. The single-predictor model for apiary proximity had a relatively high adjusted R2 among the field-level comparisons (Figure 2g). However, the observed pattern was not consistently directional, with the lowest mean wild bee counts occurring at intermediate distances from managed apiaries. Given the small number of fields and limited range of distinct distance values, this pattern should not be interpreted as evidence of a general relationship between apiary distance and wild bee abundance. Because these characteristics were represented by few fields and covaried with field size, lavender type, tillage, and other attributes, these contrasts are descriptive and cannot identify which landscape or management feature produced the observed differences.
3.6. Within-Collection Predictors of Bee Abundance
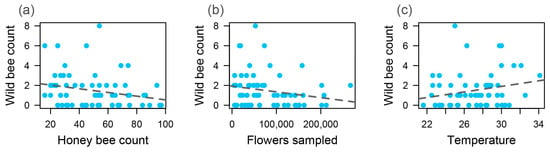
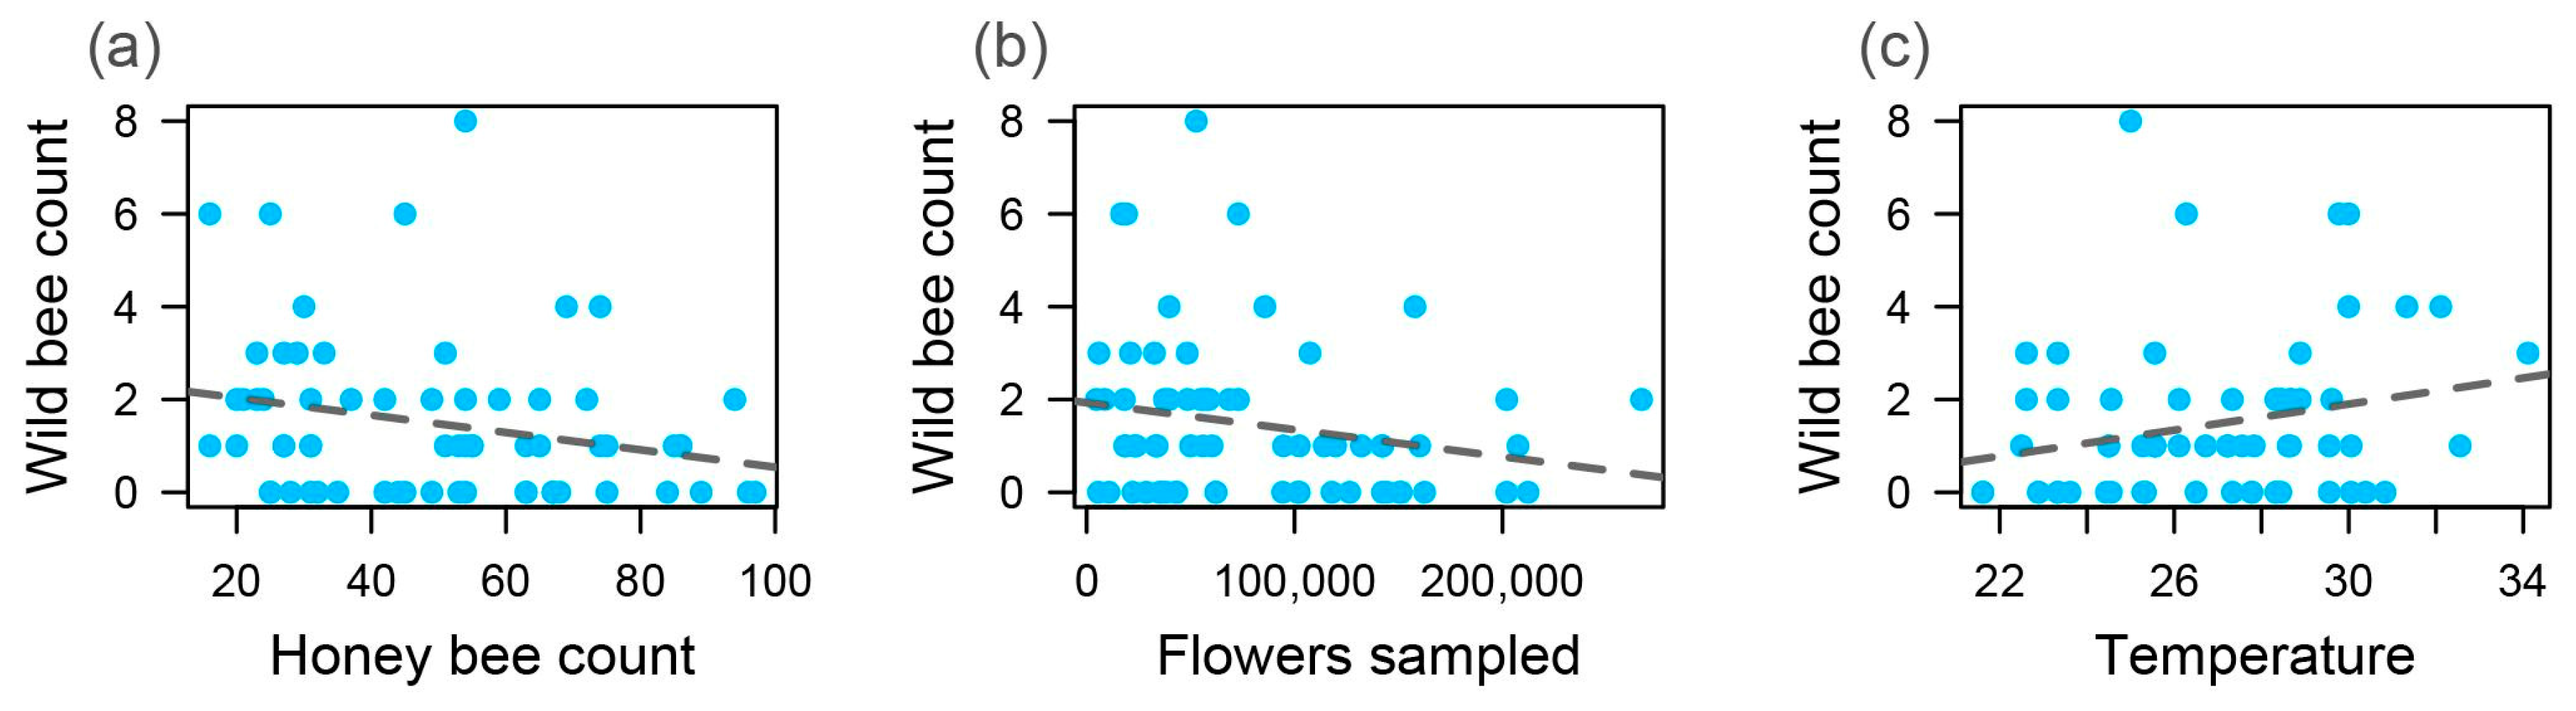
Given the strong numerical dominance of honey bees during standardized sampling, we examined whether event-level variation in honey bee abundance, temperature, and floral abundance was associated with variation in wild bee counts while accounting for repeated sampling within fields. Wild bee counts were negatively associated with honey bee abundance across sampling events (β = −0.42 ± 0.17 SE, z = −2.48, p = 0.013; Figure 3a) and positively associated with temperature (β = 0.30 ± 0.12 SE, z = 2.53, p = 0.011; Figure 3c). Estimated floral abundance along sampling transects showed no detectable association with wild bee counts (β = −0.0072 ± 0.15 SE, z = −0.047, p = 0.96; Figure 3b). Fixed effects explained approximately 25% of the variation in wild bee abundance (marginal R2 = 0.25), increasing to nearly 50% when the random effect of field was included (conditional R2 = 0.47). These event-level associations do not by themselves establish competition or other causal mechanisms.
Figure 3.
Daily wild bee counts plotted against daily honey bee counts (a), the number of flowers sampled (b), and temperature on the day of collection (c). Lines from simple Gaussian linear models are shown only as visual summaries of the raw data; statistical inference is based on the Poisson generalized linear mixed models described in the text.
We also fit a reciprocal model predicting honey bee abundance during sampling events. In this model, wild bee counts showed a weaker proportional association with honey bee abundance (β = −0.066 ± 0.022 SE, z = −2.95, p = 0.0032) than the reverse relationship observed above. Because both models (for wild bees and honey bees) use a log link and z-transformed predictors, each exponentiated coefficient represents the proportional change in expected counts of the response taxon per standard deviation increase in the abundance of the other taxon: wild bee counts decreased by approximately 34% per SD of honey bees (exp(−0.42) = 0.66), whereas honey bee counts decreased by approximately 6% per SD of wild bees (exp(−0.066) = 0.94). We present this comparison descriptively; it does not by itself establish the direction of any interaction between the two groups. Floral abundance and temperature contributed modestly to variation in honey bee counts, both with positive effects; floral abundance affecting honey bees: β = 0.16 ± 0.02 SE, z = 7.61, p < 0.001, and temperature affecting honey bees: β = 0.095 ± 0.019 SE, z = 4.97, p < 0.001. The model explained 39% of the variation through fixed effects (marginal R2 = 0.39) and 87% considering random effects (conditional R2 = 0.87).
3.7. Variation in Wild Bee Species Richness Among Fields
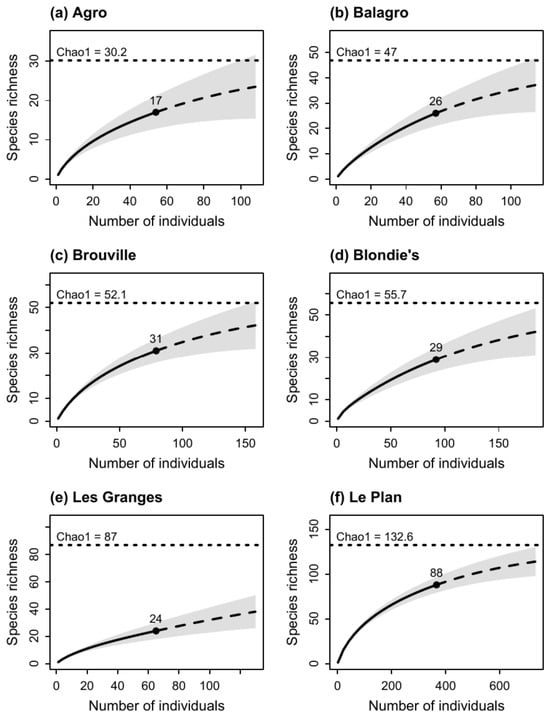
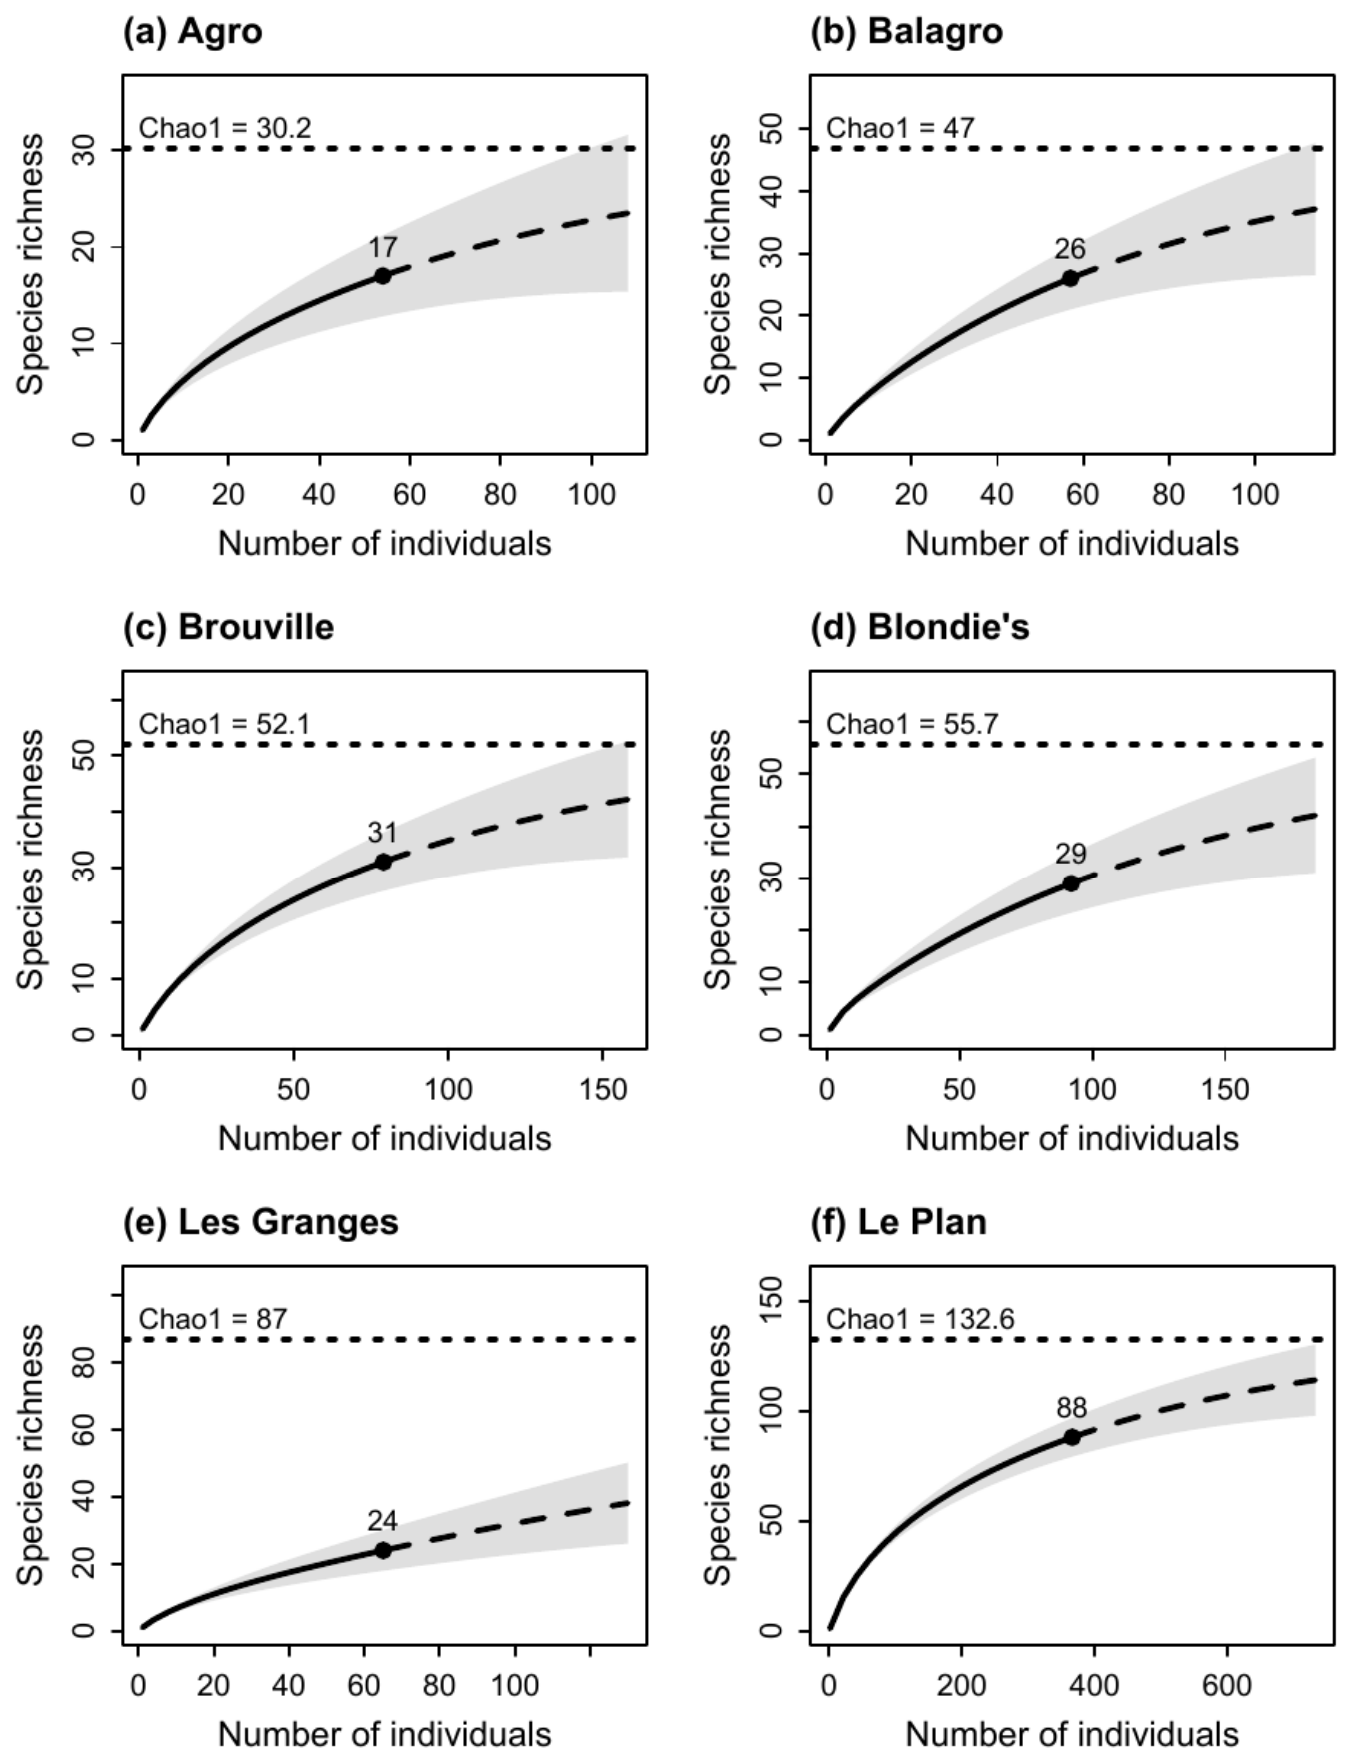
Across the six fields included in the richness analysis, taxonomic collections documented 122 bee taxa, comprising 121 wild bee taxa and the managed honey bee, Apis mellifera (Table S1). Sampling effort, measured as the number of wild bee individuals represented in the taxonomic collections, varied among sites, as did observed and extrapolated species richness (Figure 4). Observed richness ranged from 17 species at Agro to 88 species at Le Plan. Chao1-estimated richness ranged from 30.2 species at Agro to 132.6 species at Le Plan. Four intermediate sites had broadly similar observed richness (24–31 species) but substantially different estimated richness: Balagro, 26 observed and 47 estimated; Brouville, 31 observed and 52.1 estimated; Blondie’s, 29 observed and 55.7 estimated; and Les Granges, 24 observed and 87.0 estimated. The comparatively high Chao1 value at Les Granges despite modest observed richness reflects the composition of the sample, including relatively more infrequently collected species.
Figure 4.
Individual-based rarefaction and extrapolation of wild bee species richness for six lavender fields. Black points show observed richness at the observed number of individuals, dashed curves show extrapolated richness, gray bands indicate 95% confidence intervals from 1000 bootstrap replicates, and horizontal dotted lines indicate Chao1 estimated richness. Panels are ordered from lowest to highest Chao1 estimate; note that y-axis limits differ among panels. Because taxonomic collections included non-standardized opportunistic sampling, Chao1 values are interpreted as exploratory estimates of potentially unobserved species richness within each field, rather than standardized comparisons of richness among fields or complete inventories of the bee fauna.
Because these data include non-standardized opportunistic collections and collecting effort varied among fields, differences in observed and extrapolated richness may reflect sampling effort as well as differences in bee communities. Chao1 estimates are therefore presented as exploratory estimates of potentially unobserved richness within each field rather than standardized comparisons of species richness among fields.
4. Discussion
This study provides a preliminary description of wild bee abundance and richness across a small set of commercial lavender fields in Provence. Wild bee abundance during standardized collections varied substantially among fields, and the taxonomic collections likewise revealed large differences in observed and estimated richness. At the same time, the limited number of independent fields and the strong covariance among their management and landscape characteristics constrain what can be inferred about any individual farming practice. We therefore view the field-level patterns primarily as hypothesis-generating observations that identify potentially informative variables for future, more highly replicated studies.
Several field-level patterns were nevertheless notable. Fields with relatively high timed wild bee counts often occurred in smaller or more structurally heterogeneous settings, including the fields classified as agroforestry, while lower counts occurred in several larger or more simplified fields. These observations are consistent with broader literature showing that landscape context and habitat heterogeneity can influence wild bees [17,38], but the present data cannot distinguish effects of landscape setting from correlated differences in field size, lavender type, vegetation management, tillage, or other site attributes. Thus, rather than demonstrating that agroforestry or smaller fields increase wild bee abundance, our results identify those contrasts as useful targets for future replicated study. An additional limitation is that we did not quantify the abundance or diversity of co-flowering plants in the surrounding landscape. Such resources could provide alternative or complementary forage for wild bees and honey bees, potentially influencing their activity within lavender fields. Future studies should quantify floral resources beyond the lavender crop, including surrounding vegetation at spatial scales relevant to bee foraging.
Other field-level characteristics showed more variable relationships with wild bee abundance. Population-derived lavender and less-manicured field appearance were associated with higher mean wild bee counts, although these characteristics covaried with other differences among fields and therefore cannot be interpreted as independent effects. In contrast, cover-crop presence and substrate were not successful in explaining variation in mean wild bee abundance. Tillage showed a comparatively weaker pattern, with the highest mean abundance occurring at an intermediate tillage index. Although tillage intensity is biologically relevant to wild bees because soil disturbance can disrupt nests and nesting habitat for ground-nesting species [30,31], the pattern observed here is best viewed as exploratory rather than evidence for a specific disturbance mechanism. Future studies designed to contrast individual practices across independently replicated fields would be required to test these possibilities.
Apiary proximity showed a relatively strong association with mean wild bee abundance in the exploratory field-level comparisons. However, the lowest mean counts occurred at intermediate distances from managed apiaries, and the small number of fields and limited range of distance values prevent us from drawing conclusions about the shape or generality of this relationship. Although distance to the nearest known apiary provides some context for managed honey bee presence, actual honey bee activity within a field is also influenced by colony numbers, the presence of additional apiaries, and the spatial distribution of floral resources, none of which were comprehensively quantified in this study. In contrast, at the scale of individual standardized sampling events, wild bee abundance was negatively associated with honey bee abundance after accounting for field and collector effects. This event-level association is among the more robust patterns in the present dataset because honey bee abundance varied among sampling events rather than being a fixed field-level characteristic. Even so, the relationship should not be interpreted as direct evidence of competition. While we accounted for temperature and collector identity as fixed effects and field identity as a random effect, this association could also reflect unmeasured environmental conditions, spatial variation within fields, or other factors. Although competition between managed honey bees and wild bees has been documented or inferred in previous studies [18,39], resource competition, behavioral avoidance, contrasting responses to unmeasured environmental conditions, or other processes could all produce the negative association observed here. The result therefore supports further experimental or observational work specifically designed to distinguish among these mechanisms.
Temperature was positively associated with wild bee abundance during timed collections, consistent with temperature-dependent foraging activity documented in many bee taxa [40,41]. In contrast, the estimated number of open lavender flowers along sampling transects was not strongly associated with wild bee counts. These event-level results suggest that short-term bee activity can vary independently of local flower abundance during peak lavender bloom, although the present study was not designed to determine the mechanisms responsible for that variation.
Species richness provided a complementary perspective to the abundance results. Fields with similar observed richness sometimes differed substantially in estimated richness, suggesting differences in the number of infrequently collected species represented in the samples. More broadly, patterns of species richness did not necessarily parallel patterns of wild bee abundance during standardized timed collections. This suggests that the number of wild bees actively visiting lavender during a short sampling period and the diversity of species occurring within lavender fields may represent different aspects of how wild bee communities use these agricultural systems. Because the richness dataset included opportunistic collecting and unequal sampling effort, these comparisons should be interpreted cautiously, but they identify an additional dimension of variation among lavender fields that warrants more systematic investigation.
Several limitations are central to the interpretation of this study. Only seven fields were available for the abundance comparisons, and many management variables were strongly correlated, preventing reliable estimation of independent field-level effects. The qualitative landscape classifications used here are also coarse relative to GIS-based measures of habitat composition and configuration. Wild bee abundance during timed collections was low, limiting taxon-specific analyses of the standardized samples. Although species-level identifications were used for the richness analysis, detailed community composition is beyond the scope of the present study and will be addressed in a separate analysis focused on bee diversity in lavender systems. Finally, the opportunistic collections used to characterize species richness were not standardized in effort, so richness estimates are best viewed as exploratory estimates of potentially unobserved diversity rather than complete inventories. Future studies should include more independent fields, quantify surrounding landscape composition and wild bee nesting resources at biologically relevant scales, standardize taxonomic sampling, and where possible manipulate or replicate individual management practices. Within those limitations, the present study provides a useful preliminary assessment of patterns in wild bee abundance and richness across lavender farms and identifies specific hypotheses that can be tested more rigorously in future work.
5. Conclusions
This study documents substantial variation in wild bee abundance and species richness among commercial lavender fields in Provence, France. Although managed honey bees numerically dominated standardized collections, wild bee abundance varied markedly among fields and was negatively associated with honey bee abundance and positively associated with temperature at the scale of individual sampling events. Wild bee species richness also differed considerably among fields, and patterns of richness did not necessarily parallel patterns of abundance. Field-level differences were associated with several management and landscape characteristics, but the small number of fields and covariance among these characteristics prevent attribution of the observed patterns to individual practices. Together, these findings document the presence of a diverse assemblage of wild bees within the sampled lavender fields, while highlighting substantial variation among fields and the need for caution when extrapolating these patterns to commercial lavender production more broadly. More highly replicated studies that independently evaluate management practices, landscape context, and interactions with managed honey bees will be important for identifying approaches that support wild bee conservation in lavender-growing systems.
Supplementary Materials
The following supporting information can be downloaded at https://www.mdpi.com/article/doi/s1.Table S1: Bee taxa collected across six lavender fields in Provence, France, from 2022–2024. Table S2: Summary of sampling effort and taxonomic collections across the six lavender fields included in the species richness analysis, including collection visits by year, specimen counts, observed taxa, and numbers of singleton and doubleton taxa.
Author Contributions
Conceptualization, J.S.W., L.T.W., N.L. and M.S.; methodology, J.S.W., L.T.W. and M.L.F.; formal analysis, J.S.W. and M.L.F.; investigation, J.S.W., L.T.W., N.L., M.S., T.M.W. and J.Y.; resources, N.L., M.S., T.M.W. and J.Y.; writing—original draft preparation, J.S.W., M.L.F. and T.M.W.; writing—review and editing, J.S.W., N.L., M.S., T.M.W., J.Y., L.T.W. and M.L.F.; visualization, J.S.W. and M.L.F.; funding acquisition, J.S.W., L.T.W., T.M.W. and J.Y. All authors have read and agreed to the published version of the manuscript.
Funding
This research was funded by Young Living Essential Oils.
Institutional Review Board Statement
Not applicable.
Data Availability Statement
The data presented in this study are available upon request from the corresponding author. The data are not publicly available due to ongoing research using the dataset.
Acknowledgments
We would like to thank the owners and managers of the participating lavender farms for supporting this research, providing access to their fields, and sharing information about their farming practices. We also thank Ari Wilson, Isaac Wilson, and Viviann Wilson for their help with bee collections and other field work, and Skylar Burrows for assistance with bee identification.
Conflicts of Interest
Tyler M. Wilson, Jacob Young, Nicolas Landel, and Maxence Sarie are employees of Young Living Essential Oils, which funded this research. The remaining authors declare no competing interests. Young Living employees contributed to the study as described in the Author Contributions section. Beyond the involvement of these coauthors, Young Living Essential Oils had no additional role in the study design, data collection, analysis, interpretation of results, manuscript preparation, or decision to submit the article for publication.
References
- Winfree, R.; Williams, N.M.; Dushoff, J.; Kremen, C. Native bees provide insurance against ongoing honey bee losses. Ecol. Lett. 2007, 10, 1105–1113. [Google Scholar] [CrossRef] [Scilit] [PubMed]
- Garibaldi, L.A.; Steffan-Dewenter, I.; Winfree, R.; Aizen, M.A.; Bommarco, R.; Cunningham, S.A.; Kremen, C.; Carvalheiro, L.G.; Harder, L.D.; Afik, O.; et al. Wild pollinators enhance fruit set of crops regardless of honey bee abundance. Science 2013, 339, 1608–1611. [Google Scholar] [CrossRef] [Scilit] [PubMed]
- Kleijn, D.; Winfree, R.; Bartomeus, I.; Carvalheiro, L.G.; Henry, M.; Isaacs, R.; Klein, A.M.; Kremen, C.; M’Gonigle, L.K.; Rader, R.; et al. Delivery of crop pollination services is an insufficient argument for wild pollinator conservation. Nat. Commun. 2015, 6, 7414. [Google Scholar] [CrossRef] [Scilit] [PubMed]
- Page, M.L.; Nicholson, C.C.; Brennan, R.M.; Britzman, A.T.; Greer, J.; Hemberger, J.; Kahl, H.; Müller, U.; Peng, Y.; Rosenberger, N.M.; et al. A meta-analysis of single visit pollination effectiveness comparing honeybees and other floral visitors. Am. J. Bot. 2021, 108, 2196–2207. [Google Scholar] [CrossRef] [Scilit] [PubMed]
- Pires, V.C.; Silveira, F.A.; Sujii, E.R.; Torezani, K.R.; Rodrigues, W.A.; Albuquerque, F.A.; Rodrigues, S.M.; Salomão, A.N.; Pires, C.S.S. Importance of bee pollination for cotton production in conventional and organic farms in Brazil. J. Pollinat. Ecol. 2014, 13, 151–160. [Google Scholar] [CrossRef] [Scilit]
- Rao, S.; Stephen, W.P. Bumble bee pollinators in red clover seed production. Crop Sci. 2009, 49, 2207–2214. [Google Scholar] [CrossRef] [Scilit]
- Haedo, J.P.; Martínez, L.C.; Graffigna, S.; Marrero, H.J.; Torretta, J.P. Managed and wild bees contribute to alfalfa (Medicago sativa) pollination. Agric. Ecosyst. Environ. 2022, 324, 107711. [Google Scholar] [CrossRef] [Scilit]
- Halinski, R.; dos Santos, C.F.; Kaehler, T.G.; Blochtein, B. Influence of wild bee diversity on canola crop yields. Sociobiology 2018, 65, 751–759. [Google Scholar] [CrossRef] [Scilit]
- Negussie, A.; Achten, W.M.J.; Verboven, H.A.F.; Aerts, R.; Sloan, S.; Hermy, M.; Muys, B. Conserving open natural pollination safeguards Jatropha oil yield and oil quality. BioEnergy Res. 2015, 8, 340–349. [Google Scholar] [CrossRef] [Scilit]
- Bailey, L.H. Manual of Cultivated Plants; Macmillan: New York, NY, USA, 1949. [Google Scholar]
- Lis-Balchin, M. Lavender: The Genus Lavandula; CRC Press: Boca Raton, FL, USA, 2002. [Google Scholar]
- Stanev, S.; Zagorcheva, T.; Atanassov, I. Lavender cultivation in Bulgaria—21st century developments, breeding challenges and opportunities. Bulg. J. Agric. Sci. 2016, 22, 584–590. [Google Scholar]
- Valchev, H.; Kolev, Z.; Stoykova, B.; Kozuharova, E. Pollinators of Lavandula angustifolia Mill., an important factor for optimal production of lavender essential oil. BioRisk 2022, 17, 297–307. [Google Scholar] [CrossRef] [Scilit]
- Khan, S.U.; Hamza, B.; Mir, R.H.; Fatima, K.; Malik, F. Lavender plant: Farming and Health benefits. Curr. Mol. Med. 2024, 24, 702–711. [Google Scholar] [CrossRef] [Scilit] [PubMed]
- Wilson, J.S.; Young, J.G.; Wilson, L.T. The bee communities of Young Living Lavender Farm, Mona, Utah, USA. Diversity 2024, 16, 119. [Google Scholar] [CrossRef] [Scilit]
- Ingram, S.S.; Wilson, T.M.; Wilson, J.S.; Ziebarth, E.A.; Johnson, M.C.; Young, J.G.; Carlson, R.E. Pollination and seed production of Lavandula angustifolia Mill. (Lamiaceae). Seeds 2024, 3, 276–285. [Google Scholar] [CrossRef] [Scilit]
- Kennedy, C.M.; Lonsdorf, E.; Neel, M.C.; Williams, N.M.; Ricketts, T.H.; Winfree, R.; Bommarco, R.; Brittain, C.; Burley, A.L.; Cariveau, D.; et al. A global quantitative synthesis of local and landscape effects on wild bee pollinators in agroecosystems. Ecol. Lett. 2013, 16, 584–599. [Google Scholar] [CrossRef] [Scilit] [PubMed]
- Mallinger, R.E.; Gaines-Day, H.R.; Gratton, C. Do managed bees have negative effects on wild bees? A systematic review of the literature. PLoS ONE 2017, 12, e0189268. [Google Scholar] [CrossRef] [Scilit] [PubMed]
- Bengtsson, J.; Ahnström, J.; Weibull, A.C. The effects of organic agriculture on biodiversity and abundance: A meta-analysis. J. Appl. Ecol. 2005, 42, 261–269. [Google Scholar] [CrossRef] [Scilit]
- Tuck, S.L.; Winqvist, C.; Mota, F.; Ahnström, J.; Turnbull, L.A.; Bengtsson, J. Land-use intensity and the effects of organic farming on biodiversity: A hierarchical meta-analysis. J. Appl. Ecol. 2014, 51, 746–755. [Google Scholar] [CrossRef] [Scilit] [PubMed]
- Hole, D.G.; Perkins, A.J.; Wilson, J.D.; Alexander, I.H.; Grice, P.V.; Evans, A.D. Does organic farming benefit biodiversity? Biol. Conserv. 2005, 122, 113–130. [Google Scholar] [CrossRef] [Scilit]
- Rundlöf, M.; Nilsson, H.; Smith, H.G. Interacting effects of farming practice and landscape context on bumble bees. Biol. Conserv. 2008, 141, 417–426. [Google Scholar] [CrossRef] [Scilit]
- Brittain, C.; Bommarco, R.; Vighi, M.; Settele, J.; Potts, S.G. Organic farming in isolated landscapes does not benefit flower-visiting insects and pollination. Biol. Conserv. 2010, 143, 1860–1867. [Google Scholar] [CrossRef] [Scilit]
- Scheper, J.; Holzschuh, A.; Kuussaari, M.; Potts, S.G.; Rundlöf, M.; Smith, H.G.; Kleijn, D. Environmental factors driving the effectiveness of European agri-environmental measures in mitigating pollinator loss—A meta-analysis. Ecol. Lett. 2013, 16, 912–920. [Google Scholar] [CrossRef] [Scilit] [PubMed]
- Buri, P.; Arlettaz, R.; Humbert, J.-Y. Delaying mowing and leaving uncut refuges boosts orthopterans in extensively managed meadows: Evidence drawn from field-scale experimentation. Agric. Ecosyst. Environ. 2013, 181, 22–30. [Google Scholar] [CrossRef] [Scilit]
- Kratschmer, S.; Pachinger, B.; Schwantzer, M.; Paredes, D.; Guernion, M.; Burel, F.; Nicolai, A.; Strauss, P.; Bauer, T.; Kriechbaum, M.; et al. Tillage intensity or landscape features: What matters most for wild bee diversity in vineyards? Agric. Ecosyst. Environ. 2018, 266, 142–152. [Google Scholar] [CrossRef] [Scilit]
- Martínez-Núñez, C.; Manzaneda, A.J.; Isla, J.; Tarifa, R.; Calvo, G.; Molina, J.L.; Salido, T.; Ruiz, C.; Gutiérrez, J.E.; Rey, P.J. Low-intensity management benefits solitary bees in olive groves. J. Appl. Ecol. 2020, 57, 111–120. [Google Scholar] [CrossRef] [Scilit]
- Morandin, L.A.; Kremen, C. Hedgerow restoration promotes pollinator populations and exports native bees to adjacent fields. Ecol. Appl. 2013, 23, 829–839. [Google Scholar] [CrossRef] [Scilit] [PubMed]
- Garratt, M.P.D.; Senapathi, D.; Coston, D.J.; Mortimer, S.R.; Potts, S.G. The benefits of hedgerows for pollinators and natural enemies depends on hedge quality and landscape context. Agric. Ecosyst. Environ. 2017, 247, 363–370. [Google Scholar] [CrossRef] [Scilit]
- Ullmann, K.S.; Meisner, M.H.; Williams, N.M. Impact of tillage on the crop pollinating, ground-nesting bee Peponapis pruinosa in California. Agric. Ecosyst. Environ. 2016, 232, 240–246. [Google Scholar] [CrossRef] [Scilit]
- Harmon-Threatt, A. Influence of nesting characteristics on health of wild bee communities. Annu. Rev. Entomol. 2020, 65, 39–56. [Google Scholar] [CrossRef] [Scilit] [PubMed]
- Xavier, V.M.; Message, D.; Picanço, M.C.; Chediak, M.; Júnior, P.A.S.; Ramos, R.S.; Martins, J.C. Acute toxicity and sublethal effects of botanical insecticides to honey bees. J. Insect Sci. 2015, 15, 137. [Google Scholar] [CrossRef] [Scilit]
- Biddinger, D.J.; Rajotte, E.G. Integrated pest and pollinator management—Adding a new dimension to an accepted paradigm. Curr. Opin. Insect Sci. 2015, 10, 204–209. [Google Scholar] [CrossRef] [Scilit] [PubMed]
- Balfour, N.J.; Garbuzov, M.; Ratnieks, F.L.W. Longer tongues and swifter handling: Why do more bumble bees (Bombus spp.) than honey bees (Apis mellifera) forage on lavender (Lavandula spp.)? Ecol. Entomol. 2013, 38, 323–329. [Google Scholar] [CrossRef] [Scilit]
- Jackson, R.B.; Wilson, T.M.; Wilson, J.S.; Ruggles, Z.; Topham Wilson, L.; Packer, C.; Young, J.G.; Bowerbank, C.R.; Carlson, R.E. Pollination and essential oil production of Lavandula angustifolia Mill. (Lamiaceae). Int. J. Plant Biol. 2025, 16, 72. [Google Scholar] [CrossRef] [Scilit]
- Hartig, F. DHARMa: Residual Diagnostics for Hierarchical (Multi-Level/Mixed) Regression Models, R Package Version 0.4.7. 2024. Available online: https://CRAN.R-project.org/package=DHARMa (accessed on 15 September 2026).
- Hsieh, T.C.; Ma, K.H.; Chao, A. iNEXT: An R package for rarefaction and extrapolation of species diversity (Hill numbers). Methods Ecol. Evol. 2016, 7, 1451–1456. [Google Scholar] [CrossRef] [Scilit]
- Tscharntke, T.; Klein, A.M.; Kruess, A.; Steffan-Dewenter, I.; Thies, C. Landscape perspectives on agricultural intensification and biodiversity–ecosystem service management. Ecol. Lett. 2005, 8, 857–874. [Google Scholar] [CrossRef] [Scilit]
- Thomson, D. Competitive interactions between the invasive European honey bee and native bumble bees. Ecology 2004, 85, 458–470. [Google Scholar] [CrossRef] [Scilit]
- Vicens, N.; Bosch, J. Weather-dependent pollinator activity in an apple orchard, with special reference to Osmia cornuta and Apis mellifera (Hymenoptera: Megachilidae and Apidae). Environ. Entomol. 2000, 29, 413–420. [Google Scholar] [CrossRef] [Scilit]
- Willmer, P.G.; Stone, G.N. Behavioral, ecological, and physiological determinants of the activity patterns of bees. Adv. Study Behav. 2004, 34, 347–466. [Google Scholar] [CrossRef] [Scilit]
Disclaimer/Publisher’s Note: The statements, opinions and data contained in all publications are solely those of the individual author(s) and contributor(s) and not of MDPI and/or the editor(s). MDPI and/or the editor(s) disclaim responsibility for any injury to people or property resulting from any ideas, methods, instructions or products referred to in the content. |
© 2026 by the authors. Licensee MDPI, Basel, Switzerland. This article is an open access article distributed under the terms and conditions of the Creative Commons Attribution (CC BY) license.